Embed Size (px)
Citation preview

Short-Term and Long-Term Mechanical Properties of CIPP Liners
by
Amir Mahdi Riahi
A thesis
presented to the University of Waterloo
in fulfilment of the
thesis requirement for the degree of
Master of Applied Science
in
Civil Engineering
Waterloo, Ontario, Canada, 2015
© Amir Mahdi Riahi 2015

ii
Author’s Declaration
I hereby declare that I am the sole author of this thesis. This is a true copy of the thesis, including
any required final revisions, as accepted by my examiners.
I understand that my thesis may be made electronically available to the public.
Amir Mahdi Riahi

iii
Abstract
Cured In-Place Pipe (CIPP) is a well-established method used for rehabilitation of
underground pipelines. Within North America, CIPP liners used for rehabilitation of gravity
pipelines are typically designed according to the design methodology provided in the non-
mandatory Appendix (X1) of ASTM F1216. In the design equations provided in the standard,
there are two parameters, liner long-term time-corrected modulus of elasticity and long-term
time-corrected flexural strength, which are related to the CIPP long-term creep behavior.
However, ASTM F1216 does not specify any methodology for characterizing the material long-
term physical properties. Common industry practice has been to adopt a creep retention factor of
0.5 for all CIPP materials. With all the new CIPP product varieties that have entered the gravity
pipeline renovation market since Insituform’s patent expiry, a creep retention factor of 0.5 may
not apply. This thesis provides a comparison between the ASTM D2990 methodology used for
the prediction of 50-year physical properties for four CIPP resins used within the City of Toronto
sewers and reported in the CATT Report (2005) and the hydrostatic buckling test methodology
used for long-term behavior characterization of various lining systems reported in TTC Report
302 (1994). Based on the comparison of reported results, ASTM D2990 test procedures is
recommended and used for characterizing the long-term mechanical properties of nine different
reinforced CIPP products used for pressure pipe. Short-term tensile and flexural properties of the
nine CIPP liners are also studied. CIPP liners are typically tested for a period of 10,000 hours to
evaluate the liner long-term behavior. In this thesis, long-term test analyses conducted for CIPP
products used within the City of Toronto sewers based on 10,000 hours (about 1.2 years) and
96,000 hours (about 11 years) of test data are also compared. The results of this research provide
a better understanding of CIPP liners short-term and long-term mechanical properties. This work
also demonstrates the importance of proper and consistent interpretation of long-term test results.
Keywords: CIPP liner, ASTM F1216, ASTM D2990, short-term behavior, long-term behavior

iv
Acknowledgements
I would like to thank my supervisor, Professor Mark Knight who has provided me with his
precious insight and kind support during the course of my MASc. degree.
I am grateful for the support of Professor Giovanni Cascante throughout the completion of this
thesis. I would like to thank Professors Jeffrey West and Donald Burn for reviewing my thesis.
Special thanks to my friends and colleagues in Center for Advancement of Trenchless
Technologies (CATT) including Dr. Rizwan Younis, Alice Seviora, Amin Ganjidoost, Hadi
Ganjidoost, and Hamed Mohammadi Fardi who supported me throughout these years.
I would like to acknowledge the support and technical assistance of Terry Ridgeway, Anne
Allen, Richard Morrison, Douglas Hirst, and Rob Sluban.
Finally, I would like to thank Interplastic Corporation for providing the test material and
supporting the research program.

v
Dedication
I would like to dedicate this thesis to my dear family who has always supported me in every
stage of my life.

vi
Table of Contents
List of Figures .............................................................................................................................. viii
List of Tables ................................................................................................................................. xi
1 Introduction to the Test Program ............................................................................................ 1
1.1 Introduction ...................................................................................................................... 1
1.2 Motivation ........................................................................................................................ 1
1.3 Research Objectives ......................................................................................................... 2
1.4 Thesis Organization.......................................................................................................... 3
2 Background and Review of Previous Research and Current Practice .................................... 4
2.1 Background ...................................................................................................................... 4
2.2 Review of Previous Research and Current Practice ....................................................... 13
2.2.1 TTC Report ............................................................................................................. 15
2.2.2 CATT Report .......................................................................................................... 20
2.2.3 Summary of the TTC and CATT Creep Testing .................................................... 27
2.3 Analysis of 96,000 Hours of Flexural Creep Test Data ................................................. 30
2.4 Impact of 61,000 Hours of Creep Test on Flexural Properties ...................................... 34
3 Test Program ......................................................................................................................... 39
3.1 Introduction .................................................................................................................... 39
3.2 Test Material .................................................................................................................. 39
3.2.1 Vinyl Ester Resins................................................................................................... 42
3.2.2 Liner Bag Materials ................................................................................................ 43
4 Analysis of Nine CIPPs Short-term Tensile Properties ........................................................ 46
4.1 Tensile Test Specifications and Specimens ................................................................... 46
4.2 Tensile Test Equipment .................................................................................................. 49
4.3 Tensile Test Results ....................................................................................................... 50
4.4 Discussion of Tensile Test Results................................................................................. 63

vii
5 Analysis of Nine CIPPs Short-term Flexural Properties....................................................... 66
5.1 Flexural Test Specifications ........................................................................................... 66
5.2 Flexural Test Specimens ................................................................................................ 67
5.3 Flexural Test Equipment ................................................................................................ 71
5.4 Flexural Test Results ...................................................................................................... 71
5.5 Discussion of Flexural Test Results ............................................................................... 87
6 Analysis of Nine CIPPs Long-term Flexural Creep Behavior .............................................. 90
6.1 Creep Test Specifications and Procedure ....................................................................... 90
6.2 Creep Test Specimens .................................................................................................... 91
6.3 Creep Test Loads ............................................................................................................ 92
6.4 Prediction of Specimens Deflection Level ..................................................................... 94
6.5 Creep Test Equipment .................................................................................................... 96
6.6 Creep Test Results .......................................................................................................... 97
6.7 Discussion of Flexural Creep Test Results .................................................................. 116
7 Prediction of CIPP Liners Long-term Behavior ................................................................. 118
7.1 Estimation of Material 50-Year Creep Modulus .......................................................... 118
7.2 Determination of Creep Retention Factor (CRF) ......................................................... 119
7.3 Discussion of CIPP Liners Creep Retention Factors ................................................... 123
8 Conclusions and Recommendations ................................................................................... 127
8.1 Conclusions .................................................................................................................. 127
8.2 Recommendations ........................................................................................................ 131
References ................................................................................................................................... 132
Appendix A – Designation of Resins and CIPP Bag Materials .................................................. 135
Appendix B – Creep Modulus versus Time Plots ....................................................................... 136

viii
List of Figures
Figure 2.1 - Material degradation (pipe corrosion) ......................................................................... 4
Figure 2.2 - Watermain break frequency in the City of Waterloo .................................................. 5
Figure 2.3 - Internal pipe corrosion ................................................................................................ 5
Figure 2.4 - Sinkhole created from collapse of wastewater pipe in the City of Winnipeg ............. 6
Figure 2.5 - CIPP installation process ............................................................................................ 7
Figure 2.6 - CIPP liner cured inside a deteriorated pipe ................................................................. 8
Figure 2.7 - External load possibilities ......................................................................................... 10
Figure 2.8 - Long-term test and regression results for Insituform Standard product ................... 19
Figure 2.9 - Long-term test and regression results for Insituform Enhanced product .................. 19
Figure 2.10 - End view of specimens under creep load ................................................................ 22
Figure 2.11 - Example plot showing the two regression analyses ................................................ 24
Figure 2.12 - AOC Standard resin long-term test analysis ........................................................... 25
Figure 2.13 - AOC Enhanced resin long-term test analysis .......................................................... 25
Figure 2.14 - Interplastic Corp. Standard resin long-term test analysis........................................ 26
Figure 2.15 - Interplastic Corp. Enhanced resin long-term test analysis ...................................... 26
Figure 2.16 - Comparison of creep factors reported in TTC and CATT reports .......................... 28
Figure 2.17 - AOC Standard – 96,000 Hours Analysis ................................................................ 31
Figure 2.18 - AOC Enhanced – 96,000 Hours Analysis ............................................................... 31
Figure 2.19 - Interplastic Corp. Standard – 96,000 Hours Analysis ............................................. 32
Figure 2.20 - Interplastic Corp. Enhanced – 96,000 Hours Analysis ........................................... 32
Figure 2.21 - AOC Standard - Comparison of flexural stress-strain responses ............................ 35
Figure 2.22 - AOC Enhanced - Comparison of flexural stress-strain responses .......................... 35
Figure 2.23 - Interplastic Corp. Standard - Comparison of flexural stress-strain responses ........ 36
Figure 2.24 - Interplastic Corp. Enhanced - Comparison of flexural stress-strain responses ....... 36
Figure 3.1 - Front view of a typical CIPP plate ("as received condition") ................................... 40
Figure 3.2 - Comparison of resins flexural and tensile moduli ..................................................... 42
Figure 3.3 - Comparison of resins flexural and tensile strength values ........................................ 43
Figure 3.4 - Liner A ...................................................................................................................... 44
Figure 3.5 - Liner B ...................................................................................................................... 44

ix
Figure 3.6 - Liner C ...................................................................................................................... 45
Figure 4.1 - Tensile test specimen specifications ......................................................................... 46
Figure 4.2 - Liner “A” specimen, before, during, and after the tensile test .................................. 48
Figure 4.3 - Liner “B” specimen, before, during, and after the tensile test .................................. 48
Figure 4.4 - Liner “C” specimen, before, during, and after the tensile test .................................. 49
Figure 4.5 - MTS Tensile test equipment, test specimen, and strain gage extensometer ............. 50
Figure 4.6 - A typical side view of a Liner “A” specimen ........................................................... 51
Figure 4.7 - Resin 1 / Liner A - Tensile stress - strain response for all acceptable tests .............. 52
Figure 4.8 - Resin 2 / Liner A - Tensile stress - strain response for all acceptable tests .............. 53
Figure 4.9 - Resin 3 / Liner A - Tensile stress - strain response for all acceptable tests .............. 55
Figure 4.10 - Resin 1 / Liner B - Tensile stress - strain response for all acceptable tests ............ 56
Figure 4.11 - Resin 2 / Liner B - Tensile stress - strain response for all acceptable tests ............ 57
Figure 4.12 - Resin 3 / Liner B - Tensile stress - strain response for all acceptable tests ............ 59
Figure 4.13 - Resin 1 / Liner C - Tensile stress - strain response for all acceptable tests ............ 60
Figure 4.14 - Resin 2 / Liner C - Tensile stress - strain response for all acceptable tests ............ 61
Figure 4.15 - Resin 3 / Liner C - Tensile stress - strain response for all acceptable tests ............ 62
Figure 4.16 - Comparison of tensile moduli of elasticity values .................................................. 64
Figure 4.17 - Comparison of tensile strength values .................................................................... 64
Figure 5.1 - Three-Point loading bending test .............................................................................. 66
Figure 5.2 - Typical Liner “A” panel with curvature .................................................................... 68
Figure 5.3 - Liner “A” specimen (tested with the concave surface facing downwards)
before, during and after the flexural test ....................................................................................... 69
Figure 5.4 - Liner “A” specimen (tested with the convex surface facing downwards)
before, during and after the flexural test ....................................................................................... 69
Figure 5.5 - Liner “B” specimen before, during and after the flexural test .................................. 70
Figure 5.6 - Liner “C” specimen before, during and after the flexural test .................................. 70
Figure 5.7 - Typical flexural test setup ......................................................................................... 71
Figure 5.8 - Typical flexural stress-strain responses .................................................................... 72
Figure 5.9 - Resin 1 / Liner A - Flexural stress-strain response ................................................... 75
Figure 5.10 - Resin 2 / Liner A - Flexural stress-strain response ................................................. 76
Figure 5.11 - Resin 3 / Liner A - Flexural stress-strain response ................................................. 78

x
Figure 5.12 - Resin 1 / Liner B - Flexural stress-strain response ................................................. 80
Figure 5.13 - Resin 2 / Liner B - Flexural stress-strain response ................................................. 81
Figure 5.14 - Resin 3 / Liner B - Flexural stress-strain response ................................................. 82
Figure 5.15 - Resin 1 / Liner C - Flexural stress-strain response ................................................. 84
Figure 5.16 - Resin 2 / Liner C - Flexural stress-strain response ................................................. 85
Figure 5.17 - Resin 3 / Liner C - Flexural stress-strain response ................................................. 86
Figure 5.18 - Comparison of flexural moduli of elasticity values ................................................ 88
Figure 5.19 - Comparison of flexural strength values .................................................................. 89
Figure 6.1 - Primary, secondary, and tertiary creep stages ........................................................... 91
Figure 6.2 - Typical CIPP ASTM D790 flexural stress-strain response....................................... 93
Figure 6.3 - Creep rupture envelop ............................................................................................... 93
Figure 6.4 - Rectangular beam maximum deflection.................................................................... 94
Figure 6.5 - Typical flexural creep test setup ............................................................................... 96
Figure 6.6 - Resin 1 / Liner A - Creep modulus over 10,000 hours of loading ............................ 99
Figure 6.7 - Resin 2 / Liner A - Creep modulus over 10,000 hours of loading .......................... 101
Figure 6.8 - Resin 3 / Liner A - Creep modulus over 10,000 hours of loading .......................... 103
Figure 6.9 - Resin 1 / Liner B - Creep modulus over 10,000 hours of loading .......................... 105
Figure 6.10 - Resin 2 / Liner B - Creep modulus over 10,000 hours of loading ........................ 107
Figure 6.11 - Resin 3 / Liner B - Creep modulus over 10,000 hours of loading ........................ 109
Figure 6.12 - Resin 1 / Liner C - Creep modulus over 10,000 hours of loading ........................ 111
Figure 6.13 - Resin 2 / Liner C - Creep modulus over 10,000 hours of loading ........................ 113
Figure 6.14 - Resin 3 / Liner C - Creep modulus over 10,000 hours of loading ........................ 115
Figure 6.15 - Comparison of average 10,000 hour and maximum predicted deflection values . 116
Figure 7.1 - An example of bi-linear CIPP creep behavior ........................................................ 119
Figure 7.2 - Comparison of short-term and long-term creep moduli values .............................. 124
Figure 7.3 - Comparison of average creep retention factors ....................................................... 125

xi
List of Tables
Table 2.1 - CIPP products considered for analysis ....................................................................... 16
Table 2.2 - Material characterization test results .......................................................................... 18
Table 2.3 - Estimated creep factors for Insituform Standard and Enhanced CIPP samples
....................................................................................................................................................... 20
Table 2.4 - CIPP products provided by the manufacturers ........................................................... 21
Table 2.5 - Short-term flexural and tensile test results ................................................................. 23
Table 2.6 - Estimated creep factors for the four CIPP resin samples ........................................... 27
Table 2.7 - Extrapolated 50-year creep moduli values using 96,000 hours of creep test data ..... 33
Table 2.8 - Comparison of creep factors estimated based on 10,000 hours and 96,000 hours of
test data ......................................................................................................................................... 33
Table 2.9 - Comparison of ASTM D790 flexural moduli values before and after undergoing
creep test ....................................................................................................................................... 37
Table 2.10 - Comparison of ASTM D790 flexural strength values before and after undergoing
creep test ....................................................................................................................................... 38
Table 3.1 - “As received” plate dimensions .................................................................................. 41
Table 3.2 - Average resin properties without reinforcement ........................................................ 42
Table 4.1 - Tensile test specimen dimensions .............................................................................. 47
Table 4.2 - Resin 1 / Liner A - Tensile properties ........................................................................ 51
Table 4.3 - Resin 1 / Liner A - Tensile properties of specimens that broke outside of the gage
length............................................................................................................................................. 51
Table 4.4 - Resin 2 / Liner A - Tensile properties ........................................................................ 52
Table 4.5 - Resin 2 / Liner A - Tensile properties of specimens that broke outside of the gage
length............................................................................................................................................. 53
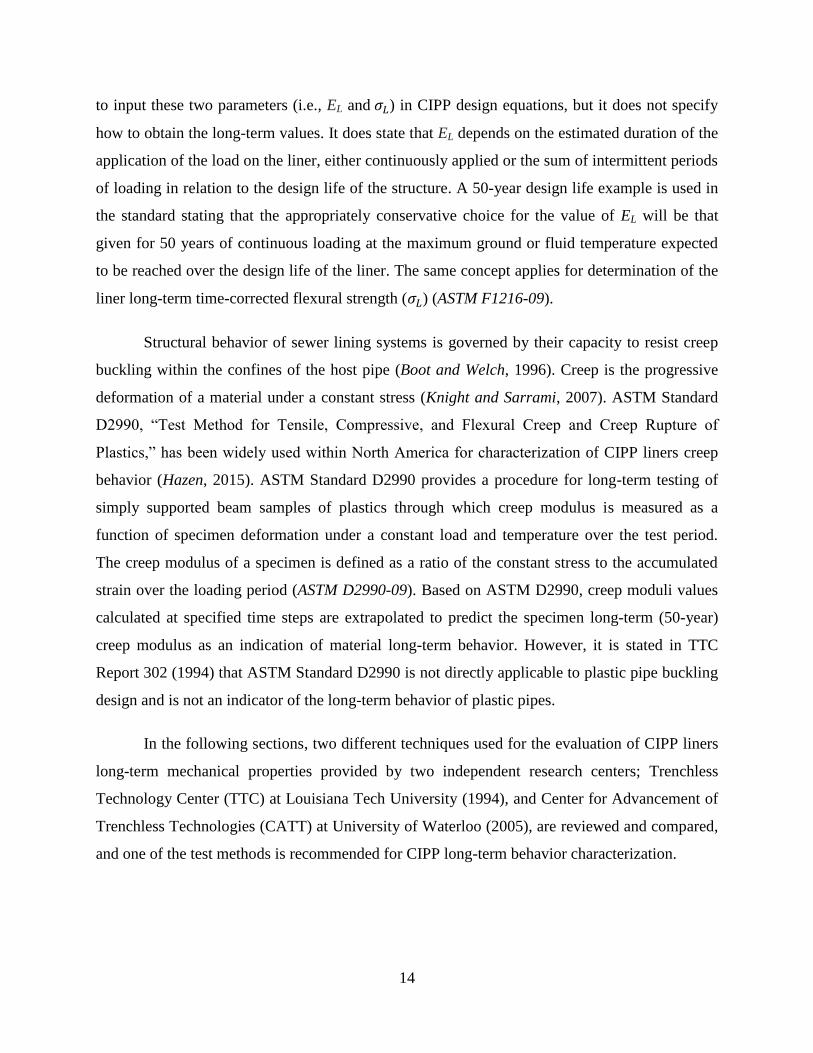
Table 4.6 - Resin 3 / Liner A - Tensile properties ........................................................................ 54
Table 4.7 - Resin 3 / Liner A - Tensile properties of specimens that broke outside of the gage
length............................................................................................................................................. 54
Table 4.8 - Resin 1 / Liner B - Tensile properties ........................................................................ 55
Table 4.9 - Resin 1 / Liner B - Tensile properties of specimens that broke outside of the gage
length............................................................................................................................................. 56

xii
Table 4.10 - Resin 2 / Liner B - Tensile properties ...................................................................... 56
Table 4.11 - Resin 1 / Liner B - Tensile properties of specimens that broke outside of the gage
length............................................................................................................................................. 57
Table 4.12 - Resin 3 / Liner B - Tensile properties ...................................................................... 58
Table 4.13 - Resin 3 / Liner B - Tensile properties of specimens that broke outside of the gage
length............................................................................................................................................. 58
Table 4.14 - Resin 1 / Liner C - Tensile properties ...................................................................... 59
Table 4.15 - Resin 2 / Liner C - Tensile properties ...................................................................... 60
Table 4.16 - Resin 2 / Liner C - Tensile properties of specimens that broke outside of the gage
length............................................................................................................................................. 61
Table 4.17 - Resin 3 / Liner C - Tensile properties ...................................................................... 62
Table 4.18 - Resin 3 / Liner C - Tensile properties of specimens that broke outside of the gage
length............................................................................................................................................. 62
Table 4.19 - Average tensile test results for each resin/liner type ................................................ 63
Table 5.1 - Flexural test specimen dimensions, test span, and span to depth ratio ....................... 67
Table 5.2 - Liner “A” Flexural testing summary .......................................................................... 73
Table 5.3 - Resin 1 / Liner A - Flexural properties ....................................................................... 74
Table 5.4 - Resin 1 / Liner A - Flexural properties of
specimens tested with convex surface facing downwards ............................................................ 74
Table 5.5 - Resin 2 / Liner A - Flexural properties ....................................................................... 75
Table 5.6 - Resin 2 / Liner A - Flexural properties of
specimens tested with convex surface facing downwards ............................................................ 76
Table 5.7 - Resin 3 / Liner A - Flexural properties ....................................................................... 77
Table 5.8 - Resin 3 / Liner A - Flexural properties of
specimens tested with convex surface facing downwards ............................................................ 77
Table 5.9 - Liner “B” Flexural testing summary .......................................................................... 79
Table 5.10 - Resin 1 / Liner B - Flexural properties ..................................................................... 80
Table 5.11 - Resin 2 / Liner B - Flexural properties ..................................................................... 81
Table 5.12 - Resin 3 / Liner B - Flexural properties ..................................................................... 82
Table 5.13 - Liner “C” Flexural testing summary ........................................................................ 83
Table 5.14 - Resin 1 / Liner C - Flexural properties ..................................................................... 84

xiii
Table 5.15 - Resin 2 / Liner C - Flexural properties ..................................................................... 85
Table 5.16 - Resin 3 / Liner C - Flexural properties ..................................................................... 86
Table 5.17 - Average flexural test results for each resin/liner type .............................................. 87
Table 6.1 - Creep test specimen dimensions and span to depth ratio ........................................... 92
Table 6.2 - Long-term flexural creep test loads ............................................................................ 94
Table 6.3 - Predicted specimen maximum deflection values ....................................................... 95
Table 6.4 - Resin 1 / Liner A - Creep test results ......................................................................... 98
Table 6.5 - Resin 2 / Liner A - Creep test results ....................................................................... 100
Table 6.6 - Resin 3 / Liner A - Creep test results ....................................................................... 102
Table 6.7 - Resin 1 / Liner B - Creep test results ........................................................................ 104
Table 6.8 - Resin 2 / Liner B - Creep test results ........................................................................ 106
Table 6.9 - Resin 3 / Liner B - Creep test results ........................................................................ 108
Table 6.10 - Resin 1 / Liner C - Creep test results ...................................................................... 110
Table 6.11 - Resin 2 / Liner C - Creep test results ...................................................................... 112
Table 6.12 - Resin 2 / Liner C - Creep test results ...................................................................... 114
Table 6.13 - 10,000 hour and maximum predicted deflection values ......................................... 116
Table 7.1 - Liner A, Average short-term flexural modulus,
extrapolated 50-year creep moduli, and creep retention factor values ....................................... 120
Table 7.2 - Liner B, Average short-term flexural modulus,
extrapolated 50-year creep moduli, and creep retention factor values ....................................... 121
Table 7.3 - Liner C, Average short-term flexural modulus,
extrapolated 50-year creep moduli, and creep retention factor values ....................................... 122
Table 7.4 - Summary of creep retention factors ......................................................................... 124

1
1 Introduction to the Test Program
1.1 Introduction
Underground pipelines are arteries of cities and towns. As the water and wastewater
distribution networks age, they deteriorate and require rehabilitation. The traditional approach to
renew/repair the deteriorated pipe involves extensive excavation along the pipe section. An
alternative to open-cut construction is application of a trenchless technology such as Cured In-
Place Pipe (CIPP) lining. Through the CIPP renovation process, a resin-impregnated lining tube
is inserted into the existing deteriorated pipe which is then cured to form a tight fit against the
pipe wall (WRc Sewerage Rehabilitation Manual, 1993). The resin used for tube impregnation is
a thermosetting polymer. Thermosetting and thermoplastic materials have a creep relationship
when under stress over time (Schrock, 1999). Thus, CIPP liners demonstrate a viscoelastic
behavior under stress. This means that their behavior is time and stress dependent and CIPP
liners creep under load. Within North America, CIPP liners used for rehabilitation of gravity
pipelines are typically designed according to the design methodology provided in the non-
mandatory Appendix (X1) of ASTM F1216 (Olivier, 2004). This standard requires the designer
to apply parameters that are related to the long-term creep behavior of the liner. ASTM F1216
does not specify how to characterize the material long-term behavior. In this thesis, different
methods used for evaluation of CIPP liners long-term behavior are reviewed. Then, based on the
recommended methodology, the long-term behaviors of nine different reinforced CIPP products
used for pressure applications are analyzed. Short-term tensile and flexural properties of the
liners are also studied. The results of both the short-term and long-term tests are presented in the
corresponding chapters. Findings are outlined to provide a better understanding of CIPP material
mechanical properties.
1.2 Motivation
CIPP is a well-established trenchless technology used for rehabilitation of water and
wastewater pipelines and is becoming more popular within the municipalities (Oxner and Allsup,
1999). Lining systems should be tested before use in order to check if the material properties
meet the design requirements or not (Straughan et al., 1995). There are usually third-party

2
testing companies that evaluate the short-term and long-term mechanical properties of this kind
of liner. However, based on review of some of the reports published on CIPP long-term
mechanical properties, there is an inconsistency found in the method of evaluating the long-term
test results. Therefore, there is a need for the industry to adopt a standard practice for testing
CIPPs and interpretation of test results. In this thesis, different methods used for CIPP material
long-term behavior characterization are reviewed and compared. Then, based on the comparison
results, one of the methodologies is recommended and used for analysis of long-term mechanical
properties of nine reinforced CIPP liners.
For characterization of long-term (typically 50-years) physical properties, CIPPs are
usually tested for a period of 10,000 hours. In this research, long-term behavior of four different
CIPP products, commonly used within North America are analyzed based on 96,000 hours (9.6
times the standard practice) of long-term test data and compared with the 10,000 hours analysis.
Afterwards, short-term and long-term mechanical properties of nine different CIPP products
provided by the Interplastic Corporation, one of the major suppliers of CIPP resins within North
America, are studied.
1.3 Research Objectives
Physical properties of CIPP liners including short-term and long-term properties need to
be analyzed before installation to ensure that the design requirements are met. Within North
America, circular CIPP liners are typically designed in accordance with ASTM F1216 design
methodology. However, ASTM F1216 does not provide a methodology for obtaining long-term
properties required for CIPP design. It has often become industry practice to adopt a creep
retention factor of 0.5 for CIPP materials (TTC Report 302, 1994). Since Insituform’s patent
expiry in late 1990’s, many new CIPP products have entered the market. With all the new CIPP
product varieties, the TTC creep retention factor of 0.5 may not apply to all products. The
objectives of this research include:
To compare different methods used for evaluation of CIPP liners long-term
behavior. Then, the methodology which is more cost and time effective is recommended.

3
To compare long-term test results based on 10,000 hours versus 96,000 hours of test
data. It is desirable to compare the 50-year predicted behavior of CIPP liners to the real
behavior. However, due to the significant costs associated with long-term tests, the liners
are not usually tested longer than 10,000 hours (Straughan et al., 1995). Thus, the results
of the analysis based on 96,000 hours (about 11 years) of creep test data will provide
valuable information on long-term behavior of CIPP liners.
To investigate the short-term and long-term mechanical properties of nine different
CIPP products. To select an appropriate rehabilitation liner, physical properties of the
liner should be well-understood. This study will provide an analysis of short-term and
long-term behaviors of various CIPP products used for pressure applications.
1.4 Thesis Organization
The thesis is subdivided into eight chapters. Chapter 2 provides background information
on the problems associated with underground pipelines and the methods usually used to
rehabilitate water and wastewater distribution networks. This chapter presents the review of
previous research and current practice regarding the characterization of CIPP liners long-term
behavior. It also presents 10,000 hours versus 96,000 hours of creep test data of four other CIPP
products commonly used within North America. In Chapter 3, the test program for investigation
of short-term and long-term mechanical properties of nine different CIPP products is described.
Chapter 4 describes the short-term tensile test procedure, specimens, equipment, and tensile
mechanical properties. Chapter 5 focuses on the short-term flexural test procedure, specimens,
equipment, results and discussion of CIPP liners short-term flexural mechanical properties.
Chapter 6 describes long-term flexural creep test procedure, specimens, test loads, prediction of
materials deflection levels based on the selected test loads, and test equipment. The creep test
results are presented and discussed in this chapter. In Chapter 7, predicted CIPP liners long-term
behavior based on the collected long-term creep test data are analyzed. Finally in Chapter 8,
conclusions and recommendations are drawn.

4
2 Background and Review of Previous Research and Current Practice
2.1 Background
Buried infrastructure, such as undergroung pipelines, are usually less emphesized
comparing to other infrastructures due to the fact that they are hidden under the ground (Rehan et
al., 2011). However, they play an important role in everyday life of all people whether living in
big cities or small towns. They provide potable water to residents and businesses, collect and
transport wastewater from residences and businesses to treatment plants, and also collect and
transport storm water. However, these arteries deteriorate over time and may fail to provide the
expected service. According to RBC Canadian water attitudes study (2012), the replacement cost
of water and wastewater linear assets (i.e., pipes) is about $50 billion and $55 billion,
respectively. As the water and wastewater distribution systems age, they deteriorate, crack, leak,
and finally break (FCM, 2003).
Water distribution networks are typically high pressure systems. Signs of an aging water
distribution system include pipe material degradation and increasing break frequency (FCM,
2003). Figure 2.1 shows a water pipe deteriorated as a result of material degradation. Figure 2.2
demonstrates the increasing trend of watermain break frequency in the City of Waterloo,
Ontario.
Figure 2.1 - Material degradation (pipe corrosion)
(Adapted from Knight, 2013)
5
Figure 2.2 - Watermain break frequency in the City of Waterloo
(Adapted from Knight, 2013)
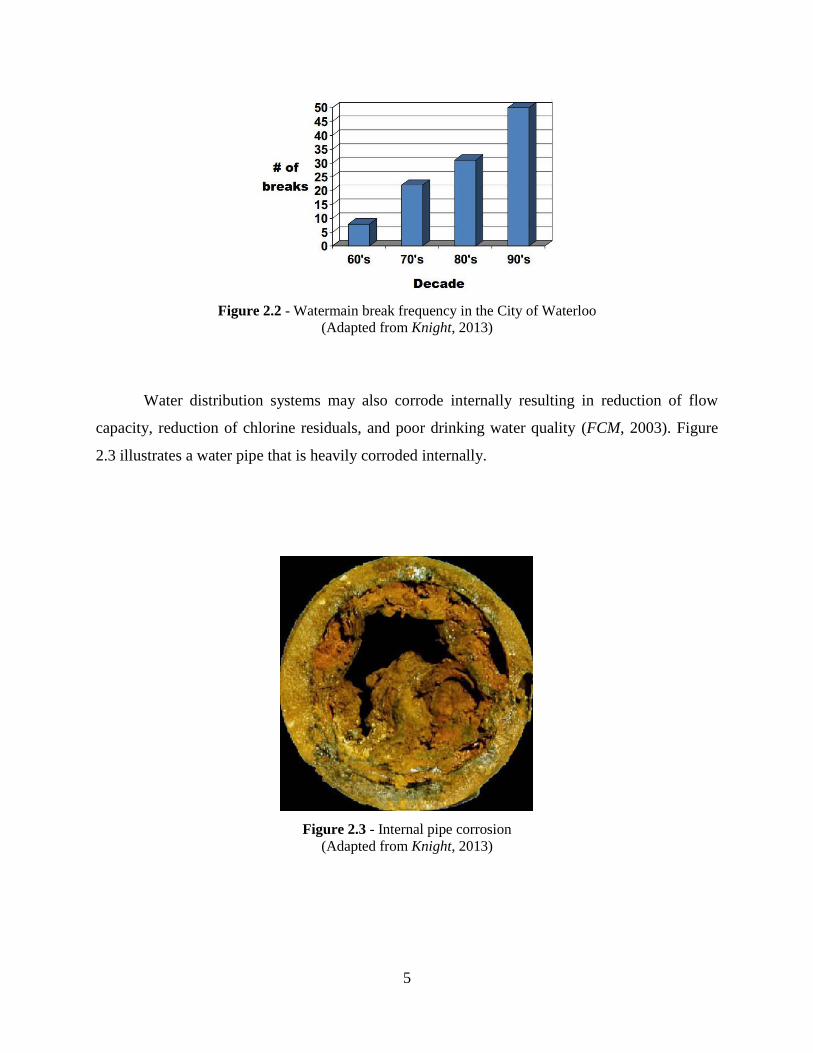
Water distribution systems may also corrode internally resulting in reduction of flow
capacity, reduction of chlorine residuals, and poor drinking water quality (FCM, 2003). Figure
2.3 illustrates a water pipe that is heavily corroded internally.
Figure 2.3 - Internal pipe corrosion
(Adapted from Knight, 2013)

6
Problems associated with aging wastewater distribution systems include structural
distress, pipe material degradation, inflow and infiltration, and poor hydraulic performance
(Knight, 2013). Figure 2.4 shows a sinkhole created as a result of wastewater pipe collapse.
Figure 2.4 - Sinkhole created from collapse of wastewater pipe in the City of Winnipeg
(Adapted from Knight, 2013)
Problems associated with deteriorated water and wastewater pipelines cost municipalities
a great deal of money each year (Boyce and Bried, 1998). To increase the level of service (i.e., to
improve the performance, reliability, and safety) of underground infrastructures, there are
typically two options (Boyce and Bried, 1998):
1- To replace the deteriorated pipe using open-cut construction (i.e., excavating the entire
pipe section), or
2- To repair/renovate the pipe using a trenchless technology.
Replacing an underground pipe using open-cut construction involves excavation along
the entire pipe section, taking the old pipe out, installing a new pipe and backfilling the trench.
The entire process is usually costly and the construction phase negatively impacts the traffic and
businesses especially in congested metropolitan areas (Boyce and Bried, 1998). An alternative to
open-cut construction is application of a trenchless technology, such as Cured In-Place Pipe
(CIPP), for repair/renovation of the deteriorated pipe. Through the CIPP renovation process a

7
resin-impregnated lining tube is inserted into the existing deteriorated pipe which is then cured to
form a tight fit against the pipe wall (WRc Sewerage Rehabilitation Manual, 1993).
This trenchless technique utilizes the existing alignment and easements and the
deteriorated pipe acts as a casing for the installation process which may or may not contribute to
structural performance of the CIPP liner (Oxner and Allsup, 1999). CIPP was first implemented
in early 1970’s in Britain, and in the late 1970’s the technology was brought to North America
(Oxner and Allsup, 1999). Figure 2.5 illustrates the CIPP installation process.
Figure 2.5 - CIPP installation process (Unitracc, 2013)
Unlike the traditional methods used for underground pipelines repair/renewal which
require extensive trenching to replace the deteriorated pipe, the CIPP process requires little or no
excavation (Oxner and Allsup, 1999). CIPP liners can be used for structural reconstruction or it
can serve as a corrosion barrier to shield existing pipe walls from the flow stream which may be
contributing to the degradation of wall thickness (Oxner and Allsup, 1999). The rehabilitation
liner reduces inflow and infiltration of unwanted surface or ground water, and usually improves
the flow characteristics of the system (Straughan et al., 1995). Social and environmental costs
can also be greatly minimized using the CIPP pipeline rehabilitation method, compared to the
open-cut construction (Boyce and Bried, 1998). When the direct cost of rehabilitating a pipeline
using trenchless methods is equal to the cost of open-cut methods, benefit to Society is a major
factor that needs to be considered for selection of a rehabilitation technique (Boyce and Bried,
1998).

8
Figure 2.6 - CIPP liner cured inside a deteriorated pipe
(Adapted from Knight, 2013)
Figure 2.6 shows a CIPP liner cured inside a deteriorated water pipe. The resin used for
CIPP tube impregnation is a thermosetting polymer. Thermoset polymers change irreversibly to
an insoluble solid when cured with application of heat and/or radiation (Nawab et al., 2013).
Thus, CIPP resins cannot be melted or reshaped once cured. Depending on the application and
strength requirements, the lining tubes are designed with or without reinforcement (Oxner and
Allsup, 1999). Reinforced tubes tend to produce higher strength liners with less wall thickness.
Polyester, vinyl ester, and epoxy are the three types of thermosetting resins typically used in
CIPP applications based on the economics, waste stream chemistry, strength requirements, and
potable versus non-potable applications (Kleweno, 1994). Characteristics and properties of these
resins are described below (Knight, 2013):
Polyester Resin
- Most common resin for rehabilitation of municipal sewage pipelines
- Contains Styrene (an organic compound) which helps the polymerization process when
heated
Vinyl Ester Resin
- Most common resin for rehabilitation of industrial pipelines, effluents
- Better corrosion and chemical resistance than polyesters
- Higher temperature range application than polyesters
- Higher ductility, better choice for pressure applications

9
- Fast wet-out and easy to handle compared to epoxy
- Good curing characteristics in presence of water, and
- Typically more expensive than polyester resin
Epoxy Resin
- Commonly used for rehabilitation of pressure pipelines
- Suitable for potable water applications
- High chemical resistance
- Typically more expensive than polyester and vinyl ester
In the design of CIPP liners, resin selection is an extremely important aspect of the
decision making process for the specifying design engineer (Knasel, 1998). As mentioned in
Chapter 1, thermosetting materials like CIPP resins, creep under stress. The rate of creep is
influenced by resin type, applied load, degree of cure, and the environmental conditions
(Richard, 1993). Creep rate is one of the major influential factors in the design of CIPP liners
(Knasel, 1994).
There are several methods used for design of CIPP liners around the world. For example,
ASTM F1216 is commonly used in North America, ATV-M 127-2 in Germany and AGHTM
RRR in France (Olivier, 2004). ASTM F1216, “Standard Practice for Rehabilitation of Existing
Pipelines and Conduits by the Inversion and Curing of a Resin-Impregnated Tube”, describes the
procedures for the reconstruction of pipelines and conduits by the installation of a resin-
impregnated flexible tube which is inverted into the existing conduit by use of a hydrostatic head
or air pressure. This standard also contains a non-mandatory Appendix (X1) outlining CIPP
design considerations that have become an industry standard in North America for the circular
gravity pipelines (Olivier, 2004).
According to Appendix “X1” of ASTM F1216-09, the condition of existing pipe can be
classified into two categories; partially deteriorated or fully deteriorated. ASTM F1216-09 states
that in a partially deteriorated condition, it is assumed that the original pipe will support the soil
and surcharge loads throughout the design life of the rehabilitated pipe, and in the case of a fully
deteriorated condition, it is assumed that the original pipe is not structurally sound and will not

10
support soil and live loads or is expected to reach this condition over the design life of the
rehabilitated pipe. Various possible external loads considered in CIPP design are illustrated in
Figure 2.7.
Figure 2.7 - External load possibilities
(Adapted from Knight, 2013)
The condition of the pipe is usually determined through judgment call, CCTV or scan
inspection information and interpretation, severity of diameter distortion, past history of pipeline,
ground conditions and the type of pipe material (FCM, 2003). It is important to consider the
future deterioration of the pipe, as well as, the present condition (FCM, 2003). To determine the
minimum required CIPP liner thickness, ASTM F1216-09 Appendix “X1” provides two design
equations (X1.1, and X1.2) to be checked for partially deteriorated condition and four equations
(X1.1, X1.2, X1.3, and X1.4) including the two for partially deteriorated case, for the fully
deteriorated condition. It should be noted that the ASTM F1216 design methodology only
applies to circular pipes. The four CIPP design equations used for gravity pipelines and the
parameters related to CIPP mechanical properties are outlined below:

11
Equation X1.1:
In the design of gravity sewer pipes, the prevention of buckling of the pipe under external
hydrostatic pressure is one of the primary criteria to be addressed (Straughan et al., 1995). This
equation checks for the liner buckling resistance against ground water pressure.
𝑃 = 2𝐾𝐸𝐿
(1−𝑣2)
1
(𝐷𝑅−1)3
𝐶
𝑁 (2.1)
where,
P = groundwater load, psi (MPa),
K = enhancement factor of the soil and existing pipe adjacent to the new pipe (a minimum
value of 7.0 is recommended where there is full support of the existing pipe),
EL = long-term (time-corrected) modulus of elasticity of CIPP liner, psi (MPa),
v = Poisson’s ratio (0.3 average),
DR = dimension ratio of CIPP liner = D/t (mean liner diameter over average liner thickness),
C = ovality reduction factor,
N = factor of safety.
Equation X1.2:
Minimum liner thickness required for rehabilitation of a circular pipe that has gone out of
round is determined through Equation (X1.2).
1.5 𝛥
100 (1 +
𝛥
100) 𝐷𝑅2 − 0.5 (1 +
𝛥
100) 𝐷𝑅 =
𝜎𝐿
𝑃𝑁 (2.2)
where,
Δ = percent ovality of existing pipe,
DR = dimension ratio of liner,
𝜎𝐿 = long-term (time-corrected) flexural strength for CIPP, psi (MPa),
P = ground water pressure, psi (MPa),
N = factor of safety.

12
In the case of a partially deteriorated condition, the required liner thickness is the largest
thickness obtained through Equations “X1.1” and “X1.2”. For the fully deteriorated condition,
two extra equations (X1.3 and X1.4) should also be checked and the largest thickness determined
by all the four equations (X1.1, X1.2, X1.3, and X1.4) is taken as the required liner thickness.
Equation X1.3:
This equation is used to determine the required CIPP thickness withstanding all the
external loads such as soil, live and water loads applied on the pipe without collapsing (ASTM
F1216-09).
𝑞𝑡 = 1
𝑁[32𝑅𝑤𝐵′𝐸′
𝑠 . 𝐶 (𝐸𝐿𝐼 𝐷3)]⁄1 2⁄
(2.3)
where,
qt = total external pressure on pipe, psi (MPa),
= 0.433𝐻𝑤 + wH𝑅𝑤 144⁄ + 𝑊𝑠, (English Units),
= 0.00981𝐻𝑤 + wH𝑅𝑤 1000⁄ + 𝑊𝑠, (Metric Units)
Rw = water buoyancy factor (0.67 min) = 1 – 0.33 (𝐻𝑤 𝐻⁄ ),
w = soil density, 𝑙𝑏. 𝑓𝑡3 (𝑘𝑁 𝑚3⁄ ),
𝑊𝑠 = live load, psi (MPa),
𝐻𝑤 = height of water above top of pipe, ft (m),
H = height of soil above top of pipe, ft (m),
𝐵′ = coefficient of elastic support = 1 (1 + 4𝑒−0.065𝐻)⁄ inch-pound units,
1 (1 + 4𝑒−0.213𝐻⁄ ) SI units.
I = moment of inertia of CIPP liner, in.4 in⁄ , (mm4 mm⁄ ),
C = ovality reduction factor,
N = factor of safety,
𝐸′𝑠 = modulus of soil reaction, psi (MPa),
EL = long-term modulus of elasticity for CIPP Liner, psi (MPa), and
D = mean inside diameter of host pipe, in. (mm).

13
Equation X1.4:
As an additional check, CIPP designed using equation (X1.3) should have the minimum
thickness specified by equation (X1.4).
𝐸𝐼
𝐷3=
𝐸
12(𝐷𝑅)3 ≥ 0.093 (inch – pound units) (2.4)
or
𝐸𝐼
𝐷3=
𝐸
12(𝐷𝑅)3 ≥ 0.00064 (SI units) (2.5)
where,
E = initial (short-term) modulus of CIPP, psi (MPa),
I = moment of inertia of CIPP liner, in.4 in⁄ , (mm4 mm⁄ ),
D = mean inside diameter of original pipe, in. (mm),
DR = dimension ratio.
Equation (X1.4) provides for a maximum liner dimension ratio dependent only on the
liner short-term modulus (ASTM F1216-09). The long-term time-corrected modulus of elasticity
and the long-term time-corrected flexural strength are the two long-term parameters outlined in
the CIPP design equations required by ASTM F1216. There is no methodology specified in
ASTM F1216 to estimate the two long-term properties. The following sections review
procedures for the determination of CIPP long-term mechanical properties.
2.2 Review of Previous Research and Current Practice
As mentioned earlier, CIPP liners creep under stress and the rate of creep is influenced by
resin type, applied load, degree of cure, and the environmental conditions (Richard, 1993).
Therefore, the modulus and strength values used in engineering design should be obtained under
conditions (time, stress, and temperature, etc.) that simulate the environment in which a
particular CIPP liner is expected to confront over its design life (ASTM D2990-09). The two
parameters EL and 𝜎𝐿 outlined in the CIPP design equations, represent the material long-term
modulus of elasticity and long-term flexural strength, respectively. It is has become a common
industry practice to define EL as long-term flexural modulus of elasticity rather than tensile or
compressive modulus due to the stress conditions CIPP liners may experience during the service
life (TTC Report 302, 1994). As discussed in Section 2.1, ASTM F1216-09 requires the designer
14
to input these two parameters (i.e., EL and 𝜎𝐿) in CIPP design equations, but it does not specify
how to obtain the long-term values. It does state that EL depends on the estimated duration of the
application of the load on the liner, either continuously applied or the sum of intermittent periods
of loading in relation to the design life of the structure. A 50-year design life example is used in
the standard stating that the appropriately conservative choice for the value of EL will be that
given for 50 years of continuous loading at the maximum ground or fluid temperature expected
to be reached over the design life of the liner. The same concept applies for determination of the
liner long-term time-corrected flexural strength (𝜎𝐿) (ASTM F1216-09).
Structural behavior of sewer lining systems is governed by their capacity to resist creep
buckling within the confines of the host pipe (Boot and Welch, 1996). Creep is the progressive
deformation of a material under a constant stress (Knight and Sarrami, 2007). ASTM Standard
D2990, “Test Method for Tensile, Compressive, and Flexural Creep and Creep Rupture of
Plastics,” has been widely used within North America for characterization of CIPP liners creep
behavior (Hazen, 2015). ASTM Standard D2990 provides a procedure for long-term testing of
simply supported beam samples of plastics through which creep modulus is measured as a
function of specimen deformation under a constant load and temperature over the test period.
The creep modulus of a specimen is defined as a ratio of the constant stress to the accumulated
strain over the loading period (ASTM D2990-09). Based on ASTM D2990, creep moduli values
calculated at specified time steps are extrapolated to predict the specimen long-term (50-year)
creep modulus as an indication of material long-term behavior. However, it is stated in TTC
Report 302 (1994) that ASTM Standard D2990 is not directly applicable to plastic pipe buckling
design and is not an indicator of the long-term behavior of plastic pipes.
In the following sections, two different techniques used for the evaluation of CIPP liners
long-term mechanical properties provided by two independent research centers; Trenchless
Technology Center (TTC) at Louisiana Tech University (1994), and Center for Advancement of
Trenchless Technologies (CATT) at University of Waterloo (2005), are reviewed and compared,
and one of the test methods is recommended for CIPP long-term behavior characterization.

15
2.2.1 TTC Report
The Trenchless Technology Center at Louisiana Tech University, joined by the US Army
Corps of Engineers (1994) published a technical report (#302) “Long-Term Structural Behavior
of Pipeline Rehabilitation Systems” with a primary objective of evaluating the long-term
structural behavior of different thermosetting plastic and thermoplastic pipe lining systems under
a uniform external hydrostatic pressure loading similar to what would be experienced in a
partially deteriorated sewer. The experiments and analytical studies in this report are limited to
straight pipes which are essentially round, snug-fitting, without major defects or anomalies, and
where bonding does not exist between the liner and the host pipe. Long-term tests are conducted
on liners installed in steel casing pipes and subjected to uniform external pressures so that the
liners would fail during a 10,000 hour test period. Specimens from each liner are tested under
constant pressure for the duration of the test and the results are plotted and extrapolated beyond
the test period to predict the material long-term behavior. The following ASTM Standards which
are test procedures for evaluating the long-term performance of plastic pipes subject to constant
internal pressure are used as a basis for developing the test procedure for analysis of the effect of
long-term external hydrostatic pressure on liners:
- ASTM D1598, “Test Method for Time-to-Failure of Plastic Pipe Under Constant Internal
Pressure”
- ASTM D2992, “Obtaining Hydrostatic or Pressure Design Basis for “Fiberglass” (Glass-
Fiber-Reinforced Thermosetting-Resin Pipe and Fittings)”, and
- ASTM D2837, “Obtaining Hydrostatic or Pressure Design Basis for Thermoplastic Pipe
Materials.
It is stated that the tests conducted for external loadings on plastic liners use a similar approach
to that of ASTM D2837 internal pressure testing procedure.
2.2.1.1 TTC Test Material
The experimental and analytical studies presented in the TTC Report 302 focus on the
buckling behavior of both CIPP and Fold-and-Formed Pipe (FFP) lining systems. Six different
CIPP products and one FFP product from five manufacturers are studied in this research. It is

16
reported that for the long-term tests at least 25 specimens of each product are tested and two
products have 40 samples each to produce statistically significant data due to the variability
associated with viscoelasticity, the buckling phenomenon and possible product non-uniformity.
Two of the CIPP products from Insituform Technologies Inc. called Standard and Enhanced are
analyzed here for comparison purposes since the other long-term test technique (presented in the
CATT Report) which will be reviewed later focuses on properties of CIPP liners which are
similar to these two particular product types. The components of the two CIPP products are
presented in Table 2.1.
Table 2.1 - CIPP products considered for analysis (Adapted from TTC Report 302, 1994)
Company/Product
Type of Tube
Type of
Resin/Base
Material
No. of Tests
Insituform
Standard
Non-woven polyester
fabric with interior
elastomeric
(polyurethane)
coating
Polyester
40
Insituform
Enhanced
Non-woven polyester
fabric with interior
elastomeric
(polyurethane)
coating
Polyester
(with a
compound
added)
40
2.2.1.2 TTC Test Method
Tensile and flexural tests are conducted for material characterization in accordance with
ASTM D638-89, “Standard Test Method for Tensile Properties of Plastics”, and ASTM D790-
86, “Standard Test Methods for Flexural Properties of Unreinforced and Reinforced Plastics and
Electrical Insulating Materials”, respectively. Specimens for material characterization tests are
cut from the flat sections of pipe so that the long direction of the specimens is in the transverse
direction of the liner. For long-term behavior prediction, CIPP products are tested under external

17
hydrostatic pressure for a period of 10,000 hours. Specimens are installed to fit snugly inside a
pipe having a length of at least six times the pipe diameter to minimize the possible effects of
edge restraint at the ends. External hydrostatic pressure is applied between the host pipe and liner
product from a pressurized water distribution system and the air is removed from the annular
space between the product and the host pipe through a pressure relief port (refer to the TTC
Report 302 (1994) for details of the test procedure). Once the specimens are prepared for the
long-term tests, short-term buckling tests are conducted on at least three specimens to establish
an upper limit for the pressures used in the long-term tests. The theoretical buckling pressures of
the materials are also computed using Equation 2.6:
𝑃𝑐𝑟 = 2 𝐾 𝐸
1− 𝑣2∗
1
(𝐷𝑅−1)3 (2.6)
where, K = enhancement factor (taken as 7 for consistency), E = modulus of elasticity (taken as
average ASTM D790 short-term flexural modulus), v = Poisson’s ratio (estimated value of 0.35
is used), and DR = dimension ratio. It should be noted that this equation is the same as Equation
2.1 with no safety factor (N) and ovality reduction factor (C).
For the long-term tests, specimens are pressurized at a rate of 10 psi/min (6.9 kPa/min) to
the desired test pressure which is held constant for the duration of the test. Once a specimen
failed under external hydrostatic pressure, the time of failure is recorded and the test data are
plotted on a graph of external pressure at failure versus time to failure on a log-log scale. For
prediction of the liner long-term behavior, a curve is then fitted to the test data and extrapolated
to 50 years. Test results will be presented in Section 2.2.1.3.
2.2.1.3 TTC Test Results
Material Characterization Tests
Flexural and tensile modulus of elasticity and strength values are presented in Table 2.2.
It is reported that at least six specimens per product are used for the flexural and tensile tests and
the results tabulated in Table 2.2 are average values. It should be noted that the flexural and

18
tensile properties are calculated based upon the full wall thickness including any film coating.
Modulus of elasticity is calculated using Equation 2.7:
𝐸 = 𝐿3𝑀 4𝑏𝑑3⁄ (2.7)
where E = modulus of elasticity, L = support span, M = slope of the tangent to the initial straight-
line portion of the load-deflection curve, b = width of specimen, d = thickness of specimen.
Exclusion of the coating thickness from the measured specimen depth increases the value of
modulus of elasticity.
Table 2.2 - Material characterization test results (Adapted from TTC Report 302, 1994)
Product
Flexural Test Tensile Test
Modulus of
Elasticity, E Strength
Modulus of
Elasticity, E Strength
(MPa) (psi) (MPa) (psi) (MPa) (psi) (MPa) (psi)
Insituform
Standard 3,093 448,630 64.2 9,310 3,934 570,590 27.3 3,960
Insituform
Enhanced 3,714 538,620 57.9 8,400 4,498 652,400 27.0 3,910
Long-Term Tests
For the long-term test data analysis, time of failure of the specimens at specified
pressures are recorded and plotted on a log-log scale with the pressure on the ordinate and time
on the abscissa. It is stated that the specimens which did not fail over the test period are
considered as failed at 10,000 hours. For prediction of the long-term behavior of the liners, best-
fitting regression is applied using the basic equation of the straight line:
𝑌 = 𝑎 − 𝑏𝑋 (2.8)
where,
𝑌 = log (𝑃) (2.9)
and 𝑋 = log (𝑡) (2.10)

19
where the values of intercept a and slope b are determined through linear regression analysis.
The test pressure versus time to failure plots generated based on the hydrostatic buckling test
results are presented in Figures 2.8 and 2.9.
Figure 2.8 - Long-term test and regression results for Insituform Standard product
(Adapted from TTC Report 302, 1994)
Figure 2.9 - Long-term test and regression results for Insituform Enhanced product
(Adapted from TTC Report 302, 1994)

20
The long-term test data are analyzed both by including and excluding the short-term
buckling test data. It is reported that there is a better correlation between analytical and
experimental results when the short-term data are included in the analysis. From the regression
curve, the 50-year extrapolated value of the test buckling pressure (𝑃𝑡𝑒𝑠𝑡50𝑌), which represents
the average pressure at which buckling would occur for a liner which has been under that
pressure for 50-years, is estimated. The creep factor (𝐶𝐿) is then defined as the ratio of 𝐸𝑡𝑒𝑠𝑡50𝑌
to 𝐸𝑒𝑥𝑝 where 𝐸𝑡𝑒𝑠𝑡50𝑌 is the experimentally-derived creep modulus back-calculated from
Equation 2.6 by letting 𝑃𝑐𝑟 = 𝑃𝑡𝑒𝑠𝑡50𝑌, and 𝐸𝑒𝑥𝑝 is the experimental (ASTM D790) flexural
modulus. The estimated creep factors for the two products are presented in Table 2.3.
Table 2.3 - Estimated creep factors for Insituform Standard and Enhanced CIPP samples
(Adapted from TTC Report 302, 1994)
Product 𝑬𝒆𝒙𝒑 𝑬𝒕𝒆𝒔𝒕𝟓𝟎𝒀
𝑪𝑳 (MPa) (psi) (MPa) (psi)
Insituform
Standard 3,093 448,630 1,793 259,990 0.580
Insituform
Enhanced 3,714 538,620 2,716 393,965 0.731
The creep factor is applied to the ASTM D790 flexural modulus such that Equation 2.6
predicts the same long-term buckling pressure as determined from the extrapolated regression
analysis (TTC Report 302, 1994). In the following, a review of the technique used by CATT for
prediction of CIPP liners long-term behavior is presented.
2.2.2 CATT Report
The Center for Advancement of Trenchless Technologies (2005) published a report
“Testing of AOC and Interplastic Corp. CIPP Resins used within the City of Toronto Sewers”
with the objective of providing a better understanding of CIPP resins including short-term and
long-term design strength properties and creep factors. Tensile, flexural and flexural creep tests
are completed on four different CIPP resins used for rehabilitation of the City of Toronto
wastewater network.

21
To evaluate the long-term behavior of the CIPP resins, rectangular specimens are tested
as a beam in flexural creep under a constant load for a period of 10,000 hours in accordance with
ASTM D2990-01 specifications. Creep moduli values of a particular specimen calculated based
on the amount of deflection at specified time steps are plotted versus time on a semi-logarithmic
scale. These data are then extrapolated beyond the 10,000 hour test period to estimate the
material 50-year creep modulus. The materials analyzed in this report are similar to the materials
discussed in the TTC Report 302 in the previous section. Test results are compared to that of
TTC Report and a summary of the comparison between the two techniques is provided in
Section 2.2.3.
2.2.2.1 CATT Test Material
Test materials supplied by AOC and Interplastic Corp. are CIPP resin products called
Standard and Enhanced. The Enhanced resins contained a filler to increase the flexural
properties. The CIPP resin samples are provided in the form of flat plates. The product
designation for each of the four CIPP resins is presented in Table 2.4.
Table 2.4 - CIPP products provided by the manufacturers (Adapted from CATT Report, 2005)
Supplier Resin Type Product
AOC Standard 102NA
AOC Enhanced 102TA
Interplastic Corp. Standard COR72-AA-455HV
Interplastic Corp. Enhanced COR72-AT-470
It is reported that the Interplastic Corp. Standard resin COR72-AA-455HV is a high
viscosity version of resin COR72-AA-455 while the Enhanced resin COR72-AT-470 is a
thixotropic, strength enhanced, polyester, perkadox catalyzed system. Specimens for both the
short-term and long-term tests are cut out of the plates using computer controlled abrasive water
jet cutting technology which produces test specimens with no heat distortion, mechanical stresses
and that are residual stress free (CATT Report, 2005).

22
2.2.2.2 CATT Test Method
Short-term flexural and tensile tests are conducted for material characterization in
accordance with ASTM D790-03 and ASTM D638-03, respectively. The long-term creep tests
are conducted in accordance with ASTM D2990-01 which outlines the test procedure for
determining the long-term flexural creep modulus. For the creep tests, simply supported
rectangular specimens are loaded at mid-span for a period of 10,000 hours in a controlled
temperature and humidity laboratory. It is reported that the specimens are prepared to have a
span to depth ratio of 16+/-1 to avoid shear stress effects. ASTM D2990 does not specify the
load required for long-term tests. However, it is stated in the CATT Report (2005) that based on
the review of North American and European practices, a load that creates a flexural stress
equivalent to 25 percent of the material ASTM D790 yield stress is selected for the long-term
creep test. After application of the load, deflection measurements are taken for each test
specimen at approximately 1, 6, 12, 30 minutes and then at 1, 2, 5, 10, 30, 60, 100, 300, 500,
1000, 2000, 3000, 4000, 5000, 6000, 7000, 8000, 9000, and 10,000 hours. Specimen deflection
is monitored using dial gages, with a reading resolution of 0.0005 in. (0.01 mm). A typical
flexural creep test setup is shown in Figure 2.10.
Figure 2.10 - End view of specimens under creep load
(Adapted from CATT Report, 2005)

23
A minimum of five specimens are tested from each test plate. Creep modulus is
calculated at each test reading to generate a plot of creep modulus versus time on a semi-log
scale to predict the CIPP resin long-term behavior. Results for both the short-term and long-term
tests are presented in Section 2.2.2.3.
2.2.2.3 CATT Test Results
Short-Term Tests
For the tensile tests, the specimens which failed outside of the limits of extensometer
gage are not considered for analysis. Short-term flexural and tensile modulus of elasticity and
strength values are presented in Table 2.5. It is reported that at least five specimens from each
resin type are tested for both tensile and flexural tests, and the results presented in Table 2.5 are
average values. The flexural and tensile properties are calculated based upon the average
thickness of the specimens.
Table 2.5 - Short-term flexural and tensile test results (Adapted from CATT Report, 2005)
Product
Flexural Test Tensile Test
Modulus of
Elasticity, E Strength
Modulus of
Elasticity, E Strength
(MPa) (psi) (MPa) (psi) (MPa) (psi) (MPa) (psi)
AOC
Standard 3,931 570,127 56.6 8,215 3,744 543,000 33.0 4,786
AOC
Enhanced 5,022 728,449 55.3 8,022
Failure occurred outside of gage
length
Interplastic
Corp.
Standard
4,526 656,427 58.9 8,541 3,359 487,254 31.4 4,557
Interplastic
Corp.
Enhanced
6,073 880,816 55.5 8,051 4,367 633,380 28.0 4,061

24
Long-Term Tests
For prediction of the liner long-term behavior, a plot is generated with creep modulus on
the ordinate and time on the abscissa for each of the test specimens. The data are extrapolated
using a linear regression analysis to predict the 50-year (about 438,000 hours) creep modulus
using the following relationship:
Creep modulus = a * log (time) + b (2.9)
where a and b are regression constants.
The creep factor (𝐶𝐿) is then defined as the ratio of 𝐸𝐿 to E where 𝐸𝐿 is the long-term
time-corrected flexural modulus (taken as the 50-year predicted creep modulus) and E is the
resin short-term ASTM D790 flexural modulus. The 50-year creep modulus is estimated using
two regression analyses; (1) using all 10,000 hour test data, and (2) using 1000 hour interval test
data only. An example plot showing the two regression analyses is illustrated in Figure 2.11.
Figure 2.11 - Example plot showing the two regression analyses
This Figure shows that the two regression analyses methods can result in very different
50-year modulus, approximately 800 MPa when all test data is used and approximately 200 MPa
when only 1000 hour interval data is used. This is a factor of four difference. It is agreed that the
regression of 1000 hour interval data results in a better prediction of the 50-year modulus and the
regression of all test data is not appropriate or realistic for the materials that do not have a linear
Regression Analysis
Using All Test Data
Regression Analysis Using 1000
Hour Interval Test Data Only
50-year
Predicted
Modulus

25
response on a creep modulus versus log time graph (CATT Report, 2005). Creep modulus versus
time plots showing the 50-year predicted creep modulus estimated using 1000 hour interval data
for AOC and Interplastic Corp. resins are presented in Figures 2.12 to 2.15.
Figure 2.12 - AOC Standard resin long-term test analysis
(Adapted from CATT Report, 2005)
Figure 2.13 - AOC Enhanced resin long-term test analysis
(Adapted from CATT Report, 2005)

26
Figure 2.14 - Interplastic Corp. Standard resin long-term test analysis
(Adapted from CATT Report, 2005)
Figure 2.15 - Interplastic Corp. Enhanced resin long-term test analysis
(Adapted from CATT Report, 2005)

27
The creep factors estimated using both regression analyses are presented in Table 2.6.
Based on the data presented in Table 2.6, the estimated creep retention factors using 1000 hour
interval test data are lower than the ones estimated by using all test data.
Table 2.6 - Estimated creep factors for the four CIPP resin samples (Adapted from CATT Report, 2005)
Product
Average Short-
term ASTM
D790 Initial
Tangent
Modulus
Average Long-term Extrapolated
50-year Creep Modulus
Average
Creep Factor (𝑪𝑳)
Using all test
data
Using 1000 hour
interval test data Using all
test data
Using 1000
hour
interval test
data (MPa) (psi) (MPa) (psi) (MPa) (psi)
AOC
Standard 3,931 570,127 2,150 311,869 1,908 276,672 0.55 0.49
AOC
Enhanced 5,022 728,449 2,873 416,701 2,817 408,593 0.57 0.56
Interplastic
Corp.
Standard
4,526 656,427 2,286 331,539 2,116 306,955 0.51 0.47
Interplastic
Corp.
Enhanced
6,073 880,816 3,071 445,481 2,889 419,036 0.51 0.48
2.2.3 Summary of the TTC and CATT Creep Testing
Based on the test results reported in Tables 2.2 and 2.5, the Insituform Standard product
has a higher tensile modulus of elasticity (𝐸𝐷638) than the AOC and Interplastic Corp. Standard
resins. However, the tensile strength (𝜎𝐷638) of the Insituform Standard product is lower
compared to the AOC and Interplastic Corp. Standard resins. The Insituform Enhanced product
has similar tensile properties to that of Interplastic Corp. Enhanced resin. The reported flexural
modulus of elasticity (𝐸𝐷790) for the Insituform Standard resin is less than the AOC and
Interplastic Corp. Standard resins by about 838 MPa and 1433 MPa, respectively. The reported
𝐸𝐷790 value for the Insituform Enhanced resin is less than the AOC and Interplastic Corp.
Enhanced resins by about 1308 MPa and 2359 MPa, respectively. However, the Insituform
products have higher flexural strength (𝜎𝐷790) values compared to the AOC and Interplastic
Corp. resins.

28
The creep factors reported using both methodologies are estimated based on the
assumption that the long-term time-corrected modulus of elasticity, 𝐸𝐿 can be defined by
multiplying the short-term ASTM D790 flexural modulus by some factor to account for material
creep behavior. The creep factors obtained using the hydrostatic buckling test and the ASTM
D2990 flexural creep test are compared in Figure 2.16.
Figure 2.16 - Comparison of creep factors reported in TTC and CATT reports
As shown in Figure 2.16, the estimated creep factors reported by TTC are higher than the
factors reported by CATT. It should be noted that direct comparison between the different
products may be misleading. However, the difference in creep factors can be attributed to the
different test methods, each measuring different long-term properties. Also, inclusion of
specimens which did not fail over the test period considered as failed at 10,000 hours, may add
to the conservativeness of the creep retention factors obtained using the hydrostatic buckling test.
0.40
0.45
0.50
0.55
0.60
0.65
0.70
0.75
0.80
Cre
ep R
eten
tion
Fact
or
Product Type
Including All Data
Considering Every 1000 Hour
Data Points

29
It has become industry standard practice to set 𝐸𝐿 at 50% of the initial value of the
modulus of elasticity of a CIPP liner for an expected service life of 50 years (TTC Report 302,
1994). The estimated creep factors of 0.580 and 0.731 for the Insituform Standard and Enhanced
products respectively, suggest that 50% reduction of initial flexural modulus of elasticity would
be conservative (TTC Report 302, 1994). The creep factors presented in the TTC Report are
estimated based on the linear regression analysis of buckling time versus applied pressure data. It
should be noted that the long-term buckling experiments of liners demonstrated a large amount
of scatter when the buckling time is plotted against the applied pressure (Zhao et al., 2005).
The creep factors estimated by considering all of the data (i.e. initial 1-minute to final)
and reported by CATT range from 0.51 to 0.57 and the creep factors estimated by considering
the data points at every 1000 hours, range from 0.47 to 0.56. A standard creep retention factor of
0.5 seems to be reasonable for CIPP resins manufactured by AOC and Interplastic Corp. and no
significant difference is observed between the creep response of the Standard and Enhanced
resins (CATT Report, 2005).
Based on the data presented in Figure 2.16, the results of both long-term test methods
presented in TTC and CATT Reports are similar and both suggest that the choice of 0.5 as a
creep retention factor applied to the short-term flexural modulus is reasonable and conservative
for the products tested. Therefore, application of ASTM D2990 Standard for prediction of plastic
material long-term behavior does provide comparable results to the long-term tests using
sustained external hydrostatic pressure.
Kleweno (1998) also compared long-term test results obtained from various resin types
and testing conditions utilizing ASTM D2990 test method to the long-term data reported in TTC
Report 302 (1994) and concluded that the two test methods can be correlated closely. Kleweno
(1998) also stated that the correlation indicates both methodologies produce similar long-term
performance predictions of pipe lining systems. Long-term hydrostatic buckling test involves a
number of sample production steps, specialized test equipment, and a large facility to maintain
the specimens (Kleweno, 1998). Comparing to the method described in TTC Report 302, the
ASTM D2990 provides a relatively simple test procedure for obtaining an estimate of the long-
term performance of CIPP lining systems.

30
2.3 Analysis of 96,000 Hours of Flexural Creep Test Data
For the selection of rehabilitation liner systems, it is highly desirable to test the material
properties as long as the design life of the liner (TTC Report 302, 1994). However, because of
the costs associated with long-term testing, it has become industry standard to perform long-term
tests on rehabilitation liners for a period of 10,000 hours to predict the material long-term
behavior (TTC Report 302, 1994). After CATT’s (2005) completion of 10,000 hours (about 1.14
years) of creep test, sample deflection readings were continued annually until 11 years of creep
data was obtained. The test started in 2003 with a minimum of five specimens from each resin
type. Some of the specimens failed over time and some are still undergoing the test at the time
this thesis was written. It is not clear exactly why some of the specimens have failed. However, it
should be noted that there is sometimes variations in specimens cut from the laboratory
manufactured CIPP panels provided by the supplier.
In 2010, after about seven years of creep test, one specimen from each resin type was
removed to be tested in flexure to analyze the effect of continuously applied stress on the flexural
properties of the resin. The flexural test results are provided in Section 2.4. For all surviving
specimens, 50-year creep moduli values are estimated based on 96,000 hours (about 11 years) of
creep test data. This test period is 9.6 times the standard test period of 10,000 hours. The AOC
and Interplastic Corp. creep modulus versus time plots with the extrapolated 50-year creep
moduli values are illustrated in Figures 2.17 to 2.20.

31
Figure 2.17 - AOC Standard – 96,000 Hours Analysis
Figure 2.18 - AOC Enhanced – 96,000 Hours Analysis

32
Figure 2.19 - Interplastic Corp. Standard – 96,000 Hours Analysis
Figure 2.20 - Interplastic Corp. Enhanced – 96,000 Hours Analysis

33
The 50-year creep moduli values estimated using 96,000 hours of creep test data based on
the two regression analyses (i.e., using all test data versus using only after the 1000 hour data
points) are presented in Table 2.7. The creep retention factors estimated using 10,000 hours and
96,000 hours of creep test data are compared in Table 2.8.
Table 2.7 - Extrapolated 50-year creep moduli values using 96,000 hours of creep test data
Product No. of
Specimens
Average Short-
term ASTM
D790 Initial
Tangent
Modulus
Extrapolated 50-Year Creep Modulus
Using all data Using only after the 1000 hour
data points
Mean Standard
Deviation Mean
Standard
Deviation
(MPa) (psi) (MPa) (psi) (MPa) (psi) (MPa) (psi) (MPa) (psi)
AOC
Standard 3 3,931 570,127 2,008 291,236 59 8,557 1,850 268,320 60 8,702
AOC
Enhanced 2 5,022 728,449 2,604 377,678 36 5,221 2,502 362,884 32 4,641
Interplastic
Corp.
Standard
1 4,526 656,427 2,125 308,205 N/A N/A 1,955 283,549 N/A N/A
Interplastic
Corp.
Enhanced
1 6,073 880,816 2,902 420,899 N/A N/A 2,683 389,136 N/A N/A
Table 2.8 - Comparison of creep factors estimated based on 10,000 hours and 96,000 hours of test data
Product
Average 𝑪𝑳 Based
on 10,000 Hours
Analysis
Average 𝑪𝑳 Based on
96,000 Hours
Analysis
*Difference in 𝑪𝑳
Using
all test
data
Using only
after the
1000 hour
data points
Using all
test data
Using only
after the
1000 hour
data points
Using all
test data
Using only
after the
1000 hour
data points
AOC
Standard 0.55 0.49 0.51 0.47 -0.04 -0.02
AOC
Enhanced 0.57 0.56 0.52 0.50 -0.05 -0.06
Interplastic
Corp.
Standard
0.51 0.47 0.47 0.43 -0.04 -0.04
Interplastic
Corp.
Enhanced
0.51 0.48 0.48 0.44 -0.03 -0.04
* (-) means decrease in creep factor

34
As shown in Table 2.8, the estimated creep factors for all of the four CIPP products have
decreased when comparing the values based on 10,000 hours and 96,000 hours of testing
regardless of the method of analysis. Based on 11 years of test data, the estimated creep factors
considering only after the 1000 hours data points, are all below 0.5 except the AOC Enhanced
resin which is 0.5. This demonstrates that the creep rate is slightly increasing after the 10,000
hours test period. However, the data presented in Table 2.8 suggest that the industry standard
creep retention factor of 0.5 may not be conservative as oppose to the factors obtained based on
10,000 hours of long-term testing. Thus, creep retention factor of 0.5 may not be applicable for
all resin types and designers may want to consider using lower creep retention factors.
As mentioned above, some specimens failed (one from each of the Interplastic Corp.
resin products) after the 10,000 hours and one specimen was removed from each of the four
products for flexural analysis. Thus, the number of specimens, and in particular the Interplastic
Corp. resins, that survived the 96,000 hours of constant loading is not sufficient for statistical
analysis. However, the analysis presented does provide valuable insight on how the creep
behavior of different CIPP resins has changed beyond the standard test period of 10,000 hours.
2.4 Impact of 61,000 Hours of Creep Test on Flexural Properties
In 2010, after about seven years (approximately 61,000 hours) of creep test, one
specimen from each resin type was removed to be tested in flexure in accordance with ASTM
D790 specifications to analyze the effect of continuously applied constant stress on flexural
properties of the CIPP products. The flexural stress-strain responses of four specimens from
AOC and Interplastic Corp. resins tested initially in flexure and a specimen tested in flexure after
seven years of undergoing creep test are compared in Figures 2.21 to 2.24.

35
Figure 2.21 - AOC Standard - Comparison of flexural stress-strain responses
Figure 2.22 - AOC Enhanced - Comparison of flexural stress-strain responses

36
Figure 2.23 - Interplastic Corp. Standard - Comparison of flexural stress-strain responses
Figure 2.24 - Interplastic Corp. Enhanced - Comparison of flexural stress-strain responses

37
Initial ASTM D790 flexural modulus values (before the start of creep test) are compared
with the values obtained after seven years of continuous loading in Table 2.9. This Table shows
that the AOC and Interplastic Corp. Standard resins have higher flexural modulus retention
factors compared to the Enhanced resins. The flexural modulus retention factors range from 0.70
to 0.77 after seven years of creep test.
Table 2.9 - Comparison of ASTM D790 flexural moduli values before and after undergoing creep test
Liner
Type
Sample
No.
Initial Flexural
Modulus Mean
Standard
Deviation
Flexural
Modulus After
7 years of creep
test
Modulus
Retention
Factor
(MPa) (psi) (MPa) (psi) (MPa) (psi) (MPa) (psi)
AOC
Standard
1 4,208 610,300
3,930 570,000 294 42,640 3,042 441,200 0.77 2 3,698 536,400
3 3,655 530,100
4 4,157 602,900
AOC
Enhanced
1 5,118 742,300
5,225 757,800 113 16,390 3,700 536,600 0.71 2 5,369 778,800
3 5,156 747,800
4 5,256 762,300
Interplastic
Corp.
Standard
1 4,550 659,900
4,594 666,300 215 31,180 3,491 506,400 0.76 2 4,552 660,200
3 4,381 635,400
4 4,893 709,600
Interplastic
Corp.
Enhanced
1 6,340 919,600
6,127 888,600 540 78,320 4,292 622,500 0.70 2 6,768 981,600
3 5,864 850,500
4 5,536 803,000
The flexural strength values before and after undergoing creep test, are presented in Table
2.10. This Table shows that the flexural strength retention factors for the Standard and Enhanced
resins range from 0.67 to 0.96. The AOC resins have lower flexural strength retentions factors
compared to the Interplastic Corp. resins. However, for the Interplastic Corp. samples, it cannot
be concluded that the flexural strength values have decreased, since the strength value after
seven years falls in the range of strength values obtained initially. The flexural properties after
seven years presented in Table 2.10 are obtained from only one specimen. Therefore, it is not
possible to analyze the test results statistically. However, the comparison is useful to develop a
better understating of CIPP liners flexural properties after undergoing constant stress for a long
period of time. It should be noted that the values presented in Tables 2.9 and 2.10 are only based

38
on seven years of constant stress (equivalent to 25% of the liner initial flexural yield strength). If
the 50 year design life is considered, the flexural properties may potentially decrease even more.
However, based on the data presented in Tables 2.9 and 2.10, the retention factor of 0.5 which is
commonly applied to the liners short-term flexural modulus and flexural strength to obtain long-
term values may be considered as conservative.
Table 2.10 - Comparison of ASTM D790 flexural strength values before and after undergoing creep test
Liner
Type
Sample
No.
Initial Flexural
Strength Mean
Standard
Deviation
Flexural
Strength After
7 years of creep
test
Strength
Retention
Factor
(MPa) (psi) (MPa) (psi) (MPa) (psi) (MPa) (psi)
AOC
Standard
1 56.0 8,120
55.8 8,090 1.53 222 44.4 6,440 0.80 2 54.1 7,840
3 55.3 8,030
4 57.8 8,380
AOC
Enhanced
1 44.3 6,430
47.7 6,910 3.04 441 31.9 4,620 0.67 2 51.5 7,460
3 46.4 6,730
4 48.4 7,030
Interplastic
Corp.
Standard
1 56.0 8,130
58.3 8,450 10.9 1584 53.7 7,790 0.92 2 60.1 8,710
3 45.3 6,560
4 71.7 10,400
Interplastic
Corp.
Enhanced
1 50.7 7,350
49.4 7,160 2.02 293 47.2 6,850 0.96 2 50.8 7,370
3 46.5 6,740
4 49.5 7,180

39
3 Test Program
3.1 Introduction
The Interplastic Corporation, with headquarters in St. Paul, Minnesota, is a specialty
chemical company that produces CIPP liners for rehabilitation of water and wastewater pipelines
commonly used within North America. In 2013, the company asked the Center for Advancement
of Trenchless Technologies to investigate the short-term and long-term physical properties of
reinforced CIPP liners of various bag materials and thermoset resins. For the characterization of
material short-term properties (i.e., tensile and flexural properties), CATT proposed the ASTM
D638 and ASTM D790 test methods, respectively and ASTM D2990 for long-term properties. In
the following chapters, description of the test material and the short-term and long-term test
procedures along with the test results are presented.
3.2 Test Material
All of the CIPP products are manufactured by Interplastic Corporation. There are a total of
nine different CIPP samples constructed using three different resins and three different fiberglass
containing reinforced bag materials that are analyzed in this research project. Eighteen test
plates, two from each product are provided. Test plates are labelled as follows:
Resin 1 / Reinforced CIPP Liner A
Resin 2 / Reinforced CIPP Liner A
Resin 3 / Reinforced CIPP Liner A
Resin 1 / Reinforced CIPP Liner B
Resin 2 / Reinforced CIPP Liner B
Resin 3 / Reinforced CIPP Liner B
Resin 1 / Reinforced CIPP Liner C
Resin 2 / Reinforced CIPP Liner C
Resin 3 / Reinforced CIPP Liner C

40
The designation of resins and CIPP bag materials are provided in Appendix A. A typical
CIPP test plate (“as received” condition) showing the proposed direction for sample cutting is
shown in Figure 3.1. Dimensions of the plates measured using a digital caliper are presented in
Table 3.1. All of the following informtion about the CIPP components is provided by the
Interplastic Corporation and presented in the paper by Hazen (2015).
Figure 3.1 - Front view of a typical CIPP plate ("as received condition")

41
Table 3.1 - “As received” plate dimensions
“As received”
Plate Description
Depth* Length Width
(mm) (in) (mm) (in) (mm)
Resin1/Reinforced CIPP Liner B - #2 7.34 15.44 392.11 7.59 192.88
Resin1/Reinforced CIPP Liner B - #3 7.63 15.97 405.61 7.59 192.88
Resin2/Reinforced CIPP Liner B - #1 7.36 15.75 400.05 7.31 185.74
Resin2/Reinforced CIPP Liner B - #2 7.13 16.00 406.40 7.34 186.53
Resin3/Reinforced CIPP Liner B - #1 7.54 15.08 382.98 7.39 187.72
Resin3/Reinforced CIPP Liner B - #2 7.32 15.67 398.07 7.73 196.45
Average 7.39 15.65 397.54 7.49 190.37
Resin1/Reinforced CIPP Liner C - #1 4.85 15.88 403.23 8.94 227.01
Resin1/Reinforced CIPP Liner C - #2 4.85 15.88 403.23 9.09 230.98
Resin2/Reinforced CIPP Liner C - #1 4.58 15.69 398.46 8.66 219.87
Resin2/Reinforced CIPP Liner C - #2 5.22 15.41 391.32 8.72 221.46
Resin3/Reinforced CIPP Liner C - #1 5.38 15.88 403.23 8.63 219.08
Resin3/Reinforced CIPP Liner C - #2 4.92 15.72 399.26 9.13 231.78
Average 4.99 15.74 399.79 8.86 225.03
Resin1/Reinforced CIPP Liner A - #1 10.57 13.69 347.66 8.28 210.34
Resin1/Reinforced CIPP Liner A - #2 10.57 13.83 351.23 8.52 216.30
Resin2/Reinforced CIPP Liner A - #1 10.55 14.06 357.19 8.33 211.53
Resin2/Reinforced CIPP Liner A - #2 10.55 13.94 354.17 8.53 216.69
Resin3/Reinforced CIPP Liner A - #1 10.51 13.16 334.17 8.56 217.49
Resin3/Reinforced CIPP Liner A - #2 10.51 13.78 350.04 8.78 223.04
Average 10.54 13.74 349.08 8.50 215.90
*In ASTM testing, depth referes to the thickness

42
3.2.1 Vinyl Ester Resins
The first resin, refered to as “R1”, is a styrenated, bisphenol-A epoxy vinyl ester resin
which is a versatile resin used for pipeline rehabilitation for more than 20 years (Hazen, 2015).
The second resin, refered to as “R2”, is a styrenated, higher elongation epoxy vinyl ester resin
which combines the enhanced corrosion resistant properties of vinyl ester resins with higher
tensile elongation properties making it more suitable for lines requiring high pressure ratings
such as forcemains and water lines. However, due to the components used in its manufacture,
this resin is not recommended by Interplastic Corp. for potable water lines. The third resin,
refered to as “R3”, is both styrene-free and VOC-free and has the enhanced pressure capabilities
of “R2”. The tensile and flexural properties of the resins, without reinforcement, provided by
Interplastic Corp. and tested in accordance with the ASTM D638 and D790 specifications are
presented in Table 3.2. The flexural and tensile moduli of the resins are compared in Figure 3.2.
The flexural and tensile strength values are compared in Figure 3.3.
Table 3.2 - Average resin properties without reinforcement (Adapted from Hazen, 2015)
Resin Initial Flexural
Modulus
Ultimate
Flexural
Strength
Tensile Modulus Tensile
Strength
Tensile
Elongation
MPa psi MPa psi MPa psi MPa psi %
R1 3,240 470,000 132 19,100 3,170 460,000 75.9 11,000 4.2
R2 3,100 450,000 114 16,500 3,100 450,000 70.0 10,000 5.6
R3 N/A N/A N/A N/A 2,140 310,000 45.5 6,600 6.3
Figure 3.2 - Comparison of resins flexural and tensile moduli
0
500
1000
1500
2000
2500
3000
3500
R1 R2 R3
(MP
a)
Resin Type
Flexural Modulus
Tensile Modulus

43
Figure 3.3 - Comparison of resins flexural and tensile strength values
Mechanical properties are specific to the resin type tested (Kleweno, 1994). Based on the
data presented in Table 3.2, the tensile strength values are lower than the flexural strength values
for Resins “1” and “2”. Resin “3” has the lowest tensile modulus and tensile strength values
compared to the other two resin types. It should be noted that Resin “3” is the only VOC-free
and styrene-free resin. According to Table 1 in ASTM F1216-09, a CIPP system designed for
pressure pipes should have a field inspection (i.e., field cured) ASTM D638 minimum tensile
strength of 3000 psi (21 MPa). The tensile strength values for all of the resin types reported in
Table 3.2, exceed the ASTM F1216-09 minimum field inspection value. The minimum field
inspection short-term flexural modulus and flexural strength values required by ASTM F1216-09
are 250,000 psi (1724 MPa) and 4500 psi (31 MPa), respectively. The flexural modulus and
flexural strength values for Resins “1” and “2” reported in Table 3.2, exceed the ASTM F1216-
09 minimum field inspection values.
3.2.2 Liner Bag Materials
The three liner bag materials are supplied by three major North American manufacturers.
The photographs of each material shown in this section, are digitaly modified to remove the
manufacturer’s identities (Hazen, 2015). The first liner bag material referred to as “Liner A” has
an asymmetrical layered construction with 3.0 mm of felt on one side and 7.5 mm of felt on the
0
20
40
60
80
100
120
140
R1 R2 R3
(MP
a)
Resin Type
Flexural Strength
Tensile Strength

44
other, and the fiberglass fabric that is sandwiched between the felts has alternating layers of
roving with each layer orthogonal to the next. A sample of Liner “A” is illustrated in Figure 3.4.
The second liner bag material referred to as Liner “B” shown in Figure 3.5, has the lowest
fiberglass thickness as a percentage of total thickness. The third liner bag material referred to as
Liner “C” is shown in Figure 3.6. The sandwiching felt material in this liner is thinner than 1.0
mm, making it mostly fiberglass.
Figure 3.4 - Liner A (Adapted from Hazen, 2015)
Figure 3.5 - Liner B (Adapted from Hazen, 2015)

45
Figure 3.6 - Liner C (Adapted from Hazen, 2015)

46
4 Analysis of Nine CIPPs Short-term Tensile Properties
A tensile test is conducted to evaluate the CIPP liner short-term tensile properties. In the
following, a description of the tensile test specimens, equipment, and results are provided.
4.1 Tensile Test Specifications and Specimens
Tensile tests are performed in accordance with ASTM D638–10, Standard Test Methods
for Tensile Properties of Plastics. Interplastic Corp. stipulated that the test specimen be cut
parallel to plate longitudinal axis shown on each CIPP plate (See Figure 3.1). A minimum of five
specimens are prepared for each of the CIPP systems making a total of 45 tensile test specimens.
Dog-bone shape specimens are cut based on the thickness of the CIPP plates according to the
following specifications presented in Figure 4.1 adapted from ASTM D638-10.
Figure 4.1 - Tensile test specimen specifications (Adapted from ASTM D638-10)

47
For Liners “B” and “C”, approximately 7 and 5 mm thick, respectively, Type II tensile
specimens are cut from the plates using computer controlled abrasive water jet cutting in
accordance with ASTM D638 requirements. For Liner “A”, approximately 10.5 mm thick,
ASTM D638 specifies Type III specimens. However, due to limited Liner “A” plate size,
number of plates, and the large Type III tensile test specimen size, it was decided and approved
by Interplastic’s that Type II tensile specimens would be cut and tested for Liner “A”. The
computer controlled water jet cutting method has been found by CATT to be the best cutting
method for creating specimens with no heat distortion that are residual stress free. Through this
cutting method, consistent specimens are prepared, and thus the test results are expected to be
consistent as well. Table 4.1 provides the tensile test specimen dimensions for each liner type.
Table 4.1 - Tensile test specimen dimensions
Liner Type Overall Length
(mm)
Overall Width
(mm)
Gage Length (mm)
A 205 19 50
B 183 19 50
C 183 19 50
All tensile test specimen dimensions are measured using a digital caliper with an
accuracy of 0.01 mm. The width and thickness of each specimen are measured and recorded at
the midpoint and within 5 mm of each end of the gage length. Average measured values are used
for all calculations. Typical tensile test specimens from each liner type, before, during, and after
the test are shown in Figures 4.2 to 4.4. For each test specimen the following labeling scheme is
used:
X1-Y-J-Z: where X1 represents the Resin Number, Y is the Liner Type, J is the Plate No., and Z
is specimen ID. For example, R2-B-1-E refers to Resin 2-Liner B-Plate No.1-Specimen E.

48
Figure 4.2 - Liner “A” specimen, before, during, and after the tensile test
Figure 4.3 - Liner “B” specimen, before, during, and after the tensile test

49
4.2 Tensile Test Equipment
The tensile tests are performed using a MTS 810 test frame with a 100 kN capacity load
cell and MTS 634.25E-24, 25.0 mm range, strain gage extensometer as shown in Figure 4.5.
MTS Station Manager Automated Material Tester software (V3.5c 1808) is used for test data
collection and test control. The test is conducted in displacement control at a rate of 5mm/min
(+/- 25%) in accordance with ASTM D638-10.
Figure 4.4 - Liner “C” specimen, before, during, and after the tensile test

50
Figure 4.5 - MTS Tensile test equipment, test specimen, and strain gage extensometer
4.3 Tensile Test Results
Tensile modulus of elasticity, tensile strength at yield, and tensile strength at break values
are reported for all the specimens tested from each liner system. Section A2.18 of ASTM D638-
10 defines the tensile strength as the maximum tensile stress sustained by the specimen during a
tension test. When the maximum stress occurs at the yield point, it is designated as the tensile
strength at yield. When the maximum stress occurs at break, it is designated as the tensile
strength at break. In this thesis, the tensile modulus of elasticity is defined as the slope of initial
linear portion of stress-strain curve and is determined using the average specimen original cross-
sectional area within the gage length. The yield stress is taken as the first sudden deviation from
the initial linear portion of the stress-strain curve, while ultimate stress is taken as the peak
specimen stress. Specimens for which the break occurred outside of the gage length are deemed
not acceptable, and their test results are reported in separate tables. The tensile test results are
presented in Tables 4.2 to 4.18. The stress-strain plots for acceptable tests (i.e., the ones which
failure occurred within the gage length) from each CIPP liner system, are illustrated in Figures
4.7 to 4.15. As mentioned in Chapter 3, Liner “A” has an asymmetrical layered construction with
3.0 mm of felt on one side and 7.5 mm of felt on the other. Some specimens failed from the thick
side and some from the thin side. Thus, the side which failure occurred in, during the tensile test
is noted for Liner “A” specimens. A typical side view of a Liner “A” specimen showing the felt
layers is illustrated in Figure 4.6.
Extensometer
Test specimen

51
Figure 4.6 - A typical side view of a Liner “A” specimen
Table 4.2 - Resin 1 / Liner A - Tensile properties
Test
Specimen
Initial Modulus
of Elasticity
Tensile Yield Tensile Break
Notes Strength Strain
(%)
Strength Strain
(%) (MPa) (psi) (MPa) (psi) (MPa) (psi)
R1-A-1-C 6,320 917,100 15.7 2,280 0.252 57.2 8,290 1.09 Thick side
broke first
R1-A-2-A 5,450 790,000 11.8 1,710 0.216 50.5 7,320 1.12 Thick side
broke first
R1-A-2-B 5,520 801,000 12.2 1,760 0.222 63.0 9,130 1.49 Thick side
broke first
Min 5,450 790,000 11.8 1,710 0.216 50.5 7,320 1.09
Max 6,320 917,100 15.7 2,280 0.252 63.0 9,130 1.49
Average 5,760 836,000 13.2 1,920 0.230 56.9 8,250 1.23
Standard
Deviation
486 70,450 2.2 317 0.020 6.3 908 0.22
Table 4.3 - Resin 1 / Liner A - Tensile properties of specimens that broke outside of the gage length
Test
Specimen
Initial Modulus
of Elasticity
Tensile Yield Tensile Break
Notes Strength Strain
(%)
Strength Strain
(%) (MPa) (psi) (MPa) (psi) (MPa) (psi)
R1-A-1-A 6,070 880,700 16.4 2,380 0.265 55.3 8,020 1.06 Thick side
broke first
R1-A-1-B 5,660 820,500 8.48 1,230 0.146 47.0 6,820 1.04 Thick side
broke first

52
Figure 4.7 - Resin 1 / Liner A - Tensile stress - strain response for all acceptable tests
Table 4.4 - Resin 2 / Liner A - Tensile properties
Test
Specimen
Initial Modulus
of Elasticity
Tensile Yield Tensile Break
Notes Strength Strain
(%)
Strength Strain
(%) (MPa) (psi) (MPa) (psi) (MPa) (psi)
R2-A-1-A 5,750 833,900 27.8 4,040 0.510 66.9 9,700 1.45 Thick side broke
first
R2-A-1-B 6,120 887,000 22.9 3,320 0.385 52.1 7,560 1.02 Thick side broke
first
R2-A-2-B 6,160 894,000 19.7 2,850 0.325 66.9 9,710 1.44 Thick side broke
first
Min 5,750 833,900 19.7 2,850 0.325 52.1 7,560 1.02
Max 6,160 894,000 27.8 4,040 0.510 66.9 9,710 1.45
Average 6,010 871,600 23.5 3,400 0.407 62.0 8,990 1.30
Standard
Deviation
227 32,870 4.1 596 0.094 8.5 1,240 0.25

53
Table 4.5 - Resin 2 / Liner A - Tensile properties of specimens that broke outside of the gage length
Test
Specimen
Initial Modulus
of Elasticity
Tensile Yield Tensile Break
Notes Strength Strain
(%)
Strength Strain
(%) (MPa) (psi) (MPa) (psi) (MPa) (psi)
R2-A-1-C 6,430 933,400 20.4 2,960 0.324 83.7 12,140 1.70 Thick side broke
first
R2-A-2-C 5,890 854,600 19.6 2,850 0.339 82.1 11,900 2.08 Thick side broke
first
Figure 4.8 - Resin 2 / Liner A - Tensile stress - strain response for all acceptable tests
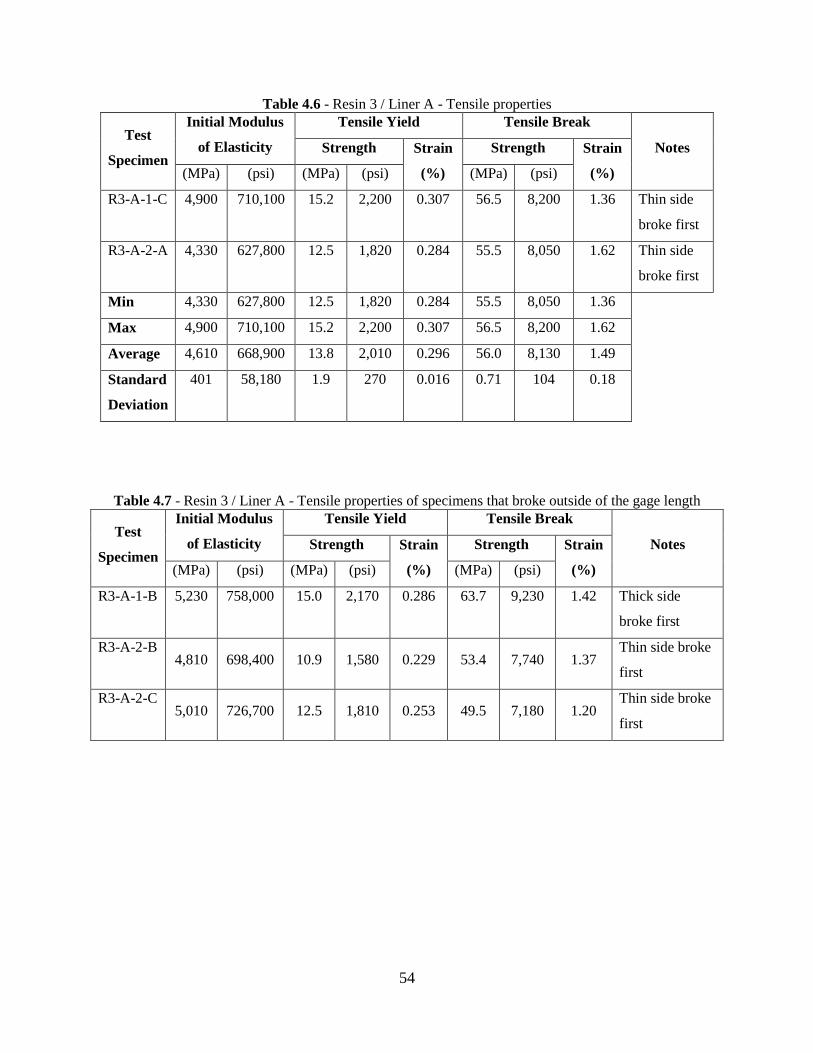
54
Table 4.6 - Resin 3 / Liner A - Tensile properties
Test
Specimen
Initial Modulus
of Elasticity
Tensile Yield Tensile Break
Notes Strength Strain
(%)
Strength Strain
(%) (MPa) (psi) (MPa) (psi) (MPa) (psi)
R3-A-1-C 4,900 710,100 15.2 2,200 0.307 56.5 8,200 1.36 Thin side
broke first
R3-A-2-A 4,330 627,800 12.5 1,820 0.284 55.5 8,050 1.62 Thin side
broke first
Min 4,330 627,800 12.5 1,820 0.284 55.5 8,050 1.36
Max 4,900 710,100 15.2 2,200 0.307 56.5 8,200 1.62
Average 4,610 668,900 13.8 2,010 0.296 56.0 8,130 1.49
Standard
Deviation
401 58,180 1.9 270 0.016 0.71 104 0.18
Table 4.7 - Resin 3 / Liner A - Tensile properties of specimens that broke outside of the gage length
Test
Specimen
Initial Modulus
of Elasticity
Tensile Yield Tensile Break
Notes Strength Strain
(%)
Strength Strain
(%) (MPa) (psi) (MPa) (psi) (MPa) (psi)
R3-A-1-B 5,230 758,000 15.0 2,170 0.286 63.7 9,230 1.42 Thick side
broke first
R3-A-2-B 4,810 698,400 10.9 1,580 0.229 53.4 7,740 1.37
Thin side broke
first
R3-A-2-C 5,010 726,700 12.5 1,810 0.253 49.5 7,180 1.20
Thin side broke
first

55
Figure 4.9 - Resin 3 / Liner A - Tensile stress - strain response for all acceptable tests
Table 4.8 - Resin 1 / Liner B - Tensile properties
Test
Specimen
Initial Modulus of
Elasticity
At Tensile Yield At Tensile Break
Strength Strain
(%)
Strength Strain
(%) (MPa) (psi) (MPa) (psi) (MPa) (psi)
R1-B-2-B 9,310 1,350,300 24.7 3,580 0.270 79.2 11,490 0.960
R1-B-2-C 9,220 1,338,000 31.5 4,560 0.342 82.6 11,980 0.976
R1-B-3-C 9,030 1,309,900 36.5 5,290 0.411 118 17,140 1.50
Min 9,060 1,309,900 24.7 3,580 0.270 79.2 11,490 0.960
Max 9,360 1,350,300 36.5 5,290 0.411 118 17,140 1.50
Average 9,230 1,332,800 30.9 4,480 0.341 93.3 13,540 1.14
Standard
Deviation
154 20,720 5.9 858 0.071 22 3,130 0.31

56
Table 4.9 - Resin 1 / Liner B - Tensile properties of specimens that broke outside of the gage length
Test
Specimen
Initial Modulus of
Elasticity
At Tensile Yield At Tensile Break
Strength Strain
(%)
Strength Strain
(%) (MPa) (psi) (MPa) (psi) (MPa) (psi)
R1-B-3-A 10,710 1,553,200 41.6 6,030 0.387 132 19,130 1.38
R1-B-3-D 10,530 1,527,600 30.0 4,360 0.268 108 15,590 1.13
Figure 4.10 - Resin 1 / Liner B - Tensile stress - strain response for all acceptable tests
Table 4.10 - Resin 2 / Liner B - Tensile properties
Test
Specimen
Initial Modulus of
Elasticity
At Tensile Yield At Tensile Break
Strength Strain
(%)
Strength Strain
(%) (MPa) (psi) (MPa) (psi) (MPa) (psi)
R2-B-1-C 9,190 1,332,700 34.8 5,040 0.385 136 19,760 1.85
R2-B-1-D 7,230 1,049,000 27.8 4,030 0.393 122 17,700 2.12
Min 7,230 1,049,000 27.8 4,030 0.385 122 17,700 1.85
Max 9,190 1,332,700 34.8 5,040 0.393 136 19,760 2.12
Average 8,210 1,191,000 31.3 4,540 0.389 129 18,730 1.99
Standard
Deviation
1,380 200,600 4.9 715 0.005 10 1,460 0.19

57
Table 4.11 - Resin 1 / Liner B - Tensile properties of specimens that broke outside of the gage length
Test
Specimen
Initial Modulus of
Elasticity
At Tensile Yield At Tensile Break
Strength Strain
(%)
Strength Strain
(%) (MPa) (psi) (MPa) (psi) (MPa) (psi)
R2-B-1-A 9,610 1,394,200 35.7 5,180 0.380 130 18,830 1.59
R2-B-2-A 9,760 1,415,800 43.7 6,340 0.456 150 21,820 1.89
R2-B-2-B 10,370 1,504,800 38.1 5,530 0.366 155 22,440 1.86
Figure 4.11 - Resin 2 / Liner B - Tensile stress - strain response for all acceptable tests

58
Table 4.12 - Resin 3 / Liner B - Tensile properties
Test
Specimen
Initial Modulus of
Elasticity
At Tensile Yield At Tensile Break
Strength Strain
(%)
Strength Strain
(%) (MPa) (psi) (MPa) (psi) (MPa) (psi)
R3-B-1-D 7,310 1,060,400 38.0 5,500 0.527 120 17,470 2.16
R3-B-2-A 6,820 988,700 35.1 5,090 0.513 96.2 13,960 1.60
R3-B-2-D 10,180 1,476,800 33.2 4,820 0.329 148 21,400 1.97
Min 6,810 988,700 33.2 4,820 0.329 96.2 13,960 1.60
Max 10,180 1,476,800 38.0 5,500 0.527 148 21,400 2.16
Average 8,100 1,175,300 35.4 5,140 0.457 121 17,610 1.91
Standard
Deviation
1,820 263,600 2.4 347 0.11 26 3,720 0.28
Table 4.13 - Resin 3 / Liner B - Tensile properties of specimens that broke outside of the gage length
Test
Specimen
Initial Modulus of
Elasticity
At Tensile Yield At Tensile Break
Strength Strain
(%)
Strength Strain
(%) (MPa) (psi) (MPa) (psi) (MPa) (psi)
R3-B-1-A 7,420 1,076,100 27.2 3,950 0.366 98.5 14,290 1.55
R3-B-2-B 7,950 1,152,400 38.4 5,570 0.481 117 16,980 1.78

59
Figure 4.12 - Resin 3 / Liner B - Tensile stress - strain response for all acceptable tests
Table 4.14 - Resin 1 / Liner C - Tensile properties
Test
Specimen
Initial Modulus of
Elasticity
At Tensile Yield At Tensile Break
Strength Strain
(%)
Strength Strain
(%) (MPa) (psi) (MPa) (psi) (MPa) (psi)
R1-C-1-B 11,870 1,721,900 42.7 6,190 0.361 160 23,190 2.17
R1-C-1-C 12,420 1,801,500 33.2 4,810 0.262 154 22,400 2.02
R1-C-1-E 12,390 1,797,400 32.8 4,750 0.262 160 23,260 2.42
R1-C-2-B 10,260 1,488,600 31.8 4,610 0.307 108 15,710 1.83
R1-C-2-D 9,280 1,346,000 17.1 2,470 0.185 85.4 12,380 1.56
Min 9,280 1,343,000 17.1 2,470 0.185 85.4 12,380 1.56
Max 12,420 1,801,500 42.7 6,190 0.361 160 23,260 2.42
Average 11,250 1,631,100 31.5 4,570 0.275 134 19,390 2.00
Standard
Deviation
1,410 204,000 9.2 1,330 0.065 35 5,030 0.33

60
Figure 4.13 - Resin 1 / Liner C - Tensile stress - strain response for all acceptable tests
Table 4.15 - Resin 2 / Liner C - Tensile properties
Test
Specimen
Initial Modulus of
Elasticity
At Tensile Yield At Tensile Break
Strength Strain
(%)
Strength Strain
(%) (MPa) (psi) (MPa) (psi) (MPa) (psi)
R2-C-1-D 11,160 1,618,200 37.9 5,490 0.338 158 22,960 2.22
R2-C-2-D 9,470 1,374,200 29.7 4,310 0.319 140 20,300 2.36
R2-C-2-F 9,410 1,365,000 36.0 5,230 0.383 117 16,930 1.86
Min 9,410 1,365,000 29.7 4,310 0.319 117 16,930 1.86
Max 11,160 1,618,200 37.9 5,490 0.383 158 22,960 2.36
Average 10,010 1,452,500 34.5 5,010 0.347 138 20,060 2.15
Standard
Deviation
990 143,600 4.3 618 0.033 21 3,020 0.26

61
Table 4.16 - Resin 2 / Liner C - Tensile properties of specimens that broke outside of the gage length
Test
Specimen
Initial Modulus of
Elasticity
At Tensile Yield At Tensile Break
Strength Strain
(%)
Strength Strain
(%) (MPa) (psi) (MPa) (psi) (MPa) (psi)
R2-C-1-E 11,030 1,599,200 40.7 5,900 0.370 112 16,260 1.29
R2-C-2-G 10,210 1,480,200 29.5 4,280 0.293 133 19,240 1.85
Figure 4.14 - Resin 2 / Liner C - Tensile stress - strain response for all acceptable tests

62
Table 4.17 - Resin 3 / Liner C - Tensile properties
Test
Specimen
Initial Modulus of
Elasticity
At Tensile Yield At Tensile Break
Strength Strain
(%)
Strength Strain
(%) (MPa) (psi) (MPa) (psi) (MPa) (psi)
R3-C-1-A 7,960 1,155,000 23.6 3,430 0.298 95.5 13,850 1.95
R3-C-1-D 8,580 1,243,000 22.9 3,320 0.266 129 18,680 2.22
R3-C-2-C 9,260 1,336,100 23.6 3,420 0.256 134 19,480 2.22
Min 6,920 1,155,000 22.9 3,320 0.256 95.5 13,850 1.95
Max 9,260 1,336,100 23.6 3,430 0.298 134 19,480 2.22
Average 8,250 1,244,700 23.4 3,390 0.273 120 17,340 2.13
Standard
Deviation
1,200 90,560 0.40 58 0.022 21 3,050 0.16
Table 4.18 - Resin 3 / Liner C - Tensile properties of specimens that broke outside of the gage length
Test
Specimen
Initial Modulus of
Elasticity
At Tensile Yield At Tensile Break
Strength Strain
(%)
Strength Strain
(%) (MPa) (psi) (MPa) (psi) (MPa) (psi)
R3-C-2-B 9,650 1,399,500 19.8 2,880 0.206 120 17,460 1.89
R3-C-2-G 8,970 1,300,700 22.7 3,300 0.255 127 18,360 2.06
Figure 4.15 - Resin 3 / Liner C - Tensile stress - strain response for all acceptable tests

63
4.4 Discussion of Tensile Test Results
The term “elastic modulus” refers to the “stiffness” or “rigidity” of plastic materials
(ASTM D638-10). Stress-strain characteristics of plastic materials are highly dependent on
various factors such as rate of application of stress, temperature, and previous loading history of
specimen (ASTM D638-10). The stress-strain curves generated using ASTM D638-10
specifications, demonstrated a linear region at low stresses. The elastic modulus is estimated by
drawing a straight line tangent to the linear portion of the stress-strain curve. Such a constant is
useful if its arbitrary nature and dependence on time, temperature, and similar factors are realized
(ASTM D638-10). The average tensile test results for each resin/liner type are tabulated in Table
4.19.
Table 4.19 - Average tensile test results for each resin/liner type
Resin / Liner
Type
Initial Modulus of
Elasticity
Strength at
Yield
Strength at
Break
(MPa) (psi) (MPa) (psi) (MPa) (psi)
Resin 1 / Liner A 5,760 836,000 13.2 1,920 56.9 8,250
Resin 2 / Liner A 6,010 871,600 23.5 3,400 62.0 8,990
Resin 3 / Liner A 4,610 668,900 13.8 2,010 56.0 8,130
Resin 1 / Liner B 9,230 1,332,800 30.9 4,480 93.3 13,540
Resin 2 / Liner B 8,210 1,190,900 31.3 4,540 129 18,730
Resin 3 / Liner B 8,100 1,175,300 35.4 5,140 121 17,610
Resin 1 / Liner C 11,250 1,631,100 31.5 4,570 134 19,390
Resin 2 / Liner C 10,010 1,452,500 34.5 5,010 138 20,060
Resin 3 / Liner C 8,250 1,244,700 23.4 3,390 120 17,340
The initial tensile moduli of elasticity values for all resin/liner types are compared in
Figure 4.16. Liner “A” products have lower tensile moduli of elasticity compared to Liners “B”
and “C”. Liner “A” is the only CIPP system which have an asymmetrical layered construction.
The fiberglass fabric that is sandwiched between the felts in Liner “A”, has alternating layers of
roving with each layer orthogonal to the next. It is noticed in Figure 4.16 that the liner bag
materials, especially Liner “C”, have substantially added to the tensile stiffness of the resin only
samples. It should be noted that Liner “C” specimens have the lowest thickness compared to
Liners “A” and “B”. The sandwiching felt material in Liner “C” is thinner than 1.0 mm making it
mostly fiberglass.

64
Figure 4.16 - Comparison of tensile moduli of elasticity values
The tensile strength at yield and at break values for all resin/liner types are compared in
Figure 4.17. Liner “A” products have lower strength values compared to Liners “B” and “C”.
The asymmetry of the felt layers in Liner “A” has caused differential shrinkage when cured
resulting in panels with curvature (Hazen, 2015). The curvature of Liner “A” dog-bone shape
specimens may have affected the tensile test results for this liner system, since the specimens
could not be placed perfectly straight within the grips of the tensile test machine. It is noticeable
in Figure 4.17 that the liner bag materials have increased the ultimate (at break) tensile strength
of resin only samples except for “Resin 1/Liner A” and “Resin 2/Liner A” products.
Figure 4.17 - Comparison of tensile strength values
0
2,000
4,000
6,000
8,000
10,000
12,000
R1
A
R2
A
R3
A
R1
B
R2
B
R3
B
R1
C
R2
C
R3
C
Ten
sile
Mo
du
lus
of
Ela
stic
ity
(M
Pa
)
Resin / Liner Type
Resin + Liner
Resin Only
0
20
40
60
80
100
120
140
160
R1
A
R2
A
R3
A
R1
B
R2
B
R3
B
R1
C
R2
C
R3
C
Ten
sile
Str
eng
th (
MP
a)
Resin / Liner Type
At Yield (Resin + Liner)
At Break (Resin + Liner)
Resin Only

65
For a reinforced CIPP, liner properties are specific to resin-reinforcement-carrier matrix
and cannot be generalized from resin only properties (Richard, 1993). Compared to some other
reinforced CIPP products previously tested by CATT, the tensile properties reported in Table
4.19 seem reasonable. According to Table 1 in ASTM F1216-09, a CIPP system designed for
pressure pipes should have a field inspection ASTM D638 minimum tensile strength of 3000 psi
(21 MPa). The strength at break values for all of the CIPP products reported in Table 4.19,
exceed the ASTM F1216-09 minimum field inspection value.
Some degree of variability is observed in the tensile properties of the specimens in each
liner system. The variability is also observed in tensile properties of some other CIPP liners
tested previously by CATT. The variation in tensile properties among the same type of
specimens can be attributed to the existence of non-uniformity along the laboratory
manufactured CIPP panels resulting in specimens with non-uniform thicknesses. The
inconsistency among the center section (i.e., gage length) of the test specimens may have also
contributed to the variability in the tensile test results. This is why a minimum of five specimens
from each CIPP liner system are tested to obtain representative tensile properties. The tensile
stress-strain curves for some of the liner systems such as “Resin 1/Liner B” are almost linear
while for some others are non-linear such as “Resin 1/Liner C”. The difference is attributed to
the difference in the composition of the liner systems. Some of the liner systems are ductile and
some are brittle.

66
5 Analysis of Nine CIPPs Short-term Flexural Properties
A flexural test is conducted to evaluate the CIPP liner flexural properties. The flexural
test results are used as a basis for characterization of material long-term behavior. In the
following, a description of the flexural test specimens, equipment, and results are provided.
5.1 Flexural Test Specifications
Flexural tests are performed in accordance with ASTM D790-10, Standard Test Methods
for Flexural Properties of Unreinforced and Reinforced Plastics and Electrical Insulation
Materials, test Procedure “A” (three-point loading). The bending test consisted of placing a
rectangular CIPP specimen flatwise on two rigid supports and then loading the specimen at mid-
span in flexure as a beam, until it reaches failure or five percent strain in its outer fibers as
specified in ASTM D790. The amount of deflection and magnitude of the applied load during the
test until failure are recorded for material behavior analysis. Parameters considered in a three
point loading flexural test are illustrated in Figure 5.1.
Figure 5.1 - Three-Point loading bending test
A minimum support span to depth ratio of 16:1 (tolerance +/- 1) is recommended by
ASTM D790 to avoid shear stress effects in the specimen when loading at the mid-span.
However, this ratio can be as high as 64:1 for composite materials depending on the level of
reinforcement (ASTM D790-10).

67
5.2 Flexural Test Specimens
The rectangular test specimens for the flexural test are cut from resin plates in accordance
with ASTM D790-10 Section 7.2.1 requirements using water jet technology with a minimum
support span to depth ratio of 16 to 1. The width of the specimens are selected to be less than or
equal to one fourth of the support span. The length of the specimens are selected to allow for
overhanging on each end for at least 10% of the support span, but in no case less than 6.4 mm on
each end to prevent the specimen from slipping through the supports. The specimens are cut in
the direction specified by Interplastic Corp. to obtain flexural properties in the hoop direction.
Sample dimensions are measured using a digital caliper accurate to 0.01 mm. Specimen
dimensions are presented in Table 5.1. The average sample width and depth (thickness) values
are used in all calculations. For each plate sample, at least five flexural specimens are tested. All
test specimens are labeled using the following scheme:
X1-Y-J-K: where X1 stands for the resin type (e.g., R1 stands for Resin 1, R2 stands for Resin 2,
R3 stands for Resin 3), Y stands for the liner type (three liners labeled as A, B, or C), J
represents the plate number, and K stands for the coupon/specimen number. For example, R2-A-
1-1 refers to Resin 2-Liner A-Plate No.1-Specimen #1.
Table 5.1 - Flexural test specimen dimensions, test span, and span to depth ratio
Test
Specimen
Specimen Dimensions (mm) Test
Span
(mm)
Span to Depth
Ratio Length Width Depth
Liner A 205 25 10.24 to 10.31 169 16.4 to 16.5
Liner B 150 20 7.08 to 7.43 125 16.88 to 17.75
Liner C 105 15 4.73 to 5.17 87 16.97 to 18.57

68
It is stated in Hazen (2015) that all the CIPP systems have shrunk when impregnated with
resin and cured. However, the asymmetry of the felt layers in Liner “A” has caused differential
shrinkage when cured resulting in panels with curvature (Hazen, 2015). A typical Liner “A”
panel having a curvature caused by differential shrinkage is shown in Figure 5.2.
Figure 5.2 - Typical Liner “A” panel with curvature (Adapted from Hazen, 2015)
It was decided and approved by the Interplastic Corp. to test three of the specimens from
each Liner “A” resins with the 3 mm felt side (concave surface) facing downwards and two
specimens with the 7.5 mm felt side (convex surface) facing downwards to evaluate the
difference in flexural properties between the two surfaces. A specimen from each liner type
before, during, and after the flexural test is illustrated in Figures 5.3 to 5.6.

69
Before test
During test
After test (bottom side)
Figure 5.3 - Liner “A” specimen (tested with the concave surface facing downwards)
before, during and after the flexural test
Before test
During test
After test (side view)
Figure 5.4 - Liner “A” specimen (tested with the convex surface facing downwards)
before, during and after the flexural test

70
Before test
During test
After test (side view)
Figure 5.5 - Liner “B” specimen before, during and after the flexural test
Before test
During test
After test (side view)
Figure 5.6 - Liner “C” specimen before, during and after the flexural test

71
5.3 Flexural Test Equipment
The three-point bending tests are performed using test equipment manufactured by
Wykenham Farrance Engineering Ltd., Slough, England. The test equipment uses a gear-driven
piston that moves the test platform up or down at a constant rate. Load readings from a calibrated
Strain-Sert 1000 lbf (4.45kN) load cell, and displacement readings from a calibrated 25mm
LVDT are recorded at 0.2 second intervals using an “eDAQ” data acquisition system. Figure 5.7
shows the test equipment and set-up. The radius of the loading nose is 4.9 mm and the crosshead
motion is set at 0.15 in/min for the “A” liners, and at 0.1 in/min for the “B” and “C” liners. The
loading rate is selected based on the support span and the depth of the specimen in accordance
with ASTM D790-10 requirements.
5.4 Flexural Test Results
CIPP liners depending on the application, level of reinforcement, and resin type could
behave differently under flexural stress (Richard, 1993). Some samples show a brittle response
and some ductile. From the recorded test results, stress-strain plots are generated to determine the
flexural properties of the CIPP products. Typical flexural stress-strain responses are shown in
Figure 5.8.
Load cell
Displacement transformer
Figure 5.7 - Typical flexural test setup
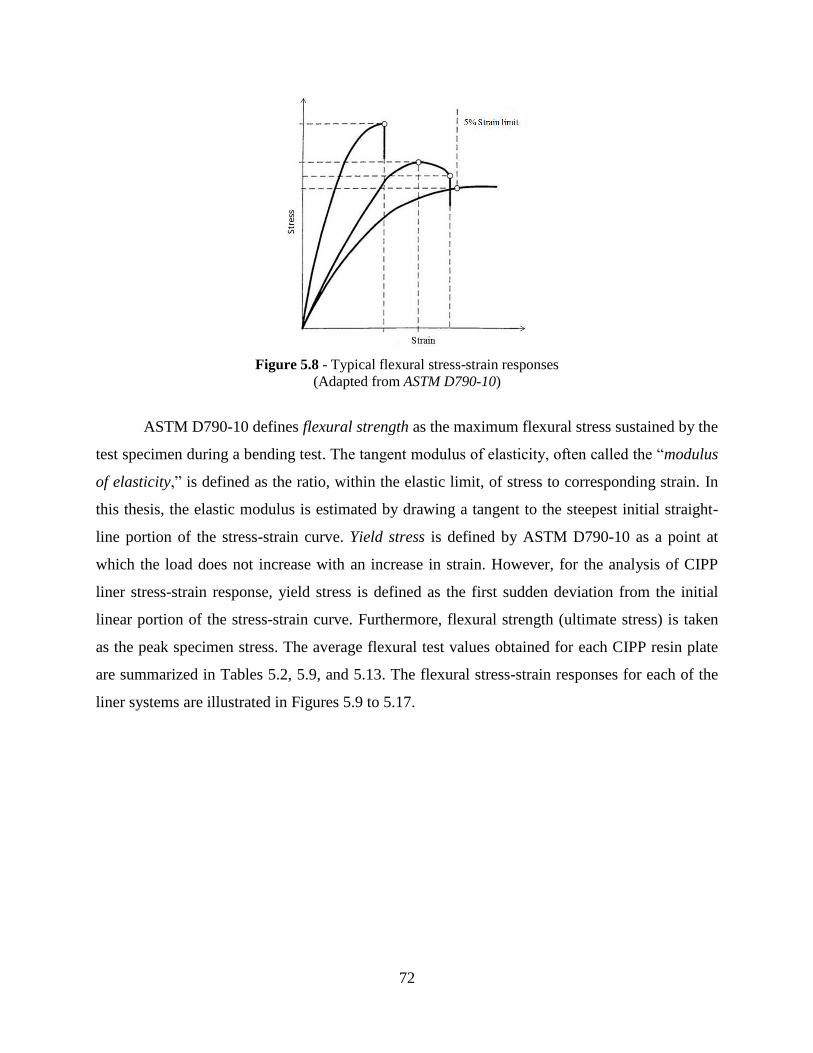
72
Figure 5.8 - Typical flexural stress-strain responses
(Adapted from ASTM D790-10)
ASTM D790-10 defines flexural strength as the maximum flexural stress sustained by the
test specimen during a bending test. The tangent modulus of elasticity, often called the “modulus
of elasticity,” is defined as the ratio, within the elastic limit, of stress to corresponding strain. In
this thesis, the elastic modulus is estimated by drawing a tangent to the steepest initial straight-
line portion of the stress-strain curve. Yield stress is defined by ASTM D790-10 as a point at
which the load does not increase with an increase in strain. However, for the analysis of CIPP
liner stress-strain response, yield stress is defined as the first sudden deviation from the initial
linear portion of the stress-strain curve. Furthermore, flexural strength (ultimate stress) is taken
as the peak specimen stress. The average flexural test values obtained for each CIPP resin plate
are summarized in Tables 5.2, 5.9, and 5.13. The flexural stress-strain responses for each of the
liner systems are illustrated in Figures 5.9 to 5.17.

73
Table 5.2 - Liner “A” Flexural testing summary
Flexural Test Results
Summary
Resin 1 – Liner A Resin 2 – Liner A Resin 3 – Liner A
Average Standard
Deviation Average
Standard
Deviation Average
Standard
Deviation
Span to Depth Ratio 16.5 0.04 16.4 0.07 16.4 0.23
Average Depth (mm) 10.2 0.03 10.3 0.04 10.3 0.14
Slope (N/mm) 107 4.5 103 1.5 67.0 0.9
Initial Tangent Modulus
of Elasticity (MPa) 4,850 151 4,580 78 3,000 95
Initial Tangent Modulus
of Elasticity (psi) 703,300 21,930 663,600 11,370 435,400 13,840
Flexural Strength
(Ultimate) (MPa) 151 3.8 139 2.1 82 2.9
Flexural Strength
(Ultimate) (psi) 21,930 550 20,130 311 11,870 424
Flexural Strain
(Ultimate) (%) 4.84 0.01 4.91 0.04 4.79 0.18
Flexural Strength (Yield)
(MPa) 79.8 6.8 58.9 2.8 32.7 5.30
Flexural Strength (Yield)
(psi) 11,570 992 8,540 405 4,740 770
Flexural Strain (Yield)
(%) 1.68 0.21 1.31 0.09 1.09 0.15

74
Table 5.3 - Resin 1 / Liner A - Flexural properties
Test
Specimen
Initial Tangent
Modulus of
Elasticity
At Flexural Yield At Flexural Break
Strength Strain
(%)
Strength Strain
(%) (MPa) (psi) (MPa) (psi) (MPa) (psi)
R1-A-1-1 4,950 718,300 74 10,790 1.52 153 22,190 4.85
R1-A-1-5 4,920 713,400 77 11,230 1.59 154 22,310 4.85
R1-A-1-8 4,680 678,100 87 12,680 1.92 147 21,300 4.83
Min 4,680 678,100 74 5,553 1.52 147 21,300 4.83
Max 4,950 718,300 87 12,680 1.92 154 22,310 4.85
Average 4,850 703,300 79 11,570 1.68 151 21,930 4.84
Standard
Deviation 151 21,930 7 991 0.21 4 550 0.01
Table 5.4 - Resin 1 / Liner A - Flexural properties of
specimens tested with convex surface facing downwards
Test
Specimen
Initial Tangent
Modulus of
Elasticity
At Flexural Yield At Flexural Break
Strength Strain
(%)
Strength Strain
(%) (MPa) (psi) (MPa) (psi) (MPa) (psi)
R1-A-2-1 4,950 717,600 40 5,770 0.821 74 10,770 1.75
R1-A-2-3 4,970 721,400 38 5,550 0.790 77 11,210 1.88

75
Figure 5.9 - Resin 1 / Liner A - Flexural stress-strain response
Table 5.5 - Resin 2 / Liner A - Flexural properties
Test
Specimen
Initial Tangent
Modulus of
Elasticity
At Flexural Yield At Flexural Break
Strength Strain
(%)
Strength Strain
(%) (MPa) (psi) (MPa) (psi) (MPa) (psi)
R2-A-1-1 4,650 674,800 56.0 8,120 1.22 140 20,250 4.87
R2-A-1-5 4,500 652,000 61.5 8,920 1.40 136 19,780 4.90
R2-A-1-6 4,580 664,100 59.2 8,580 1.31 140 20,360 4.95
Min 4,500 652,000 56.0 8,120 1.22 136 19,780 4.87
Max 4,650 674,800 61.5 8,920 1.40 140 20,360 4.95
Average 4,580 663,600 58.9 8,540 1.31 139 20,130 4.91
Standard
Deviation 78 11,370 3 405 0.09 2 311 0.0

76
Table 5.6 - Resin 2 / Liner A - Flexural properties of
specimens tested with convex surface facing downwards
Test
Specimen
Initial Tangent
Modulus of
Elasticity
At Flexural Yield At Flexural Break
Strength Strain
(%)
Strength Strain
(%) (MPa) (psi) (MPa) (psi) (MPa) (psi)
R2-A-2-1 4,720 684,400 42.2 6,120 0.93 72.5 10,510 1.95
R2-A-2-8 4,500 653,100 36.6 5,300 0.83 70.4 10,210 1.91
Figure 5.10 - Resin 2 / Liner A - Flexural stress-strain response

77
Table 5.7 - Resin 3 / Liner A - Flexural properties
Test
Specimen
Initial Tangent
Modulus of
Elasticity
At Flexural Yield At Flexural Break
Strength Strain
(%)
Strength Strain
(%) (MPa) (psi) (MPa) (psi) (MPa) (psi)
R3-A-1-1 3,010 437,300 35.3 5,110 1.15 83.0 12,040 4.83
R3-A-1-2 2,900 420,700 26.6 3,860 0.92 78.5 11,390 4.94
R3-A-2-3 3,090 448,200 36.2 5,250 1.19 84.0 12,180 4.58
Min 2,900 420,700 26.6 3,860 0.92 78.5 11,390 4.58
Max 3,090 448,200 36.2 5,250 1.19 84.0 12,180 4.94
Average 3,000 435,400 32.7 4,740 1.09 81.8 11,870 4.79
Standard
Deviation 95 13,840 5 769 0.15 3 424 0.2
Table 5.8 - Resin 3 / Liner A - Flexural properties of
specimens tested with convex surface facing downwards
Test
Specimen
Initial Tangent
Modulus of
Elasticity
At Flexural Yield At Flexural Break
Strength Strain
(%)
Strength Strain
(%) (MPa) (psi) (MPa) (psi) (MPa) (psi)
R3-A-2-5 3,120 452,900 23.0 3,340 0.75 44.0 6,400 1.85
R3-A-2-6 3,100 450,200 21.5 3,120 0.70 44.3 6,420 1.75

78
Figure 5.11 - Resin 3 / Liner A - Flexural stress-strain response

79
Table 5.9 - Liner “B” Flexural testing summary
Flexural Test Results
Summary
Resin 1 – Liner B Resin 2 – Liner B Resin 3 – Liner B
Average
Standard
Deviation
Average
Standard
Deviation
Average
Standard
Deviation
Span to Depth Ratio 16.9 0.86 17.8 1.1 17.6 0.95
Average Depth (mm) 7.43 0.37 7.08 0.42 7.12 0.38
Slope (N/mm) 261 36 208 28 186 15
Initial Tangent Modulus
of Elasticity (MPa) 15,530 521 15,210 1,415 12,820 1,462
Initial Tangent Modulus
of Elasticity (psi) 2,252,200 75,500 2,206,400 205,300 1,859,700 212,100
Flexural Strength
(Ultimate) (MPa) 365 29 354 46 250 31
Flexural Strength
(Ultimate) (psi) 52,930 4,200 51,280 6,730 36,300 4,540
Flexural Strain
(Ultimate) (%) 2.48 0.26 2.48 0.22 2.06 0.15
Flexural Strength
(Yield) (MPa) 236 37 219 35 162 11
Flexural Strength
(Yield) (psi) 34,240 5,320 31,790 5,140 23,500 1,570
Flexural Strain (Yield)
(%) 1.53 0.27 1.45 0.11 1.30 0.17

80
Table 5.10 - Resin 1 / Liner B - Flexural properties
Test
Specimen
Initial Tangent
Modulus of
Elasticity
At Flexural Yield At Flexural Break
Strength Strain
(%)
Strength Strain
(%) (MPa) (psi) (MPa) (psi) (MPa) (psi)
R1-B-2-2 15,180 2,202,100 289 41,980 1.93 394 57,130 2.73
R1-B-2-3 16,340 2,369,700 227 32,950 1.43 326 47,250 2.10
R1-B-2-4 15,770 2,287,300 197 28,520 1.27 393 57,040 2.71
R1-B-3-5 15,170 2,200,100 212 30,820 1.36 354 51,310 2.45
R1-B-3-6 15,180 2,201,900 255 36,950 1.67 358 51,920 2.42
Min 15,170 2,200,100 197 28,520 1.27 326 47,250 2.10
Max 16,340 2,369,700 289 41,980 1.93 394 57,130 2.73
Average 15,530 2,252,200 236 34,240 1.53 365 52,930 2.48
Standard
Deviation 521 75,500 37 5,320 0.27 29 4,200 0.26
Figure 5.12 - Resin 1 / Liner B - Flexural stress-strain response

81
Table 5.11 - Resin 2 / Liner B - Flexural properties
Test
Specimen
Initial Tangent
Modulus of
Elasticity
At Flexural Yield At Flexural Break
Strength Strain
(%)
Strength Strain
(%) (MPa) (psi) (MPa) (psi) (MPa) (psi)
*R2-B-1-4 N/A N/A N/A N/A N/A N/A N/A N/A
R2-B-1-6 16,970 2,461,400 272 39,430 1.60 418 60,610 2.62
R2-B-1-7 14,850 2,154,200 206 29,890 1.40 310 45,010 2.16
R2-B-2-3 13,560 1,967,000 195 28,290 1.46 332 48,190 2.63
R2-B-2-5 15,460 2,242,800 204 29,570 1.34 354 51,320 2.49
Min 13,560 1,967,000 195 28,290 1.34 310 45,010 2.16
Max 16,970 2,461,400 272 39,430 1.60 418 60,610 2.63
Average 15,210 2,206,400 219 31,790 1.45 354 51,280 2.48
Standard
Deviation 1,415 205,300 35 5,140 0.11 46 6,730 0.22
* Specimen R2-B-1-4 was removed from analysis due to existence of anomaly in the test result
Figure 5.13 - Resin 2 / Liner B - Flexural stress-strain response

82
Table 5.12 - Resin 3 / Liner B - Flexural properties
Test
Specimen
Initial Tangent
Modulus of
Elasticity
At Flexural Yield At Flexural Break
Strength Strain
(%)
Strength Strain
(%) (MPa) (psi) (MPa) (psi) (MPa) (psi)
R3-B-1-1 14,870 2,156,400 158 22,890 1.08 275 39,950 1.96
R3-B-1-2 12,430 1,802,800 164 23,820 1.33 232 33,580 1.95
R3-B-1-4 11,700 1,697,200 146 21,110 1.27 215 31,240 1.93
R3-B-2-6 13,740 1,993,100 171 24,810 1.26 290 42,090 2.21
R3-B-2-7 11,370 1,648,900 172 24,890 1.55 239 34,650 2.23
Min 11,370 1,648,900 146 21,110 1.08 215 31,240 1.93
Max 14,870 2,156,400 172 24,890 1.55 290 42,090 2.23
Average 12,820 1,859,700 162 23,500 1.30 250 36,300 2.06
Standard
Deviation 1,460 212,100 11 1,570 0.17 31 4,540 0.15
Figure 5.14 - Resin 3 / Liner B - Flexural stress-strain response

83
Table 5.13 - Liner “C” Flexural testing summary
Flexural Test Results
Summary
Resin 1 – Liner C Resin 2 – Liner C Resin 3 – Liner C
Average Standard
Deviation Average
Standard
Deviation Average
Standard
Deviation
Span to Depth Ratio 16.97 1.6 18.57 1.8 17.66 1.6
Average Depth (mm) 5.17 0.50 4.73 0.47 5.01 0.47
Slope (N/mm) 165 33 122 34 118 32
Initial Tangent Modulus
of Elasticity (MPa) 13,390 1,256 12,420 656 10,410 1,173
Initial Tangent Modulus
of Elasticity (psi) 1,942,600 182,200 1,801,100 95,210 1,509,400 170,200
Flexural Strength
(Ultimate) (MPa) 336 36 321 14 257 36
Flexural Strength
(Ultimate) (psi) 48,720 5,240 46,500 1,960 37,350 5,150
Flexural Strain (Ultimate)
(%) 3.40 0.31 3.61 0.52 3.23 0.16
Flexural Strength (Yield)
(MPa) 108 26 95 6 63 5
Flexural Strength (Yield)
(psi) 15,610 3,760 13,780 908 9,140 772
Flexural Strain (Yield)
(%) 0.85 0.24 0.77 0.09 0.62 0.07
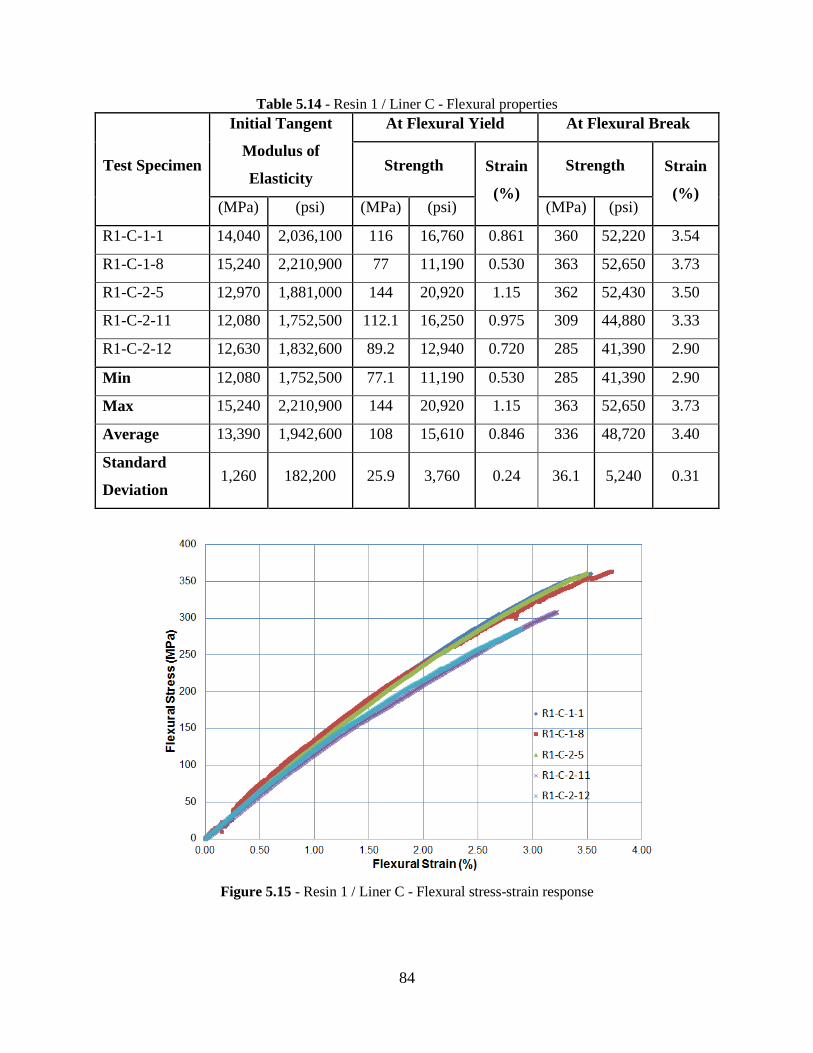
84
Table 5.14 - Resin 1 / Liner C - Flexural properties
Test Specimen
Initial Tangent
Modulus of
Elasticity
At Flexural Yield At Flexural Break
Strength Strain
(%)
Strength Strain
(%) (MPa) (psi) (MPa) (psi) (MPa) (psi)
R1-C-1-1 14,040 2,036,100 116 16,760 0.861 360 52,220 3.54
R1-C-1-8 15,240 2,210,900 77 11,190 0.530 363 52,650 3.73
R1-C-2-5 12,970 1,881,000 144 20,920 1.15 362 52,430 3.50
R1-C-2-11 12,080 1,752,500 112.1 16,250 0.975 309 44,880 3.33
R1-C-2-12 12,630 1,832,600 89.2 12,940 0.720 285 41,390 2.90
Min 12,080 1,752,500 77.1 11,190 0.530 285 41,390 2.90
Max 15,240 2,210,900 144 20,920 1.15 363 52,650 3.73
Average 13,390 1,942,600 108 15,610 0.846 336 48,720 3.40
Standard
Deviation 1,260 182,200 25.9 3,760 0.24 36.1 5,240 0.31
Figure 5.15 - Resin 1 / Liner C - Flexural stress-strain response

85
Table 5.15 - Resin 2 / Liner C - Flexural properties
Test Specimen
Initial Tangent
Modulus of
Elasticity
At Flexural Yield At Flexural Break
Strength Strain
(%)
Strength Strain
(%) (MPa) (psi) (MPa) (psi) (MPa) (psi)
R2-C-1-1 13,310 1,931,000 92 13,320 0.676 306 44,420 2.99
*R2-C-1-8 N/A N/A N/A N/A N/A N/A N/A N/A
R2-C-1-11 11,810 1,713,400 97 14,060 0.830 327 47,480 4.19
R2-C-2-1 12,470 1,809,400 88 12,830 0.731 336 48,730 3.83
R2-C-2-8 12,070 1,750,500 103 14,910 0.859 313 45,360 3.43
Min 11,810 1,713,400 88 12,830 0.68 306 44,420 2.99
Max 13,310 1,931,000 103 14,910 0.859 336 48,730 4.19
Average 12,420 1,801,100 95 13,780 0.770 321 46,500 3.61
Standard
Deviation 656 95,210 6 908 0.090 14 1,960 0.52
* Specimen R2-C-1-8 was removed from analysis due to existence of anomaly in the test result
Figure 5.16 - Resin 2 / Liner C - Flexural stress-strain response

86
Table 5.16 - Resin 3 / Liner C - Flexural properties
Figure 5.17 - Resin 3 / Liner C - Flexural stress-strain response
Test
Specimen
Initial Tangent
Modulus of
Elasticity
At Flexural Yield At Flexural Break
Strength Strain
(%)
Strength Strain
(%) (MPa) (psi) (MPa) (psi) (MPa) (psi)
R3-C-1-1 9,160 1,329,000 65 9,400 0.730 231 33,450 3.35
R3-C-1-9 11,960 1,734,000 68 9,860 0.574 312 45,300 3.33
R3-C-1-11 10,300 1,494,700 67 9,740 0.639 264 38,270 3.06
R3-C-2-8 9,430 1,367,600 55 8,030 0.609 222 32,170 3.34
R3-C-2-9 11,180 1,621,400 60 8,670 0.539 259 37,540 3.05
Min 9,160 1,329,000 55 8,030 0.539 222 32,170 3.05
Max 11,960 1,734,000 68 9,860 0.730 312 45,300 3.35
Average 10,410 1,509,400 63 9,140 0.618 257 37,350 3.23
Standard
Deviation 1,170 170,200 5 772 0.073 36 5,150 0.16

87
5.5 Discussion of Flexural Test Results
ASTM D790-10 specifies five percent strain in specimen outer fibers as the failure limit.
Liner “A” specimens demonstrated the highest strain values at the flexural break point. However,
none of the specimens from the nine CIPP products had strain values above five percent at the
flexural break point. The average initial modulus of elasticity, strength at yield, and strength at
break values for each resin/liner type are reported in Table 5.17.
Table 5.17 - Average flexural test results for each resin/liner type
Resin / Liner
Type
Initial Modulus
of Elasticity
Strength at
Yield
Strength at
Break
(MPa) (psi) (MPa) (psi) (MPa) (psi)
Resin 1 / Liner A 4,890 709,800 63 9,210 121 17,560
Resin 2 / Liner A 4,580 663,600 59 8,540 139 20,130
Resin 3 / Liner A 3,000 435,400 33 4,740 82 11,870
Resin 1 / Liner B 15,530 2,252,200 236 34,240 365 52,930
Resin 2 / Liner B 15,210 2,206,400 219 31,790 354 51,280
Resin 3 / Liner B 12,820 1,859,700 162 23,500 250 36,300
Resin 1 / Liner C 13,390 1,942,600 108 15,610 336 48,720
Resin 2 / Liner C 12,420 1,801,100 95 13,780 321 46,500
Resin 3 / Liner C 10,410 1,509,400 63 9,140 257 37,350
The asymmetry of the felt layers in Liner “A” has caused differential shrinkage when
cured resulting in panels with curvature (Hazen, 2015). The Liner “A” specimens tested with the
convex surface facing downwards demonstrated a brittle behavior compared to the specimens
tested with the concave surface facing downwards. It should be noted that for the specimens
tested with the concave surface facing downwards, the load applied at the mid-span is in the
direction of specimen curvature as oppose to the specimens tested with the convex surface facing
downwards which the load is applied against the specimen curvature. It should also be noted that
the thinner layer (i.e., the 3.0 mm felt layer) is at the bottom when the concave surface faced
downwards and the thicker layer (i.e., the 7.5 mm felt layer) is at the bottom when the convex
surface faced downwards. Thus, the asymmetry of the felt layers may have contribued to this
difference in the behavior of the Liner “A” specimens. The test results from the specimens tested
with the concave surface down are considered as the material flexural properties.

88
The initial flexural moduli of elasticity values of all resin/liner types are compared in
Figure 5.18. It is noticed that the liner bag materials, especially Liner “B”, have substantially
added to the flexural stiffness of the resin only samples. Liner “B” bag material has the lowest
fiberglass thickness as a percentage of total thickness. Figure 5.18 also shows that the Resin “3”
products have lower flexural moduli of elasticity values compared to the other two resins in each
liner system. Liner “A” products have considerably lower flexural moduli of elasticity compared
to Liners “B” and “C”.
Figure 5.18 - Comparison of flexural moduli of elasticity values
The flexural strength at yield and at break values of all resin/liner types are compared in
Figure 5.19. Liner “A” products have lower strength values compared to Liners “B” and “C”. It
is noticed that the Liner “A” bag material has not increased the ultimate (at break) flexural
strength of the Resin “1” only sample. Figure 5.19 shows that Liner “B” products have higher
flexural strength at yield and at break values compared to Liners “A” and “C”. Flexural
properties of Liner “A” systems are lower than Liners “B” and “C”. This difference is due to the
differing construction of each liner resulting in panels with different thicknesses and fiberglass
content, two variables which have a significant impact on flexural properties of CIPP liners
(Hazen, 2015). Resin “3” products demonstrated lower flexural properties compared to Resins
“1” and “2”. This difference is attributed to the differing polymer properties and the fiberglass to
resin interaction on the molecular level (Hazen, 2015). Resin “3” is the only VOC-free and
0
2,000
4,000
6,000
8,000
10,000
12,000
14,000
16,000
18,000
R1
A
R2
A
R3
A
R1
B
R2
B
R3
B
R1
C
R2
C
R3
C
Fle
xu
ral
Mod
ulu
s of
Ela
stic
ity
(MP
a)
Resin / Liner Type
Resin + Liner
Resin Only

89
styrene-free resin and had a significantly different composition comparing to Resins “1” and “2”
(Hazen, 2015).
Figure 5.19 - Comparison of flexural strength values
For a reinforced CIPP, liner properties are specific to resin-reinforcement-carrier matrix
and cannot be generalized from resin only properties (Richard, 1993). Compared to some other
reinforced CIPP products previously tested by CATT, the flexural properties reported in Table
5.17 seem reasonable. Flexural strength at yield values are used as a basis for calculation of the
loads required for the long-term creep tests. The minimum field inspection short-term flexural
modulus and flexural strength values required by ASTM F1216-09 are 250,000 psi (1724 MPa)
and 4500 psi (31 MPa), respectively. The flexural modulus and flexural strength values for all of
the CIPP products reported in Table 5.17 exceed the ASTM F1216-09 minimum field inspection
values.
Similar to tensile test specimens, some degree of variability is observed in the flexural
properties of the specimens in each liner system. For some liner systems the variability is higher
than others. The variability is also observed in flexural properties of some other CIPP liners
tested previously by CATT. The variation in flexural properties among the same type of
specimens can be attributed to the existence of non-uniformity along the laboratory
manufactured CIPP panels resulting in specimens with non-uniform thicknesses. This is why a
minimum of five specimens from each CIPP liner system are tested to obtain representative
flexural properties.
0
50
100
150
200
250
300
350
400
R1
A
R2
A
R3
A
R1
B
R2
B
R3
B
R1
C
R2
C
R3
C
Fle
xu
ral
Str
eng
th (
MP
a)
Resin / Liner Type
At Yield (Resin + Liner)
At Break (Resin + Liner)
Resin Only
90
6 Analysis of Nine CIPPs Long-term Flexural Creep Behavior
As mentioned in Chapter 2, CIPP liners creep under stress. The rate of creep is influenced
by resin type, applied load, degree of cure, and the environmental conditions (Richard, 1993). A
long-term flexural creep test is conducted to evaluate the CIPP liner long-term behavior. In the
following, a description of the creep test, specimens, equipment, and the results are provided.
6.1 Creep Test Specifications and Procedure
ASTM D2990-09, Standard Test Methods for Tensile, Compressive, and Flexural Creep
and Creep-Rupture of Plastics, outlines the test procedure for determining the long-term flexural
creep modulus. ASTM D2990 and ISO 899, “Determination of Creep Behavior”, Parts 1 and 2
cover the same subject matter. However, it is stated in ASTM D2990-09 that the technical
content of ISO 899 is different from ASTM D2990 and results cannot be directly compared
between the two test methods. Flexural creep behavior is addressed in ISO 899 Part 2, “Flexural
Creep by Three-Point Loading”. ASTM D2990-09 specifies the test procedure for measuring the
deformation of a specimen as a function of time under a constant static load applied to the
specimen in selected loading configurations, (such as, tension, flexure, or compression) in a
controlled temperature and humidity environment.
The flexural creep test is conducted on rectangular CIPP specimens similar to the
specimens used in the bending test, prepared in accordance with ASTM D790 specifications. The
test consisted of placing a rectangular specimen flatwise as a beam, on two rigid supports and
applying a load at the mid-span with the long axis of the specimen perpendicular to the loading
nose. The full load is applied within five seconds.
Upon application of the load, the specimen undergoes an initial rapid elongation that may
consist of both elastic and plastic strain (ASTM D2990-09). The plastic strain may not be
recoverable once the load is removed. Although the initial strain in the specimen that occurs
instantaneously upon application of the load does not represent material creep, it should be
included in the creep modulus calculations since it is usually a considerable fraction of the total
allowable strain in design of CIPP liners (ASTM D2990-09). Following the initial elongation, the
creep rate decreases rapidly with time (primary creep) and then it reaches a steady-state value
(secondary creep) followed by a rapid increase and fracture (tertiary creep) which usually occurs

91
at high stress levels (ASTM D2990-09). Figure 6.1 shows an idealized curve illustrating the three
stages of creep.
Figure 6.1 - Primary, secondary, and tertiary creep stages (Adapted from ASTM D2990-09)
The flexural creep test duration is not specified by ASTM D2990-09. However, the
standard states that for prediction of material long-term performance undergoing constant loads
for six months or longer, test duration of longer than 3,000 hours is necessary. For CIPP liners,
10,000 hours of continuous loading has become standard industry practice for extrapolation of
the test results to determine the 50-year creep modulus (TTC Report 302, 1994). Creep behavior
is noticeably affected by temperature (Ryther and Ruggles-Wrenn, 2011). Thus, the test is
conducted in a controlled temperature and humidity room. The temperature and relative humidity
of the test environment over the testing period is monitored to make sure it stays within specified
limits (i.e., temperature of 23 +/- 2°C (73.4 +/- 3.6°F) and 50 +/- 10 % relative humidity).
6.2 Creep Test Specimens
According to ASTM D2990-09, at least three specimens are required for the flexural
creep test at a single temperature to estimate long-term properties of a particular CIPP product.
However, in this research, five specimens from each liner system are tested to obtain more
representative test results. Rectangular test specimens are cut from resin plates using water jet
technology in accordance with ASTM D790-10 requirements. To avoid shear stress effects, the
specimens are cut with a support span to depth ratio of 16 (tolerance +/- 1). The width of the
specimens are selected to be less than or equal to one fourth of the support span. The length of
the specimens are selected to allow for overhanging on each end for at least 10% of the support

92
span, but in no case less than 6.4 mm on each end to prevent the specimen from slipping through
the supports. Sample dimensions are measured using a digital caliper accurate to 0.01 mm.
Specimen dimensions are presented in Table 6.1. Average sample width and depth (thickness)
values are used in all calculations. All test specimens are labeled using the following scheme:
X1-Y-J-K: where X1 stands for the resin type (e.g., R1 stands for Resin 1, R2 stands for Resin 2,
R3 stands for Resin 3), Y stands for the liner type (three liners labeled as A, B, or C), J
represents the plate number, and K stands for the coupon/specimen number. For example, R2-A-
1-1 refers to Resin 2-Liner A-Plate No.1-Specimen #1.
Table 6.1 - Creep test specimen dimensions and span to depth ratio
Test Specimen Specimen Dimensions (mm)
Span to Depth
Ratio Length Width Depth
Liner A 205 25 10.06 to 10.56 15.6 to 16.8
Liner B 150 20 6.64 to 7.80 16.0 to 18.8
Liner C 105 15 4.23 to 5.50 15.8 to 20.6
6.3 Creep Test Loads
Both the ASTM D2990-09 and ISO standard 889-2-2003 do not specify the required test
load for the flexural creep test. ISO standard 889-2-2003, states to select a stress value
appropriate to the application envisaged for the material under test or choose the stress such
that the deflection is not greater than 0.1 times the distance between the supports at any time
during the test. A load creating a flexural stress equivalent to 25 percent of material ASTM D790
yield stress is selected for the long-term creep test. A typical ASTM D790 flexural stress-strain
response of a brittle CIPP liner is illustrated in Figure 6.2. In this case the flexural strength and
the yield stress values are the same since a sudden failure occurs at 1.5% strain. It should also be
noted that since the exact period and level of stresses (such as hydraulic surges, and hydrostatic
pressures, etc.) that a liner may undergo over its design life are unknown, a factor of safety of
“2” is commonly considered in CIPP design (Knight, 2013).

93
Figure 6.2 - Typical CIPP ASTM D790 flexural stress-strain response
Creep-rupture envelopes are useful for determining a stress level below which it is safe to
operate given the time requirements of the end-use application (ASTM D2990-09). To develop a
creep-rupture envelope, it is required to test a material under different stress levels and measure
the time to failure (ASTM D2990-09). Figure 6.3 shows a typical creep-rupture envelope
developed for a plastic material.
Figure 6.3 - Creep rupture envelop (Adapted from ASTM D2990-09)

94
As illustrated in Figure 6.3, as the stress level increases, the time-to-failure decreases and
the material demonstrates less creep. On the other hand, at lower stress levels the time-to-failure
increases and the material creep behavior can be better characterized. This better explains the
reason behind the selection of 25% of material ASTM D790 yield stress as the required test load
for flexural creep characterization of CIPP liners. The calculated test loads are reported in Table
6.2. All of the loads were approved by the Interplastic Corp.
Table 6.2 - Long-term flexural creep test loads
Liner Type / Resin Type Mass (kg)
Liner A / Resin 1 20.9
Liner A / Resin 2 15.7
Liner A / Resin 3 9.3
Liner B / Resin 1 39.2
Liner B / Resin 2 31.1
Liner B / Resin 3 23.5
Liner C / Resin 1 10.1
Liner C / Resin 2 6.3
Liner C / Resin 3 5.5
6.4 Prediction of Specimens Deflection Level
Based on the calculated loads (i.e., 25% of material ASTM D790 yield stress), the
maximum deflection of the rectangular beam shape specimens from each liner type is predicted
using Equation 6.1.
Figure 6.4 - Rectangular beam maximum deflection
(Adapted from Canadian Concrete Design Handbook, 2005)

95
𝛿𝑚𝑎𝑥 = 𝑃𝑙3
48 𝐸𝐼 (6.1)
where,
𝛿𝑚𝑎𝑥 = specimen maximum deflection (mm),
P = load applied on the specimen (N),
l = specimen span (mm),
E = short-term flexural modulus (MPa),
I = moment of inertia (mm4 mm⁄ ).
The estimated maximum deflection values for each liner type are provided in Table 6.3.
The values presented in Table 6.3 are estimated based on average properties of five specimens
from each CIPP product. For the estimation of specimen deflection, the flexural modulus is taken
as 50% of initial value, assuming that the specimen loses 50% of its initial flexural modulus
under constant stress over the test period (i.e., creep of 50%). This doubled the values of the
predicted maximum deflections.
Table 6.3 - Predicted specimen maximum deflection values
Resin /
Liner Type
50%
Flexural
Modulus,
E
(MPa)
L
(mm)
Depth,
h
(mm)
Width,
b
(mm)
I
(𝐦𝐦𝟒)
P
(N)
Max.
Deflection
(mm)
Liner A /
Resin 1 2,425 169 10.24 25 2,237 205.5 3.81
Liner A /
Resin 2 2,288 169 10.31 25 2,283 154.3 2.97
Liner A /
Resin 3 1,527 169 10.29 25 2,270 91.7 2.66
Liner B /
Resin 1 7,589 125 7.43 20 684 384.0 3.01
Liner B /
Resin 2 7,564 125 7.08 20 591 305.0 2.77
Liner B /
Resin 3 6,156 125 7.12 20 602 230.0 2.53
Liner C /
Resin 1 6,281 87 5.17 15 173 99.4 1.26
Liner C /
Resin 2 6,209 87 4.65 15 126 61.8 1.09
Liner C /
Resin 3 5,238 87 5.01 15 157 53.7 0.89

96
6.5 Creep Test Equipment
From each liner system, five test samples are loaded on a rigid test rack with a span equal
to 16 times the sample thickness. The test racks are designed in accordance with Canadian
Handbook of Steel Construction specifications to be capable of withstanding the test loads.
Using a stirrup, each sample is loaded at the mid span by hanging a steel weight as shown in
Figure 6.5. Mechanical dial gages accurate to 0.01 mm mounted on top of the test frame are used
to monitor the deflection of four of the specimens from each liner system. From each CIPP
product, deflection of one of the test specimens is monitored and recorded using a displacement
transducer connected to a data acquisition system. All tests are conducted in a controlled access
room located in the Engineering 2 building at the University of Waterloo.
Figure 6.5 - Typical flexural creep test setup
Specimen Monitored by
Displacement Transducer
Specimen Monitored by
Mechanical Dial Gage

97
6.6 Creep Test Results
The test started on June 13, 2014 with a total of 45 specimens. Sample deflection
measurements are recorded at approximately 0.02, 0.05, 0.1, 0.2, 0.25, 0.5, 1, 2, 5, 16, 24, 48, 96,
192, 384, 768 and 1000 hours after the load application. Additional readings are recorded at
subsequent 1000 hours interval until 10,000 hours is reached on August 10, 2015. These
recorded data are used to predict the CIPPs long-term behavior. The amount of measured
deflection at each time step is used to calculate the creep modulus for a given specimen.
According to ASTM D2990-09, creep modulus is determined by dividing the maximum fiber
stress by the maximum strain at a given time step. ASTM D2990-09 defines the following two
relationships for calculating the maximum fiber stress and the maximum strain, respectively.
Maximum fiber stress for each specimen is calculated using Equation 6.2:
𝑆 = 3𝑃𝐿 2𝑏𝑑2⁄ (6.2)
where,
S = stress, psi (MPa),
P = initial applied load, lbf (N),
L = span, in. (mm),
b = width, in. (mm), and
d = depth, in. (mm).
Maximum strain in the outer fibers at the mid-span is calculated as:
𝑟 = 6𝐷𝑑
𝐿2 ∗ 100 (6.3)
where,
r = maximum strain, in./in. (mm/mm),
D = maximum deflection at mid-span, in. (mm),
d = corrected specimen depth, in. (mm), and
L = span, in. (mm).

98
The flexural creep test results for each of the specimens from all of the CIPP products are
provided in Tables 6.4 to 6.12. The creep modulus versus time plots for all of the liner systems
are presented in Figures 6.6 to 6.14.
Table 6.4 - Resin 1 / Liner A - Creep test results
Specimen Time Deflection
Maximum
Strain Creep Modulus
(Hours) (mm) (%) (MPa) (psi)
R1-A-1-2 1,000 2.42 0.532 3,590 521,000
R1-A-1-2 3,000 2.46 0.540 3,540 513,200
R1-A-1-2 6,000 2.55 0.560 3,410 494,500
R1-A-1-2 10,000 2.63 0.577 3,310 480,000
R1-A-1-6 1,000 2.54 0.540 3,740 542,000
R1-A-1-6 3,000 2.60 0.554 3,650 528,800
R1-A-1-6 6,000 2.71 0.578 3,490 507,000
R1-A-1-6 10,000 3.03 0.645 3,130 454,200
R1-A-2-5 1,000 2.21 0.491 3,780 548,400
R1-A-2-5 3,000 2.25 0.500 3,710 537,900
R1-A-2-5 6,000 2.34 0.519 3,580 518,600
R1-A-2-5 10,000 2.42 0.536 3,460 501,700
R1-A-2-6 1,000 2.20 0.487 3,850 558,400
R1-A-2-6 3,000 2.25 0.498 3,770 546,500
R1-A-2-6 6,000 2.33 0.515 3,640 528,000
R1-A-2-6 10,000 2.42 0.535 3,510 508,600
R1-A-2-7 1,000 2.16 0.480 3,880 563,200
R1-A-2-7 3,000 2.27 0.502 3,710 538,100
R1-A-2-7 6,000 2.33 0.516 3,610 523,800
R1-A-2-7 10,000 2.43 0.538 3,460 502,600

99
Figure 6.6 - Resin 1 / Liner A - Creep modulus over 10,000 hours of loading

100
Table 6.5 - Resin 2 / Liner A - Creep test results
Specimen Time Deflection
Maximum
Strain Creep Modulus
(Hours) (mm) (%) (MPa) (psi)
R2-A-1-2 1,000 1.91 0.432 3,420 496,000
R2-A-1-2 3,000 2.06 0.466 3,170 460,500
R2-A-1-2 6,000 2.19 0.496 2,980 432,800
R2-A-1-2 10,000 2.30 0.521 2,840 411,800
R2-A-1-7 1,000 1.96 0.448 3,230 469,100
R2-A-1-7 3,000 2.12 0.484 2,990 433,700
R2-A-1-7 6,000 2.23 0.510 2,840 412,000
R2-A-1-7 10,000 2.34 0.534 2,710 393,700
R2-A-2-5 1,000 1.78 0.417 3,300 478,100
R2-A-2-5 3,000 1.96 0.459 3,000 434,800
R2-A-2-5 6,000 2.06 0.481 2,860 414,900
R2-A-2-5 10,000 2.15 0.503 2,730 396,300
R2-A-2-6 1,000 1.83 0.423 3,350 485,500
R2-A-2-6 3,000 2.02 0.465 3,040 441,200
R2-A-2-6 6,000 2.12 0.488 2,900 420,400
R2-A-2-6 10,000 2.22 0.513 2,760 400,100
R2-A-2-7 1,000 1.83 0.418 3,440 498,800
R2-A-2-7 3,000 2.05 0.468 3,070 445,700
R2-A-2-7 6,000 2.36 0.539 2,670 387,500
R2-A-2-7 10,000 2.42 0.554 2,600 377,100

101
Figure 6.7 - Resin 2 / Liner A - Creep modulus over 10,000 hours of loading

102
Table 6.6 - Resin 3 / Liner A - Creep test results
Specimen Time Deflection
Maximum
Strain Creep Modulus
(Hours) (mm) (%) (MPa) (psi)
R3-A-1-3 1,000 3.58 0.757 1,210 176,200
R3-A-1-3 3,000 4.73 0.999 921 133,500
R3-A-1-3 6,000 5.69 1.203 765 110,900
R3-A-1-3 10,000 5.39 1.140 807 117,100
R3-A-1-4 1,000 3.42 0.739 1,190 173,200
R3-A-1-4 3,000 4.46 0.964 915 132,800
R3-A-1-4 6,000 5.31 1.147 769 111,500
R3-A-1-4 10,000 4.92 1.063 830 120,400
R3-A-2-1 1,000 3.30 0.708 1,250 180,700
R3-A-2-1 3,000 4.31 0.926 953 138,200
R3-A-2-1 6,000 5.17 1.110 795 115,300
R3-A-2-1 10,000 4.73 1.016 869 126,000
R3-A-2-2 1,000 3.32 0.714 1,240 180,200
R3-A-2-2 3,000 4.32 0.929 955 138,600
R3-A-2-2 6,000 5.23 1.123 790 114,600
R3-A-2-2 10,000 4.89 1.050 845 122,600
R3-A-2-7 1,000 3.34 0.770 1,120 162,100
R3-A-2-7 3,000 4.54 1.045 823 119,400
R3-A-2-7 6,000 5.57 1.282 671 97,280
R3-A-2-7 10,000 5.24 1.206 713 103,400

103
Figure 6.8 - Resin 3 / Liner A - Creep modulus over 10,000 hours of loading

104
Table 6.7 - Resin 1 / Liner B - Creep test results
Specimen Time Deflection
Maximum
Strain Creep Modulus
(Hours) (mm) (%) (MPa) (psi)
R1-B-2-6 1,000 1.72 0.487 13,540 1,964,400
R1-B-2-6 3,000 1.74 0.493 13,390 1,941,800
R1-B-2-6 6,000 1.73 0.490 13,460 1,951,900
R1-B-2-6 10,000 1.76 0.499 13,210 1,916,500
R1-B-2-7 1,000 2.40 0.611 13,380 1,940,200
R1-B-2-7 3,000 2.43 0.620 13,180 1,912,200
R1-B-2-7 6,000 2.42 0.617 13,250 1,922,500
R1-B-2-7 10,000 2.47 0.629 13,000 1,885,100
R1-B-3-3 1,000 1.60 0.465 13,540 1,963,700
R1-B-3-3 3,000 1.62 0.471 13,350 1,937,000
R1-B-3-3 6,000 1.62 0.471 13,340 1,934,700
R1-B-3-3 10,000 1.64 0.477 13,180 1,911,100
R1-B-3-4 1,000 1.55 0.451 13,840 2,008,000
R1-B-3-4 3,000 1.57 0.458 13,620 1,976,100
R1-B-3-4 6,000 1.59 0.463 13,470 1,953,800
R1-B-3-4 10,000 1.60 0.465 13,430 1,947,700
R1-B-3-7 1,000 1.53 0.459 12,830 1,861,600
R1-B-3-7 3,000 1.60 0.479 12,300 1,783,700
R1-B-3-7 6,000 1.84 0.550 10,710 1,553,600
R1-B-3-7 10,000 1.91 0.571 10,330 1,498,200

105
Figure 6.9 - Resin 1 / Liner B - Creep modulus over 10,000 hours of loading

106
Table 6.8 - Resin 2 / Liner B - Creep test results
Specimen Time Deflection
Maximum
Strain Creep Modulus
(Hours) (mm) (%) (MPa) (psi)
R2-B-1-2 1,000 1.37 0.393 12,860 1,865,800
R2-B-1-2 3,000 1.41 0.406 12,450 1,805,300
R2-B-1-2 6,000 1.42 0.407 12,400 1,798,900
R2-B-1-2 10,000 1.45 0.418 12,080 1,751,700
R2-B-1-3 1,000 1.47 0.413 12,890 1,869,800
R2-B-1-3 3,000 1.51 0.424 12,580 1,825,200
R2-B-1-3 6,000 1.54 0.431 12,360 1,792,000
R2-B-1-3 10,000 1.56 0.436 12,210 1,771,300
R2-B-2-2 1,000 1.94 0.495 12,970 1,880,900
R2-B-2-2 3,000 1.99 0.509 12,620 1,830,800
R2-B-2-2 6,000 2.01 0.513 12,520 1,815,300
R2-B-2-2 10,000 2.04 0.522 12,310 1,785,100
R2-B-2-7 1,000 1.60 0.432 13,230 1,918,600
R2-B-2-7 3,000 1.64 0.444 12,860 1,865,200
R2-B-2-7 6,000 1.66 0.450 12,700 1,842,400
R2-B-2-7 10,000 1.69 0.457 12,490 1,812,000
R2-B-2-9 1,000 1.69 0.477 11,020 1,598,900
R2-B-2-9 3,000 1.75 0.494 10,630 1,541,400
R2-B-2-9 6,000 1.78 0.502 10,480 1,519,700
R2-B-2-9 10,000 1.77 0.500 10,510 1,524,900
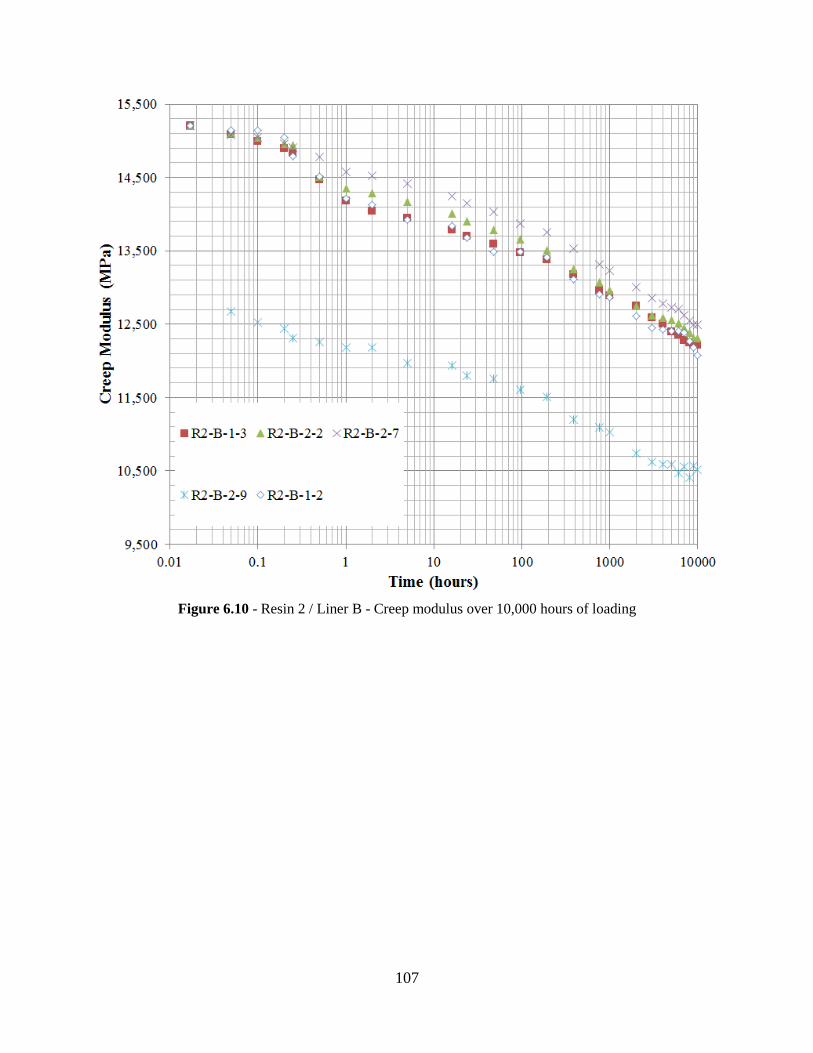
107
Figure 6.10 - Resin 2 / Liner B - Creep modulus over 10,000 hours of loading

108
Table 6.9 - Resin 3 / Liner B - Creep test results
Specimen Time Deflection
Maximum
Strain Creep Modulus
(Hours) (mm) (%) (MPa) (psi)
R3-B-1-3 1,000 1.78 0.473 9,540 1,384,400
R3-B-1-3 3,000 1.89 0.503 8,970 1,300,900
R3-B-1-3 6,000 1.96 0.520 8,680 1,258,600
R3-B-1-3 10,000 1.98 0.527 8,560 1,240,900
R3-B-1-6 1,000 1.35 0.402 8,940 1,297,300
R3-B-1-6 3,000 1.46 0.434 8,290 1,202,400
R3-B-1-6 6,000 1.51 0.450 7,980 1,158,000
R3-B-1-6 10,000 1.53 0.454 7,920 1,148,400
R3-B-2-2 1,000 1.63 0.452 9,170 1,329,900
R3-B-2-2 3,000 1.76 0.487 8,510 1,233,900
R3-B-2-2 6,000 1.77 0.489 8,470 1,228,600
R3-B-2-2 10,000 1.85 0.512 8,090 1,172,900
R3-B-2-3 1,000 1.63 0.444 9,620 1,395,200
R3-B-2-3 3,000 1.69 0.460 9,290 1,346,900
R3-B-2-3 6,000 1.83 0.500 8,540 1,238,600
R3-B-2-3 10,000 1.84 0.502 8,490 1,231,800
R3-B-2-4 1,000 1.41 0.413 8,940 1,297,300
R3-B-2-4 3,000 1.54 0.450 8,200 1,189,500
R3-B-2-4 6,000 1.60 0.467 7,900 1,146,300
R3-B-2-4 10,000 1.62 0.472 7,820 1,134,200

109
Figure 6.11 - Resin 3 / Liner B - Creep modulus over 10,000 hours of loading

110
Table 6.10 - Resin 1 / Liner C - Creep test results
Specimen Time Deflection
Maximum
Strain Creep Modulus
(Hours) (mm) (%) (MPa) (psi)
R1-C-1-2 1,000 1.05 0.369 11,830 1,716,500
R1-C-1-2 3,000 1.07 0.377 11,580 1,679,900
R1-C-1-2 6,000 1.08 0.379 11,530 1,672,000
R1-C-1-2 10,000 1.09 0.384 11,370 1,648,600
R1-C-1-10 1,000 0.90 0.336 11,530 1,671,900
R1-C-1-10 3,000 0.92 0.344 11,260 1,633,600
R1-C-1-10 6,000 0.93 0.348 11,130 1,614,300
R1-C-1-10 10,000 0.94 0.352 11,010 1,597,100
R1-C-1-11 1,000 0.88 0.323 12,530 1,816,700
R1-C-1-11 3,000 0.89 0.327 12,360 1,793,400
R1-C-1-11 6,000 0.89 0.327 12,380 1,796,000
R1-C-1-11 10,000 0.90 0.331 12,210 1,770,800
R1-C-2-4 1,000 0.63 0.267 11,210 1,625,800
R1-C-2-4 3,000 0.64 0.271 11,030 1,600,000
R1-C-2-4 6,000 0.64 0.272 10,990 1,593,700
R1-C-2-4 10,000 0.65 0.276 10,840 1,572,000
R1-C-2-8 1,000 0.60 0.262 10,890 1,580,200
R1-C-2-8 3,000 0.54 0.235 12,130 1,758,900
R1-C-2-8 6,000 0.54 0.236 12,100 1,755,700
R1-C-2-8 10,000 0.57 0.249 11,470 1,663,300

111
Figure 6.12 - Resin 1 / Liner C - Creep modulus over 10,000 hours of loading

112
Table 6.11 - Resin 2 / Liner C - Creep test results
Specimen Time Deflection
Maximum
Strain Creep Modulus
(Hours) (mm) (%) (MPa) (psi)
R2-C-1-5 1,000 0.85 0.285 10,420 1,511,300
R2-C-1-5 3,000 0.88 0.296 10,040 1,456,100
R2-C-1-5 6,000 0.87 0.292 10,150 1,472,900
R2-C-1-5 10,000 0.92 0.310 9,580 1,389,600
R2-C-1-12 1,000 0.79 0.269 10,680 1,548,800
R2-C-1-12 3,000 0.79 0.269 10,660 1,546,800
R2-C-1-12 6,000 0.79 0.271 10,600 1,537,000
R2-C-1-12 10,000 0.82 0.281 10,220 1,482,700
R2-C-2-3 1,000 0.43 0.180 10,700 1,551,600
R2-C-2-3 3,000 0.44 0.185 10,390 1,507,200
R2-C-2-3 6,000 0.44 0.186 10,360 1,502,900
R2-C-2-3 10,000 0.46 0.191 10,070 1,461,200
R2-C-2-7 1,000 0.49 0.204 9,420 1,366,800
R2-C-2-7 3,000 0.51 0.214 8,980 1,302,900
R2-C-2-7 6,000 0.52 0.218 8,810 1,278,000
R2-C-2-7 10,000 0.54 0.225 8,530 1,237,800
R2-C-2-13 1,000 0.54 0.224 8,750 1,269,400
R2-C-2-13 3,000 0.57 0.235 8,340 1,209,100
R2-C-2-13 6,000 0.57 0.238 8,250 1,196,500
R2-C-2-13 10,000 0.59 0.246 7,970 1,156,300

113
Figure 6.13 - Resin 2 / Liner C - Creep modulus over 10,000 hours of loading

114
Table 6.12 - Resin 2 / Liner C - Creep test results
Specimen Time Deflection
Maximum
Strain Creep Modulus
(Hours) (mm) (%) (MPa) (psi)
R3-C-1-2 1,000 0.59 0.250 6,460 936,800
R3-C-1-2 3,000 0.63 0.268 6,020 873,000
R3-C-1-2 6,000 0.64 0.274 5,900 855,400
R3-C-1-2 10,000 0.67 0.283 5,700 827,100
R3-C-1-5 1,000 0.64 0.270 6,110 885,600
R3-C-1-5 3,000 0.69 0.292 5,660 820,600
R3-C-1-5 6,000 0.71 0.298 5,540 803,300
R3-C-1-5 10,000 0.74 0.311 5,310 769,600
R3-C-2-1 1,000 0.96 0.346 6,690 970,300
R3-C-2-1 3,000 1.03 0.370 6,260 908,000
R3-C-2-1 6,000 1.05 0.377 6,140 889,900
R3-C-2-1 10,000 1.09 0.392 5,900 856,400
R3-C-2-2 1,000 1.13 0.381 6,960 1,009,400
R3-C-2-2 3,000 1.21 0.406 6,520 945,900
R3-C-2-2 6,000 1.22 0.409 6,470 938,000
R3-C-2-2 10,000 1.28 0.429 6,170 895,200
R3-C-2-11 1,000 1.00 0.350 6,850 993,800
R3-C-2-11 3,000 1.08 0.380 6,310 915,600
R3-C-2-11 6,000 1.09 0.385 6,240 904,700
R3-C-2-11 10,000 1.13 0.397 6,040 876,600

115
Figure 6.14 - Resin 3 / Liner C - Creep modulus over 10,000 hours of loading

116
6.7 Discussion of Flexural Creep Test Results
As mentioned in Chapter 2, the behavior of CIPP liners is time and stress dependent. The
average 10,000 hour and maximum predicted deflection values for each resin/liner type are
tabulated in Table 6.13 and compared in Figure 6.15.
Table 6.13 - 10,000 hour and maximum predicted deflection values
Resin / Liner
Type
Avergae 10,000
Hour
Deflection
(mm)
Max.
Predicted
Deflection
(mm)
Resin 1 / Liner A 2.58 3.81
Resin 2 / Liner A 2.29 2.97
Resin 3 / Liner A 5.03 2.66
Resin 1 / Liner B 1.88 3.01
Resin 2 / Liner B 1.70 2.77
Resin 3 / Liner B 1.76 2.53
Resin 1 / Liner C 0.83 1.26
Resin 2 / Liner C 0.67 1.09
Resin 3 / Liner C 0.98 0.89
Figure 6.15 - Comparison of average 10,000 hour and maximum predicted deflection values
0.00
1.00
2.00
3.00
4.00
5.00
6.00
Def
lect
ion
(m
m)
Resin / Liner Type
Average 10,000 Hour
Max. Predicted

117
Figure 6.15 shows that the 10,000 hour deflection values are all below the maximum
predicted values except for “Resin 3/Liner A” and “Resin 3/Liner C” products. These two liner
types have deflection values higher than the maximum predicted values and this can be attributed
to the properties of Resin “3” which is the only VOC-free and styrene-free resin. The deflection
values can be correlated to the flexural properties of the liner systems. As discussed in Section
5.5, flexural properties of Liner “A” systems are lower than Liners “B” and “C” and Resin “3”
products also demonstrated lower flexural properties compared to Resins “1” and “2”. The liner
systems which have lower flexural properties, demonstrated higher deflection values. Table 6.13
shows that the combination of Liner “A” and Resin “3” products has resulted in the highest
average 10,000 hour deflection value compared to the eight other CIPP systems. An unusual
behavior is observed in the creep modulus versus log time plot of the “Resin 3/Liner A” product
(See Figure 6.8). After the 6000 hour deflection reading, the specimens from this liner type
demonstrated reverse deflection (i.e., increase in creep modulus) until the 9000 hour reading and
at the 10,000 hour reading the specimens showed a positive deflection. It is not clear exactly why
this liner demonstrated such behavior. However, this different behavior can be attributed to the
construction of Liner “A” and properties of Resin “3”.
“Resin 3/Liner B” product is an exception and has an average 10,000 hour deflection
value less than the predicted value compared to the other two Resin “3” systems. This product
despite demonstrating lower flexural properties compared to “Resin 1/Liner B” product, has a
slightly lower average 10,000 hour deflection value. All of the Liner “A” specimens tested in
flexural creep have the concave surface facing downwards and thus the load is applied in the
direction of the specimen curvature. This may have also contributed to the higher deflection
values compared to the other liner systems. The 10,000 hours of creep test results are used to
estimate the material 50-year (438,000 hours) creep modulus. The CIPP long-term mechanical
properties are described in Chapter 7.

118
7 Prediction of CIPP Liners Long-term Behavior
The long-term behavior of CIPP liners are predicted based on the flexural creep test
results through which the time dependent strain changes are measured under a constant static
load. In the following, the methodology used for analysis of CIPP products long-term physical
properties is described.
7.1 Estimation of Material 50-Year Creep Modulus
The creep test data are used to extrapolate the 50-year creep modulus as an indication of
material behavior over its design life. ASTM D2990-09 does not provide a specific method for
determining the 50-year creep modulus. However, it does offer several procedures for
documenting creep data depending upon time, temperature and rates of loading. To evaluate the
CIPP liners long-term performance, creep moduli values calculated at specified time steps are
plotted versus time on a semi-logarithmic scale. The 50-year creep modulus of any specimen is
estimated based on a linear regression of the observed values and projecting a value to 50 years
as follows:
Creep modulus = a * log (time) + b (7.1)
where “a” and “b” are regression constants. Then, by using the best fit regression equation, the
50-year creep modulus is calculated. Some CIPP samples showed a linear change in creep
modulus over time, but some demonstrated a bi-linear behavior. The linear versus non-linear
behavior can be attributed to the differences in resin-reinforcement-carrier matrices. Based on
previous creep tests conducted on various CIPP liners by CATT, it has been found that the
reinforced CIPP liners tend to demonstrate a bi-linear behavior compared to the non-reinforced
CIPP liners (Knight, 2013). A typical bi-linear CIPP creep behavior is shown in Figure 7.1.

119
Figure 7.1 - An example of bi-linear CIPP creep behavior
As discussed in Chapter 2, the inclusion of all of the observed values from the initial (1-
minute modulus) to the final (10,000 hours modulus) in the regression analysis can result in the
estimation of unsubstantiated high 50-year creep modulus value for the specimens which
demonstrate a bi-linear behavior. Thus, for the specimens which showed a bi-linear behavior in
the creep modulus versus time plot, only the data at every 1000 hour interval are considered for
the regression analysis. The creep modulus versus time plots for all the CIPP products showing
the extrapolated 50-year creep modulus are provided in Appendix B. The extrapolated 50-year
creep moduli values are presented in the following section.
7.2 Determination of Creep Retention Factor (CRF)
The short-term ASTM D790 flexural modulus and the 50-year extrapolated creep
modulus values along with the creep retention factors for each liner system are presented in
Tables 7.1 to 7.3. In this thesis, the Creep Retention Factor (CRF) for any particular CIPP sample
is defined as:
CRF = Extrapolated 50-year creep modulus / ASTM D790 short-term flexural modulus (7.2)
Trend of Data Before
the 1000 Hour Point
Trend of Data After the
1000 Hour Point

120
Table 7.1 - Liner A, Average short-term flexural modulus,
extrapolated 50-year creep moduli, and creep retention factor values
Sample
Average D790
(Short-Term)
Flexural Modulus
Extrapolated
50-Year Creep
Modulus
Creep
Retention
Factor
(MPa) (psi) (MPa) (psi)
R1-A-1-2
4,890 709,800
2,780 403,500 0.57
R1-A-1-6 2,350 341,300 0.48
R1-A-2-5 2,880 418,100 0.59
R1-A-2-6 2,900 421,400 0.59
R1-A-2-7 2,800 406,400 0.57
Average 2,740 398,100 0.56
Standard Deviation 225 32,660 0.05
Maximum 2,900 421,400 0.59
Minimum 2,350 341,300 0.48
R2-A-1-2
4,590 665,700
1,840 266,900 0.40
R2-A-1-7 1,830 265,100 0.40
R2-A-2-5 1,790 259,400 0.39
R2-A-2-6 1,760 255,800 0.38
R2-A-2-7 1,040 150,500 0.23
Average 1,650 239,500 0.36
Standard Deviation 345 49,970 0.08
Maximum 1,840 266,900 0.40
Minimum 1,040 150,500 0.23
R3-A-1-3
3,050 441,900
23 3,320 0.01
R3-A-1-4 104 15,060 0.03
R3-A-2-1 99 14,420 0.03
R3-A-2-2 34 4,950 0.01
*R3-A-2-7 N/A N/A N/A
Average 65 9,440 0.02
Standard Deviation 43 6,160 0.01
Maximum 104 15,060 0.03
Minimum 23 3,320 0.01 * Specimen R3-A-2-7 was removed from analysis due to existence of anomaly in the test result
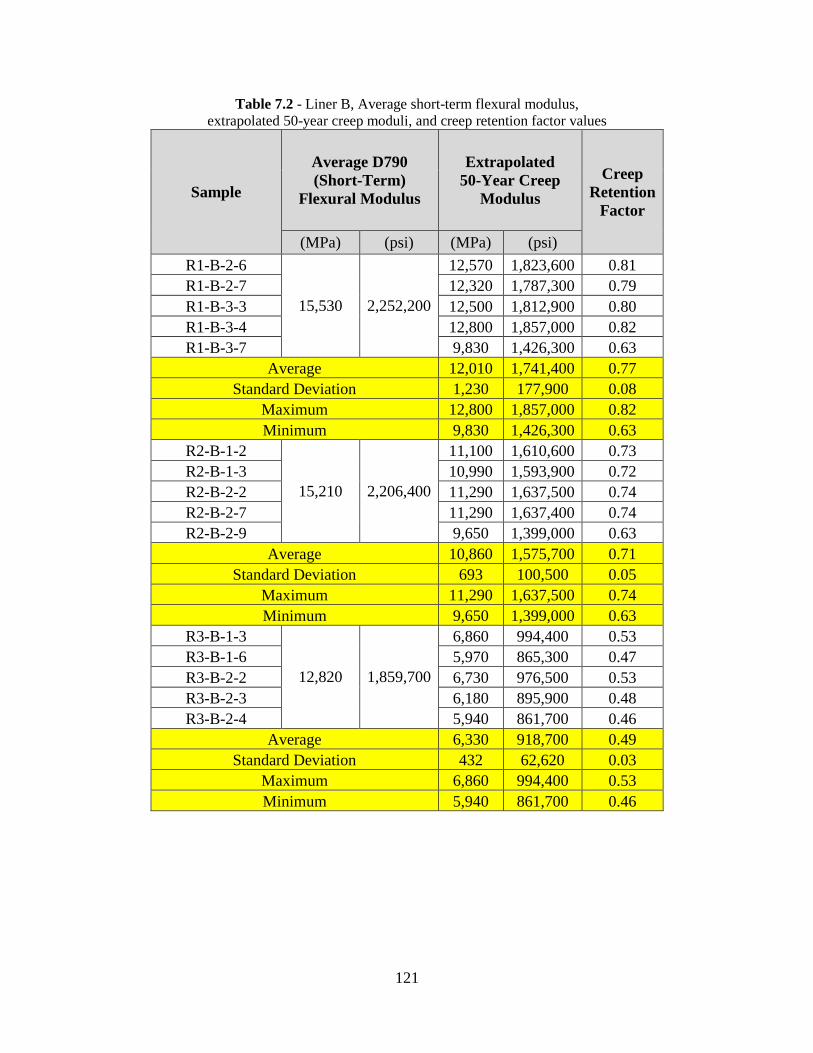
121
Table 7.2 - Liner B, Average short-term flexural modulus,
extrapolated 50-year creep moduli, and creep retention factor values
Sample
Average D790
(Short-Term)
Flexural Modulus
Extrapolated
50-Year Creep
Modulus
Creep
Retention
Factor
(MPa) (psi) (MPa) (psi)
R1-B-2-6
15,530 2,252,200
12,570 1,823,600 0.81
R1-B-2-7 12,320 1,787,300 0.79
R1-B-3-3 12,500 1,812,900 0.80
R1-B-3-4 12,800 1,857,000 0.82
R1-B-3-7 9,830 1,426,300 0.63
Average 12,010 1,741,400 0.77
Standard Deviation 1,230 177,900 0.08
Maximum 12,800 1,857,000 0.82
Minimum 9,830 1,426,300 0.63
R2-B-1-2
15,210 2,206,400
11,100 1,610,600 0.73
R2-B-1-3 10,990 1,593,900 0.72
R2-B-2-2 11,290 1,637,500 0.74
R2-B-2-7 11,290 1,637,400 0.74
R2-B-2-9 9,650 1,399,000 0.63
Average 10,860 1,575,700 0.71
Standard Deviation 693 100,500 0.05
Maximum 11,290 1,637,500 0.74
Minimum 9,650 1,399,000 0.63
R3-B-1-3
12,820 1,859,700
6,860 994,400 0.53
R3-B-1-6 5,970 865,300 0.47
R3-B-2-2 6,730 976,500 0.53
R3-B-2-3 6,180 895,900 0.48
R3-B-2-4 5,940 861,700 0.46
Average 6,330 918,700 0.49
Standard Deviation 432 62,620 0.03
Maximum 6,860 994,400 0.53
Minimum 5,940 861,700 0.46

122
Table 7.3 - Liner C, Average short-term flexural modulus,
extrapolated 50-year creep moduli, and creep retention factor values
Sample
Average D790
(Short-Term)
Flexural Modulus
Extrapolated
50-Year Creep
Modulus
Creep
Retention
Factor
(MPa) (psi) (MPa) (psi)
R1-C-1-2
13,390 1,942,600
10,400 1,508,000 0.78
R1-C-1-10 9,710 1,408,300 0.72
R1-C-1-11 11,610 1,684,300 0.87
R1-C-2-4 10,010 1,451,500 0.75
*R1-C-2-8 N/A N/A N/A
Average 10,430 1,513,000 0.78
Standard Deviation 836 121,300 0.06
Maximum 11,610 1,684,300 0.87
Minimum 9,710 1,408,300 0.72
R2-C-1-5
12,420 1,801,100
8,060 1,168,400 0.65
R2-C-1-12 9,250 1,342,200 0.75
R2-C-2-3 8,750 1,269,700 0.70
R2-C-2-7 6,480 940,100 0.52
R2-C-2-13 6,280 910,600 0.51
Average 7,760 1,126,200 0.63
Standard Deviation 1,340 193,700 0.11
Maximum 9,250 1,342,200 0.75
Minimum 6,280 910,600 0.51
R3-C-1-2
10,410 1,509,400
3,510 509,600 0.34
R3-C-1-5 2,960 428,700 0.28
R3-C-2-1 3,810 552,800 0.37
R3-C-2-2 4,250 616,300 0.41
R3-C-2-11 4,130 599,700 0.40
Average 3,730 541,400 0.36
Standard Deviation 521 75,590 0.05
Maximum 4,250 616,300 0.41
Minimum 2,960 428,700 0.28 * Specimen R1-C-2-8 was removed from analysis due to existence of anomaly in the test result

123
The long-term flexural modulus of the liner required by ASTM F1216 is defined as the
short-term D790 modulus reduced by the long-term creep retention factor. The following
relationship is used to determine the value of “EL”:
𝐸𝐿 = 𝐶𝑅𝐹 ∗ 𝐸 (7.3)
where "𝐶𝑅𝐹" is called the resin creep retention factor and “E” is the resin short-term (ASTM
D790) initial tangent modulus. As mentioned in Chapter 2, the same creep retention factor is
usually applied to the liner flexural strength to estimate the liner long-term time-corrected
flexural strength (𝜎𝐿) used for determination of the minimum liner thickness required for
rehabilitation of an oval pipe (i.e., application of Equation X1.2).
7.3 Discussion of CIPP Liners Creep Retention Factors
The long-term creep test is conducted both on specific resins and liners (i.e., resin plus
tube) (Knasel, 1994). For a non-reinforced CIPP, liner properties are mostly related to resin
properties. However, for a reinforced CIPP, liner properties are specific to resin-reinforcement-
carrier matrix and cannot be generalized from resin only properties (Richard, 1993). The short-
term flexural moduli values and the extrapolated 50-year creep moduli values for each liner
system are compared in Figure 7.2.

124
Figure 7.2 - Comparison of short-term and long-term creep moduli values
Figure 7.2 suggests that Resin “3” systems had lower 50-year creep moduli values
compared to Resins “1” and “2”. The above figure also shows that Liner “A” systems
demonstrated lower short-term and long-term flexural moduli values compared to Liners “B” and
“C”. The average, minimum, and maximum creep retention factors for each liner system are
presented in Table 7.4 and compared in Figure 7.3.
Table 7.4 - Summary of creep retention factors
Resin / Liner
Type
Average
Creep Retention
Factor
Minimum
Creep Retention
Factor
Maximum
Creep Retention
Factor
Resin 1 / Liner A 0.56 0.48 0.59
Resin 1 / Liner B 0.77 0.63 0.82
Resin 1 / Liner C 0.78 0.72 0.87
Resin 2 / Liner A 0.36 0.23 0.40
Resin 2 / Liner B 0.71 0.63 0.74
Resin 2 / Liner C 0.63 0.51 0.75
Resin 3 / Liner A 0.02 0.01 0.03
Resin 3 / Liner B 0.49 0.46 0.53
Resin 3 / Liner C 0.36 0.28 0.41
0
2,000
4,000
6,000
8,000
10,000
12,000
14,000
16,000
18,000
R1
A
R1
B
R1
C
R2
A
R2
B
R2
C
R3
A
R3
B
R3
C
Short-term Flexural Modulus (MPa) 50-Year Creep Modulus (MPa)
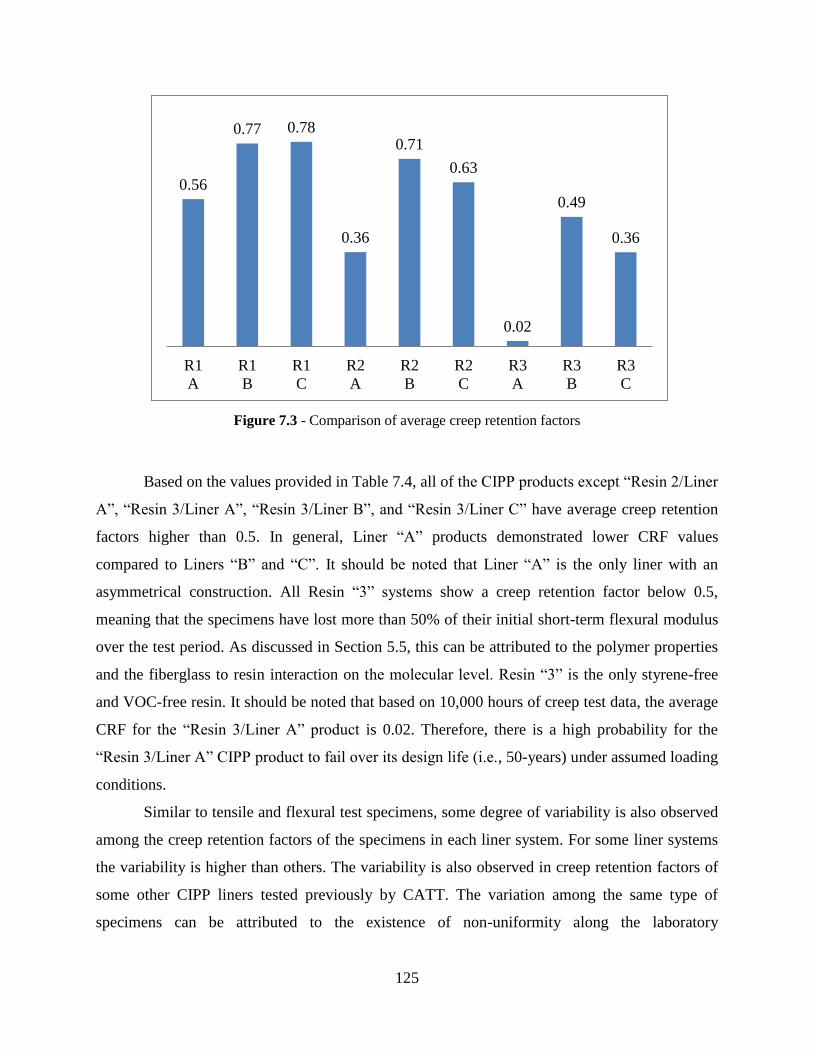
125
Figure 7.3 - Comparison of average creep retention factors
Based on the values provided in Table 7.4, all of the CIPP products except “Resin 2/Liner
A”, “Resin 3/Liner A”, “Resin 3/Liner B”, and “Resin 3/Liner C” have average creep retention
factors higher than 0.5. In general, Liner “A” products demonstrated lower CRF values
compared to Liners “B” and “C”. It should be noted that Liner “A” is the only liner with an
asymmetrical construction. All Resin “3” systems show a creep retention factor below 0.5,
meaning that the specimens have lost more than 50% of their initial short-term flexural modulus
over the test period. As discussed in Section 5.5, this can be attributed to the polymer properties
and the fiberglass to resin interaction on the molecular level. Resin “3” is the only styrene-free
and VOC-free resin. It should be noted that based on 10,000 hours of creep test data, the average
CRF for the “Resin 3/Liner A” product is 0.02. Therefore, there is a high probability for the
“Resin 3/Liner A” CIPP product to fail over its design life (i.e., 50-years) under assumed loading
conditions.
Similar to tensile and flexural test specimens, some degree of variability is also observed
among the creep retention factors of the specimens in each liner system. For some liner systems
the variability is higher than others. The variability is also observed in creep retention factors of
some other CIPP liners tested previously by CATT. The variation among the same type of
specimens can be attributed to the existence of non-uniformity along the laboratory
0.56
0.77 0.78
0.36
0.71
0.63
0.02
0.49
0.36
R1
A
R1
B
R1
C
R2
A
R2
B
R2
C
R3
A
R3
B
R3
C

126
manufactured CIPP panels resulting in specimens with non-uniform thicknesses. Consistency
among the specimens from each liner type is an important factor for obtaining representative
results. It should be noted that the variability in the creep retention factors of the specimens from
each resin/liner type can also be attributed to the long-term testing conditions. The dial gages
used for deflection monitoring are highly sensitive. It is a challenging task to record a reference
reading before application of the load. The difference between the reference reading and the 1-
minute (after application of the load) dial gage reading demonstrates the initial elongation of the
specimen which is a considerable portion of the total deflection that a specimen experiences. Due
to the discrepancy associated with the dial gage reference readings, it was decided to adjust the
1-minute readings for all of the specimens from each liner system as the short-term ASTM D790
flexural modulus of that particular liner system. ASTM D2990 requires a minimum of three
specimens to be tested in flexural creep. However, in this research project, five specimens from
each liner system are tested for characterization of material long-term creep behavior to obtain
more representative test results.
As mentioned in Chapter 2, common industry practice has been to adopt a creep retention
factor of 0.5 for all CIPP materials. This has been mainly on testing of Insituform liner systems
using non-reinforced resins (Knight, 2013). Based on the data presented in Table 7.4, a creep
retention factor of 0.5 may not be applicable for all resin/liner types. Table 7.4 suggests that the
creep retention factor is specific to the resin/liner type.

127
8 Conclusions and Recommendations
Within North America, CIPP liners used for rehabilitation of gravity pipelines are
typically designed according to the design methodology provided in the non-mandatory
Appendix (X1) of ASTM F1216. In the design equations provided in the standard, there are two
parameters, liner long-term time-corrected modulus of elasticity and long-term time-corrected
flexural strength, which are related to the CIPP long-term creep behavior. ASTM F1216 does not
specify any methodology for characterizing the material long-term physical properties. Common
industry practice has been to adopt a creep retention factor of 0.5 for all CIPP materials. With all
the new CIPP product varieties, a creep retention factor of 0.5 may not apply. In the following,
conclusions and recommendations regarding the short-term and long-term mechanical properties
of CIPP liners are provided.
8.1 Conclusions
Analysis of previous long-term creep test results
Based on the comparison made between the results of the hydrostatic buckling tests and
the ASTM D2990 flexural creep tests, it can be concluded that both methods yield similar
results. However, ASTM D2990 provides a relatively simple test procedure compared to the
hydrostatic buckling test.
Based on 96,000 hours (about 11 years) of long-term test data, the estimated creep factors
considering data points only after 1000 hour, are all below 0.5 except the AOC Enhanced resin
which is 0.5. This suggests that the industry standard creep retention factor of 0.5 may not be
applicable for all resin types.
The results of the flexural tests conducted on AOC and Interplastic Corp. resins after
seven years of undergoing flexural creep test demonstrate that the flexural modulus retention
factors range from 0.70 to 0.77 and the flexural strength retention factors range from 0.67 to
0.96. The AOC and Interplastic Corp. Standard resins have higher flexural modulus retention
factors compared to the Enhanced resins. The AOC resins have lower flexural strength retentions
factors compared to the Interplastic Corp. resins. However, for the Interplastic Corp. samples, it
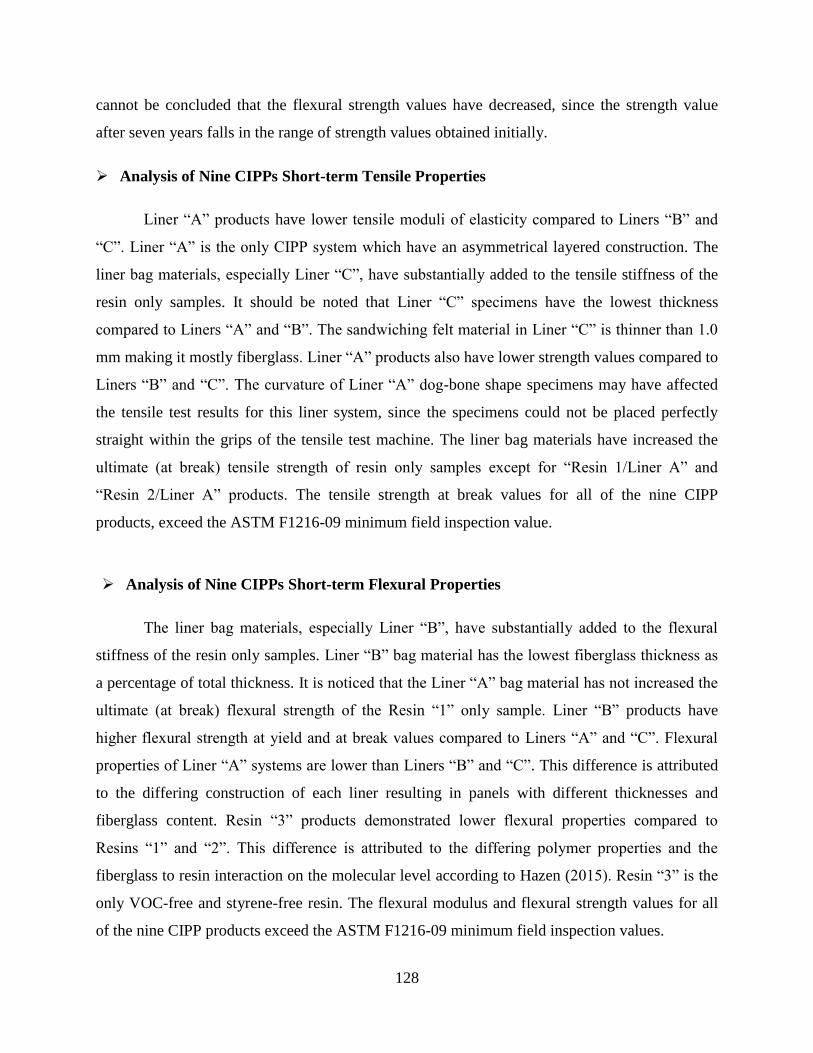
128
cannot be concluded that the flexural strength values have decreased, since the strength value
after seven years falls in the range of strength values obtained initially.
Analysis of Nine CIPPs Short-term Tensile Properties
Liner “A” products have lower tensile moduli of elasticity compared to Liners “B” and
“C”. Liner “A” is the only CIPP system which have an asymmetrical layered construction. The
liner bag materials, especially Liner “C”, have substantially added to the tensile stiffness of the
resin only samples. It should be noted that Liner “C” specimens have the lowest thickness
compared to Liners “A” and “B”. The sandwiching felt material in Liner “C” is thinner than 1.0
mm making it mostly fiberglass. Liner “A” products also have lower strength values compared to
Liners “B” and “C”. The curvature of Liner “A” dog-bone shape specimens may have affected
the tensile test results for this liner system, since the specimens could not be placed perfectly
straight within the grips of the tensile test machine. The liner bag materials have increased the
ultimate (at break) tensile strength of resin only samples except for “Resin 1/Liner A” and
“Resin 2/Liner A” products. The tensile strength at break values for all of the nine CIPP
products, exceed the ASTM F1216-09 minimum field inspection value.
Analysis of Nine CIPPs Short-term Flexural Properties
The liner bag materials, especially Liner “B”, have substantially added to the flexural
stiffness of the resin only samples. Liner “B” bag material has the lowest fiberglass thickness as
a percentage of total thickness. It is noticed that the Liner “A” bag material has not increased the
ultimate (at break) flexural strength of the Resin “1” only sample. Liner “B” products have
higher flexural strength at yield and at break values compared to Liners “A” and “C”. Flexural
properties of Liner “A” systems are lower than Liners “B” and “C”. This difference is attributed
to the differing construction of each liner resulting in panels with different thicknesses and
fiberglass content. Resin “3” products demonstrated lower flexural properties compared to
Resins “1” and “2”. This difference is attributed to the differing polymer properties and the
fiberglass to resin interaction on the molecular level according to Hazen (2015). Resin “3” is the
only VOC-free and styrene-free resin. The flexural modulus and flexural strength values for all
of the nine CIPP products exceed the ASTM F1216-09 minimum field inspection values.

129
Analysis of Nine CIPPs Long-term Flexural Creep Behavior
All of the specimens from each CIPP product tested in flexural creep, demonstrated
deflection values below the maximum predicted values except “Resin 3/Liner A” and “Resin
3/Liner C” specimens. These two liner types have deflection values higher than the maximum
predicted values and this can be attributed to the properties of Resin “3”. The deflection values
can be correlated to the flexural properties of the liner systems. The liner systems which have
lower flexural properties, demonstrated higher deflection values.
Combination of Liner “A” and Resin “3” products has resulted in the highest average
10,000 hour deflection value compared to the eight other CIPP systems. An unusual behavior is
observed in the creep modulus versus log time plot of the “Resin 3/Liner A” product (See Figure
6.8). After the 6000 hour deflection reading, the specimens from this liner type demonstrated
reverse deflection (i.e., increase in creep modulus) until the 9000 hour reading and at the 10,000
hour reading the specimens showed a positive deflection. It is not clear exactly why this liner
demonstrated such behavior. However, this different behavior can be attributed to the
construction of Liner “A” and properties of Resin “3”.
“Resin 3/Liner B” product is an exception and has an average 10,000 hour deflection
value less than the predicted value compared to the other two Resin “3” systems. This product
despite demonstrating lower flexural properties compared to “Resin 1/Liner B” product, has a
slightly lower average 10,000 hour deflection value. All of the Liner “A” specimens tested in
flexural creep have the concave surface facing downwards and thus the load is applied in the
direction of the specimen curvature. This may have also contributed to the higher deflection
values compared to the other liner systems.
All of the CIPP products except “Resin 2/Liner A”, “Resin 3/Liner A”, “Resin 3/Liner
B”, and “Resin 3/Liner C” have average creep retention factors higher than 0.5. In general, Liner
“A” products demonstrated lower CRF values than Liners “B” and “C”. Liner “A” is the only
liner with an asymmetrical construction. All Resin “3” systems have CRF values below 0.5,
meaning that the specimens have lost more than 50% of their initial short-term flexural modulus
over the test period. This can be attributed to the polymer properties and the fiberglass to resin
interaction on the molecular level according to Hazen (2015). Resin “3” is the only styrene-free

130
and VOC-free resin. It should be noted that based on 10,000 hours of creep test data, the average
CRF for the “Resin 3/Liner A” product is 0.02. Therefore, there is a high probability for the
“Resin 3/Liner A” CIPP product to fail over its design life (i.e., 50-years) under assumed loading
conditions.
Similar to tensile and flexural test specimens, some degree of variability is observed
among the creep retention factors of the specimens in each liner system. For some liner systems
the variability is higher than others. The variation among the same type of specimens can be
attributed to the existence of non-uniformity along the laboratory manufactured CIPP panels
resulting in specimens with non-uniform thicknesses. Consistency among the specimens from
each liner type is an important factor for obtaining representative results.
Most of the liner systems demonstrated a bi-linear behavior over the 10,000 hours of
creep test. It is agreed that the regression of 1000 hour interval data results in a better prediction
of the 50-year modulus and the regression of all test data is not appropriate or realistic for the
materials that do not have a linear response on a creep modulus versus log time graph.
Common industry practice has been to adopt a creep retention factor of 0.5 for all CIPP
materials. Based on the long-term creep test results, a creep retention factor of 0.5 may not be
applicable for all resin/liner types. The test results suggest that the creep retention factor is
specific to the resin/liner type.

131
8.2 Recommendations
Creep retention factor is dependent on the particular rehabilitation system considering
factors such as the type of resin and construction of the fabric tube. Thus, it is recommended to
obtain both short-term and long-term properties through experimentation for all new products
before use. The CIPP samples used for analysis in this thesis are laboratory manufactured. Field
installation and curing conditions can be significantly different from laboratory controlled
conditions. It is recommended to test field cured CIPP samples for evaluating the properties of
installed liner. Further testing is required to evaluate the material tensile/compression long-term
properties to develop a better understanding of CIPP liner long-term mechanical behavior. It is
also desirable to test CIPP products in flexural creep at various stress levels to generate a creep-
rupture envelope. This will help the designers to have a better understanding of CIPP liner creep
behavior.

132
References
ASTM D638 – 10, Standard Test Methods for Tensile Properties of Plastics.
ASTM D790 – 10, Standard Test Methods for Flexural Properties of Unreinforced and
Reinforced Plastics and Electrical Insulating Materials.
ASTM D2990 – 09, Standard Test Methods for Tensile, Compressive, and Flexural Creep and
Creep-Rupture of Plastics.
ASTM F1216 – 09, Standard Practice for Rehabilitation of Existing Pipelines and Conduits by
the Inversion and Curing of a Resin-Impregnated Tube.
Boyce, G. M., Bried, E., 1998. Social Cost Accounting for Trenchless Projects. North American
Conference and Exhibition of Trenchless Technology, Albuquerque, New Mexico, USA, 5-8
April.
Canadian Concrete Design Handbook, 2005. 3rd
Edition.
Canadian Handbook of Steel Construction, 2012. 10th
Edition.
Boot, J. C., Welch, A. J., 1996. Creep Buckling of Thin-walled Polymeric Pipe Linings Subject to
External Groundwater Pressure. Thin-Walled Structures 24, 191-210.
Federation of Canadian Municipalities and National Research Council, 2003. Deterioration and
Inspection of Water Distribution Systems. Issue No. 1.1.
Guice, L. K., Straughan, W. T., Norris, C. R., and Bennett, R. D., 1994. Long-Term Structural
Behavior of Pipeline Rehabilitation Systems. Technical Report #302, Trenchless Technology
Center, Louisiana Tech University, Ruston, Louisiana, USA.
Hazen, B. R., 2015. Physical Properties and Flexural Creep Retention Factors of Reinforced
CIPP Liners of Various Bag Materials and Thermoset Resins. Paper TM1-T3-01, NASTT No-
Dig Show, Denver, Colorado, USA, 15-19 March.

133
Herzog, D., Bennett, A. J., Rahaim, K., and Schiro, J. D., 2007. A Comparison of Cured-In-Place
Pipe (CIPP) Mechanical Properties: Laboratory vs. Field-Manufactured. On behalf of
Interplastic Corporation. American Composites Manufacturing Association (ACMA).
ISO 899-2, 2003. Plastics – Determination of creep behavior, Part 2: Flexural creep by 3-point
loading.
Kleweno, D. G., 1994. Physical Properties and Chemical Resistance of Selected Resins for
Cured-in-Place Pipe Rehabilitation. Buried Plastic Pipe Technology: 2nd
Volume, ASTM STP
1222, Dave Eckstein, Ed., American Society for Testing and Materials, Philadelphia.
Kleweno, D., 1998. Long-Term Performance Comparison of Pipe Lining Systems using
Traditional Methodologies. North American Conference and Exhibition of Trenchless
Technology, Albuquerque, New Mexico, USA, 5-8 April.
Knasel, J. P., 1994. Resin Selection for CIPP Applications – A Discussion. Journal of No-Dig
Engineering, Vol. 1, No.2, pp. 20-21.
Knight, M., CIPP Design & Construction and Quality Control. Part of Trenchless Technologies
graduate level course, University of Waterloo, Ontario, Canada, Winter 2013.
Knight, M., 2005. Testing of AOC and Interplastic Corp. CIPP Resins used within the City of
Toronto Sewers. Center for Advancement of Trenchless Technologies, University of Waterloo,
Waterloo, Ontario, Canada.
Knight, M., Sarrami, K., 2007. Testing of CIPP Resins used within the City of Toronto Sewers.
NASTT No-Dig Conference and Exhibition, San Diego, California, USA, 16-19 April.
Nawab, Y., Casari, P., Boyard, N., and Jacquemin, F., 2013. Characterization of the cure
shrinkage, reaction kinetics, bulk modulus and thermal conductivity of thermoset resin from a
single experiment. Journal of Materials Science, Vol. 48(6), pp. 2394-2403.
Thepot, O., 2004. International Comparison of Methods for the Design of Sewer Linings. 3R
International 8-9, Essen, Germany.

134
Oxner, K. B., Allsup, T., 1999. Advances in Cured-in-Place Pipe Rehabilitation for Pressurized
Piping Systems. Insituform Technologies, Inc.
Rehan, R., Knight, M. A., Haas, C. T., Unger, A. J. A., 2011. Application of system dynamics for
developing financially self-sustaining management policies for water and wastewater systems.
Journal of Water Research, pp. 1-14.
Richard, J. G., 1993. Demystifying The Design of Cured-in-Place Pipe for Sewer Rehabilitation.
Proceedings of WEF Conference, Anaheim, California, USA.
Ryther, C. E. C., Ruggles-Wrenn, M. B., 2011, The Rate (Time) – Dependent Mechanical
Behavior of the PMR-15 Thermoset Polymer at Temperatures in the 274-316 Degree C Range:
Experiments and Modeling. Proceedings of the ASME International Mechanical Engineering
Congress & Exposition, Denver, Colorado, USA, 11-17 November.
Schrock, B. J., 1999. Long-Term Modulus For Pipeline Renewal Products. Journal of No-Dig
Engineering, Vol. 6, No.2, pp. 15-17.
Straughan, W. T., Guice, L. K., and Mal-Duraipandian, C., 1995. Long-Term Structural
Behavior of Pipeline Rehabilitation Systems. Journal of Infrastructure Systems, Vol. 1, No. 4,
Paper No. 11361.
Straughan, W. T., Tantirungrojchai, N., Guice, L. K., and Lin, H., 1998. Creep Test of Cured-In-
Place Pipe Material Under Tension, Compression, and Bending. Journal of Testing and
Evaluation, JTEVA, Vol. 26, No. 6, pp. 594-601.
WRc Sewerage Rehabilitation Manual (SRM), 1993. 3rd
Edition. UK Water Research Center.
Zhao, W., Nassar, R., Hall, D., 2005. Design and reliability of pipeline rehabilitation liners.
Journal of Tunneling and Space Technology 20, pp. 203-212.

135
Appendix A – Designation of Resins and CIPP Bag Materials
CORVE8190 = Resin 1
VEX216-589 = Resin 2
CORVE8293 = Resin 3
Norditube = Reinforced CIPP Liner A
Applied Felts = Reinforced CIPP Liner B
Saertex = Reinforced CIPP Liner C

136
Appendix B – Creep Modulus versus Time Plots
Resin 1 / Liner A
Regression Equation
Specimen a b
R-
Square
R1-A-1-2 -46,959 668,395 0.89
R1-A-1-6 -81,924 803,484 0.72
R1-A-2-5 -51,716 709,907 0.89
R1-A-2-6 -54,449 728,566 0.89
R1-A-2-7 -60,113 745,513 0.97

137
Resin 2 / Liner A
Regression Equation
Specimen a b
R-
Square
R2-A-1-2 -88,256 764,819 0.99
R2-A-1-7 -78,125 705,798 1.00
R2-A-2-5 -82,788 726,440 0.99
R2-A-2-6 -87,483 749,370 0.99
R2-A-2-7 -136,442 920,227 0.93

138
Resin 3 / Liner A
Regression Equation
Specimen a b
R-
Square
R3-A-1-3 -62,513 355,986 0.84
R3-A-1-4 -56,895 336,029 0.79
R3-A-2-1 -59,694 351,185 0.79
R3-A-2-2 -63,351 362,344 0.84
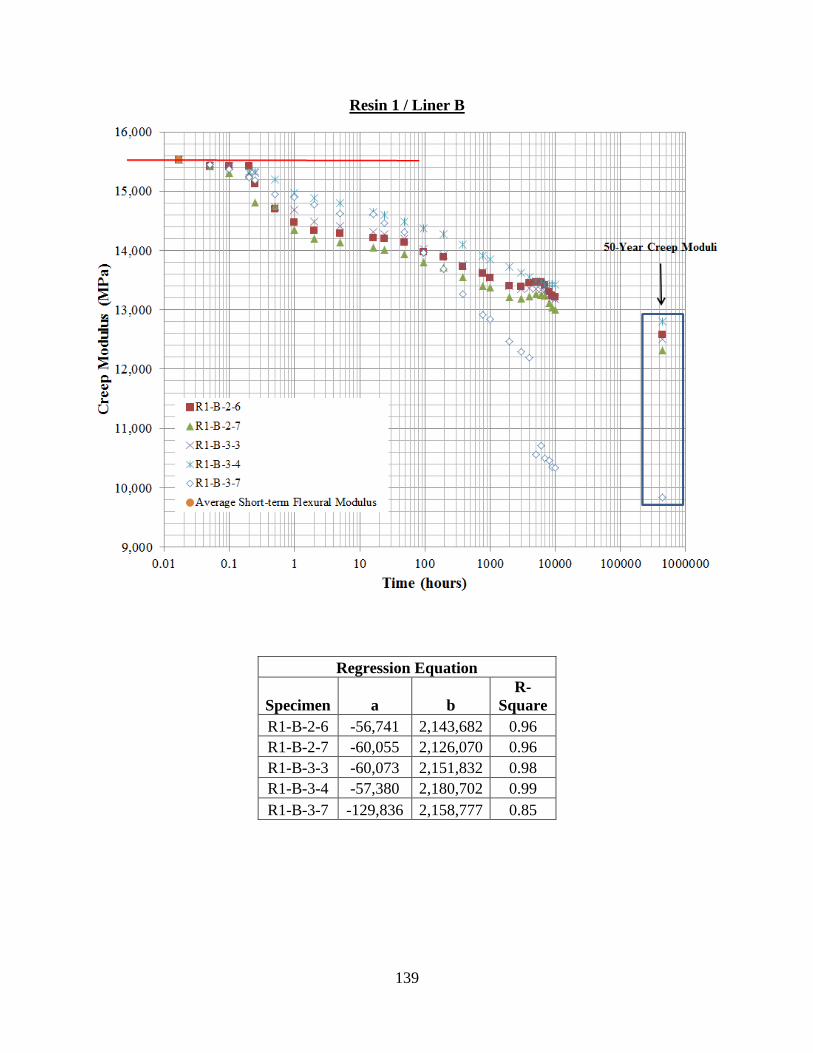
139
Resin 1 / Liner B
Regression Equation
Specimen a b
R-
Square
R1-B-2-6 -56,741 2,143,682 0.96
R1-B-2-7 -60,055 2,126,070 0.96
R1-B-3-3 -60,073 2,151,832 0.98
R1-B-3-4 -57,380 2,180,702 0.99
R1-B-3-7 -129,836 2,158,777 0.85

140
Resin 2 / Liner B
Regression Equation
Specimen a b
R-
Square
R2-B-1-2 -95,052 2,146,868 0.92
R2-B-1-3 -106,198 2,193,040 0.99
R2-B-2-2 -91,769 2,155,234 0.98
R2-B-2-7 -106,389 2,237,586 0.99
R2-B-2-9 -70,317 1,795,693 0.82

141
Resin 3 / Liner B
Regression Equation
Specimen a b
R-
Square
R3-B-1-3 -143,870 1,805,994 0.98
R3-B-1-6 -161,471 1,776,196 0.94
R3-B-2-2 -127,799 1,697,450 0.90
R3-B-2-3 -200,196 2,025,252 0.90
R3-B-2-4 -157,450 1,749,963 0.92

142
Resin 1 / Liner C
Regression Equation
Specimen a b
R-
Square
R1-C-1-2 -56,183 1,881,107 0.89
R1-C-1-10 -71,780 1,885,007 0.99
R1-C-1-11 -35,828 1,922,214 0.76
R1-C-2-4 -47,800 1,768,925 0.92

143
Resin 2 / Liner C
Regression Equation
Specimen a b
R-
Square
R2-C-1-5 -95,847 1,804,964 0.78
R2-C-1-12 -61,965 1,753,731 0.61
R2-C-2-3 -77,099 1,781,711 0.90
R2-C-2-7 -115,970 1,710,301 0.97
R2-C-2-13 -96,566 1,551,975 0.94

144
Resin 3 / Liner C
Regression Equation
Specimen a b
R-
Square
R3-C-1-2 -119,645 1,304,195 1.00
R3-C-1-5 -128,786 1,284,027 1.00
R3-C-2-1 -118,204 1,337,891 0.99
R3-C-2-2 -112,417 1,362,958 0.98
R3-C-2-11 -109,772 1,328,701 0.98