Embed Size (px)
Citation preview

i
SHORTAGE OF NURSES IN SOUTH AFRICA: RELATIVE OR ABSOLUTE?
Case study report, forming part of the HSRC study:
A multiple source identification and verification of scarce and critical skills in the South African labour
market Commissioned by the Department of Labour
Angelique Wildschut and Thando Mqolozana
04 September 2008

ii
Table of Contents INTRODUCTION..................................................................................... 1 1. SCARCE SKILLS, CRITICAL SKILLS, ABSOLUTE AND RELATIVE SCARCITY– SAME DIFFERENCE?....................................................... 2 Defining scarcity……………………………………………………………… 2 Measuring scarcity…………………………………………………………… 4 Programmes used to address scarcity…………………………………….. 6 2. WHO SAYS THERE IS A SHORTAGE?............................................. 6 Individuals/stakeholders in the nursing profession………………………. 6 Skills legislation/policy reports for the nursing profession………………. 7 3. EXISTING NURSING LABOUR FORCE………………………………. 12 Profile of nursing staff……………………………………………………….. 13 Public/Private divide…………………………………………………………. 19 Comparison with other countries…………………………………………… 20 4. SUPPLY OF NURSES……………………………………………………. 22 Growth in registers…………………………………………………………… 27 5. DEMAND FOR NURSES………………………………………………… 31 Analysis of DoL’s job vacancy database…………………………………... 32 Survey of employers recently advertising vacancies in the Sunday Times 38 Forecasting new demand for nurses……………………………………….. 41 Demand due to HIV/AIDS……………………………………………………. 42 Population……………………………………………………………… 42 Health care system…………………………………………………… 42 Health Human Resources…………………………………………… 43 6. ADDITIONAL FACTORS INFLUENCING SUPPLY/DEMAND……….. 48 Working conditions, and broader professional environment……………... 49 Remuneration…………………………………………………………………. 49 Solutions to the poor nursing wage…………………………………. 50 Emigration of nurses………………………………………………………….. 52 Existing initiatives……………………………………………………………… 57 Short term initiatives…………………………………………………… 57 Medium term initiatives……………………………………………….. 58 Long term initiatives…………………………………………………… 59

iii
7. SUMMATIVE REMARKS AND RECOMMENDATIONS FOR THE FUTURE 61 Summative remarks………………………………………………………….. 61 Recommendations…………………………………………………………… 62 Initiatives should correspond to correctly identified……………… 62 There should be congruence between the different strategies … 63 REFERENCES………………………………………………………………. 65 APPENDIX…………………………………………………………………… 75

iv
List of Tables and Figures Table 1: Target for human resources for health production……………… 9 Table 2: Total nurses in employment, 2001, 2005………………………… 13 Table 3: Gender distribution of nursing staff by occupational category, 2006…………………………………………………………….. 14 Table 4:Gender distribution of nursing staff, learner category, 2006 14 Table 5: Racial distribution of nursing staff by occupational category, and percentages, 2007………………………………………. 15 Table 6:Age distribution of nursing staff by occupational category, in percentages, 2006…………………………………………….. 16 Table 7: Occupational distribution of nursing staff, 2005…………………. 17 Table 8: Nurse per population by province, 2006…………………………. 17 Table 9: Population per qualified nurse in the same province, 2006……. 18 Table 10: Private sector nurses compared to private sector beneficiaries……………………………………………………… 19 Table 11: Nurses per 1000 population in SA and neighbouring countries, various years…………………………………………………….. 20 Table 12: Nurses per 1000 population, OECD countries…………………… 21 Table 13:Output for nursing courses by Province, 2006…………………… 23 Table 14: Output four year programme by year, 1997-2006…………….… 24 Table 15: Output pupil nurses by year, 1997-2006………………………… 24 Table 16: Output pupil auxiliaries by year, 1997-2006……………………. 25 Table 17: Output bridging programme by year, 1997-2006………………. 26 Table 18: Output for all nursing courses, excluding bridging programmes, by year, 1997 – 2006…………………………………………… 26 Table 19: Growth in registers (SANC)………………………………………... 27 Table 20: Overall numbers of professional nurses produced, 1996 – 2006 28 Table 21: Growth in the South African Nursing Council Register and Roll of nurses, 1996 – 2006……………...……………………… 29 Table 22: Year-on-year growth calculated…………………………………… 30 Table 23: Number and share of vacancies for Health Professionals, by year and minor group………………………………………………… 33 Table 24: Number and share of vacancies for Midwifery and Nursing professionals, by year and by unit group……………………. 33 Table 25: Total number of nursing professional, and nursing associate vacancies by province, from April 2004 - March 2007……… 35 Table 26: Total number of nursing professional, and nursing associate vacancies by sector, from April 2004 - March 2007…………. 36 Table 27: Percentage of professional nurse posts vacant, 2006 and 2007.. 37 Table 28: Total number of nursing professional, and nursing associate vacancies by salary, from April 2004 - March 2006………….. 38 Table 29: Short questionnaire survey results for Health Professionals vacancies (minor group level)…………………………………. 39

v
Table 30: Short questionnaire survey results for Midwifery and Nursing professionals vacancies (unit group level)…………………… 40 Table 31: In-depth questionnaire survey results for selected Midwifery and nursing professionals (unit group level)………………… 40 Table 32: New demand for nurses due to population growth……………... 41 Table 33: Total additional staff to be recruited by DoH……………………. 44 Table 34: Treatment roll-out in the province (adults)………………………. 45 Table 35: Nurses and midwives trained in sub-Saharan Africa working in OECD countries………………………………………………… 55 Table 36: Number of approved European work permits for South African Nurses…………………………………………………………… 56 Table 37: Requests for verification of qualification and transcripts of training by South African nurses residing in other countries (2001-2005)…………………………………………………….. 56 Figure 1: General distribution of nursing staff, 2007………………………... 15 Figure 2: Comparison between nurse and population distribution, 2006…. 18 Figure 3: Overall professional nursing output, 1996 – 2006……………….. 29 Figure 4: Nursing professional vacancies compared to total professional vacancies from April 2004 – March 2007 advertised in the Business Times newspaper…………………………………… 34 Figure 5: Vacancies for professional and associate nurses from April 04 – March 07, as advertised in the Business Times newspaper.. 35 Figure 6: Reasons for migration of health professionals in six countries, WHO Regional Office for Africa………………………………... 54
Graph 1.1: Gender distribution of nursing staff – occupational category….. 75 Graph 1.2: Distribution of nursing staff - occupational category……………. 75 Graph 2.1 Gender distribution of nursing staff - learner category………….. 75 Graph 2.2: Distribution of nursing staff – learner category………………….. 76 Graph 3: Racial distribution of nursing staff – occupational category……… 76 Graph 4: Age distribution of nursing staff – occupational category………… 76 Graph 5: Provincial distribution of nursing staff – occupational category….. 77

1
INTRODUCTION This study on nurses, forms part of a suite of studies commissioned by the Department of Labour (DoL) in an effort to more concretely define, identify and quantify scarce and critical skills in South Africa. The need arose because of an “increasing national clamour about ‘critically scarce skills’, ‘critical skills’, ‘scarce and critical skills’ and ‘priority skills’” (National Skills Authority (NSA), 2007: 1), further exacerbated by confusing and varied suggestions around the identification, estimation and successful ways to address these skills needs (NSA, 2007). Moreover, we are aware of the more recent, and constant discourse of ‘skills shortages’ in our labour market, and it is often difficult to ascertain whether these are purely perceived or cases in fact. Thus, the comprehensive study, encompassing investigations into 12 different occupations, is labeled, A multiple source identification and verification of scarce and critical skills in the South African labour market. The motivation by DoL to more adequately define, identify and quantify scarce and critical skills, links aptly with the specific objectives of the Scarce and Critical Skills briefing paper, of the National Skills Authority (NSA, 2007), in May this year, which identifies the need to consider the;
• national and sectoral suitability and applicability of current definitions for scarce and critical skills across the first and second economy,
• use-value and validity of scarce and critical skills lists at national, sectoral and provincial levels,
• value-add and use of the organizing framework of occupations (OFO), • identification, monitoring and forecasting of scarce and critical skills, and • on-going monitoring and reporting in respect of the data on scarce and
critical skills and the impact and success of initiatives to address these.
Such an investigation should be done in an effort to present possible ways forward to enhance the current definitions, identification and intervention strategies that are already in place to address scarce and critical skills (NSA, 2007).
Each case study uses a similar methodology consisting of 6 phases;
• quantitative occupational and sectoral profiling, to provide an overview of the current situation, as well as baseline information around the demand and supply of skills in South Africa,
• study of the specific occupation, to determine the structural arrangement that underpin the practice of the profession or occupation, as well as considering issues of supply and demand within the professional labour market,
• a survey of employers with vacancies, which involves in-depth interviews with experts and stakeholders in the relevant sector/occupation, education and training institutions, and professional bodies, to identify the skills needs in the sector,

2
• a survey of media signals on skills shortages, to review and analyse media reportage on these issues,
• documentary research, which will use secondary literature available on the sector/occupation (HSRC, StatsSA, SSP), to review and analyse relevant skills needs and economic development planning secondary data and literature,
• culminating in the compilation of a comprehensive verification synthesis report, where these different sources of information on the relevant occupation/profession is then triangulated, to ascertain whether there is in fact a scarcity/shortage of qualified and experienced people in respective categories. It will further also identify the gaps in research and suggestions for future research.
This particular report on nursing has seven parts; part one grapples with the difficulty in defining concepts such as scarce skills, critical skills, shortage of skills, absolute shortages and relative shortages, while also considering its impact on addressing and measuring skills needs. The second part investigates the different media and stakeholders asserting that there is a shortage of nurses. Part three looks to quantify and profile the existing nursing labour force. Part four and five will look at the supply and demand of nurses respectively. While part six and seven will consider the myriad of issues influencing supply and demand in the nursing profession, and conclude by auditing the existing programmes to address skills needs and offering suggestions on the way forward. 1. SCARCE SKILLS, CRITICAL SKILLS, ABSOLUTE AND RELATIVE SCARCITY– SAME DIFFERENCE? In order for us to concisely grapple with the various sources of information used to establish whether we are experiencing a shortage of nursing skills in South Africa, we need to discuss the different concepts within national and international ‘skills discourse’. This is not only important for, adequately defining scarcity, but also impacts on quantifying and measuring scarcity, and of course following from that, one’s ability to address scarcity. As the NSA briefing paper (2007:2) importantly notes, “accurate analysis of the extent and impact of the skills crisis as well as clear strategies to address the skills crisis is hampered by a number of inter-related problems, including:
• Defining, contextualizing and locating scarcity, • Measuring scarcity and • Addressing scarcity
Defining scarcity In the discussion of scarcity we have four main concepts; 1) scarce skills, 2) critical skills, 3) absolute scarcity and 4) relative scarcity. Scarce skills, refer to those occupations in which there are a scarcity of qualified and experienced people – current and anticipated (DoL framework for Identifying

3
and Monitoring Scarce Skills, 2006). This is usually measured by indicators, such as scarcity in certain occupations or qualifications, which is relatively easy to measure and communicate. A more comprehensive definition introduces two further qualifiers related to scarcity, identifying scarce skills as “the inability to find suitably qualified and experienced people to fill occupational vacancies either at an absolute level of scarcity or at a relative level of scarcity” (NSA, 2007: 4). Put simply, absolute scarcity is merely a situation where suitably skilled people are not available for a specific vacancy. In the Framework for Identifying and Monitoring Scarce Skills (quoted in Erasmus, 2006: 3), the DoL offer three possible reasons for situations of absolute scarcity:
• A new or emerging occupation, where there are few, if any, people in the country with the requisite skills.
• Firms, sectors and even the country are unable to implement planned growth strategies and experience productivity, service delivery and quality problems directly attributable to a lack of skilled people.
• Illustrated through replacement demand, where there are no people enrolled or engaged in the process of acquiring skills that need to be replaced.
Relative scarcity on the other hand, exists when people suitably skilled for the vacancy is available, but do not meet other employment criteria. Factors which can result in relative scarcity are, for example:
• Geographical location, i.e. people are unwilling or unable to work outside of urban or rural areas,
• Equity considerations, i.e. there are few if any candidates with the requisite skills from designated groups available to meet the skills requirements of firms and enterprises,
• Recruitment and retention difficulties, where there is an adequate supply of people with the necessary skills required by the labour market, but they are not willing to take up employment at current levels of remuneration and conditions of employment (New Zealand Department of Labour NZDoL, 2006).
• Replacement demand, if there are people in education and training who are in the process of acquiring the necessary skills but the lead time means that they are not available to meet immediate short term replacement demand.
The distinction between absolute and relative scarcity is important as it impacts on the verification of perceived skilled shortages, and then by extension the programmes put in place to ameliorate these shortages.

4
According to the NSA briefing paper, critical skills refer “to the lack of ability of people to perform to the level of occupational competence required, because of gaps in their skills profiles” (NSA, 2007: 4). These skills can include things like literacy, numeracy, general management skills, communication and customer handling skills, teamwork, etc. Daniels (2007:2) also note some of these skills, when identifying two groups of critical skills within the South African context: “1) generic skills, including problem solving and learning to learn; language, literacy or numeracy skills; and working in teams for example; [and] 2) particular occupational skills required for performance within that occupation”. It is evident that, different to the indicators associated with establishing scarcity, these are more difficult to establish, and therefore it is more difficult to measure the absence or presence of critical skills. Even though this study will concern itself more with establishing whether there is in fact a shortage of nurses, and how this shortage is experienced at the different occupational levels, it is important to understand the concept of critical skills, as it increasingly informs the way in which nurses are trained in SA today. It is mentioned by many stakeholders in the education and training environment, as an essential part of nursing training and contributes to effective and efficient practice. This is especially true in the current public nursing practice environment, where individuals have to creatively manage and deal with various resource constraints. The above discussion explains why skills shortage is not an easily definable term, “an amorphous concept that encapsulates many specific components…” (Daniels, 2007:1). In the Concise Oxford Dictionary (2001:1326), shortage is given as a “state or situation in which something needed cannot be obtained in sufficient amounts”. The term labour shortage more specifically, as it is used in economics, refers to an economic condition in which there are insufficient qualified candidates (employees) to fill the market-place demands for employment at any price. To put it quite simply then, nursing shortage can be viewed as a situation where the demand for nurses outstrips the supply of nurses for various, and sometimes interrelated reasons.
Measuring scarcity In an effort to measure scarcity we will consider some of the following indicators commonly used to determine labour shortages; 1) self-reported shortage status, 2) Registered Nurse (RN) supply per 100 000 population, 3) vacancy rates, 4) strong employment growth, 5) wages, 6) turnover rates and 7) unemployment rate (Cohen, 1998, Veneri, 1999, Grumbach, Ash, Seago & Coffman, 2001 in Pindus, Tilly & Weinstein, 2002). With specific reference to establishing shortages in the nursing profession, Pindus et al (2002: i) adds; “the difficulties in recruiting and retaining nursing staff is also a strong indicator of shortage in a profession”.
5
There are certain data limitations within this study, which makes it impossible for us to utilize all the above indicators to establish shortage. As noted by Wilson, Woolard & Lee (2004: 4) “current work in this area is still; very much constrained by data limitations“. Let us however, within the context of our study, consider each indicator, and assess its usability and relevance: • Self-reported shortage status: We will be using this indicator by surveying and
illustrating various stakeholders’ key insights into the status of nursing profession, and discuss their assertions around whether there is a shortage of nursing labour in SA.
• RN supply per 100 000 population: Because we are utilizing data from a variety of sources, and have to triangulate these; in some instance we will use nurses per 1 000 population, and in others, nurses per 100 000 population. However, while presenting these different measures, in the sections discussing them, we will calculate to make these equivalent and comparable.
• Vacancy rates: An analysis of DoL’s job vacancy database, captured by their Labour Market Information and Statistics (LMIS) unit, from the Sunday Times Career supplement, analysed on a quarterly basis, as well as a survey of employers who have recently advertised vacancies in the Sunday Times. The complete study results are reported and analysed comprehensively in Erasmus (2007). When we discuss vacancies later in the demand section, we will elaborate on the methodology used, and relate the results relevant to the nursing profession.
• Strong employment growth: We will be using the relevant Sector Skills Plan (SSP) report to illustrate expected growth rates.
• Wages: Some data on wages is available, through the examination of advertisements in the Business Times newspaper. Unfortunately in the middle of the 3 year period, the data on wages was no longer captured, and therefore the most reliable data is that of 2005. We will use this as an indication of the likely situation in the current working environment, but this should not at all be viewed as a total account of the current situation in the SA healthcare system.
• Turnover rates: We have no data at our disposal currently to establish turnover rates.
• Unemployment rate: This indicator is difficult to establish. The Health Systems Trust (HST) does provide data that indicate the percentage of professional nurse posts vacant in the public sector, which suggests underemployment, rather than unemployment.
• Difficulties in recruitment and retainment: We will discuss these factors, but will not be able to quantify this indicator, and will only use these in the qualitative section of this report, when we discuss perceived nursing shortage.
Also, even though we have access to some data sets, which we can use to establish many of the above indicators, there are also limitations associated with their use. With regards to the October Household Survey (OHS) and Labour Force Survey (LFS), Wilson, Woolard and Lee (2004) asserts that even though these data sets provide better coverage of sectors and employment, they have a small sample size, and are also not directly comparable. This is because “the

6
LFS has a more in-depth approach to determining employment figures compared to the OHS, [and therefore] OHS total employment figures should not be compared directly with the LFS figures“(Wilson et al, 2004: 25). Further, LFS data is also incomplete for certain years, or certain occupations. SETA data on the other hand, while recognizing that they provide some useful insights; “inevitably tend to be partial, focusing on the areas of concern to a particular SETA” (Wilson et al, 2004:14). So while we use these data sets as the best available data, their limitations should be kept in mind during analysis. Programmes used to address scarcity The importance of adequately defining and measuring skills shortages becomes clear when government has to choose or develop programmes to address these shortages. For example according to Erasmus (2006:3)/ DoL: “with regard to genuine skills shortages or absolute scarcity, supply side policy responses might include increases in education and training levels and adjustments to skilled migration targets and policies. As there is a lag of at least three to four years between the start of new training and any addition to supply, immigration responses need to take precedence in the short term. Demand side measures to address some of the issues associated with recruitment and retention or relative scarcity include increasing pay scales or providing incentives e.g. to work in rural areas” Now that we have illustrated the importance of having a consistent and widely understood definition of scarcity, adequate ways to measure these perceived instances of scarcity, and then appropriate programmes developed to address scarcity in its different forms, let us consider whether the nursing profession is indeed experiencing a shortage of personnel. 2. WHO SAYS THERE IS A SHORTAGE? The shortage of health workforce is an international phenomenon (Dal Poz, Quain, O’Neil, McCaffery, Elzinga & Martineau, 2006, WHO, 2006a, Simoens, Villeneuve & Hurst, 2005). The sources quoting a nursing shortage in SA are abundant and varied (McGrath & McGrath, 2004, Hall & Erasmus, 2003, Woolard, Kneebone & Lee, 2003, Mail & Guardian, 16 August 2006, News 24, 24 May 2007), next follow more recent assertions of stakeholders in and involved in the field. Individuals/stakeholders in the nursing profession The two most important role players in the South African nursing profession are, of course, the South African Nursing Council (SANC), and the Democratic Nursing Organisation of South Africa (DENOSA). The former was established to be an autonomous, financially independent, statutory body with the responsibilities to set and maintain standards of nursing education and practice in the Republic of South Africa (SANC, 2007). The latter, is a voluntary

7
organization representing the interests of nurses and nursing in South Africa. It has one encompassing aim to; protect, promote, develop, empower and support nurses and midwives/accouters, by means of a member driven pro-active approach, using all relevant legal mechanisms to address the members needs (DENOSA, 2007). The SANC does identify a shortage of nurses in South Africa, but simultaneously tries to present a positive picture by noting past gains. Thus it asserts, “although there may still be a shortage of qualified nurses in RSA, the positive side to this overall picture is that the growth in nursing figures is now approaching that of the population of South Africa” (SANC, 30 October 2007). DENOSA, also asserts that there is a shortage of nurses, stating that South Africa is “not producing/training sufficient nurses to deal with its health needs” (DENOSA, 24 October 2007), and further points out that this directly impacts on the ability of the health sector to deliver an efficient service. It is not only organizations that allude to a shortage of health personnel generally and nurses more specifically, but other influential individuals within the nursing profession as well. For instance, at the Nursing Summit on the 29th of November 2004, the Free State MEC for Health, Mr. Sakhiwo Belot, clearly indicated that one of the challenges confronting our health sector at this juncture in history relates to the shortage of personnel. He confirms the statements by personnel and management within the health care sector, that all assert “… we are still battling with the issue of sufficient personnel in our institutions… leav[ing] a burden on the shoulders of those who have to work at a double to try and ensure that the work is done”. More specific to nurses, he advocates the need for nursing managers to play a strategic leadership role, in collaboration with other managers and nurses themselves, to address these kinds of challenges. Further, the Member of Executive Committee (MEC) for health in Gauteng Province, Brian Hlongwa stated that the combined shortage of nurses and doctors compels us to revisit our training priorities and strategies (Benjamin, 2006). Clearly identifying a shortage of health personnel, he stated that we need to determine which categories of nurses need to be prioritized to ensure that there are enough qualified auxiliary, enrolled professional and specialist nurses available to meet the increased demand for quality patient care. Another individual previously prominently involved in the nursing profession, is Ms. Hasina Subedar, former registrar of the SANC. In her chapter on the nursing profession in the Health Systems Trust (HST) annual South African Health Review (SAHR), Subedar asserts that possible nursing shortages exist. She notes that “the overall production of nurses in SA over the past nine years (1996 – 2004) is of major concern and is not even keeping up with the increase in population growth let alone providing the health system with additional nurses to cope with new demands and the effects of the HIV epidemic…. Given the need for nurses in the SA health system, these losses represent an unsustainable

8
situation and will significantly affect the implementation of Primary Health Care, which is dependent on the professional nurse” (2005: 100). This view is inconsistent with the current perspective advocated by the SANC, which asserts that our gains in nurses have been quite satisfactory over the past few years. One has to keep in mind though, that Subedar’s analysis was only up till 2004, and the SANC takes into account more recent figures. Even though clearly identifying shortages of nurses in general, as well as particular shortages at the professional nurse level in the South African health care system, she carefully states that it is however, “very difficult to quantify if there is a shortage or not…the only way you can define if there is a shortage is if the health services identify what is their need” (Subedar personal interview, November 2006). Her last statement points to the importance for the Human Resources for Health (HRH) Plan to identify specific areas of skills needs, so that the nursing education and training institutions have a better platform from which to try and respond more effectively to these skills needs. Skills legislation/policy reports for the nursing profession To give an indication of the international health workforce skills needs, and compare South Africa to the international situation, let us first consider the World Health report of 2006, which notes a chronic global shortage of well-trained health workers. It further, and more specifically, “estimates a shortage of more than 4 million doctors, nurses, midwives and others” (WHO, 2006: 11). This report relies on the Joint Learning Initiative (JLI) global assessment of shortfall, which states that countries with fewer than 2,5 health care professionals (counting only doctors, nurses and midwives) per 1000 population will fail to reach the minimum desired level of 80 per cent health services coverage rate. There are 57 countries that fall below this threshold and are defined as having a critical shortage. Shockingly “thirty-six of them are in sub-Saharan Africa” (WHO report, 2006: 12). A closer examination of the map however, indicates that SA is not part of the countries within Sub-Saharan Africa defined as experiencing a critical shortage of health care professionals based on the WHO indicator. Very importantly, in the analysis of these figures, the report further advocates that shortages should not be evaluated monolithically, and assertions around sufficiency should be based on needs in particular areas. Thus, in the South African case where the public/private and rural/urban divides are sometimes very pronounced, we should not only be investigating whether areas are faced with shortages in absolute numbers of nurses, but we should be very aware of the possible mal/distribution of different nursing categories, which results in specific nursing skills shortages in certain areas. Now that we have a sense of the health worker shortages in Sub-Saharan Africa, to give a sense of the picture in South Africa, The National Skills Authority – Briefing Paper identifies general skills needs in the South African labour market. It asserts “the count of scarce skills still leaves the country facing an estimated

9
occupational scarcity of around half a million people” (NSA, 2007: 2). Importantly, it also warns us from accepting all reports of labour shortages in various professions, as there is “increasing concern that employers and SETAs are inadvertently identifying skills needs with scarcity because of the increased national focus and levels of incentives on scarce skills” (NSA, 2007: 2). The National Scarce Skills List (ASGISA aligned, 2006) of the Department of Labour (DoL), more concretely specifies a need for Registered Nurses and Primary Health Care Nurses, as scarce skills. These individuals have as their role to “provide nursing care for patients in hospitals, nursing homes, extended care facilities, other health care facilities, and in the community”. Quantifying the need in these occupations, the DoL, Master list of scarce and critical skills, (8 August 2006), list a shortage of 10 250 Registered Nurses, as well as 4 120 Primary health care nurses, thus advocating a total need of 14 370 nurses. Another important report influencing the discourse around shortages in the health sector in South Africa, as well as trying to quantify the needs in the sector, is the Department of Health (DoH), National Human Resources for Health Planning Framework 2006. This report clearly identifies a shortage of health personnel in the public and private sectors as key challenges for the South African health sector. It further alludes to the inequitable distribution between urban and rural areas, as important in considering skills shortages. The report proposes a national production of 21 000 nurses by 2011 (3 000 professional nurses, 8 000 enrolled nurses and 10 000 enrolled nursing assistants) to address current needs in the profession. See table 1 below. It specifically mentions migration of healthcare workers as an important factor influencing the need for greater increases in production. Table 1: Target for human resources for health production Nursing Category
Duration of Training
Location of Training Current yearly National Production
Proposed Annual National Production
Professional nurses
4 years University, Technikon & College
1896 3000 by 2011
Current production levels are relatively low taking into consideration the health service needs, especially at Primary Health Care level. Massive production is strongly indicated in this area, also in order to assist in countering the impact of migration. Enrolled Nurse 2 years College of nursing and
private nursing schools 5000 8000 by 2008
Enrolled nursing Auxiliaries
1 year College of nursing and private nursing schools
6600 10000 by 2008
This category in terms of revised scopes of nursing must be trained in large numbers to enable appropriate deployment and placement of nursing professionals in general. This must also be in terms of the revised qualifications framework for nursing. Source: Department of Health (DoH) (2006) These are the national propositions for production, based on current yearly production, to counteract the impact of migration, and to try and address skills needs to allow for deployment and placement of nursing professionals in general.

10
What this plan does not seem to overtly take into account is the impact of HIV/AIDS, and its associated treatment and management needs. The latest HIV/AIDS plan on the other hand, does not extensively consider HR needs. When one evaluates the Operational plan for Comprehensive HIV and AIDS care, management and treatment for South Africa, it indicates “significant shortages of professional nurses, medical officers, lay counsellors, and managerial/administrative personnel” (2003: 103). It estimates that for the effective care, treatment and management of HIV/AIDS alone, a total of 13 805 additional healthcare staff should be recruited by March 2008, to support the implementation of the plan. Of this total 1 883 should be professional nurses, 1 255 should be enrolled nurses, and 1 255 should be assistant nurses. According to this plan then, an additional 4 393 nurses are needed to manage HIV/AIDS in our healthcare system. These staffing estimates are calculated using the estimated number of persons with HIV and AIDS, and the model presents recruitment needs based on the assumption that all ARV-related treatment represents an additional workload for health professionals. According to the Health and Welfare Sector Education and Training Authority (HWSETA) Draft Sector Skills Plan 2005 – 2009, “when forecasting medical skills for the future, there are significant gaps… apparent for both doctors and nurses, particularly in the public sector” (HWSETA SSP, 2006: 58). It further asserts that “human resource development of the sector has been characterized by a shortage and maldistribution of appropriately trained health and social development workers caused by attrition; a shortfall in the production of adequately qualified and experienced workforce; new demands emerging from new legislation or strategies; and a tendency for the sector to focus training efforts on the higher-level, internationally recognized cadres” (HWSETA SSP, 2006: 25). Moreover demand for these professionals outstrips supply in light of emigration, demand and changing market conditions. A total of 3 480 nursing skills are prioritized as scarce, especially at NQF levels 4 and 5 (SSP, 2006: 60), thus falling into the EN and ENA nursing categories. Hall & Erasmus (2003) is consistently used as a source for the quantification of nursing supply and demand, and then also to forecast future nursing demand and supply in the HWSETA SSP of 2006. They estimated an overall gap between the supply and demand for nurses at 20 815 (a figure consistent with the 21 000 target in HRH Plan of the DoH). The Médecins Sans Frontières (MSF) report; Confronting the health care worker crisis, clearly echo the dire need of health human resources in South Africa, and agrees with the HWSETA SSP that the shortage of nurses is more acute in the public sector. It asserts that the overall supply of health care workers is not the problem, but “unequal distribution between the private and public sectors and between urban and rural areas…” (MSF, 2007: 8), as has been mentioned before.

11
Related more to the general skills needs in South Africa, is the DoE Strategic Plan 2007 – 2011 and HRD Strategy for SA. It commits itself to addressing skills shortages by specifically leading the implementation of the National Human Resources Development Strategy (NHRDS) and the revision of the National Qualifications Framework (NQF). It might not be the specific ambit of this strategy to comprehensively outline how human resources for health (HRH) care needs to be addressed, but it does strike one as a glaring lack in the report. This is concerning, as the strategy clearly indicates the major impact of HIV/AIDS on our population and workforce, without considering the importance of skilling human resources to address this epidemic. The Health Sector Strategic Framework identifies the improvement of human resource development and management as one of the key strategic health priorities, and therefore indicated the development of the HRH Plan for the health sector as a matter of urgency. It does allude to shortages in the SA health sector, and identifies that there are certain gaps in the current levels of human resources. In sum, many of the individuals and stakeholders within the nursing profession claim a shortage, but are very tentative and careful in quantifying these. The policy reports and legislation that do attempt to quantify these perceived shortages, present very different views; • The National Skills Authority (NSA) (2007) overall states that the country is
facing an estimated occupational scarcity of around half a million people. • The WHO World Health Report (2006) estimates a shortage of more than 4
million doctors, nurses, midwives and others, alone. • The Master list of scarce and critical skills (2006) list a shortage of 10 250
Registered Nurses, as well as 4 120 Primary health care nurses. • The HRH Plan (2006) proposes the need for a national production of 21 000
nurses by 2011. • Hall & Erasmus (2003), estimated a gap of 20 815 nurses for 2009. • The HIV/AIDS Plan (2003) estimates that a total of 13 805 additional healthcare
staff should be recruited by March 2008, of which 1 883 should be professional nurses, 1 255 enrolled nurses, and 1 255 should be assistant nurses.
• The HWSETA SSP (2006) state that nursing skills are scarce, especially at NQF levels 4 and 5, and the total number of nursing skills defined as scarce is 3 480 nursing professionals.
Now that we have looked at the various sources claiming, general-, health sector- and nursing specific skills needs and shortages in South Africa, let us examine our existing nursing labour force, compare this to the healthcare situations in other countries, and relate it back to the specific healthcare needs in our country to establish our own assertions around whether we have a nursing shortage or not. What the above section highlights, is the great variance in the perception of nursing shortages as well as its quantification.

12
3. EXISTING NURSING LABOUR FORCE It is necessary to first discuss the main types of nurses, so that one can adequately understand and interpret the tables presented. These are the categories of nurses: Already qualified • A professional nurse (PN) or registered nurse (RN) and sometimes called a
sister, which is an individual who has completed a four year programme at university or a nursing College. This person is educated and competent to practice comprehensive nursing and midwifery (Subedar, 2005).
• An enrolled nurse (EN) or sometimes called a staff nurse, which is an individual who has completed a two year programme, usually at a nursing college or exited after completing two years of the university four year programme. This person is educated and competent to practice basic nursing (Subedar, 2005).
• An enrolled nursing auxiliary (ENA) or sometimes called an assistant nurse (AN), which is an individual who has completed a year programme or a similar course at college, or exited after completing the first year of the university four year programme. This person is educated and competent to practice elementary nursing (Subedar, 2005)
In training • A student nurse, who is in the process of training either on a four year nursing
programme at Nursing College or University. • A pupil nurse, which is an individual on a two year nursing programme at a
public or private nursing institution. • Lastly, there is a pupil auxiliary, which is an individual on one year or similar
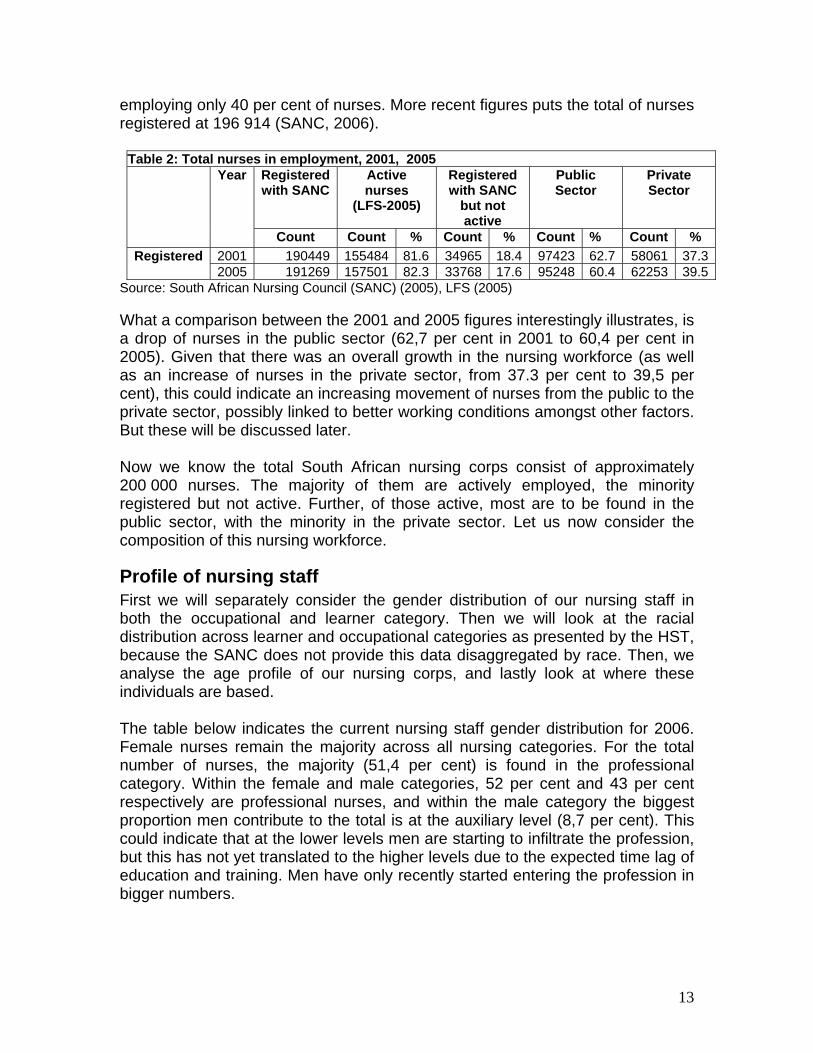
nursing course at a public or private nursing institution. We will be using a combination of sources to quantify the existing nursing labour force as it is our mandate to identify, verify and triangulate available data on nursing in South Africa. SANC, StatsSA and HST data is used as the best possible available data on nurses in the public and private sectors. We thus propose the following estimations of the total number of nurses in South Africa. 2006 data on nurses registered with the SANC is available, but we do not have the same for LFS. In order to present a more accurate and comparable set of data indicators, we have opted to use only the 2005 figures. Moreover, especially proportional representations change quite slowly over time, and the 2005 figure would still give quite a reliable indication of the present situation. Thus table 2 indicates that in 2005 South Africa had a total of 191 269 nurses, of those registered with the SANC, only 82,3 per cent are active/in employment, leaving 17,6 per cent inactive. Further, the public/private divide is in favour of the public sector which employs 60 per cent of nurses, and the private sector
13
employing only 40 per cent of nurses. More recent figures puts the total of nurses registered at 196 914 (SANC, 2006). TTable 2: Total nurses in employment, 2001, 2005
Registered with SANC
Active nurses
(LFS-2005)
Registered with SANC
but not active
Public Sector
Private Sector
Year
Count Count % Count % Count % Count % 2001 190449 155484 81.6 34965 18.4 97423 62.7 58061 37.3Registered 2005 191269 157501 82.3 33768 17.6 95248 60.4 62253 39.5
Source: South African Nursing Council (SANC) (2005), LFS (2005) What a comparison between the 2001 and 2005 figures interestingly illustrates, is a drop of nurses in the public sector (62,7 per cent in 2001 to 60,4 per cent in 2005). Given that there was an overall growth in the nursing workforce (as well as an increase of nurses in the private sector, from 37.3 per cent to 39,5 per cent), this could indicate an increasing movement of nurses from the public to the private sector, possibly linked to better working conditions amongst other factors. But these will be discussed later. Now we know the total South African nursing corps consist of approximately 200 000 nurses. The majority of them are actively employed, the minority registered but not active. Further, of those active, most are to be found in the public sector, with the minority in the private sector. Let us now consider the composition of this nursing workforce.
Profile of nursing staff First we will separately consider the gender distribution of our nursing staff in both the occupational and learner category. Then we will look at the racial distribution across learner and occupational categories as presented by the HST, because the SANC does not provide this data disaggregated by race. Then, we analyse the age profile of our nursing corps, and lastly look at where these individuals are based. The table below indicates the current nursing staff gender distribution for 2006. Female nurses remain the majority across all nursing categories. For the total number of nurses, the majority (51,4 per cent) is found in the professional category. Within the female and male categories, 52 per cent and 43 per cent respectively are professional nurses, and within the male category the biggest proportion men contribute to the total is at the auxiliary level (8,7 per cent). This could indicate that at the lower levels men are starting to infiltrate the profession, but this has not yet translated to the higher levels due to the expected time lag of education and training. Men have only recently started entering the profession in bigger numbers.

14
Table 3: Gender distribution of nursing staff by occupational category, 2006 Female Male Total Nursing
category Count % Count % Count % Professional 95336 94.1 5959 5.8 101295 100Enrolled 36347 92.4 2958 7.5 39305 100Auxiliaries 51402 91.2 4912 8.7 56314 100Total 183085 92.9 13829 7.0 196914 100Source: SANC (2007) In table 4 we examine the gender distributions in the learner category. Similar to the trends in the professional category, females remain the majority of all categories of student nurses, although at lower proportions. The majority of learners are found in the student category (44,9 per cent of females, and 61,4 per cent of males). The lowest proportion of learners (22 per cent overall) fall in the pupil auxiliary category (23 per cent of females and 17,1 per cent of males). The highest female proportional representation is at pupil auxiliary level (87,8 per cent of total pupil auxiliaries), and the lowest at student level, where they comprise 79,7 per cent of the total. This information suggests that gender transformation of the nursing profession is starting slowly at the learner level, with male students starting to comprise bigger proportions in comparison to the distributions at professional level.
Table 4: Gender distribution of nursing staff, learner category, 2006 Female Male Total Learner category
Count % Count % Count % Students 10587 79.7 2685 20.2 13272 100Pupils 7549 88.9 934 11.0 8483 100Pupil Auxiliaries 5418 87.8 751 12.1 6169 100Total 23554 84.3 4370 15.6 27924 100
Source: SANC (2007) When we look at race, let us keep in mind that HST has classified the categories somewhat differently, and have not separated the occupational and learner categories, as has the SANC data. We nevertheless, find the following. African students remain the majority throughout all nursing categories, and they form the highest proportion in the student category (89,7 per cent). They are followed by Coloured students, who have the second highest proportional representations, also across all categories. The lowest proportional representations are found in the White and Indian groups, who consistently prove to be in the minority across all categories, with Whites representing slightly better than Indians. Interestingly if we look at trends within certain racial groupings, we see that more than half of White and Indian nursing staff, are in the professional category (57,5 per cent and 51,9 per cent respectively).

15
Table 5: Racial distribution of nursing staff by occupational category, and percentages, 2007 Number Professionals Enrolled Auxiliaries Students Total
African 36807 18152 27628 8673 91260Coloured 4520 2231 4218 378 11347Indian 1092 420 303 288 2103White 2683 576 1070 332 4661Total 45102 21379 33219 9671 109371*Percentages Professionals Enrolled Auxiliaries Students Total African 81.6 84.9 83.2 89.7 83.4Coloured 10.0 10.4 12.7 3.9 10.4Indian 2.4 2.0 0.9 3.0 1.9White 5.9 2.7 3.2 3.4 4.3Total 100.0 100.0 100.0 100.0 100.0
Source: HST (2007) *Note: This figure for public sector nurses will differ from the public sector figure offered in table 2. The Health Systems Trust (HST) figure for public sector nurses includes student nurse data, and thus will illustrate a significant inflation on the public/private proportional distribution of nurses. To get a more accurate picture, one would subtract the 9 671 from the total, leaving us with 99 700 (2007) public sector nurses, which would be much more in line with the 95 248 (2005). Across all the racial groupings, the majority of nursing staff were found in the professional category (41,2 per cent), followed by nursing auxiliaries (30,3 per cent), enrolled nurses (19,5 per cent), and lastly student nurses (8,8 per cent). See graph below. Figure 1: General distribution of nursing staff, 2007
Professionals41.2%
Enrolled19.5%
Auxiliaries30.4%
Students8.8%
Source: SANC (2007) What is more important, in terms of establishing whether we have a shortage of nurses, is to examine the age profile of our nursing corps. This will indicate whether we have a present problem or an impending nursing crisis. According to the SANC 2006 data presented below, across all nursing categories, our highest concentration of nurses are between 40 – 49, amounting to 32,8 per cent of our nurses. The most worrying is that our <25 nurses only comprise 1,3 per cent of

16
our total workforce, illustrating the small number of young nurses entering the profession, effectively turning nursing into an aging workforce. As asserted in the DoL Framework for Identifying and Monitoring Scarce Skills (2006), this could indicate a situation of absolute scarcity, where replacement demand cannot be met due to the fact that there are no people enrolled or engaged in the process of acquiring skills that need to be replaced. What is further alarming, is that these nurses are entering and practising the profession mostly at auxiliary level. One could expect this at the <25 level, as we could argue these might be individuals still in the process of qualifying as a PN, but this trend persists in the 25 – 29, and 30 – 34 age groups. The DoL identifies a second indicator of absolute scarcity to be a lack of skilled people at certain skills levels. If most of our professional nurses are nearing retirement age and presumably will leave the profession soon, and the nurses now entering and practising the profession are doing so mostly at the lower categories of nursing, this might indicate a future shortage of Professional nurses. Table 6: Age distribution of nursing staff by occupational category, in percentages 2006
Registered Enrolled Auxiliary Total Age Group Count % Count % Count % Count %
<25 63 0.06 782 1.9 1754 3.1 2599 1.325-29 3090 3.0 4215 10.7 7694 13.6 14999 7.630-34 9298 9.1 5137 13 8274 14.6 22709 11.535-39 13810 13.5 6189 15 7909 14 27908 14.140-44 17348 17.0 6949 17.6 7751 13.7 32048 16.245-49 18953 18.6 6221 15.8 7592 13.4 32766 16.650-54 15071 14.7 4674 11.8 6003 10.6 25748 13.055-59 10299 10.1 2573 6.5 4241 7.5 17113 8.760-64 7225 7 1329 3.3 2521 4.4 11075 5.665-69 3765 3.6 589 1.4 817 1.4 5171 2.6>69 1888 1.8 183 0.4 214 0.3 2285 1.2Not Reported 1032 1.0 508 1.2 1556 2.7 3096 1.6Total 101842 100 39349 100 56326 100 197517* 100.0
Source: SANC (2007) *Note: The age distribution statistics include nurses who are resident outside the RSA. For this reason, totals may be slightly more that other statistics that apply to nurses resident in the RSA only. Before looking at the regional distributions of our nursing corps let us consider acceptable benchmarks in health care provision. While the NHR Plan of 2006 does not specify an optimum ratio of RN/PNs to ENs, the NHR Plan Task Team report for DoH (2004), cited in Subedar 2005, specified a ratio of 1:2 RN/PN:EN. Pretorius et al. (1997) cited in Hall and Erasmus (2003) identify the desired RN/PN:EN ratio for hospitals to be 1 : 3. The SANC registers show a ratio that is nearly the reverse: 2.7:1 RN/PN:EN in 2005 overall and 2.1:1 RN/PN:EN in the private sector.

17
Subedar (2005) estimated that in order for SA to obtain the ratio recommended in DoH (2004) the number of enrolled nurses would have to increase nearly six fold. However, as we showed earlier in this chapter when presenting the estimates of shortage by various stakeholders, there is no consensus as to whether we indeed we need this many enrolled nurses or whether we need more professionals nurses.
Table 7: Occupational distribution of nursing staff, 2005
SANC register, 2005 Public health sector employment, 2005
Nursing category
Count % Count %
Percentage of nurses who are
employed in the public
health sector Professional 99534 52.04 43660 45.84 43.86Enrolled 37085 19.39 20582 21.61 55.50Auxiliaries 54650 28.57 31006 32.55 56.74Total 191269 100 95248 100 49.79
Source: SANC (2005), HST (2005) When we look at where these nurses are situated, we are presented with the following picture. It appears that the majority of our nurses can be found in Gauteng, and the minority in the Northern Cape. But absolute figures are not adequate to establish sufficiency. When we look at population per qualified nurse ratios, we see that Gauteng indeed has the most favourable nurse/population ratio (177:1), followed by the Western Cape (184:1), and then Kwazulu – Natal (219:1). The three provinces with the worst nurse/population ratios are; Mpumalanga (349:1), Eastern Cape (346:1) and Limpopo (330:1). Table 8: Nurse per population by province, 2006
Population Nurses
Population per qualified nurse
ratios Provinces Num % Num %
Eastern Cape 7051500 14.9 20381 10.4 346:1 Free State 2958800 6.2 11467 5.8 258:1 Gauteng 9211200 19.4 51997 26.4 177:1 KwaZulu Natal 9731800 20.5 44349 22.5 219:1 Limpopo 5670800 12.0 17173 8.7 330:1 Mpumalanga 3252500 6.9 9310 4.7 349:1 North West 3858200 8.1 13010 6.6 297:1 Northern Cape 910500 1.9 3376 1.7 270:1 Western Cape 4745500 10.0 25851 13.1 184:1 Total 47390800 100.0 196914 100.0 241:1
Source: SANC (2007) Note: These figures exclude nurses in training (Students, Pupils and Pupil N/A) To further illustrate the disparities between provinces, let us consider population distribution with nurse distribution (See figure below). It then becomes evident that Kwazulu-Natal, Gauteng and the Western Cape, possess more nurses than

18
the proportion they comprise of the population. The Free State and the Northern Cape have roughly the same population proportional representation as their nurses comprise of the total nursing population. Eastern Cape, Limpopo, North West and Mpumalanga, are all in a desperate situation where they have an under representation of nurses compared to their proportion of the population. This indicates that a favourable nurse population ratio, is not always desirable, as it might not be justified by the proportion of population those nurses are serving. Figure 2: Comparison between nurse and population distribution, 2006
20.5
19.4
14.9
12.0
10.0
8.1
6.9
6.2
1.9
22.5
26.4
10.4
8.7
13.1
6.6
4.7
5.8
1.7
0 5 10 15 20 25 30
KwaZulu Natal
Gauteng
Eastern Cape
Limpopo
Western Cape
North West
Mpumalanga
Free State
Northern Cape
%
NursesPopulation
Source: SANC (2007) Table 9 disaggregates the information even further illustrating the big discrepancies not only between provinces, but also their registered nurse, enrolled nurse, and auxiliary ratios. This indicates that even though some provinces have a favourable overall nurse population ratio, when we look deeper, many are experiencing needs at enrolled and auxiliary level. Table 9: Population per qualified nurse in the same province, 2006
Province Registered Enrolled Auxiliaries Total Limpopo 732:1 1990:1 862:1 330:1North West 583:1 1808:1 907:1 297:1Mpumalanga 662:1 1915:1 1206:1 349:1Gauteng 343:1 962:1 593:1 177:1Free State 415:1 2113:1 1005:1 258:1KwaZulu Natal 482:1 698:1 953:1 219:1Northern Cape 463:1 1905:1 977:1 270:1Western Cape 354:1 1045:1 601:1 184:1Eastern Cape 567:1 2622:1 1339:1 346:1Total 468:1 1206:1 842:1 241:1Source: SANC, 2006 Note: Population figures – StatsSA (mid year estimates)

19
(All population figures have been rounded off to the nearest 100.) Refer to appendix (graphs 1 – 5) for a series of charts to provide an overview of important demographic indicators. To sum up South African nurses are primarily, female and PNs in the occupational category. Further in the learner category, they are also found to be primarily female and in the student nurse category. The majority of these two categories are between the ages of 40 – 49. Those in employment are primarily black, and concentrated in Gauteng. Now that we have a sense of the profile of our nursing corps, and we have highlighted the inequalities in distribution by illustrating the provincial distributions, let us briefly consider the added disparities brought about by the nursing distribution between the public and private sectors. Public/Private divide As noted by Breier (2007), it is very difficult to categorically state how many health care workers are active in the public and private sectors, but as attempted in table one, we do have a sense of the proportional distribution. To get an indication of the extent of the disparities in healthcare service delivery, we will use the latest figures for public sector nurses, as estimated in table one. We will compare these figures with the Council on Medical Schemes data, stating the amount of medical scheme beneficiaries. Following the method used by Breier & Wildschut (2006) to give some indication of the number of people supported by private sector nurses, we assume that most of the medical scheme members make use of the private service. Using 2005 figures as the latest available comparable year, given that the population for 2005 was around 46,8 million (StatsSA, 2005), this means that 15 per cent of the population is served by approximately 40 per cent of nurses. Stated differently, in the public service, about 85 per cent of the population is served by 60 per cent of nurses. Although this seems a worrisome situation, the public private divide for medical doctors is much more extreme (refer to doctors report). Table 10: Private sector nurses compared to private sector beneficiaries
Nurses in Private sector Medical aid beneficiaries
Year Total
Population Count % Count % of population 2001 44328322 58061 37.3 7 025 262 15.84 2005 46888200 62253 39.5 6 835 621 14.58 Source: HST (2007), SANC (2007), StatsSA (mid-year estimates population figures) What this table also indicates is a decline in medical aid beneficiaries during the period. This is indeed a matter of concern, if we relate it back to the observed trend of nurses moving more to the private service, where they are then serving less and less of the population. We are not however, able to state whether this trend continues at present, as we do not have LFS data to estimate the amount of nurses in the private sector as at 2007.
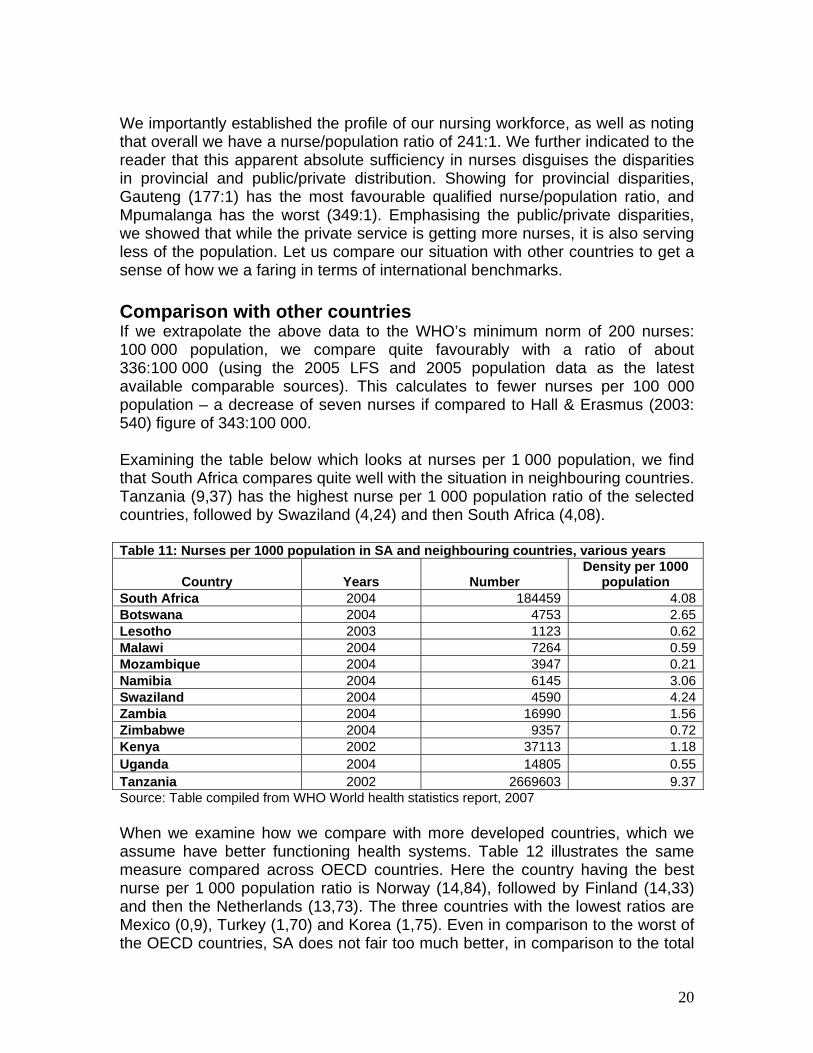
20
We importantly established the profile of our nursing workforce, as well as noting that overall we have a nurse/population ratio of 241:1. We further indicated to the reader that this apparent absolute sufficiency in nurses disguises the disparities in provincial and public/private distribution. Showing for provincial disparities, Gauteng (177:1) has the most favourable qualified nurse/population ratio, and Mpumalanga has the worst (349:1). Emphasising the public/private disparities, we showed that while the private service is getting more nurses, it is also serving less of the population. Let us compare our situation with other countries to get a sense of how we a faring in terms of international benchmarks. Comparison with other countries If we extrapolate the above data to the WHO’s minimum norm of 200 nurses: 100 000 population, we compare quite favourably with a ratio of about 336:100 000 (using the 2005 LFS and 2005 population data as the latest available comparable sources). This calculates to fewer nurses per 100 000 population – a decrease of seven nurses if compared to Hall & Erasmus (2003: 540) figure of 343:100 000. Examining the table below which looks at nurses per 1 000 population, we find that South Africa compares quite well with the situation in neighbouring countries. Tanzania (9,37) has the highest nurse per 1 000 population ratio of the selected countries, followed by Swaziland (4,24) and then South Africa (4,08). Table 11: Nurses per 1000 population in SA and neighbouring countries, various years
Country Years Number Density per 1000
population South Africa 2004 184459 4.08Botswana 2004 4753 2.65Lesotho 2003 1123 0.62Malawi 2004 7264 0.59Mozambique 2004 3947 0.21Namibia 2004 6145 3.06Swaziland 2004 4590 4.24Zambia 2004 16990 1.56Zimbabwe 2004 9357 0.72Kenya 2002 37113 1.18Uganda 2004 14805 0.55Tanzania 2002 2669603 9.37Source: Table compiled from WHO World health statistics report, 2007 When we examine how we compare with more developed countries, which we assume have better functioning health systems. Table 12 illustrates the same measure compared across OECD countries. Here the country having the best nurse per 1 000 population ratio is Norway (14,84), followed by Finland (14,33) and then the Netherlands (13,73). The three countries with the lowest ratios are Mexico (0,9), Turkey (1,70) and Korea (1,75). Even in comparison to the worst of the OECD countries, SA does not fair too much better, in comparison to the total

21
group of 29 countries SA ranks fifth from the bottom. SA definitely falls very much short of the high standards in many of the other OECD countries. Table 12: Nurses per 1000 population, OECD countries
Country Years Number Density per 1000
population Norway 2003 67274 14.84Finland 2002 74450 14.33Netherlands 2003 221783 13.73Iceland 2003 3954 13.63United Kingdom 1997 704332 12.12Switzerland 2000 77120 10.75Denmark 2002 55425 10.36Sweden 2002 90758 10.24Canada 2003 309576 9.95Germany 2003 801677 9.72Czech Republic 2003 99351 9.71Austria 2003 76161 9.38United States 2000 2669603 9.37Luxembourg 2003 4151 9.16Australia 2001 176188 9.10Hungary 2003 87381 8.85New Zealand 2001 31128 8.16Japan 2002 993628 7.79Spain 2003 315200 7.68France 2004 437525 7.24Slovak Republic 2003 36569 6.77Belgium 2003 60142 5.83Italy 2003 312377 5.44Poland 2003 188898 4.90Portugal 2003 43860 4.36Greece 2000 42129 3.86Korea 2003 83333 1.75Turkey 2003 121000 1.70Mexico 2000 88678 0.90Source: Table compiled from WHO World health statistics report, 2007 Thus within the group of neighbouring countries, South Africa has a favourable nurse per 1 000 population ratio, but, when we compare it to the same ratios in OECD countries, we could definitely be seen as experiencing a shortage of nursing personnel. Also, it is important to note that these ratios are based on the number of nurses on the SANC register, rather than active nurses. But then again, rated against the WHO minimum norm, and only taking into consideration active nurses, we seem to have a more than adequate amount of nurses (336: 100 000). This leaves us with three questions following from these sections, 1) is the minimum norm applicable to the South African situation where we might have a sufficient absolute number of nurses, but we need to establish whether we have critical skills shortages at certain occupational levels, and 2) if the current

22
situation illustrates that we do not have an absolute shortage, what does the growth in the sector predict for our future nursing supply and 3) how does it influence demand? Now that we have contextualized our nursing situation with other neighbouring and international countries, let us see whether our current situation has seen improvement over the years. The previous sections indicate that we have enough nurses, but whether we have enough nurses at the correct occupational levels is still questionable. 4. SUPPLY OF NURSES If following from the above sections, we postulate that we have enough nurses in absolute terms we need to examine the supply of nurses, to establish whether current nurse population ratios can be maintained with the current output. Hall & Erasmus (2003) suggests that if the current nurse population ratio (at that stage 343:100 000) is to be maintained, SA would need to keep their average annual supply at about 5 837, but this would still leave an overall shortage of approximately 20 000 nurses by 2011. Let us see if their assertions presently still hold true. The nursing education and training environment, is quite complex, with training occurring at universities, colleges and private institutions. It is important to consider the regional distribution of output so that we can evaluate how this compares to the current regional distribution of nurses. This is important to establish whether nurses are inclined to stay in the provinces in which they have trained. The table below comprehensively presents the regional distribution of output for nursing courses in 2006. We find the majority of nurses are produced in Gauteng, with the Northern Cape contributing the least to nursing output. This is in line with nursing distribution illustrated in figure two, where Gauteng has the most nurses (26.4 per cent), and the Northern Cape the least (1.7 per cent). This might indicate that nurses are inclined to stay in the province in which they train. College output is divided into three sections; four year programme, pupil nurses and pupil auxiliaries. For the four year programme the most nurses are produced in the Eastern Cape and Gauteng, with the least being produced by the Northern Cape. For pupil nurses the majority come from Kwazulu-Natal, with the least from Limpopo and the Western Cape. Pupil auxiliaries are mainly produced by Limpopo, with the Northern Cape once again producing the least in this category.

23
Table 13: Output for nursing courses by Province, 2006 Output for Public training institutions Output for Private training
institutions
University College Private training institutions
Four year Programme
Four year Programme
Pupil Nurses Pupil Auxiliaries
Pupil Nurses Pupil Auxiliaries
Total Output Bridging
Programme for all
institutions
Province
Count % Count % Count % Count % Count % Count % Count % Count % Eastern Cape 100 19% 328 22% 0% 126 11% 31 1% 37 1% 622 5% 208 9% Free State 31 6% 45 3% 146 10% 123 11% 50 1% 78 2% 473 4% 53 2% Gauteng 87 16% 326 22% 182 13% 136 12% 1358 40% 2600 61% 4689 38% 537 23% KwaZulu Natal 125 23% 304 20% 818 57% 51 4% 1722 51% 1029 24% 4049 33% 935 40% Limpopo 71 13% 43 3% 107 7% 364 31% 13 0% 100 2% 698 6% 345 15% Mpumalanga 0% 112 8% 81 6% 73 6% 32 1% 93 2% 391 3% 197 8% North West 16 3% 182 12% - 0% 169 14% - 0% - 0% 367 3% 3 0% Northern Cape - 0% 24 2% - 0% 22 2% - 0% - 0% 46 0% 47 2% Western Cape 104 19% 129 9% 108 7% 102 9% 168 5% 319 7% 930 8% 39 2%
Total 534 100% 1493 100% 1442 100% 1166 100% 3374 100% 4256 100% 12265* 100% 2364 100% Sources: SANC (2007) *Note: Total excludes those qualifying from bridging courses Private sector training is done mainly by hospital groups (for instance; Life College of Learning, Medi-Clinic College, Netcare Training Academy, Arwyp training Centre and Goldfield Training Centre). Private output is divided into two sections; pupil nurses, and auxiliaries. For the former, Gauteng is the major producer, and Limpopo contributes the least. For the latter, Gauteng again contributes the majority, and the Eastern Cape contributes the least. Particularly, looking at university output, the most is supplied by Kwazulu-Natal (23,4 per cent), with North-West producing the least (2,9 per cent). Although the output from bridging programmes is not included in the total output (because it does not actually represent a real increase in nursing numbers), it illustrates those nurses that have been assisted to advance or upgrade in their careers from EN and ENA level by completing the 2 year bridging programme. The fact that an increasing number of nurses are graduating from bridging courses is positive, as it results in many more nurses being able to upgrade to professional status. Subedar (2005: 92) also notes this “general upward trend in the number of PNs graduating through the bridging course”. However, it impacts on the number of EN and ENAs, and thus it is important to ensure that there are a sufficient number of new EN and ENAs to replace those advancing through the bridging course (Subedar). This seems to be in line with the HRH plan which advocates greater increases at these lower levels. Further, a critical point emerging from table 13 is that 65 per cent of total nursing output is obtained from private training, with 30 per cent coming from Colleges and the remaining 5 per cent from the universities. Importantly even though

24
private training contribution seems impressive, one needs to recognize that the majority lies at the lower categories of nursing, with the Colleges dominating output of professional nurses, which has been the case historically. We will now briefly look at the trends during the period, for each nursing category, and will later analyse the specific trends for the production of professional nurses. University and College output for the four year nursing programme, as mentioned earlier, is still dominated by the nursing colleges (79 per cent), although at a lower proportion than in 1997 (85 per cent). Specifically, universities have shown a positive average annual growth of 4 per cent during the period, with nursing colleges actually having a decline (-5 per cent). This results in a negative growth rate (-3 per cent) for the university and college output of professional nurses during the period 1997 to 2006. Table 14: Output four year programme by year, 1997-2006
SA universities SA Nursing Colleges Total Year Count % Count % Count % 1997 387 14% 2295 86% 2682 100%1998 381 16% 1990 84% 2371 100%1999 351 16% 1911 84% 2262 100%2000 408 16% 2086 84% 2494 100%2001 409 21% 1494 79% 1903 100%2002 400 24% 1252 76% 1652 100%2003 453 29% 1108 71% 1561 100%2004 428 25% 1288 75% 1716 100%2005 460 30% 1058 70% 1518 100%2006 534 26% 1493 74% 2027 100%Total 4211 21% 15975 79% 20186 100%
Percentage growth 38% -35% -24% Avg annual growth 4% -5% -3%
Source: Author’s own calculations based on data from SANC (2007) Table 15 reports on the trends in pupil nurse output during the same period. We notice positive growth rates, for both public and private institutions. Private institutions dominate the production of pupil nurses, while also showing the greatest average annual growth, compared to the lower growth (6 per cent) for pupil nurse output in public institutions. The overall annual average growth was very positive at 18 per cent. Table 15: Output pupil nurses by year, 1997-2006
Public institutions Private institutions Total
Year Count % Count % Count % 1997 881 82% 188 18% 1069 100% 1998 1262 75% 418 25% 1680 100% 1999 2042 80% 526 20% 2568 100% 2000 1217 63% 702 37% 1919 100%
25
2001 1058 55% 874 45% 1932 100% 2002 1328 48% 1443 52% 2771 100% 2003 1352 59% 956 41% 2308 100% 2004 1438 34% 2835 66% 4273 100% 2005 1185 26% 3380 74% 4565 100% 2006 1442 30% 3374 70% 4816 100% Total 13205 47% 14696 53% 27901 100%
Percentage growth 64% 1695% 351% Avg annual growth 6% 38% 18%
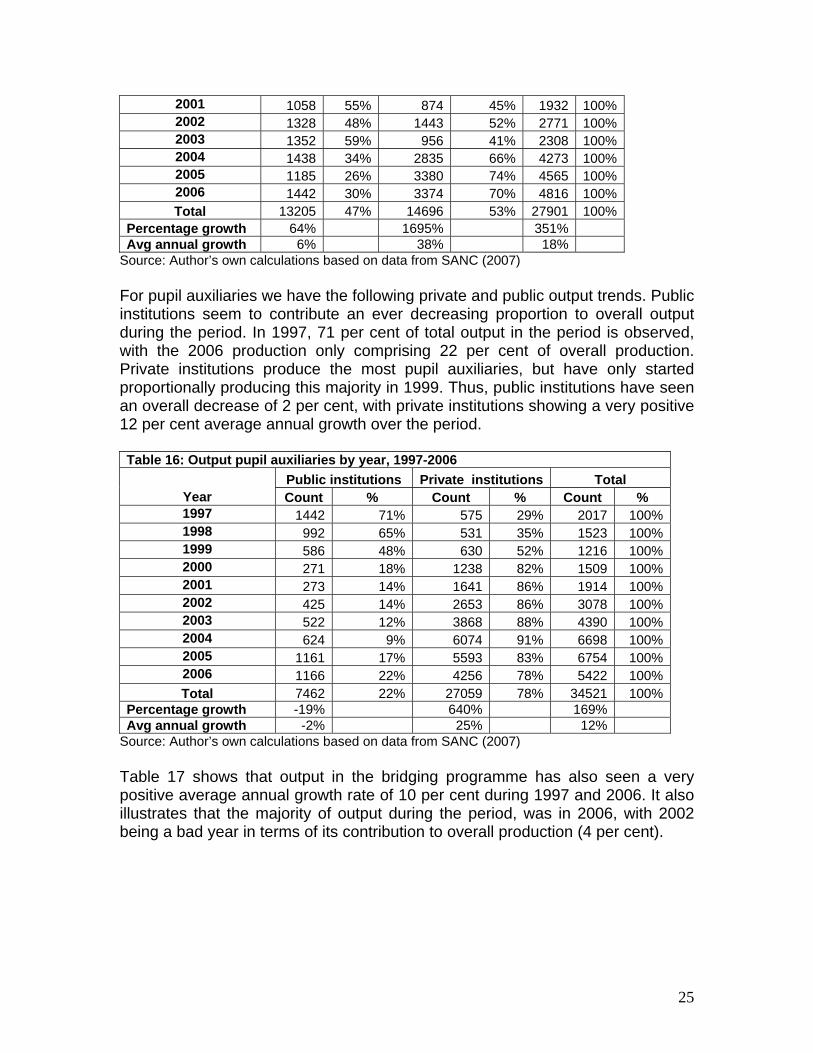
Source: Author’s own calculations based on data from SANC (2007) For pupil auxiliaries we have the following private and public output trends. Public institutions seem to contribute an ever decreasing proportion to overall output during the period. In 1997, 71 per cent of total output in the period is observed, with the 2006 production only comprising 22 per cent of overall production. Private institutions produce the most pupil auxiliaries, but have only started proportionally producing this majority in 1999. Thus, public institutions have seen an overall decrease of 2 per cent, with private institutions showing a very positive 12 per cent average annual growth over the period. Table 16: Output pupil auxiliaries by year, 1997-2006
Public institutions Private institutions Total Year Count % Count % Count % 1997 1442 71% 575 29% 2017 100%1998 992 65% 531 35% 1523 100%1999 586 48% 630 52% 1216 100%2000 271 18% 1238 82% 1509 100%2001 273 14% 1641 86% 1914 100%2002 425 14% 2653 86% 3078 100%2003 522 12% 3868 88% 4390 100%2004 624 9% 6074 91% 6698 100%2005 1161 17% 5593 83% 6754 100%2006 1166 22% 4256 78% 5422 100%Total 7462 22% 27059 78% 34521 100%
Percentage growth -19% 640% 169% Avg annual growth -2% 25% 12%
Source: Author’s own calculations based on data from SANC (2007) Table 17 shows that output in the bridging programme has also seen a very positive average annual growth rate of 10 per cent during 1997 and 2006. It also illustrates that the majority of output during the period, was in 2006, with 2002 being a bad year in terms of its contribution to overall production (4 per cent).

26
Table 17: Output bridging programme by year, 1997-2006 All institutions
Year Count % 1997 1033 6%1998 1539 9%1999 1839 11%2000 1991 11%2001 1670 10%2002 679 4%2003 1841 11%2004 2103 12%2005 2352 13%2006 2364 14%Total 17441 100%
Percentage growth 129% Avg annual growth 10%
Source: Author’s own calculations based on data from SANC (2007) Table 18 presents a collation of all of the above tables, to illustrate figures on total output trends between 1997 and 2006. It shows that overall we have a positive annual average growth rate of 9 per cent, and the average output is 8 261 nurses. This average output is significantly higher than the average output calculated, by Hall & Erasmus (2003) for the period 1991 to 2000 (at that stage 5 837). Based on this updated information, the estimated gap between nursing supply and demand by 2011 (at that stage estimated to be 18 758), could be substantially reduced, and in some cases even eradicated. Bringing into question again – how serious are the reports of nursing shortages, and what are the methods used by governments to establish the wide scale reported gaps in nursing skills?
Table 18: Output for all nursing courses, excluding bridging programmes, by year, 1997-2006
Output four-year
Programme- South African
universities
Output four-year
Programme –South African
Nursing Colleges
Output Pupil Nurses –
Public institutions
Output Pupil Nurses – private
institutions
Output Pupil Auxiliaries –
Public institutions
Output Pupil Auxiliaries –
Private institutions Total
Year Count % Count % Count % Count % Count % Count % Count % 1997 387 7% 2295 40% 881 15% 188 3% 1442 25% 575 10% 5768 100% 1998 381 7% 1990 36% 1262 23% 418 7% 992 18% 531 10% 5574 100% 1999 351 6% 1911 32% 2042 34% 526 9% 586 10% 630 10% 6046 100% 2000 408 7% 2086 35% 1217 21% 702 12% 271 5% 1238 21% 5922 100% 2001 409 7% 1494 26% 1058 18% 874 15% 273 5% 1641 29% 5749 100% 2002 400 5% 1252 17% 1328 18% 1443 19% 425 6% 2653 35% 7501 100% 2003 453 5% 1108 13% 1352 16% 956 12% 522 6% 3868 47% 8259 100% 2004 428 3% 1288 10% 1438 11% 2835 22% 624 5% 6074 48% 12687 100% 2005 460 4% 1058 8% 1185 9% 3380 26% 1161 9% 5593 44% 12837 100% 2006 534 4% 1493 12% 1442 12% 3374 28% 1166 10% 4256 35% 12265 100% Total 4211 5% 15975 19% 13205 16% 14696 18% 7462 9% 27059 33% 82608 100%

27
Percentage growth 38% -35% 64% 1695% -19% 640% 113%
Avg annual growth 4% -5% 6% 38% -2% 25% 9%
Average output (number) 421 1598 1321 1270 746 2706 8261
Source: Author’s own calculations based on data from SANC (2007) The previous sections focused on establishing supply trends of nurses in general, and again, it seems that our overall supply might be sufficient, given our increased production, and assuming that replacement demand remains roughly the same as estimated in Hall & Erasmus’ report. However let us be cautious in asserting sufficiency based on older indicators used for forecasting. In order to present a more accurate comparison between, or update of, Hall & Erasmus’ projected nursing gaps, one would need to take into consideration, the updated population estimations, recalculate new demand, as well as establishing new replacement demand, based on updated retirement, death and emigration data. However, amidst claims that we specifically need professional nurses, let us more closely examine their production trends. Growth in registers Many stakeholders assert that we have definite shortages at PN level. Let us examine the growth in registers to get a sense of whether this is true. Table 19: Growth in registers (SANC)
Category PN/ PM
% Growth
EN / EM
% Growth ENA
% Growth Total
% Growth
1996 87783 n.a. 33170 n.a. 51567 n.a. 172520 n.a.1997 90007 2.5 33005 -0.5 51538 -0.1 174550 1.21998 91011 1.1 32744 -0.8 49948 -3.1 173703 -0.51999 92390 1.5 32925 0.6 47578 -4.7 172893 -0.52000 93303 1.0 32399 -1.6 45943 -3.4 171645 -0.72001 94552 1.3 32120 -0.9 45666 -0.6 172338 0.42002 94948 0.4 32495 1.2 45426 -0.5 172869 0.32003 96715 1.9 33575 3.3 47431 4.4 177721 2.82004 98490 1.8 35266 5.0 50703 6.9 184459 3.82005 99534 1.1 37085 5.2 54650 7.8 191269 3.72006 101295 1.8 39305 6.0 56314 3.0 196915 3.0
Overall growth 15.4 18.5 9.2 14.1Source: SANC (2007) The above table indicates positive gains over the previous period. Where our SA population has increased from approximately 42, 130 million in 1996 to 47, 400 million in 2006 (12,5 per cent growth) there has also been an overall increase in the total number of nurses on the registers from 172 520 in 1996 to 196 914 in 2006, (14,1 per cent growth) (SANC website, 30 October 2007). More specifically

28
the growth in the different categories are as follows, PN’s increased by 15 per cent, ENs by 19 per cent, and ENAs by nine per cent. The highest growth then observed in the enrolled nurse category, followed by professional nurses, and the lowest growth in the enrolled nursing auxiliary category. Growth in the latter is then most worrying, as it does not keep up with growth in the population. Further, more specifically, PNs proportional representation has increased slightly from 50,9 per cent of total nurses in 1996 to 51,4 per cent in 2006. Enrolled nurses also showing a slight proportional increase between 1996 and 2006 (19,2 per cent to 20 per cent), and ENAs decreased from 30 per cent of total nurses to 29 per cent during the ten year period. Thus for nursing overall, we have seen positive growth trends keeping up with population growth. If these trends persist we will continue to have a majority of Professional Nurses, which is what many assert our country currently needs. So, if according to international norms, we have enough nurses, and after this analysis it seems that we have a majority of Professional Nurses, why are many stakeholders maintaining a need for PNs specifically, and the HRH Plan on the other hand calls for greater output in the ENA and EN in comparison to the need for PN output? The HRH Plans’ assertion that we need more ENs and ENAs might be linked to the proposed HRH Task team benchmark (1 professional nurse to 2 enrolled nurses), which would require more ENs in comparison to RNs. Let us examine the supply of nurses, to establish how the assertions around the need for specific categories of nurses are informed by current supply trends. The tables below present a different view to that of table 13 because they take into consideration the contribution of bridging programmes to the output of professional nurses. It shows that PN coming from public colleges have decreased from a proportional representation of 63 per cent in 1996 to 22 per cent in 2006. Both universities (from 9 per cent in 1996 to 14 per cent in 2006) and bridging programmes (from 28 per cent in 1996 to 63 per cent in 2006) showed an overall increase in production. Table 20: Overall numbers of professional nurses produced, 1996 - 2006
Public
Colleges Universities Bridging
Programme Total 1996 2629 360 1169 4158 1997 2295 387 1033 3715 1998 1990 381 1539 3910 1999 1911 351 1839 4101 2000 2086 408 1991 4485 2001 1633 408 1670 3711 2002 1252 400 1679 3331 2003 1100 453 1841 3394 2004 1288 428 2103 3819 2005 1058 475 2352 3885 2006 1493 534 2364 4391

29
Total 18735 4585 19580 42900 % 43.7 10.7 45.6 100%
Source: SANC (2007) When we combine national output information from all of the different training institutions, it is evident that professional nursing output was dominated by Public Colleges until 2000. In 2001 it seems as if the majority of PN output now started to come from bridging programmes. The above trends are illustrated by the graph below. Figure 3: Overall professional nursing output, 1996 - 2006
0
500
1000
1500
2000
2500
3000
Public CollegesUniversitiesBridging Programme
Public Colleges 2629 2295 1990 1911 2086 1633 1252 1100 1288 1058 1493
Universities 360 387 381 351 408 408 400 453 428 475 534
Bridging Programme 1169 1033 1539 1839 1991 1670 1679 1841 2103 2352 2364
1996 1997 1998 1999 2000 2001 2002 2003 2004 2005 2006
Source: SANC, 2007 In order to establish how this production of professional nurses translates into the nursing profession, we will calculate the difference between PNs produced between 1996 and 2006 (table 20 above), and growth in the SANC register during the same period (table 21 below). Table 21: Growth in the South African Nursing Council Register and Roll of nurses, 1996 - 2006
Category RN/ RM EN / EM ENA Total 1996 87783 33170 51567 172520 1997 90007 33005 51538 174550 1998 91011 32744 49948 173703 1999 92390 32925 47578 172893 2000 93303 32399 45943 171645 2001 94552 32120 45666 172338 2002 94948 32495 45426 172869 2003 96715 33575 47431 177721 2004 98490 35266 50703 184459 2005 99534 37085 54650 191269 2006 101295 39305 56314 196915

30
Variance 1996 - 2004 +13512 +6135 +4747 +24395
Source: SANC (2007) When comparing the two tables, whilst 42 900 professional nurses were trained during the period, the growth in the number of professional nurses on the SANC register was only 13 512 nurses (only 32 per cent of those produced). This would result in an attrition rate of 68 per cent. Taking into account that for instance, 2006 graduates will only register in 2007, and the 2006 register will obviously not yet reflect those additional numbers, it makes sense to consider the year-on-year growth rates, to get a more accurate picture of the rate of attrition between graduation and registration. See table 22 below. Table 22: Year-on-year growth calculated RN/ RM %
1996-1997 2224 53.51998 1004 27.01999 1379 35.32000 913 22.32001 1249 27.82002 396 10.72003 1767 53.02004 1775 52.32005 1044 27.32006 1761 45.3
13512 35.1Source: Author’s calculations from SANC (2007) data Thus taking into account the new estimations in table 22, only 35% of PNs graduating during the period is reflected on the register, leaving us with a slightly lower attrition rate of 65%. This inevitably raises the attrition debate around why the amount produced does not reflect reasonably on the registers. Do we lose so many nurses to emigration, or is the extent of AIDS related health worker attrition underestimated? What has also emerged from interviews, and thus can only be anecdotally offered as a reason for attrition between graduation and registration, is the effect of bursaries. Many students train for a nursing degree as a stepping stone into academia, and either end up practicing in another field, or change specialization to end up in related but different fields after the initial degree (for instance going from nursing into Psychiatry or Medicine). Subedar further explains the reasons for this attrition as a “combination of reaching retirement age, morbidity and mortality, moving to other jobs and leaving the country” (2005: 94). This of course represents a tremendous loss to the SA health system, and she further asserts that if this situation persists “the production of nurses will have to be increased at least three fold to keep up with the requirements of the health system” (Subedar, 2005: 94). We will elaborate on the impact of HIV/AIDS and emigration in a later discussion.
31
So it seems that we lose a great amount of nurses between graduation and registration, and if one considers further that, about 20 per cent of those on the SANC register is not active in the SA health care system, and greater proportions of nurses are now moving to private institutions, we begin to understand why many stakeholders, might be perceiving, and at grassroots level (especially in public facilities) be experiencing nursing shortages. Even though, calculations based on national data, might indicate that we have enough nurses. Linking again back to Subedar’s assertion that it is indeed difficult to establish shortage of nurses in SA.
5. DEMAND FOR NURSES Related to the difficulty in establishing nursing shortage, Subedar (2006) notes that if we perhaps would know the needs of government for the SA health care system, as set out by a very specific set of demand indicators for national needs, as well as at different skills levels, then only can we establish whether our current supply, even though experiencing a certain level of attrition would be able to address our health care needs. The tools used by government to try and quantify these needs, seem to not be accurately based on a comprehensive assessment of demand in certain areas, at the correct skills levels, and further at the correct specialisations. More specifically there is a disjuncture between the assertions of different government skills needs assessment and indicator tools. For instance, as shown in the introductory sections, whereas the Master list of scarce and critical skills would imply the importance of training more Professional nurses (10 250 Registered Nurses in comparison to a need of 4 120 Primary health care nurses), the HRH Plan more strongly proposes the increased production in higher numbers of lower levels of nurses (EN 8 000, and ENAs 10 000 in comparison to the need of 3 000 in the professional nurse category). Further, although acknowledging the different intents and purposes of the Master list of Scarce and Critical Skills, in comparison to the Quota list of Scarce and Critical Skills, it is worrying that even though the latter should follow from the assertions of the former; particularly related to health professionals for instance, the former does not specifically identify Research and Development Pharmacologists in its list, but the latter refers to these occupations as having a situation of absolute scarcity, thus necessary for inclusion and quantification in the Department of Home Affairs (DoHA) Work Permit Quotas. Understandably, we are confused! In an effort to answer this question, let us examine indications around the demand for nurses. Using vacancy rates as a recognized indicator for labour shortages, and a reflection of the current demand for nurses, we will firstly analyse the data arising out of the DoL’s Labour Market Information and Statistics unit (LMIS). This unit has, since April 2004 been capturing job vacancies advertised in the Sunday Times Career supplement and analyse the data on a quarterly basis (DoL, 2006).

32
Occupation(s) are used as the unit of analysis. The DoL’s data capturers classify and code the advertised job titles according to the South African Standard Classification of Occupations (SASCO) system. They were further classified according to the Organising Framework for Occupations (OFO) and recoded accordingly. The OFO is based on the SASCO but represents a significant enhancement in respect of providing a skill-based coded classification system, which encompasses all occupations in the South African context. It was developed to address the main shortcoming of the SASCO, which did not “provide details that the SETA’s require for good skills development planning and intervention” (Inseta website, October 2007). Occupations are classified into eight major groups: 1 Managers; 2 Professionals; 3 Technicians and Trades Workers; 4 Community Workers and Personal Service Workers; 5 Clerical and Administrative Workers; 6 Sales Workers; 7 Machinery Operators and Drivers and 8 Elementary Workers. Occupations in each major group are classified into sub-major groups (2 digit level). Occupations in sub-major groups can be classified into minor groups (3 digit level) and then into unit groups (4 digit level). SETAS are required to use the OFO in identifying scarce and critical skills in their sector skills plans. Using the OFO to classify advertised vacancies should also allow for alignment with the scarce and critical skills list developed each year by the DoL as the basis for the immigration quotas published by the Department of Home Affairs. The second part to establish demand will be the analyses of the survey of employers who recently advertised vacancies in the Sunday Times. Analysis of DoL’s job vacancy database The data captured every week over a period of three years – from April 2004 to March 2007 – was used as the basis for analysis to estimate the extent of nursing demand, and was also taken as the sample population for the survey. The analysis showed:
• There were a total of 112 828 vacancy adverts in this period. • The largest share of job vacancy adverts were placed in search for
Professionals (50,37 per cent) and for Managers (30,52 per cent). • A total of 17 479 vacancies were classified into the Health Professionals
grouping. Advertised vacancies for this group accounted for 30,76 per cent of all professional vacancies over the period under review.
• The largest share of job vacancy adverts in the Health Professionals category were placed in search of Midwifery and Nursing Professionals (43,59 per cent), followed by vacancies for Medical Practitioners (35,87 per cent) and for Health Diagnostic and Promotion Professionals (16,04 per cent). (See table 23 below).

33
Table 23: Number and share of vacancies for Health Professionals, by year and minor group
Number of vacancies published Share of vacancies 25 Health Professionals 04/05 05/06 06/07 3 years 04/05 05/06 06/07 3 years
Total¹ 4616 6955 5908 17479 32.72 34.98 25.87 30.76251 Health Diagnostic and Promotion Professionals 566 1123 1115 2804 12.26 16.15 18.87 16.04252 Health Therapy Professionals 183 234 370 787 3.96 3.36 6.26 4.50253 Medical Practitioners 1963 2116 2190 6269 42.53 30.42 37.07 35.87254 Midwifery and Nursing Professionals 1904 3482 2233 7619 41.25 50.06 37.80 43.59
¹ The ‘total’ number of advertised job vacancies relates to the total number appearing in the OFO recoded database, rather than the total number of advertisements placed. Source: DoL vacancy database based on advertisements placed in the Business Times In relation to nursing specifically:
• A total of 7 619 vacancies were classified into the Midwifery and Nursing Professionals group. Advertised vacancies for this group accounted for 40,85 per cent of all Health professional vacancies over the selected period.
• The largest share of midwives and nurse advertisements were placed in search of Registered Nurses (96,84 per cent).
• Nurse Educators and Researchers and Nurse Managers each accounted for 1,5 per cent of the vacancies and Midwives for 0,08 per cent.
• The concentration of Registered Nurses (and the small number advertised vacancies for Midwives) may be ascribed to job titles wrongly captured or wrongly classified and coded using the OFO, as Midwives are also RNs.
Analysis of the number of advertised vacancies and percentage change for Midwifery and Nursing Professionals across the three year period shows there were 2 233 for the two groups combined in Year 3 (March ’06 – April ’07): 41,24 per cent more than in Year 1 (April ’04 – March ’05), but 35,87 per cent less than in Year 2. The erratic nature of the number of vacancies published for Midwifery and Nursing Professionals may be attributed to the fact that the same vacancies could have been published repeatedly during that Year 2. Table 24: Number and share of vacancies for Midwifery and Nursing Professionals, by year and by unit group
Number of vacancies published Share of vacancies 254 Midwifery and Nursing
Professionals 04/05 05/06 06/07 3 years 04/05 05/06 06/07 3 years
Total¹ 1904 3482 2233 7619 41.24 44.69 35.76 40.85
2541 Midwives 0 0 6 6 0.00 0.00 0.27 0.08

34
2542 Nurse Educators and Researchers 60 39 16 115 3.15 1.12 0.72 1.51
2543 Nurse Managers 47 28 45 120 2.47 0.80 2.02 1.58
2544 Registered Nurses 1797 3415 2166 7378 94.38 98.08 97.00 96.84Source: DoL (job vacancy database), 2007 *Note: The ‘total’ number of advertised job vacancies relates to the total number appearing in the OFO recoded database, rather the total number of advertisements placed every year in the Sunday Times. According to the chart during the period April 2004 – March 2007, the total vacancies for nursing professionals have hovered around 2000. Between this period they make up a high of about 22 per cent of professional vacancies in the first 6 months of 05/06, and a low of 8 per cent in the second half of 06/07.
Figure 4: Nursing professional vacancies compared to total professional vacancies from April 2004 – March 2007 advertised in the Business Times newspaper
0
2000
4000
6000
8000
10000
12000
14000
1stHalf 04/05 2ndHalf 04/05 1stHalf 05/06 2ndHalf 05/06 1st Half 06/07 2ndHalf 06/07
Professionals Nursing Professionals
Source: DoL (job vacancy database), 2007
Within the nursing profession; the graph below indicates total vacancies. This shows that the greatest amount of vacancies is found in the nursing professional category, with lowest amounts of vacancies in the nursing associate category. One will have to debate whether this indicates greater need for nursing professionals in comparison to nursing associates, and of course we need to take into account the effect of the different type of occupational classification methods, which do not directly correspond to the educational classifications of these skills levels/nursing specialties.

35
0
500
1000
1500
2000
2500
3000
3500
4000
Nursing professionalsNursing associates
Nursing professionals 1904 3482 2233
Nursing associates 410 197 285
April 04 - March 05
April 05 - March 06
April 06 - March 07
Figure 5: Vacancies for professional and associate nurses from April 04 – March 07, as advertised in the Business Times newspaper
Source: DoL (Vacancy database compiled from Sunday Times newspaper, April 04 – March 07)
Note: The category nursing professionals include Nurse educators and researchers, nurse managers, midwives and registered nurses. The category Nursing associates include Enrolled And Mother Craft Nurses according to the OFO occupational classification.
Further investigating the differences between nursing professional and nursing associate vacancies published in the Sunday Times during the specific period, according to the table below the most nursing vacancies were consistently recorded in Gauteng, of which the majority was for nursing professionals. The lowest number of vacancies for nursing professionals and associates is seen in the North-West and Northern Cape.
Table 25: Total number of nursing professional, and nursing associate vacancies by province, from April 2004 - March 2007
Province Periods Nursing
Professionals % of total
Nursing Associates
% of total
Total for provinces
% of total
April 04 - March 05 117 6% 33 8% 150 6%April 05 - March 06 253 11% 10 4% 263 10%
Western Cape April 06 - March 07 97 3% 9 5% 106 3%
April 04 - March 05 704 37% 157 38% 861 37%
April 05 - March 06 92 4% 0 0% 92 4%Eastern Cape April 06 - March 07 490 14% 91 46% 581 16%
April 04 - March 05 0 0% 0 0% 0 0%April 05 - March 06 4 0% 2 1% 6 0%
Northern Cape April 06 - March 07 190 5% 15 8% 205 6%
April 04 - March 05 53 3% 2 0% 55 2%Free State
April 05 - March 06 19 1% 1 0% 20 1%

36
April 06 - March 07 23 1% 4 2% 27 1%April 04 - March 05 39 2% 8 2% 47 2%April 05 - March 06 151 7% 2 1% 153 6%KwaZulu-Natal
April 06 - March 07 61 2% 0 0% 61 2%April 04 - March 05 2 0% 0 0% 2 0%April 05 - March 06 25 1% 0 0% 25 1%
North West April 06 - March 07 3 0% 0 0% 3 0%
April 04 - March 05 843 44% 73 18% 916 40%April 05 - March 06 807 36% 206 72% 1013 40%
Gauteng April 06 - March 07 1230 35% 33 17% 1263 34%
April 04 - March 05 142 7% 137 33% 279 12%April 05 - March 06 36 2% 5 2% 41 2%
Mpumalanga April 06 - March 07 30 1% 0 0% 30 1%
April 04 - March 05 0 0% 0 0% 0 0%April 05 - March 06 437 20% 55 19% 492 20%
Limpopo April 06 - March 07 390 11% 0 0% 390 11%
April 04 - March 05 4 0% 0 0% 4 0%April 05 - March 06 409 18% 4 1% 413 16%
Not stated April 06 - March 07 968 28% 45 23% 1013 28%
April 04 - March 05 1904 100% 410 100% 2314 100%April 05 - March 06 2233 100% 285 100% 2518 100%
Total April 06 - March 07 3482 100% 197 100% 3679 100%
Source: DoL (Vacancy database compiled from Sunday Times newspaper, April 04 – March 07)
Moreover, from table 26 it is evident that the most vacancies were advertised in the public sector, indicating that the greatest demand for nursing professionals and associates exists within this sector. Total vacancies in the private sector is shown as being only 71 during the period April 06 – March 07, and for the public sector, 2477 during the same period. Table 26: Total number of nursing professional, and nursing associate vacancies by sector, from April 2004 - March 2007
Sector Periods Nursing
Professionals % of total
Nursing Associates
% of total
Total for
sector % of total
April 04 - March 05 56 3% 6 1% 62 3%April 05 - March 06 63 2% 8 4% 71 2%
Private April 06 - March 07 68 3% 3 1% 71 3%April 04 - March 05 1842 97% 404 99% 2246 97%April 05 - March 06 2689 77% 144 73% 2833 77%
Public April 06 - March 07 2165 97% 282 99% 2447 97%April 04 - March 05 6 0% 0 0% 6 0%April 05 - March 06 730 21% 45 23% 775 21%Not
stated April 06 - March 07 0 0% 0 0% 0 0%April 04 - March 05 1904 100% 410 100% 2314 100%Total April 05 - March 06 3482 100% 197 100% 3679 100%

37
April 06 - March 07 2233 100% 285 100% 2518 100%
Source: DoL (Vacancy database compiled from Sunday Times newspaper, April 04 – March 07)
We are only able to compare the above data to HST information on the percentage of professional nurse posts vacant, as they do not provide figures on the total number of nursing vacancies. However, to give some indication of the extent of vacancies in the health sector as a whole, their most recent available figure (2005), indicated that there are about 46 000 vacant health professional posts in the public sector. If we compare the DoL vacancy database information to the HST data in table 27 below, we find that currently about 36 per cent of professional nurse posts are vacant. This represents a 4,8 per cent increase in professional nursing posts vacant in the public sector from 2005, which could in part be attributed to the earlier observation that more nurses are seemingly moving into the private sector. More specifically, the increase in public sector vacancies seems to be most acute in the North West province (19.6 per cent), and the smallest increases noted in Mpumalanga (0.2 per cent) and the Kwazulu-Natal (0.5 per cent).
Table 27: Percentage of professional nurse posts vacant, 2006 and 2007
EC FS GP KZN LP MP NC NW WC ZA
2006 Public sector 34.0 31.4 26.0 42.5 15.0 40.0 33.2 22.8 22.0 31.5
2007 Public sector 35.8 35.7 39.9 42.0 20.0 40.2 35.9 42.4 23.8 36.3
Source: HST, 2007 from 2006 and 2007 PERSAL From the DoL vacancy data, as well as HST data, we can assert that the greatest demand appears to be for nursing professionals, and due to the increasing exodus of nurses from the public sector, the greatest demand exists there. Additionally, we need to however, bear in mind that vacancies also reflect frozen posts, and thus do not purely illustrate demand in a particular occupation. Considering the remuneration packages, table 28 shows that within the nursing professional category, the majority of salary packages were advertised in the R100 000 per annum category, and for nursing associates at the lower salary level of R50 000 per annum. In total, the largest proportion of salaries advertised for both were found in the R100 000 salary package level. These figures should be interpreted with caution, and the reader must note the high incidence of ‘not stated’ salary packages in these datasets. This information is merely given to present an indication of the realities of low wages in the sector. This relates to a later discussion in the HIV/AIDS section, which recognises the importance of

38
increasing wages, as a very important incentive for retention and recruitment of the HR so necessary for the treatment of the pandemic. Table 28: Total number of nursing professional, and nursing associate vacancies by salary, from April 2004 - March 2006
Salary Periods Nursing
Professionals % of total
Nursing Associates
% of total
Total for
sector % of total
April 04 - March 05 43 2% 231 56% 274 12%R50000 April 05 - March 06 109 3% 138 70% 247 7%
April 04 - March 05 933 49% 173 42% 1106 48%R100000 April 05 - March 06 1449 42% 6 3% 1455 40%
April 04 - March 05 228 12% 0 0% 228 10%R150000 April 05 - March 06 271 8% 0 0% 271 7%
April 04 - March 05 13 1% 0 0% 13 1%R200000 April 05 - March 06 9 0% 0 0% 9 0%
April 04 - March 05 0 0% 0 0% 0 0%R300000 April 05 - March 06 4 0% 0 0% 4 0%
April 04 - March 05 0 0% 0 0% 0 0%R350000 April 05 - March 06 2 0% 0 0% 2 0%
April 04 - March 05 687 36% 6 1% 693 30%Not stated April 05 - March 06 1638 47% 53 27% 1691 46%
April 04 - March 05 1904 100% 410 100% 2314 100%Total April 05 - March 06 3482 100% 197 100% 3679 100%
Source: DoL (Vacancy database compiled from Sunday Times newspaper, April 04 – March 07) Note: Stopped capturing salary data for 06 – 07, that is why there are no figures for April 06 – 07. Survey of employers recently advertising vacancies in the Sunday Times The second part of the vacancy study drew on the methodology of a New Zealand survey of employers (NZDoL, 2005). This study importantly regards the fill rate as a key indicator of skill shortage, asserting that occupations with fill rates lower than 80 per cent are regarded as experiencing shortage. The survey included: • A large sample telephone survey of 2 000 employers that had recently
advertised vacancies across all occupations, using a short questionnaire designed to collect information on whether advertised vacancies were being filled, and the number and suitability of applicants, and
• A small sample in-depth interview survey of 200 employers in selected professional occupations. In addition to questions asked in the large sample survey, qualitative questions were included to cover issues such as the supply and demand forces that are contributing to shortages and implications for the employer of their inability to fill vacancies, and their response to this.
A total of 207 employers were interviewed for vacancies across the three minor occupational groups of Health Professionals. The respondents collectively stated

39
799 vacancies of which 457 (57,20 per cent) were filled. A below 80 per cent fill rate was recorded at every minor group level of occupations in the Health Professions. Health Therapy Professionals recorded the highest fill rate (72,97 per cent) and Medical Practitioners the lowest at 54,15 per cent. The fill rate for Midwifery and Nursing Professionals was 56,43 per cent. In terms of the New Zealand DoL study, this does indicate a definite shortage. Table 29: Short questionnaire survey results for Health Professionals vacancies (minor group level)
OFO Occupation (sub-major group)
Inter-viewed
Vacan-cies Filled
Fill Rate
Appli-cants
Suit-able Rate
25 Health Professionals 207 799 457 57.20 3048 968 31.76251 Health Diagnostic and Promotion Professionals 59 142 87 61.27 584 163 27.91252 Health Therapy Professionals 14 37 27 72.97 163 44 26.99
253 Medical Practitioners 91 301 163 54.15 1239 377 30.43254 Midwifery and Nursing Professionals 43 319 180 56.43 1062 384 36.16
Source: DoL (Short questionnaire survey results of interviews with employers who placed advertisements in the Sunday Times) If we examine the tables more closely, it should be noted that shortages were not necessarily across all occupations within a minor group (coded to 3 digits) such as ‘Medical Practitioners’ or ‘Midwifery and Nursing Professionals’. One needs to take account of unit groups (coded to 4 digits) to see the specific occupations with the lowest vacancy fill rates. In the case of Medical Practitioners it was generalist medical practitioners and internal medicine specialists which had the lowest vacancy fill rates and among Midwifery and Nursing Professionals it was registered nurses, with a 56 per cent fill rate. Other professions with high vacancy fill rates were: Dieticians (2511), Medical Imaging Professionals (2512), Pharmacists (2515), Complementary Health Therapists (2522), Dental Practitioners (2523) and Speech Professionals and Audiologists (2527). The majority (97,67 per cent) of the short questionnaire interviews were conducted with employers who had advertised vacancies for Registered Nurses. A total of 42 employers were interviewed for vacancies for Registered Nurses, collectively reporting 316 vacancies of which 177 were filled. As an aside, one employer that had advertised vacancies for Nurse Managers reported that all of the vacancies were filled (the employer stated one vacancy but reported that five appointments were made). More than half (55 per cent or 11 out of 20) of the applicants were found to have had the qualifications and experience to do the job the employer needed them for. Thus the employer was of the opinion that there is not a shortage of Nurse Managers in the country.

40
Table 30: Short questionnaire survey results for Midwifery and Nursing Professionals vacancies (unit group level)
OFO Occupational Group Inter-viewed
Vacan-cies Filled
Fill Rate
Appli-cants
Suit-able Rate
254 Midwifery and Nursing Professionals 43 319 180 56.43 1058 381 36.012543 Nurse Managers 1 1/5 1/5 100.00 20 11 58.332544 Registered Nurses 42 316 177 56.01 1038 370 35.65
Source: DoL (Short questionnaire survey results of interviews with employers who placed advertisements in the Sunday Times) Below follows the tabled results for the ten (of the 42) employers that had recently advertised vacancies for Registered Nurses, who responded to the in-depth questionnaire. All had been looking to fill vacancies for “Chief-“, “Senior-” or “Professional Nurses”. All the respondents had made appointments but managed to fill only 37 of the 72 vacancies, amounting to a fill rate of 51,39 per cent. Table 31: In-depth questionnaire survey results for selected Midwifery and Nursing Professionals (unit group level)
OFO Occupational Group Inter-viewed
Vacan-cies Filled
Fill Rate
Appli-cants
Suit-able Rate
2543 Nurse Managers 1 1/5 1/5 100.00 20 11 55.002544 Registered Nurses 10 72 37 51.39 270 110 40.74
Source: DoL (In-depth questionnaire survey results of interviews with employers who placed advertisements in the Sunday Times) These 10 employers had different opinions on the question of whether there is a shortage of Registered Nurses in South Africa. Four of the five employers who indicated that there is NOT a shortage had managed to fill all their vacancies (one managed to fill only five (25 per cent) of 20 vacancies but still believed there is not a shortage of Registered Nurses in the country. Five stated that there is a shortage (four of these employers recorded a vacancy fill rate of below 60 per cent). The following reasons were offered to explain shortages: • Nursing is a low-wage occupation, where nurses do not get the recognition
they deserve, and there is a lack of promotion opportunities and constant shortages in the financial budget of the institution
• Nurses are going overseas … “because they are getting paid better” and there are not as many coming into the country
• People don’t want to become nurses because of unusual hours of work … “they work shifts so the married Nurses think it's unsociable … it has an effect on marriage … working a twelve hour shift is difficult for a mommy”, tough physical work and danger of injury – “there is a lot of people with HIV … they (Nurses) are scared for their own health” (Refer to section on HIV/AIDS below).
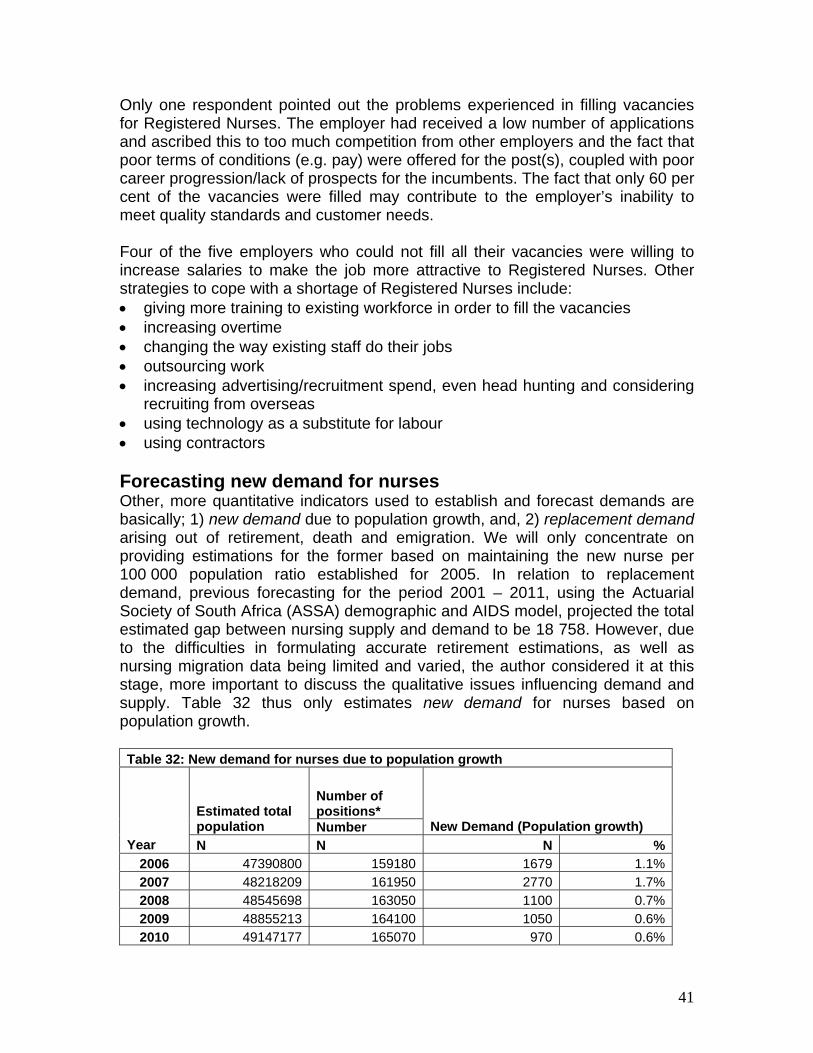
41
Only one respondent pointed out the problems experienced in filling vacancies for Registered Nurses. The employer had received a low number of applications and ascribed this to too much competition from other employers and the fact that poor terms of conditions (e.g. pay) were offered for the post(s), coupled with poor career progression/lack of prospects for the incumbents. The fact that only 60 per cent of the vacancies were filled may contribute to the employer’s inability to meet quality standards and customer needs. Four of the five employers who could not fill all their vacancies were willing to increase salaries to make the job more attractive to Registered Nurses. Other strategies to cope with a shortage of Registered Nurses include: • giving more training to existing workforce in order to fill the vacancies • increasing overtime • changing the way existing staff do their jobs • outsourcing work • increasing advertising/recruitment spend, even head hunting and considering
recruiting from overseas • using technology as a substitute for labour • using contractors Forecasting new demand for nurses Other, more quantitative indicators used to establish and forecast demands are basically; 1) new demand due to population growth, and, 2) replacement demand arising out of retirement, death and emigration. We will only concentrate on providing estimations for the former based on maintaining the new nurse per 100 000 population ratio established for 2005. In relation to replacement demand, previous forecasting for the period 2001 – 2011, using the Actuarial Society of South Africa (ASSA) demographic and AIDS model, projected the total estimated gap between nursing supply and demand to be 18 758. However, due to the difficulties in formulating accurate retirement estimations, as well as nursing migration data being limited and varied, the author considered it at this stage, more important to discuss the qualitative issues influencing demand and supply. Table 32 thus only estimates new demand for nurses based on population growth. Table 32: New demand for nurses due to population growth
Number of positions* Estimated total
population Number New Demand (Population growth) Year N N N %
2006 47390800 159180 1679 1.1%2007 48218209 161950 2770 1.7%2008 48545698 163050 1100 0.7%2009 48855213 164100 1050 0.6%2010 49147177 165070 970 0.6%

42
2011 49418610 166000 930 0.6%2012 49670161 166845 845 0.5%2013 49904215 167625 780 0.5%2014 50123162 168350 725 0.4%2015 50328900 169050 700 0.4%Total 11549
Sources: Van Aardt, 2005 (data for total population); SANC (South African Nursing Council, 2007 (data for nurses on the register in 2005) *Note: Maintaining a 336: 100 000 ratio So, according to the above table, we estimate the new demand for nurses (between 2006 and 2015) to be 11 549, based on the forecasted population growth estimates and to maintain the 336:100 000 ratio. It is important, before considering the other factors influencing demand and supply, to discuss the additional demand for healthcare brought about by HIV/AIDS.
Demand due to HIV/AIDS Providing care has become increasingly complex for nurses, the African health care and health services environment is influenced in a profound manner by the HIV/AIDS epidemic, often making it impossible for nurses to fulfill their duty of supporting those in need and providing care. It is important to consider three broad aspects, to understand more accurately the AIDS related nursing demand estimations; the impact it has on the population at large, the health care system, and the health care workers within that system. Population The impact of HIV/AIDS on Africa is extensive. The World Health Organisation (WHO), notes that Sub-Saharan Africa “accounts for 11 per cent of the world’s population, but 65 per cent of the world’s HIV infections and only 3 per cent of its doctors and nurses” (Mail & Guardian online, 16 August 2006). We are also presented with unsatisfactory conditions in the public service, where “AIDS patients have started ‘crowding out’ other patients” (Terreblanche, 2004). This situation is exacerbated by the increased length of stay and complexity of their treatment, as well as lack of drugs and supplies (Rau, 2004 in Pendukeni, 2004, Raisler & Cohn, 2005). Moreover, because of the stigma attached to HIV infection, patients often wait till they become very ill, and this increases the workload for nurses who then have to attend to chronically ill patients. Health care system Many note that AIDS is “reversing all the health gains that have been made in the past two decades” (Cape Times, May 29, 2004: 5), and that the main obstacle to addressing the epidemic is the weak condition of the African health system. There also seems to be a “lack of awareness and understanding of the effect of

43
HIV/AIDS on companies” (Hall, nd: 3), evident in the lack of adequate policies and information on policies for health care staff, in various hospitals.
Health Human Resources
Hall identifies 6 ways in which HIV/AIDS impacts on nurses in healthcare; • it increases the workload of nurses because of higher number of patients
with AIDS related illnesses, • the increased emotional discontent for the remaining workforce • the intensive and comprehensive type of care needed by these (dying
patients) • the lack of supplementary support to nurses • the secrecy surrounding disease reduces productivity, and • nurses themselves can be infected which contributes to absenteeism,
stress and lower performance (Hall, nd). The human resources needed to address the HIV/AIDS epidemic is seen and recognized by many as the most important factor in the fight against it. Nurses are recognized as the first point of contact in the health system having to deal with this epidemic, and should be “prominent in the struggle against disease conditions such as HIV and AIDS” (The Star, May 11, 2005). David Saunders, head of the School of Public Health at the University of the Western Cape, asserts that “the health systems are not functioning… because the human resources are not functioning” (Cape Times, 29 May 2004: 5). UNAIDS estimates that about “78 per cent of those in need of ARV’s in South Africa are not receiving them” (News Plus, 14 September 2006). This has been blamed on, amongst other things, lack of government leadership and commitment at national level in some provinces, which is exacerbated by the limited skills base. Fundamentally the HIV/AIDS plan is committed to providing appropriate treatment for 80 per cent of all HIV-positive people by 2011. “Of the 5,5 million South Africans currently infected, about a million are in need of antiretrovirals (ARVs)… by 2011 actuaries estimate there will be 5,9 million infected, and the need for ARVs will grow still further” (Van der Vliet, 2007). Zelnick (2005: 164) notes, “nursing staff shortages, exacerbated by international recruitment programs, increased emigration, expanding job options for women, and poor working conditions resulting from the HIV/AIDS epidemic, render staffing anti-retroviral therapy (ART) programs all the more difficult”. The shortage of properly trained healthcare workers is always mentioned as a hindrance to the successful implementation and management of any ARV programme.

44
Some estimations have been offered in an effort to more concretely quantify the additional demand for healthcare staff brought about by this pervasive epidemic. Table 33 thus estimates the total additional need for nurses, due to HIV/AIDS to be, 4 393 between April 2005 and March 2008 (1 883 Professional Nurses, 1 255 Enrolled Nurses, and 1 255 Assistant Nurses).
Table 33: Total additional staff to be recruited by DoH
Category of staff Through March 04 April 04 to March 05 April 05 to March 08
Medical officers 76 271 628
Professional nurses 228 813 1883
Enrolled nurses 152 542 1255
Assistant nurses 152 542 1255
Pharmacists 76 271 314
Pharmacist assistants 76 271 314
Dieticians/nutritionists 76 136 314
Social workers 38 136 314
Lay counselors/ Community health workers 760 2710 6275
Administrative clerks 152 542 1255
Total 1786 6234 13807
Source: DoH (2003)
Table 34 further presents the immense disparities in ART roll-out between provinces. It lists all the factors needed for efficient and adequate ART treatment roll-out, and Grimwood et al, provide the following figures. We see that the Western Cape is most favourably positioned to achieve high ART coverage. This is because it has the lowest HIV prevalence of any of the other provinces, the highest number of doctors per 100 000 uninsured persons, the second highest GDP per capita, the highest public sector health expenditure per capita, and the longest running ART and care programme (Grimwood et al, 2007).
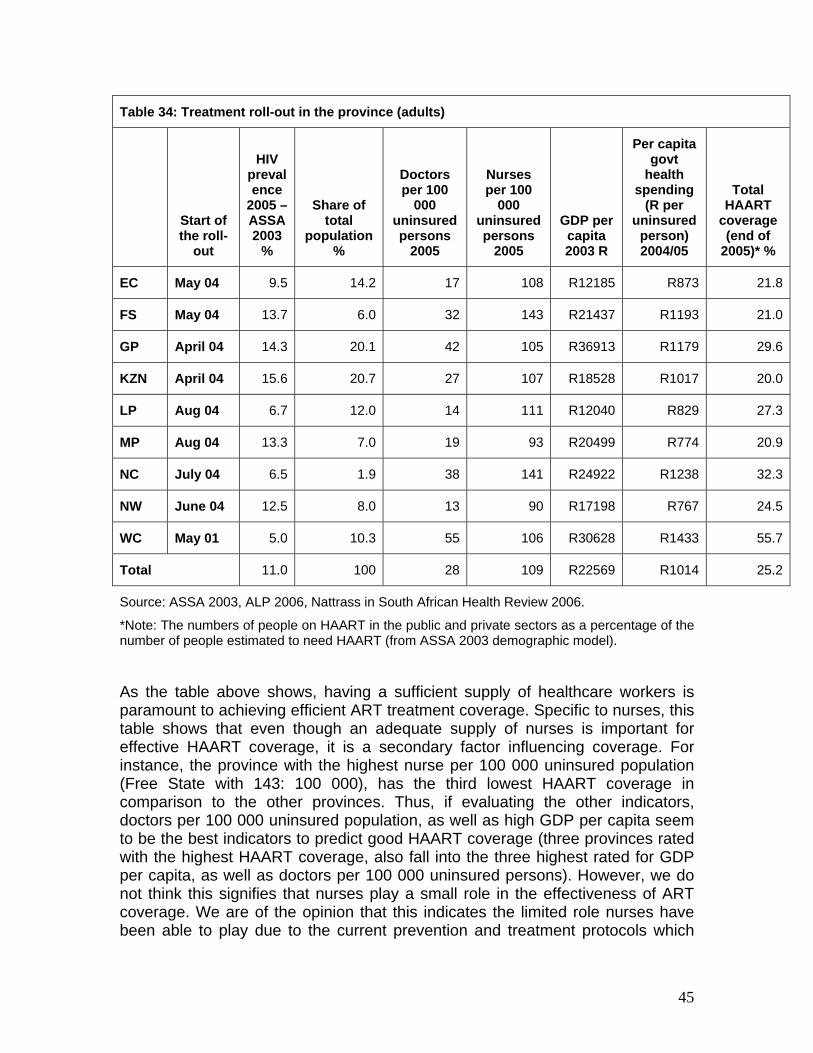
45
Table 34: Treatment roll-out in the province (adults)
Start of the roll-
out
HIV prevalence
2005 – ASSA 2003
%
Share of total
population %
Doctors per 100
000 uninsured persons
2005
Nurses per 100
000 uninsured persons
2005
GDP per capita 2003 R
Per capita govt
health spending
(R per uninsured
person) 2004/05
Total HAART
coverage (end of
2005)* %
EC May 04 9.5 14.2 17 108 R12185 R873 21.8
FS May 04 13.7 6.0 32 143 R21437 R1193 21.0
GP April 04 14.3 20.1 42 105 R36913 R1179 29.6
KZN April 04 15.6 20.7 27 107 R18528 R1017 20.0
LP Aug 04 6.7 12.0 14 111 R12040 R829 27.3
MP Aug 04 13.3 7.0 19 93 R20499 R774 20.9
NC July 04 6.5 1.9 38 141 R24922 R1238 32.3
NW June 04 12.5 8.0 13 90 R17198 R767 24.5
WC May 01 5.0 10.3 55 106 R30628 R1433 55.7
Total 11.0 100 28 109 R22569 R1014 25.2
Source: ASSA 2003, ALP 2006, Nattrass in South African Health Review 2006.
*Note: The numbers of people on HAART in the public and private sectors as a percentage of the number of people estimated to need HAART (from ASSA 2003 demographic model).
As the table above shows, having a sufficient supply of healthcare workers is paramount to achieving efficient ART treatment coverage. Specific to nurses, this table shows that even though an adequate supply of nurses is important for effective HAART coverage, it is a secondary factor influencing coverage. For instance, the province with the highest nurse per 100 000 uninsured population (Free State with 143: 100 000), has the third lowest HAART coverage in comparison to the other provinces. Thus, if evaluating the other indicators, doctors per 100 000 uninsured population, as well as high GDP per capita seem to be the best indicators to predict good HAART coverage (three provinces rated with the highest HAART coverage, also fall into the three highest rated for GDP per capita, as well as doctors per 100 000 uninsured persons). However, we do not think this signifies that nurses play a small role in the effectiveness of ART coverage. We are of the opinion that this indicates the limited role nurses have been able to play due to the current prevention and treatment protocols which

46
rely heavily on doctors. This picture could soon be changing as government is increasingly realizing that expanding the role of nurses in HIV/AIDS treatment and prevention, might be more appropriate for the circumstances of SA. Only then can one better assess and measure the importance of nurses in influencing HAART coverage. Another perspective promoting the importance of nurses in HIV/AIDS treatment, realizes that nurses present the majority of healthcare workers available to address this epidemic. In line with these assertions, it is concerning that we are losing a significant amount of nurses to HIV/AIDS. Shisana et al (2003: xii) proposed that the HRH Plan for the SA health sector must consider the attrition of health workers due to AIDS related mortality. Many countries in Africa are faced with high proportions of their nursing workforce being infected with AIDS. In Lesotho, Mozambique, and Malawi, death is the leading cause of health worker attrition, with a significant proportion being HIV-related (Van der Vliet, 2007). A recent South African survey found that the HIV/AIDS prevalence among South African health workers1 was “15,7 per cent (compared to 15,6 per cent in the general population), rising to 20 per cent in younger health workers” (Raisler & Cohn, 2005: 279). This is particularly concerning, given that we already have such a small cadre of young nurses. These figures clearly illustrates that HIV/AIDS very significantly impacts on shortages of health workers (Zelnick, 2005). Quoting an HSRC (refer to footnote below) report, Terreblanche (2004) notes that government will need to train “more nurses as up to 16 percent of health workers [is] likely to die from AIDS between 2002 and 2007, particularly if they don’t receive anti-retroviral treatment”. Although, there are policies and workplace practices which aim to protect nurses from exposure to HIV/AIDS, the undervaluation of nurses has often been cited as one of the main impacts on their negative responses to HIV/AIDS company policies and protocols. Further, AIDS education is not yet well integrated into the pre-service curriculum (Raisler & Cohn, 2005: 280), which again raises the question of whether especially young nurses are adequately prepared to deal with the reality of HIV/AIDS in the health care system. There are various initiatives and programmes developed in an effort to ameliorate the impact and effect of HIV/AIDS. Some authors have argued that it is important to involve nurses in the policy development process and to include their perspectives “contributing to worker health [and] addressing the dramatic shortage of nurses” (Zelnick, 2005: 163). Three main suggestions to address the impact of HIV/AIDS on nurses is to; 1) expand the role of nurses in the treatment 1 In this survey (Shisana et al, 2003) the term health workers referred to professional health workers (medical professionals, nursing professionals and other health professionals such as social workers and physiotherapists), as well as non-professional health workers (ward attendants and cleaners). The majority of the sample comprised of nurses.

47
of HIV/AIDS, 2) increase remuneration, 3) better working conditions and increase their resources. Expand the role of nurses. Nurses and midwives are the backbone of the healthcare system and will be the largest group of health workers available to diagnose and treat opportunistic infections and dispense antiretroviral therapy (SANNAM workshop, 2001). There is thus a need to develop and expand roles for nurses and midwives in AIDS care (Raisler & Cohn, 2005, Lancet in Mail & Guardian online 13 June 2006) as a way to alleviate the pressure on the health system brought about by HIV/AIDS. The current situation in SA is very restrictive, allowing only for RNs to conduct an HIV test, and only to prescribe ARV’s under very strict regulations (Ngcobo, 5 June 2007). Medicins Sans Frontiers (MSF), supports expanding the role of nurses, and encourages countries to look at innovative ways in which to more efficiently harness their HRH to deal with the epidemic in the short term. Cullinan (2006) suggested that “nurses and ‘clinical officers’ could monitor patients instead of doctors, while lay people could do HIV counselling and testing instead of nurses” (see also Independent Online, 14 June 2007). Some countries have implemented such strategies. For example, task-shifting has been permitted in Lesotho, where nurses are allowed to prescribe ARV’s. Dr. Pheelo Lethola (a field doctor in Lesotho), asserts that if they “were to rely solely on doctors for HIV care, a lot of people would die, especially in the mountains and rural areas” (HIV-Aids, 25 May 2007). George Jagoe, country director of the Clinton Foundation HIV/Aids initiative in Mozambique, asserts that the administration of drugs by trained doctors only might be inappropriate for the situation of HIV/AIDS in Africa, where medics and labs are scarce (Independent Online, 14 June 2007). Funding to increase salaries. The low remuneration, at a time when AIDS has burdened nurses with more than they feel they can handle, has effectively caused a medium-term shortage. Hospitals and clinics are short-staffed because of the additional procedures required by the surge in AIDS. According to many nurses, a critical first step to “retain nurses and attract new ones is salary increases” (Cohen, 2007). However, many donors are still of the opinion that the funding of salaries, a fixed human resource cost, is not a sustainable option. MSF is urging governments to fund more health care workers and improve their wages, and therefore ask donors to “reverse policies that ban funding for health care salaries and other recurring costs” (News 24, 24 May 2007), but it remains a controversial issue. Many (Cohen, 2007, MSF, 2007) are of the opinion that an emergency approach needs to be taken to deal with the crisis in health human resources needed to manage HIV/AIDS in Africa. We will in the following section evaluate the broader discussion of nursing salaries as importantly influencing nursing supply and demand, not specifically related to the need due to HIV/AIDS.

48
Better working conditions and increase resources. The lack of resources and support structures needed for HIV/AIDS prevention and treatment is negatively impacting on, not only nurses’ physical ability to care for patients, but also their mental ability to provide care. In 2001, there was a call for 4 interventions; 1) A task team, 2) HIV/AIDS training manual, 3) South African nurses HIV/AIDS initiative, and 4) The Baylor Curriculum2. These all recognize that nurses interact more closely with the communities at the primary level and especially those infected and affected by HIV/AIDS on a one on one basis. For instance, the Canada South Africa Nurses C-SAN HIV/AIDS Initiative aims at capacity development of SA nurses to increase their ability to manage treatment of HIV/AIDS more effectively. Above we discussed the specific impact of working conditions and resources on HIV/AIDS prevention and treatment. In the following section we elaborate on the impact of working conditions and lack of resources, more broadly on nursing supply and demand. We have considered the main impacts of HIV/AIDS on the SA population and its healthcare system. In addition, we more extensively considered the demand for health human resources brought about by this impact. Let us now grapple with the important factors affecting more generally, the supply of, and demand for, nurses.
6. ADDITIONAL FACTORS INFLUENCING SUPPLY/DEMAND
At the macro-level, political and economic changes in the South African history has impacted on the demand for health services, and now “large sections of the population, who never had access to health care before, are now entitled to free health services” (Hall, nd: 8). This larger demand has to be addressed by a shrinking nursing corps, under unsatisfactory working conditions in public health facilities. Although the extent of their impact on supply and demand is not always quantifiable, the factors identified as extensively influencing the present and future, demand and supply of nurses are;
• Working conditions
• The broader professional environment
• Remuneration
• Migration
2 This curriculum was developed in recognition of the “need to equip nurses and nursing students with comprehensive knowledge and skills in dealing with HIV/AIDS patients” (Secure the Future, 2001). It is envisaged that “nurses trained with this curriculum can be empowered to make early diagnosis thus hopefully reducing the impact of HIV/AIDS, offer support, compassion and care for those affected and infected” (Ashraf Grimwood, Director of HIV Research Institute, Secure the Future, 2001).

49
Working conditions, and broader professional environment According to the Citizen (2006) “South African nurses are unhappy” and this applies both in the public and private sector. In the public sector professionals are not properly remunerated and there is no commitment to maintain facilities and expertise. In the private sector the emphasis is on making a profit and they compromise on human resources (Sooka, 2007). In addition, the unhappiness of nurses comes with pressure. Already crippled by staff shortages, the health system continues to haemorrhage nurses and doctors, who are driven away by working conditions (Njamela, 2006). Nurses have to function in an environment characterized by shortages of other health personnel and necessary equipment. The other problem is that of exposure to infections and contamination, because of inadequate facilities (Hoo, 2006). Dibetle (2006) states that in certain hospitals the casualty and dispensary are overflowing with scores of patients and there are only two nurses and a doctor on duty. Due to the sometimes unbearable pressures within their working environment, there have also been various reports on abuse of patients by nurses (see Parker 2006; Reyneke, 2006; Hlatshwayo, 2007). This behaviour has been condemned by the minister of health, asserting that “it is totally unacceptable that clients are shouted, abused and mistreated by nurses (Tshabala-Msimang, 1999). Similarly, allegations of abuse of nurses by patients have also been reported, but less extensively (see Beresford, 2007; Hosken, 2007). Further events, like the recent public service strike, of which the largest constituents were teachers and hospital workers, definitely highlighted the plight of nurses having to work in unsatisfactory conditions. It illuminated the human resources crisis in health care as caused by poor conditions, increased workloads and failure to develop and implement a reasonable human resource plan for health.
Remuneration The public service strike, also illustrated other issues of concern in the health service. It was initiated when government refused the Congress of South African Trade Unions’ (COSATU) demands of a 12 per cent across the board salary increase, with an offer of only 6 per cent. The initial offer was dismissed by many as below the inflation rate and substantially below estimates of food and transport inflation, which are major expenses for lower-paid workers. Minister for Public Service and Administration, Ms Geraldine Fraser-Moleketi, and Health Minister, Dr. Manto Thabalala-Msimang, condemned health workers who had, according to them, behaved in ways totally discordant to their vows to put the lives of patients above everything else. On the other hand, unions have been supported by other entities; the Treatment Action Campaign, for instance, agree that public servants earn too little money, while working in appalling
50
conditions, and maintain that ‘all workers have the right to protest poor conditions of service, even essential ones’ (SOS News, 2007). Unfortunately updated information on the remuneration of nurses is not currently available, but from Hall & Erasmus’ report in 2003 it is evident that there is a relatively small difference between the salary packages of nurses employed in the public and private health sectors. However they do note that nursing administrator salaries in the public and private health sectors are higher than those of professional nurses in corresponding sectors. The low salaries paid to nurses, have been noted repeatedly as one of the major factors contributing to the low status of the profession. Also there seems to be no incentive for nurses to specialize, because it does not improve their financial situation (Dewar in Hall & Erasmus, 2003) or, to a large extent, their career progression in the clinical field. Moreover, there seems to be confusion between the original intentions of the scarce and rural skills allowances, which resulted in disparities in their respective application. Solutions to the poor nursing wage In an effort to address many of these concerns linked to the poor remuneration packages of healthcare workers, the DOH has recently (14th of September 2007) finalized the collective agreement on the Occupation Specific Dispensation (OSD) for nurses. The signing of the OSD agreement for nurses will be “implemented retrospectively with effect from 1 July 2007” (DoH, 2007). The Department has been lobbying other government institutions to “mobilize additional resources for the improvement of the working conditions for nurses” (DoH, 2007). Intense pressure to finalize the structure for the utilization of these resources was exerted by the trade union movement during the recent and protracted public service strike. An amount of 1, 458 billion rand was secured and allocated for the implementation of the OSD for nurses (in part). The general purpose of the OSD is to “improve government’s ability to attract and retain skilled employees, through improved remuneration” (DoH, 2007). The particular outcomes for nurses are:
• To introduce a remuneration and career progression system for all categories of nurses, providing for career pathing, pay progression, grade progression, recognition of seniority, increased competencies, and performance.

51
• To differentiate salary scales for categories of nursing professionals based on a new remuneration structure.
• To incorporate the existing scarce skills allowance for identified categories of specialty nurses into salary.
Remuneration and career progression system. The OSD provides the basis for salary recognition of the relevant experience on posts at production level, both for serving employees, as well as to add to the recruitment of nurses from outside the public health sector. It further introduces a two-yearly pay progression allowance within the confines of the relevant salary scale, on condition that the employee has upheld an agreeable level of performance outlined in the Performance management system. A Performance Management and Development System (APMDS) for nurses should be developed by the employer. Amongst other goals, it is meant to facilitate the assessment of employees in the occupational categories; Professional Nurse (Registered Nurse), Staff Nurse (Enrolled Nurse) and Nursing Assistant (Enrolled Nursing Assistant) for purposes of grade progression. This will apply to all the provincial departments of health, ensuring consistent management of performance (OSD, 2007). Thus a proviso is made for the introduction of a system of accelerated grade progression, based on shorter qualifying periods than normal, to higher grades based on sustained above average performance. Provided that the candidates at production and at supervisory levels meet all the promotion/ appointment requirements for the relevant higher grades, progression to the next salary grade (scale) will then be possible (OSD, 2007). In terms of the improvement of nurse’s career paths, the OSD provides that the salary grades display longer career progression opportunities, as part of the defined career path, to recruit and retain nurses in the relevant areas of need and also retain nurses in clinical practice for longer periods. The second aspect of career path improvement facilitates progression to other nurse categories, providing requirements and conditions for such progression are met. Also, competency requirements will be prescribed to determine appropriate salary recognition and grade progression. Differentiate salary scales. The OSD provides for variation in salary scales between Professional Nurse categories, General Nursing, Specialty Nursing, Specialist Nurse Practitioner and Nursing Educators. It also provides for the introduction of unique remuneration structures per nursing category with 3 per cent increments between notches on a particular salary level and the introduction of different career streams within the occupational category: Professional Nurse (OSD, 2007). The first phase of salary adjustments is subsequent to the 7,5

52
percent salary improvements as of 1 July 2007. At this phase of the OSD minimum adjustments, Nursing Assistants will have had 24 percent improvement overall, 20 percent for Staff Nurses, 24 percent for Professional Nurses and up to 88 percent for Professional Nurse Specialists. The second phase will include a full year’s re-calculation of relevant experience obtained by a nurse on a production level after registering with the SANC as of 31 March 2007. Incorporate the existing scarce skills allowance. Lastly, the OSD provides for the consolidation of the scarce skills allowance payable to nurses, stated in Resolution 1 of 2004 in the Public Health and Welfare Sector Bargaining Council (PHWSBC). The above presents the specific salary adjustments relevant to nurses, but the OSD will be extended to other health professional categories between 2008/09; doctors and medical specialists, dentists and dental specialists, pharmacists and emergency care practitioners and all other health professionals in the public health sector. DENOSA hailed the signing of the agreement as “an achievement for nurses” (DENOSA, 2007).
Emigration of nurses Migration between international health sectors is becoming increasingly important, as “concerns about the adverse impact of the flows of skilled professionals from poorer to richer countries have thrust the migration of health workers to the forefront of the policy agenda in recent years “(WHO, 2006: 98 see also Scott, Whelan, Dewdney and Zwi, 2004; Capdevila, 2007). More specifically, it appears that “nurses and midwives trained in sub-Saharan Africa, [who are] working in OECD countries represent 5% of the current workforce…” (WHO, 2006: 99). This migration significantly impacts on the shortage of healthcare workers in general, as well as nurses specifically. In South Africa –and other African states- the flight of nurses and doctors has long been a source of concern for the government (Deane & Hobbs, 2004). It is estimated that over 23 000 South African health-care professionals work in Australia, Canada, New Zealand, the United States of America and the United Kingdom (Financial Mail, 2007 Sunday Times, 2007; Health Systems Trust, 2005). Amid them are more than 5 000 South African nurses who were employed abroad in 2006 (Zvomuya, 2007)
Importantly, the in/out migration of healthcare workers, impacts on the management of HIV/AIDS, and is crippling and severely undermining Africa’s response to its biggest health challenge (HIV/AIDS) (Shacinda, 2004; HIV-Aids, 25 May 2007). Stephen Lewis, UN Special envoy on AIDS in Africa, asserts that “the shortage of nurses is a result of two factors: the virus itself and poaching by

53
the western world…The majority are going to the U.K., which is one of the most persistent countries engaging in this practice” (International Nurses’ Forum, 2006: 4).
The debate around globalization and its impact on the management of HIV/AIDS, postulates that it impacts countries’ ability to respond to the treatment and management of the epidemic through the ease of migration of healthcare workers. Shacinda (2004) states that it is “morally wrong for developed nations to provide ARV’s to Africa and then take away the doctors who should be administering the same drugs”. There are however, more recent efforts to curb or manage this loss of skills as, South Africa for example, “has an agreement with Britain aimed at putting the brakes on emigration of trained medical staff” (Shacinda, 2004). Leonard Rubenstein, Executive Director of Physicians for Human Rights notes, this drain is occuring “at a time when the plan that the WHO adopted calls for massive increases in the health workforce, in some cases tripling, in some cases even quadrupling workforces” (Hirschler, 24 July 2004). There are a variety of reasons underpinning the emigration of nurses from South Africa to other countries, and the WHO recognizes that “a better life and livelihood are at the root of decisions to migrate (2006:99). Prominent stakeholders in the field are of the opinion that many health care workers “are migrating because they are overstressed and undervalued” (International Nurses’ Forum, 2006: 6) and low salaries are often cited as the primary reason that nurses sought work overseas (Zelnick, 2005). Piliso (2007) also asserts that health professionals are flooding the foreign market because of poor working conditions, including a lack of resources and equipment to provide quality healthcare, and relatively poor salaries. A study conducted by the World Health Organization in six countries including South Africa, found that nurses and a large majority of our health professionals migrated because they needed international exposure and experience (DoH, 2004). See figure below.
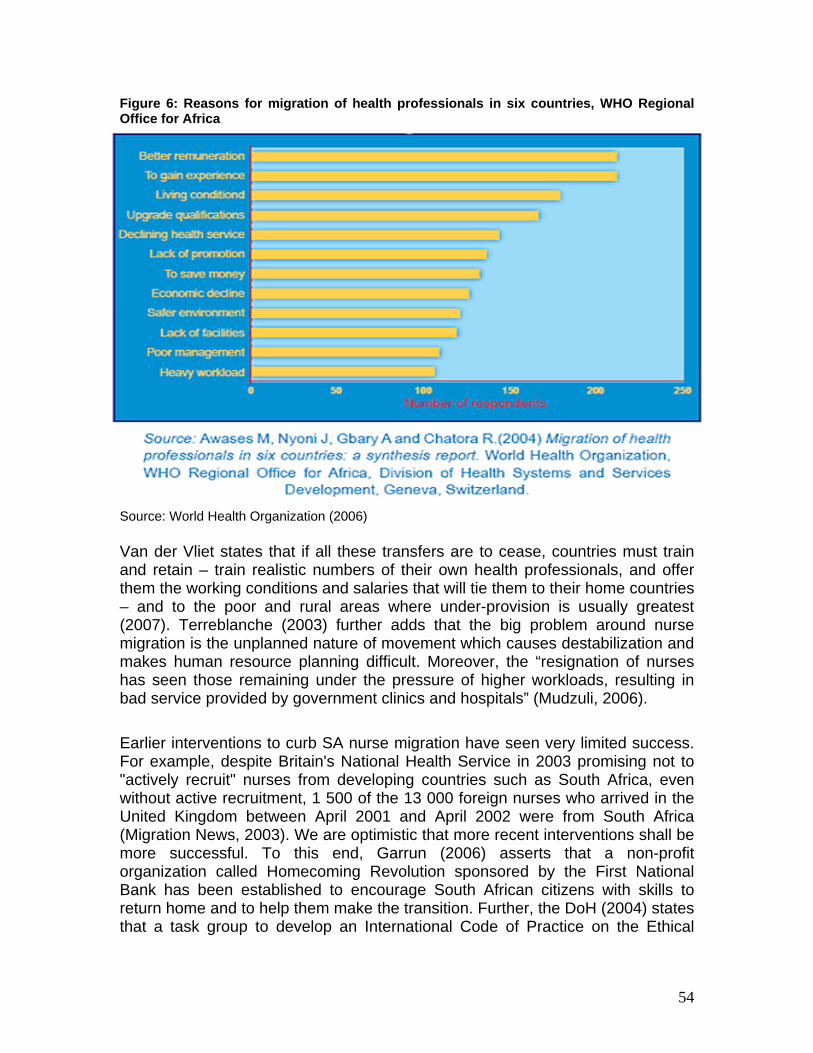
54
Figure 6: Reasons for migration of health professionals in six countries, WHO Regional Office for Africa Source: World Health Organization (2006) Van der Vliet states that if all these transfers are to cease, countries must train and retain – train realistic numbers of their own health professionals, and offer them the working conditions and salaries that will tie them to their home countries – and to the poor and rural areas where under-provision is usually greatest (2007). Terreblanche (2003) further adds that the big problem around nurse migration is the unplanned nature of movement which causes destabilization and makes human resource planning difficult. Moreover, the “resignation of nurses has seen those remaining under the pressure of higher workloads, resulting in bad service provided by government clinics and hospitals” (Mudzuli, 2006). Earlier interventions to curb SA nurse migration have seen very limited success. For example, despite Britain's National Health Service in 2003 promising not to "actively recruit" nurses from developing countries such as South Africa, even without active recruitment, 1 500 of the 13 000 foreign nurses who arrived in the United Kingdom between April 2001 and April 2002 were from South Africa (Migration News, 2003). We are optimistic that more recent interventions shall be more successful. To this end, Garrun (2006) asserts that a non-profit organization called Homecoming Revolution sponsored by the First National Bank has been established to encourage South African citizens with skills to return home and to help them make the transition. Further, the DoH (2004) states that a task group to develop an International Code of Practice on the Ethical

55
Recruitment of Health Workers was established at the World Health Assembly and both South Africa and the United Kingdom participated in this task team. Amidst the clearly recognized negative impact of health care worker migration on the home country healthcare system as well as the remaining workforce, let us see what the available nurse emigration statistics suggest around its extent in South Africa. Table 32 presents the WHO figures on nurse and midwives’ migration to OECD countries. This estimates that 7 per cent of the SA total nurses and midwives country workforce is working in the relevant OECD countries. Table 35: Nurses and midwives trained in sub-Saharan Africa working in OECD countries
Nurses and midwives working in seven OECD recipient countries4
Source country
Total nurses and midwives working in
home country Number % of home country
workforce Angola 13627 105 1%Botswana 7747 572 7%Cameroon 26032 84 0%Ethiopia 20763 195 1%Ghana 17322 2267 13%Guinea-Bissau 3203 30 1%Kenya 37113 1213 3%Lesotho 1123 200 18%Malawi 11022 453 4%Mauritius 4438 781 18%Mozambique 6183 34 1%Namibia 6145 54 1%Nigeria 210306 5375 3%South Africa 184459 13496 7%Swaziland 4590 299 7%Uganda 17472 21 0%Tanzania 13292 37 0%Zambia 22010 1198 5%Zimbabwe 9357 3183 34%Total 616204 29597 5%
Source: Table adapted from WHO World Health Report 2006, page 10.
Table 36 presents only the figures of approved European work permits for SA nurses. It shows that for the period, South African nurses comprise roughly 22 per cent of total European country work permits approved. Interestingly though,
4 Recipient countries: Canada, Denmark, Finland, Ireland, Portugal, United Kingdom, United States of America.

56
these figures show a decline in emigration of nurses to European countries, a -12 per cent average annual decrease.
Source: UK Home Office (2006) Table 37 presents the official migration statistics of SANC. This figure is markedly lower than the figures suggested by the WHO World Health Report 2006. Bearing in mind though, that the 2005 SANC figure, will be an under representation, because it only illustrates verifications up until April. We evaluate below the official SANC data on emigration of nurses, to get an indication of the yearly proportion of SA nurses that have requested verification of their qualifications, while residing in other countries. Table 37: Requests for verification of qualification and transcripts of training by South African nurses residing in other countries - (2001-2005)5
Year of request Country of request 2001 2002 20036 2004 20057 Total
Australia 430 461 467 347 136 1841Canada 87 38 108 27 10 270Ireland 253 528 109 32 5 927Namibia 28 - 17 8 7 60New Zealand 237 161 156 57 18 629United Arab Emirates 41 10 55 10 2 118United Kingdom 2567 2336 2790 1746 379 9818United states of America 267 420 360 163 67 1277Other Countries 28 48 49 21 14 160Yearly Total 3938 4002 4096 2411 653 15100Num on register 172338 172869 177721 184459 191269 -% of total num of nurses on SANC register 2.3 2.3 2.3 1.3 0.3 -Source: SANC (2007) The trends in this table are in line with those suggested by Hall & Erasmus in 2003, where they estimate the “the exodus of nurses will continue at an annual
5 According to SANC (2007) the above figures indicate the number of persons who have requested that verification of qualifications and/or transcripts of training be sent to the countries indicated only and nothing else. However, nurses are not required to notify the SANC if they do leave the country. Therefore, the fact that a nurse had requested verification be sent does not necessarily mean that she/he has taken up the offer of a [nursing] position in another country. 6The total also includes 15 verifications from the Arabian Gulf. 7 The total consists of verifications from January to April 2005 only.
Table 36: Number of approved European work permits for South African nurses
Occupation 2000 % of total 2001
% of total 2002
% of total 2003
% of total 2004
% of total 2005
% of total Total
% of total
Dental Nurse 0 0% 8 0% 11 0% 6 0% 9 0% 6 0% 40 0%Nurse 1146 26% 1468 20% 1697 21% 1504 24% 1244 22% 616 17% 7675 22%Total work permits approved 4435 100% 7406 100% 7959 100% 6245 100% 5613 100% 3671 100% 35329 100%

57
rate of between 1 and 2 per cent” (2003: 542). This table would then suggest that although nursing migration has decreased, the annual loss is still between 1 and 2 per cent of SA nursing workforce. The cumulative loss between 2001 and 2005, based on the above figures, is then about 8%, which is in line with the World Health Report’s estimation that about 7% of SA nurses and midwives are working in OECD countries (WHO World Health Report, 2006). These three tables (35 – 37) point to the many different migration data which is used in the estimation of shortages, and thus again indicates why there are many different views on the extent of shortages. Let us look at a few of the initiatives government has put in place in an effort to address or alleviate shortages in the short, medium and long term.
Existing initiatives Following above discussions, it becomes evident the myriad of factors related to the nursing profession, which interact to impact on the perceived as well as real shortages. Let us evaluate the policy and industry initiatives put in place in an effort to address these shortages. This is important for three reasons; 1) to assess what types of nursing shortage they are aimed at addressing, 2) whether the programmes put in place corresponds to the shortages identified by various stakeholders in the field, and 3) whether the programmes are integrated. There are three broad avenues available for addressing shortages, these can be aimed at influencing education and training, altering staffing, and working conditions for nurses (Pindus et al, 2002). In the absence of, or slow progress of some government initiatives, the health industry itself has come to the table, and thus the examples below are a mixture of both government, and industry led initiatives. Short term initiatives • Importing skills: For instance, private hospital group (Mediclinic), is recruiting
professional nurses from India, most specifically to work in its Western Cape intensive care unit wards, where they allege the shortage to be most critical (Thom, 2007). These nurses were expected to arrive in August, and to stay for at least three years to temporarily relieve the shortage of SA nurses. They hold that this is a short term solution to the nursing shortage experienced in specific nursing areas. Outlookmoney (2007) confirms this and states that the country's leading private hospital groups, Netcare and Medi-Clinic, have embarked on a programme to recruit about 700 Indian nurses over the next few years because they are "highly-skilled and hardworking".
• Using retired nurses: This strategy is often used by many governments at various points in time, to present short term relief for staff shortages, and has

58
most recently been utilized in SA during the public sector strike to alleviate nursing shortages, especially in KZN (Cullinan, 2007). Also in 2004, retired nurses were called back to the profession “to come and relieve the shortage in the health facilities” (Nyansula, 2004). Apart from bringing back to the health system the wealth of knowledge and expertise that they gained during their nursing careers, they also assist in providing support and mentorship, especially to nursing students and nurses who are entering the field “to restore, instill and bring back the culture of ethics and compassion to the profession” (DoH, 2006).
Medium term initiatives The more medium term strategies focus on alleviating the pressure felt by nurses, or trying to better their working conditions or livelihood in an effort to retain the current nursing corps, as well as to attract new nurses by making the profession more appealing. For instance; • Repatriation, recruitment and retention initiatives. For example, the WHO
launched a programme, Treat, Train, Retain, in an effort to increase the number of medical workers in the sub-Saharan Africa and give them better resources to fight HIV/AIDS (Mail & Guardian, 16 August 2006). Another method is the use of retention bonuses. In an effort to retain staff, Medi-clinic has initiated retention bonuses, and has reported positive results thus far, which has seen it lose less staff to its competitors (Thom, 2007). Another retention strategy is to limit the overseas recruitment of nurses. As seen in the British Guidelines on the International Nursing Recruitment, it is expressly asserted that employers should “avoid poaching nurses from South Africa and the Caribbean” (International Council of Nurses website, 2007).
• Emphasizing critical thinking. This is not expressly a retainment strategy, but indirectly impacts on the propensity of retainment. Nurses are trained to innovatively deal with the reality of resource constrained working environments in the SA public service. By training individuals to be prepared and creative in these situations, we are presented with a better likelihood of retaining them. This strategy recognizes the importance of acquiring generic skills, as discussed in the beginning of the report.
• In 2004 the government introduced a Scarce Skills Allowance to act as an incentive for nurses to specialize, and to obtain more nurses in particular specialty fields. It “applies to 62 000 full-time health professionals in specified categories regardless of the geographic area in which they work. The categories include medical officers, dentists, medical and dental specialists, pharmacists, radiographers, various types of therapist and nurses specialising in the areas of operating theatre technique, critical or intensive care and oncology. The allowances range from 10 per cent to 15 per cent of annual salary, depending on occupational category” (DoH, 2004)

59
• The Rural Skills Allowance was instituted as a way in which to attract more nurses to the rural areas, providing them with higher remuneration as compensation for working in often remote rural communities. The allowances range from 8 per cent to 22 per cent of annual salary, depending on area and occupational category. (DoH, 2004) The combination of the allowances is aimed at addressing the dual inequity in the distribution of health professionals -- between the private and public sectors and between rural and urban areas. Further, they “apply much more widely than previous allowances, covering more rural areas and for the first time acknowledging the critical role of professional nurses in such areas” (DoH, 2004) The rural allowances that apply to 33 000 full-time health professionals, including professional nurses, working in designated areas (DoH, 2004). Dovlo (2005) recognizes the institution of the community service and bonding schemes as a way to retain nurses.
• The recently instituted Occupation Specific Dispensation (OSD) presents a way in which to incorporate all the different salary strategies, providing a comprehensive and competitive remuneration structure. This is envisaged to act as incentive for choosing nursing as a profession, as well as to provide better career and salary advancement opportunities for current nurses.
• Funding to increase salaries. Cohen (2007) recommends that an emergency approach needs to be taken to deal with the shortage of health human resources needed to manage HIV/AIDS in Africa, advocating that funding agencies should disburse funds to strengthen the health workforce so that patients are not left without the urgent medical care they need.
Long term initiatives Long term initiatives are focused more at addressing supply side deficiencies contributing to shortages. These are a few of those recognized in SA; • Increased training and focus on primary health care. There have been
numerous attempts by provincial departments of health and the private sector across the country to augment the nursing learner cohorts as a way to increase nursing output and ultimately address the shortage of nurses. The Eastern Cape Health department, for instance, has set aside R170 million to train more nurses and improve health service in public hospitals. It is further reported that in 2005, the EC provincial health department allocated more than R3 000 a month to each of the 450 matriculants expected to receive nursing training for four years at one Lilitha Nursing College (Nofemele, 2005). Realizing that both the public and private sectors need a collective effort to train and retain nurses, Network Healthcare Holdings increased its nurses’ training budget in 2007 by 49 per cent from R36, 5 to R59 million (Netcare, 2007). Another private hospital, Life Healthcare, has increased its training activities demonstrably over the past four to five years, rising from 297 students in 1999 to 2154 in 2003 (HASA, 2006).
60
• Also, a public-private partnership has been formed between Afrox Healthcare and the Gauteng Department of Health, with the introduction of a neonatal ICU nurse training programme in 2003 (HASA, 20003). The six months certificate programme, that has the rationale to work together “for a sustainable solution to a critical need” (HASAS, 2003), was accredited by the SANC.
• Bursaries: As a way in which to train more nurses, government has also instituted bursaries to attract more individuals into the profession. For instance, in order to improve the quality of health care for everyone in the Western Cape, the DOH has committed itself to a long term strategic plan called Healthcare 2010. This plan aims to reshape public health services in the Western Cape to focus on primary-level services, community-based care and preventative care. The Provincial Government of the Western Cape (PGWC) has estimated a deficit of a 1 000 nurses in the health services. In order to meet this crisis PGWC decided that it would offer bursaries, each worth R24 000 (in 2004 values) to UWC for a four-year degree programme in nurse training, in addition to bursaries for students registering at WCCN. The aim is to provide up to 1 000 bursaries for all categories of nurse training over the next few years. (UWC website as well as PGWC website)
• Increasing training capacity: Not only are there initiatives to increase training at education institutions, but there was a review of nursing colleges with the national department of health deciding to re-open the colleges as they realized the need for more nursing staff in the country (Citizen, 2006).
Although this is not a complete and comprehensive account of all the initiatives put in place to ameliorate nursing shortages, the majority seem to be concentrated in the medium to long term strategies. This leads the author to assert that both government and industry clearly identifies nursing shortages, and their response to these shortages suggests that they have identified both instances of relative scarcity (as seen in the recruitment and retention strategies, and increasing pay scales), as well as identifying absolute scarcity (as seen in the initiatives to increase education and training levels, and adjustments to migration policy). We have considered the initiatives put in place to address nursing shortages in SA, and have tried to address the first question posed, in relation to which types of shortages these initiatives are aimed at alleviating. Let us now in the concluding section evaluate the remaining two questions; whether the programmes put in place corresponds to the shortages identified by various stakeholders in the field, and whether the programmes are integrated.

61
7. SUMMATIVE REMARKS AND RECOMMENDATIONS FOR THE FUTURE Summative remarks Let us briefly pull together what the various indicators on shortage have suggested throughout this paper. The most prominent indicators of shortage have been established in this report as; • Desired level of health worker coverage 80 per cent: The Joint Learning
Initiative (JLI) suggests that the minimum level of health worker coverage should be 80 per cent. This measure is based on an estimation of the availability of health workers required to achieve a package of essential health interventions and the Millennium Development Goals. In the World Health Report 2006, WHO identifies Sub-Saharan Africa as having a critical shortage of health professionals (counting only doctors, nurses and midwives), and an increase of almost 140 per cent is needed to meet the threshold (refer to page 9).
• 80 per cent fill rate: In the section discussing vacancy rates, drawing on the methodology of a NZ survey of employers, the fill rate is regarded as a key indicator of skills shortage. The survey asserts that occupations with fill rates lower than 80 per cent are regarded as experiencing shortage. In analysis of the vacancy data available to us, it is clear that measured against this indicator, we would be seen as experiencing a shortage of nurses. A below 80 per cent fill rate was recorded at every minor group level of occupations in the Health Professions. The fill rate for Midwifery and Nursing Professionals was 56,43 per cent, and thus in terms of the New Zealand DoL study, this does indicate a definite shortage.
• Aging workforce: In analysis of the age distribution of the South African workforce, it is evident that we have an aging nursing workforce. Our highest concentration of nurses are between 40 – 49, amounting to 32,8 per cent of our nurses, and our <25 nurses only comprise 1.3 per cent of our total workforce, illustrating the small amount of young nurses entering the profession. This could indicate a situation of absolute scarcity, where replacement demand cannot be met due to the fact that there are no people enrolled or engaged in the process of acquiring skills that need to be replaced. Further, nurses are entering and practising the profession mostly at auxiliary level, and this trend persists in the 25 – 29, and 30 - 34 groups. This is a second indicator of absolute scarcity in the lack of skilled people at certain skills levels, indicating an impending nursing crisis.
• WHO minimum norm: The only positive indicator, according to the minimum norm of 200 nurses per 100 000 population, as set by the WHO, we have enough nurses (336: 100 000 in 2005). Although, one should be careful to employ this norm across all provinces and areas in SA, as these vary immensely between each other, and adequacy in absolute numbers, may

62
disguise inadequate supply of nurses in critical nursing specialties, as well as disparities in the public/private distribution.
If evaluated against the above indicators, two out of these four would indicate a nursing shortage in South Africa. However, the last indicator, although suggesting a sufficient supply of nurses in absolute numbers, does not address whether this supply is adequate across all levels and specialties of nursing based on the different healthcare needs within different areas in SA. It is indeed difficult to assert whether nursing shortages exist in the SA healthcare system. We seem to have two major problems, attrition between graduation and registration, and then further attrition between nurses on the register and those active in the workforce. We do not seem to be experiencing shortages in supply, as our higher output indicates, but the immense attrition between graduation and registration is problematic. Further, given this attrition, as well as taking into account the further attrition occurring between registration on the roll of nurses and being active in the workforce, we still seem to have enough nurses in absolute terms. Recommendations Realising that both government and industry have clearly identified a shortage of nurses, and the former has tried to quantify that need based on the health context of SA, let us now consider the two questions posed earlier. We do this to present recommendations for the future in an effort to more accurately identify nursing shortages so that the initiatives put in place not only correctly addresses these shortages, but they are in congruence with each other. Initiatives should correspond to correctly identified shortages In evaluating the different stakeholder claims of shortages and their different estimations around the need for nurses, its clear that shortages have been identified and quantified at all levels of nursing, with some concentrating more on the specific need of Registered Nurses. From a scan of some of the initiatives in place, there seems to be a focus on more long term solutions to shortage, with an emphasis on training and providing more capital investment into the training and education of nurses, more appropriate to instances of absolute shortages. Thus to a certain extent, there seems to be a disjuncture between the identification of shortages and the policies put in place to address them. To the credit of the SA government, the identification of shortages has increasingly become more specific and quantified, but government initiatives seem to be concentrating on long term responses, which focus largely on increased training. The authors are not convinced that our nursing shortage is an issue of problematic supply, and thus questions an emphasis on increased training. Again we ask, if we need more nurses at certain levels and specialties, in certain provinces, and in a certain health care sector, should the policy response not expressly be focused at a national level on retainment, with short and long term

63
initiatives being secondary? If there is an identification of the priority of medium-term initiatives, this should filter through more effectively to HRH policy plans at provincial level. It is not clear that national government has identified medium term initiatives as its focus in trying to ameliorate the impact of nursing shortages caused by maldistribution. We recommend that a more concerted response is needed. We agree with the current situation where initiatives spanning the entire spectrum from short, medium to long term responses are in place for a comprehensive response to the different types of nursing shortages experienced in our country. But, without a clear identification of which types of initiatives should take precedence, this could lead to haphazard implementation of strategies without a clear focus of the particular needs of our country as a whole. The National Health System does undertake to plan and develop human capital strategies linked to the needs of the recipient communities (HRH Plan, 2006). In an effort to achieve this, the plan advocates for a Nursing Strategy for SA, and identify the following urgent needs; • Improved remuneration of nurses • Improved conditions of service • Increased production • Review of nursing qualifications • Review of scopes of practice This is not satisfactory, as the above does not clearly identify maldistibution of nurses as severely impacting on the nursing shortages experienced. The most pressing problem, according to the authors, is the issue of maldistribution of nurses between provinces, rural and urban areas, and between the public and private sectors. We thus recommend that strategies and initiatives aimed at ameliorating the impact of nursing shortages should be concentrating firstly, on retention of the nurses we are producing, secondly, on recruiting nurses now practicing in other fields, back into the profession, and lastly, on identifying specific provinces and areas with shortages, as well as whether the shortages in provinces are in the public or private sectors. This could better ensure that redistribution strategies and incentives are more focused and effective, because it is developed to respond to specifically identified nursing needs. There should be congruence between the different strategies Of course there will be various assertions and different estimations around nursing shortages and the extent of that shortage. But in evaluation of the policy initiatives in place to address the identified shortages, one does not expect there to be large discrepancies. Looking at the relevant reports we find, firstly, definite differences in the shortage estimations, as shown in the beginning of this report. Secondly, there are different needs estimations at different nursing categories, and lastly the one

64
document does not take into account the additional needs estimated by the other. For instance, as indicated earlier, a clear lack of the HRH Plan is that it does not take into account the additional HRH needs brought about by the impact of HIV/AIDS, even though it clearly recognizes the importance of developing needs estimations based on the changing disease burden in different communities of SA. Further, the Department of Health’s HIV and AIDS and STI Strategic Plan 2007 – 2011, to its credit does recognize the shortage of HR as a critical challenge in the health sector, and advocates the need to audit what is currently available. But it does not do this in a concerted manner, with scattered references throughout the document which does not recognize the critical importance of HRH to address the HIV/AIDS epidemic. Further, there seems to be no attempt to quantify the human resources needed. The HRH Plan is severely lacking, in that it clearly disregards the impact of HIV/AIDS on the HRH, only noting exposure to HIV/AIDS and other infectious diseases as a difficulty experienced by human resources in the health sector. Further, in the research for this report, we experienced a serious dearth in independent quantitative survey research to more accurately profile the skills needs and demands in the nursing profession necessary to estimate relevant skills gaps. Although providing some information around skills supply and demand, the author is not satisfied that the relevant sector SETA has fulfilled its mandate in this regard. We recommend that there be a greater congruence between the estimations of shortage as well as between the different strategies suggested to alleviate shortages. Moreover, and lastly, in an effort to more appropriately and effectively address the nursing shortage in SA, it is imperative that shortages be correctly identified at all nursing levels, as well as in specific sectors, so that the strategies put in place to address the shortages, take into consideration the unique health context of South Africa.

65
References Africa’s Nursing shortage. Financial Mail. 20 April 2007. Aids is reversing all SA’s health gains. Cape Times. Page 5. May 29, 2004. <http://www.iol.co.za> (Accessed 9 July 2007). Aids treatment needs to expand dramatically. Mail & Guardian online. 13 June 2006. <http://www.mg.co.za> (Accessed 9 July 2007). Aids workers support SA nurses strike. SOS News. 13 June 2007. <http://www.soschildrensvillages.org.uk> (Accessed 27 June 2007). Ayisi, R.A. (2006) Nurses to the fore in battle against Aids. Mail & Guardian online. 4 April 2006. <http://www.mg.co.za> (Accessed 9 July 2007). Belot, S. (2004) The speech of the Free State MEC for Health. Nursing Summit, 29 November. Bloemfontein. Benjamin, C. (2006) Public-private partnerships to train nurses considered. Bussiness Day, October 04. Beresford, D. (2007) South African Editor fears arrest for minister claims. The Guardian, October 15. Better working conditions for nurses might decrease the infection for patients. Nursing profession news. <http:www.Medindia.com> (Accessed 24 May 2007). Breier, B. (2007) The shortage of medical doctors in South Africa. Draft case study report forming part of the HSRC study: A multiple source identification and verification of scarce and critical skills in the South African labour market. Client report commissioned by the Department of Labour. Canadian Nurses Association (CAN) (2006) Nurses at the forefront of HIV/AIDS. Report: International Nurses’ Forum. August 2006. Toronto, Canada. Capdevila, G. (2007) Health: Brain Drain hits poor countries hard. Inter Press Service. http://ipsnews.net/news.asp?idnews=32627 (Accessed 07 November 2007).

66
Celebrate the noble profession of nursing. The Star. Page 3. May 11, 2005. <http://www.iol.co.za> (Accessed on 9 July 2007). Centre for HIV/AIDS Networking (HIVAN) Nurses’ HIV/AIDS preparedness initiative to be launched. IRIN Plus News. <http://www.hivan.org.za> (Accessed 9 July 2007). Cohen, R. (2007) Nursing blow in Aids fight. Mail & Guardian online. 27 March 2007. <http://www.mg.co.za> (Accessed 9 July 2007). Pearsall, J. (2001) Concise Oxford Dictionary (10th edition). Oxford University Press. Cullinan, K. (2006a) Aids programmes: Look beyond nurses and doctors. Mail & Guardian online. 14 June 2006. <http://www.mg.co.za> (Accessed 9 July 2007).
Cullinan, K. (2007) Recruiting retired nurses is ‘elderly abuse’. HealthE. 17 May 2007. <www.health-e.org.za> (Accessed 28 November 2007). Dal Poz, M.R., Quain, E.E., O’Neil, M., McCaffery, J., Elzinga, G. & Martineau, T. (2006) Addressing the health workforce crisis: towards a common approach. Human Resources for Health 4:21. August. Daniels, R. (2007) Skills shortage in South Africa: A literature review. DPRU Working paper 07/121. Development Policy Research Unit. May. Deane, N. & Hoobs, J. (2004). South Africa: Reversing the Medical Brain Drain. Inter Press Service. June 30, 2004. http://www.aegis.com (Accessed 12 November 2007). Democratic Nursing Organisation of South Africa (DENOSA) (2007a) Canada South Africa Nurses C-SAN HIV/AIDS Initiative. <http://www.denosa.org.za> (Accessed 9 July 2007). Democratic Nursing Organization of South Africa (DENOSA) (2007b). Achievements for Nurses in the current salary negotiations. <http://www.denosa.org.za/achivementForNurses.html> (Accessed 30 September 2007).

67
Department of Education (DoE) (2007) Strategic Plan 2007 – 2011. Republic of South Africa. Pretoria. Department of Health (DoH) (1999) Health sector strategic framework 1999 – 2004. Republic of South Africa. Pretoria. Department of Health (DoH) (2003) Operational plan for Comprehensive HIV and AIDS care, management and treatment for South Africa. 19 November. Republic of South Africa. Pretoria. Department of Health (DoH) (2004a) Substantial allowances ready to roll for health professionals. 28 January 2004. www.doh.gov.za (Accessed 28 November 2007). Department of Health (2004b) Conference on Health in the Rural Nodes. <http://www.doh.gov.za/docs/sp/2004/sp0921.html> (Accessed 28 November 2007). Department of Health (DoH) (2006a) National Human Resources for Health Planning Framework. Republic of South Africa. Pretoria. Department of Health (DoH) (2006b) KwaZulu Natal Department of Health sends SOS call to retired nurse. <http://www.kznhealth.gov.za> (Accessed 28 November 2007). Department of Health (DoH) (2007a) Occupation Specific Dispensation (OSD). Republic of South Africa. Pretoria. Department of Health (DoH) (2007b). Signing of a Collective Agreement on Occupational Specific Dispensation (OSD) for Nurses. Centurion. September 14 2007. <http://www.info.gov.za/speeches> (Accessed18 September 2007). Department of Health (DoH) (2007c) Occupation Specific Dispensation (OSD) in the Public Service. 12 June 2007. Department of Health (DoH) (2007d) HIV and AIDS and STI Strategic Plan for South Africa, 2007 – 2011. Unveiled at the National Consultation Conference. 14 March.

68
Department of Labour (DoL) (2006a) The National Scarce Skills List (ASGISA aligned). Republic of South Africa. Pretoria. Department of Labour (DoL) (2006b) Master list of scarce and critical skills as at 8th August 2006. Republic of South Africa. Pretoria. Dibetle, M. (2006) Behind the scenes. Mail & Guardian. 31 August 2006. Dovlo, D. (2005) Migration of nurses from Sub-Saharan Africa – A review of issues and challenges. <http://www.academyhealth.org> (Accessed 28 November 2007). Erasmus, J. (2006) A multiple source identification and verification of scarce and critical skills in the South African labour market. Terms of reference for 12 occupational case studies. Erasmus, J. (2007) Vacancy analysis report. Compiled for the Department of Labour (DoL) study: A multiple source identification and verification of scarce and critical skills in the South African labour market. October. HSRC/DoL. Fraser-Moleketi, G. (2007) Press statement by the minister for Public Service and Administration. 4 May 2007. Garrun, T. (2006) South African ‘brain drain’ bring reversed. The Star. 06 September 2006. Grumbach, K.M., Ash, J.A, Seago, J.S. & Coffman, J. (2001) Measuring shortages of hospital nurses: How do you know a hospital with a nursing shortage when you see one? Medical Care Research and Review 58(4): 387 – 403. December. Hall, E. & Erasmus, J. (2003) Medical Practitioners and nurses. In: Human Resources Development Review 2003: 522 – 553. Human Sciences Research Council: HSRC Press. Pretoria. Hall, E. (nd) The challenges HIV/AIDS poses to nurses in their work environment. Employment and Economic Policy Research, HSRC. Pretoria.
69
Health and Welfare Sector Education and Training Authority (HWSETA) (2006) Draft Sector Skills Plan 2006 – 2009. 30 November. Healthcare workers Africa’s secret weapon. Independent Online. 14 June 2007. <http://www.iol.co.za> (Accessed 9 July 2007). Health professionals leave in droves. Sunday Times. 25 February 2007. Health Systems Trust (HST) (2007). Health Statistics. <http://www.hst.org.za/healthstats/index.php> (Accessed 27 October 2007). Hirschler, B. (2004) Africa’s ‘brain drain’ jeopardizes Aids fight. Independent Online. 15 July 2004. <http://www.iol.co.za> (Accessed 9 July 2007). Hlatshwayo, R. (2007) Jail for Stepmom: HIV injector gets 5 years. Sowetan 28 March 2007. Hospital Association of South Africa (HASA) (2003) Nurse Training Partnership. 8 December 2003. <http:www.hasa.co.za> (Accessed September 2007). Indian nurses in great demand in South Africa. Outlookmoney. http://www.outlookmoney.com (Accessed 28 November 2007). Insurance Sector Education and Training Authority (INSETA) Organising Framework for Occupations (OFO) <http:www.inseta.org.za> (Accessed 24 October 2007). International Council of Nurses (ICN) <http:www.icn.ch> (Accessed 9 July 2007). Kemp, E. (2006) Chance selection deprives South Africa of dedicated nurses. The Herald. 14 November 2006. Manto unveils plans to reopen nursing colleges. Citizen. 05 July 2007. McGrath, A. & McGrath, S. (2004) Nursing Skills and Knowledge. A proposal written for the Human Resources Development Research Programme of the Human Sciences Research Council.
70
Médecins Sans Frontières (MSF) (2007) Help wanted: Confronting the health care worker crisis to expand access to HIV/AIDS treatment. Johannesburg, May. Mgwigwi, M. (2007) Fort Hare and Partners launch HIV/Aids certificate. Fort Hare University News. <http://www.news.ufh.ac.za> (Accessed 9 July 2007). Migration News (2003). Migration News 10: 3. July 2003. <http:www.migration.ucdavis.edu> (Accessed 12 November 2007). More doctors, nurses needed in Aids fight. Mail and Guardian online. 16 August 2006. <http://www.mg.co.za> (Accessed 9 July 2007). More needed to win Aids war. News 24. 24 May 2007. <http://www.news24.com> (Accessed 9 July 2007). More pills will not help, says MSF. HIV-Aids. May 25, 2007. <http://www.iolhivaids.co.za> (Accessed 9 July 2007). Mudzuli, K. (2006) Nurses leaving at alarming rate. Citizen. 28 September 2006. Munshi. R (2005) Health Minister urges nurses to remain in South Africa. Health Systems Trust. <http:www.hst.org.za> (Accessed 24 September 2007). Musgrave, A. (2007) Nurses set to get better deal. The Weekender. 15 September 2007. National Skills Authority (NSA) (2007) Scarce and Critical Skills. Briefing paper. Commissioned by the Department of Labour (DoL) and the German Technical Co-operation (GTZ). Prepared by Umhlaba Skills Services. May. New Zealand Department of Labour (NZ DoL) (2005) Skills shortages in New Zealand: key findings from the Survey of Employers who have Recently Advertised 2005. <http://www.dol.govt.nz/PDFs/lmr- skills-may2006.pdf> (Accessed 23 August 2006). Ngcobo, M. (2007) Call to remove restriction on nursing practice. Health-e. 5 June 2007. <http://www.health-e.org.za> (Accessed 9 July 2007).

71
Njamela, Y. (2006) The Eastern Cape Exodus. Mail & Guardian. 31 August 2006. Nofemele, B. (2005) R170m boost for nurse’s training in Eastern Cape. The Herald. 13 May 2005. Nurturing Nursing Skills (2007) Network Healthcare Holdings. <http://www.fin24.co.za> (Accessed 28 November 2007). Nyansula, D (2004) Africa Losing Nurses to Britain - nutrition and care for PLWHA. http://www.afronets.org (Accessed 28 November 2007). Parker, B. (2006) Disabled patient raped. Witness. 31 October 2006. Pendukeni, M. (2004) The impact of HIV AIDS on health care provision: Perceptions of nurses currently working in one regional hospital in Namibia. A mini-thesis submitted in partial fulfillment of the requirements for the degree of Masters in Public Health in the School of Public Health, University of the Western Cape. November 2004. Pindus, N., Tilly, J. & Weinstein, S. (2002) Skills shortages and mismatches in nursing related health care employment. Report prepared for the U.S Department of Labour, Employment and Training Administration. April. The Urban Institute: Washington. Piliso, S (2007) Health professionals leave SA in droves. Sunday Times. 25 February 2007. F Provincial Government of the Western Cape (PGWC) <http:www.capegateway.gov.za> (Accessed 9 July 2007). Raisler, J. & Cohn, J. (2005) Mothers, Midwives, and HIV/AIDS in Sub-Saharan Africa. Journal of Midwifery & Women’s Health 50(4): 275 – 282. July/August 2005. Reyneke, D. (2006) Nurses insulted, abused mom in labour, court told. The Herald. 27 October 2006.

72
SADC Aids Network of Nurses and Midwives (SANNAM) (2001) Critical issues for SANNAM workshop. 15 November 2001. <http://www.sannam.org.za> (Accessed 9 July 2007). Secure the Future (2001) Secure the future to roll out HIV/AIDS nursing curriculum in SADC countries. Johannesburg South Africa, 13 November 2001. <http://www.securethefuture.com> (Accessed 9 July 2007). SA-UK Bilateral Forum Ministerial Meeting (2004) Marks Building, Parliament. Department of Health. 25 August. Scott, L., Whelan, A., Dewdney, J. & Zwi, B. (2004). Solving health workforce shortages with professionals from developing countries. The Medical Journal of Australia 180(4): 174-176. 6 January. Shacinda, S. (2004) Emigration of nurses cripples Aids fight. Independent Online. 10 November. <http://www.iol.co.za> (Accessed 9 July 2007). Shisana, O., Hall, E., Maluleke, K.R., Stoker, D.J., Schwabe, C., Colvin, M., Chauveau, J., Botha, C., Gumede, T., Fomundam, H., Shaikh, N., Rehle, T., Udjo, E. & Gisselquist, D. (2003) The impact of HIV/AIDS on the Health Sector: National survey of health personnel, ambulatory and hospitalized patients and health facilities, 2002. Report prepared for the South African Department of Health. Funded by the Department of health and the Centre for Disease Control. HSRC Publishers: Pretoria. Simoens, S., Villeneuve, M. & Hurst, J. (2005) Tackling nurse shortage in OECD Countries. Organisation for Economic Co-operation and Development (OECD) Health Working Papers no.19. Directorate for Employment, Labour and Social Affairs. Sookha, B. (2007) Chronic Shortage of health staff. Daily News. 01 February. South Africa: Some are less equal than others. Plus News – global HIV/AIDS news and analysis. <http://www.plusnews.org> (Accessed 9 July 2007). South African Nursing Council (SANC) (2007) <http://www.sanc.co.za>
73
South Africa to recruit Indian Nurses. Bio-Medicine http://www.bio-medicine.org (Accessed 28 November 2007). Subedar, H. (2005) Nursing Profession: Production of nurses and proposed scope of practice, In: The South African Health Review 2005. Health Systems Trust (HST). Pretoria. Subedar, H. (2006) Personal interview at the South African Nursing Council. Pretoria. November 2006. Terreblanche, C. (2003) Health Ministry Sets sights on agreement with UK to curb poaching of medical staff. Heath Systems Trust. <http:hst.org.za> (Accessed 5 November 2007). Terreblanche, C. (2004) ‘HIV cases overwhelm our state hospitals’. Independent Online. 30 January. <http://www.iol.co.za> (Accessed 9 July 2007). Thom, A. (2007) Private hospitals ‘import’ nurses from India. HealthE. 16 May 2007. www.health-e.org.za. (Accessed 28 November 2007). Tshabalala-Msimang, M. (1999). Speech by Dr Manto Tshabalala-Msimang, at the National Summit on Nursing. Department of Health. 27 August 1999. Tshabalal-Msimang, M. (2007) Speech at the occasion of health Minister and MEC meeting health sector unions. 5 July 2007. University of the Western Cape (UWC) (2007) www.uwc.ac.za (Acessed November 2007) Van der Vliet, V. (2007) Public Service Strike – and AIDS. AIDSAlert 276. 8 June 2007. <http://www.ever-fasternews.com> (Accessed 9 July 2007). Veneri, C.M. (1999) Can occupational labour shortages be identified using available data? Monthly Labour Review. Pages 15 - 21 March 1999. Wilson, R., Woolard, I. & Lee, D. (2004) Developing a National Skills Forecasting Tool for South Africa. Institute for Employment Research, University of Warwick. Coventry, UK. Human Sciences Research Council” Pretoria.

74
Woolard, I., Kneebone, P. & Lee, D. (2003) Forecasting the demand for scarce skills, 2001 – 2006. In Human Sciences Research Council. 2003. Human Resources Development Review 2003: Education, Employment and Skills in South Africa. Cape Town: HSRC Press and East Lansing: Michigan State University Press. World Health Organisation (WHO) (2006a) World Health Report 2006: Working together for health. WHO Press: Geneva, Switzerland. World Health Organization (WHO) (2006b). Migration of Health workers. http://www.who.int (Accessed 07 November 2007). Zelnick, J. (2005) The impact of the HIV/AIDS epidemic on hospital nurses in Kwazulu-Natal, South Africa: Nurses’ perspectives and implications for health policy. Journal of Public Health Policy 26: 163 – 185. Zvomuya. P. Pinky and the brain drain. Mail & Guardian. 3 – 9 August 2007.

75
Appendix
Graph 1.1: Gender distribution of nursing staff – occupational category Total
93%
7%
Female Male
Source: SANC (2007) Graph 1.2: Distribution of nursing staff - occupational category
51%
20%
29%
ProfessionalEnrolledAuxiliaries
Source: SANC (2007) Graph 2.1 Gender distribution of nursing staff - learner category
Total
84%
16%
Female Male
Source: SANC (2007)

76
Graph 2.2: Distribution of nursing staff – learner category
48%
30%
22%
StudentsPupilsPupil Auxiliaries
Source: SANC (2007) Graph 3: Racial distribution of nursing staff – occupational category
84%
10%
2%
4%
AfricanColouredIndianWhite
Source: SANC (2007) Graph 4: Age distribution of nursing staff – occupational category
0
5000
10000
15000
20000
25000
30000
35000
<25 25-29 30-34 35-39 40-44 45-49 50-54 55-59 60-64 65-69 >69
v
Source: SANC (2007)

77
Graph 5: Provincial distribution of nursing staff – occupational category
10%
6%
25%
23%
9%
5%
7%
2%
13%
Eastern Cape
Free StateGauteng
KwaZulu NatalLimpopo
MpumalangaNorth West
Northern CapeWestern Cape
Source: SANC (2007)


![wednesday5- Child malnutrition DTree International Zanzibar · The Problem • “[There is] an estimated shortage of almost 4.3 million doctors, midwives, nurses and support workers](https://img.pdfslide.net/doc/110x75/5f724dd26b9011092c5abfc9/wednesday5-child-malnutrition-dtree-international-zanzibar-the-problem-a-aoethere.jpg)