Embed Size (px)
Citation preview
Shortest Term Forecast System for PV Plants and Distribution Grids
Stefan C. Müller, Jan Remund
Meteotest, Switzerland
EU PVSEC 2013, Paris | Page 2 | October 1 2013
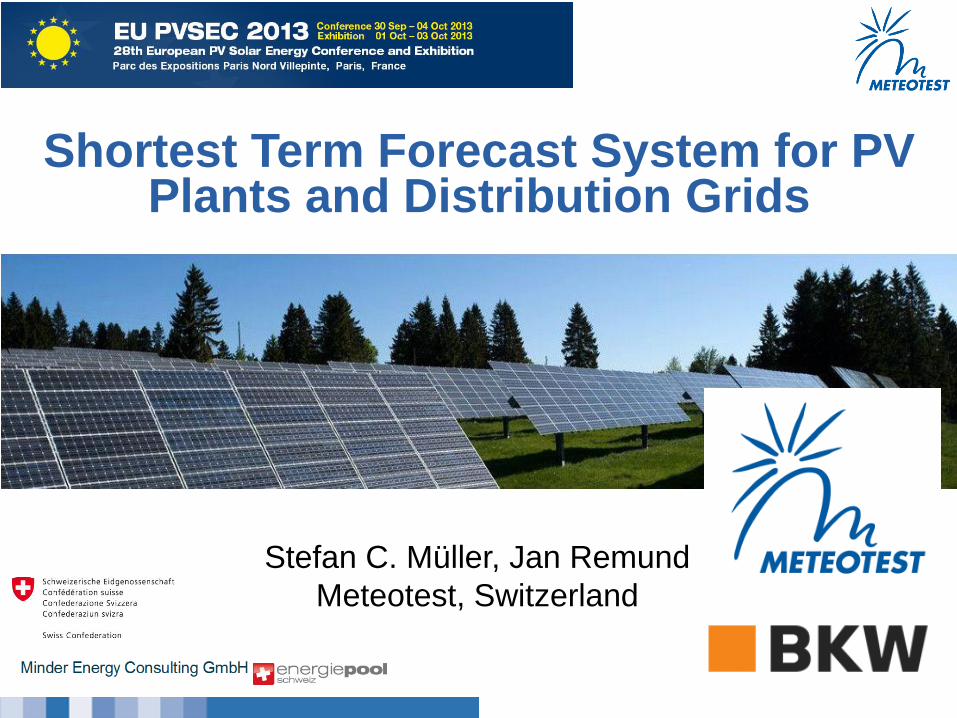
Outline
Project description: Shortest term solar forecasting
Presentation results
Case studies
Overall statistics
Conclusion

EU PVSEC 2013, Paris | Page 3 | October 1 2013
Why do we need forecasts
Management of power production,
delivery and storage
Stability of the grid
Energy trading
EU PVSEC 2013, Paris | Page 4 | October 1 2013
Project: Aim and idea
Aim: Improve solar forecasting between 0.5 and 6 hours (for intra day
trading and power and grid management) on a regional basis
Idea: Nowcasting method by a simple combination of available
weather data (satellite images and numerical weather prediction
model)
EU PVSEC 2013, Paris | Page 5 | October 1 2013
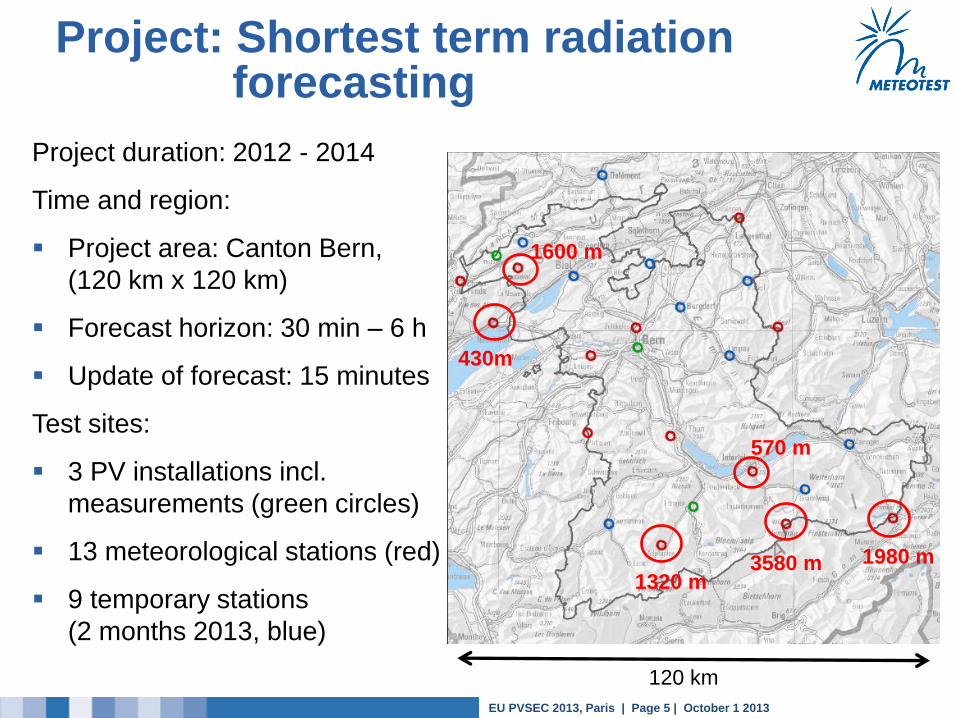
Project: Shortest term radiation forecasting
Project duration: 2012 - 2014
Time and region:
Project area: Canton Bern,
(120 km x 120 km)
Forecast horizon: 30 min – 6 h
Update of forecast: 15 minutes
Test sites:
3 PV installations incl.
measurements (green circles)
13 meteorological stations (red)
9 temporary stations
(2 months 2013, blue)
3580 m 1980 m
430m
1600 m
570 m
120 km
1320 m
EU PVSEC 2013, Paris | Page 6 | October 1 2013
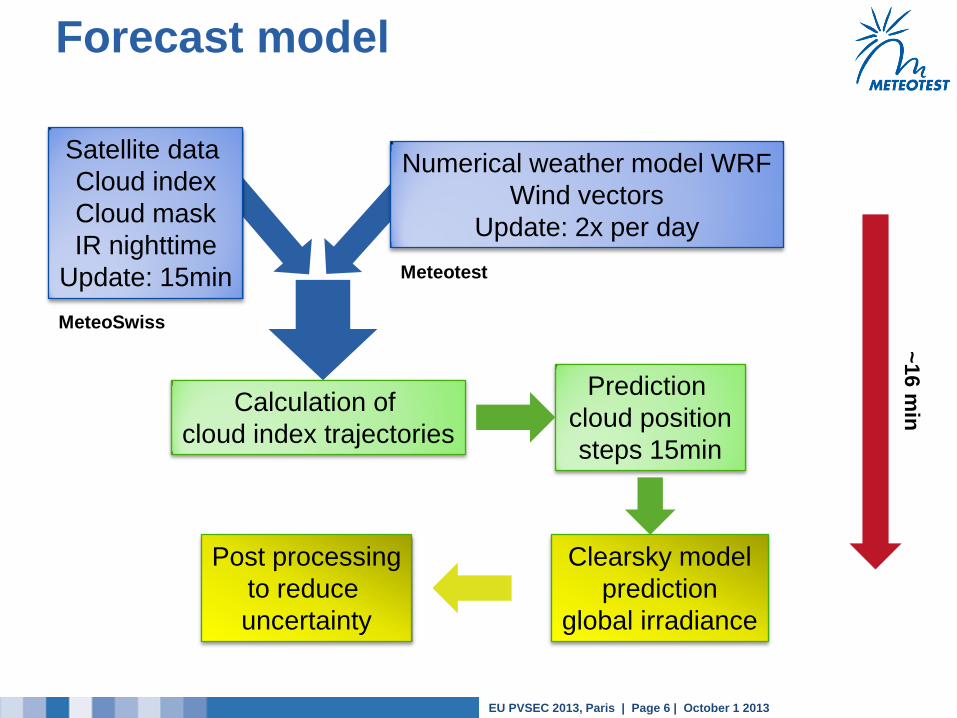
Forecast model
Satellite data
Cloud index
Cloud mask
IR nighttime
Update: 15min
Numerical weather model WRF
Wind vectors
Update: 2x per day
Prediction
cloud position
steps 15min
Clearsky model
prediction
global irradiance
Calculation of
cloud index trajectories
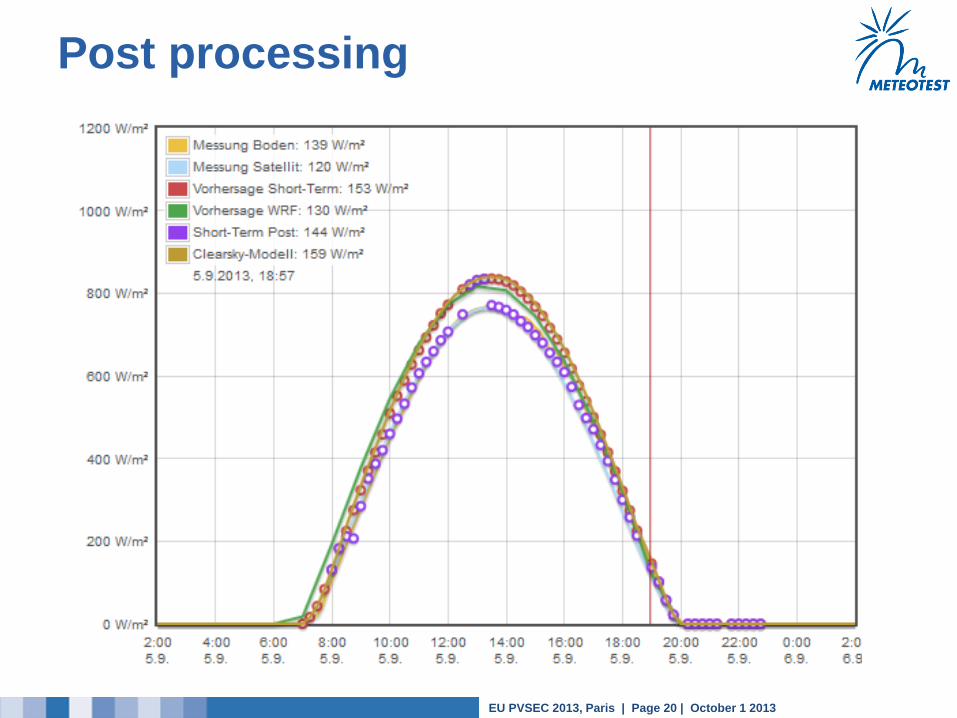
Post processing
to reduce
uncertainty
MeteoSwiss
Meteotest
~16
min
EU PVSEC 2013, Paris | Page 7 | October 1 2013
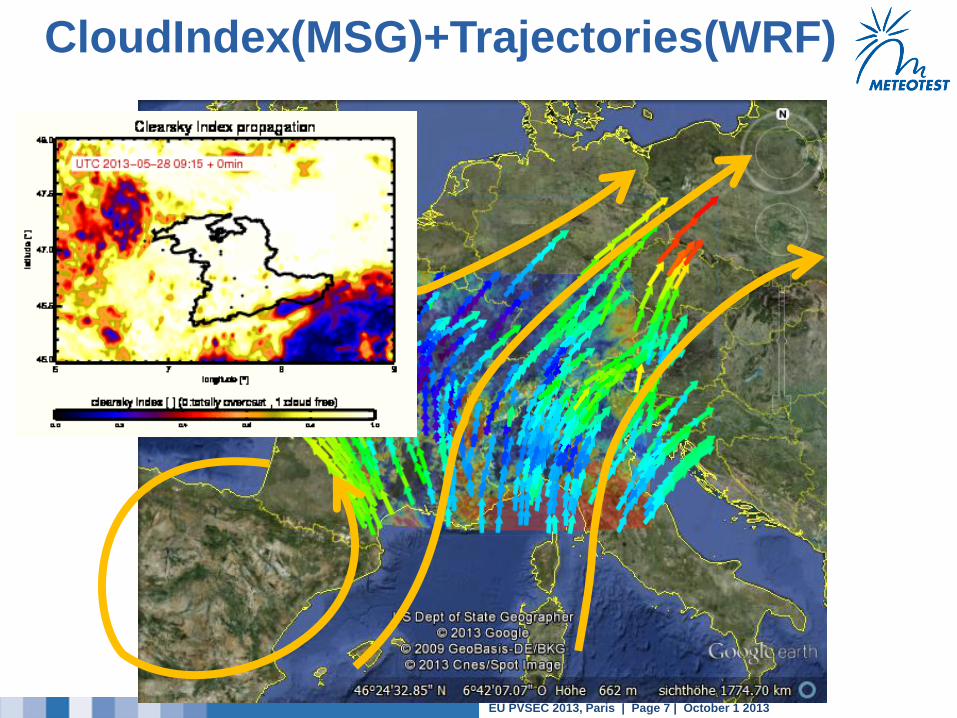
CloudIndex(MSG)+Trajectories(WRF)
EU PVSEC 2013, Paris | Page 8 | October 1 2013
Outline
Project description: Shortest term solar forecasting
Presentation results
Case studies
Overall statistics
Conclusion
EU PVSEC 2013, Paris | Page 9 | October 1 2013
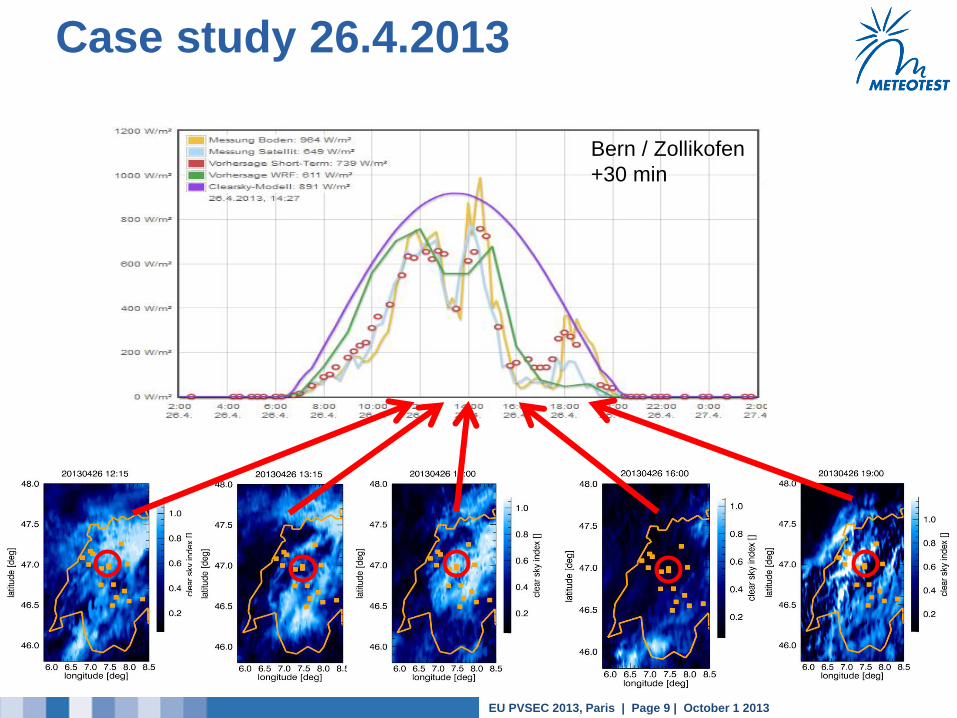
Case study 26.4.2013
Bern / Zollikofen
+30 min
EU PVSEC 2013, Paris | Page 10 | October 1 2013
Statistical parameters
Measures:
Reference: SwissMetNet Stations 10 min averages
BIAS / relative BIAS
RMSE / relative RMSE
Only daytime values (xx > 10 W/m2)
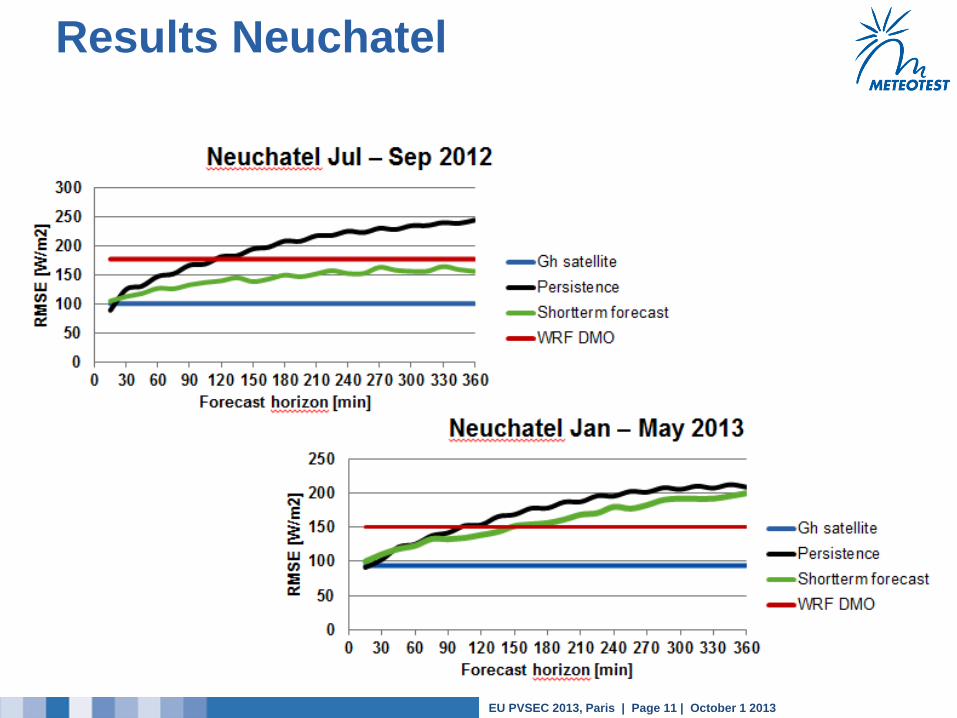
Forecast comparison to:
NWP WRF direct model output
Persistence forecast (constant clearness index)
Periods:
Jul – Sep 2012
Jan – May 2013
EU PVSEC 2013, Paris | Page 11 | October 1 2013
Results Neuchatel
EU PVSEC 2013, Paris | Page 12 | October 1 2013
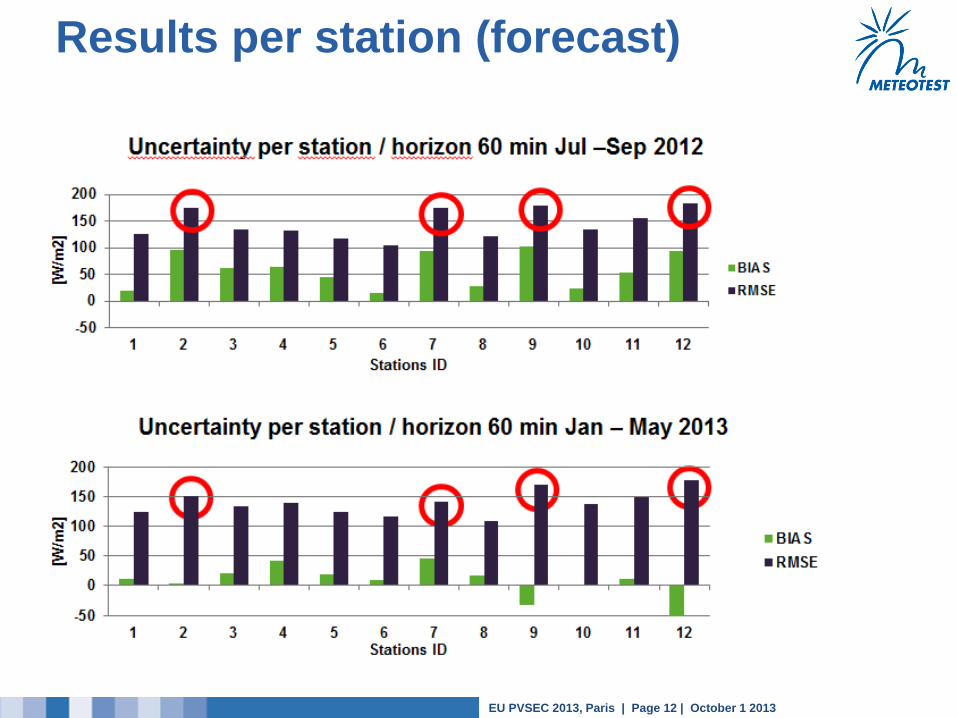
Results per station (forecast)
EU PVSEC 2013, Paris | Page 13 | October 1 2013
Outline
Project description: Shortest term solar forecasting
Presentation results
Case studies
Overall statistics
Conclusion
EU PVSEC 2013, Paris | Page 14 | October 1 2013
Conclusion
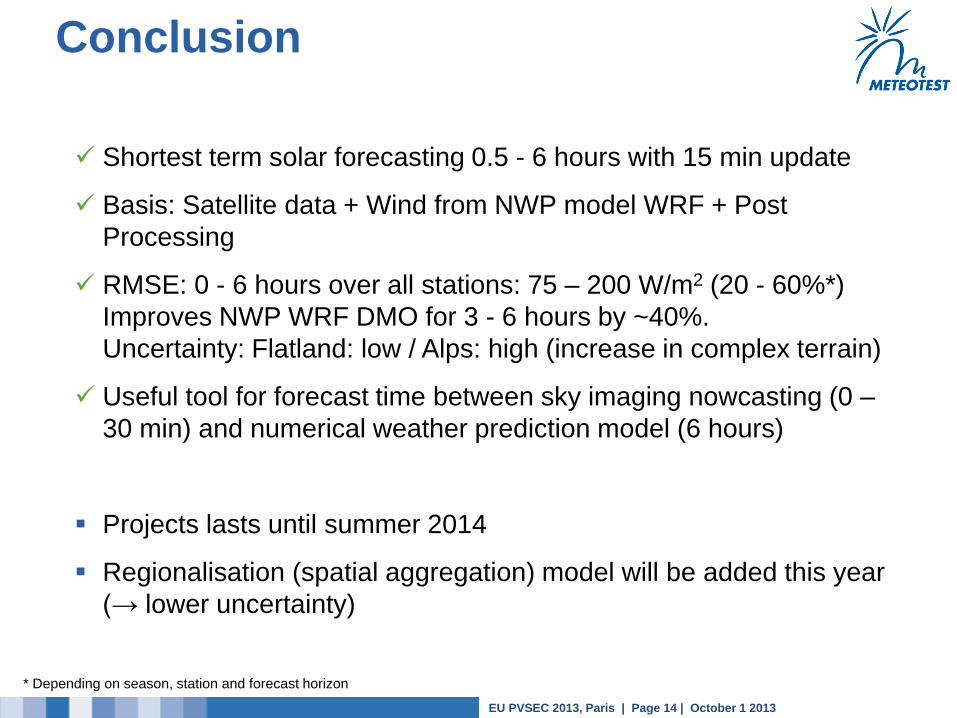
Shortest term solar forecasting 0.5 - 6 hours with 15 min update
Basis: Satellite data + Wind from NWP model WRF + Post
Processing
RMSE: 0 - 6 hours over all stations: 75 – 200 W/m2 (20 - 60%*)
Improves NWP WRF DMO for 3 - 6 hours by ~40%.
Uncertainty: Flatland: low / Alps: high (increase in complex terrain)
Useful tool for forecast time between sky imaging nowcasting (0 –
30 min) and numerical weather prediction model (6 hours)
Projects lasts until summer 2014
Regionalisation (spatial aggregation) model will be added this year
(→ lower uncertainty)
* Depending on season, station and forecast horizon
EU PVSEC 2013, Paris | Page 15 | October 1 2013
Thank you
Thank you for your attention!
Stefan Müller, Meteotest, [email protected]
Jan Remund, Meteotest, [email protected] METEOTEST Fabrikstrasse 14
CH-3012 Bern
www.meteotest.ch
solarforecast.meteotest.ch
EU PVSEC 2013, Paris | Page 16 | October 1 2013
Input 1: Satellite data
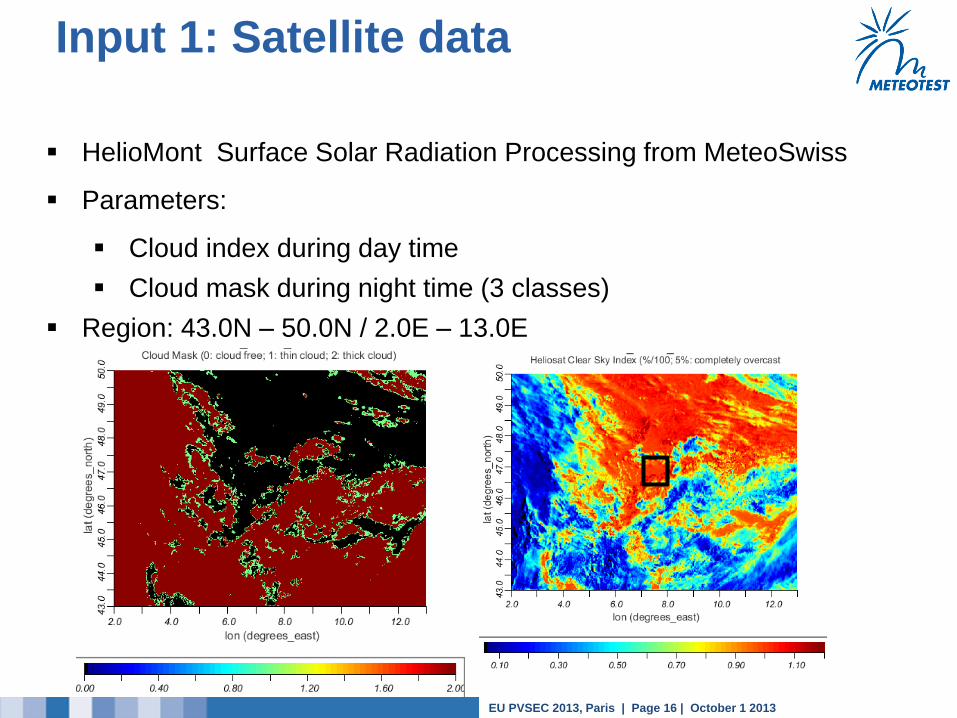
HelioMont Surface Solar Radiation Processing from MeteoSwiss
Parameters:
Cloud index during day time
Cloud mask during night time (3 classes)
Region: 43.0N – 50.0N / 2.0E – 13.0E
EU PVSEC 2013, Paris | Page 17 | October 1 2013
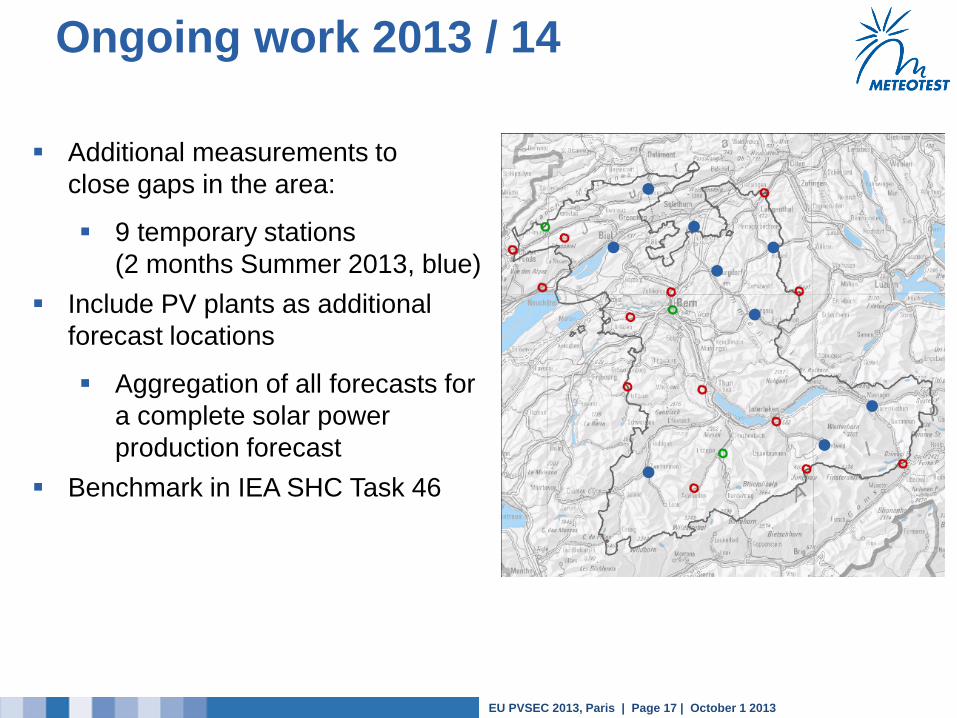
Ongoing work 2013 / 14
Additional measurements to
close gaps in the area:
9 temporary stations
(2 months Summer 2013, blue)
Include PV plants as additional
forecast locations
Aggregation of all forecasts for
a complete solar power
production forecast
Benchmark in IEA SHC Task 46
EU PVSEC 2013, Paris | Page 18 | October 1 2013
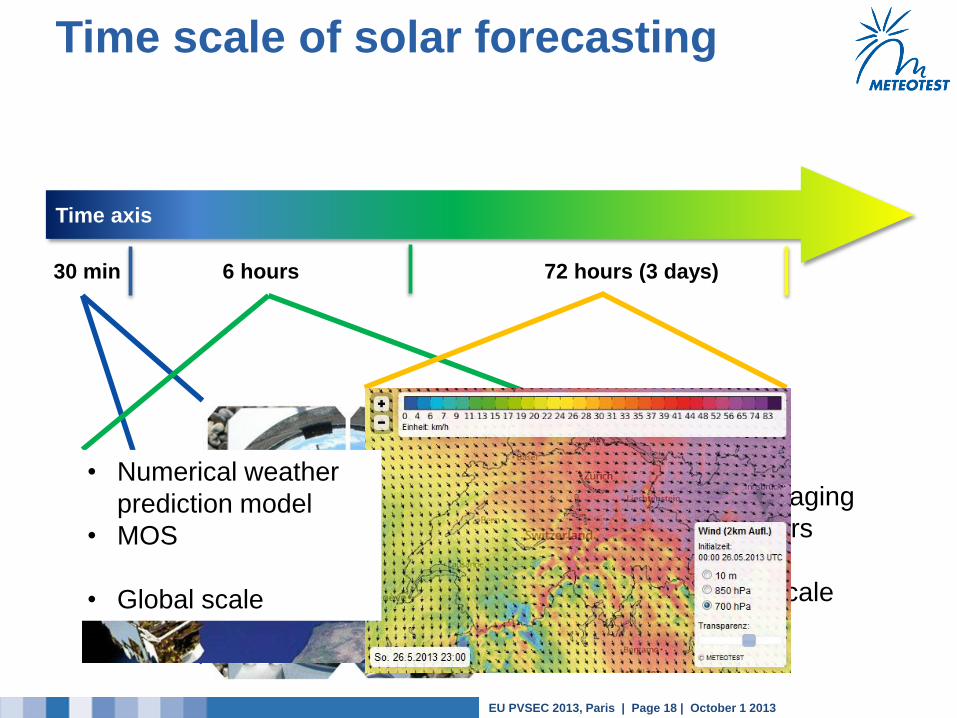
All sky imaging
Wind vectors
Local scale
Nowcasting
Time scale of solar forecasting
Time axis
30 min 6 hours 72 hours (3 days)
Satellite imaging
Wind vectors
Regional scale
• Numerical weather
prediction model
• MOS
• Global scale
EU PVSEC 2013, Paris | Page 19 | October 1 2013
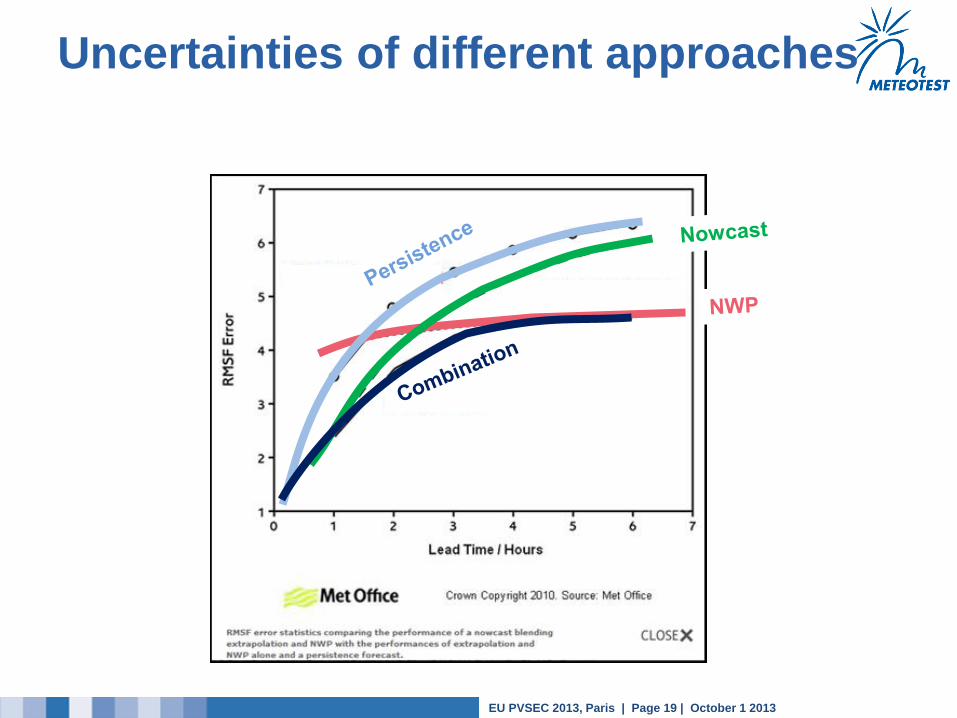
Uncertainties of different approaches
EU PVSEC 2013, Paris | Page 20 | October 1 2013
Post processing