Embed Size (px)
Citation preview

Should I sow QM in my fields?
Ewa Chudyk
Cresset UGM, 18-19th June 2015, Cambridge, UK
PAGE
Agenda
1
Fragment Molecular Orbitals (FMO)
Contribution of various interactions to binding energy
Protein-ligand field complementarity & SAR interpretation
QSAR analysis with Forge and FMO

PAGE
MM and QM system description
2
Summary
Molecular mechanics (MM):
• Fast
• Can be applied to large
systems
• Low level of accuracy
• Polarisation not included
(usually)
• Limited parametrization
Quantum mechanics (QM):
• Higher level of accuracy
• Electrons explicitly defined
• Can study chemical reactions
• Slower
• Sampling not included
• Difficult to apply to large systems
Non-classical intermolecular forces: cation-π, dipole-π, halogen-π, carbonyl n-π*,
also charge transfer and polarization important in ligand binding
Is MM description good enough to understand drug binding?

PAGE
Fragment molecular orbital (FMO)
3
About the method
• “Visual inspection” and molecular mechanics do not fully
explain complex protein-ligand interactions
• FMO is a quantum mechanical method that has been
developed1 for application to large (biological) systems
• FMO provides detailed analysis of protein-ligand
interactions and their chemical nature
− Calculate individual contribution of each residue and water
molecule to binding enthalpy
• Exploration of these receptor-ligand interactions provide
key insights for further SBDD
PIE (Pair Interaction Energy)
Fragmentation of peptide
1Fedorov DG and Kitaura K. J. Phys. Chem. A, Vol. 111, No. 30, 2007
11
22
44
33
5
PAGE 4
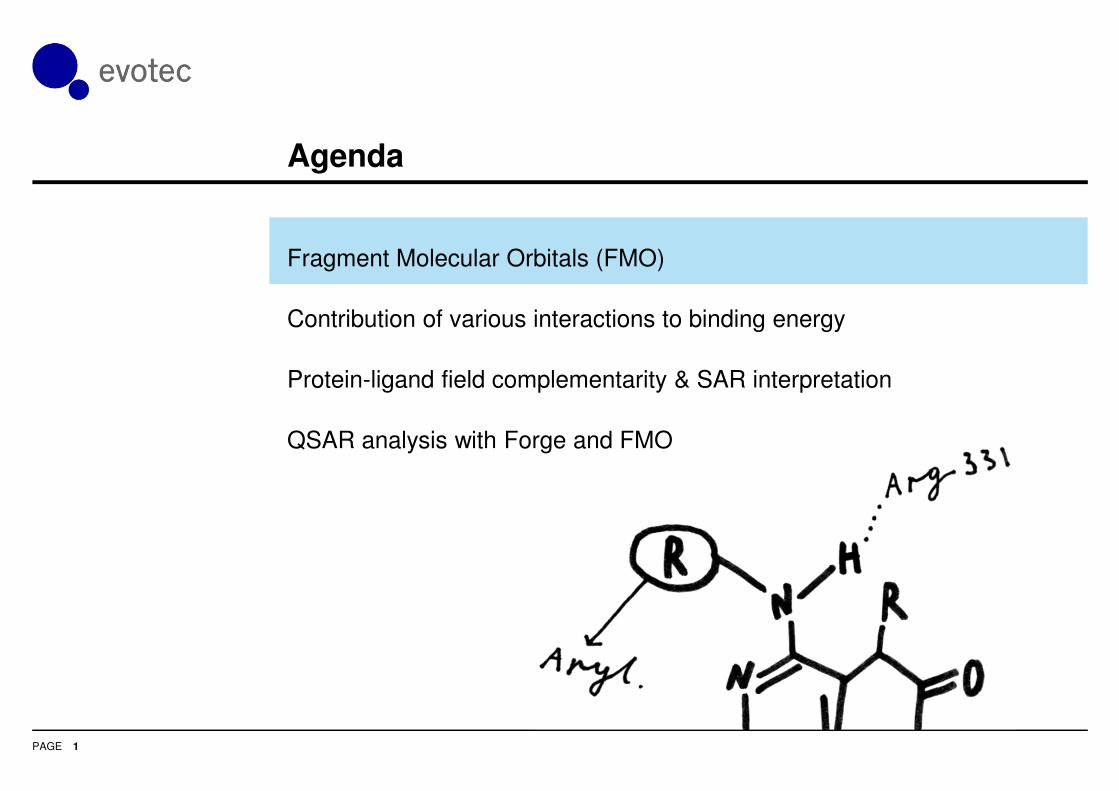
Pair interaction energy decomposition analysis (PIEDA)
Electrostatic (PIEes)Forces between point charges / (permanent and induced)
dipoles/quadrupoles
Charge transfer (PIEct)Interactions between occupied orbital of
the donor and unoccupied orbital of the
acceptor. Orbital energy gap and overlap
are the important factors.
Dispersion (PIEdis)Non-polar molecule can have dipolar moment for a
short period of time due to the movement of
electrons within the molecule; this induces weak
dipole-dipole interaction
Exchange repulsion (PIEex)Forces between molecules placed close together and always
repulsive. Mainly due to the overlap of two occupied orbitals.
δ+ δ- δ+ δ-
+ - or
C C: :
C C:
e-
Four energy terms obtained
1Fedorov DG and Kitaura K. J. Phys. Chem. A, Vol. 111, No. 30, 2007

PAGE
Cyclin-dependent kinase 2 (CDK-2)
5
Details on the receptor
• Involved in the control of the cell
cycle
• CDK-2 inhibitors might have
anticancer properties
• Good target to examine binding
affinities
• Previously published QSAR study1
• Range of different interactions within
the binding pocket
• 14 available crystal structures of
protein-ligand complexes
1Mazanetz M. et. al.; J Cheminform. 2011 Jan 10;3(1)
PAGE
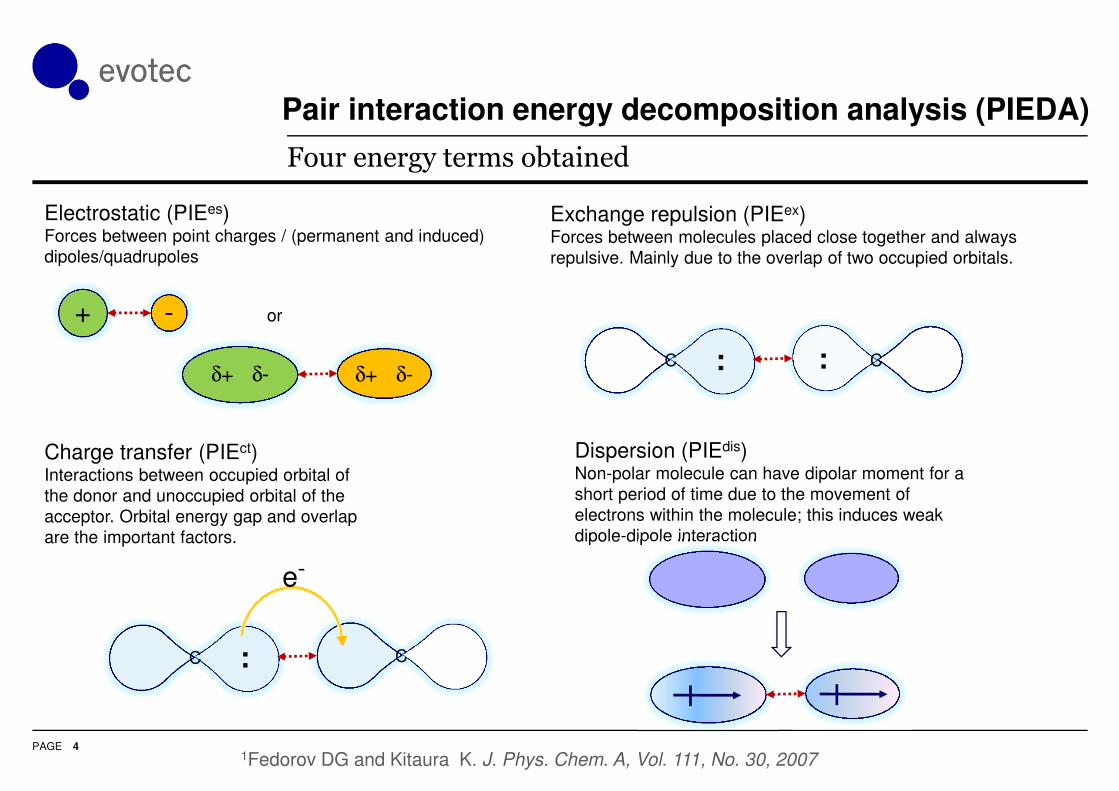
28 CDK-2 inhibitors
6
Details on the ligands
NN
N
SO
O
O N
NN
N N
N
Cl
N
N S
O
O
N
N
Cl
N
N
Cl
N
N
N
N
N
NN+
N
NN
N
NN
O
NN
O
NNS
O
O
N
O
NNN
N NN
N
N
NN
O
NF
O
N
N N
O
N
F
N
NN
O
N
F
O
O
N
NN
O
N
FO N
NN
O
N
F
O
F
N
O
NN
N
O
NO
N
N
N
O
F
F
N
O
NN
NO
FF
N
O
NN
N
O
F
F
O
N
O
NN
N
O
F
F
N+
N
O
NN
N
OF
F
N+
N
O
NN
N
O
F
F
N+
N
O
NN
NO
FF
F
N+
N
O
NN
NO
FO
N+
N
O
NN
NO
FCl
N+
N
O
NN
N
O
N+
Cl
Cl
185.0 µM120.0 µM 1000.0 µM 7.0 µM 1.9 µM 1.5 µM 0.03 µM
3.0 µM0.66 µM 97.0 µM 25.0 µM 85.0 µM
0.85 µM 0.73 µM
1.6 µM0.09 µM 0.14 µM
F
N
O
NN
N
O
F
F
0.003 µM 0.025 µM 0.012 µM 0.019 µM
0.038 µM 0.14 µM 0.044 µM0.91 µM 0.052 µM 0.063 µM
0.082 µM
Wyatt P.G. et al., J.Med. Chem. 2008, 51: 4986-4999
• Activity of the molecules ranging from 1000 µM to 3 nM
• Half of the inhibitors available as protein-ligand complex crystal structures (green)
PAGE
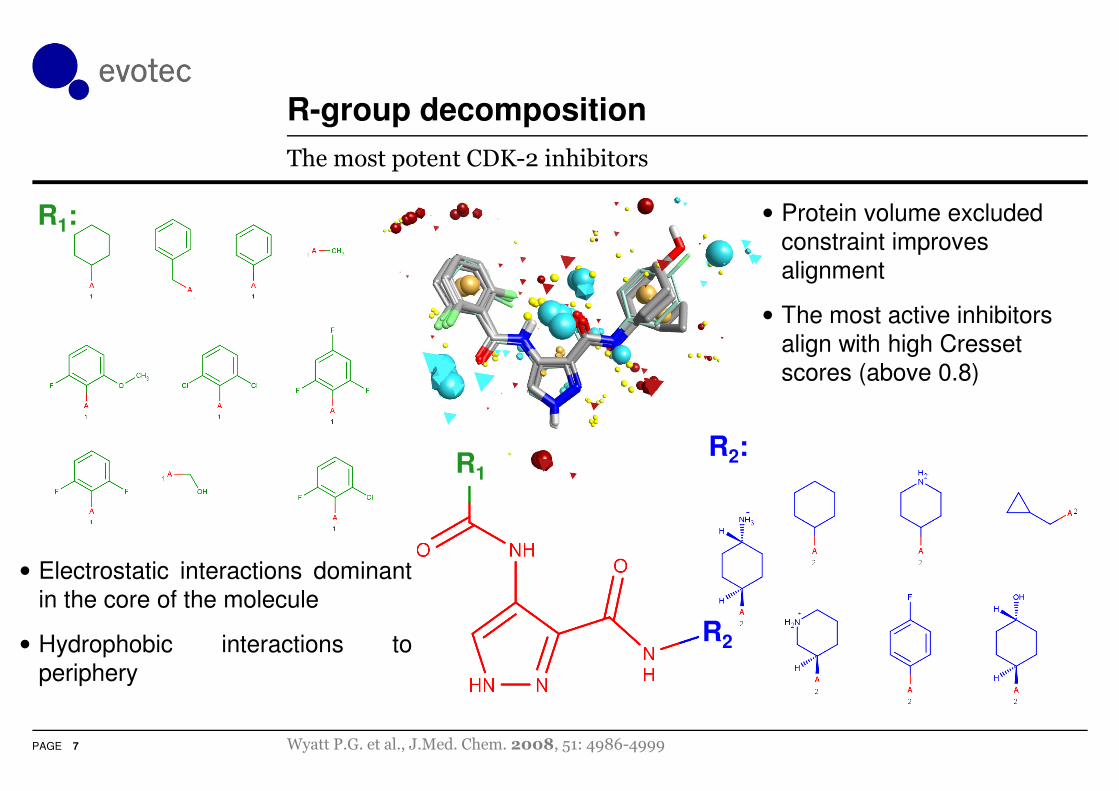
R-group decomposition
7
The most potent CDK-2 inhibitors
Wyatt P.G. et al., J.Med. Chem. 2008, 51: 4986-4999
• Protein volume excluded
constraint improves
alignment
• The most active inhibitors
align with high Cresset
scores (above 0.8)
R1
R2
R2:
R1:
• Electrostatic interactions dominant
in the core of the molecule
• Hydrophobic interactions to
periphery

PAGE
Cyclin-dependent kinase 2 (CDK-2)
8
Binding pocket and subpockets
• Hydrogen bond interactions in the centre of
the pocket
• What drives SAR of both subpockets?
• To be able to explain activity of those
molecules more details analysis is required:
F
N
O
NN
N
O
F
F
N
O
NN
N
OF
F
N+
N
O
NN
N
O
F
F
N+
0.003 µM
0.14 µM 0.044 µM
F
N
O
NN
N
O
0.14 µM
#18
#17
#23 #24

PAGE
Cyclin-dependent kinase 2 (CDK-2)
9
FMO interactions
• Different interactions dominate in every
inhibitor part
S1
S2
S2S1 Core

PAGE
Electrostatic complementarity (EC)
10
About the method
Davenport and Heifetz et al., ,Assay Drug Dev Technol., Dec 2010, 8, 6, 781
• “Electrostatic Complementarity” (EC) is a method to calculate the electrostatic attraction and
repulsion between the protein and ligand and map it on the ligand surface
• The EC is mainly SAR/QSAR analysis and design tool for lead optimization
• It provide the medicinal chemist not only with the overall degree of electrostatic behavior, but also
highlights the most significant regions for modifications in order to maximize the effect on binding
affinity to the protein
• The and derived from the electrostatic potential around protein and ligand
• The more active inhibitor, the more negative ECScore
protein
kjiE,,
ligand
kjiE,,
∑∑∑= = =
×=
N
i
N
j
ligand
kji
N
k
protein
kjiScore EEEC1 1
,,
1
,,

PAGE 11
#18, IC50: 0.003 µM
EC for the most potent inhibitor
Protein ESP+
Protein ESP-
Ligand ESP+
Ligand ESP-
Protein
ESP
Ligand
ESP
Electrostatic Attraction
Electrostatic Repulsion
EC

PAGE
Electrostatic complementarity
12
Crystal structure complexes
• Lack of correlation between electrostatic complementarity score and inhibition
• Possibly electrostatics is not a driving force in inhibitor binding

PAGE
EC in ligand optimization
13
Inhibitor’s core
• ECScore reproduces ligand ranking
• Inhibitor core interactions dominated by
electrostatics – high complementarity
Electrostatic Attraction
Electrostatic Repulsion
NN
N
SO
O
ON
Cl
N
N
N
N
185.0 µM
120.0 µM
1.5 µM
Inhibitor Activity [µM] ECScore
#1 185 -45.1
#2 120 -66.0
#6 1.5 -114.4
#1 #2#6
Leu83Glu81
Leu83
Leu83
Glu81
Glu81
Leu134
Gln134
WAT
Leu134 Ile10
Val18

PAGE
EC in ligand optimization
14
S1 subpocket
• Electrostatic complementarity does not
reproduce activity ranking
• Other effects than electrostatics must be
strong within S1 pocket
• Charge transfer and dispersion may play an
important role
Electrostatic Attraction
Electrostatic Repulsion
F
N
O
NN
N
O
F
N
O
NN
N
O
F
F
0.14 µM
0.003 µM
#18
#17
Inhibitor Activity [µM] ECScore
#18 0.003 -101.5
#17 0.14 -126.3

PAGE
F
N
O
NN
N
O
F
F
Core
Leu134
Val18
Lys33
Asp145
Asn132
#18
FMO effects around the S1 subpocket
15
Physical nature of interactions
• Total interaction energies:
� #18: -25.3 kcal/mol
� #17: -7.1 kcal/mol
• Difference between #18 and #17
comes from interactions with Lys33
and Asp145
• Charge transfer significantly
contributes to binding
#18 #17
0.14 µM0.003 µM
#18 #17
#18 #17
F
N
O
NN
N
O
PAGE
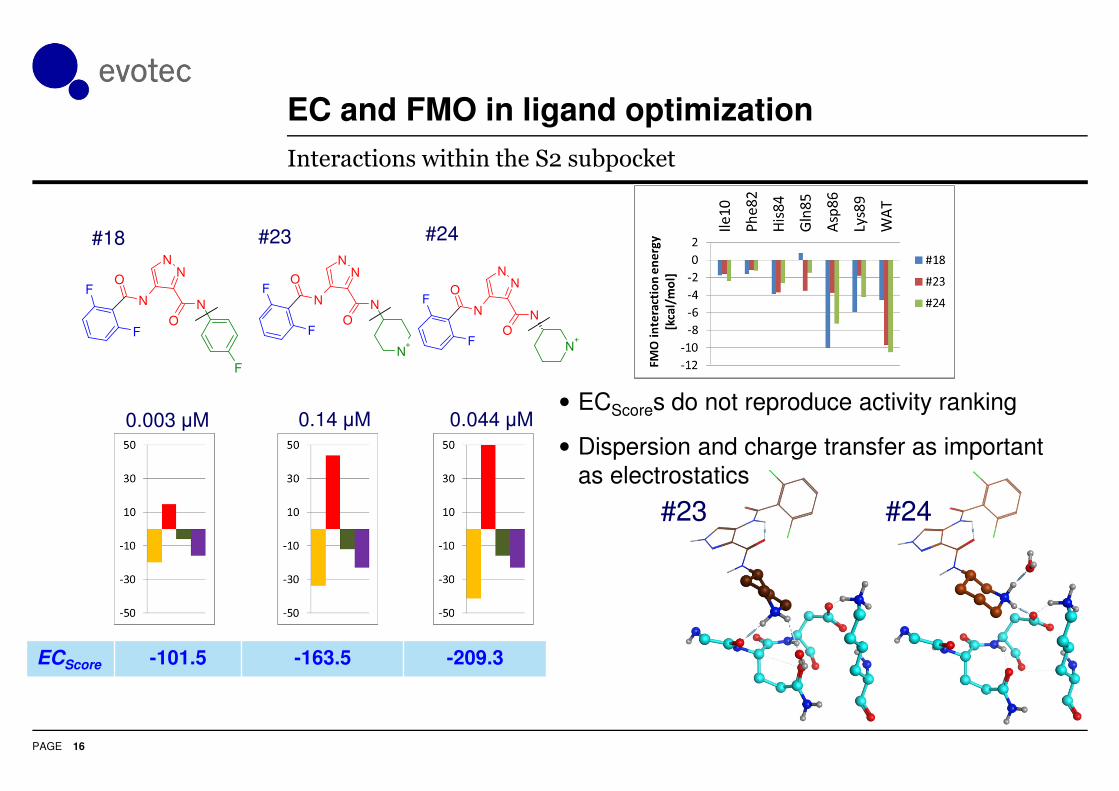
EC and FMO in ligand optimization
16
Interactions within the S2 subpocket
• ECScores do not reproduce activity ranking
• Dispersion and charge transfer as important
as electrostatics
0.003 µM 0.14 µM 0.044 µM
#18 #23 #24
ECScore -101.5 -163.5 -209.3
#23 #24
F
N
O
NN
N
O
F
FN
O
NN
N
OF
F
N+
N
O
NN
N
O
F
F
N+

PAGE
QSAR model with FMO
17
Cyclin-dependent kinase 2 inhibitors
1Mazanetz M. et. al.; J Cheminform. 2011 Jan 10;3(1)
• PLS model used
• 14 inhibitors with crystal structures as a
training set, remaining 14 as a test set
• Descriptors included:
• The sum of the enthalpic contributions
from FMO
• The polar solvation term
• The nonpolar solvation term
• The entropic term
• Solvation component improves correlation
Observed ∆G
Pre
dic
ted
∆G
R2=0.94
Test Set
Training Set

PAGE
QSAR model with Forge
18
Cyclin-dependent kinase 2 inhibitors
• Six different models tested
• The best model:
− The most active ligand as a reference
− Manual adjustment of the alignment
− “Normal” alignment conditions
− Protein as volume excluded
• PLS model (as for FMO) as implemented
in Forge – “3D descriptors”
• Electrostatic model descriptors dominate
around the inhibitor core
• All other interactions (hydrophobic
pockets) represented as steric positive and
negative effectsCresset field descriptors from the training
set around the reference cmpd
PAGE
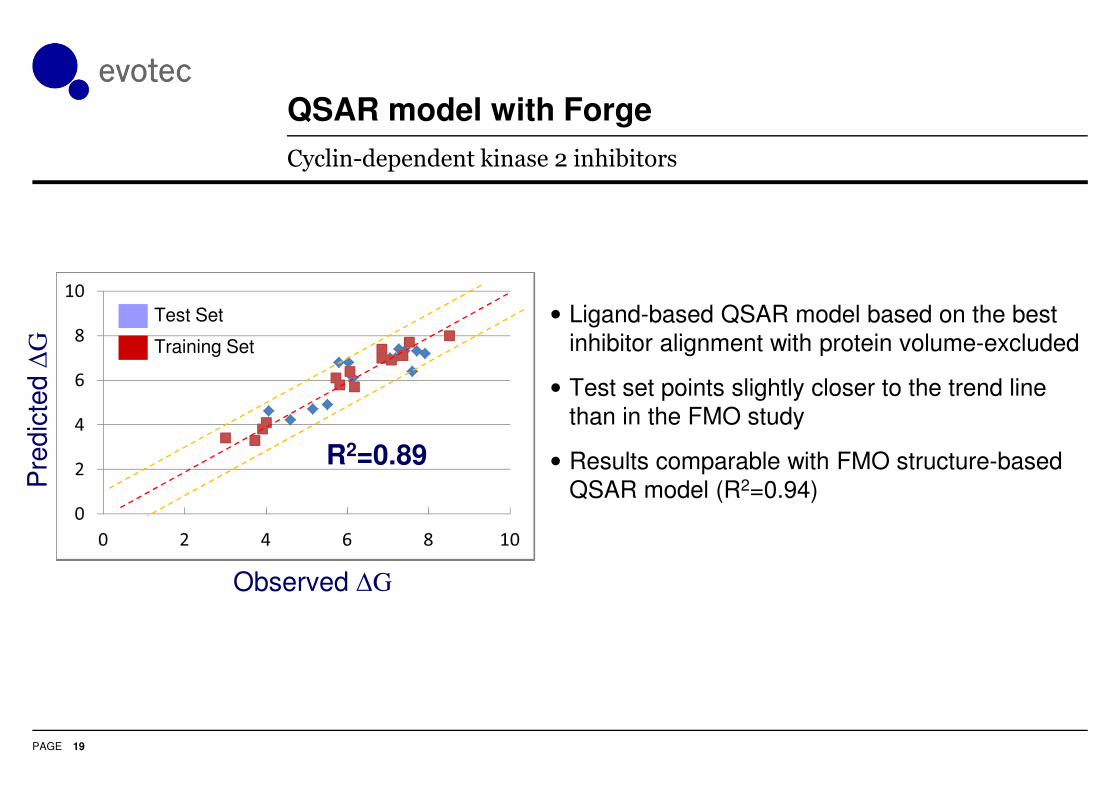
QSAR model with Forge
19
Cyclin-dependent kinase 2 inhibitors
• Ligand-based QSAR model based on the best
inhibitor alignment with protein volume-excluded
• Test set points slightly closer to the trend line
than in the FMO study
• Results comparable with FMO structure-based
QSAR model (R2=0.94)
R2=0.89
Observed ∆G
Pre
dic
ted
∆G
Test Set
Training Set

PAGE
Summary
20
• QM approach helps to deconvolute the drivers of molecular interactions
• QSAR performance with FMO and Forge are equally good
• Both approaches have been proven complementary useful in inhibitor optimization

PAGE
Acknowledgement
21
• Evotec (Comp Chem group)
− Dr. Mike Bodkin
− Dr. Alexander Heifetz
− Dr. Mike Mazanetz
− Dr. Inaki Morao
− Dr. Tim James
− Dr. Mirco Meniconi
• FMO Developers
− Dr. Dmitri Fedorov
• Cresset Support Team

PAGE
Calculating binding affinities
23
Thermodynamic cycle
• The cycle calculates the receptor (R), ligand (L), and
complex (C) in vacuum and then transfers them to
solvent to find the solvation free energy
•
• The reported IC50 values can be used to calculate
free binding energy for each ligand
• Non-classical effects, including charge transfer and
polarization, were proven to play an important part in
binding (e.g., hydrogen bonding)
Schematic view of the
thermodynamic cycle used in the
derivation of the binding affinity
∆����� = − ln ��� = ∆� − ∆�

PAGE
How ECScore calculated?
24
More details
Davenport and Heifetz et al., ,Assay Drug Dev Technol., Dec 2010, 8, 6, 781
PAGE
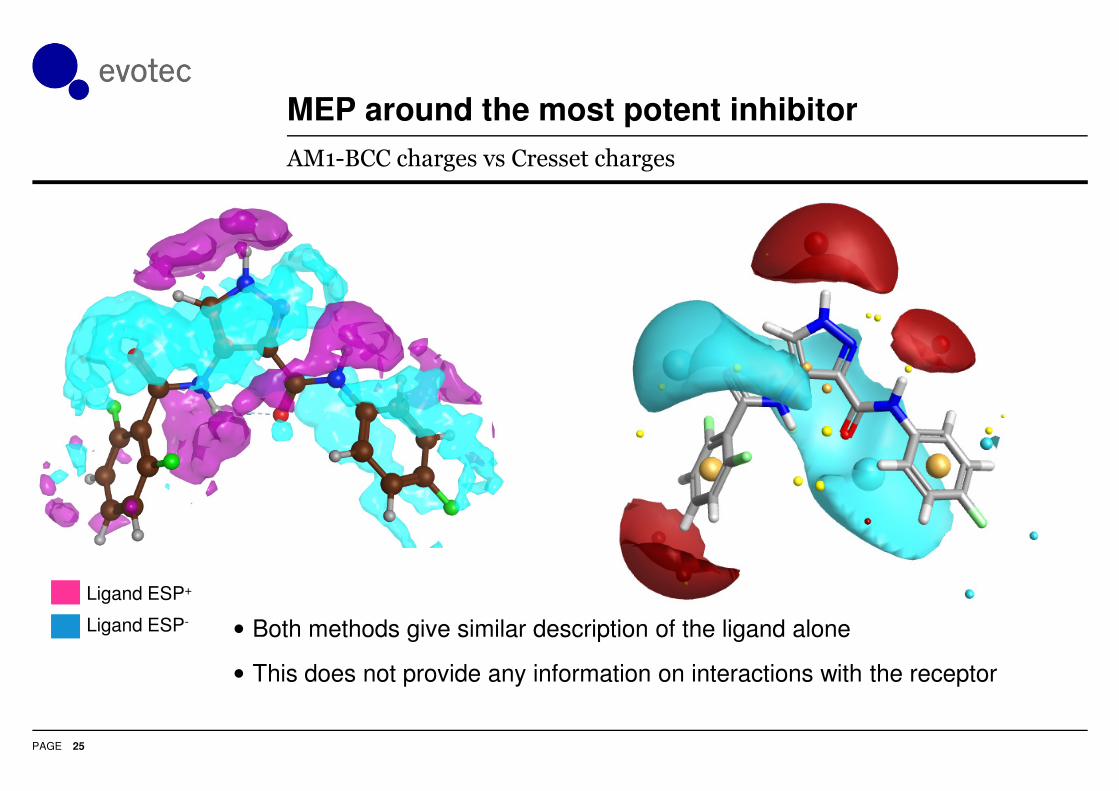
MEP around the most potent inhibitor
25
AM1-BCC charges vs Cresset charges
• Both methods give similar description of the ligand alone
• This does not provide any information on interactions with the receptor
Ligand ESP+
Ligand ESP-

PAGE
Charge transfer within P1 subpocket
26
Asp145
Lys33
Direction of charge transfer