Embed Size (px)
Citation preview
1
Whitman College Econ 101A Final Exam December 16, 2013 Write all answers on the exam. Show all of your work. The exam ends at 11:30. 1. Suppose Victor and Sondra are farmers. Each owns a 5-acre plot of land. The following table shows the amount of oats or flax each farmer could produce on a given acre. Both farmers can choose whether to devote all 5 acres to producing oats only, to producing flax only, or to producing both oats and flax.
Oats (tons per acre) Flax (tons per acre) Victor 2 8 Sondra 3 9
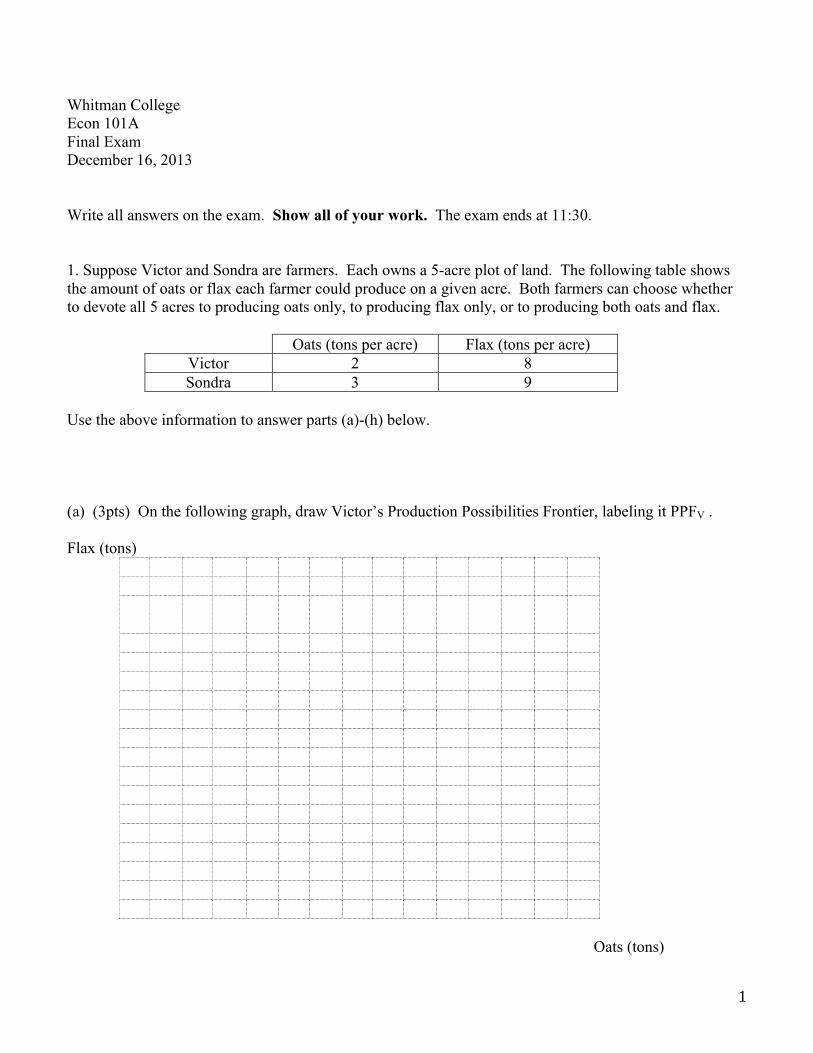
Use the above information to answer parts (a)-(h) below. (a) (3pts) On the following graph, draw Victor’s Production Possibilities Frontier, labeling it PPFV . Flax (tons)
Oats (tons)
2
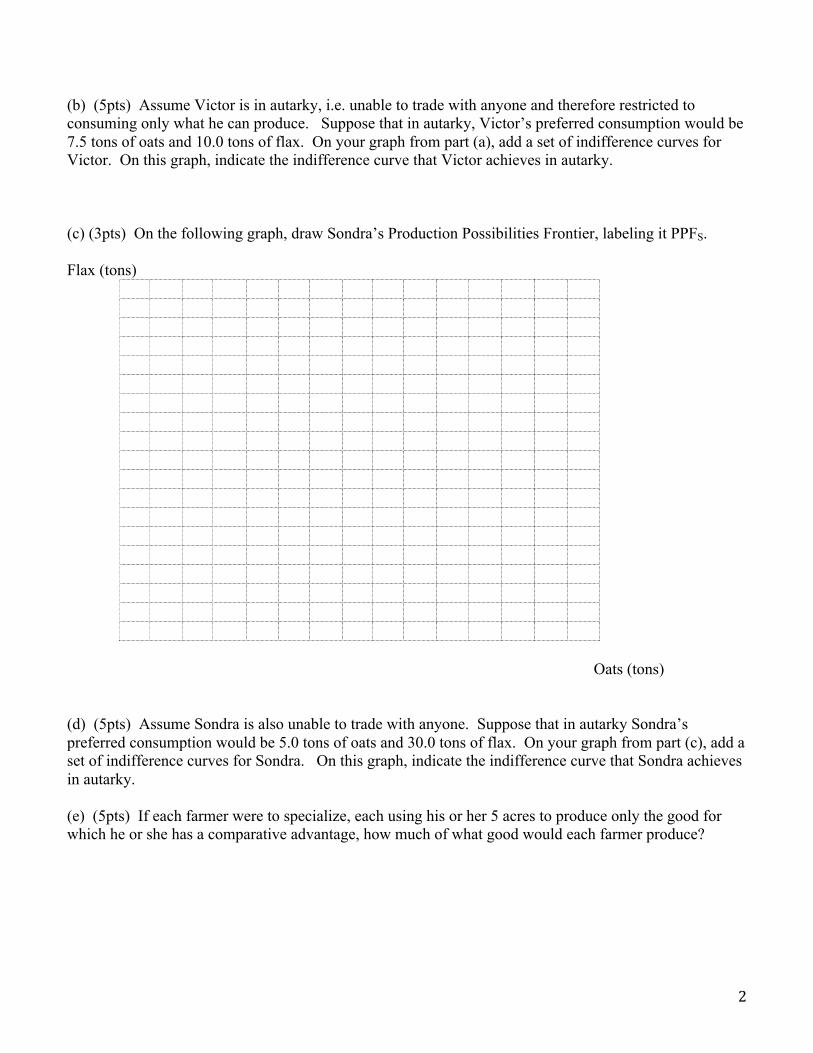
(b) (5pts) Assume Victor is in autarky, i.e. unable to trade with anyone and therefore restricted to consuming only what he can produce. Suppose that in autarky, Victor’s preferred consumption would be 7.5 tons of oats and 10.0 tons of flax. On your graph from part (a), add a set of indifference curves for Victor. On this graph, indicate the indifference curve that Victor achieves in autarky. (c) (3pts) On the following graph, draw Sondra’s Production Possibilities Frontier, labeling it PPFS. Flax (tons)
Oats (tons) (d) (5pts) Assume Sondra is also unable to trade with anyone. Suppose that in autarky Sondra’s preferred consumption would be 5.0 tons of oats and 30.0 tons of flax. On your graph from part (c), add a set of indifference curves for Sondra. On this graph, indicate the indifference curve that Sondra achieves in autarky. (e) (5pts) If each farmer were to specialize, each using his or her 5 acres to produce only the good for which he or she has a comparative advantage, how much of what good would each farmer produce?
3
(f) (5pts) Assuming each specializes with his or her 5 acres, describe a trade that would make Victor and Sondra each clearly better off than they would be in autarky. How much does each farmer consume of each good under your proposal? On your graph from part (a), indicate the amounts that Victor would consume under your proposal. On your graph from part (c), indicate the amounts that Sondra would consume under your proposal. (g) (2pts) On your graph from part (a), indicate the indifference curve Victor achieves when he consumes the amounts under your proposal. (h) (2pts) On your graph from part (c), indicate the indifference curve Sondra achieves when she consumes the amounts under your proposal. 2. Consider the information in the following article. Rent-Regulation Push Raises Tensions in Europe by Alessia Pirolo Wall Street Journal Dec. 11, 2013 As Europe slowly recovers from its worst financial downturn since World War II, tensions are intensifying in Germany, France and the U.K. over new efforts to regulate rents. In Germany, the nascent "grand coalition" government, expected to be led by Chancellor Angela Merkel and her center-right Christian Democratic Party, recently laid out a comprehensive national agenda that includes a proposal to cap rents on new leases. Such a rule would be a blow for landlords in the country's already heavily regulated rental market.
Meanwhile, the French parliament is expected to approve the Loi Duflot—named after Cécile Duflot, housing minister of the Socialist-led French government—by the end of January. The law would include a mechanism to cap rents in Paris and other cities. And in London, caps have been proposed as a solution for soaring rents that can consume up to 50% of take-home salaries, according to the housing charity Shelter. High rents are pushing the lower-paid to the margins of the city, Shelter says.

4
Ms. Merkel's party has been negotiating for three months with the center-left Social Democrats to develop a list of shared goals. Rent caps haven't been controversial because both parties, in their election campaigns, promised some sort of rental regulation to German voters, the majority of whom live in rented housing. Investors and analysts have strongly criticized the coalition's proposals. Market experts fear the measure could discourage investors from new purchases, landlords from maintaining their properties and builders from investing in much-
needed new housing. "Investors will invest less and supply will be even more restricted," Jochen Moebert, an analyst with Deutsche Bank said of the potentially stricter rules in Germany….If it becomes law, the proposal could have a significant impact on investment in residential real estate, according to a recent study from Cologne's IW Institute for Economics Research. Germany's main cities are already short of housing, says Michael Voigtländer, a real-estate economist at the IW Institute….
Suppose the market for apartment rentals in Germany is perfectly competitive. Consider the current situation in Germany, where government regulation caps monthly rent at a level below what would be the equilibrium rent in Germany’s main cities. (a) (4pts) Draw a graph of supply and demand for apartment rental units in Germany.

5
(b) (2pts) On your graph from part (a), indicate what would be the equilibrium quantity (Q) and rent (R), absent government intervention. (c) (5pts) On your graph, indicate the current cap on rent, labeling it Rcontol. On your graph, indicate the amount by which “Germany’s main cities are already short of housing.” (d) (5pts) Suppose a new law passes that caps rents at a lower level than the current cap. On your graph, indicate that new cap, labeling it Rnewcontrol. On your graph, indicate the amount by which Germany’s main cities would then be “short of housing.” 3. Consider the information below.
Can Quinoa Farming Go Global Without Leaving Andeans Behind? by Dan Charles August 15, 2013 National Public Radio
…Over the past decade or so, millions of North Americans and Europeans have started eating the seeds of [quinoa]. It's grown by small farmers in South America in the Andes. Now, farmers around the world are trying to get into the business. That leaves some Andean farmers wondering: What happens to us?
When European explorers and settlers arrived in the Americas, they liked some of the food they found here: corn, potatoes. They took those plants around the world. But they really had no use for quinoa, a relative of tumbleweed and spinach. It comes in all kinds of colors and grows a big lumpy head filled with thousands of tiny seeds. In the Andes, though, people kept growing this plant. And now, it's a profitable export crop. In trendy restaurants of North American and Europe, you'll find quinoa salads, quinoa chili. It's super nutritious, also exotic. Farmers all over the world are now starting to wonder, how do we climb onto this quinoa bandwagon? Many of them gathered this week for a kind of quinoa summit at Washington State University. … They're trying to grow quinoa in the Pacific Northwest, in Denmark and France, in Pakistan and the African country of
Malawi. Some had stories of success. There were also tales of failure. Many varieties of quinoa are only happy in the cool, dry highlands of the Andes. If it's too hot, many won't produce a harvest. Too much rain is bad too. We're spending a lot of time just testing different varieties that have come out of the Andean countries to see if any of those will, one, survive here and, two, produce the seeds that we'd like to eat. Researchers also are figuring out how to mass-produce this crop and harvest it with machines.
Kevin Murphy, the plant breeder at Washington State who organized this conference, says those practical problems can be solved. He's more worried about something else: fairness. In four or five years, quinoa will not be just a crop from the Andes anymore, he says. But what about the people of the Andes, the farmers whose ancestors kept quinoa alive through the centuries, who selected all these different varieties, what will happen to them?…They know they can't stop this international appetite for quinoa. They don't even want to. It's been profitable for them. But they also feel that if they're providing this plant for competitors to grow in the U.S. or Australia, they should see some benefits…

6
For parts (a)-(d) below, suppose quinoa is produced in a perfectly competitive market free of government intervention. Suppose transporting quinoa between countries is no more expensive than transporting it within countries. (a) (10pts) How has the increase in the international appetite for quinoa between 2000 and 2013 affected the producer surplus for quinoa producers in the Andean countries (i.e. Bolivia, Columbia, Peru and Ecuador)? To answer this question, refer to two graphs that you draw side-by-side in the space below. Have the graph on the left show the supply and demand for quinoa in the Andean countries, i.e. it includes only Andean buyers and sellers. Have the graph on the right show the world-wide supply and demand for quinoa, i.e. have it include the Andean buyers and sellers and also all the other buyers and sellers from the rest of the world.

7
(b) (5pts) How has the increase in the international appetite for quinoa between 2000 and 2013 affected the consumer surplus of households in the Andean countries? To answer this question, refer to the pair of graphs you drew for part (a). Suppose that by 2020 farmers outside of the Andean countries will have figured out how to mass produce quinoa and harvest it cheaply with machines. Suppose that these cheap production techniques would not work in the Andean countries. (c) (10pts) How would the introduction of these cheap quinoa production techniques outside of the Andean countries affect the producer surplus for quinoa producers in the Andean countries? To answer this question, refer to two graphs that you draw side-by-side on the next page. Have the graph on the left show the supply and demand for quinoa in the Andean countries. Have the graph on the right show the world-wide supply and demand for quinoa in 2013 and in 2020.
8
(d) (5pts) How will the introduction of these cheap quinoa production techniques outside of the Andean countries affect the consumer surplus for households in the Andean countries? To answer this question, refer to the pair of graphs you drew for part (c).

9
4. (2pts each) Define each of the following. Price elasticity of demand Marginal revenue Long run average total cost Oligopoly The Coase Theorem
10
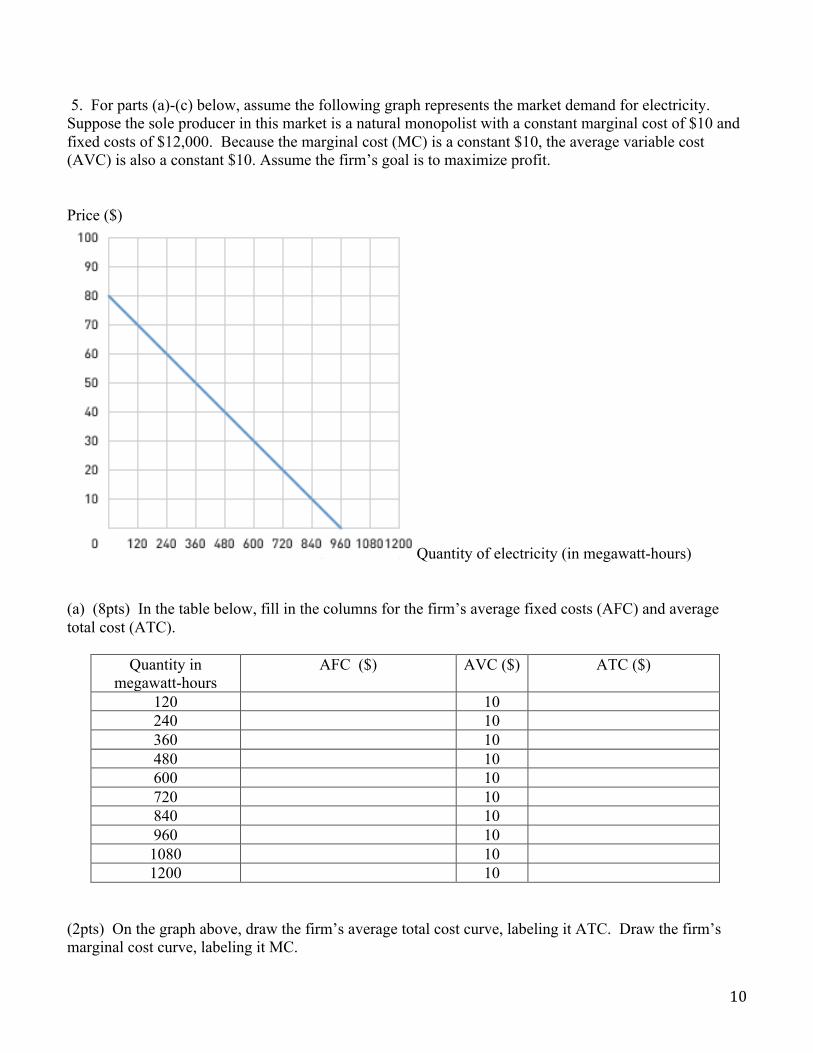
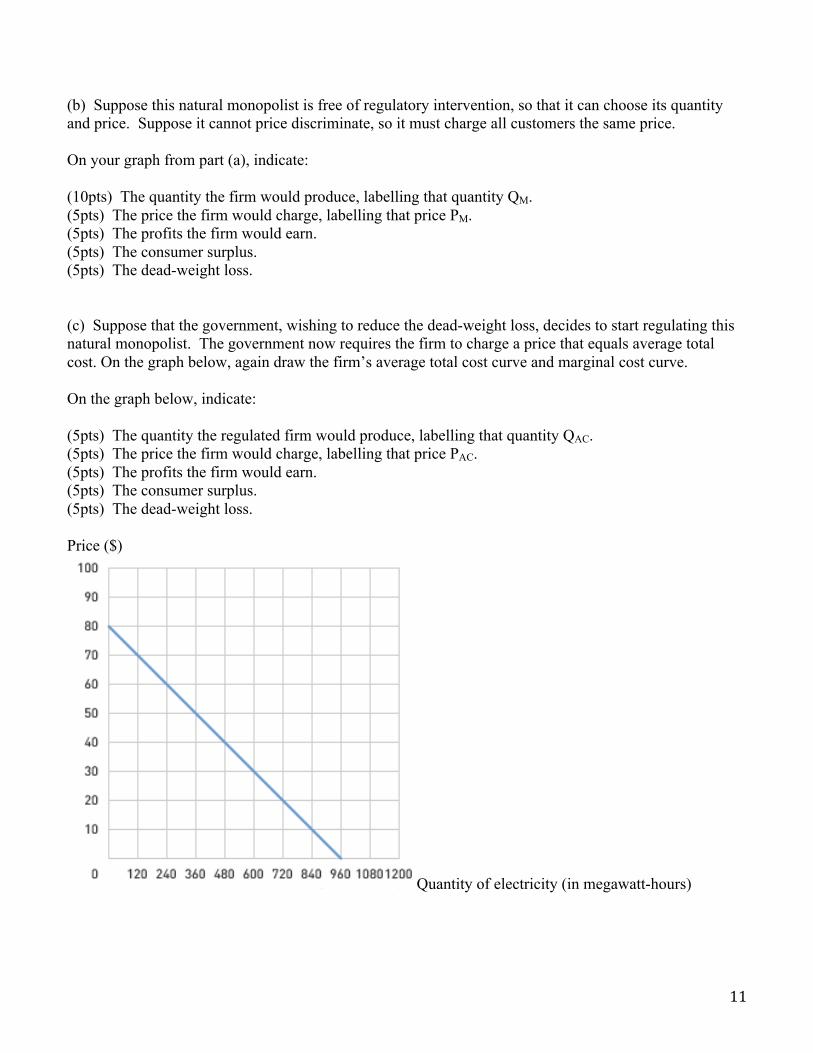
5. For parts (a)-(c) below, assume the following graph represents the market demand for electricity. Suppose the sole producer in this market is a natural monopolist with a constant marginal cost of $10 and fixed costs of $12,000. Because the marginal cost (MC) is a constant $10, the average variable cost (AVC) is also a constant $10. Assume the firm’s goal is to maximize profit. Price ($)
Quantity of electricity (in megawatt-hours) (a) (8pts) In the table below, fill in the columns for the firm’s average fixed costs (AFC) and average total cost (ATC).
Quantity in megawatt-hours
AFC ($) AVC ($) ATC ($)
120 10 240 10 360 10 480 10 600 10 720 10 840 10 960 10 1080 10 1200 10
(2pts) On the graph above, draw the firm’s average total cost curve, labeling it ATC. Draw the firm’s marginal cost curve, labeling it MC.
11
(b) Suppose this natural monopolist is free of regulatory intervention, so that it can choose its quantity and price. Suppose it cannot price discriminate, so it must charge all customers the same price. On your graph from part (a), indicate: (10pts) The quantity the firm would produce, labelling that quantity QM. (5pts) The price the firm would charge, labelling that price PM. (5pts) The profits the firm would earn. (5pts) The consumer surplus. (5pts) The dead-weight loss. (c) Suppose that the government, wishing to reduce the dead-weight loss, decides to start regulating this natural monopolist. The government now requires the firm to charge a price that equals average total cost. On the graph below, again draw the firm’s average total cost curve and marginal cost curve. On the graph below, indicate: (5pts) The quantity the regulated firm would produce, labelling that quantity QAC. (5pts) The price the firm would charge, labelling that price PAC. (5pts) The profits the firm would earn. (5pts) The consumer surplus. (5pts) The dead-weight loss. Price ($)
Quantity of electricity (in megawatt-hours)

12
6. Suppose steel is produced in a perfectly competitive industry by plants that dump waste into nearby rivers, creating a negative externality for those living downstream. Assume that producing each additional ton of steel imposes an external cost of $300. There is no external benefit from steel production, so the private value equals the social value. The graph below shows the supply and demand for steel.
(2pts) On this graph, indicate the quantity of steel the perfectly competitive industry would produce. Label that quantity QPC. (2pts) Indicate the price of steel in the perfectly competitive industry. Label that price PPC. (10pts) On the graph, draw the marginal social cost curve. (5pts) On the graph, indicate the socially optimal quantity of steel. Label that quantity QOptimal. (5pts) On the graph, indicate the dead weight loss generated by this perfectly competitive industry. (6pts) Describe a tax the government could impose to get this industry to produce the socially optimal quantity. Be specific in your description.
13
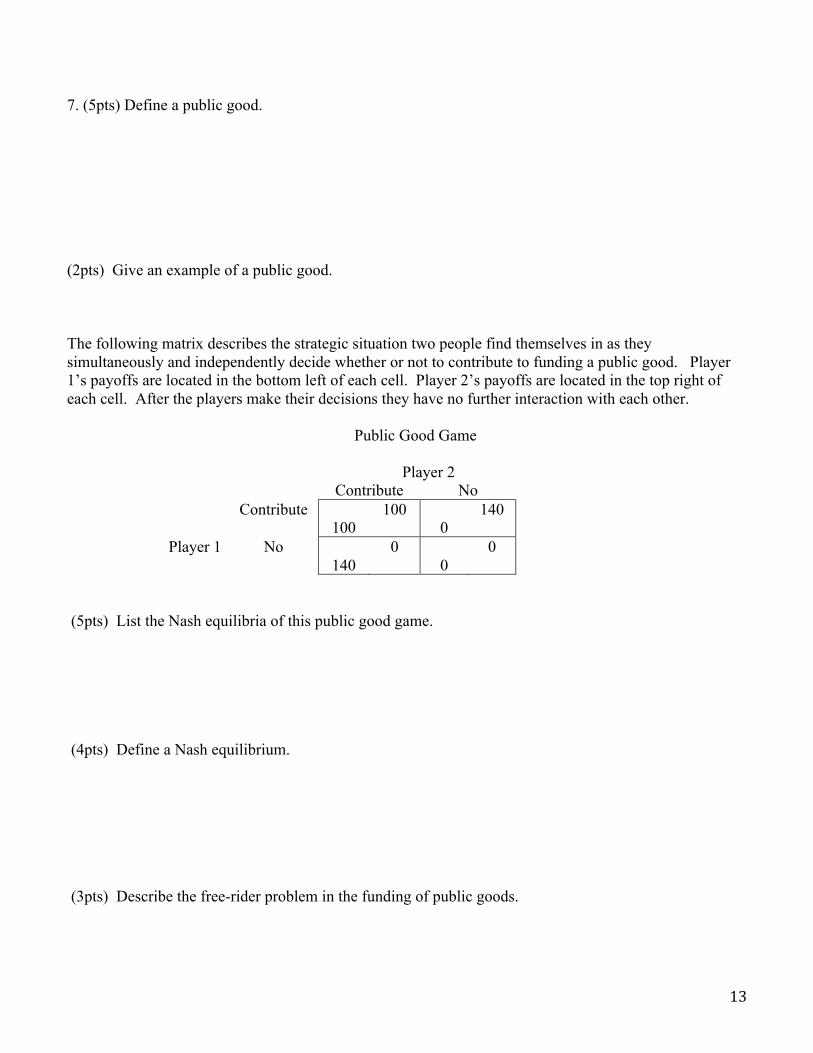
7. (5pts) Define a public good. (2pts) Give an example of a public good. The following matrix describes the strategic situation two people find themselves in as they simultaneously and independently decide whether or not to contribute to funding a public good. Player 1’s payoffs are located in the bottom left of each cell. Player 2’s payoffs are located in the top right of each cell. After the players make their decisions they have no further interaction with each other. Public Good Game Player 2
Contribute No Contribute
100 100
0 140
Player 1 No 140
0 0
0
(5pts) List the Nash equilibria of this public good game. (4pts) Define a Nash equilibrium. (3pts) Describe the free-rider problem in the funding of public goods.