Embed Size (px)
Citation preview
REKLAMA SHTETËRORE DHE PRIVATE NË MEDIAN SHQIPTARE
STATE AND PRIVATE ADVERTISEMENT IN ALBANIAN MEDIA
Albanian Media InstituteInstituti Shqiptar i Medias
Albanian Media InstituteInstituti Shqiptar i Medias
State and Private Advertisement in Albanian Media
Tirana 2014
Albanian Media InstituteInstituti Shqiptar i Medias
2
State and Private Advertisement in Albanian Media Publisher:
Rr. Gjin Bue Shpata, nr.8, Tiranë, ShqipëriTel/Fax: +42229800E-mail: [email protected] © ISHM
This publication has been produced with the financial assistance of European Union. The contents of this documents are the sole responsibility of the Albanian Media Institute and can under no circumstances be regarded as reflecting the position of the European Union.
I N V E S T I N G I N Y O U R F U T U R E
EUROPEAN UNIONEUROPEAN REGIONAL DEVELOPMENT FUND
Albanian Media InstituteInstituti Shqiptar i Medias
3
1 AMA list of licensed operators is available at: http://ama.gov.al/index.php?option=com_content&view=catego-ry&id=21&Itemid=75&lang=sq
Overview of media landscape
Albania has a rich and dynamic media landscape, with about 250 broadcast media outlets, 25 daily newspapers, and an increasing number of online news portals. Albanian print media are numerous, with 25 daily newspapers and many more publications of other frequencies. The print media are under no obligation to publish their circulations or sales and a system or authority for the verification of these figures is absent. In this context, the number of circulation and sales for print media remains unknown and different claims remain unverified, in the absence of official or verified data.
Albania at the moment has two national commercial televisions, 71 local televisions, 83 local cable televisions, and two commercial multiplexes.1 Of all the existing national analog television stations, the public broadcaster Radio Televizioni Shqiptar (RTSH) has the greatest reach:
4
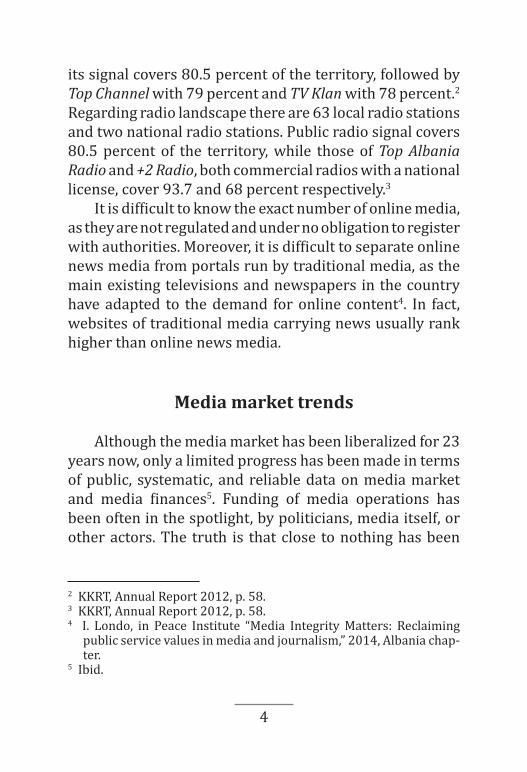
its signal covers 80.5 percent of the territory, followed by Top Channel with 79 percent and TV Klan with 78 percent.2 Regarding radio landscape there are 63 local radio stations and two national radio stations. Public radio signal covers 80.5 percent of the territory, while those of Top Albania Radio and +2 Radio, both commercial radios with a national license, cover 93.7 and 68 percent respectively.3
It is difficult to know the exact number of online media, as they are not regulated and under no obligation to register with authorities. Moreover, it is difficult to separate online news media from portals run by traditional media, as the main existing televisions and newspapers in the country have adapted to the demand for online content4. In fact, websites of traditional media carrying news usually rank higher than online news media.
Media market trends
Although the media market has been liberalized for 23 years now, only a limited progress has been made in terms of public, systematic, and reliable data on media market and media finances5. Funding of media operations has been often in the spotlight, by politicians, media itself, or other actors. The truth is that close to nothing has been
2 KKRT, Annual Report 2012, p. 58.3 KKRT, Annual Report 2012, p. 58.4 I. Londo, in Peace Institute “Media Integrity Matters: Reclaiming
public service values in media and journalism,” 2014, Albania chap-ter.
5 Ibid.
5
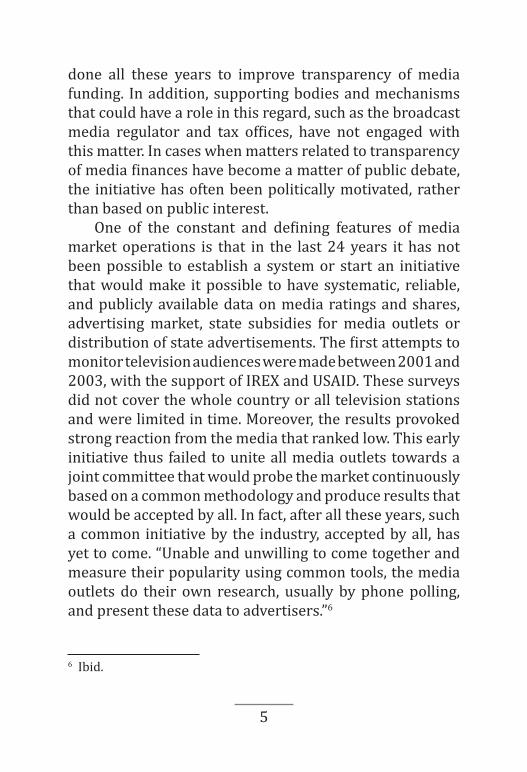
done all these years to improve transparency of media funding. In addition, supporting bodies and mechanisms that could have a role in this regard, such as the broadcast media regulator and tax offices, have not engaged with this matter. In cases when matters related to transparency of media finances have become a matter of public debate, the initiative has often been politically motivated, rather than based on public interest.
One of the constant and defining features of media market operations is that in the last 24 years it has not been possible to establish a system or start an initiative that would make it possible to have systematic, reliable, and publicly available data on media ratings and shares, advertising market, state subsidies for media outlets or distribution of state advertisements. The first attempts to monitor television audiences were made between 2001 and 2003, with the support of IREX and USAID. These surveys did not cover the whole country or all television stations and were limited in time. Moreover, the results provoked strong reaction from the media that ranked low. This early initiative thus failed to unite all media outlets towards a joint committee that would probe the market continuously based on a common methodology and produce results that would be accepted by all. In fact, after all these years, such a common initiative by the industry, accepted by all, has yet to come. “Unable and unwilling to come together and measure their popularity using common tools, the media outlets do their own research, usually by phone polling, and present these data to advertisers.”6
6 Ibid.
6
7 Interview with Thanas Goga, R&T Advertising, 15 May 2013.
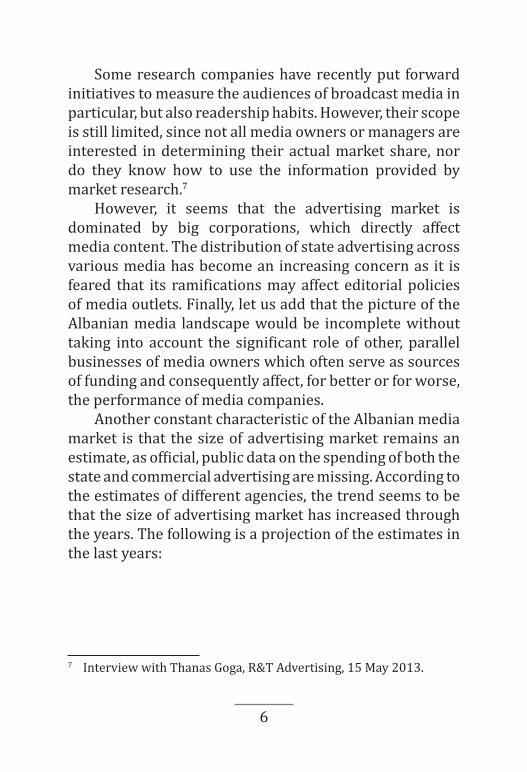
Some research companies have recently put forward initiatives to measure the audiences of broadcast media in particular, but also readership habits. However, their scope is still limited, since not all media owners or managers are interested in determining their actual market share, nor do they know how to use the information provided by market research.7
However, it seems that the advertising market is dominated by big corporations, which directly affect media content. The distribution of state advertising across various media has become an increasing concern as it is feared that its ramifications may affect editorial policies of media outlets. Finally, let us add that the picture of the Albanian media landscape would be incomplete without taking into account the significant role of other, parallel businesses of media owners which often serve as sources of funding and consequently affect, for better or for worse, the performance of media companies.
Another constant characteristic of the Albanian media market is that the size of advertising market remains an estimate, as official, public data on the spending of both the state and commercial advertising are missing. According to the estimates of different agencies, the trend seems to be that the size of advertising market has increased through the years. The following is a projection of the estimates in the last years:
7
Radio 2.10%Internet 1.80%Outdoor 10.40%Print 7.80%TV 77.90%
17
4
0 0
20000000
40000000
60000000
80000000
10000000
12000000
14000000
0
2
4
6
8
10
12
14
16
18
2012 2013 2014
Klan group (2012-2014)
Total amount Number of transactions
Radio 2%
Internet2% Outdoor
10%
Print8%
TV78%
Advertising cake based on media type, 2013
Radio
Internet
Outdoor
TV
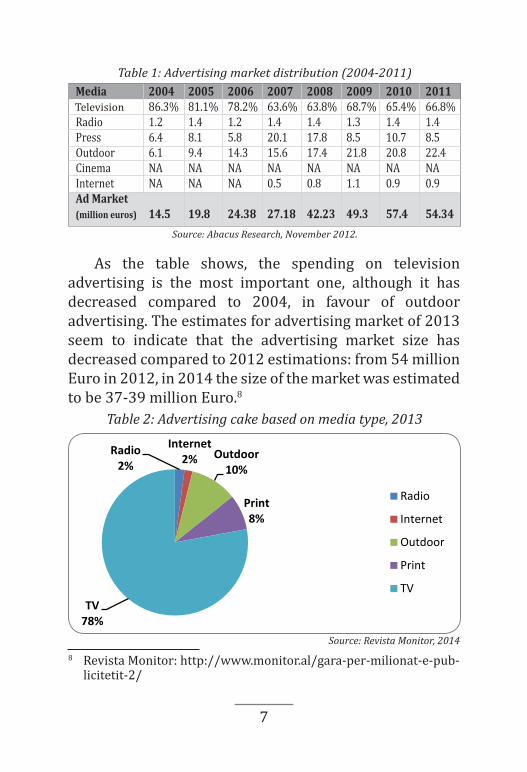
Table 2: Advertising cake based on media type, 2013
As the table shows, the spending on television advertising is the most important one, although it has decreased compared to 2004, in favour of outdoor advertising. The estimates for advertising market of 2013 seem to indicate that the advertising market size has decreased compared to 2012 estimations: from 54 million Euro in 2012, in 2014 the size of the market was estimated to be 37-39 million Euro.8
8 Revista Monitor: http://www.monitor.al/gara-per-milionat-e-pub-licitetit-2/
Source: Revista Monitor, 2014
Source: Abacus Research, November 2012.
Table 1: Advertising market distribution (2004-2011)
8
Top Channe 43%TV Klan 23%Vizion Plus 11%Ora News 5%Focus Med 4%TV Scan 2%A1 Report 2%TVSH 4%Agonset 0.10%Other (est) 8%
2012 2013mobile tele 108 104TV 44 45health care 21 43education 39 38food 37 34beverage 23 24clothes, acc 19 24pharmaceu 10 24
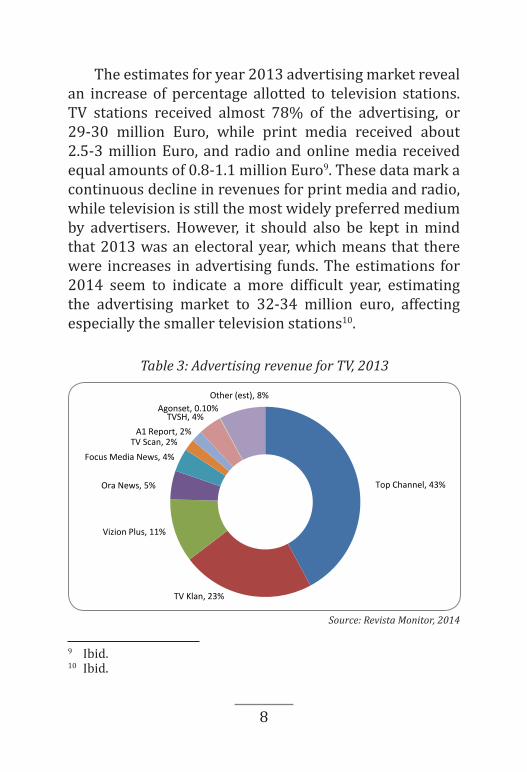
Top Channel, 43%
TV Klan, 23%
Vizion Plus, 11%
Ora News, 5%
Focus Media News, 4%TV Scan, 2%
A1 Report, 2%TVSH, 4%
Agonset, 0.10%Other (est), 8%
Advertising revenue for TV, 2013Table 3: Advertising revenue for TV, 2013
Source: Revista Monitor, 2014
The estimates for year 2013 advertising market reveal an increase of percentage allotted to television stations. TV stations received almost 78% of the advertising, or 29-30 million Euro, while print media received about 2.5-3 million Euro, and radio and online media received equal amounts of 0.8-1.1 million Euro9. These data mark a continuous decline in revenues for print media and radio, while television is still the most widely preferred medium by advertisers. However, it should also be kept in mind that 2013 was an electoral year, which means that there were increases in advertising funds. The estimations for 2014 seem to indicate a more difficult year, estimating the advertising market to 32-34 million euro, affecting especially the smaller television stations10.
9 Ibid.10 Ibid.
9
As it can be seen from the chart, the three main television stations seem to receive the highest share of advertising, respectively 77%. The main news stations seem to receive each 4% and 5%, respectively, while the public broadcaster also receives only 4%.
Rules and criteria for state advertising
Albanian legislation does not specify any provisions whatsoever on state support and funding of the media, not even in terms of protecting media pluralism or supporting minorities or specific communities. However, it has been unfair and non-transparent distribution of state advertising that has given rise to concerns about the integrity of the Albanian media in the last years.
Unclear rules
Regulation on the distribution of state advertising has always been problematic for several reasons. In principle, such regulation needs to establish that state advertising is awarded in a fair and transparent manner to the most popular media. However, in view of the above-mentioned problems with audience measurements and trends, it is impossible to establish beyond any doubt and prejudice which media most deserve to be awarded state advertising.
As a result, this has become a breeding ground for all kinds of speculations on how to distribute state advertising and how to “rank” the media when ranking is missing in reality. Until 2006, most of the ads and announcements that fell into the state advertising category had been
10
considered public spending and as such subject to the public procurement laws. In 2006, the government decided to stop advertising altogether, while announcements would be published in the “Bulletin of Official Announcements” instead.11 Yet, the distinction between state advertising and announcements was not clear.
In addition, in the following years other decisions on the same issue were made, which did not help to clarify the criteria applied in decisions on state funding for public announcements. On the contrary, the criteria were made even hazier and after a while the government also resumed advertising in the media. A 2007 decision by the Council of Ministers related to state advertising mentions the number of viewers or readers as one of the criteria to be used in making a decision.12 This criterion is clearly difficult to observe when data on media ranking are lacking, but it at least attempts to impose some selection filters. The two latter Council of Ministers’ decisions seem to have very broad and vague definitions of the criteria, including “the media outlet” (without any specification), the offer made, and the broadcasting duration,13 as well as the experience in organizing similar events.14 These two decisions leave out the criterion of the outlet’s audience reach, even though this is usually one of the basic requirements.
11 VKM No. 176, “On the publication of the bulletin of official an-nouncements,” 29 March 2006.
12 VKM No. 6223, “On procurement of productions/broadcasting of advertising and spots from state administration bodies in the me-dia,” 29 September 2007.
13 VKM No. 1195, 05 August 2008.14 VKM No. 1173, 06 November 2009
11
Transparency of the process of distribution
Another problem with the implementation of these decisions is related to the transparency of calls for advertising and decisions on this matter. Government Decision No. 1195 of 2008 states that the invitation for offers will be published on the official website of the institution, while the spokesperson of the institution should e-mail the invitation to present an offer to broadcast media. On the other hand, Decision No. 1173 of 2009 on the organization of artistic and social events does not have any clause on transparency of invitations. In addition, apart from the official criteria, several media outlets claimed that the invitations were sent only to selected media but were not published on the website, or had been published only one day before the deadline.
Distribution of state advertising trends
The way state advertising is distributed has been a continuous source of concern in the Albanian media scene, related to reasons such as lack of transparency in awarding state advertising, lack of clear criteria on distribution of state advertising, as well as the challenge of respecting criteria given the lack of public reliable data and studies on popularity of media outlets and groups in the country. This concern has been emphasized in different reports, from different organizations, and occasionally from the media outlets, too.
While some specific aspects of distributing advertising revenue to particular media companies in 2012-2014
12
have been subject of an investigative report and are known to public, it is necessary to monitor continuously the trend in distributing state advertising, especially given the sensitivity of these revenues to sustainability and consequently independence of some media outlets. For this purpose, this research has monitored the transactions made by the Department of Treasury at the Ministry of Finances to media companies in the years 2012, 2013, and 2014. The aim is to depict the main trends in distributing state advertising, identifying the main media groups that benefit from this process, as well as compare the trends through the years, given also the change of government in 2013.
In order to be as realistic as possible, the research has considered not only media groups and companies, but also companies owned or related to media owners that do not necessarily deal with media, such as foundations, agencies, or other kind of companies, since some of the transactions of these companies were described as notifications or publications of advertising in the newspaper. In addition, the monitoring of treasury transactions has also considered companies that are related to media owners, but deal with organization of campaigns, public events, etc, since this has been another way of awarding public funds to media owners that also own these companies. Another difficulty in monitoring transactions to media or related companies from the treasury department is that the description of transactions is not consistent. So, some of the transactions are entered as “services of printing and publishing,” others as “professional books and publications,” while others are described as “other services” or “other transfers.” For the purpose of this research, the monitoring has considered
13
87
38
111
20 11
68
2
7852
Transactions from state budget 2014
Total amount Number of transactions
Panorama
Focus group
Shqiptarja.com
Media Mapo
Standard
Publikime …
Ora
Shqip
Koha Jonë
Funds paid in 2014, including 2013 arrears
Awarded in 2014 2013 arrears
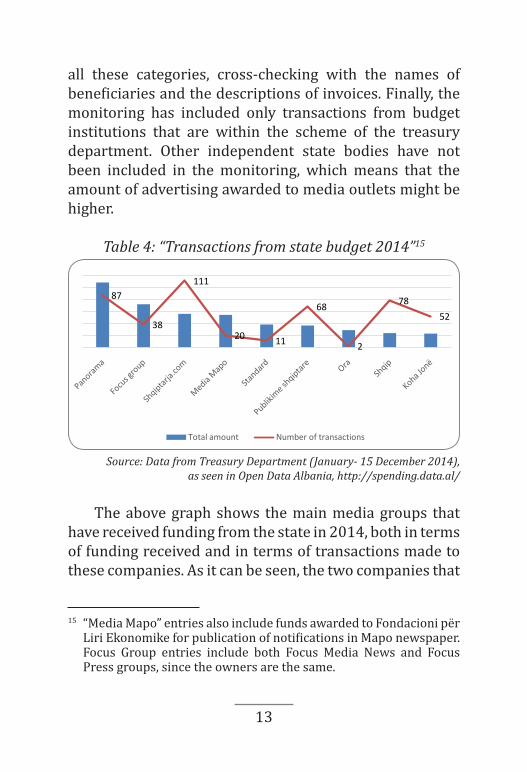
all these categories, cross-checking with the names of beneficiaries and the descriptions of invoices. Finally, the monitoring has included only transactions from budget institutions that are within the scheme of the treasury department. Other independent state bodies have not been included in the monitoring, which means that the amount of advertising awarded to media outlets might be higher.
Table 4: “Transactions from state budget 2014”15
Source: Data from Treasury Department (January- 15 December 2014), as seen in Open Data Albania, http://spending.data.al/
The above graph shows the main media groups that have received funding from the state in 2014, both in terms of funding received and in terms of transactions made to these companies. As it can be seen, the two companies that
15 “Media Mapo” entries also include funds awarded to Fondacioni për Liri Ekonomike for publication of notifications in Mapo newspaper. Focus Group entries include both Focus Media News and Focus Press groups, since the owners are the same.
14
have received the largest amount of funds are Panorama and Focus Group. Shqiptarja.com is the media company that has received the highest number of transactions, 111. What can also be noticed is that the main media groups that appear as the main beneficiaries of state advertising are the ones that own daily newspapers, while only a few also own electronic media. In fact, as other research reports show, it seems that state advertising, while not constituting a significant portion of the advertising revenue for the media market, it is important especially for newspapers.
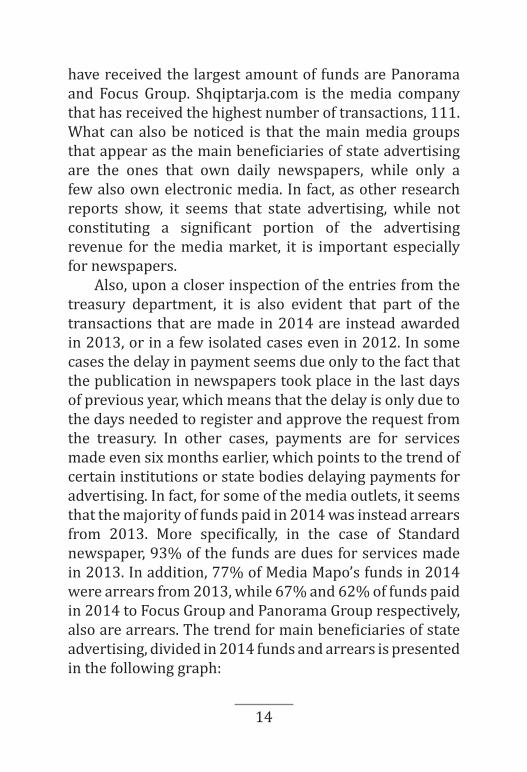
Also, upon a closer inspection of the entries from the treasury department, it is also evident that part of the transactions that are made in 2014 are instead awarded in 2013, or in a few isolated cases even in 2012. In some cases the delay in payment seems due only to the fact that the publication in newspapers took place in the last days of previous year, which means that the delay is only due to the days needed to register and approve the request from the treasury. In other cases, payments are for services made even six months earlier, which points to the trend of certain institutions or state bodies delaying payments for advertising. In fact, for some of the media outlets, it seems that the majority of funds paid in 2014 was instead arrears from 2013. More specifically, in the case of Standard newspaper, 93% of the funds are dues for services made in 2013. In addition, 77% of Media Mapo’s funds in 2014 were arrears from 2013, while 67% and 62% of funds paid in 2014 to Focus Group and Panorama Group respectively, also are arrears. The trend for main beneficiaries of state advertising, divided in 2014 funds and arrears is presented in the following graph:
15
Table 5: “Funds paid in 2014, including arrears”
87
38
111
20 11
68
2
7852
Transactions from state budget 2014
Total amount Number of transactions
Panorama
Focus group
Shqiptarja.com
Media Mapo
Standard
Publikime …
Ora
Shqip
Koha Jonë
Funds paid in 2014, including 2013 arrears
Awarded in 2014 2013 arrears
Source: Data from Treasury Department (January- 15 December 2014), as seen in Open Data Albania.
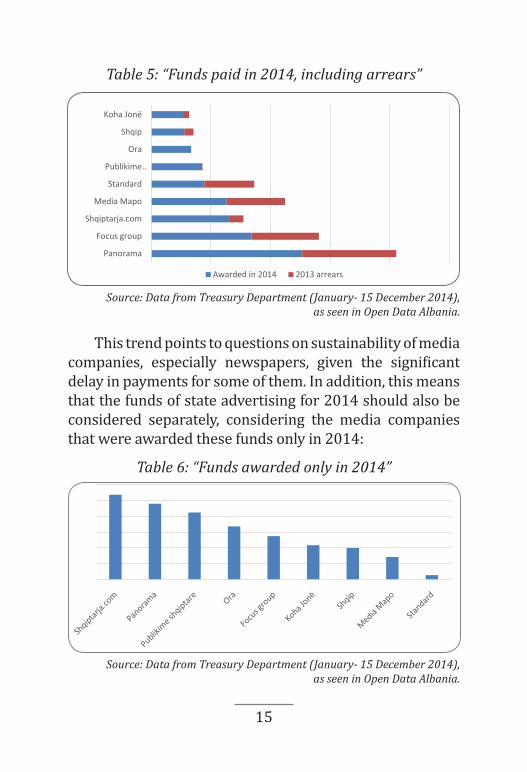
This trend points to questions on sustainability of media companies, especially newspapers, given the significant delay in payments for some of them. In addition, this means that the funds of state advertising for 2014 should also be considered separately, considering the media companies that were awarded these funds only in 2014:
Table 6: “Funds awarded only in 2014”Funds awarded only in 2014
130148
87
0
2000000
4000000
6000000
8000000
10000000
12000000
14000000
2012 2013 2014
Panorama group (2012-2014)
Total amount Number of transactions
Source: Data from Treasury Department (January- 15 December 2014), as seen in Open Data Albania.
16
As the table shows, the picture of state advertising funds has changed if we consider only the funds awarded specifically in 2014. Shqiptarja.com seems to be the greatest beneficiary, followed by Panorama Group and also by Publikime Shqiptare. All three of the groups publish daily newspapers, two of them considered to be left-wing or supporting the current Prime Minister, which is a trend to monitor, since distribution of state advertising in accordance with the editorial policy has been a constant concern for the media market and media independence in the country.
In fact, as reports published at the end of 2013 showed, the former government had significantly favored the companies of the media that supported the government and Prime Minister. “Data collected from the treasury department database in the Ministry of Finance show that the state spent at least 780,000 euro between June 2012 and the end of 2013 on TV advertising. The bulk of this sum seems to have gone to TV stations and agencies owned by or tied to Aleksandër Frangaj, the owner of TV Klan and other companies.”16
16 Likmeta, “Big advertisers subvert Albanian media freedom,” Bal-kan Insight, 20 December 2013. Available at: http://www.balk-aninsight.com/en/article/big-advertisers-subvert-albanian-me-dia-freedom.
17
State institution Company Amount (euro)
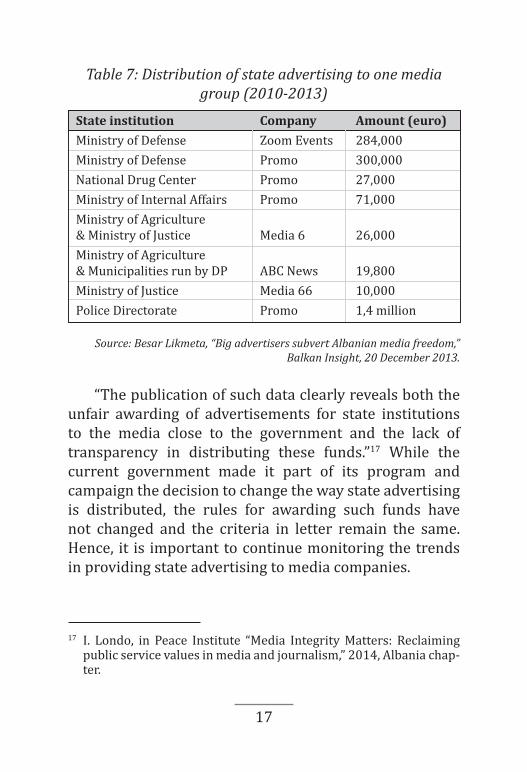
Ministry of Defense Zoom Events 284,000Ministry of Defense Promo 300,000National Drug Center Promo 27,000Ministry of Internal Affairs Promo 71,000Ministry of Agriculture & Ministry of Justice Media 6 26,000Ministry of Agriculture & Municipalities run by DP ABC News 19,800Ministry of Justice Media 66 10,000Police Directorate Promo 1,4 million
Table 7: Distribution of state advertising to one media group (2010-2013)
Source: Besar Likmeta, “Big advertisers subvert Albanian media freedom,” Balkan Insight, 20 December 2013.
“The publication of such data clearly reveals both the unfair awarding of advertisements for state institutions to the media close to the government and the lack of transparency in distributing these funds.”17 While the current government made it part of its program and campaign the decision to change the way state advertising is distributed, the rules for awarding such funds have not changed and the criteria in letter remain the same. Hence, it is important to continue monitoring the trends in providing state advertising to media companies.
17 I. Londo, in Peace Institute “Media Integrity Matters: Reclaiming public service values in media and journalism,” 2014, Albania chap-ter.
18
48
87
38
0
1000000
2000000
3000000
4000000
5000000
6000000
7000000
8000000
9000000
Focus group transactions (2012-2014)
Total amount Number of transactions
13
68
0
10
20
30
40
50
60
70
80
0500000
10000001500000200000025000003000000350000040000004500000
2013 2014
Publikime shqiptare (2013-2014)
Total amount Number of transactions
Funds awarded only in 2014
130148
87
0
2000000
4000000
6000000
8000000
10000000
12000000
14000000
2012 2013 2014
Panorama group (2012-2014)
Total amount Number of transactions
2012 2013 2014
Publikime shqiptare (2012-2014)
Focus group transactions (2012-2014)
Panorama group (2012-2014)
19
18
36
111
0
1000000
2000000
3000000
4000000
5000000
6000000
7000000
2012 2013 2014
Shqiptarja.com (2012-2014)
Total amount Number of transactions
35
77
20
0
1000000
2000000
3000000
4000000
5000000
6000000
7000000
2012 2013 2014
Media Mapo (2012-2014)
Total amount Number of transactions
18
36
111
0
1000000
2000000
3000000
4000000
5000000
6000000
7000000
2012 2013 2014
Shqiptarja.com (2012-2014)
Total amount Number of transactions
35
77
20
0
1000000
2000000
3000000
4000000
5000000
6000000
7000000
2012 2013 2014
Media Mapo (2012-2014)
Total amount Number of transactions
49
52 52
0
2000000
4000000
6000000
8000000
10000000
12000000
2012 2013 2014
Koha Jonë (2012-2014)
Total amount Number of transactions
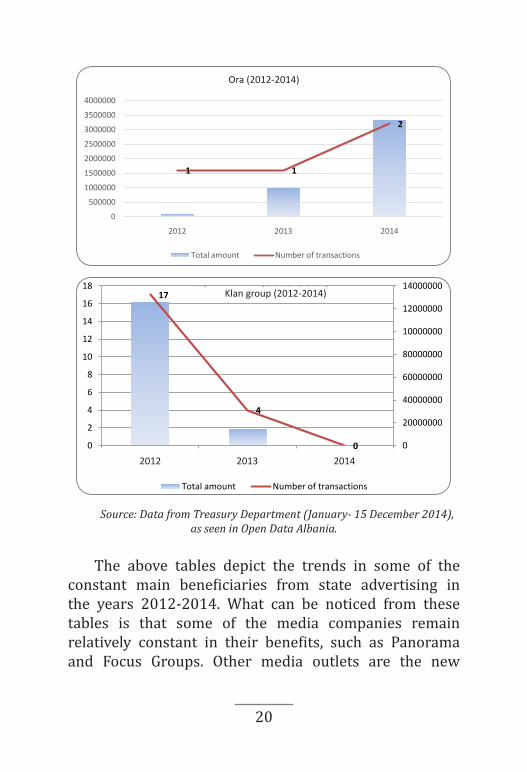
1 1
2
0
500000
1000000
1500000
2000000
2500000
3000000
3500000
4000000
2012 2013 2014
Ora (2012-2014)
Total amount Number of transactions
Koha Jonë (2012-2014)
Media Mapo (2012-2014)
Shqiptarja.com (2012-2014)
20
49
52 52
0
2000000
4000000
6000000
8000000
10000000
12000000
2012 2013 2014
Koha Jonë (2012-2014)
Total amount Number of transactions
1 1
2
0
500000
1000000
1500000
2000000
2500000
3000000
3500000
4000000
2012 2013 2014
Ora (2012-2014)
Total amount Number of transactions
Source: Data from Treasury Department (January- 15 December 2014), as seen in Open Data Albania.
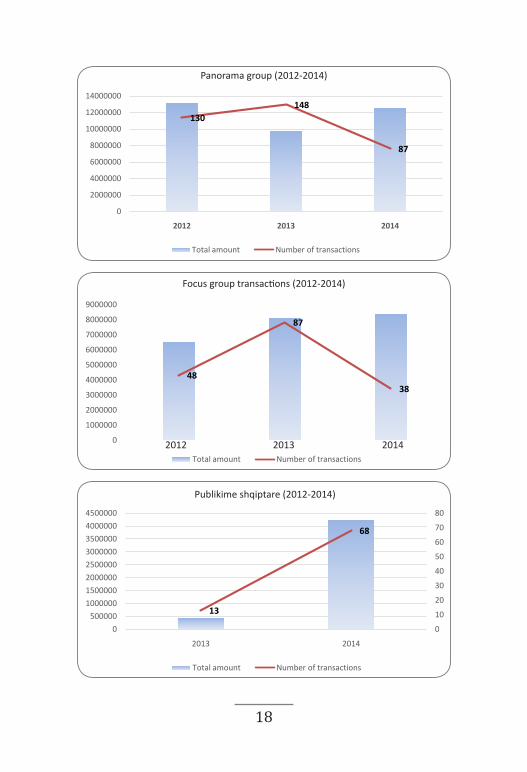
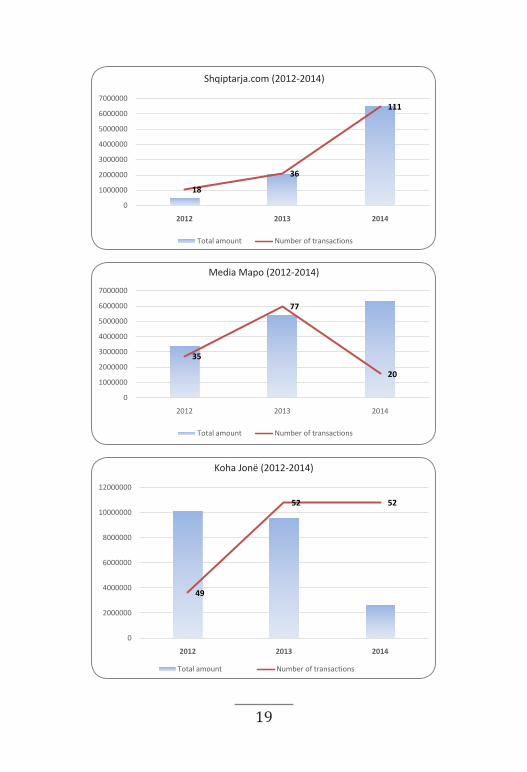
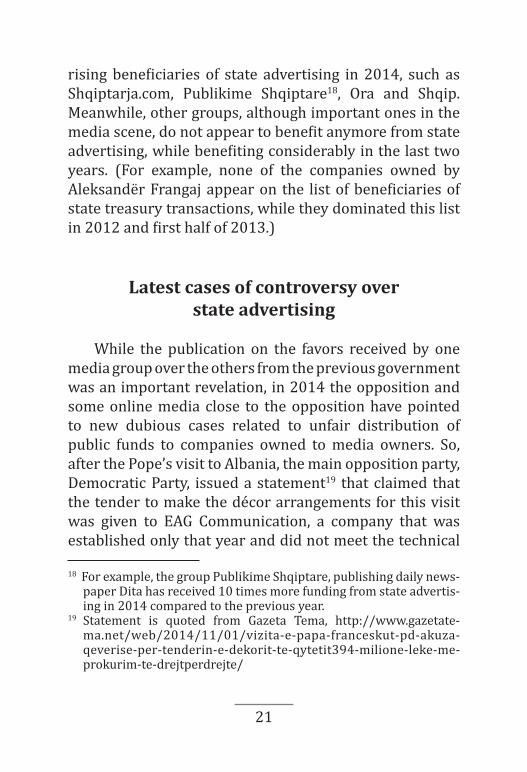
The above tables depict the trends in some of the constant main beneficiaries from state advertising in the years 2012-2014. What can be noticed from these tables is that some of the media companies remain relatively constant in their benefits, such as Panorama and Focus Groups. Other media outlets are the new
Radio 2.10%Internet 1.80%Outdoor 10.40%Print 7.80%TV 77.90%
17
4
0 0
20000000
40000000
60000000
80000000
10000000
12000000
14000000
0
2
4
6
8
10
12
14
16
18
2012 2013 2014
Klan group (2012-2014)
Total amount Number of transactions
Radio 2%
Internet2% Outdoor
10%
Print8%
TV78%
Advertising cake based on media type, 2013
Radio
Internet
Outdoor
TV
2012 2013 2014
Klan group (2012-2014)
Ora (2012-2014)
21
rising beneficiaries of state advertising in 2014, such as Shqiptarja.com, Publikime Shqiptare18, Ora and Shqip. Meanwhile, other groups, although important ones in the media scene, do not appear to benefit anymore from state advertising, while benefiting considerably in the last two years. (For example, none of the companies owned by Aleksandër Frangaj appear on the list of beneficiaries of state treasury transactions, while they dominated this list in 2012 and first half of 2013.)
Latest cases of controversy over state advertising
While the publication on the favors received by one media group over the others from the previous government was an important revelation, in 2014 the opposition and some online media close to the opposition have pointed to new dubious cases related to unfair distribution of public funds to companies owned to media owners. So, after the Pope’s visit to Albania, the main opposition party, Democratic Party, issued a statement19 that claimed that the tender to make the décor arrangements for this visit was given to EAG Communication, a company that was established only that year and did not meet the technical
18 For example, the group Publikime Shqiptare, publishing daily news-paper Dita has received 10 times more funding from state advertis-ing in 2014 compared to the previous year.
19 Statement is quoted from Gazeta Tema, http://www.gazetate-ma.net/web/2014/11/01/vizita-e-papa-franceskut-pd-akuza-qeverise-per-tenderin-e-dekorit-te-qytetit394-milione-leke-me-prokurim-te-drejtperdrejte/
22
criteria. Moreover, the statement claimed that the company that won the tender had the exact address that the company owned by the brother of Erion Veliaj, Minister of Labour and Social Welfare, had, alleging to a clear case of favoring one company over the others. These allegations have continued with other cases, the latest one being a publication from the Democratic Party on December 20 over a complaint headed to the Minister of Labour that supposedly “fixed” a tender to the same company by one of the agencies dependent from this ministry20. Minister Veliaj has denied any involvement of his or his relatives with this company, while EAG company has sued the Democratic Party for trying to ruin its reputation. According to data from treasury department, this company has benefited ALL 54,303,232 in 2014.21
Another similar case was brought forward by a news website known for its opposition against the government. In late November the government opened to the public an atomic refuge built by the communist regime. The website claimed that the company that was given the tender to reconstruct the refuge is tied to Carlo Bollino, who owns several media outlets. The claims stemmed from the lack of transparency of procedures from the Ministry of Culture, as well as from the fact that one of the main shareholders in the company that restructured the bunker had been a constant business partner of Carlo Bollino.22
20 Statement is quoted from Shqiptarja.com : http://shqiptarja.com/politike/2732/pd-veliaj-favorizoi-eag-detyroi--specialisten-te-fir-moste-tenderin-261118.html
21 http://spending.data.al/sq/treasury/list/year/2014/perf_id/%22EAGCOMMUNICATION%22
22 Article is quoted from Pol.al: http://www.pol-al.com/bunkart-boli-no-dhe-detajet-e-panjohura-te-nje-tenderi-luksoz/
23
Bollino reacted by issuing a statement that did not address these allegations, but rather the Facebook statements on the opening of the refuge by former Prime Minister.23 According to data from treasury department, Spazio Eventi Albania, the company in charge of the reconstruction, has benefited ALL 1,684,800.24
Commercial advertising
Any attempt at determining a ratio of state to private advertising would be a speculation in view of the lack of systematic and public data. However, the prevailing perception is that commercial advertising constitutes a more significant percentage than state advertising. As the estimates for 2010 indicate, state institutions accounted only for 5 percent of advertising expenditures. In 2013 state institutions did not rank among largest advertisers at all.
While detailed information on advertising expenditures is missing, the market research firms and the media agree as to who the main advertisers are: telecom operators, banks, big companies (food and beverages, such as Coca-Cola, and similar companies).25
23 Article is quoted from Shqiptarja.com : http://shqiptarja.com/anal-iza/2709/un--doktori-dhe-frika-nga-historia-254811.html
24 http://spending.data.al/sq/treasury/list/year/2014/perf_id/SPAZIOEVENTIALBANIA
25 In the first half of 2011, Eagle Mobile was considered the top spend-er in print advertising, spending an estimated 252,249 euro from January to May, compared to 173,539 euro spent by AMC, according to Idramedia research. Available at: http://www.idramedia.com/news/news_eagle_jul11. Accessed 8 April 2014.
24
drinks, cofe 22 22matresses, 23 21personal hy 18 20bank 16 19home elect 17 18publication 20 17ISP, fixed te 18 16detergents 13 15constructio 16 15furniture 6 8insurance 6 6lottery 5
0 20 40 60 80 100 120
mobile telephonyTV
health careeducation
foodbeverage
clothes, accessories, shoespharmaceutical
drinks, cofee, teamatresses, cushions, sheetspersonal hygiene, cometics
bankhome electronic appliances
publicationsISP, fixed telephony
detergentsconstruction
furnitureinsurance
lottery
Biggest advertising sectors, according to number of spots (thousands)
2013
2012
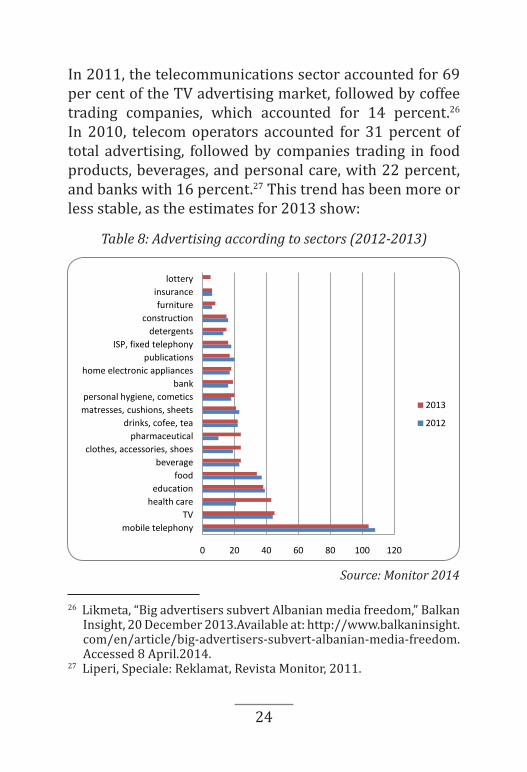
Table 8: Advertising according to sectors (2012-2013)
Source: Monitor 2014
In 2011, the telecommunications sector accounted for 69 per cent of the TV advertising market, followed by coffee trading companies, which accounted for 14 percent.26 In 2010, telecom operators accounted for 31 percent of total advertising, followed by companies trading in food products, beverages, and personal care, with 22 percent, and banks with 16 percent.27 This trend has been more or less stable, as the estimates for 2013 show:
26 Likmeta, “Big advertisers subvert Albanian media freedom,” Balkan Insight, 20 December 2013.Available at: http://www.balkaninsight.com/en/article/big-advertisers-subvert-albanian-media-freedom. Accessed 8 April.2014.
27 Liperi, Speciale: Reklamat, Revista Monitor, 2011.
25
As the above chart shows, telecom operators are visibly distanced from the rest of the other sectors that advertise in the television sector. The other sectors that follow are television’s own advertising, health care, education, food, beverages, accessories, medicinal products, etc. According to the estimates, telecom companies remain the undisputable big advertisers though, with a total budget of 20 million Euro among them spent in 2013 on advertising.
In addition to the lack of public data on the amount of advertising expenditures and their distribution across the media, there is also no information on the criteria advertisers use to allocate advertisements to the media. “It is difficult to speak of the advertising market and its sustainability for media outlets when in fact there is no media market, or it is completely chaotic.”28 Since ranking of the media is missing and their market shares are unknown, the question of how companies decide in which media to place their advertisements remains unanswered. In fact, there are opinions that the corporations that can afford it give money to every media, just as long as they remain silent or flatter the company. “Some of these companies are only advertising to keep the media’s mouth shut… using their ad budget as leverage in the editorial room.”29 For example, in the first half of 2011, Vodafone advertised in 36 print outlets, while the other three operators spent more than half a million euro in print advertising alone.30
28 Lani (ed.), Balkan Media Barometer: Albania, 2013.29 Likmeta, “Big advertisers subvert Albanian media freedom,” Balka-
nInsight, 20 December 2013.30 Idramedia research.
26
Considering that advertising market is dominated by telecoms and big corporations, their direct or indirect influence is visible in media practices and content. “Sources of financing for the media are not sufficiently diversified and big commercial sponsors, such as mobile companies, continue to be very significant for the survival of the media. Consequently, they are able to affect the media’s editorial policy, and that is why we do not see any criticism of these companies in the media. If there is any criticism, the media are aiming to obtain some financing.”31 So, when the competition regulatory body fined the country’s two biggest mobile operators, Vodafone and AMC, for uncompetitive behaviour in 2007, the story was reported only by a few media outlets.32 Similarly, when the same regulator started an investigation against Vodafone, it took many months for this story to be published in a few media, even though it is a story of public interest. “Instead, it was the Competition Authority that found itself battling tabloid media criticism of the probe.”33
Apart from the failure, or inability of media to report on their advertisers in an unfavourable light, the big advertisers also often decide directly on the content the media has to publish on them. The press often publishes what are clearly press releases, presenting them as news articles or TV stories. A recent investigation story on this subject also revealed that advertising companies specifically asked the
31 IREX, ’Albania’ in Media Sustainability Index, 2012, pp. 13-14. 32 Likmeta, “Big advertisers subvert Albanian media freedom,” Bal-
kan Insight, 20 December 2013. Available at: http://www.balk-aninsight.com/en/article/big-advertisers-subvert-albanian-me-dia-freedom. Accessed 8 April 2014.
33 Ibid.
27
media outlets to publish the information as news rather than as a press release, or demanded that the media should spin the angle of the story, as they owed it to the company. “As a company responsible for safeguarding the image of CEZ Shpërndarje, considering that we have a service contract with your newspaper in this regard, and without censoring your independence, we ask you to protect the image of the company in this debate,”34 the e-mail read. Due to both corruption and financial dependence on these sources, the media have not yet managed to create sufficient financial and professional independence and they readily comply with the situation.
Conclusions
Transparency of media finances and media business practices is very low. More than two decades after market liberalization, the Albanians still do not have access to public and verified data showing the circulation, sales, and audiences of the media outlets. Moreover, the information on the size of advertising market is also not publicly available.
In this context, the ways in which advertisements are distributed are also not clear. Unclear rules on distributing advertising, low transparency, and media clientelism lead to a situation where media echoes the interests of its advertisers. As a result, direct or indirect influence on media content is clearly visible, also aided by the lack of
34 Ibid.
28
self-regulation and developed professional rules, as well as financial pressure on the media outlets.
In sum, media content is significantly affected by factors other than journalistic values, and media are clearly instrumentalized for the economic and political goals. Facing heavy financial dependence on big advertisers, including the government and commercial companies, media outlets are routinely subjected to adaptation of their editorial content to the particular interests. What the cases above show is that these interests are reflected in both the content that can be found in the media, but also the information that is being concealed.