Embed Size (px)
Citation preview

Shrimp Farming
Technical Assistance Curriculum
By
Texas A&M University Sea Grant College Program
Marine Advisory Service Texas Cooperative Extension Service
December 2003


Acknowledgements
This technical assistance manual is the product of many sources and resources. The following acknowledgements must be made as contributors to the body of this publication:
The Core Writing Team:
Granvil D. Treece, Texas A&M University, Sea Grant College Program, Marine Advisory Service
Michael G. Haby, Department of Agricultural Economics and Terry Hanson and James Avery, Mississippi State University
Tom Westcot, USDA Foreign Agricultural Service
Terry Hanson and James Avery, Mississippi State University “Production Efficiency, Marketing Alternatives”
Technical Team Members
Dr. Kenneth W. Stokes, Extension Economist, Texas Cooperative Extension Robert Craven, Center for Farm Financial Management, University of Minnesota
Damona Doye, Oklahoma Cooperative Extension Service, Oklahoma State University Kevin Klair, Center for Farm Financial Management, University of Minnesota
Chris Mikesell, Center for Farm Financial Management, University of Minnesota Dale Nordquist, Center for Farm Financial Management, University of Minnesota
Krista Johansen, Multimedia Courseware Producer, U of Minnesota Extension Service Peter Bruhn, Graphic Designer, Peter Bruhn Design
This material is based upon work supported by the Cooperative State Research, Education and Extension Service, U.S. Department of Agriculture, under Agreement No. 2003-48605-01813.


Table of Contents Overview of Trade Adjustment Assistance ..............................1 Where Am I? ..........................................................................................................5
• Status of the World and U.S. Shrimp Markets.........................................................7 • World Trade Situation and Outlook.......................................................................25 • Evaluating the Financial Viability of the Business................................................33 • Inventory of Resources and Talents.......................................................................45
Where Do I Want To Be? ........................................................................53
• Business Options Available to Improve Profitability ............................................55 • Goals ......................................................................................................................59 • Production Efficiency ............................................................................................63 • Marketing Opportunities........................................................................................69 • Alternative Enterprises...........................................................................................73 • Transitioning Out of the Business..........................................................................77
How Do I Get There? ...................................................................................83
• How to Access More Information..........................................................................85

© 2003 TAA Technical Assistance 1
What is Trade Adjustment Assistance (TAA) for Farmers and Fishermen The Trade Act of 1974, as amended by the Trade Act of 2002, established Trade Adjustment Assistance (TAA) for Farmers. The Trade Act of 1974 was created by Congress to provide business owners and their employees relief from hardships created by foreign import competition. The purpose of TAA for Farmers is to help agricultural producers and fishermen adjust to import competition. The amended program provides technical assistance and cash benefits to eligible farmers and fishermen from the U.S. Department of Agriculture (USDA), and access to Department of Labor (DOL) retraining and education programs. Traditional TAA has provided technical assistance and labor retraining services to non-agricultural businesses and employees. TAA for farmers expands the benefits to include:
• Technical assistance from the Extension Service to assist producers and fishermen in exploring alternative commodities, marketing opportunities, and alternative enterprises.
• A cash payment of up to $10,000 depending on the amount of product you harvested.
• Retraining and education to help producers and fishermen transition to a different career, including tuition for up to 104 weeks of full-time classroom education.
Establishing a Commodity’s Eligibility for TAA Commodities must be certified as eligible for TAA before individual producers can apply for benefits. The eligibility criteria for a commodity are:
• Average price of the commodity in the most recent 12 months must be less than 80% of the average price over the past 5 years in which data is available.
• Imports of directly competing products must have increased during the most recent 12 month period.
• Increase in imports must have “contributed importantly” to the price decrease. Petitions to seek TAA eligibility may be filed by a group of agricultural producers or their representatives (grower groups) with USDA’s Foreign Agricultural Service (FAS).
Trade Adjustment Assistance Program
© 2003 TAA Technical Assistance 2
The TAA petition form is available at www.fas.usda.gov/itp/taa/FAS0930.pdf or may be requested by phone at (202) 720-2916 or by e-mail at [email protected]. Petitions may be made on behalf of a state, region or the nation as a whole. FAS does an initial eligibility screen. If the petition meets basic requirements, the information is posted in the Federal Register and FAS must announce the determination regarding a commodity’s eligibility within 40 days of posting in the Federal Register. Applying for Individual Producer or Fishermen TAA Benefits Producer or fishermen are eligible to apply for TAA benefits once a commodity petition has been certified and if:
• They are an owner, operator, landlord, tenant, sharecropper, or fisherman who is entitled to a share of the commodity available for marketing from the farm or fishing operation.
• They harvested the commodity in the year for which TAA eligibility has been established.
Applying for Cash Benefits Application must be made at a USDA Farm Service Agency (FSA) office within 90 days after the commodity has been certified as eligible for TAA. The application form is available at http://forms.sc.egov.usda.gov/eforms/Forms/FSA0229_030923V01.pdf or at local FSA offices. Information regarding the location of local FSA office is available at http://oip.usda.gov/scripts/ndisapi.dll/oip_agency/index?state=us&agency=fsa. After an application has been submitted the applicant has until September 30 of the current year to submit the following documentation:
• Certification that technical assistance has been received from the Extension Service.
• Acceptable production documentation for the commodity. • Evidence that net income was less than the last year in which no adjustment
assistance was received. • Proof that average gross revenue was less than $2.5M for preceding 3 years.
Applying for Technical Assistance Benefits Technical assistance at no cost will be widely available through the Extension Service. Technical assistance must be completed within 180 days after the commodity has been certified as eligible for TAA. Sources for technical assistance are listed at http://www.agrisk.umn.edu/taa/ or can be obtained by contacting one of the four regional TAA centers:

© 2003 TAA Technical Assistance 3
Western Region Washington State University (800) 477-4012 Southern Region Texas A&M University (254) 968-4144 Northeast Region University of Delaware (302) 831-6540 North Central Region University of Nebraska (402) 472-2039 Technical assistance will help producers and fishermen evaluate opportunities to improve production efficiencies, alternative or improved marketing, and alternative enterprises potentially suitable for the geographic area. The Texas Sea Grant Program is tentatively organizing a technical assistance workshop in conjunction with the 34th Annual Texas Aquaculture Association Conference and Trade Show, Jan. 20-23, 2003. The workshop is tentatively scheduled for Jan. 22, 2004 from 5pm to 7pm at the El Campo Civic Center, 2350 N. Mechanic (Hwy 71 North), El Campo, Texas 77437. The El Campo Civic Center web site is www.ci.el-campo.tx.us/civic-center.htm. The Texas Aquaculture Association conference information can be obtained from their web site at www.texasaquaculture.org. Applying for Retraining and Education Benefits To apply for Department of Labor retraining and education benefits contact your state department of labor. Links to your state department of labor TAA coordinators are available at http://www.doleta.gov/tradeact/contacts.cfm. The national Department of Labor TAA site is http://www.doleta.gov/tradeact. The Department of Labor provides TAA employment counseling, case assessment, job development, and self-directed job search services. Education assistance (Trade Readjustment Allowances) pay tuition and travel for up to 104 weeks of full-time education including classroom training, on-the-job training, and employer –based training. Deadlines to Apply for Benefits Application for cash benefits must be made at with FSA within 90 days after FAS announces a commodity is approved for TAA. Technical assistance must be received from the Extension Service within 180 after FAS announces a commodity is approved for TAA. Department of Commerce Assistance Farmers and fishermen may also qualify for assistance as business owners through the U.S. Department of Commerce. Qualified applicants may receive 50% cost sharing for projects like developing business plans, creating new marketing strategies, research and new product development, or design of marketing materials. A separate application with

© 2003 TAA Technical Assistance 4
the Department of Commerce is required. For more information contact go to www.taacenters.org/locations.html. To Obtain Further Information Extension’s one stop site for information on technical assistance is http://www.agrisk.umn.edu/taa. This site also provides links to obtaining cash benefits from FSA and retraining benefits from the Department of Labor. You can also obtain additional information at your local FSA or Extension county offices. Alternatively you can contact the Washington, D.C. Trade Adjustment Assistance Office, Foreign Agricultural Service, at (202) 720-2916 or write to USDA, Foreign Agricultural Service, Trade Adjustment Assistance, STOP 1021, 1400 Independence Avenue, SW, Washington, DC 20250-1021, or e-mail at [email protected].

© 2003 TAA Technical Assistance 5
• Status of the World and U.S. Shrimp Markets
• U.S. and World Shrimp Trade Trends in Production, Imports, and Exports
• Evaluating the Financial Viability of the Business
• Inventory of Resources and Talents
Where Am I?

© 2003 TAA Technical Assistance 6
© 2003 TAA Technical Assistance 7
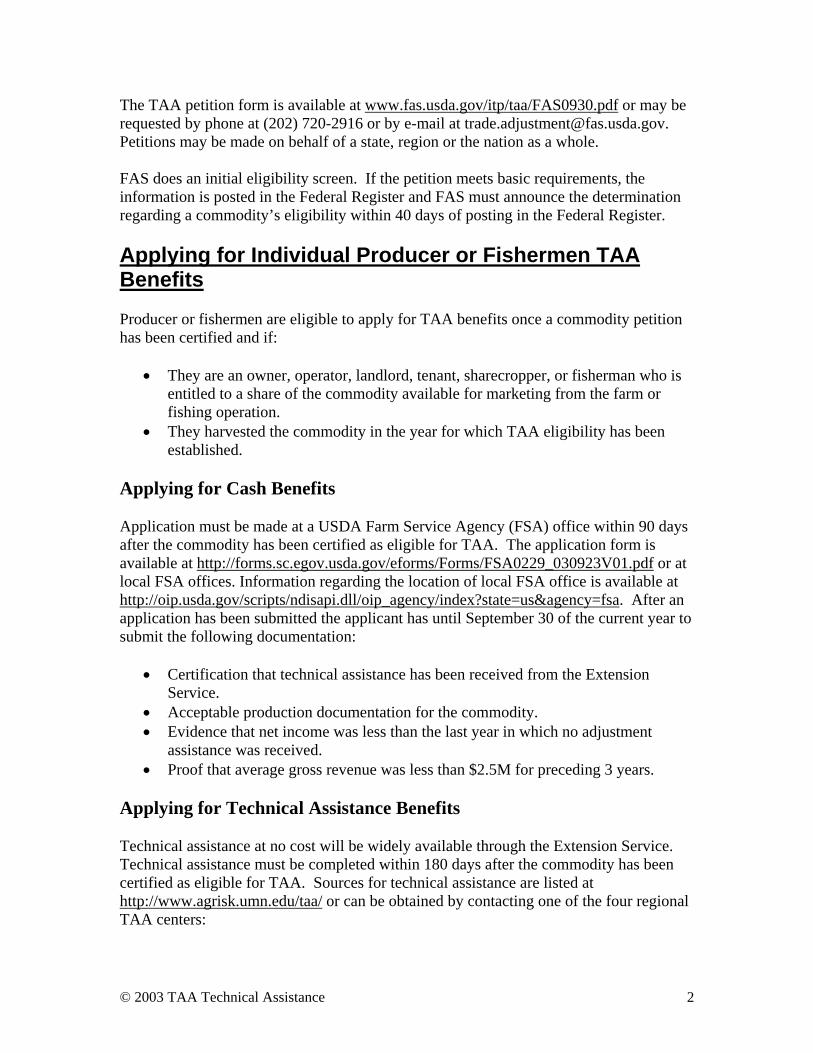
With domestic production averaging roughly 200 million pounds per year, any growth in the U.S. shrimp market beyond that level has to be supplied by imported product. Not surprisingly, imports have been a growing contributor to total U.S. shrimp supplies for decades. However, calendar 2001 signaled a departure from the gradual, annual increases in shrimp imports. Specifically, imports in 2001 exceeded 2000 levels by almost 122 million pounds, or 16 percent. In both 2002 and 2003, annual shrimp imports have set records that have been eclipsed in the following year. In 2002, even with the West Coast stevedores’ strike that began in October, imports exceeded the record set in 2001 by 64 million pounds (7 percent). Finally, shrimp imports in the first ten months of 2003 are 152 million pounds ahead of imports for the same time period last year, a 20 percent increase. Most U.S. producers and processors feel that sharply increased supplies are the root cause of the low ex-vessel prices they have received since 2001. Ironically, many shrimp farmers half a world away, who supply a growing fraction of the American marketplace, are also perplexed by the relatively low prices they are receiving. The question then becomes whether the last three years are symptomatic of a short-term imbalance between worldwide demand and supply, or whether we are seeing a fundamentally different global shrimp industry to which we must adapt. This section of the technical assistance report attempts to answer that question by reviewing what is known about (a) world shrimp production, (b) supply trends within the American marketplace, and (c) the drivers that steer the international shrimp trade. World Shrimp Production Shrimp are produced from practically every tropical and subtropical coastal country in the world. Historically, the source of supply has been wild harvests from the worldwide band of nearshore tropical waters. However, with many wild sources being harvested close to their maximum sustainable levels, new supplies have come from coastal shrimp farms; most located in developing countries within Southeast Asia, the Indian sub-continent, and Central America. Between 1979 and 1999, world production of tropical shrimp grew from 1.86 billion pounds of shell-on, headless product to 4.3 billion pounds [1]. In 1979, pond-raised shrimp contributed just 88 million shell-on, headless pounds to world production (4.7 percent) while wild sources supplied 1.78 billion pounds. Twenty-one years later wild harvests stand at 2.74 billion pounds worldwide, with cultured shrimp comprising 36.5 percent of the world production base of tropical shrimp (1.57 billion shell-on, headless pounds) (Table 1, Figure 1). Over this 21-year time frame, wild harvests grew about 41 million pounds a year while pond production grew by about 84 million pounds each year [2].
Status of World and U.S. Shrimp Markets

© 2003 TAA Technical Assistance 8
Table 1. Worldwide Production of Tropical Shrimp
from Capture Fisheries and Aquaculture
Shell-on, Headless Pounds Year Capture Aquaculture Total Supplies
Percent Cultured
1979 1,773,416,673 88,072,110 1,861,488,783 4.7% 1980 1,804,307,202 99,875,718 1,904,182,919 5.2% 1981 1,702,061,594 123,080,079 1,825,141,673 6.7% 1982 1,794,246,977 155,604,248 1,949,851,225 8.0% 1983 1,787,352,626 197,509,347 1,984,861,973 10.0% 1984 1,841,473,910 239,339,432 2,080,813,342 11.5% 1985 2,050,588,216 296,782,173 2,347,370,389 12.6% 1986 2,157,141,578 444,073,748 2,601,215,325 17.1% 1987 2,102,309,049 686,417,911 2,788,726,960 24.6% 1988 2,135,543,073 801,477,038 2,937,020,112 27.3% 1989 2,006,452,142 863,014,994 2,869,467,136 30.1% 1990 2,034,144,847 935,179,947 2,969,324,795 31.5% 1991 2,145,651,918 1,157,905,145 3,303,557,063 35.1% 1992 2,139,891,113 1,237,293,679 3,377,184,791 36.6% 1993 2,063,872,657 1,178,313,148 3,242,185,805 36.3% 1994 2,278,169,882 1,237,160,320 3,515,330,202 35.2% 1995 2,237,239,967 1,323,777,990 3,561,017,957 37.2% 1996 2,356,067,858 1,335,178,744 3,691,246,602 36.2% 1997 2,508,452,056 1,390,439,131 3,898,891,187 35.7% 1998 2,548,422,069 1,493,166,774 4,041,588,843 36.9% 1999 2,735,697,548 1,570,763,304 4,306,460,851 36.5%
Further growth in the global shrimp supplies will continue to be fueled by aquaculture for several reasons. First, wild, tropical shrimp resources across the globe appear to be fully utilized. Second, technological advances in the culture of marine shrimp have reduced
1979 1981 1983 1985 1987 1989 1991 1993 1995 1997 1999
0
1
2
3
4
5
Billions of shell-on, headless pounds
AquacultureCapture
Figure 1. Annual changes in world production of tropical shrimp from capture fisheries and aquaculture

© 2003 TAA Technical Assistance 9
both the risk of crop failure and the cost of production. For example, feed formulations are being evaluated that replace a larger fraction of fish meal with cereal or grain-based protein thereby reducing feed cost; a major production expense. Furthermore, shrimp farming need not be exclusively located in the coastal zone. In the early days, shrimp farming was limited to coastal regions where estuarine water could be pumped into ponds. Today, however, some countries have developed farms in upland areas since species like Pacific white shrimp (Litopenaeus vannamei) can be grown in fresh water. Aside from the obvious advantage of greater expansion capability, moving away from the coastal zone typically reduces the environmental impacts on sensitive, estuarine areas. Third, many developing countries continue to pursue a policy of producing and processing various agricultural commodities for the export trade as a means of providing employment to a growing labor force while funding improvements in their national infrastructures. Market Growth in the Major Shrimp-consuming Countries Historically, the major worldwide markets for shrimp have been located in Japan, the European Union (E.U.), and the U.S. The U.S. has consistently remained the largest shrimp market in the world. Until the mid-nineties, Japan was the second-largest shrimp market but then began to decline in response to slower economic growth. Today, the E.U. is the second-largest major shrimp market (Table 2, Figure 2)[1].
Table 2. Apparent Annual Consumption of Shrimp Among Major Markets
Shell-on, headless pounds
Year USA European Union Japan Total 1988 788,280,000 513,810,467 618,465,015 1,920,555,482 1989 738,633,000 554,359,756 670,020,120 1,963,012,876 1990 719,225,000 611,884,457 683,426,520 2,014,535,977 1991 777,954,000 662,350,887 688,806,720 2,129,111,607 1992 840,958,000 716,991,714 685,373,535 2,243,323,249 1993 817,042,000 694,483,316 713,890,800 2,225,416,116 1994 870,247,000 727,996,560 725,755,905 2,323,999,465 1995 846,644,000 695,055,646 695,648,835 2,237,348,481 1996 864,468,000 743,123,014 689,604,930 2,297,195,944 1997 930,642,000 722,002,378 641,037,600 2,293,681,978 1998 1,000,792,000 848,346,959 571,333,140 2,420,472,099 1999 1,102,047,000 816,296,490 596,265,075 2,514,608,565

© 2003 TAA Technical Assistance 10
When worldwide supplies (Table 1, Figure 1) are compared with total apparent consumption from the three major markets (Table 2, Figure 2), it is clear that shrimp consumption across the rest of the world is also increasing. In 1988, approximately two-thirds of worldwide supplies (1.9 billion shell-on, headless pounds) were consumed in the U.S., the E.U. and Japan, with 1 billion pounds consumed in the rest of the world. In 1999 however, the U.S., the E.U. and Japan consumed 58 percent (2.5 billion pounds) of the 4.3 billion pound worldwide supply that year, with the rest of the world using approximately 1.8 billion pounds. Increasing worldwide consumption outside the major shrimp markets is a positive signal for the domestic shrimp industry because it suggests that more of the growing supply base is being consumed outside the historic major shrimp consuming regions. Consumption and Supply Trends in the American Marketplace Since 1980, U.S. shrimp consumption has virtually tripled, growing from around 423 million pounds to approximately 1.3 billion pounds in 2001 (Table 3, Figure 3). Between 1980 and 2001, consumption has grown by an average of 33 million pounds each year.
1988 1989 1990 1991 1992 1993 1994 1995 1996 1997 1998 19990.0
0.5
1.0
1.5
2.0
2.5
3.0
Billions of Shell-on, headless pounds
JapanEuropean UnionUSA
Figure 2. Apparent Consumption of Shrimp Across the Major World Markets

© 2003 TAA Technical Assistance 11
Table 3. The U.S. Market for Shrimp
Thousands of Pounds of Shell-on, Headless Product
Year
Landings
Imports Dec. 31 Cold
Storage HoldingsCold StorageAdjustments Exports
ApparentConsumption
Computed Trendin Consumption
1979 205,587 267,119 109,634 53,058 NA NA1980 207,869 255,957 109,509 125 41,054 422,897 436,0481981 218,900 256,920 89,886 19,623 43,721 451,722 469,0001982 175,613 319,596 76,645 13,241 37,198 471,252 501,9531983 155,591 421,179 101,357 (24,712) 35,937 516,121 534,9061984 188,132 422,340 81,596 19,761 26,591 603,642 567,8581985 207,239 452,232 79,379 2,217 26,940 634,748 600,8111986 244,409 492,005 75,633 3,746 30,450 709,710 633,7641987 223,514 583,030 92,319 (16,686) 33,813 756,045 666,7161988 203,350 598,210 70,816 21,503 34,784 788,279 699,6691989 215,825 563,523 67,770 3,046 36,056 746,338 732,6221990 213,899 579,427 78,035 (10,265) 59,682 723,379 765,5741991 198,115 632,775 71,655 6,380 87,186 750,084 798,5271992 207,086 694,252 69,105 2,550 81,604 822,284 831,4801993 180,687 708,683 76,751 (7,646) 81,447 800,277 864,4331994 174,969 749,993 70,789 5,962 77,755 853,169 897,3851995 190,208 719,463 71,528 (739) 77,677 831,255 930,3381996 195,902 720,852 61,857 9,671 75,130 851,295 963,2911997 179,084 810,696 67,926 (6,069) 66,674 917,037 996,2431998 173,304 893,578 83,891 (15,965) 65,302 985,615 1,029,1961999 189,112 959,915 79,893 3,998 65,427 1,087,598 1,062,1492000 218,542 1,024,476 66,633 13,260 70,383 1,185,895 1,095,1012001 201,428 1,178,232 81,842 (15,209) 67,975 1,296,476 1,128,054
a. Apparent consumption = [landings + imports + (Dec. 31 cold storage holdings in the previous year – Dec. 31 cold storage holdings in the current year) – exports]. End-of-year cold storage adjustments reflect the amount of product withheld from the market or entered into the market as determined by changes in subsequent years. For example, end-of-year inventories between 1999 and 2000 dropped from 79,893,000 lb. to 66,633,000 lb., so an additional 13,260,000 lb. entered the market in calendar 2000.
Since 1980, domestic landings of tropical shrimp have remained relatively steady. Therefore, with consumption increasing by an average of 33 million pounds each year, imports have accounted for all expansion in the market. Because of significant growth in the total domestic shrimp market, the market share of domestic producers has gradually
1980 1982 1984 1986 1988 1990 1992 1994 1996 1998 20000
500
1,000
1,500
Millions of shell-on, headless pounds
Apparent ConsumptionComputed Trend
Figure 3. The U.S. market for shrimp (shell-on, headless basis)

© 2003 TAA Technical Assistance 12
slipped from 44.6 percent in 1980 to 14.6 percent in 2001 (Table 4, Figure 4). It is important to realize that the domestic market share has dropped because of market growth, not declining production levels in the domestic shrimp fishery.
Table 4. Domestic and Import Market Shares of the U.S. Shrimp Market
Thousands of Pounds Market Share Thousands of Pounds Market Share Year Landings Imports Total Domestic Import Year Landings Imports Total Domestic Import1979 205,587 267,119 472,706 43.5% 56.5% 1991 198,115 632,775 830,890 23.8% 76.2%1980 207,869 255,957 463,826 44.8% 55.2% 1992 207,086 694,252 901,338 23.0% 77.0%1981 218,900 256,920 475,820 46.0% 54.0% 1993 180,687 708,683 889,370 20.3% 79.7%1982 175,613 319,596 495,209 35.5% 64.5% 1994 174,969 749,993 924,962 18.9% 81.1%1983 155,591 421,179 576,770 27.0% 73.0% 1995 190,208 719,463 909,671 20.9% 79.1%1984 188,132 422,340 610,472 30.8% 69.2% 1996 195,902 720,852 916,754 21.4% 78.6%1985 207,239 452,232 659,471 31.4% 68.6% 1997 179,084 810,696 989,780 18.1% 81.9%1986 244,409 492,005 736,414 33.2% 66.8% 1998 173,304 893,578 1,066,882 16.2% 83.8%1987 223,514 583,030 806,544 27.7% 72.3% 1999 189,112 959,915 1,149,027 16.5% 83.5%1988 203,350 598,210 801,560 25.4% 74.6% 2000 218,542 1,024,476 1,243,018 17.6% 82.4%1989 215,825 563,523 779,348 27.7% 72.3% 2001 201,428 1,178,232 1,379,660 14.6% 85.4%1990 213,899 579,427 793,326 27.0% 73.0%
The previous analysis indicates that the American shrimp market has been dominated by imports for more than two decades. However, a closer examination of these imports between 1997 and 2001 should provide a clear assessment of competitive conditions present in the marketplace and may help answer the question stated at the outset: “Are the last three years symptomatic of a short-term imbalance between worldwide demand and supply, or is this the new reality to which we must adapt?”. This assessment begins by measuring how much of our supply originates from wild-harvested and farm-raised imports. Next, we consider the volume of imports by exporting country. Finally, the types of shrimp products exported to the U.S. are reviewed.
1980 1982 1984 1986 1988 1990 1992 1994 1996 1998 2000
0
500
1,000
1,500
Millions of shell-on, headless pounds
ImportsLandings
Figure 4. The contribution domestic landings and imports make to the U.S. shrimp market.

© 2003 TAA Technical Assistance 13
The Contribution Made by Source and Production Method to the U.S. Shrimp Market Between 1997 and 2001, the supply of shrimp available for utilization in the U.S. market grew by 31 percent or 257 million pounds (expressed as actual product weight) (Table 5, Figure 5) [3]. Over this five-year period, domestic landings increased by 22 million pounds, wild-harvested imports increased by 38 million pounds, and farm-raised imports increased by 197 million pounds. By 2001, cultured imports represented 65.2 percent of the beginning annual supply (708 million pounds), with domestic landings and wild-harvested imports respectively accounting for 18.6 percent (201 million pounds) and 16.2 percent (176 million pounds) of total beginning supplies. Imported, farm-raised shrimp have accounted for roughly 80 percent of total shrimp imports over the five-year time series.
Table 5. Sources of Shrimp Available for the U.S. Market Contributed from Domestic Landings, Wild-harvested Imports, and Farm-raised Imports
Imports
(actual product wt.) The Contribution of Farm-raised Shrimp to:
Year Dom. Landings
(shell-on, hdls. wt.) Wild-
harvested Farm-raisedAvailable Supplies Total Imports Beginning Supplies
1997 179,084,000 138,332,748 510,636,951 828,053,699 78.7% 61.7%1998 173,304,000 139,976,804 556,231,212 869,512,016 79.9% 64.0%1999 189,112,000 133,704,146 598,609,008 921,425,154 81.7% 65.0%2000 218,542,000 152,658,192 609,553,902 980,754,094 80.0% 62.2%2001 201,428,000 176,223,677 707,814,567 1,085,466,244 80.1% 65.2%
1997 1998 1999 2000 2001
0
200
400
600
800
1,000
1,200
Millions of pounds (actual product weight)
Farm-raised ImportsWild-harvested ImportsDomestic Landings
Figure 5. Sources of shrimp available for the U.S. market contributed from domestic landings, wild-harvested imports, and farm-raised imports

© 2003 TAA Technical Assistance 14
With farm-raised imports accounting for 65 percent of beginning supplies in the American marketplace, the quality attributes of aquacultured production have become the new standard against which all other shrimp products are judged. This upgraded standard represents a significant, fundamental change in the expectations of corporate procurement officers. “Conformance to specifications” or standards is the first set of attributes used to define overall shrimp quality. Two primary “conformance-to-specifications” elements are considered in evaluating the quality of shell-on, headless shrimp: pack-style and product condition. Pack-style attributes include (a) accurate net weights and counts, (b) count uniformity, (c) presence/absence of damaged tails or pieces which, in most food service applications, are considered unusable elements, (d) the fraction of black-spotted shrimp, (e) soft-shelled product, etc. Product condition parameters include those elements that have bearing on edibility and enjoyment such as (a) dehydration, (b) texture, and (c) mild, “fresh-caught” odor, etc. “Conformance-to-specifications” criteria are particularly important as a screening mechanism throughout the supply chain. In other words, products that do not conform to predetermined specifications are immediately eliminated from consideration, regardless of other attributes. “Conformance-to-specifications” criteria drive purchase decisions because they represent the cost-side of non-compliant quality for the purchaser. For instance, a sample of shell-on, headless shrimp that is non-compliant across pack-style criteria (e.g., incorrect average count size, or the presence of pieces or damaged tails) implies a higher cost per serving compared with a pack that does not contain these defects. A similar argument can be made about product condition defects. The Contribution Made by Shrimp-exporting Country to the U.S. Shrimp Market According to import data maintained by the International Trade Commission (ITC), in any year about 100 countries export shrimp to the U.S. In 2001, 83 percent of total imports or roughly 737 million pounds (actual product weight basis) originated from just ten countries, with the remaining countries collectively exporting about 147 million pounds to the U.S. (Table 6, Figure 6) [3]. Slightly more than half of total shrimp imports originate from just three countries: Thailand, Viet Nam, and India (Table 6, Column 7). Thailand is the largest shrimp exporter to the U.S. In 2001, Thai shrimp accounted for 34 percent of total imports (roughly 300.3 million pounds) and 28 percent of total, beginning supplies. Nine of the top-ten shrimp exporting countries generate at least two-thirds of their production from farming systems (Table 6, column 5). Collectively, farm-raised shrimp comprises 87 percent of all shrimp imported to the U.S. by the top-ten shrimp-exporting countries (615 million farm-raised pounds out of 737 million total pounds). Among the other shrimp-exporting countries, farm-raised shrimp accounts for a smaller fraction of their total exports to the U.S. (63 percent).

© 2003 TAA Technical Assistance 15
Table 6. 2001 Shrimp Import Volumes from both the Top Ten and Remaining Shrimp-exporting Countries Delineated by Production Method
Cumulative
Farm-raised Wild-harvested
Total Imports Total Imports Farm-raised Imports
Country pounds (actual product weight)
Farmed / Wild Pct.
Pounds Pct. Pounds Pct.Thailand 288,556,574 11,710,412 300,266,986 96 / 04 300,266,986 34.0% 288,556,574 40.8%Viet Nam 56,704,216 16,699,300 73,403,516 77 / 23 373,670,502 42.3% 345,260,790 48.8%India 48,563,155 24,092,672 72,655,827 67 / 33 446,326,329 50.5% 393,823,944 55.6%Mexico 55,435,504 10,764,047 66,199,551 84 / 16 512,525,880 58.0% 449,259,448 63.5%China 41,441,804 20,643,295 62,085,099 67 / 33 574,610,979 65.0% 490,701,252 69.3%Ecuador 58,544,647 460,238 59,004,885 99 / 01 633,615,864 71.7% 549,245,899 77.6%Indonesia 26,700,743 8,243,300 34,944,043 76 / 24 668,559,907 75.6% 575,946,642 81.4%Guyana 458,807 25,316,889 25,775,696 02 / 98 694,335,603 78.5% 576,405,450 81.4%Brazil 18,322,373 3,327,601 21,649,974 85 / 15 715,985,577 81.0% 594,727,823 84.0%Honduras 20,526,162 828,563 21,354,725 96 / 04 737,340,302 83.4% 615,253,984 86.9%All Other Countries 92,560,583 54,137,359 146,697,942 63 / 37 884,038,244 100.0% 707,814,567 100.0%
Between 1997 and 2001, annual exports of shrimp from all exporting countries grew, on average, by 53.6 million pounds per year (actual product weight). The volume of exports to the U.S. by the top-ten countries grew by 49.3 million pounds per year while exports from the remaining shrimp-exporting countries grew by 4.3 million pounds per year; less than one-tenth of the rate computed for those countries among the top-ten. Considering a few of the top-ten countries individually, the computed average annual growth rates of shrimp exported from Thailand, Viet Nam, and India between 1997 and 2001 were respectively 35.2 million pounds per year, 15.5 million pounds per year, and 7.6 million
ThailandViet Nam
IndiaMexico
ChinaEcuador
IndonesiaGuyana
BrazilHonduras
All Others0
100
200
300
400
Millions of pounds (actual product weight)
Wild-harvestedFarm-raised
Figure 6. 2001 Import Volumes from Both the Top Ten and the Remaining Shrimp-exporting Countries Delineated by Production Method

© 2003 TAA Technical Assistance 16
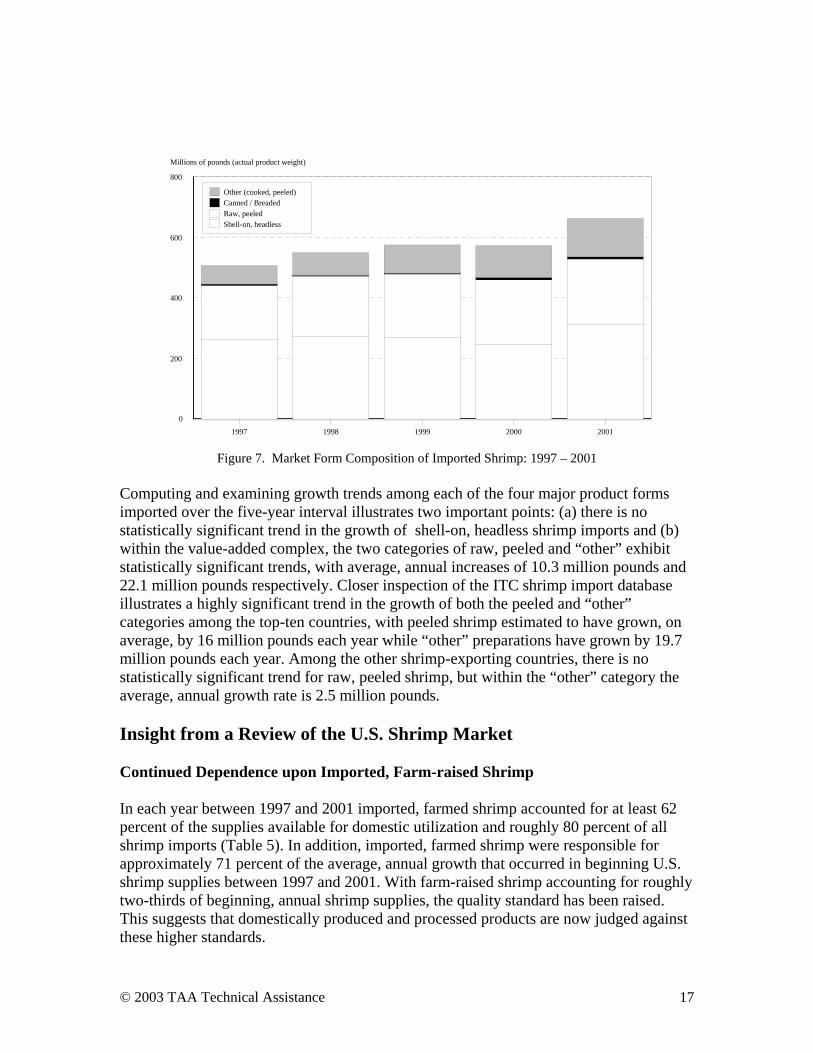
pounds per year. Importantly, two of the countries in the top-ten actually experienced negative growth rates in the amount of shrimp they exported to the U.S. between 1997 and 2001. Specifically, the computed average, annual growth rate for Mexico over the five-year interval was -3.1 million pounds each year while the average annual growth rate for Ecuador was -26 million pounds each year. The Contribution Made by Product Form to the U.S. Shrimp Market Understanding the product forms imported to the American marketplace is important as the domestic industry addresses how best to tailor wild, domestic shrimp products to specific segments of the U.S. market. The product forms of shrimp that enter the U.S. span the continuum of convenience; from raw, frozen, shell-on, headless product to hand-peeled, cooked shrimp that, once thawed, are ready-to-eat. For reporting purposes, the spectrum of shrimp products is generally collapsed into four primary forms. These include (a) shell-on, headless product, (b) raw, peeled shrimp, (c) canned or breaded shrimp, and (d) “other” preparations which mostly consists of cooked, peeled product. Of the four categories listed above, the last three represent the value-added products. Between 1997 and 2001, total annual shrimp imports were about equally split between the various sizes of shell-on, headless product and all of the value-added market forms combined (e.g., peeled, canned or breaded, and “other”). Over that five-year interval, total imports grew by 36 percent. Within this same time frame, shell-on, headless volumes increased by 25 percent (98 million product weight pounds) while the value-added component increased by 45 percent (137.1 million product weight pounds) (Table 7, Figure 7) [3].
Table 7. Market Form Composition of Imported Shrimp: 1997 – 2001
Shell-on, headless
Peeled
Canned or Breaded Other
Total, AllMarket Forms
Total, Value-added
Year pounds (actual product weight) Percent
Value-added 1997 343,704,554 235,592,263 4,072,027 65,600,855 648,969,699 305,265,145 47.0% 1998 341,956,637 264,426,404 4,024,368 85,800,607 696,208,016 354,251,379 50.9% 1999 344,962,926 275,587,569 5,233,648 106,602,103 732,386,246 387,423,320 52.9% 2000 338,798,460 285,815,207 7,887,444 129,740,299 762,241,410 423,442,950 55.6% 2001 441,658,079 276,567,415 11,376,135 154,436,615 884,038,244 442,380,165 50.0%
© 2003 TAA Technical Assistance 17
Figure 7. Market Form Composition of Imported Shrimp: 1997 – 2001
Computing and examining growth trends among each of the four major product forms imported over the five-year interval illustrates two important points: (a) there is no statistically significant trend in the growth of shell-on, headless shrimp imports and (b) within the value-added complex, the two categories of raw, peeled and “other” exhibit statistically significant trends, with average, annual increases of 10.3 million pounds and 22.1 million pounds respectively. Closer inspection of the ITC shrimp import database illustrates a highly significant trend in the growth of both the peeled and “other” categories among the top-ten countries, with peeled shrimp estimated to have grown, on average, by 16 million pounds each year while “other” preparations have grown by 19.7 million pounds each year. Among the other shrimp-exporting countries, there is no statistically significant trend for raw, peeled shrimp, but within the “other” category the average, annual growth rate is 2.5 million pounds. Insight from a Review of the U.S. Shrimp Market Continued Dependence upon Imported, Farm-raised Shrimp In each year between 1997 and 2001 imported, farmed shrimp accounted for at least 62 percent of the supplies available for domestic utilization and roughly 80 percent of all shrimp imports (Table 5). In addition, imported, farmed shrimp were responsible for approximately 71 percent of the average, annual growth that occurred in beginning U.S. shrimp supplies between 1997 and 2001. With farm-raised shrimp accounting for roughly two-thirds of beginning, annual shrimp supplies, the quality standard has been raised. This suggests that domestically produced and processed products are now judged against these higher standards.
1997 1998 1999 2000 2001
0
200
400
600
800
Millions of pounds (actual product weight)
Other (cooked, peeled)Canned / BreadedRaw, peeledShell-on, headless

© 2003 TAA Technical Assistance 18
Major Shrimp-exporting Countries In 2001, 84 percent of total shrimp imports were supplied by just ten countries. Between 1997 and 2001, the volume of exports to the U.S. by the top ten countries grew, on average, by 49 million pounds per year. Exports to the U.S. are becoming more geographically concentrated, even among the top ten countries, with exports from Thailand, Viet Nam, and India accounting for slightly more than 50 percent of total imports. Exports from Thailand alone account for almost the same volume that is collectively exported to the U.S. by those countries that occupy the second through the sixth places within the top ten – Viet Nam, India, Mexico, China, and Ecuador (Table 6). Growth in the Value-added Fraction of Imported Shrimp Value-added shrimp products – peeled, canned or breaded, and “other” items (mostly cooked, peeled shrimp) – accounted for roughly 50 percent of total imports each year between 1997 and 2001 (Table 7). The average, annual growth rate for the value-added fraction is computed to be 34.3 million pounds per year. Growth in the value-added fraction accounts for 64 percent of the annual growth of total shrimp imports. Virtually all of the increase in the value-added fraction has occurred within two categories: (a) raw, peeled product and (b) cooked, peeled preparations. A growing, value-added fraction of total shrimp imports should come as no surprise. First, several of the top ten countries (e.g., Thailand, Viet Nam, and India) have a growing, dependable supply of raw materials. Second, convenience can be added to this dependable supply at a relatively low cost because wage rates in most shrimp-exporting countries are much lower than those in the U.S. For example, the reported wage rate for Thai food, beverage, and tobacco workers in 1999 was 78¢ an hour, while hourly wage rates for U.S. employees in similar occupations were reported to average roughly $12 per hour [6]. Third, shrimp can be grown to a predetermined count size that meshes with menu requirements and advertising plans. Thus, the value-added market forms from the top-ten countries appear to target the specific, convenience requirements of the largest food service operators. For most of the casual dining establishments around the country, purchasing the precise market form required for a particular shrimp preparation enables the operator to minimize on-site preparation time and concentrate on those specialized in-store functions that support retail success. What Drives the International Shrimp Trade? The recent history of imported shrimp demonstrates an unprecedented increase between 2001 and 2003. However, questions remain about why shrimp imports increased so dramatically in 2001 and continued through 2003. Answering this question requires that three issues be considered: (a) tariffs, (b) currency exchange rates, and (c) enforcement of food safety regulations. Importantly, these institutional considerations can create national demand/supply imbalances that result in dramatic changes in both producer and wholesale prices.

© 2003 TAA Technical Assistance 19
Tariff Issues Shrimp are routinely traded on the world market, but individual countries have differing approaches in taxing imported shrimp. All market forms of shrimp enter the U.S. market duty-free [4]. However, in some countries the tariff rates can change almost overnight, or can be applied differently to various market forms of the same product. Other things being equal, tariffs result in the exporter netting less money on the transaction. Of course if the price offer takes the tariff into account, then other factors like currency exchange rates and differences in transportation costs direct the flow of shrimp from producing to consuming country. The E.U. exemplifies a trading block of nations where tariffs for certain products are in a state of flux. Specifically, certain nations that exported shrimp to the E.U. experienced tariff treatment different from that accorded to other shrimp-producing countries. In the fourth quarter of 2001, Thai shrimp marketers were surprised to learn that the lower tariffs the E.U. had imposed under the generalized system of preferences had ended, and the tariff on Thai shrimp would be 12 percent on frozen, raw products and 20 percent on cooked shrimp [5]. E.U. duties on processed shrimp (e.g., peeled or cooked, peeled varieties) from other countries such as Peru, Indonesia, India and Vietnam were taxed at between 3.6 percent and 7 percent, while a tariff rate of 4.2 percent was applied to frozen shell-on, headless shrimp. Importantly, such tariff increases make shrimp from countries affected by these higher tariffs appear less expensive in competing markets like the U.S. Currency Exchange Rates Exchange rates for currency are important issues for most shrimp-exporting countries because the revenues earned from the sale of shrimp in many developing countries are used to fund improvements in national infrastructure. Generally speaking, national infrastructure such as aircraft, road-building services, petroleum development, electrical power and its distribution, etc. is priced in U.S. Dollars, Euros, or Yen. When the exchange rates are factored into the pricing formula along with tariffs, the final destination of shrimp exported from a producing country can clearly be seen. Tables 8 through 10 illustrate three scenarios that compute different ending prices when tariffs and currency exchange rates change. In Table 8, a hypothetical Thai marketer offers shrimp to an E.U. buyer under the provisions of a 4.2 percent tariff and a Dollar/Euro exchange rate of 1.0823. As shown in Table 8, after accounting for the tariff and the exchange rate, the price of 5 Euros per pound offered by the E.U. buyer nets the marketer $4.426 per pound.

© 2003 TAA Technical Assistance 20
Table 8. Computing a U.S. Dollar Equivalent Price for Thai Shrimp Offered for Sale in the E.U. with a 4.2 Percent Tariff and an Exchange Rate where One U.S. Dollar Equals 1.0823 Euros
Conditions: Current E.U. tariff is 4.2 percent ● Exchange rate: 1 Euro = $0.924 ● Exchange rate: $1.00 = 1.0823 Euro
A firm in the E.U. bids 5.00 Euros/lb. A bid is also solicited from a U.S. firm.
Determine E.U. bid price in U.S. dollars after accounting for tariff and exchange rate issues:
= (5.00 Euro / lb. * (1 - % tariff)) * ($1.00 / 1.0823 Euro) = (5.00 Euro / lb. * (0.958)) * ( $1.00 / 1.0823 Euro) = 4.79 Euro / lb. * $0.924 / Euro = 4.79 Euro / lb. * $0.924 / Euro = $4.426 / lb.
After paying the tariff and accounting for the exchange rate, that bid of 5.00 Euros/lb. is worth $4.426 U.S.
If the U.S. bid price is at least equal to $4.426 / lb. then the Thai processor would sell his shrimp in the U.S. assuming that transportation costs are equal.
In Table 9 only the tariff rate has changed; this time to 12 percent. After the tariff increase, the Thai marketer would net $4.065 per pound on the same bid of 5 Euros per pound; an 8.2 percent reduction. If the freight cost from Bangkok, Thailand to either the U.S. or Europe is the same, then should a U.S. buyer offer a price just above the $4.065 the seller would net in the E.U., then those shrimp would likely be shipped to the U.S.
Table 9. Computing a U.S. Dollar Equivalent Price for Thai Shrimp Offered for Sale in the E.U. with a 12 Percent Tariff and an Exchange Rate where One U.S. Dollar Equals 1.0823 Euros
Conditions: Current E.U. tariff is 12 percent ● Exchange rate: 1 Euro = $0.924 ● Exchange rate: $1.00 =
1.0823 Euro
A firm in the E.U. bids 5.00 Euros/lb. A bid is also solicited from a U.S. firm.
Determine E.U. bid price in dollars after accounting for tariff and exchange rate issues: = (5.00 Euro / lb. * (1 - % tariff)) * ($1.00 / 1.0823 Euro) = (5.00 Euro / lb. * (0.88)) * ( $1.00 / 1.0823 Euro) = 4.40 Euro / lb. * $0.924 / Euro = 4.40 Euro / lb. * $0.924 / Euro = $4.065 / lb.
After paying the tariff and accounting for the exchange rate, that bid of 5.00 Euros/lb. is worth $4.065 U.S.
If the U.S. bid price is at least equal to $4.065 / lb. then the Thai processor would sell his shrimp in the U.S. assuming that transportation costs are equal.
Table 10 presents conditions where one U.S. Dollar is worth less than one Euro. In this situation, the 5 Euro per pound bid would actually be worth $5.72 per pound. In this scenario, the American shrimp buyer would have to offer something at least equal to $5.72 for shrimp to be delivered to the United States.

© 2003 TAA Technical Assistance 21
Table 10. Computing a U.S. Dollar Equivalent Price for Shrimp Offered for Sale in the E.U. with a 12 Percent Tariff and an Exchange Rate where One U.S. Dollar Equals 0.769 Euros
Conditions: Current E.U. tariff is 12 percent ● Exchange rate: 1 Euro = $1.30 ● Exchange rate: $1.00 = 0.769 Euro
A firm in the E.U. bids 5.00 Euros/lb.
A bid is also solicited from a U.S. firm.
Determine E.U. bid price in dollars after accounting for tariff and exchange rate issues: = (5.00 Euro / lb. * (1 - % tariff)) * ($1.00 / 0.769 Euro) = (5.00 Euro / lb. * (0.88)) * ( $1.00 / 0.769 Euro) = 4.40 Euro / lb. * $1.30 / Euro = 4.40 Euro / lb. * $1.30 / Euro = $5.72 / lb.
After paying the tariff and accounting for the exchange rate, that bid of 5.00 Euros/lb. is worth $5.72 U.S.
If the U.S. bid price is at least equal to $5.72 / lb. then the Thai processor would sell his shrimp in the U.S. assuming that transportation costs are equal.
Thus, when the dollar is valued higher than the native currency in the country (or trading block) where the shrimp are sold, the shrimp appear less expensive in the American market, and product would be expected to flow to the U.S. Conversely, when the native currency in the country (or trading block) where the shrimp are sold is valued higher than the dollar, the shrimp would have to command a relatively high price in the U.S. to remain competitive with the bid offered in another country. In this situation, the exporter may find it easier to sell his shrimp in the E.U. because to equal the bid of 5 Euros per pound, a U.S. firm would have to offer at least $5.72 per pound. Enforcement of Food Safety Regulations [6] Food safety considerations are not new issues in the international shrimp trade. In the seventies and eighties, shipments from certain exporting countries were automatically detained pending sampling for bacterial pathogens. Today, the primary food safety issue in the world shrimp trade is residue of banned antibiotics in farmed product. For some shrimp-farming countries the food safety requirements in receiving countries have become much more important than tariffs or currency exchange rates in steering international trade. Expectations of regulatory oversight and scrutiny of incoming shipments for compliance with a country’s food safety requirements can be the paramount issue in deciding where shrimp are sold; particularly if non-compliant product can be destroyed by the importing country’s food safety authority. Beginning in August 2001, chloramphenicol, a broad-spectrum antibiotic was detected in shrimp offered for sale in the E.U. [7]. This compound has been banned in most countries for over a decade. With a zero tolerance for this compound, public health authorities in the E.U. blocked importation of non-compliant shrimp; much of it from China, Southeast Asia and the Indian sub-continent [7]. Citing the risk associated with sending potentially non-compliant shrimp to the E.U., Peter Redmayne, writing for Seafoodbusiness.com, noted in May 2002 that “The European market for Asian shrimp is dead, since other Asian producers can't afford to risk having their containers seized and destroyed by E.U.

© 2003 TAA Technical Assistance 22
regulators. As a result, shrimp that used to go to Europe is going to the United States, which is putting pressure on prices” [7]. Many in the domestic industry questioned why the aggressive lead taken in the E.U. was not followed by the U.S. Food and Drug Administration. In the first few months after the initial detection of chloramphenicol in the E.U., the U.S. was reeling from the 911 terrorist attacks and the subsequent distribution of anthrax through the U.S. Postal Service. Understaffed, and preoccupied with new bio-terrorism concerns in the nation’s food supply, the Food and Drug Administration performed limited testing for chloramphenicol in 2001. A maximum level of 5 parts per billion (ppb) had been in force for some time, but imported shrimp was not scrutinized for the compound. In summer of 2002, public health officials in several Gulf States initiated their own sampling plans to determine the presence and level of chloramphenicol in imported shrimp products. Early sampling has shown the presence of the compound in farm-raised shrimp and crawfish from some Southeastern Asian countries. In late 2002, the Food and Drug Administration lowered the federal action level from 5 parts per billion (ppb) to 1 ppb; then, in the first half of 2003 FDA adopted the worldwide standard for residual chloramphenicol of 0.3 ppb, so differences in this particular food safety standard are beginning to fade among the major shrimp-importing countries. This is a positive signal that should help level the worldwide “playing field.” Changing an action level to a lower limit is an important step in harmonizing food safety requirements, but it is the periodic operational oversight and sampling that makes such action levels effective. In fact, FDA is beginning a more aggressive sampling plan. On August 26, 2003 “The National Fisheries Institute announced that the FDA has initiated a new sampling assignment to test for chloramphenicol in shrimp. An FDA assignment is an instruction to FDA field offices to collect a specific number of samples over a period of time. The FDA has not announced the number [of samples to be taken] for this assignment, but has asked its field offices to collect about 12 samples per week” [7]. The additive effects of high tariffs in the E.U., a strong U.S. dollar, and inconsistent food safety standards among shrimp-importing countries have pushed record levels of relatively low-priced shell-on, headless shrimp into the American marketplace. Given that the domestic industry maintains about a 15 to 20 percent market share (depending on market form), relatively low commodity prices for the remaining 80 percent of the market imply that domestic producers will also receive much lower prices for their harvests. As shown in Table 8 and 9 (above), when E.U. tariffs increase while the dollar is strong, prices offered in competing markets like the U.S. can as much as drop 8 percent overnight. Factor in the impact of a “distressed sale” (i.e., shrimp sold in the American marketplace that could not be sold elsewhere in the world because it could not comply with stated food safety standards) to an already falling price, and the price-taking domestic producer receives prices he has not seen in years.

© 2003 TAA Technical Assistance 23
What Does a Review of the World and U.S. Shrimp Markets Suggest? At the beginning of this section the question many producers have asked was raised. Specifically, “Are the last three years symptomatic of a short-term imbalance between worldwide demand and supply, or whether we are seeing a fundamentally different global shrimp industry to which we must adapt?” The short answer is “some of both.” On the fundamental side, global supplies of shrimp are growing in response to breakthroughs in shrimp farming and the economic opportunities an agricultural export provides. In the future, the American marketplace will increase its dependence on imported, farm-raised shrimp products. A larger fraction of these farm-raised imports will likely come from fewer countries such as Thailand, Viet Nam, and India. In addition, it is clear that the major shrimp-exporting countries will continue to increase their percentage of value-added shrimp products destined for the U.S. Furthermore, with farm-raised shrimp accounting for the “lion’s share” of the domestic shrimp market, the quality standard for the domestic market has also been significantly upgraded. Products that cannot meet the new standard for pack style and product condition will be relegated to a lower tier within the market, and will be priced accordingly. Focusing on the effects of a short-term imbalance between demand and supply, growing supplies of cultured shrimp coincided with a global economic slowdown that began in the second half of 2000. This set the stage for a general softening of prices that has affected every member of the worldwide shrimp industry. Additional downward pressure on U.S. ex-vessel and wholesale prices resulted from three other regulatory and institutional issues. First, aggressive enforcement by the European Union (E.U.) for banned antibiotics prevented non-compliant imports from entering that trading block. This preemption resulted in additional quantities being rerouted to the only other major market in the world – the U.S. Second, a sharply-higher tariff rate imposed by the E.U. on shrimp imported from certain Asian countries in December 2001 made those shrimp less expensive in competing markets like the U.S. Third, until recently, the dollar was quite strong against other currencies which also made imports less expensive in the American market. These four conditions have resulted in record imports to the U.S. market since 2001. This onslaught of lower-priced imports has dramatically reduced ex-vessel shrimp prices by $1.00 to $2.00 per pound depending upon the size count. In the future, the world will have a greater supply of varied shrimp products than ever before. Importantly, the historic data suggest that a growing fraction of these shrimp will be consumed outside the three major shrimp markets of the U.S., the E.U., and Japan. This is a very positive signal for the domestic shrimp industry. Other issues such as tariffs and currency exchange rates will always be part of the steering currents that determine the ultimate destinations for exported shrimp. For example, the dollar is currently falling against other major currencies which makes imported shrimp more expensive in the American market. So long as this condition prevails, the prices of all shrimp products should be lifted. Finally, the antibiotic residue issues that surfaced in 2001 – and continue
© 2003 TAA Technical Assistance 24
to this day – will be addressed in a uniform fashion among all major shrimp-importing countries. For this food safety issue it is a question of “when, not if.” References 1. Vondruska, J. 2001. Southeast Shrimp Markets and Global Market Trends. SERO-
ECON-01-03. 36p. 2. Haby, M., R. Miget, L. Falconer, and G. Graham. 2002. A Review of Current
Conditions in The Texas Shrimp Industry, an Examination of Contributing Factors, and Suggestions for Remaining Competitive in the Global Shrimp Market. Extension Economics Staff Paper, TAMU-SG-03-701. 26 p.
3. Haby, M., R. Miget, L. Falconer, and G. Graham. 2003. Establishing Wild, Domestic
Shrimp as a Premium Choice in the American Marketplace With a Verifiable, Quality Management System. Extension Economics Staff Paper, 12 p.
4. U.S. International Trade Commission. 2002. Harmonized Tariff Schedule of The
United States (2002) (Rev. 2). [http://dataweb.usitc.gov/SCRIPTS/tariff/toc.html]. 5. WorldCatch News Network. 2002. The sky's the limit on Thai seafood trade barriers.
[http://wave.worldcatch.com/article]. 6. Haby, M. 2003. Documentation to Support a Petition from the Texas Shrimp Industry
for Certification and Eligibility to the Trade Adjustment Assistance Program of the U.S. Department of Agriculture. Extension Economics Staff Paper, 17 p.
7. Rosenberry, R. 2003. The Rise and Fall of Chloramphenicol.
[http://www.shrimpnews.com]. Prepared by Michael G. Haby, Texas Cooperative Extension / Sea Grant College Program, Texas A&M University

© 2003 TAA Technical Assistance 25
Tom WestcotUSDA Foreign Agricultural Service
June 11, 2003
U.S. and World Shrimp TradeTrends in Production, Imports, and Exports
U.S. Consumption of Fish and Shellfish
FAS, USDANote: Fisheries of the United States, National Marine Fisheries Service.
0
2
4
6
8
10
12
14
16
Poun
ds p
er P
erso
n
1910 1920 1930 1940 1950 1960 1970 1980 1990 2000
Year
Fresh/Frozen Canned Cured

© 2003 TAA Technical Assistance 26
0
0.5
1
1.5
2
2.5
3
3.5Po
unds
per
Per
son
90 91 92 93 94 95 96 97 98 99 00 01 02 03e
Calendar Year
U.S. Consumption of Shrimp is Rising Steadily
FAS, USDANote: Fisheries of the United States, National Marine Fisheries Service. Shrimp, all preparations. e=estimated by FAS staff
0
200
400
600
800
1000
1200
1400
92 93 94 95 96 97 98 99 00 01 02
Year
Mill
ion
Poun
ds
U.S. Landings Imports
U.S. Landings and Imports of Shrimp
FAS, USDANote: Fisheries of the United States, National Marine Fisheries Service. Landings and imports as head-off conversion.

© 2003 TAA Technical Assistance 27
0
1
2
3
4
5
6
7
98 99 00 01 02 03
Year
$ pe
r pou
nd
26/30 count 31/35 count
U.S. Shrimp Prices, Ex-vessel, 1998-2003(ytd)
FAS, USDANote: Northern Gulf 26/30 count per pound, headless, and Western Gulf 31/35 count per pound, headless. National Marine Fisheries Service, Market News.
0
50
100
150
200
250
95 96 97 98 99 00 01 02
Mill
ion
Poun
ds
U.S. Landings Aquaculture
U.S. Landings and U.S. Aquaculture Production of Shrimp
FAS, USDANote: Fisheries of the United States, National Marine Fisheries Service. Landings , head-off; aqua as reported processors.

© 2003 TAA Technical Assistance 28
0
500
1000
1500
2000
2500
1995 1996 1997 1998 1999 2000Year
Met
ric to
ns
U.S. Aquaculture Production of Shrimp, 1995-2000
FAS, USDANote: Live-weight
3081
1087
151 2.20
5001000
1500
2000
25003000
3500
2000
Year
1,000 Metric Tons
World Catch World Aqua U.S. Catch U.S. Aqua
U.S. and World Catch and Aquaculture Production of Shrimp in 2000
FAS, USDANote: Live-weight

© 2003 TAA Technical Assistance 29
World Exports and Imports of Shrimp, 2000 - 2002
FAS, USDASource: Global Trade Atlas, with FAS estimates.
0
2
4
6
8
10
12
14
2000 2001 2002
Year
$Bill
ion Exports
Imports
0
2
4
6
8
10
12
14
2000 2001 2002
$Bill
ion
All-Types Prepared/Preserved
World Imports of Shrimp; all types and prepared & preserved, 2000 - 2002
FAS, USDASource: Global Trade Atlas with FAS estimates.

© 2003 TAA Technical Assistance 30
0200400600800
100012001400160018002000
$Mill
ion
ThailandIndia (E)IndonesiaChinaDenmarkNetherlandsCanadaMexicoArgentinaMalaysiaBelgiumBrazilUKUS
Leading Exporters of Shrimp in 2002
Source: Global Trade Atlas, with FAS estimates.
0
500
1000
1500
2000
2500
3000
3500
4000
$Mill
ion
USJapanSpainUKFranceDenmarkCanadaBelgiumItalyNetherlandsGermanyThailand
Leading Importers of Shrimp in 2002
FAS, USDASource: Global Trade Atlas, with FAS estimates.

© 2003 TAA Technical Assistance 31
0
500
1000
1500
2000
2500
3000
79 81 83 85 87 89 91 93 95 97 99
Year
Mill
ion
Poun
ds
CaptureAqua
World Production of Tropical Shrimp: Capture vs. Aquaculture, 1979-1999
FAS, USDASource: Haby et. al. Texas shrimp study. Shell-on, headless.
0200400600800
10001200140016001800
79 80 81 82 83 84 85 86 87 88 89 90 91 92 93 94 95 96 97 98 99Year
Mill
ion
Poun
ds
World AquacultureFAS, USDA
Source: World from the Texas Study, Shell-on, headless; U.S. from NMFS
World Aquaculture Production of Tropical Shrimp vs. U.S.
Aquaculture of Shrimp, 1979-1999
© 2003 TAA Technical Assistance 32
World Trade Situation & Outlook
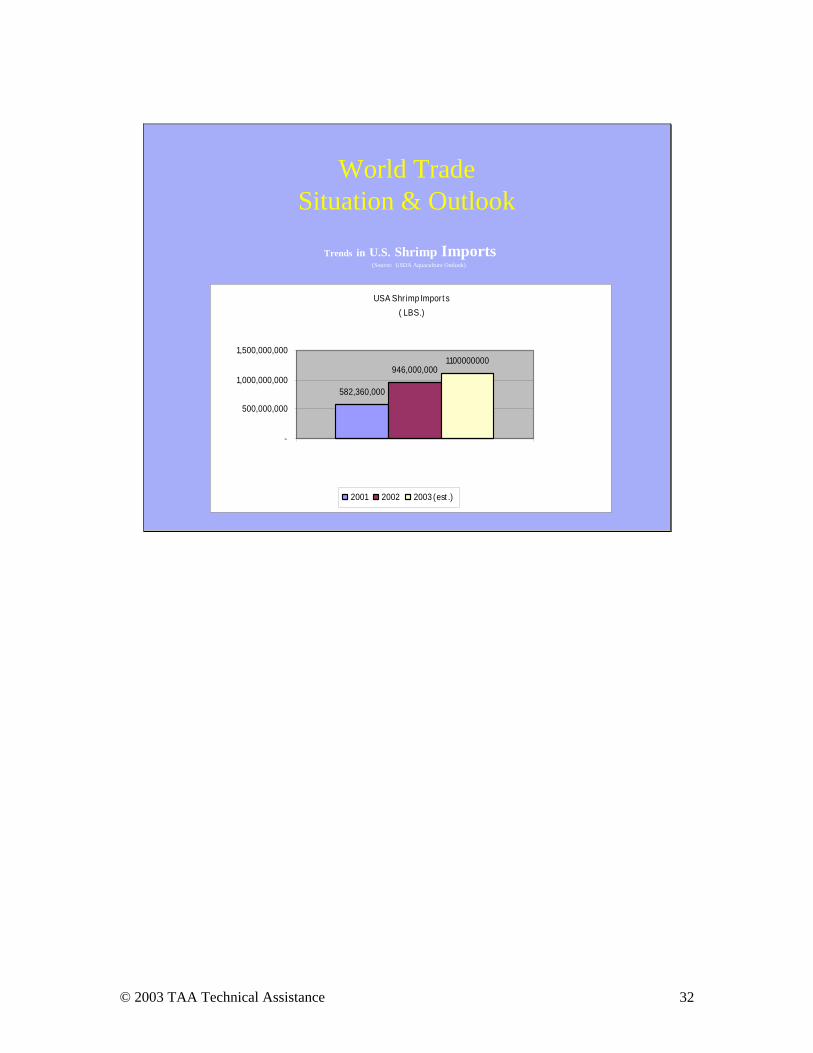
Trends in U.S. Shrimp Imports(Source: USDA Aquaculture Outlook)
USA Shrimp Import s ( LBS.)
582,360,000
946,000,0001100000000
-
500,000,000
1,000,000,000
1,500,000,000
2001 2002 2003 (est .)

© 2003 TAA Technical Assistance 33
Just as it is important to construct a new building on a strong foundation, it is important to build the economic future of your business on a sound financial base. Evaluating the financial viability of your business will help you understand the financial strengths and weaknesses of your business position. With knowledge of your financial situation you are in a better position to respond to current economic forces within the industry. There are three major financial objectives that businesses usually monitor to track their financial performance:
• Solvency to track changes in the net worth of the business; • Profitability to monitor the earnings of the business; and • Liquidity to estimate cash flow available for short term payments.
Solvency Solvency analysis compares the capital (assets) invested in the business with the sources of capital, debt and equity. In almost every business, one of the primary goals is to grow net worth or equity over time. In periods of low profits, a strong equity position helps the business survive and may also provide the borrowing capacity needed to make business adjustments. The balance sheet is the financial tool used to evaluate solvency. It provides the foundation for all of the remaining financial analysis. It is very difficult to evaluate where you are and what resources you have available for adjusting to economic forces without an accurate balance sheet. If you do not have a current balance sheet, you may be able to get a copy from your lender. Otherwise, you can build one from scratch. There is a set of financial statement forms at the end of this section that includes a balance sheet format. It is available in PDF format at http://www.extension.iastate.edu/Publications/FM1824.pdf. Other possible sources include:
• FINPACK Farm Financial Software, available through many local Extension offices.
• Assessing and Improving Your Farm Solvency, http://www.agnr.umd.edu/MCE/Publications/PDFs/FS540.pdf
Evaluating the FinancialViability of the Business

© 2003 TAA Technical Assistance 34
Asset Valuation It is becoming more and more common for agricultural balance sheets to include Cost and Market valuations for capital assets.
• Cost – capital assets are valued at their original purchase cost less depreciation. Cost value balance sheets are most useful in evaluating year to year progress.
• Market – capital assets are valued at their estimated current market value. This is most useful in evaluating the financial soundness of the business and borrowing capacity.
Market value balance sheets are still the standard used by most agricultural lenders. For the purpose of this analysis, it is probably most useful to value assets at their conservative market value net of selling costs. Measuring Solvency The Debt to Asset Ratio is the most common measure used to evaluate business solvency.
Debt to Asset Ratio = (Total Liabilities / Total Assets) * 100 Simple rules of thumb for evaluating solvency (Debt to Asset) position are:
Strong Under 30 % Caution 30 to 60 %
Vulnerable Over 60 % Businesses that are in a Strong solvency position have a firm foundation upon which to build or change their operations. They may be experiencing profitability or cash flow problems because of the current economic situation, but their financial position should open up doors to alternatives and borrowing capacity that allow them to survive and adjust to more profitable strategies. Businesses whose debt to asset ratio raises the Caution flag need to do some serious financial planning to assure, as much as possible, that their net worth position is not going to continue to erode. If so, they need to look at their options. Their lender should still be willing to work with them but may not be willing to lend enough money to make major changes in facilities or equipment. In the worst case, they may need to consider exiting the business while there is still substantial net worth left. Businesses in a vulnerable solvency position have limited ability to borrow additional funds. They need to look at options that improve net worth growth without investing more money in the business. Some examples might include using existing facilities more fully and/or improving operating efficiencies. Other options could include adding non-farm income and reducing family living costs.

© 2003 TAA Technical Assistance 35
Profitability Profitability analysis involves analyzing how much money the business is making. Profitability is measured using an Income Statement. Most non-farm businesses are required to complete an accrual income statement for tax purposes so it is relatively easy to evaluate their profitability. Farmers and ranchers, unless they are very large, are not required to do accrual accounting for tax purposes. While cash accounting provides flexibility for tax management, it leaves agricultural producers in a position of evaluating their profitability based on a system whose general purpose is to reduce income. Therefore, for many growers, tax statements to do not provide a reliable source of information for evaluating farm business profitability. Accrual Adjusted Income Statement An accrual adjusted income statement adjusts the cash income and expenses reported for tax purposes for changes in inventories of crops, growing livestock, and assets that would have been included in taxable income had they been sold during the period covered. It also adjusts for changes on prepaid expenses, accounts payable and other items that would have been recorded as expenses had they been paid. The set of financial statements included at the end of this section includes an accrual adjusted income statement format. The FINPACK Farm Financial Software, available through many local Extension offices, also includes a tool to calculate accrual net farm income. Using Schedule F Tax Statements It may be impossible to complete an accurate accrual adjusted income statement. In that case, the only option may be to use tax information. If so, it is recommended that you use the average net farm income from several years’ Schedule F tax forms. In theory, the average of the net income from three or more year’s taxes will wash out the effects of year-to-year inventory changes. Livestock producers should add the income from sales of raised cull breeding livestock to the Schedule F net income. The bottom line of the income statement, Net Farm Income, is the amount of money the business contributed during the period for owner withdrawals for family living and taxes. If, over a period of time, net farm income it is not enough to cover owner withdrawals, other sources of income will be needed or net worth will decline.

© 2003 TAA Technical Assistance 36
Measuring Profitability The most common measure of profitability is the Rate of Return on Assets (ROA).
ROA = Net Farm Income + Interest Expense - Value of Unpaid Labor & Management Total Farm Assets
Value of Unpaid Labor and Management is an estimate of the amount of income unpaid farm operators could have earned from off-farm employment. Rate of Return on Assets can be directly related to interest rates. The goal when borrowing capital is to earn a higher return than the interest rates being paid. Businesses with low debt to asset ratios can operate with a lower ROA because they are paying interest charges on a smaller portion of their assets. Business profitability can vary a great deal from one period to the next. Managers should take care when basing decisions on results from only one period. With that in mind, some simple rules of thumb for evaluating your Rate of Return on Assets are:
Strong Over 8 % Caution 3 to 8 %
Vulnerable Under 3 % A Strong ROA indicates that the business is operating efficiently. If there are cash flow problems, it may be that the business is not large enough to support the number of people or families drawing from it. Or it may be that there is too much short-term debt placing undue pressure on cash flows. In that case, maybe debt repayment schedules can be restructured. If the ROA raises the Caution flag, take a closer look at business efficiencies. Are there adjustments that could be made to control costs, improve marketing, or use facilities and equipment more intensively? For businesses where the ROA analysis comes up Vulnerable, managers need to dig deeper to try to figure out why the business was not profitable. It is human nature to blame problems on factors beyond management control, like foreign competition. The management challenge is to position the business so that it can react to those outside forces. Liquidity Liquidity deals with how much cash the business could convert or generate in the short term, usually one year, to meet financial obligations. Holding inventories of cash and liquid assets is a risk management strategy to cushion the business from short-term financial downturns. Unfortunately, cash flow pressures often prevent businesses from

© 2003 TAA Technical Assistance 37
holding liquid assets. And even if they can, it is difficult to invest those liquid assets in places that yield a high rate of return. So there is often a conflict between liquidity and profitability. The Cash Flow Statement is the most common tool for analyzing the liquidity of your business. It can be either a summary of sources and uses of cash from the past period or a projection of cash flows for the future. Many agricultural lenders require a cash flow projection as part of any credit application. The set of financial statements included at the end of this section includes a cash flow statement. Other sources of projected cash flow formats include:
• FINPACK Farm Financial Software, available through many local Extension offices
• Cash Flow Projection and Operating Loan Determination, http://www.oznet.ksu.edu/library/agec2/mf275a.pdf
Measuring Liquidity The most common measure of liquidity is the Current Ratio. It is useful for businesses that have substantial current assets. Businesses with limited current assets have little liquidity no matter what the current ratio says.
Current Ratio = Total Current Assets Total Current Liabilities
Simple rules of thumb for evaluating your Current Ratio:
Strong Over 1.75 Caution 1.1 to 1.75
Vulnerable Under 1.1 Businesses with a Strong Current Ratio have established a healthy risk management cushion for difficult economic times. Their challenge is to make sure they are earning a reasonable return on their liquid assets. If the Current Ratio raises the Caution flag, management needs to monitor cash flows carefully. A low current ratio will not make the business unprofitable but it might make it difficult to take advantage of opportunities as they arise. Businesses with a Vulnerable Current Ratio are in a precarious position. Businesses don’t usually go out of business because they lose all their net worth; they go out because they can’t pay their bills. Businesses that fall in this category need to take immediate action. First, determine if there is a profitability problem, a solvency problem, or are owner withdrawals putting too much strain on the business. Maybe adding non-farm income is an option. Operators in this position should work very closely with financial

© 2003 TAA Technical Assistance 38
advisors, creditors and others to craft a plan that will get their operation back on the road to financial security. Adding Up the Evidence Financial analysis is a diagnostic, but not necessarily a prescriptive process. In other words, it may reveal a problem, but it may not point to a specific solution. The remainder of the resources available through this site will help business managers dig deeper into their operations to look for adjustments and creative options for their individual situations. Producers who understand ‘Where Am I?’ financially are in a much better position to evaluate alternatives for generating more income, controlling costs, and improving their bottom line. Developed by Dale Nordquist, Center for Farm Financial Management, University of Minnesota

© 2003 TAA Technical Assistance 39
Balance Sheet
Name________________________________ Date___________
FARM ASSETS
Cost Value
Market Value
FARM LIABILITIES
Market Value
Checking and Savings Accounts
Accounts payable
Farm taxes due
Short-term notes and credit lines
Crops held for sale or feed
Accrued interest - short
Invest in growing crops
- intermediate
Commercial feed on hand
- long-term
Prepaid expenses
Due in 12 mo. - intermediate
Market livestock
- long-term
Supplies on hand
Other
Accounts receivable
Other
Total Current Assets
Total Current Liabilities
Unpaid Patronage Dividends
Notes and contracts, remainder
Breeding livestock
Other
Time certificates
Farm securities
Other
Machinery and Equipment
Total Intermediate Assets
Total Intermediate Liabilities
Buildings/improvements
Notes and contracts, remainder
Farmland
Other
Farm Securities
Other
Total Long-term Assets
Total Long-term Liabilities
A. Total Farm Assets
B. Total Farm Liabilities
Current Assets (market) = ________ Current ratio
Current Liabilities
Farm Net Worth, Cost Value (A - B)
Total Liabilities = ________ Debt to asset ratio
Total Assets (market)
Farm Net Worth, Market Value (A - B)

© 2003 TAA Technical Assistance 40
Balance Sheet (continued)
PERSONAL ASSETS
PERSONAL LIABILITIES
Bank accounts, stocks, bonds
Credit card, charge accounts
Automobiles, boats, etc.
Automobile loans
Household goods, clothing
Other loans, taxes due
Real estate
Real estate, other long-term loans
E. Total Personal Assets
Total Personal Liabilities
G. Total Personal Net Worth (E - F)
H. Total Net Worth, Market Value (D + G)

© 2003 TAA Technical Assistance 41
INCOME STATEMENT
Name________________________________ Date___________
INCOME
EXPENSES
Cash income
Cash Expenses
Sale of livestock bought for resale
Breeding fees
Sales of livestock, grain, other products
Car and truck expenses
Patronage dividends
Chemicals
Agricultural program payments
Conservation expenses
Crop insurance proceeds
Custom hire
Custom hire income
Employee benefits
Other cash income
Feed purchased
Sales of breeding livestock
Fertilizer and lime
A. Total Cash Income
Freight, trucking
Income Adjustments
Ending
Beginning
Gasoline, Fuel, Oil
Crops for sale or feed
Insurance
Livestock held for sale
Interest paid
Accounts receivable
Labor hired
Unpaid patronage div.
Pension and profit-share plans
Breeding livestock
Rent of land, buildings, equipment
Subtotal of Adjustments
B.
C.
Repairs, maintenance
D. Home Used Production
Seeds, plants
E. Gross Farm Revenue (A + B - C + D)
Storage, warehousing
F. Net Farm Income From Operations (F - N)
Supplies purchased
Sales of farm capital assets
Taxes (farm)
Previous cost value or new purchase
Utilities
Cost of capital assets sold
Veterinary fees, medicine
G. Capital Gain or Loss
Other cash expenses
Livestock purchased
I. Total Cash Expenses

© 2003 TAA Technical Assistance 42
Income Statement (continued)
Expense Adjustments
Beginning
Ending
Investment in growing crops
Prepaid expenses
Feed and supplies on hand
Ending
Beginning
Accounts payable
Farm taxes due
Accrued interest
Subtotal of Adjustments
K.
L.
M. Depreciation
H. Net Farm Income (G + H)
N. Gross Farm Expenses (J + K - L - M)

© 2003 TAA Technical Assistance 43
Statement of Cash Flows Name________________________________ Date___________
Cash Farm Income and Expenses
Total Cash Income
Total Cash Expenses
Capital Assets
Sales of Capital Assets
Purchases and Net Cost of Trades
Financing
New Loans Received
Principal Paid
Nonfarm
Nonfarm Income and Receipts
Nonfarm Expenditures
Cash on Hand, Farm and Nonfarm
Beginning of Year
End of Year
Total
If all cash transactions are included correctly, the totals for the two columns will be equal. Source of financial statements: Farm Financial Statements, William Edwards, Iowa State University, http://www.extension.iastate.edu/Publications/FM1824.pdf

© 2003 TAA Technical Assistance 44
How Viable Is Your Shrimp Farming Business? Take stock of your current situation. Determine whether shrimp farming is profitable for you, and if not, find out why. Financial Performance The balance sheet is the financial tool used to evaluate financial performance. It provides the foundation for all of the remaining financial analysis. It is very difficult to evaluate where you are and what resources you have available for adjusting to economic forces without an accurate balance sheet. If you do not have a current balance sheet, you may be able to get a copy from your lender or use the blank provided above to fill in your numbers. A financial analysis is available specifically for shrimp farming through Texas A&M University, Sea Grant College Program, 2700 Earl Rudder Frwy. S., Suite 1800 College Station, Texas 77845. “A Guide to the Financial Analysis of Shrimp Farming, by Griffin and Treece. A Pro Forma Balance Sheet and Pro Forma Income Statement is developed with internal rate of return over 7 and 12 year horizons, which also gives the break-even costs and shows if the business is viable. The program runs on excel and can be ordered from the Texas Sea Grant web site at http://texas-sea-grant.tamu.edu.

© 2003 TAA Technical Assistance 45
One of the purposes of TAA Technical Assistance is to help business owners find a profitable future direction for their business. The direction you take your business will depend on several factors, including: What you want to do (your goals) What is happening within the industry, and The package of skills, resources, and talents you and the other stakeholders in your business can pull together to implement a change. Your resources come in at least two forms: 1) the hard assets and financial resources that are included on your balance sheet and 2) the knowledge, interests, and abilities that you can draw on from your management team. This section will focus on these personal attributes. It will ask a series of questions that are intended not to highlight weaknesses, but rather to help you build on your strengths and avoid the pitfalls of mapping a direction for your business that does not match your skills, likes, or values. Production and Operations Management Yes No Are your skills best suited to high volume commodity production?
• Do you have a history of producing high yields or rates of production per unit? ______ ______
• Are you a low cost producer? ______ ______ • Do you stay on top of new technologies? ______ ______ • Do you get things done on time? ______ ______ • Is expansion an option or interest? ______ ______ • Do you gain your competitive advantage by producing
more per unit at a lower cost? ______ ______ Or, are your skills best suited to niche market or value added products? Are you good at juggling multiple production schedules? ______ ______ Do you monitor production activities and quickly make adjustments if problems surface? ______ ______ Do you have a history of producing high quality products? ______ ______ Do you gain your competitive advantage by marketing multiple products at a high margin? ______ ______
Inventory of Resourcesand Talents

© 2003 TAA Technical Assistance 46
No matter the type of operation, efficient production is important. But it may be more important for some than for others. For producers of traditional agricultural commodities, the goal is to be the lowest cost producer. If you can keep costs per unit down and produce enough volume, you can generally be successful in commodity production. For direct marketers, value added producers, and other non-traditional operations, efficient production is still important. But product quality and efficient marketing may well be more important than producing the highest production rates at the lowest costs. The world is full of stories of companies that have been very successful just because they out-marketed the other guys. Producing these types of products takes a different mindset. You may spend more of your time outside of production activities while managing others. You will spend more time in your office and less time on your tractor. If you can be happy doing these activities and you have skills in those areas, you may want to consider a transition into this type of operation. Marketing Yes No Are your skills best suited to marketing traditional agricultural commodities?
• Would you rather be out in the field or in the production facilities than negotiating with buyers? ______ ______
• Do you feel time on the phone is wasted time? ______ ______ • Do you have the option to contract your production? ______ ______ • Do you negotiate input costs? ______ ______ • Do you lock in a profit when it is offered to you? ______ ______
Or, do you have skills suited to marketing niche market, value added, wholesale, or retail products?
• Do you like to negotiate deals? ______ ______ • Are you good at closing a deal? ______ ______ • Do you know how to estimate the market for a product? ______ ______ • Do you develop good relationships with buyers and sellers? ______ ______ • Do you have skills in advertising and promotion? ______ ______ • Are you good at making pricing decisions? ______ ______ • Do you know who your competitors are? ______ ______ • Do you target your products at a specific market? ______ ______
Is there a market for your product? Most commodity producers have not had experience with estimating market size, target marketing, advertising and promotion, and pricing. These are skills that may be needed if you plan to move into a “niche” market or if your plans include direct marketing or processing of farm products. Many commodity

© 2003 TAA Technical Assistance 47
producers have the ability to move into these areas but they may need to educate themselves on the techniques. There are classes and other resources in community colleges and other institutions in most communities to help you improve these skills. People Skills Yes No Are your skills best suited to managing a sole proprietorship?
• Do you feel a need to be actively involved in all or most production activities? ______ ______
• Would you rather be out doing than directing others? ______ ______ • Do you feel frustrated training employees? ______ ______ • Do you worry about others getting things done right? ______ ______
Or, do you have the skills needed to manage multiple employees?
• Do you like to work in a team setting? ______ ______ • Are you comfortable delegating tasks to others? ______ ______ • Are you able to constructively criticize employees? ______ ______ • Do you have specific hiring procedures? ______ ______ • Do you have specific training procedures for new
employees? ______ ______ • Are you comfortable with firing employees? ______ ______ • Do you get satisfaction out of seeing someone else
succeed? ______ ______ • Do you like to delegate production tasks to others? ______ ______ • Are you good at training others to do production tasks? ______ ______
Many feel that they have to grow to be competitive in today’s business world, but there are still many very successful small businesses. Moving from a business with few employees to a multiple employee business is one of the biggest challenges for most business managers (inside and outside of agriculture). Those who successfully make the transition tend to be very happy with the change. They find that they can get away with assurance that things are getting done while they are gone. They build managerial capacity in the next generation and they get a great deal of satisfaction out of seeing others grow and be successful. But not everyone has the skills to be a people manager. If you are not comfortable with your skills in this area, there are two options: 1) get help and training in personnel management; or 2) stay small and look for other ways to improve profitability.

© 2003 TAA Technical Assistance 48
Money Management Skills Yes No Should you consider hiring accounting and financial services?
• Do you use your records only for tax purposes? ______ ______ • Do you let accounting functions slide as long as possible? ______ ______ • Does your lender complete your balance sheet for you? ______ ______ • Do you place financial reports in your files without
examining them? ______ ______ • Would you rather do just about anything else but
accounting? ______ ______ • Do you lack trust in your lenders? ______ ______
Or, do you have the skills to manage the finances of the business?
• Do you know your production costs per unit? ______ ______ • Do you like to do your own accounting? ______ ______ • Do you read and understand financial reports? ______ ______ • Do you develop a financial plan at the beginning of each
production or accounting cycle? ______ ______ • Do you monitor deviations from your financial plan and
make mid-term adjustments to your plans? ______ ______ • Do you periodically analyze the financial performance of
your business? ______ ______ • Do you work well with you lenders? ______ ______ • Do you cover risks with adequate insurance and other risk
management tools? ______ ______ • Do you know how your living costs? ______ ______ • Do you know your net worth? ______ ______
Financial management is an area where many agricultural producers feel least comfortable. Again, there are a lot of resources within the Extension Service and local community and technical colleges to help you improve these skills. This is also an area where you might consider hiring outside help or joining a farm management group if one is available in your area. Hiring accounting and tax services, however, may not provide you with a great deal management information. You still need to understand the reports and monitor financial performance.

© 2003 TAA Technical Assistance 49
Other Resources Other resources include the physical assets you own, the other assets you can acquire through lease or other means, and the financial resources that you can access in terms of equity capital and borrowing capacity. If you are considering a major business adjustment, consider how well adapted each of these resources is to your new business plan. Is the business large enough to support you and other stakeholders? Is your land base suited to high yield and high quality production of your selected products? Are production facilities and equipment adequate? Has asset replacement been adequately considered in you financial plans? Is an adequate and well educated labor force available? These are among the questions that you should honestly answer before you commit to investing more in your business operation. Summary of Strengths and Weaknesses After considering the resources, talents, and interests of the operation and the management team, it may be helpful to summarize the strengths and weaknesses of the operation. The worksheet on the following page provides a framework for this summary. Developed by Dale Nordquist, Center for Farm Financial Management, University of Minnesota

© 2003 TAA Technical Assistance 50
Summary of Resources and Talents Strengths Weaknesses Production and operations
Marketing
People skills
Money management
Other resources

© 2003 TAA Technical Assistance 51
Other Publications Checking Your Farm Business Management Skills, Farm Business Management for the 21st Century, Purdue Extension, West Lafayette, Indiana, by Michael Boehlje, Craig Dobbins, and Alan Miller. Are Your Farm Business Management Skills Ready for the 21st Century?, Self-Assessment Checklists to Help You Tell, Farm Business Management for the 21st Century, Purdue Extension, West Lafayette, Indiana, by Michael Boehlje, Craig Dobbins, and Alan Miller. Building a Sustainable Business, A Guide to Developing a Business Plan for Farms and Rural Businesses, Minnesota Institute for Sustainable Agriculture, St. Paul, Minnesota, by Gigi DiGiacomo, Robert King, and Dale Nordquist.

© 2003 TAA Technical Assistance 52

© 2003 TAA Technical Assistance 53
• Business Options Available to Improve Profitability
• Goals
• Production Efficiency
• Marketing Opportunities
• Alternative Enterprises
• Transitioning Out of the Business
Where Do I Want To Be?

© 2003 TAA Technical Assistance 54

© 2003 TAA Technical Assistance 55
Options to Improve Profitability When faced with financial stress due to low prices, agricultural producers and fishermen have several options to improve profitability. There are four general options available to increase profits. They are:
• Improve the profit margin • Expand the business • Create innovative niches • Exit and transition to a new business or job
The first two options are described by one of the most basic equations in economics:
Profit = (Price – Cost) x Volume Profits can be improved by increasing the margin between the market price received for a product and the cost to produce the product or by increasing the amount of the product produced. Improving the Profit Margin There are two components to increasing the profit margin:
• Reducing the cost of production • Increasing the market price received
Economic forces are squeezing profit margins, but successful managers continue to pry the profit margin apart with a critical eye toward cost control practices and improved marketing. Controlling the cost of production is always an essential management function of successful businesses. Data shows that there is rarely one area where significant cost reductions can be attained, but rather the more profitable businesses manage many costs two to five percent more efficiently than their competitors. With tight profit margins, marketing actions that improve the sales price even a few cents may increase profits by significant percentage.
Business Options Available to Improve Profitability

© 2003 TAA Technical Assistance 56
Expanding the Business Expanding the business is an option that many producers have pursued. As profit margins have tightened, expanding the size of the business has been the most feasible option for many producers. Additional sales volume may be necessary to cover the overhead costs of the business and to allow the families involved to meet their financial needs. But when considering an expansion, care should be taken when doing financial planning to verify that the expansion will improve your financial situation. If the profit margin is in fact negative, or the added volume will cause overhead costs to increase, an expansion may just put your business in a deeper financial hole. Creative and Innovative Strategies Over time agricultural producers have developed many creative and innovative strategies to help increase profitability. These range from adding value to their products through cooperatives or on-farm processing, direct marketing, niche products and markets, marketing recreational and agri-tourism opportunities, and contracts with businesses and municipalities. Today’s producers need to determine which strategy they will pursue - a commodity production strategy or a creative alternative strategy. The commodity strategy generally involves expanding to an adequate size and focusing on being low cost producer. The creative alternative strategy generally means focusing on markets, customers, and innovative niches. Some high-capacity producers are able to pursue both of these strategies. Transitioning to a New Career Exiting the business is always an option, although not one that many people want to consider. Commodities that have been certified as eligible for Trade Adjustment Assistance (TAA) are facing financial challenges. Some producers may elect or need to exit the business. Producers should evaluate the skills and resources available or needed to transition to a different business or career. For some finding off-farm employment or downsizing by selling some assets may also be options.

© 2003 TAA Technical Assistance 57
TAA provides retraining and educational resources to help producers who are transitioning to a different career. The Department of Labor provides TAA services through which eligible producers and fishermen may receive reemployment and educational assistance. Reemployment services include employment counseling, case assessment, job development, and self-directed job search services. Education assistance (Trade Readjustment Allowances) pay for up to 104 weeks of full-time education including classroom training, on-the-job training, and employer –based training. Developed by Kevin Klair, Extension Economist, Farm Management, University of Minnesota.

© 2003 TAA Technical Assistance 58

© 2003 TAA Technical Assistance 59
Most of us would not leave home on a trip to an unfamiliar destination without a road map. We would want to know where food, gas, and lodging were available. Family members would discuss the best route. An arrival time would be estimated to inform family and friends. What about an agricultural business or fishery that is considering a new business model? Before launching into a new business plan, a well-developed “road map” is needed. A successful “road map” starts with discussion of where you want to go—personal and business goals. Steps for generating goals to guide your business decision-making follow. What Are Goals? A goal is a statement of what an individual or family wants to achieve. Through goals, each person, family, or business unit identifies its aspirations for the future. Goals change with circumstances and time, and they must be reevaluated and updated periodically. How To Use Goal Setting Goals provide focus and direction for management. Attaining high priority goals takes precedence in management decisions. They serve as reference points to monitor how well a business is doing and as a motivation if deadlines are specified. Goals help aid decision making in the face of uncertainty. Finally, achieving goals can serve as a rallying point for the family or business management team. Steps in Goal Setting Goal setting requires creative thinking. Goals can be tangible and intangible, short-term and long-term, monetary and non-monetary. Goals are personal and unique to the family since they reflect values and beliefs, the resources available, and the opportunities and limitations faced. Because achieving goals often requires the cooperation of family, the goal setting process should involve discussion and compromise among family members. Seven steps for setting goals follow.
Goals

© 2003 TAA Technical Assistance 60
• Assess where the operation was in the past. • Assess family and farm resources (including self) and planning restrictions. • Develop a general management plan. • Identify and establish specific goals or objectives. • Prioritize goals. • Develop plans for action and implementing goals. • Measure progress and reassess goals.
Developing SMART Goals Other tips for goal setting are to make them SMART: Specific, Measurable, Action-oriented, Reasonable, and established in a Time frame. Write goals down to make them visible and increase commitment. Goals should be measurable, for instance, to increase income by $8,000 per year. Goals should be challenging, but achievable. To be most effective, set family and business goals jointly, that is, set goals with family members rather than for them. Using realistic deadlines specify when the goal is to be attained. Prioritizing Goals Goal priorities can provide clear guidelines for management decisions and make possible a level of consistency that otherwise is difficult to maintain. To help establish goal priorities, ask these questions:
• Which goals are most important for family well-being? Farm well-being? • Which short-term goals, if attained, would help achieve long-term goals? • Which short-term goals conflict with, or impede, long-term goals? • Which short-term goals do not support any long-term goals? • Which goals are so important that they should be attained even if it prevents
reaching other goals? High priority goals should not receive all the attention and resources while other goals are ignored. Priorities should not be completely either/or decisions, and priority decisions need not be permanent. In prioritizing goals, weigh the importance of each task for long-term and short-term goals. Consider personal life goals as well as business aims. Group similar activities wherever possible and identify links between goals. Implementing Goals To effectively set and implement goals, the business manager must invest time and energy in mapping out goals. A thorough job of planning, with a commitment to the goal-setting process, will help ensure positive results. Make the goal known to others. Relate individual goals to family or team goals. Try to anticipate problems and plan strategies for overcoming them. Do not ignore potential conflicts or restrictions that might prevent reaching goals. Identifying possible problems in the planning stage will

© 2003 TAA Technical Assistance 61
allow time to resolve conflicts or channel efforts to feasible objectives. Beware of the following potential pitfalls:
• Making goals too lofty • Trying to do too many things at once • Overemphasizing quantitative aspects • Vulnerability to unexpected events • Failing to use all information or include all decision makers • Ignoring good plans.
Summary Goal setting, although important for all individuals and families, is especially important for family farms and small businesses because of family and business interrelationships. The development of individual goals, discussion and negotiation of family goals, and business and family priority setting gives structure to the management process. Setting goals as a family at least annually (or whenever circumstances change significantly) should become part of the business management routine. By helping individuals and families work smarter, goal-directed management can improve business efficiency. Achievement of goals should result in a feeling of accomplishment and pride. Use the following worksheet to begin specifying goals for family and business. Reprinted from Goal Setting for Farm and Ranch Families, Damona Doye, Oklahoma Cooperative Extension Service, Oklahoma State University.

© 2003 TAA Technical Assistance 62
Goal Setting Worksheet
Short Term Intermediate term Long-term Farm/business Family/personal Goals Priority Potential Conflicts Ways to Resolve Resources Assigned Deadline (High, Med. Low) or Restrictions Conflict Needed Person(s) Most important goal? Second most important goal? Other goals? Provide each family member or person involved in farm management with a copy of this worksheet. Ask each person to complete it, without input from others initially. When everyone has completed the worksheet, discuss it with family and/or business associates. Use additional copies of the worksheet to document your family or farm management team’s best thinking and mark it as such. Short-term goals should include those that will allow you to attain your long-term goals. An additional sheet detailing activities necessary to achieve a goal may be needed, along with an associated time line.

© 2003 TAA Technical Assistance 63
Diversification Farmers can diversify by planting a different crop and aquaculturists can diversify by producing different species. But it is not as simple as it sounds.
Species Diversification Shrimp farmers have built ponds using a certain design criteria and on sites which limit their future use with other species. Finfish show the most potential for shrimp farmers to diversify and bait shrimp offers another possibility to diversify. Specifically the red drum and the hybrid striped bass have both been grown with some success by shrimp farmers. Native shrimp have also been produced on a commercial scale for bait and offer yet another option for diversification. Criteria for consideration before diversification will be discussed in Alternative Enterprises. Specific Production Efficiency Considerations
• Energy efficiency: converting to natural gas and saving one third the energy cost for pumping as some farms have done
• Water use and pumping efficiency: Use less water and reuse and recirculate water to save on fertilizer costs
• Lower stocking densities from 50 to 36/m2 to save on postlarval costs • Feed efficiency: consider lowering protein level to 25%. Consider improving
food conversion ratio (FCR) through specific feed management techniques such as computer operated blowers
• Consider best management practices as ways to improve production efficiency (listed in Global Aquaculture Alliance Code of Practices).
• Consider economics of producing 2 crops vs. 1 crop of larger shrimp. Some farms have produced two short crops of smaller shrimp (10 grams) and have also produced one long crop of 28-gram shrimp. The larger shrimp has generally been found to bring a better return; however the market conditions sometimes favor smaller shrimp and this would be the time to consider two crops of smaller shrimp.
Production Efficiency

© 2003 TAA Technical Assistance 64
Cost of Production Basics The production of agricultural commodities is typically characterized by low profit margins. Moreover, commodity producers are typically price-takers (i.e., they receive the market rate for their production and have little, if any, ability to bargain for a higher price). Consequently, the best opportunity for improving profit margins often lies in reducing costs of production. Producers in all areas of agriculture have proven over the years to be very adept at (and very interested in) reducing costs to the lowest possible level. In evaluating ways to reduce costs, it can be instructive to consider the general nature of the costs involved in agricultural production. First of all, in any type of production system—both agricultural and non-agricultural—costs of production can be categorized as being one of two types: variable or fixed. Variable costs are those costs that depend on the level of total production. In shrimp production, major variable costs could include such things as seed or postlarvae, feed, labor, and fuel. As more pounds of shrimp are produced, more postlarvae, feed, labor, and fuel will be required. Total variable costs will increase. If production ceases, no more postlarvae, feed, labor, and fuel will be needed and total variable costs will be zero. Fixed costs do not depend on the level of production. Fixed costs are those costs that will be incurred whether anything is produced or not. Examples of fixed costs include depreciation on facilities and equipment, property taxes, and insurance. Since the total level of fixed costs does not change as production increases, producers do realize some cost advantage from increasing production. As production increases, fixed costs per unit of output (or average fixed costs) decline. This is nothing more than the idea of “spreading the overhead,” a common goal of producers in every industry. Of course, there is a limit to how much costs can be reduced by increasing production. At some point, increases in average variable costs due to production inefficiencies will begin to outweigh the reductions in per unit total costs. The relationship between input costs and output levels can be important for producers to consider. In many production processes, economies of scale may exist. An economy of scale is a term referring to per unit cost savings that result from increased production. The idea is that increasing production may allow resources to be used more efficiently, thereby reducing per unit costs. For example, a shrimp producer with 10 acres of ponds may not find it economical to invest in the facilities and equipment needed to handle bulk feed. It may, however, be economical for a producer with 30 acres. The larger producer may realize significant cost savings from being able to handle bulk feed. Producers may be able to capture economies of scale without increasing their own production by working cooperatively with other producers. Smaller producers may work together to, for example, purchase inputs in bulk at a price that none of them individually would be able to negotiate. The Arroyo Aquaculture Association in Arroyo City, Texas is one such group that acts like a cooperative with 11 different shrimp producers

© 2003 TAA Technical Assistance 65
operating within the organization, producing shrimp on the same farm. They obtain reduced prices on fuel, feed, fertilizer, lime and other items through the Co-op. Finally, it should be noted that simply increasing production would by no means ensure a reduction in per unit costs. At some point, increasing output may very likely lead to diseconomies of scale. That is, increasing production beyond a level that is appropriate for the management ability and physical resources available to the operation will create inefficiencies that will lead to increasing per unit costs. The key is to identify opportunities to make better use of existing resources, always keeping in mind the financial, environmental, and human resource constraints of the operation and acting in a manner that is consistent with short-run and strategic business and family goals. Feed Feed accounts for about 50% of variable operating costs and represents a cost of about 60 cents per pound of shrimp at current feed prices and an average feed conversion of 2:1 (2 pounds of feed to 1 pound of shrimp). There are four principle methods to reduce feed costs:
• Reduce dietary protein level • Reduce or eliminate animal protein • Reduce feed conversion ratios • Restricted feeding regimes
Reducing dietary protein from 32% to 28% can result in a savings of $60 to $80 per acre per year. Feeding a 28 % protein feed will not have a significant effect on feed conversion ratios or processing yield. This has been proven in research and commercial shrimp ponds with Litopenaeus vannamei. However, the stocking densities were also reduced from 50 shrimp per square meter to 36 shrimp per square meter, so that natural productivity in the pond could be utilized by the shrimp. Some producers have fed a 25% protein feed with limited success, and have been able to produce up to 4,000 pounds of shrimp per acre. Eliminating animal protein can result in a savings of around $2 per ton of feed or $10 to $12 per acre per year. Research has shown that eliminating animal protein does not compromise disease resistance. Soybean meal has been substituted for fishmeal in shrimp feeds with limited success. Feed conversion ratios on commercial shrimp farms typically average 2:1 (with ranges from 1.6:1 up to 2.5:1 and sometimes higher with poorly managed intensive farms). A decrease in feed conversion ratio by 0.1 unit results in a savings of about $50 per acre per year. The two largest factors affecting feed conversion ratios are the difficulty in efficiently feeding shrimp in large ponds and unrealized harvest due to mortality. Feeding shrimp slightly less than full feed has proven to be the most efficient strategy. However, it is difficult to judge when shrimp are near satiation so shrimp are easily underfed or overfed if care is not taken. Feeding trays are a must in ponds to check for over or under

© 2003 TAA Technical Assistance 66
feeding. Reducing mortality is a goal of every shrimp farmer and is discussed in the Disease Costs section. To reduce feed costs and wastage, some farmers have implemented feeding with computer operated feed blowers. Reducing Costs Associated with Shrimp Loss Physiological stress, physical injury, bacterial and fungal infections, toxic algae and diseases such as NHP and HE are the primary contributing factors of mortality in marine shrimp production in the United States. Shrimp reared under commercial aquaculture conditions are weakened by stress conditions including, increased density, poor water quality (high ammonia or low oxygen), rapid temperature or salinity changes, and under or over feeding. Prevention through good management practices is the best control measure to minimize disease problems and shrimp losses. Prevention of disease outbreaks is more cost-effective than treating dying shrimp. Shrimp health researchers suggest that the single most important prevention technique is a good water quality-monitoring program. Vital parameters to monitor include dissolved oxygen, ammonia, nitrite, pH and temperature. Catastrophic loses of shrimp due to viral infections were common in the late 1990s, but USDA’s US Marine Shrimp Farming Program has stopped viral infections on US farms through the development of disease resistant shrimp stocks via selective breeding. Disease checks are still necessary to be sure these viruses are not present. Once a disease outbreak occurs, a rapid response is critical to reducing losses. First, samples of sick shrimp should be submitted to a shrimp diagnostic laboratory for a complete diagnosis. Economics must be considered when determining the best treatment procedure. Does the cost of treatment exceed the value of the shrimp? Do the number of shrimp dying (or likely to die) have a high enough value to justify the cost of the treatment? There is no treatment for viruses and the laws are such that the crop must be destroyed and ponds disinfected. However, bacterial infections, Vibrio, NHP, HE and other diseases are treatable. If chemical or antibiotic therapy is determined to be economically feasible, treatment should be applied before infection intensifies or shrimp reduce feed intake. Antibiotic treatment must be conducted under a veterinarian’s supervision and INAD followed, as well as specific withdrawal times before harvest. Antibiotic treatment added to the feed at the feed mill generally adds an additional $0.06 per pound to the feed costs. Partial Budgeting Agriculture is a complex and dynamic industry. New technology and new production techniques that promise higher returns or lower costs are constantly being introduced. Producers routinely find themselves in the position of evaluating whether or not a new investment or some other type of change to the existing operation will be worthwhile.

© 2003 TAA Technical Assistance 67
In evaluating a proposed change to an existing agricultural operation, the basic issue to be addressed is whether or not the long run profitability of the farm will be improved. In evaluating these long-run effects, a partial budget can be a very useful tool. Basically, a partial budget is made up of four components: two identify changes in the operation that will increase profits and two identify changes in the operation that will decrease profits. Interpreting the results of a partial budget is very simple. If increased profits exceed decreased profits, then the change being considered is a good one. A basic outline of a partial budget would look something like this: 1) Changes that Increase Revenue 2) Changes that Decrease Revenue
+ 3) Changes that Reduce Costs + 4) Changes that Increase Costs
Increased Profits Decreased Profits The difficulty in applying a partial budget to a particular problem is accounting for all cost and return changes that will result. Each profit-changing item must be included to determine whether or not the proposed change to an operation will be profitable. The application of a partial budget to a specific decision will help to illustrate how this tool might be useful to shrimp producers. Consider the case of a producer who is trying to decide whether to continue raising shrimp with a one-crop system or to convert to a two-crop production system. This producer has 100 acres of ponds in shrimp production and has been producing 4,000 pounds per acre of shrimp with one crop and can produce 5.400 pounds per acre with two crops or an increase of 1,400 pounds an acre. For the 100 acres this would be 140,000 pounds more shrimp produced in one season. However, there are costs associated with producing two crops and the shrimp will be smaller and will not bring as much money per pound. The first step in the evaluation is to identify any changes to the operation that will increase the operation’s profits. The producer must determine if the proposed change to the operation will lead to any increase or decrease in revenue. In our example, the producer expects to be able to increase the number of crops and total pounds of shrimp produced in one season, but he knows the shrimp will be smaller (18 grams and 10 grams each instead of 28 grams each). Next, the producer must decide if the proposed change will lead to any increase or reduction in costs. The producer knows that an extra crop will cost money, but are the returns worth it? Table 1 shows a simulated partial budget for a one-crop vs. two-crop production system.

© 2003 TAA Technical Assistance 68
Table 1. Partial Budget of One-Crop vs. Two-Crop Production Results of the partial budgeting exercise indicate that moving from a one-crop to a two-crop production system would be an unwise decision because the lower prices received for the smaller shrimp and the increased costs of producing a second crop. The change in profits is projected to be – $523,698 ($860,000 – $1.383,698). It is very important to note, however, that the outcome of any partial budgeting exercise depends on the assumptions used in developing the budget. This particular farmer raised 4,000 pounds per acre of 28-gram shrimp with one crop or a total of 400,000 pounds from the 100 acres and received $2.80/lb or $1,120,000 for the crop. When he switched to two crops he produced 5,400 lbs./ac of smaller shrimp or a total of 540,000 pounds (400,000 lbs of 18 g shrimp @ $1.80/lb = $720,000, and 140,000 lbs of 10g shrimp @$1.00/lb = $140,0000 or a total of $860,000 for the two crops of smaller shrimp). $860,000 – increased expenses of $263,698 for the second crop or a net income of $596,302. In this scenario it is better for the farmer to raise one long crop and sell larger animals. If the farmer received $1,120,000 for the one crop of large shrimp and expenses were $300,000 then net profit would be $820,000 or $223,698 more profitable than raising two crops of smaller shrimp.
Increased Revenue Decreased Revenue400,000 lbs of 18gram shrimp@$1.80/lb $720,000 400,000 lbs 28 gram shrimp@$2.80/lb=
140,000 lbs of 10 gram shrimp@$1.00/lb $140,000 $1,120,000 or $260,000 less income for crop $1,120,000Increased CostsPostlarval feed $500Postlarvae $90,000Transport of Postlarvae $1,000Labor $36,000Misc. transportation $200
Decreased Costs $0 Overhead (phone, accounting, etc.) $450Diesel fuel $500Electricity (aerator, pumps, meters) $45,000Deprec., maint., R&M on equipment $14,870Taxes $688Misc. expenses $1,250Transportation to markets $314Interest on op. cap. $72,926
Higher Profits $860,000 Lower Profits $1,383,698
© 2003 TAA Technical Assistance 69
Marketing Alternatives For Shrimp Farmers In general terms, agricultural producers have two options for improving profitability: reduce costs or increase revenue (or some combination of both). Reducing costs often involves increasing the efficiency of production in some fashion. Increasing revenue may also involve improving efficiency. For example, reducing death loss or increasing pounds marketed from the same pond acreage would increase revenue for shrimp producers. Very often, though, efforts to increase revenue involve making changes in marketing strategies. Key Marketing Concepts Over the last several years, the term “value-added” has been widely used in agricultural industries to describe efforts by producers to capture more of the final consumer’s food dollar. Capturing more of the final value of a product is certainly a worthy goal for commodity producers; however, it may not be as easy as it appears at first glance. A proper understanding of the marketing chain and the roles of different individuals and firms in it will be helpful to anyone considering value-added marketing strategies. Many efforts by agricultural producers to add value actually consist of trying to capture part of the marketing margin. The marketing margin can be defined as the difference between the farm price of a raw commodity and the retail price of a finished food product derived from that commodity. The marketing margin is the total amount of money that is available to pay for all of the marketing services required to convert a commodity in raw form at the farm gate into a finished product in the supermarket. To many people, the term marketing is synonymous with advertising. Certainly promoting a product can be a part of marketing, but in food industries, the term marketing typically refers to “the performance of all business activities involved in the flow of food products and services from the point of initial agricultural production until they are in the hands of consumers.”1 In other words, marketing involves transportation, storage, processing (which may involve several steps), and a host of related activities necessary to produce a retail food product.
1 Kohls, R.L. and J.N. Uhl. Marketing of Agricultural Products, 6th Edition. MacMillan Publishing, New
York: 1985, p. 8.
Marketing Opportunities

© 2003 TAA Technical Assistance 70
As noted, many of the value-added or alternative marketing strategies pursued by agricultural producers represent an attempt to capture a greater portion of the marketing margin. As a simple example, consider the case of a farmer’s market. A vegetable producer selling sweet corn in a farmer’s market must take responsibility for a number of marketing functions that would be performed by somebody else if the corn were simply sold off the farm. For example, the farmer is obviously responsible for transporting his product to the farmer’s market, for locating and securing a place at the market, and for handling the retail transaction. The farmer will also very likely perform some minimal level processing: at the very least culling and sorting the corn, perhaps even shucking, cleaning, and packaging some of it. The farmer’s market is a very simple example, but it hopefully illustrates a basic point: marketing services come at a cost. Farmers often overlook the fact that marketing is a productive activity. The marketing margin exists because there is value in the performance of marketing services. The farmer selling produce through a farmer’s market must expend additional resources—including a potentially significant amount of time—beyond those employed in the production of the crop. In addition, the alternative marketing strategy may require a different set of management skills than are needed in production. Dealing with the logistics of product storage and/or delivery or handling requests or criticisms from customers may become essential functions. This is not to say that alternative marketing strategies are not worthwhile. They can in many cases be very successful. In fact, alternative marketing strategies may be the best way for some producers to improve their bottom line. But simply capturing a higher price is not, in itself, sufficient to make an alternative marketing strategy successful. The increase in returns must be enough to compensate the producer for the additional marketing activities being performed. Shrimp Marketing Alternatives Shrimp producers are faced with a number of potentially viable alternative marketing channels. The advantages and disadvantages of several of these alternatives will be discussed in turn. For most shrimp producers, the most readily accessible market outlet is to sell directly to a processor. This is without question the dominant marketing practice in the industry, and there are some good reasons for this. This is an outlet through which a producer can market a very large volume of shrimp. It is also a market that is available on a year-round basis. Processors generally deal with many wholesale or retail customers, and they thus have a market for different sizes of shrimp. For this reason, processors will generally allow more latitude in the size distribution of shrimp than may be permissible through some other market outlets. A final advantage of selling to a processor is that the processor bears the majority of the liability for any problems related to product safety or quality. Of course, selling to a processor is not without its disadvantages. The primary disadvantage is that the producer is a price taker. That is, the producer has very little

© 2003 TAA Technical Assistance 71
ability to try to negotiate a higher price with the processor. Either the producer takes the price that is offered, or he rejects the price and doesn’t sell the shrimp. This situation is common to most producers of agricultural commodities. It is also worth noting that a producer is not guaranteed to be able to sell to a processor at any given time. Processors do generally handle a large volume of shrimp, but from time to time, even large processors may not need to make additional purchases. They do not represent a guaranteed outlet for production. The primary alternative that shrimp producers have to selling to processors is to market directly to a customer further down the marketing chain. Producers may try to establish direct sales outlets with wholesalers, retailers (e.g., local grocers or restaurants), or final consumers. For example the West Texas shrimp farmers try to sell some of their shrimp fresh on the pond bank to retail buyers before processing is necessary. The primary advantage of direct selling is that it is potentially a high-margin activity. In direct selling, the producer captures all or a large portion of the marketing margin. But direct selling is not necessarily easy. It may be difficult for an individual producer to establish business relationships with wholesalers, grocers, or restaurants. Moreover, these direct sales outlets may have very strict requirements for their suppliers. For example, a grocery store or restaurant may require a constant supply of product conforming to quite narrow standards for quality and consistency. This can be exceedingly difficult for an individual producer to provide and may require on-site processing facilities. Additionally, direct sales to stores or restaurants will likely require the producer to have a functioning food processing safety plan in place, i.e., a Hazard Analysis of Critical Control Points (HACCP) plan. Finally, in direct selling, the producer assumes a great deal more liability for product safety or quality problems than in selling to a processor. Direct sales to consumers may be somewhat easier than direct sales to wholesalers, stores, or restaurants, but those sales are usually limited. Depending on the form in which the product is delivered, the HACCP requirements and product liability may be reduced substantially. Also, the need to conform to a particular store or restaurants product standards is eliminated. The major problem with direct sales to consumers is that this is typically a very low volume market outlet. Summary and Conclusions Shrimp producers in any given area may have several alternatives to marketing their shrimp to a processor. Each of these alternatives has its advantages and disadvantages. Producers must carefully consider whether the potential for a higher price that a given alternative offers will be sufficient in the long run to offset any costs associated with the new marketing plan. As with any change to the business, the producer also must evaluate whether adopting new marketing strategy is compatible with the resources available in the operation and is consistent with the business and family goals of the operation.

© 2003 TAA Technical Assistance 72
Shrimp Marketing References for Additional Information
• Florida Department of Agriculture and Consumer Services. www.fl-aquaculture.com Marketing publications: http://www.fl-aquaculture.com/shrimp.com/shrimp/ Titles of publications are: “Assessing Potential Direct Consumer Markets for Farm-raised Shrimp” by Wirth and Davis, 2001. 39 pages. “Identifying and Assessing Potential Direct Markets for Farm-raised Shrimp Grown on Small Farms” by Florida Dept. of Agriculture, Bureau of Seafood and Aquaculture Marketing, and Univ. of Florida.
• Texas Department of Agriculture’s Go Texan marketing program. http://www.gotexan.org/
• Newsletter. Aquaculture Outlook, published twice a year since October 1989, examines changes in domestic aquaculture production and prices, and provides forecasts of production for the coming year. The report also examines changes in imports and exports of aquacultural products and closely related wild harvest seafood products. www.ers.usda.gov.

© 2003 TAA Technical Assistance 73
Finfish Aquaculture
Issues that shrimp farmers need to consider before looking into finfish culture: • Cost of fingerlings vs. cost of shrimp postlarvae • Stocking rates of finfish • Feed quantity and cost of finfish feed • Harvest techniques • Time to grow fingerlings to market • Over-wintering of some species as a potential risk • Financial analysis • Marketing issues (fresh product, harvest windows, potential outlets for seasonally
produced items, times of the year when production is harvested, price availability is less for fish than for shrimp, markets may be easily saturated).
The following issues should be addressed before a shrimp farmer looks into finfish farming as an alternative enterprise. The cost of fingerling fish ranges from $0.15 to $0.25 each or $150-$250 per thousand whereas shrimp postlarvae cost from $6.00 to $8.00 per thousand. Fish are generally stocked between 1,000 to 6,000 fingerlings per acre whereas shrimp larvae in intensive culture are stocked at around 50 per square meter or 180,000 to 200,000 per acre. Feed conversion ratios are generally the same for shrimp or finfish and average around 2 pounds of feed for every pound or shrimp or fish produced. Harvest techniques in Texas are different with shrimp and fish. The shrimp are drain-harvested using a fish pump to lift the shrimp from a harvest sump to a dewatering device and they are quick killed on ice in plastic tots that hold around 1,000 lbs. Finfish are generally rounded up with a seine and either lifted with an auger that pulls water and fish out at the same time or they are hoisted out of the seine with baskets and placed in ice tots, similar to the shrimp tots. It generally takes 12 to 24 months to grow finfish to market size whereas it takes 4 to 6 months to grow shrimp to market size. Shrimp are grown only during hotter summer months whereas fish are grown throughout the year since at least a full year is required to grow them out. This means taking the fish through a winter season. Red drum are susceptible to very cold rapidly dropping temperatures in a shallow pond and risk of losing the crop is a reality in a cold winter. Thermal refuses are required during a very cold winter. Hybrid striped bass are not as susceptible to freezing but growth stops below 15 degrees C. A financial analysis is available for catfish through Dr. Carol Engle, 1200 n. University Dr. Pine Bluff, Arkansas 71601, Tel. (870) 543-8537, and can easily be converted to red drum or hybrid striped bass. Finfish are generally sold to the processor fresh on ice and are generally whole fish that have not been gilled or gutted. Finfish are generally less seasonal than
Alternative Enterprises

© 2003 TAA Technical Assistance 74
shrimp and can be harvested throughout the year. Farm gate whole fish prices in Texas have historically ranged from $2.00 to $2.40/lb for either red drum or hybrid striped bass. Bass fillets sell for $6.50/lb and can be air freighted anywhere in the US for approximately $0.50/lb. Prices for finfish are generally not as published as for shrimp and are somewhat more difficult to find. Lastly the markets for fresh finfish are easily saturated. This is apparent in the winter when red drum ponds are harvested due to potential winter kill. The price drops rapidly from $2.35 to $2.00/lb. The 3rd largest hybrid striped bass producer in the US in located in Texas. This farm claims that markets are off 60% this year because a new farm started producing on the coast. There is evidence that fresh finfish markets are easily saturated. Typical hybrid striped bass expectation scenario and assumptions
1. 7,200 lbs/ac. production expected. 2. 1.5 inch fingerlings (costs between $0.15-0.20 each plus shipping from Arkansas). 3. 2:1 FCR 4. Feed about same price as shrimp feed ($0.27-$0.31/lb at Cargill or Rangen
Feeds). 5. Takes 12 months to get one pound fish and 18 months to get 2 pound fish. 6. One phase system used (direct stocking into 5-acre ponds). No fingerling moving
required after that. 7. Stocking rate for 1.5-inch fingerlings will be 6,000 fingerlings/ac. or 30,000 fish
per 5-ac. pond. 8. 80% survival from fingerling to 1.5 lb. fish or 24,000 fish that weigh 1.5 lbs each. 9. 36,000 total pounds harvested from each 5-ac. pond or 7,200 lbs./ac. 10. Wholesale price for fish is $2.00/lb whole on ice.
Actual occurrence at shrimp farm that stocked striped bass 10,000-12,000 striped bass fingerlings were stocked per 5-acre pond (3 inch fish). The larger the fingerling when starting the better the uniformity of size at harvest and the better they will start to feed once stocked. One million 3-inch fish from Arkansas were obtained at $0.25 ea. Optimum water temp for growth is 25 degrees C. Under 15 degrees C no growth. Over 27 degrees C sometimes they will eat sometimes they won't. At peak feed consumption in a pond with good survival (90%), fish will eat 350 to 400lbs of feed/day and they can do it in about 30 minutes. Farm’s FCR goal was 1.5 to 2.0 lbs of feed for each pound of fish and they achieved 1.7 to 2.1 FCR. It worsened however once fish grew over 2 lbs. The best 5-acre pond harvested showed 99% survival and 27,000 pounds of 2.3 lb. fish were removed (5,400 lbs per acre). The price ranged from $2.10/lb. to $2.40/lb. Feed cost via Cargill was $0.25/lb., and Rangen Feeds had a more expensive but better feed at $0.27/lb. Marketing before production starts is a must! Supplemental aeration is a must and the ability to exchange water is helpful. 3 feedings /day to start, then 2/day, then after fish get to around .7-.8lbs ea. -1 feeding/day. Best fed in early morning before sunrise and late afternoon during the hot months.

© 2003 TAA Technical Assistance 75
Red Drum Aquaculture Red drum (Sciaenops ocellatus) are native finfish to the Gulf and South Atlantic States. Hatcheries and farms have been established and approximately 2 million pounds are produced annually on Texas farms. Red drum are susceptible to winter kill from cold temperatures in shallow ponds whereas the hybrid striped bass are not. Otherwise, red drum aquaculture is very similar to hybrid striped bass aquaculture in many aspects. The stocking densities, fingerling costs, time of growout, feed, FCR and price received for the product are all very similar; therefore details will not be presented on red drum, but additional information on both finfish species can be obtained from the USDA Southern Regional Aquaculture Center web site. Bait Shrimp Aquaculture Bait shrimp aquaculture is an alternative enterprise that can be considered by shrimp farmers. However, commercial aquaculture pond trials using native shrimp for bait have not been sustainable in the past. Texas A&M University and Nova University in Florida are the two most active facilities conducting bait shrimp research. Some of the issues that need to be addressed before a sustainable commercial bait shrimp industry can be established are:
• High health, disease-free stocks of native shrimp available to producers on year-round basis
• Marketing and distribution channels defined • Recreational bait shrimp needs must be defined • Seasonal needs and corresponding seasonal production addressed • Improved methods of physical transport and supplying healthy shrimp to the
market • Ways for both bait shrimp harvest industry and aquaculture bait industry to co-
exist, supplying the needs of the same market Until these issues and others are addressed bait shrimp aquaculture is a very risky business to consider as an alternative enterprise.

© 2003 TAA Technical Assistance 76

© 2003 TAA Technical Assistance 77
For some farmers and fishermen, exiting the business may be the best financial and family option. For some it may be the only option. Transitioning to a new career, business, or to retirement can be an emotional and complex experience. This is particularly true when financial stress is forcing a change or exit from the business. Some producers and their families may be ready for a change or for retirement, but others may be in the process of being forced out of their business for financial reasons. If you are facing a potential transition out of your business you should discuss your options and goals with family members, creditors, and financial advisors. You might also seek additional assistance from TAA technical assistance providers. There are different transition issues that need to be addressed depending each individual’s situation, but some general factors should be considered by most producers or fishermen faced with exiting their business. These include future sources of income, family and emotional well-being, tax and credit issues, and retaining and education opportunities for TAA eligible producers and fishermen. Future Sources of Income If you are transitioning out of your business, you need a new means to support yourself and your family. Your source of future income will depend significantly on your stage of life. Your stage in life will determine whether you are willing to start over with a new career or business, seek additional education and training, or plan for partial or full retirement. Different Business or Career An earlier section of the TAA technical assistance package, Inventory of Resources and Talents, discussed your skills and resources. This same inventory can be very useful to assess your opportunities to transition to new business or career. The education and experience that you have obtained will have a significant impact on the alternative sources of employment and income available. The management, technical and people skills obtained in farming or fishing can often be leveraged into valuable assets for other types of employment or in other businesses. Farmers and fishermen possess a set of entrepreneurial skills that are valuable when starting a new business. But starting a new business is rarely easy. The statement is frequently made that 80 percent of new businesses are gone within five years. Farmers and fishermen may possess the experience and management skills to give them the edge
Transitioning Out of the Business

© 2003 TAA Technical Assistance 78
to overcome the odds when starting a new business, but should still seek advice and assistance. Small Business Development Centers (SBDC’s) are located throughout the country and provide help with financial, marketing, production, organization, engineering and technical problems and feasibility studies. To locate the nearest SBDC visit (http://www.sba.gov/sbdc/) or call 1-800-8-ASK-SBA. You may be interested in starting a new career as an employee, rather then starting a new business. You probably have numerous relationships with businesses in your area. If you are seeking off-farm employment, your existing relationships are one of the most valuable tools available to assist you in your job search. As the producer of a TAA certified commodity, you also have access to employment counseling services at your state department of labor (http://www.doleta.gov/tradeact/contacts.cfm). Location may also be a major factor in determining how you will seek future income. In many rural areas job availability is limited, many jobs may not pay enough to maintain your standard of living, or available jobs may not include health insurance benefits. Determining whether you are willing to relocate may be a major issue for you and your family. Regardless of whether you are considering a new business or a new job, your attitude is critical to success. You have the opportunity to create a new future for yourself. You can take the attitude that your future is in your hands or you can have the attitude that you are a victim of circumstances beyond your control, of imports, overproduction, and lost markets. Your attitude may be the single most important factor in determining the success of your new career or business. Retirement The average age of agricultural producers in the U.S. is in upper 50’s. For many producers, retirement may be a viable option when facing the choice of exiting the business or struggling financially to keep it going. If retirement is an option for you, there are a number of questions you should answer before making the decision to retire. Do you have sufficient financial resources to sustain you through the retirement years? You should project your retirement income and your retirement expenses to determine if you will have adequate income for your retirement. If you aren’t sure how to project your financial needs or how to evaluate income from your investments and capital assets, you should seek the assistance of a financial planner. How will you handle your capital assets? For many producers, the bulk of their wealth is tied up in capital assets such as land, buildings, and equipment. Will you sell the capital assets and invest the proceeds or will you lease out the assets to provide retirement income? Do you know how much social security you will receive if you retire? Do you have the annual statement you receive from Social Security Administration detailing how much you will receive at various retirement ages? You may want to contact your local social security office (http://s3abaca.ssa.gov/pro/fol/fol-home.html) or call 1-800-772-1213 to determine your specific retirement benefits.

© 2003 TAA Technical Assistance 79
Health is a major issue for most senior citizens. Do you want to retire early while your health is good? If you retire now will you have adequate health care coverage to cover you until you are eligible for Medicare? Should you wait to retire due to health care affordability? Supplemental Income and Leasing Assets You have probably considered supplementing your income with off-farm or non-fishing income. Have you exhausted all the possibilities for supplemental income? There are certainly trade-offs associated with finding a second job. You may not have the time to successfully manage your business. The impact on your quality of life or family life may cause you to decide supplemental income is not worth the cost. You may want to explore the possibility of terminating your business while retaining control of your business assets. Leasing your land, equipment, or boat to other farmers or fishermen when combined with an off-farm or non-fishing job may allow you to support yourself financially. This alternative may allow you to keep the land or boat to which you have emotional ties, while providing sufficient income for your family. Exiting the business while retaining control of the assets is dependent on the amount of debt you have against those assets and your overall financial situation. Family and Emotional Well-Being When considering a transition or exit from your business, family concerns are one of the major issues that will impact your decision making. What are the goals of your family? How much emotional impact will leaving the business, possibly your way of life, or a potential move have on you and your family? Where will you live, can you stay living on your farm or in your community? Goals The previous Goals section of the TAA technical assistance package discussed setting and implementing goals for your business and family. Goals are important when you are considering a major career change. Even though exiting your business may be the best financial decision or in some cases you may not have a choice about exiting, considering your family goals as explore the next step is important. Emotional Stress and Counseling Transitioning out of your business and your way of life may be one of the most stressful events you will ever experience. This is especially true if you are exiting due to financial stress. Although you might not believe it now, many farmers and fishermen have successfully and happily transitioned to a different career. Many successful business people started out with a farming background and took their work ethic and skills into another field. During this time of emotional stress, it may be very important for you get help. Counseling help is usually available. You might start by checking with your local

© 2003 TAA Technical Assistance 80
county human services department or a member of your local clergy. If you don’t know where to ask for help, contact your local Extension Service and ask them where to find assistance. Living Situation What options do you have to continue to live in your home and in your community? The answer may depend on many of the issues discussed above, can you find alternative employment or start a new business that will financially support you in your current living situation? If you live on a farm, can you retain ownership of it and rent out the land? If you need to sell the land, can you keep the farmstead and continue to live in your home? If you need to move to a different community to find employment, will you be able to continue to own a farm that may have been in your family for several generations? One of the most important aspects of these topics is whether you are willing to seek the help of friends, family, or business advisors to help you think through your options? Often times someone else can help you think about options more broadly and also, others can look at the situation without the emotional stress you may be experiencing. Tax and Credit Issues Taxes are one of the major issues you will need to address if you exit your business. If you are planning to sell your business or assets owned by your business, meet with a qualified tax advisor first. You should also keep your lender informed about your plans. Many assets have security agreements in which they are used as the collateral for the outstanding debt used to purchase the asset. Proceeds from assets sold with security agreements must be used to pay off the credit owed for the asset. Income Taxes Taxes can consume a major portion of the sales value of a business’s assets. Tax planning is critical if you are transitioning out of your business and selling business assets. When selling capital assets you must pay income tax on the difference between the selling price and the tax basis of the asset. Tax basis is the generally the amount you paid for the asset minus any tax depreciation you have claimed on it. Some assets, such as land, are not generally depreciated, so the tax basis is simply the difference between the selling price and the original purchase price. Most assets owned more than 12 months qualify for capital gains tax rates. Capital gains rates are either 5% or 15% depending on your income level. For assets that have been depreciated below their market value, the difference between the sales price and depreciated value will be taxed at your normal income tax rate. There are ways to reduce the amount of tax you will pay on the sales of your capital assets. One method is installment sales of property. The installment method allows you to spread out the taxation proportionally over the years that principal payments are made. Another strategy is to sell assets over several years. Both the installment method and

© 2003 TAA Technical Assistance 81
selling assets over time will often allow you to keep more taxable income in lower tax brackets. If you are selling a farm that includes your personal residence, up to $250,000 ($500,000 for married filing jointly) of capital gain on the residence can be excluded from taxation. In every case you should consult a tax advisor. Self-Employment Tax Income tax must be paid on the sales of all farm or fishing assets, but self-employment tax is only due on current assets, such as, crop and livestock inventories. You may want to consider selling all of your current assets in a single year if it will push your income over the self-employment tax limit. In 2003, self-employment tax is only charged on the first $87,000 of income. The self-employment tax threshold increases each year. Sales of capital assets including equipment, machinery, buildings, and land are not subject to self-employment taxes. Collateral and Security Agreements You have probably been discussing your situation with your lenders, but before you sell any assets you should contact the appropriate lenders to check on security agreements. You should repay outstanding loans against assets that you are selling or discuss a repayment plan and security release with your lender. Frequently there is considerable debt against farming or fishing assets. Liquidating some assets may only generate enough cash to pay the outstanding debt or in some cases the sales revenue may be insufficient to cover the debt. You should keep lenders informed throughout the process and work with them. TAA Retraining and Education Opportunities Producers of commodities that are eligible for TAA benefits are also eligible for substantially more retraining and educational benefits than the typical producer or fisherman facing an exit from their business. To learn more about TAA retraining and educational benefits available, contact the Department of Labor TAA coordinator in your state (http://www.doleta.gov/tradeact/contacts.cfm). For some producers and fishermen the TAA educational benefits may be the most significant benefit available under TAA. For others, such as those approaching retirement or unable to relocate to an area where jobs are available, the educational benefit may be less valuable. The TAA Department of Labor program provides retraining and reemployment services tailored to help individuals prepare for employment in another job or career. Producers or fishermen may receive up to 104 weeks of approved training in occupational skills or basic or remedial education. There are some conditions that you need to meet to receive the educational benefits. You must be able to complete your educational program within 104 weeks and be job ready at the end of that time. Generally that means that will need to earn some type of degree

© 2003 TAA Technical Assistance 82
within the 104 weeks. The educational program must be fully paid for by the Department of Labor. You can’t supplement government payments with your own funds. This means that there are limits to how much the program can cost and on when you must complete it. Individual state labor agencies responsible for TAA have lists of educational programs in which TAA participants may enroll. Summary Whether to make the pivotal move of transitioning out of your farm or fishing business is a very personal decision that each person has to think through with the support of his or her family. Analyzing the financial viability of your business, determining the availability of alternative sources of income, working through the emotional and family issues, examining the tax consequences, and exploring retraining opportunities are important parts of the process. Assistance is available for all of these issues related to transitioning out of your business, but only you and your family can make the final decision. Developed by Kevin Klair, Extension Economist, Farm Management, University of Minnesota.

© 2003 TAA Technical Assistance 83
• How to Access More Information
How Do I Get There?

© 2003 TAA Technical Assistance 84

© 2003 TAA Technical Assistance 85
Shrimp Farming Links on the Internet Federal Government Publications http://aquanic.org/publicat/govagen/govag.htm US Aquaculture Production for 1985-1999 http://ag.ansc.purdue.edu/aquanic/jsa/aquaprod.htm U.S. and World Shrimp Trade Trends in Production, Imports, and Exports, 2003 http://www.fas.usda.gov/ffpd/Fishery%20Products%20Presentations/Shrimp/SHRIMP03final.ppt Guide to Federal Aquaculture Programs and Services http://ag.ansc.purdue.edu/aquanic/jsa/federal_guide/index.htm U.S. Per-Capita Consumption By Species in Pounds http://www.nfi.org/?a=news&b=Top%20Ten%20Seafoods&PHPSESSID=064155f6a5937fbbe6564f045abff40a Aquaculture Outlook http://jan.mannlib.cornell.edu/reports/erssor/livestock/ldp-aqs/2002/aqs16.pdf USDA Crop Disaster Program http://www.fsa.usda.gov/pas/publications/facts/html/cdp03.htm EPA http://www.epa.gov/OST/ EPA Aquaculture Effluents Guidelines http://www.epa.gov/ost/guide/aquaculture/ FDA HACCP Plan http://vm.cfsan.fda.gov/~dms/haccp-2a.html NOAA Fisheries Statistics & Economics Division http://www.st.nmfs.gov/st1/
How to Access More Information

© 2003 TAA Technical Assistance 86
Southern Regional Aquaculture Center Home http://www.msstate.edu/dept/srac/ Publications http://www.msstate.edu/dept/srac/publicat.htm Marine Shrimp Opportunities and Constraints in Marine Shrimp Farming http://srac.tamu.edu/2600fs.pdf Marketing Publications Small Scale Marketing of Aquaculture Products http://srac.tamu.edu/350fs.pdf Analysis of Regional and National Markets for Aquaculture Products for food in the Southern Region http://srac.tamu.edu/601fs.pdf Texas Aquaculture Sites Texas Aquaculture Association http://www.texasaquaculture.org Texas Aquaculture Facilities http://www.texasaquaculture.org/id30.htm Legal Representation http://www.baw.com/aquaculture.html Shrimp Farming Course http://www.texasaquaculture.org/id84.htm Texas A&M University Sea Grant Aquaculture Publications http://texas-sea-grant.tamu.edu/pubs/pubcat/aquaculture.html TCEQ Rules and Regs. http://www.tnrcc.state.tx.us/oprd/rules/indxpdf.html Texas State Agencies http://www.state.tx.us/

© 2003 TAA Technical Assistance 87
Texas Aquaculture Sites (cont) Texas Parks & Wildlife http://prodweb.tpwd.state.tx.us/ Texas Dept. of Agriculture http://www.agr.state.tx.us/index.htm Aquaculture Certification Aquaculture Certification Council http://www.aquaculturecertification.org/ Shrimp Processing American Shrimp Processors Association http://www.americanshrimpprocessorsassociation.org/ US Aquaculture Sites US Marine Shrimp Farming Program http://www.usmsfp.org/ Shrimp News International http://www.shrimpnews.com/ Mississippi State University – Aquaculture Marketing site http://www.msstate.edu/dept/crec/awmr.html Current Seafood Wholesale Prices http://www.st.nmfs.gov/st1/market_news/doc21.txt High Health Shrimp http://www.hihealthshrimp.com/ Aquaculture Equipment http://www.housemfg.com/ Aquaculture Equipment http://www.rbaquatic.com/ Global Aquaculture Alliance http://www.gaalliance.org/

© 2003 TAA Technical Assistance 88
US Aquaculture Sites (cont) Seafood Net.com http://www.seafoodnet.com/ AquaNIC (Purdue University) http://aquanic.org/ International Aquaculture Sites World Aquaculture Society http://www.was.org/main/FrameMain.asp World Shrimp Markets http://www.fas.usda.gov/ffpd/Fishery%20Products%20Presentations/Shrimp/SHRIMP03final.ppt http://www.globefish.org/presentations/worldshrimpproduction/sld001.htm Food and Agriculture Organization of the UN http://www.fao.org/index_en.htm State of the World Fisheries and Aquaculture http://www.fao.org/docrep/w9900e/w9900e00.htm#TopOfPage University of Ghent http://allserv.ugent.be/aquaculture/index.htm Stirling Aquaculture http://www.atc.stir.ac.uk/staq/ Shrimp World, Inc. http://www.shrimpcom.com/

© 2003 TAA Technical Assistance 89
Additional Shrimp Marketing Links for Examples Shrimp Anywhere, Inc. http://www.shrimpanywhere.com/ BlueCadia http://www.bluecadia.com/ Sea Farms Group http://www.seafarmsgroup.com/index.html Ocean Garden http://www.oceangarden.com/ Shrimp Marketing References and Shrimp Prices http://www.chipsbooks.com/shrimp.htm http://www.chipsbooks.com/intlseaf.htm http://www.seafoodreport.com/info.cfm?x=int http://www.worldseafoodmarket.com/MR/MRHome.jsp http://www.bigy.com/content/stor/pdct/wc_meatseaf.php Aquaculture Overview http://www.kyagr.com/mkt_promo/hort/pdf/e_aquaculture%20overview.pdf