Embed Size (px)
Citation preview
Shuttle lidar resonance fluorescence investigations.2: Analysis of thermospheric Mg+ measurements
Shoou-Dyi Yeh and Edward V. Browell
Shuttle lidar measurements of magnesium-ion (Mg+) number density in the ionosphere (80-500 km) havebeen numerically simulated. A set of recently defined system parameters are used to assess the system per-formance. These simulations take into account the saturation effect of atomic absorption due to the highintensity of the laser, which is seen to be important in making near-field or daytime measurements. Whenthe saturation is important, a calibration procedure must be used to correct the systematic error introducedby this effect. Both the nadir- and zenith-viewing configurations have been considered because the altitudeof the Shuttle was assumed to be 300 km. The background level in these two configurations is discussed,and we show that the background level for zenith-viewing with the assumed lidar system parameters is negli-gible. The calibration of the lidar system parameters by means of Rayleigh backscattering from atmospher-ic molecules in the stratosphere is examined. This method is shown to require extra care because of thewavelength used (2796 A), which lies within a strong absorption band of ozone causing large transmissionerrors. The Shuttle lidar capability for Mg+ measurement is compared with the requirements for conduct-ing scientific investigations in the thermosphere.
1. IntroductionThe metal-ion number density profiles and their
spatial and temporal variations are important infor-mation for understanding the ionospheric dynamics andchemistry. The measurements of these species arecurrently made by rocket- or satellite-borne massspectrometers and dayglow photometers.' Theseconventional techniques have severe limitations. Forexample, the mass spectrometer can make only in situmeasurements, and the dayglow photometer is not ca-pable of nighttime measurements and, until very re-cently,2 gave only column content information. Re-cently proposed Shuttle-borne lidar measurements3 canovercome these difficulties and potentially will be ableto surpass the measurement accuracy of these conven-tional methods.
In this paper we numerically simulate the measure-ments of magnesium ions (Mg+) over the 80-500-kmaltitude range using recently defined Shuttle lidarsystem parameters (Table I) to study the performance
When this work was done, S.-D. Yeh was with Systems and AppliedSciences Corporation, Hampton, Virginia 23666; he is now withUniversity of Kentucky, Department of Physics & Astronomy, Lex-ington, Kentucky 40506. Edward Browell is with NASA LangleyResearch Center, Hampton, Virginia 23665.
Received 7 December 1982.
of such a system. The measurements are based on thedetection of resonantly backscattered fluorescencephotons following the 3S2SJ2-3p 2P3 /2 excitation of Mg+by laser radiation at 2796 A. The measurement prin-ciple is the same as that of the alkali atom measure-ments which we have described in a previous paper.4However, there are three major differences that requirecareful consideration: (1) the wavelength used is in astrong absorption band of ozone, and this affects thecalculations of background level in the nadir-viewinggeometry and the procedure and accuracy of systemparameters calibration; (2) due to the large altituderange (80-500 km) to be investigated, both nadir- andzenith-viewing configurations, each with a differentbackground level, have to be considered for a Shuttlealtitude of 300 km; and (3) because near-field mea-surements have to be considered, larger saturation ef-fects will occur as a result of the smaller area of illumi-nation for a given laser beam divergence and pulse en-ergy.
In the following sections we briefly review the reso-nance fluorescence lidar equation and discuss the cali-bration of system parameters and calculations ofbackground levels for two different viewing configura-tions. The saturation effect and its calibration are alsodiscussed, and the uncertainty in the effective absorp-tion cross section of Mg+ is estimated. We present thesimulation results for lidar measurements of Mg+ anddiscuss these results with respect to scientific investi-gations.
1 July 1982 / Vol. 21, No. 13 / APPLIED OPTICS 2373
Table I. Assumed Shuttle Lidar System Parameters
Wavelength /,m 0.2796Energy per pulse J 0.04Pulse duration jisec 0.01Laser linewidth pm 0.5Pulse repetition rate Hz 10Laser beam divergence mrad Optimal valuesaArea of receiver m2 1.11Detector bandwidth nm 1.2Optical efficiency % 28bPMT quantum efficiency % 30Receiver FOV mrad 1.27 X laser beam
divergencesShuttle altitude km 300Shuttle speed km/sec 8
a Daytime laser beam divergences are those yielding the minimumsignal error. The nighttime laser beam divergences are determinedby the largest telescope FOV, taken to be 6 mrad.
b Three aluminum mirrors, two uncoated lenses, and a 50% inter-ference filter transmission efficiency are assumed (see Ref. 17).
II. Resonance Fluorescence Lidar EquationAs in the case of alkali atom measurements,4 the
signal return (number of photoelectrons) per laser shotfrom the observation point can be written as
P = ( A exp(-2r)(0o + nueff), (1)(ZL - Z2'
where K = ArEi -qqX/hc is a product of system de-pendent parameters;
Ar = area of receiver;El = energy per laser pulse;, = system optical transmission efficiency;q = quantum efficiency of detector;X = wavelength;h = Planck's constant;c = speed of light;
Az = vertical measurement resolution (rangebin size);
ZL = lidar altitude;z = altitude of the observation point;X = optical thickness from z to ZL, equal to
| i FL a(')dz,| (atot is the total extinctionZ t I coefficient at altitude z');
= backscattering coefficient at z due tomolecules other than Mg+;
n = number density of Mg+ at z; and¢eff = effective backscattering cross section per
Mg+ ion.The number density n of Mg+ can be obtained by in-verting Eq. (1) yielding
n =I [ K (-Z) 2exp(2T) - . (2)
0e ffF [ Az
It should be noted that Eq. (1), in which the signalreturn is proportional to the laser pulse energy, does nottake into account the saturation of atomic absorption.5Hence the direct use of Eq. (2) to obtain the numberdensity from the measured signal return withoutproperly accounting for the saturation will lead to asystematic underestimate of the number density. Thisand other aspects of saturation effect will be discussedin later sections.
Ill. Sources of Uncertainties in Mg+ MeasurementsAs discussed in the previous paper,4 if the signal re-
turn from a certain altitude z, is used to calibrate thesystem parameters, the number density to be measuredcan be obtained as
1n = - [PQ/O3, - 0],
aeff
(3)
where P = [P8 (ZL - )2 ]/[Pc(ZL - Zc) 2 ] is the ratio ofrange-corrected signals between the observation pointand the calibration point; Q = exp[-2(rc - r)] is thetwo-way attenuation factor between the observationand the calibration points, r and -rc are, respectively, theoptical thicknesses from the lidar to the observationpoint and the calibration point; 0c is the backscatteringcoefficient at the calibration point, which is mainlyRayleigh; and 10 is the backscattering coefficient at theobservation point from molecules other than the speciesto be measured. The fractional error in the numberdensity can then be obtained by4
n fr P Q 0cl
(4)X f f+ '/2 + o ) l2(oeJ2n Uef #o n,) °
Unlike the case of sodium and potassium measure-ments, where there is little attenuation between theobservation and calibration points (both and i> arevery small), the measurements of magnesium ion use awavelength of 2796 A, which is within a strong absorp-tion band of ozone. The ozone absorption leads to anon-negligible attenuation between the observation andcalibration altitudes. Depending on the altitude chosenfor calibration, the attenuation factor Q will vary.Following the analysis given by Russell et al. ,6 i.e.,
2j[5TA(Z,Zc)]2
+ [M(z,zc)I2 + [bT0
3(ZZC )121/2,Q
where it is assumed that
6rO3(Z,Z,) = 0.2TO3(Z,Z,), 6rA(Z,Zc) = 0.5rA(Z,ZC),
6TM(Z,Z,) = 0.1TM(ZZC),
and where TA,TM,1 03 are optical thicknesses from theobservation point to the calibration point of aerosol,molecules, and ozone, respectively (see Ref. 6 for de-tails). Since ztA and 1 M are much smaller than 103, thedominant contribution to Q/Q will be from the un-certainty in the ozone optical thickness. If zc = 30 kmis chosen, for example, the ozone optical thickness 1r3
from ZL to 30 km is 5.7,7 which amounts to an uncer-tainty in the attenuation factor of 3Q/Q = 228%. Ifinstead the altitude of z, = 40 km is chosen, 103 - 0.782,and the uncertainty in the attenuation factor can beestimated to be 3Q/Q _ 31%. Likewise, for Z, = 50 km,T03 = 0.01, and the uncertainty in Q becomes 0.4%.These errors cannot be improved by signal integrations.Thus a reasonable altitude for system parameter cali-bration is in the vicinity of 50 km.
However, when a zc of 50 km is chosen for the cali-bration of system parameters, the Rayleigh backscat-tered signal is much weaker than at 30 km, so that a
2374 APPLIED OPTICS / Vol. 21, No. 13 / 1 July 1982
Table II. Altitude Dependence of Mg+ Doppler Width and EffectiveAbsorption Cross Section
Tempera- Doppler Effective absorptionAltitude turea width (FWHM) cross section
(km) (K) (pm) (10-12 cm2)"
100-110 200 0.58 3.26110-120 300 0.71 2.87120-130 400 0.82 2.60130-140 500 0.92 2.39140-150 600 1.01 2.22150-175 700 1.09 2.08175-200 800 1.16 1.98200-225 850 1.20 1.93225-250 900 1.23 1.88250-275 950 1.26 1.83275-500 1000 1.30 1.79
a From U.S. Standard Atmosphere (1976).b Gaussian line shape for the laser having a width (FWHM) of 0.5
pm is assumed locked to the absorption peak of the Doppler-broad-ened line.
longer integration time will be needed to achieve goodcalibration accuracy. Also the uncertainty in the mo-lecular number density, which cannot be overcome bylonger integration time, is greater at 50 km than at 30km.
Reasonable estimates of the molecular number den-sity uncertainty, '5 ,c/1oc, have been discussed in Refs.6 and 8. Typical values of the uncertainty were ob-tained by Russell et al.9 for cases where radiosondemeasurement data are available, where interpolationsof data are needed, and where models have to be used.For the purpose of the simulations presented here, weuse conservatively the errors associated with the lastcase, i.e., 5% at 50 km and 3% at 30 km.
Due to the large range of the observation region(80-500 km), the temperature at the observation pointz can vary between -200 (lower altitudes) and -1000K (higher altitudes). The Doppler linewidth and thusthe effective cross section of Mg+ ion will vary as shownin Table II. The effective absorption cross sections inTable II are obtained assuming a Gaussian line shapefor the laser locked to the absorption peak of a Dop-pler-broadened line. These effective absorption crosssections are used in later simulations to take into ac-count the variation of cross sections with altitude.
The uncertainty in the effective cross section, whichcontributes to the number density error, depends on ourknowledge of the temperature at the altitude undermeasurement, or the ability of the system to simulta-neously measure the temperature. Such temperaturemeasurements using a resonance absorption cell havebeen discussed by Blamont et al. 10 in the sodium case,in which an uncertainty of 25 K was obtained using la-sers of modest energies.
In the simulations discussed here we assume that thesame technique can be used for the measurement ofMg+ ionic temperature. Near the strong sporadic-Eregion, where the Mg+ concentration is large, and in thenear field, where the signals are strong, it is reasonableto assume that the temperature measurements can bemade as accurately as in the Na case. In the interme-diate range, e.g., near 150 km in the nadir-viewing case,
or far field in the zenith-viewing case, the accuracy willbe much lower if lasers of comparable power are used.However, comparing Table II of this paper with TableI of Ref. 4, the effective absorption cross section is lesssensitive to the temperature than in the Na case. Forexample, near 150 km the temperature is -700 K,11 andan uncertainty of 100 K results in an error of approxi-mately -4.8% to -6.7% in the effective absorption crosssection. Above 300 km an uncertainty of 100 K causesan. error of -5%. A temperature error of 100 K is veryconservative compared with the 25 K uncertainty in theNa case mentioned above. Therefore, in the followingsimulations we assume a 4% uncertainty in the effectiveabsorption cross section. In any case, the uncertaintyin the effective cross section is not the dominating factorin the error of Mg+ number density.
The uncertainty in the measured signal is due tophoton statistical fluctuation in the received lidar andbackground signals and is calculated assuming that thephoton arrivals are a Poisson stochastic process as dis-cussed in Ref. 4 [Eq. (6)]. Terms containing f0/n effin Eq. (4) are small by the same argument given in Ref.4; however, they are included in all simulations forcompleteness.
IV. Background-Level Considerations
A. Zenith-Viewing ConfigurationAt a Shuttle altitude of 300 km the dominant con-
tribution to the daytime background in this configu-ration will be due to fluorescence from solar-excitedMg+ ions, which has been discussed in detail by An-derson and Barth.12 To obtain an estimate of thebackground the column density along the optical pathof the viewing receiver and the emission rate factor ofthe transition lines of Mg+ involved are required. Thebackground per unit solid angle of the receiver is givenby
i1 N4r y
where Ii is the background in photons cm-2 sec 1 sr-1 ,the subscript i indicates the particular transition lineof Mg+ ion, gi is the emission rate factor of that transi-tion, N is the column number density in cm-2 , and u isthe slant path correction factor. Knowing N and gi willallow us to determine the contribution to the back-ground from fluorescence due to solar excitation of thetransition line i. The number of transition lines con-tributing to the background depends on the bandwidthof detector used and the level structure of Mg+ ion.The Mg+ ion has two allowed transitions in the wave-length region (-2796 A), a doublet at 2802.698 A cor-responding to the 3s2S 1 /2-3p 2p1 /2 transition and adoublet at 2795.523 A corresponding to the 3S2S1 /2 -3p 2P3/2 transition. Both lines will contribute to thebackground for a detector with a bandwidth larger thanthe separation of the two lines (-7 A). In the simula-tiops given here a detector of the 12-A bandwidth isassumed; thus the background will be the sum of con-tributions from these two transitions. Appropriate
1 July 1982 / Vol. 21, No. 13 / APPLIED OPTICS 2375
values of the emission-rate factor for these two transi-tion lines have been obtained by Anderson and Barth12
based on the measurements of Lemairel3 and Wilsonet al.,14
= 0.037 photons/sec at 2803 A,
1/2,2/3= 0.091 photons/sec at 2796 A,where the indices 1/2,1/2 and 1/2,2/3 refer to the tran-sitions 3s 2S 1/2-3p2p1 /2 and 3s2S1 /2 -3p 2P3 /2, respec-tively.
The column density of Mg+ must be known to obtainan estimate of the background. The Mg+ ion densityis highly variable at high altitudes. Depending on the(local) time of day and altitude, it can range from 0 to-100 cm-:3 according to the recent data obtained fromthe Visible Airglow Experiment (VAE) on the Atmo-sphere Explorer E (AEE) satellite.' However, for thepurpose of simulations we can obtain a worst-case es-timate from the VAE/AEE data presented by Gerardet al.' In their analyses it was concluded that thelargest airglow intensity observed in the zenith-viewinggeometry never exceeded 300 R (Rayleigh), corre-sponding to a column density of 2 X 10⁹ ions/cm 2, whichoccurred most probably near 1400 local time. We thusadopt this value for our background estimate. It isnoted that this is a conservative estimate for our anal-ysis (overestimates the background) since the Shuttleis at an altitude higher than the AEE satellite.
Using the values discussed above the background isestimated to be 2.04 X 10ll (photons m- 2 sr-1 sec').For the lidar system currently considered this corre-sponds to 3.6 photoelectrons for a vertical resolution of1 km and a daytime field of view of 6.0 mrad.
B. Nadir-Viewing ConfigurationDue to the strong absorption by ozone at 2796 A,
there is no surface reflection of solar radiation. Con-tributions to the background are from Rayleigh scat-tering along the optical path viewed by the receiver,which are not negligible because of the strong Rayleighscattering at ultraviolet wavelengths. The backgroundcan be estimated by the following integral, assumingplane-parallel atmosphere:
- cosOW) 11+ cos2O NW + P(O)fA(z)I
x exp [-secO 3' att(z')dz - fZL att(z')dz'Jdz (5)
where 0 = solar zeniun angle;W(X) = solar radiance outside the atmosphere at
wavelength A in (W m-2 um);f = molecular (Rayleigh) backscattering
coefficient in (km-' sr-,);fA = aerosol backscattering coefficient in
(km-' sr-'); and0(0) = aerosol phase function relative to the
backward direction.Other variables have been previously defined. Givenmolecular and aerosol profile models, this integral yieldsan estimate of the background level in photons m-2 sr-'
sec' 1 M- 1. An analysis using Eq. (5) shows that thedominant contribution to the background is fromRayleigh scattering above an altitude of -30 km. Thisestimate gives rise to a background level of 7.2 X 10¹⁶(photons m- 2 secl sr-l Am- 1), taking into account areduction factor of 0.9 due to the presence of solarFraunhofer lines.15
The contribution due to fluorescence from solar-excited Mg+ ions is also estimated using the samemethod as discussed in the zenith-viewing case. As-suming a column density of 4 X 109 cm- 2 for the Mg+ion density in accordance with measurements of An-derson and Barth,1 2 a background level of 4.08 X 10"(photons m-2 sr-1 sec 1) is obtained, which for a de-tector bandwidth of 1.2 nm is more than 2 orders ofmagnitude smaller than the Rayleigh contribution andconsequently is neglected.
V. Saturation EffectsThe rate equation analysis of the saturation effects
given in the alkali atom measurements cases4 shows thatthe saturation time (defined in Ref. 4) is inversely pro-portional to the power density of the laser beam. Fora given laser beam divergence and intensity, a near-fieldmeasurement will be subject to the saturation effectmore than its far-field counterpart. Since measure-ments of Mg+ ion density can range from an altitude of-80-500 km, with a Shuttle altitude of 300 km, near-field measurements and the saturation effect must betaken into account carefully.
The calibration of the systematic error due to satu-ration using a resonance cell has been discussed previ-ously.4 A similar calibration can be done in the Mg+ion case. Also discussed in Ref. 4 was the trade off be-tween the reduction of signal level due to saturation andthe reduction of background by decreasing the receiverfield of view (therefore, the laser beam divergence).The same trade-off situation emerges in the measure-ment of Mg+ ions, especially in daytime or in near-fieldcases. We shall not reiterate the discussions here; thesimulation results will be given in Sec. VI.
VI. Simulations
A. Models and ParametersMetal ions in the upper atmosphere are created in the
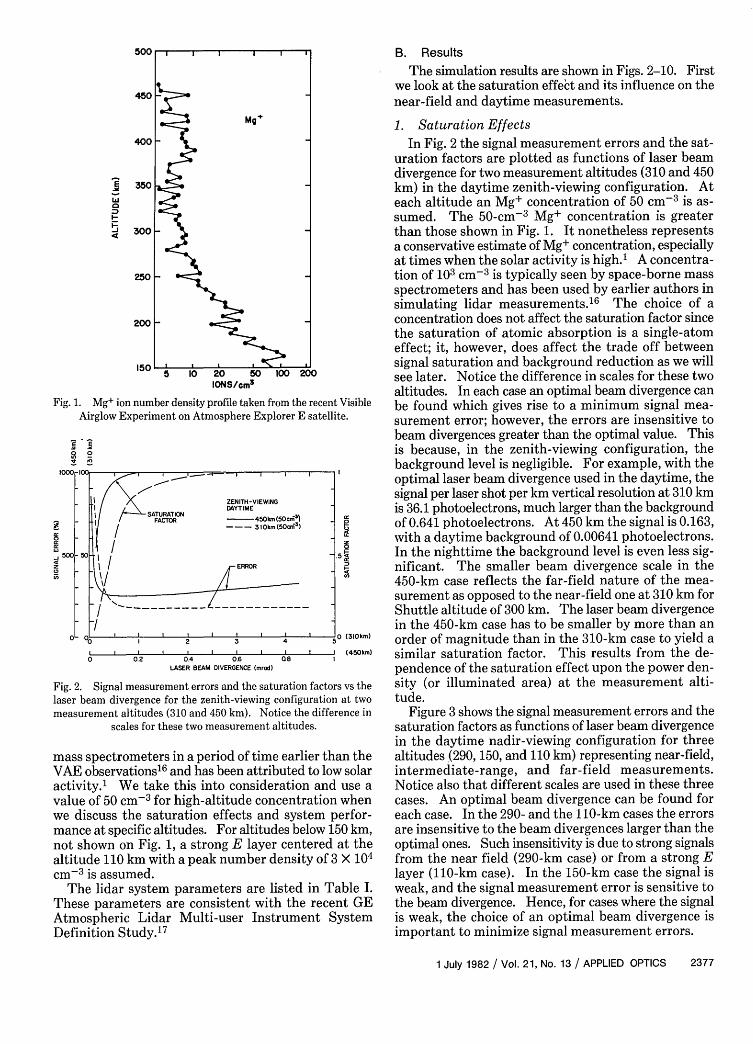
E region by photoionization processes and drift upwardby electromagnetic force. This mechanism explains thelarge diurnal variations that have been observed by therecent Visible Airglow Experiment (VAE).1 For oursimulations of Mg+ ion measurements for the wholealtitude range (80-500 km), we chose a typical late af-ternoon profile (1730 local time) taken from the dataobtained in the Visible Airglow Experiment shown inFig. 1. Such a profile shows a long tail extending intothe higher altitude region (450 km), which is typical ofthe late-afternoon distribution. The Mg+ concentra-tion on this profile lies around 10 cm-3 in the higheraltitude region and increases to -100 cm- 3 near 150 kmas the altitude is decreased. Such densities are very lowcompared with 103 cm-3 typically seen by space-borne
2376 APPLIED OPTICS / Vol. 21, No. 13 / 1 July 1982
E 350
5 300
250
200
150 5 10 20 50 100 200
IONS/cm3
Fig. 1. Mg+ ion number density profile taken from the recent VisibleAirglow Experiment on Atmosphere Explorer E satellite.
E 8
22
-a I 2 3 4
I I I ~~~~I I I0 0.2 0.4 0.6 08
LASER BEAM DIVERGENCE (mrod)
Fig. 2. Signal measurement errors and the saturation factors vs thelaser beam divergence for the zenith-viewing configuration at twomeasurement altitudes (310 and 450 km). Notice the difference in
scales for these two measurement altitudes.
mass spectrometers in a period of time earlier than theVAE observations 6 and has been attributed to low solaractivity.1 We take this into consideration and use avalue of 50 cm-3 for high-altitude concentration whenwe discuss the saturation effects and system perfor-mance at specific altitudes. For altitudes below 150 km,not shown on Fig. 1, a strong E layer centered at thealtitude 110 km with a peak number density of 3 X 104cm-3 is assumed.
The lidar system parameters are listed in Table I.These parameters are consistent with the recent GEAtmospheric Lidar Multi-user Instrument SystemDefinition Study.17
B. ResultsThe simulation results are shown in Figs. 2-10. First
we look at the saturation effect and its influence on thenear-field and daytime measurements.
1. Saturation Effects
In Fig. 2 the signal measurement errors and the sat-uration factors are plotted as functions of laser beamdivergence for two measurement altitudes (310 and 450km) in the daytime zenith-viewing configuration. Ateach altitude an Mg+ concentration of 50 cm- 3 is as-sumed. The 50-cm-3 Mg+ concentration is greaterthan those shown in Fig. 1. It nonetheless representsa conservative estimate of Mg+ concentration, especiallyat times when the solar activity is high.1 A concentra-tion of 103 cm-3 is typically seen by space-borne massspectrometers and has been used by earlier authors insimulating lidar measurements.16 The choice of aconcentration does not affect the saturation factor sincethe saturation of atomic absorption is a single-atomeffect; it, however, does affect the trade off betweensignal saturation and background reduction as we willsee later. Notice the difference in scales for these twoaltitudes. In each case an optimal beam divergence canbe found which gives rise to a minimum signal mea-surement error; however, the errors are insensitive tobeam divergences greater than the optimal value. Thisis because, in the zenith-viewing configuration, thebackground level is negligible. For example, with theoptimal laser beam divergence used in the daytime, thesignal per laser shot per km vertical resolution at 310 kmis 36.1 photoelectrons, much larger than the backgroundof 0.641 photoelectrons. At 450 km the signal is 0.163,with a daytime background of 0.00641 photoelectrons.In the nighttime the background level is even less sig-nificant. The smaller beam divergence scale in the450-km case reflects the far-field nature of the mea-surement as opposed to the near-field one at 310 km forShuttle altitude of 300 km. The laser beam divergencein the 450-km case has to be smaller by more than anorder of magnitude than in the 310-km case to yield asimilar saturation factor. This results from the de-pendence of the saturation effect upon the power den-sity (or illuminated area) at the measurement alti-tude.
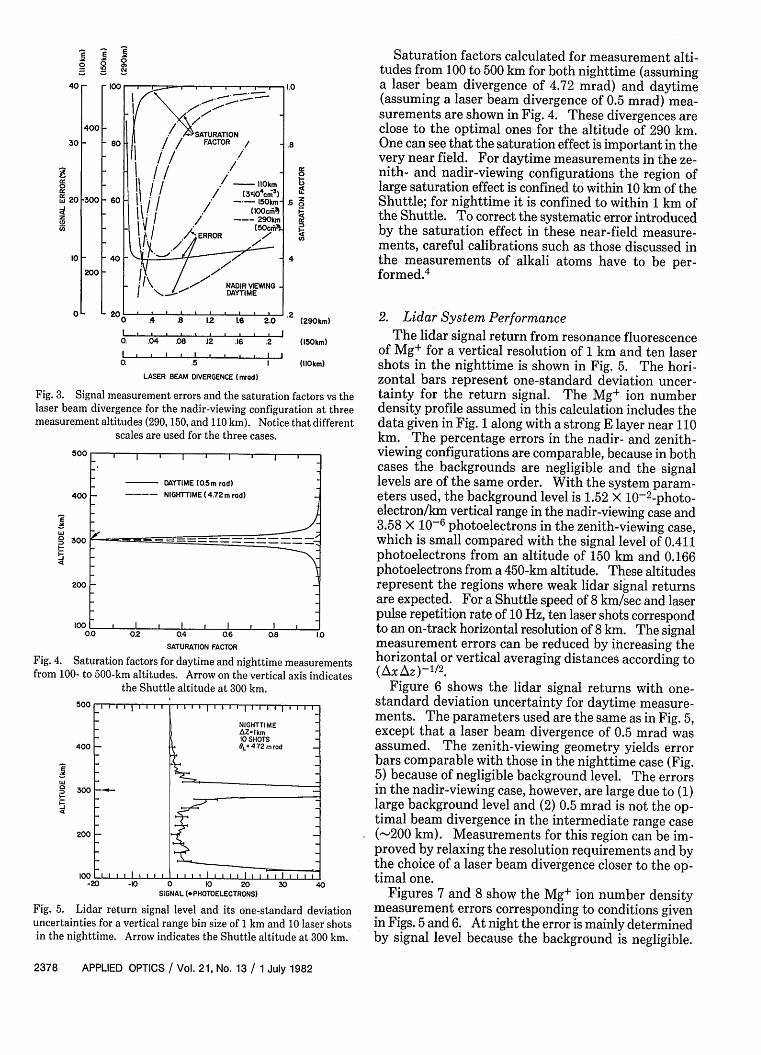
Figure 3 shows the signal measurement errors and thesaturation factors as functions of laser beam divergencein the daytime nadir-viewing configuration for threealtitudes (290, 150, and 110 km) representing near-field,intermediate-range, and far-field measurements.Notice also that different scales are used in these threecases. An optimal beam divergence can be found foreach case. In the 290- and the 110-km cases the errorsare insensitive to the beam divergences larger than theoptimal ones. Such insensitivity is due to strong signalsfrom the near field (290-km case) or from a strong Elayer (110-km case). In the 150-km case the signal isweak, and the signal measurement error is sensitive tothe beam divergence. Hence, for cases where the signalis weak, the choice of an optimal beam divergence isimportant to minimize signal measurement errors.
1 July 1982 / Vol. 21, No. 13 / APPLIED OPTICS 2377
ir
6
I)
E
1_
40
30
'U0'U
'U
20
10
0
400
-300
200
E Q~0 _
- 100 a
o 4 Al 12 L6 2.0I I I . . . I
a .04 .08 J2 .16 .2I . . I . I . * . . I I0. .5 1
4o
.Z
tz
4'U
4
(290km)
(150km)
(IlOkm)
LASER BEAM DIVERGENCE (mrod)
Fig. 3. Signal measurement errors and the saturation factors vs thelaser beam divergence for the nadir-viewing configuration at threemeasurement altitudes (290, 150, and 110 km). Notice that different
scales are used for the three cases.
500
400
300r-
i
1001
I I I
DAYTIME (.5m rd)- - - - NIGHTTIME (4.72 m rod)
- I I I I
0.0 0.2 04 0.6 0.8 1SATURATION FACTOR
Fig. 4. Saturation factors for daytime and nighttime measurementsfrom 100- to 500-km altitudes. Arrow on the vertical axis indicates
the Shuttle altitude at 300 km.500 _ I | I I | I | | I | | | | I I l
NIGHTTIMEAZ=Ikm10 SHOTS
400 _Lz 4.72 m rod
= 300 -
200
10 0 .. L .....i ...I... ... .I..I....I I I I I I I I I I I a I I I I I-20 -10 0 10 20 30 40
SIGNAL (PHOTOELECTRONS)
Fig. 5. Lidar return signal level and its one-standard deviationuncertainties for a vertical range bin size of 1 km and 10 laser shotsin the nighttime. Arrow indicates the Shuttle altitude at 300 km.
Saturation factors calculated for measurement alti-tudes from 100 to 500 km for both nighttime (assuminga laser beam divergence of 4.72 mrad) and daytime(assuming a laser beam divergence of 0.5 mrad) mea-surements are shown in Fig. 4. These divergences areclose to the optimal ones for the altitude of 290 km.One can see that the saturation effect is important in thevery near field. For daytime measurements in the ze-nith- and nadir-viewing configurations the region oflarge saturation effect is confined to within 10 km of theShuttle; for nighttime it is confined to within 1 km ofthe Shuttle. To correct the systematic error introducedby the saturation effect in these near-field measure-ments, careful calibrations such as those discussed inthe measurements of alkali atoms have to be per-formed.4
2. Lidar System PerformanceThe lidar signal return from resonance fluorescence
of Mg+ for a vertical resolution of 1 km and ten lasershots in the nighttime is shown in Fig. 5. The hori-zontal bars represent one-standard deviation uncer-tainty for the return signal. The Mg+ ion numberdensity profile assumed in this calculation includes thedata given in Fig. 1 along with a strong E layer near 110km. The percentage errors in the nadir- and zenith-viewing configurations are comparable, because in bothcases the backgrounds are negligible and the signallevels are of the same order. With the system param-eters used, the background level is 1.52 X 10⁻²-photo-electron/km vertical range in the nadir-viewing case and3.58 X 10-6 photoelectrons in the zenith-viewing case,which is small compared with the signal level of 0.411photoelectrons from an altitude of 150 km and 0.166photoelectrons from a 450-km altitude. These altitudesrepresent the regions where weak lidar signal returnsare expected. For a Shuttle speed of 8 km/sec and laserpulse repetition rate of 10 Hz, ten laser shots correspondto an on-track horizontal resolution of 8 km. The signalmeasurement errors can be reduced by increasing thehorizontal or vertical averaging distances according to(Ax Az)- 1/2 .
Figure 6 shows the lidar signal returns with one-standard deviation uncertainty for daytime measure-ments. The parameters used are the same as in Fig. 5,except that a laser beam divergence of 0.5 mrad wasassumed. The zenith-viewing geometry yields errorbars comparable with those in the nighttime case (Fig.5) because of negligible background level. The errorsin the nadir-viewing case, however, are large due to (1)large background level and (2) 0.5 mrad is not the op-timal beam divergence in the intermediate range case(-200 km). Measurements for this region can be im-proved by relaxing the resolution requirements and bythe choice of a laser beam divergence closer to the op-timal one.
Figures 7 and 8 show the Mg+ ion number densitymeasurement errors corresponding to conditions givenin Figs. 5 and 6. At night the error is mainly determinedby signal level because the background is negligible.
2378 APPLIED OPTICS / Vol. 21, No. 13 / 1 July 1982
- 80
- 60
- 40
200
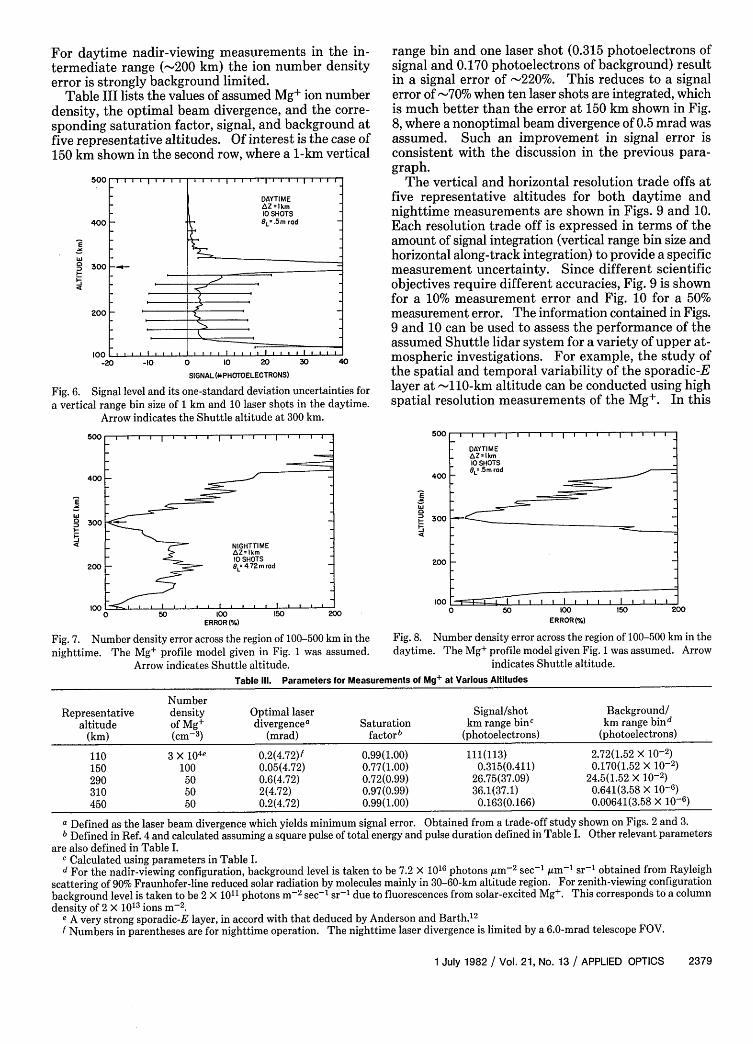
For daytime nadir-viewing measurementermediate range (200 km) the ion nunerror is strongly background limited.
Table III lists the values of assumed Mg-density, the optimal beam divergence, arsponding saturation factor, signal, and befive representative altitudes. Of interest150 km shown in the second row, where a
500 ll l ll ll
DAYTIMEAZ=Ikm10 SHOTS
400 _ S5m rac
g 300
200
100 .. I-20 -10 0 10 20
SIGNAL (WPHOTOELECTRONS)
Fig. 6. Signal level and its one-standard deviation va vertical range bin size of 1 km and 10 laser shots
Arrow indicates the Shuttle altitude at 30
500
400
I')
a1-
4
300
200
1000 50 100
ERROR (%)
ts in the in- range bin and one laser shot (0.315 photoelectrons ofrber density signal and 0.170 photoelectrons of background) result
in a signal error of -220%. This reduces to a signalion number error of -70% when ten laser shots are integrated, which
id the corre- is much better than the error at 150 km shown in Fig.ackground at 8, where a nonoptimal beam divergence of 0.5 mrad wasis the case of assumed. Such an improvement in signal error is-km vertical consistent with the discussion in the previous para-
graph.The vertical and horizontal resolution trade offs at
five representative altitudes for both daytime andnighttime measurements are shown in Figs. 9 and 10.Each resolution trade off is expressed in terms of theamount of signal integration (vertical range bin size andhorizontal along-track integration) to provide a specificmeasurement uncertainty. Since different scientificobjectives require different accuracies, Fig. 9 is shownfor a 10% measurement error and Fig. 10 for a 50%measurement error. The information contained in Figs.9 and 10 can be used to assess the performance of the
_ assumed Shuttle lidar system for a variety of upper at-30 40 mospheric investigations. For example, the study of
the spatial and temporal variability of the sporadic-Euncertainties for layer at -110-km altitude can be conducted using highin the daytime. spatial resolution measurements of the Mg+. In this0 km.
500
400
D
I-
300
200
100
150 200 50 100ERROR (-)
_ I I I I I I I I I I I I l l I -
- DAYTIME- AZ=Ikm
10 SHOTSSm.5, rod
_ , =IEZZIIZ_ ~~~~~~~~~~~S
200
Fig. 7. Number density error across the region of 100-500 km in the Fig. 8. Number density error across the region of 100-500 km in thenighttime. The Mg+ profile model given in Fig. 1 was assumed. daytime. The Mg+ profile model given Fig. 1 was assumed. Arrow
Arrow indicates Shuttle altitude. indicates Shuttle altitude.Table Ill. Parameters for Measurements of Mg+ at Various Altitudes
NumberRepresentative density Optimal laser Signal/shot Background/
altitude of Mg+ divergencea Saturation km range binc km range bind(km) (cm-3) (mrad) factorb (photoelectrons) (photoelectrons)
110 3 x 10⁴e 0.2(4.72)f 0.99(1.00) 111(113) 2.72(1.52 X 10⁻²)150 100 0.05(4.72) 0.77(1.00) 0.315(0.411) 0.170(1.52 X 10⁻²)290 50 0.6(4.72) 0.72(0.99) 26.75(37.09) 24.5(1.52 X 10⁻²)310 50 2(4.72) 0.97(0.99) 36.1(37.1) 0.641(3.58 X 10⁻⁶)450 50 0.2(4.72) 0.99(1.00) 0.163(0.166) 0.00641(3.58 x 10⁻⁶)
a Defined as the laser beam divergence which yields minimum signal error. Obtained from a trade-off study shown on Figs. 2 and 3.b Defined in Ref. 4 and calculated assuming a square pulse of total energy and pulse duration defined in Table I. Other relevant parameters
are also defined in Table I.c Calculated using parameters in Table I.d For the nadir-viewing configuration, background level is taken to be 7.2 X 10¹⁶ photons jim- 2 sec-.1 jm-' sr- obtained from Rayleigh
scattering of 90% Fraunhofer-line reduced solar radiation by molecules mainly in 30-60-km altitude region. For zenith-viewing configurationbackground level is taken to be 2 X 10¹¹ photons m-2 sec- 1 sr- due to fluorescences from solar-excited Mg+. This corresponds to a columndensity of 2 X 10¹³ ions m-2 .
e A very strong sporadic-E layer, in accord with that deduced by Anderson and Barth.'2
f Numbers in parentheses are for nighttime operation. The nighttime laser divergence is limited by a 6.0-mrad telescope FOV.
1 July 1982 / Vol. 21, No. 13 / APPLIED OPTICS 2379
- l I I I I l l I I I
NIGHTTIMEAZ= km10 SHOTS8-= 4.72 m rod
I I, I,, I I . . .' 150
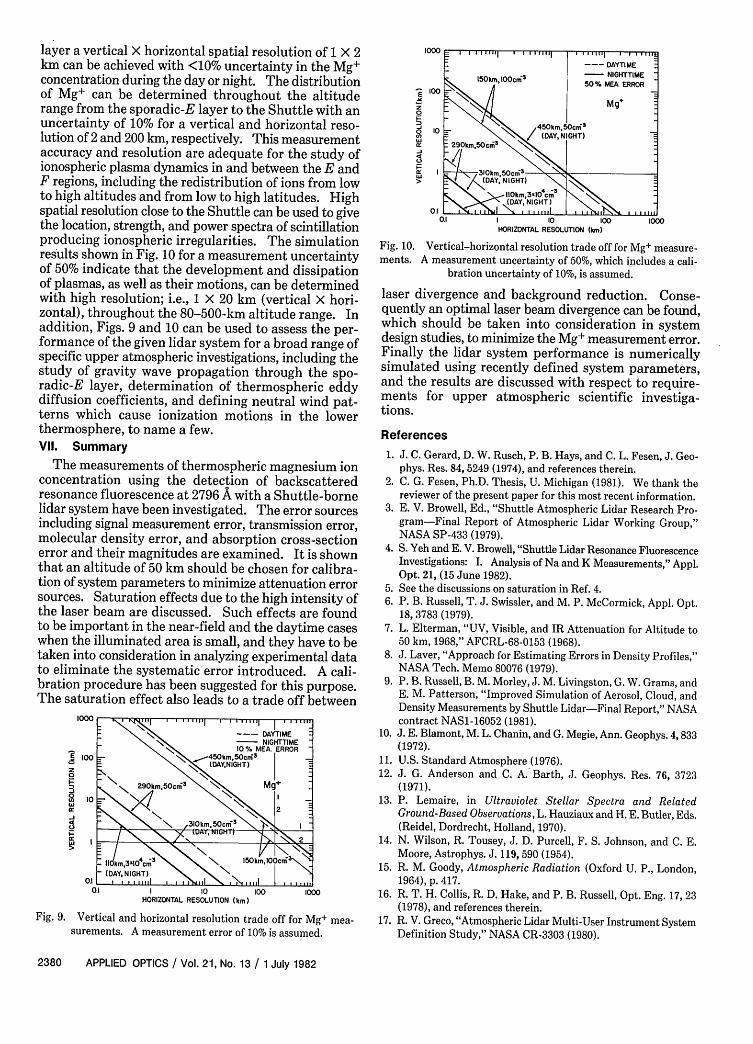
layer a vertical X horizontal spatial resolution of 1 X 2km can be achieved with <10% uncertainty in the Mg+concentration during the day or night. The distributionof Mg+ can be determined throughout the altituderange from the sporadic-E layer to the Shuttle with anuncertainty of 10% for a vertical and horizontal reso-lution of 2 and 200 km, respectively. This measurementaccuracy and resolution are adequate for the study ofionospheric plasma dynamics in and between the E andF regions, including the redistribution of ions from lowto high altitudes and from low to high latitudes. Highspatial resolution close to the Shuttle can be used to givethe location, strength, and power spectra of scintillationproducing ionospheric irregularities. The simulationresults shown in Fig. 10 for a measurement uncertaintyof 50% indicate that the development and dissipationof plasmas, as well as their motions, can be determinedwith high resolution; i.e., 1 X 20 km (vertical X hori-zontal), throughout the 80-500-km altitude range. Inaddition, Figs. 9 and 10 can be used to assess the per-formance of the given lidar system for a broad range ofspecific upper atmospheric investigations, including thestudy of gravity wave propagation through the spo-radic-E layer, determination of thermospheric eddydiffusion coefficients, and defining neutral wind pat-terns which cause ionization motions in the lowerthermosphere, to name a few.VII. Summary
The measurements of thermospheric magnesium ionconcentration using the detection of backscatteredresonance fluorescence at 2796 A with a Shuttle-bornelidar system have been investigated. The error sourcesincluding signal measurement error, transmission error,molecular density error, and absorption cross-sectionerror and their magnitudes are examined. It is shownthat an altitude of 50 km should be chosen for calibra-tion of system parameters to minimize attenuation errorsources. Saturation effects due to the high intensity ofthe laser beam are discussed. Such effects are foundto be important in the near-field and the daytime caseswhen the illuminated area is small, and they have to betaken into consideration in analyzing experimental datato eliminate the systematic error introduced. A cali-bration procedure has been suggested for this purpose.The saturation effect also leads to a trade off between
1000
100E
-44WF'U
10
DAYTIME- N. - NIGHTTIME
N Ha 10% MEA. ERROR_ \ % ,450km,50cyi
5
- (DAY.NIGHT)
-\ 290km,50cm3
N\ Mg
2~~ Ads \ \ 310km,5c
- km,3.104cm
3\ \ 150km100cmN
- (DAY,NIGHT) \Oil
0. I 10 100HORIZONTAL RESOLUTION (km)
1000
Fig. 9. Vertical and horizontal resolution trade off for Mg+ mea-surements. A measurement error of 10% is assumed.
1000
E 100
0
o 10
a.)
': I>
OJ0.1 I 10 100
HORIZONTAL RESOLUTION (kin)1000
Fig. 10. Vertical-horizontal resolution trade off for Mg+ measure-ments. A measurement uncertainty of 50%, which includes a cali-
bration uncertainty of 10%, is assumed.
laser divergence and background reduction. Conse-quently an optimal laser beam divergence can be found,which should be taken into consideration in systemdesign studies, to minimize the Mg+ measurement error.Finally the lidar system performance is numericallysimulated using recently defined system parameters,and the results are discussed with respect to require-ments for upper atmospheric scientific investiga-tions.
References1. J. C. Gerard, D. W. Rusch, P. B. Hays, and C. L. Fesen, J. Geo-
phys. Res. 84, 5249 (1974), and references therein.2. C. G. Fesen, Ph.D. Thesis, U. Michigan (1981). We thank the
reviewer of the present paper for this most recent information.3. E. V. Browell, Ed., "Shuttle Atmospheric Lidar Research Pro-
gram-Final Report of Atmospheric Lidar Working Group,"NASA SP-433 (1979).
4. S. Yeh and E. V. Browell, "Shuttle Lidar Resonance FluorescenceInvestigations: I. Analysis of Na and K Measurements," Appl.Opt. 21, (15 June 1982).
5. See the discussions on saturation in Ref. 4.6. P. B. Russell, T. J. Swissler, and M. P. McCormick, Appl. Opt.
18, 3783 (1979).7. L. Elterman, "UV, Visible, and IR Attenuation for Altitude to
50 km, 1968," AFCRL-68-0153 (1968).8. J. Laver, "Approach for Estimating Errors in Density Profiles,"
NASA Tech. Memo 80076 (1979).9. P. B. Russell, B. M. Morley, J. M. Livingston, G. W. Grams, and
E. M. Patterson, "Improved Simulation of Aerosol, Cloud, andDensity Measurements by Shuttle Lidar-Final Report," NASAcontract NAS1-16052 (1981).
10. J. E. Blamont, M. L. Chanin, and G. Megie, Ann. Geophys. 4,833(1972).
11. U.S. Standard Atmosphere (1976).12. J. G. Anderson and C. A. Barth, J. Geophys. Res. 76, 3723
(1971).13. P. Lemaire, in Ultraviolet Stellar Spectra and Related
Ground-Based Observations, L. Hauziaux and H. E. Butler, Eds.(Reidel, Dordrecht, Holland, 1970).
14. N. Wilson, R. Tousey, J. D. Purcell, F. S. Johnson, and C. E.Moore, Astrophys. J. 119, 590 (1954).
15. R. M. Goody, Atmospheric Radiation (Oxford U. P., London,1964), p. 417.
16. R. T. H. Collis, R. D. Hake, and P. B. Russell, Opt. Eng. 17, 23(1978), and references therein.
17. R. V. Greco, "Atmospheric Lidar Multi-User Instrument SystemDefinition Study," NASA CR-3303 (1980).
2380 APPLIED OPTICS / Vol. 21, No. 13 / 1 July 1982
DAYTIME
10S~km,100crcm - NIGHTTIMEIS~km,100cn
350% MEA ERROR
K ~ < Mg
K / \ X 450km S5crj3
(DAYNIGHT)2901km.SOcm
3\ %
310km,5 3
/<J9DAY: NIGHT) \ N'1kOkm,3'I01cm K(DAY, NIGHT)
I