Embed Size (px)
Citation preview

2013Carbon Count
SHV Energy

02

01Introduction
02Numbers & Figures
03 Aproach to the SHV
Energy’s Footprint
0405
A steady performance in 2013 04
Key Numbers & Figures 06
1.1 Carbon footprint of LPG distribution 08
1.2 Comparison of 2013 to 2012 17
1.3 Carbon footprint of other operations 19
2.1 Introduction and review of relevant guidance 21
2.2 Definition of carbon footprint 22
2.3 Scope 25
2.4 Base year is 2012 26
2.5 Calculation method: emission factors 26
SHV Energy’s role in the LPG life-cycle 28
References 32
Table ofcontents
03

SHV Energy’s Carbon Count 2013
A steady performancein 2013
04

SHV Energy’s Carbon Count 2013
For the second year in a row, SHV Energy has measured its corporate carbon footprint. This is believed to be the largest footprint-exercise ever conducted within the LPG-distribution industry. Some 1,500 sets of data for 2013 operations were collected from more than 20 business units, then compiled, computed and compared to their 2012 benchmark.
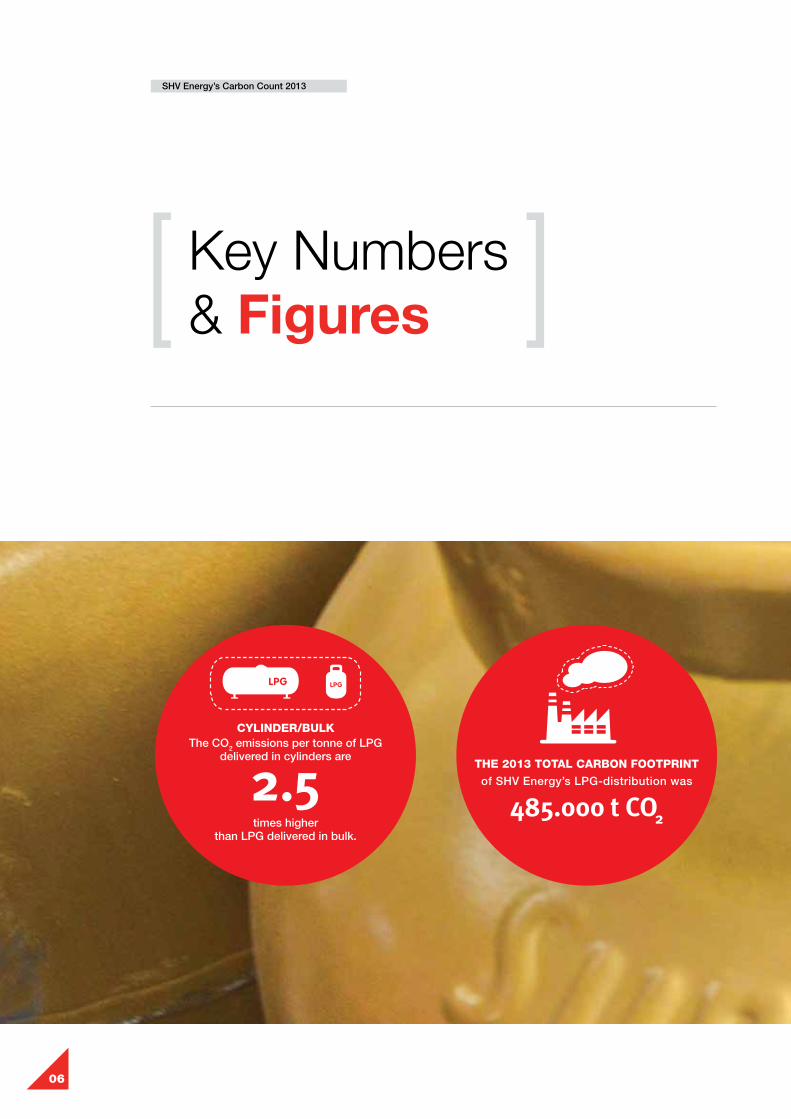
The total carbon footprint of SHV Energy’s LPG-distribution operations, in 2013, is calculated to be 485.000 tonnes of carbon dioxide (CO2). This equates to a unit footprint of 83 kilogrammes of CO2 per tonne of LPG sold to third parties. On an equivalent-volume basis, the 2013 total footprint is 0.1% lower than that of 2012.
Our core business is the onshore marketing and distribution of LPG. To improve transparency in our carbon reporting we have redefined our scope in 2013 based on our major function: LPG distribution from terminal to delivered tank. In the SHV Energy
2012 footprint we defined our scope of operations differently, as the supply footprint (transport from remote production locations) was included. To ensure like for like comparison, the 2012 performance has been adjusted accordingly. Now we have separated these two functions. LPG distribution from terminal to delivered tank is a better reflection of the fundamental structure of the LPG business. In addition it is a better fit to the definitions used by carbon-footprint and sustainability analysts.
Also, in its 2013 reporting exercise, SHV Energy for the first time collected data on the water consumption of all its business units. This will be used as a benchmark and presented in the 2014 report.
The first subsection of this chapter presents the LPG-distribution footprint in detail. The second compares 2013 to 2012, and the final subsection discusses the footprint of other SHV Energy operations.
05
SHV Energy’s Carbon Count 2013
Key Numbers& Figures
06
The CO2 emissions per tonne of LPG delivered in cylinders are
times higherthan LPG delivered in bulk.
CYLINDER/BULK
THE 2013 TOTAL CARBON FOOTPRINT
of SHV Energy’s LPG-distribution was
485.000 t CO2
2.5

SHV Energy’s Carbon Count 2013
Represent the emissions related to rail or barge transport.
South America’s footprint is roughly equal to that of Asia and Europe combined, because of significantly-greater transport distances and a cylinder-heavy business.
Of our emissions come from diesel use.
2% 50% 77%
THAN THAT OF 2012
07
On an equivalent-volume basis,
THE 2013 TOTAL FOOTPRINT WAS
-0.1%TRANSPORT RELATED
Of our CO2 emissions are
84%

SHV Energy’s Carbon Count 2013
1.1 CARBON FOOTPRINT OF LPG DISTRIBUTION
08
The 2013 total carbon footprint of SHV Energy’s LPG-distribution was 485.000 t CO2, which equates to a footprint of 83 kg CO2/t of LPG sold to our customers. This LPG-distribution carbon footprint can be divided in five ways: by function, by business type, by energy type, by distribution scope and scale, and by region.

SHV Energy’s Carbon Count 2013
09
The above logistics model explains the difference between primary and secondary transport. It was estimated, in 2012, that the average footprint per tonne of cylinder LPG is about three times that of a tonne of bulk LPG. However, data reported in 2012 were not sufficiently broken down to provide precise
figures for footprints by product type, i.e. bulk, cylinder and wholesale. Additional data collected in 2013 did enable a more precise comparison and this multiple turned out to be slightly lower than estimated. Cylinder LPG turned our to be 2,5 more carbon intensive than bulk LPG.
LPG SUPPLY CHAIN
LARGE WHOLESALE CUSTOMERS
SMALLWHOLESALE
ENDCONSUMEREND
CONSUMER
BULK
CYLINDERS
REFINERY
FILLING PLANT/DEPOT
MAJOR STORAGE
Primary DistributionSecondary Distribution
1.1.1 The LPG Supply Chain

SHV Energy’s Carbon Count 2013
010
1.1.2 Carbon footprint, by function
As our main business is the distribution of LPG from terminals to our customers, 84% of our emissions are transport related. The rest is split between filling plants and overheads, with a small part attributable to storage.
Corporate carbon footprint by main function
LPG-distribution carbon footprint is mainly transport
Figure 1:
6%
7%
3%
84%
All transport
Overheads
Filling plants
All storage
All transport
Overheads
Filling plants
All storage

SHV Energy’s Carbon Count 2013
The overwhelming majority of transport related emissions are caused by road vehicles. Emissions related to rail or barge transport represents just over 2%.
11
Corporate carbon footprint by transport type
Road transport dominates the distribution footprint
Figure 2:
2% 0.2%
98%
Road transport
Rail transport
Barge transport
Road transport
Rail transport
Barge transport

SHV Energy’s Carbon Count 2013
Transporting cylinders generates 53% of emissions. Transport of bulk LPG accounts for one-third of our footprint. Overheads and filling plants1 each account for just over 5%, with storage (in terminals and depots) accounting for the remaining 3%.
1 Filling also includes reconditioning and disposal of cylinders, to the extent it is carried out internally. This varies by BU, with some doing it internally, and others outsourcing this function.
12
Corporate carbon footprint by function (transport / storage)
Cylinder transport and bulk transport predominate
Figure 3:
2% 1%
31%
7%
6%
53%
Cylinder transport
Bulk transport
Overhead
Filling plants
Terminals
Depots
Production transport
Cylinder transport
Bulk transport
Overhead
Filling plants
Terminals
Depots
Production transport

SHV Energy’s Carbon Count 2013
13
Figure 4 shows the relative contributions of primary and secondary transport of bulk LPG and cylinders.
7%
6%2% 1% 1%
14%
17%
31%
21%
Corporate carbon footprint by function (complete disaggregation)
Cylinder transport more carbon-intensive than bulk transport
Figure 4:
Cylinder secondarytransport
Cylinder primarytransport
Bulk primarytransport
Bulk secondarytransport
Overhead
Filling plants
Terminals
Cylinder depots
Cylinder secondary transport
Cylinder primary transport
Bulk primary transport
Bulk secondary transport
Overhead
Filling plants
Terminals
Cylinder depots
Bulk depotsBulk depots

SHV Energy’s Carbon Count 2013
TABLE 1 - Carbon footprint, per business type, kg CO2 per tonne LPG
Business type Footprint Scope
Cylinder 139From terminal through delivery to retailer.Does not include customer transport, from retailer onward.
Bulk 55 From terminal to customer tank.
Wholesale 7Storage and overheads only, assumes no transport – i.e. customer picks up loads at the SHV terminal or depot.
1.1.2 Carbon footprint, by business type
Bulk and cylinder sales constitute about 80% of sales volume (about 40% each). However, cylinders represent over two-thirds of the total footprint, while bulk accounts for about one quarter. Wholesale’s footprint of about 2% is a statistically insignificant proportion.
LPG-distribution’s administrative footprint is negligible. Our headquarters in Hoofddorp generate 278 tonnes of CO2, 0.05% of the company’s total. The footprint of our offices Hoofddorp and other locations (which are mostly operational) have been allocated to the business types in proportion to LPG sales volumes by business type.
14
Contributions to sales and footprint
Cylinders contribute disproportionately more footprint than bulk or wholesale
Figure 5:
80%70%60%50%40%30%20%10%0%
Sales volume
Carbon footprint
Bulk Cylinders Wholesale

SHV Energy’s Carbon Count 2013
15
2 This is common in many industrial sectors. Only a few sectors – for example, agriculture, air-conditioning, chemicals, heat pumps and natural gas production – have significant non-energy-caused components in their footprints.
3 For air travel the energy will be jet kerosene, for train either diesel or electricity. Distances-travelled have been measured, and these multiplied by representative emission factors.
Corporate carbon footprint by energy type
Diesel is the predominant energy used
Figure 6:
1%2%6%
77%
13%Diesel (including barge transport)
Gasoline
Electricity
LPG
Natural Gas
Train Travel
Air Travel
Heating oil
<1%
Diesel
Gasoline
Electricity
LPG
Natural Gas
Train Travel
Air Travel
Heating oil
1.1.3 Carbon footprint, by energy type
SHV Energy’s carbon footprint is, by definition, an energy footprint. That is, the footprint consists purely of emissions caused by energy consumption2.
Fugitive emissions of LPG are not measured. In any case, they are believed to be negligible, and the components of LPG are not classified as greenhouse gases.
Most of the energy use comes from transporting LPG, mainly using heavy-goods vehicles. Therefore, the primary energy type responsible for the footprint is diesel, which is also consumed, to a lesser extent, in terminals, depots and filling plants.
The second most important fuel type is gasoline, which powers cars and vans for deliveries, sales and administration. Electricity powers storage filling operations as well as offices. The proportion of LPG, natural gas and heating oil used is very small. Employee air travel by air and train have been classified as ‘energy types’, because direct fuel consumption data for these are not available3 – in any case, together they account for less than 1% of the corporate footprint.

SHV Energy’s Carbon Count 2013
4 Footprints for four business units were not reported: Bosnia, Croatia, Malta and Slovenia. Combined, these account for just under 1% of LPG sold. Estimates of their footprints have been included in the corporate footprint – these are based on a by-volume-proportioning with their nearest, most-related business unit, Italy.16
1.1.4 Carbon footprint, by region
The largest regional footprint comes from South America, followed by Europe, with Asia being responsible for 10% of emissions.
South America’s footprint is roughly equal to that of Asia and Europe4 combined, because of significantly-greater transport distances and a cylinder-heavy business.
Corporate carbon footprint by region
South America and Europe dominate the distribution carbon footprint
Figure 7:
40%
10%
50%
South America
Europe
Asia
South America
Europe
Asia

SHV Energy’s Carbon Count 2013
17
1.2 COMPARISON 2013 - 2012
On an absolute-volume basis, SHV Energy’s total LPG-distribution footprint was 2.0% higher in 2013 as compared to 2012. This was caused by an increase in cylinder volume and a slight decline in bulk volume.
Footprint 2013 vs 2012 by function
Comparison of 2013 and 2012 footprints, LPG distribution
Figure 8:
160
140
120
100
80
60
40
20
0
2012
2013
Terminals
Millions CO2 [kg]
Bulk primary
transport
Bulk depots Bulk secondary transport
Filling plants
Cylinder primary
transport
Cylinder depots
Cylinder secondary transport
Overhead Ocean-ship transport

SHV Energy’s Carbon Count 2013
As already noted, the unit footprint (i.e. kg CO2 per t of LPG sold) of cylinders is 2.5 times higher than that of bulk (Table 1). This means that absolute-volume results can be affected by shifts in the business mix between bulk, cylinder and wholesale. These shifts cannot be controlled by SHV Energy.
To correct the change caused by increased weight of the cylinder based business, we compared the footprints on an equivalent-volume basis. In other words: what would the 2012 and 2013 footprints have been, had we used the same volume proportions in both years? On this equivalent-volume basis, the 2013 total footprint is 0.1% lower than that of 2012.
TABLE 2 - Equivalent-volume footprints 2012 and 2013, LPG-distribution (kt CO2)
Business type 2012 2013
Cylinder 134 134
Bulk 334 334
Wholesale 8 7
Sum 476 475
18

SHV Energy’s Carbon Count 2013
1.3 CARBON FOOTPRINT OF OTHER OPERATIONS
LPG-distribution is SHV Energy’s main business. This involves the transport and packaging of LPG, starting at terminals and finishing with the delivery of gas to customers, either wholesale, in bulk (including Autogas) and in cylinders. This activity is common among all our business units and is the primary focus of our footprint reporting at group level.
SHV also has a significant business in LPG supply. This involves mainly deep-sea shipping of LPG from export terminals to import terminals (the latter of which then make LPG available for distribution). Additionally, SHV has a small, fast-growing business in the distribution of LNG (liquefied natural gas), which operated for its first year in 2013.
Only the LPG-distribution footprint has been presented in this report. The LPG-supply footprint has been measured in 2012-13 but it has not been presented in this report as the category emission factors for this activity are currently under review.
SHV Energy plans to report the LPG-supply footprint in 2014 (along with 2012 and 2013 figures) as an index utilising the necessary emissions factors when they are established. In 2014 we will also present a footprint for the LNG operations.
19

THE CO2 EMISSIONS PER TONNE OF LPG DELIVERED IN CYLINDERS ARE 2,5 TIMES HIGHER THAN LPG DELIVERED IN BULK.

SHV Energy’s Carbon Count 2013
Approach to the SHV Energy’s Footprint
2.1 Introduction, and review of relevant guidance
SHV Energy engaged Atlantic Consulting to review SHV Energy estimate of its corporate carbon footprint, to document the results and to establish a baseline for such estimates in coming years. This report is that documentation, covering the calendar year 2013.
The value to SHV of a corporate carbon footprint is seen most strongly in three respects:• Management is measurement – carbon accounts
allow management to make more intelligent deci-sions about carbon emissions.
• Ready response to stakeholders – regulators, interest groups, suppliers and customers expect a company of SHV Energy’s size and stature to measure and manage its footprint. Many compa-nies of similar size already do. Looked at con-versely: failure to do a footprint could seriously detract from SHV Energy’s credibility.
• Boost the visibility and competitiveness of LPG positioning LPG as a lower-carbon, cleaner fuel is critical to its future success. Having a strong evidence base is critical to that positioning.
21
This chapter documents the approach taken in compiling the footprint, i.e. how it was put together. It covers: a review of relevant guidance; definition of a corporate carbon footprint; principles of footprint estimation; organisational boundaries; currency; scope; base year; and calculation method.
SHV Energy’s Carbon Count 2013
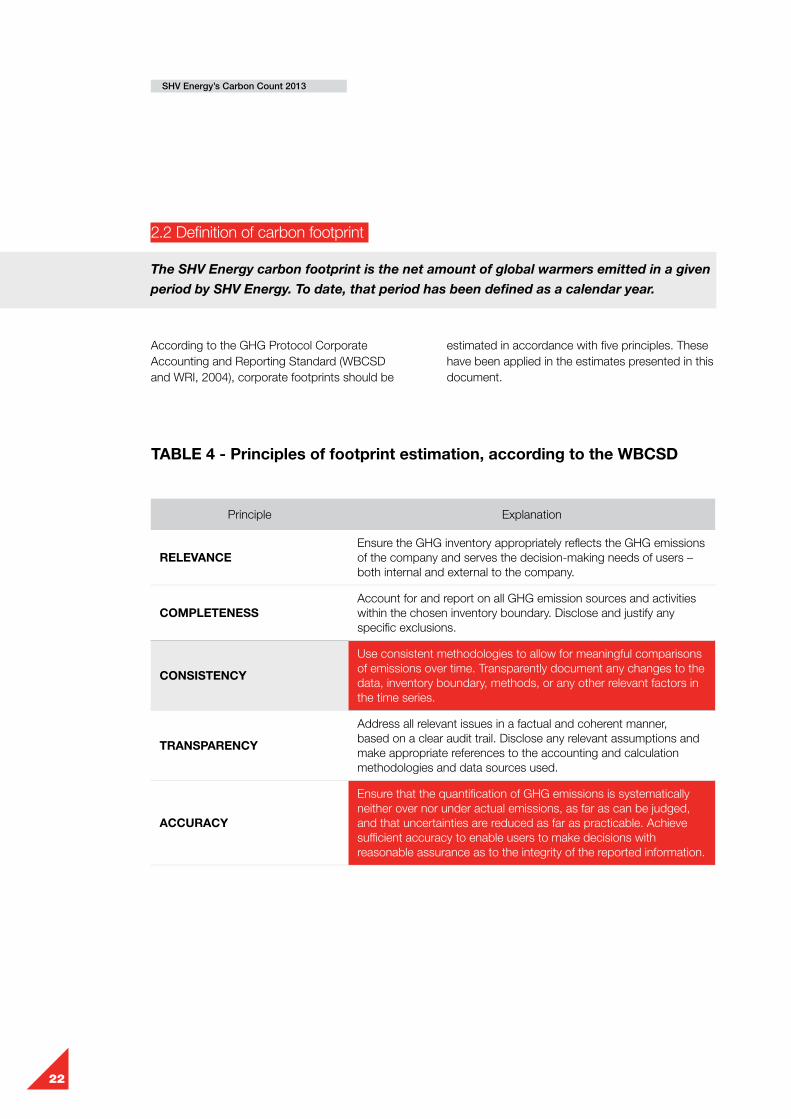
2.2 Definition of carbon footprint
The SHV Energy carbon footprint is the net amount of global warmers emitted in a given
period by SHV Energy. To date, that period has been defined as a calendar year.
According to the GHG Protocol Corporate Accounting and Reporting Standard (WBCSD and WRI, 2004), corporate footprints should be
estimated in accordance with five principles. These have been applied in the estimates presented in this document.
TABLE 4 - Principles of footprint estimation, according to the WBCSD
Principle Explanation
RELEVANCEEnsure the GHG inventory appropriately reflects the GHG emissions of the company and serves the decision-making needs of users – both internal and external to the company.
COMPLETENESS Account for and report on all GHG emission sources and activities within the chosen inventory boundary. Disclose and justify any specific exclusions.
CONSISTENCY
Use consistent methodologies to allow for meaningful comparisons of emissions over time. Transparently document any changes to the data, inventory boundary, methods, or any other relevant factors in the time series.
TRANSPARENCY
Address all relevant issues in a factual and coherent manner, based on a clear audit trail. Disclose any relevant assumptions and make appropriate references to the accounting and calculation methodologies and data sources used.
ACCURACY
Ensure that the quantification of GHG emissions is systematically neither over nor under actual emissions, as far as can be judged, and that uncertainties are reduced as far as practicable. Achieve sufficient accuracy to enable users to make decisions with reasonable assurance as to the integrity of the reported information.
22

SHV Energy’s Carbon Count 2013
2.3 Scope
In determining how high, wide and deep to measure, we have applied three criteria:• Significance5 (relevance) to the final answers• Control, i.e. can SHV Energy steer it?• Data availabilityThese were applied to a range of scoping issues, as discussed in the following subsections.
2.3.1 Definition of life cycle phases
Carbon footprints come in two main types:• Corporate – the footprint of an organisation; and• Product – the footprint of a certain item.
SHV Energy has decided to be ambitious in creating some compatibility between the two. Therefore, the 2013 footprint has been made consistent, with respect to corporate and to product footprints. The footprint presented is for LPG distribution, from terminal to delivered tank, according to three different product types: bulk, cylinder and wholesale.
2.3.2 Which global warmers?
This footprint includes emissions of the most common, most important greenhouse gas: carbon dioxide, CO2. Other global warmers, whether
regulated under the Kyoto Protocol or not, are not included, for reasons of significance and data-availability.
Emissions of LPG itself are not included in the footprint. Although propane and butane were at one point classified as greenhouse gases, Kyoto does not classify them as such, and both have since been excluded by most definitions.
2.3.2.1 Other Kyoto greenhouse gases
Carbon dioxide is of course regulated under the Kyoto Protocol. So, too, are methane, nitrous oxide and about 15 fluoro- a nd chloro- compounds. However, the latter ones are not included in this footprint, due to a combination of insignificance and data unavailability.
The primary sources of emissions at SHV Energy are of combustion: mainly diesel for transport, some natural gas and LPG for heating, plus (indirect) power plant fuels. Using data from the ecoinvent database, their emissions of methane, nitrous oxide and other Kyoto GHGs were benchmarked for significance and data-availability (Table 4).
5 This word is often used by scientists. Auditors frequently use the word ‘materiality’. WBCSD calls it ‘relevance’.
23

SHV Energy’s Carbon Count 2013
TABLE 4 - Non-CO2 GHGs – significance, data availability and reason for exclusion
Emissions
Process MethaneNitrous oxide
Other GHGs Why excluded from footprint
Diesel-powered transport6
2% of footprint
1% of footprint
Nil
<4% impact. Also, non-CO2 emissions are very dependent on the engine type, i.e. very variable, and specific data are not generally available.
Natural gas heating 0.1% 0.05% Nil
<1% impact. Pipeline and other transport leaks can add about 5-6% to the footprint, but these are out of SHV Energy’s control.
Power generation, European average7
4%8 Nil Nil
<5% impact. Also, non-CO2 emissions are neither consistently nor widely reported for many countries where SHV operates.
6 Well to wheel.7 UCTE average, from ecoinvent.8 In SHV’s UK operations, methane emissions are counted, because they are included in the CO2e factor used, which is the one published
by the UK Department of Energy and Climate Change.9 Presumably, maintenance emissions are mainly ‘scope 3’ indirect, incurred in the production of replacement parts, but this is only inferred,
not known for sure.
2.3.2.2 Non-Kyoto global warmers
This footprint does not include global warmers not regulated by the Kyoto Protocol, such as carbon black. As scientific understanding of their impacts and data availability increase, perhaps they might be included in future.
2.3.3 Sources of emissions: which are in, which are out
Included in this footprint are direct emissions from operations, plus indirect emissions from electricity generation and subcontracted transport.
Not included are some of what WBCSD calls ‘scope 3’ indirect emissions.
2.3.3.1 Direct emissions
Direct emissions constitute the bulk of SHV Energy’s footprint, and all significant ones have been included. The largest contributors are: • Mobile combustion – for transport of LPG• Stationary combustion – for heating of facilities,
compression of LPG and reconditioning of cylinders and tanks. Some reconditioning is done in-house, some indirectly, that is by subcontractors. Emissions for both have been estimated and included.
Vehicle maintenance data was not collected. These emissions are likely to be immaterial and probably indirect9. Still, it would be sensible to analyse them and perhaps include them in future footprints. At this point, it is unclear how much maintenance is done in-house and how much is done by subcontractors.
24

SHV Energy’s Carbon Count 2013
Fugitive emissions have not been measured. They are believed to be insignificant, not least because leaking LPG is equivalent to leaking revenues – there is a powerful incentive to avoid it. Still, in future years, it would be sensible to do some spot checks to confirm this.
The footprint does not include direct emissions from water use and waste disposal. These are believed to be immaterial.
2.3.3.2 Electricity (indirect) emissions
Power consumption has been measured, and then converted to estimated emissions by use of national electricity emission factors.
2.3.3.3 Indirect transport emissions are included
Significant amounts of LPG transport are outsourced, which by definition makes the resulting emissions indirect. Because they are significant, and effectively under SHV control, these ‘scope 3’ emissions have been included.
Emissions, direct and indirect, have also been included from staff transport, by car/van, taxi, train and airplane. These are believed to be modestly significant.
2.3.3.4 Other indirect emissions not included, for now
Two significant sources of ‘scope 3’ indirect emissions have not been included in this footprint, but should be considered for inclusion in future footprints.• Production of LPG, from well-to-terminal.
Emissions data for this are sketchy at best, and would need some serious development work. A credible well-to-terminal dataset would be useful for SHV’s carbon management and for maintaining competitiveness against other fuels.
• LPG in use. For heating, cooking and automotive – the primary uses – quality data are available.
2.3.4 Capital goods and infrastructure
Emissions involved in producing capital goods and infrastructure have not been included in the footprint for a variety of reasons.
2.3.4.1 Cylinders
With limited exceptions, cylinder production is not within SHV’s control. Even if it were included, it would make a negligible contribution to the overall footprint, because scrap rates are around only 0.1% (i.e. a cylinder makes 1,000 trips before it is scrapped), and nearly all of that material is recycled.
25

SHV Energy’s Carbon Count 2013
2.3.4.2 Tanks and networks
Production of tanks and networks generally is not within SHV’s control. Even if it were included, because of their long life (often 30 years or more) and suitability for recycling, emissions would not likely be significant. This was confirmed independently, by footprint work done for Primagas Germany.
2.3.4.3 Vehicles
According to the ecoinvent database of life cycle assessment, the carbon footprint of a heavy transport vehicle (>32-tonne, Euro 5 emission controls) can be disaggregated into four main subgroups:• Operation (fuel combustion) – 79%• Road construction and maintenance – 12%• Manufacturing of the vehicle – 6% • Vehicle maintenance – 3% Road construction and vehicle manufacturing are outside of SHV’s control, so these capital goods and infrastructure emissions are not included in the footprint.
2.3.4.4 Buildings
As a rule-of-thumb, building construction emissions are relatively minor in relation to operating emissions. Moreover, buildings’ emissions are a relatively small portion of SHV’s total. So the construction emissions have not been estimated in this footprint.
2.4 Base year is 2012
That year was the first for which most SHV BUs collected data.
2.5 Calculation method: emission factors
The ‘emission factor’ method used to calculate SHV Energy’s carbon footprint is the most common method of carbon footprinting. Emissions are calculated by multiplying proxies x emission factors, e.g. consumption of diesel in transport x a carbon-emission factor for diesel combustion in transport.
26

SHV Energy’s Carbon Count 2013
ASIA IS RESPONSIBLE FOR 10% OF OUR TOTAL CO2 EMISSIONS.

SHV Energy’s Carbon Count 2013
SHV Energy’s role in the LPG life-cycle
SHV Energy’s operations are in both of these latter areas: production and distribution. How do these fit into the overall footprint of LPG? The answer is that whether or not the LPG is distributed by bulk on in cylinders (Table 1), distribution as such is a minor contributor to the overall footprint (Figure 9).
For average bulk deliveries, it amounts to 1% of the total; for average cylinders, it is 4%. In specific cases, these figures of course vary around the aver-ages10, but even at high extremes, distribution will be well under 10% of the total.
For most fuels, carbon footprints are presented as having two phases: pre-combustion and combustion. In transport, these are often referred to as well-to-tank (WTT) and tank-to-wheel (TTW) footprints; the entire life-cycle footprint is then referred to as well-to-wheel (WTW). Some, more-de-tailed footprints break down the pre-combustion phase into production and distribution (or even more) components.
10 Within SHV’s business units, bulk distribution footprints vary in the range of roughly 10-110 kg CO2/t LPG, while cylinder ones vary in the range of 100-250 or so.
28

SHV Energy’s Carbon Count 2013
29
LPG lifetime footprint, with distribution by bulk and cylinder
Whether bulk or cylinder, distribution is a minor part of the LPG lifetime footprint
Figure 9:
4000
2000
0
LPG kg CO2/t
Bulk Cylinder
Combustion
Distribution
Production

SHV Energy’s Carbon Count 2013
Production footprints, however, are an entirely different story. They can vary considerably, ranging from around 3-23% of the total.
30
LPG lifetime footprint by phase, with clean, base case and dirty production
Production footprints vary enormously
Figure 10:
100%
90%
80%
70%
60%
50%
40%
30%
20%
10%
0%Clean Base case Dirty
Combustion
Distribution
Production

SHV Energy’s Carbon Count 2013
3111 This is a representative global figure, that assumes 50/50 LPG production from refining and as a by-product of oil & gas.
Compared to the base case11 (Figure 9 and middle column in Figure 10) of 400 kg CO2/t LPG, production footprints can be as low as 100 kg CO2/t LPG (the ‘clean’ case in Figure 10) and as high as 900 kg CO2/t LPG (the ‘dirty’ case in Figure 10), according to a peer-reviewed summary of the literature (Johnson, 2012).
Particularly due to the political interest in hydraulic fracturing (‘fracking’) and tight gas, production footprints are the object of numerous new research projects – which are also reporting a wide range of values. SHV Energy might explore this research in more detail, for two reasons: 1) it will be useful in benchmarking S&RM’s operations; and 2) it could be useful or necessary to consider production footprints when purchasing LPG.

SHV Energy’s Carbon Count 2013
1 Filling also includes reconditioning and disposal of
cylinders, to the extent it is carried out internally. This
varies by BU, with some doing it internally, and others
outsourcing this function.
2 This is common in many industrial sectors. Only a few
sectors – for example, agriculture, air-conditioning,
chemicals, heat pumps and natural gas production –
have significant non-energy-caused components in their
footprints.
3 For air travel the energy will be jet kerosene, for train
either diesel or electricity. Distances-travelled have
been measured, and these multiplied by representative
emission factors.
4 Footprints for four business units were not reported:
Bosnia, Croatia, Malta and Slovenia. Combined, these
account for just under 1% of LPG sold. Estimates of their
footprints have been included in the corporate footprint –
these are based on a by-volume-proportioning with their
nearest, most-related business unit, Italy.
5 This word is often used by scientists. Auditors frequently
use the word ‘materiality’. WBCSD calls it ‘relevance’.
6 Well to wheel.
7 UCTE average, from ecoinvent.
8 In SHV’s UK operations, methane emissions are
counted, because they are included in the CO2e factor
used, which is the one published by the UK Department
of Energy and Climate Change.
9 Presumably, maintenance emissions are mainly ‘scope
3’ indirect, incurred in the production of replacement
parts, but this is only inferred, not known for sure.
10 Within SHV’s business units, bulk distribution footprints
vary in the range of roughly 10-110 kg CO2/t LPG, while
cylinder ones vary in the range of 100-250 or so.
11 This is a representative global figure, that assumes
50/50 LPG production from refining and as a by-
product of oil & gas.
32
References...


SHV Energy’s Carbon Count 2013
Tables
Figures
Table 1: Carbon footprint, per business type, kg CO2 per tonne LPG 14
Table 2: Equivalent-volume footprints 2012 and 2013, LPG-distribution (kt CO2) 19
Table 3: Principles of footprint estimation, according to the WBCSD 24
Table 4: Non-CO2 GHGs – significance, data availability and reason for exclusion 26
Figure 1: LPG-distribution carbon footprint is mainly transport 09
Figure 2: Road transport dominates the distribution footprint 10
Figure 3: Cylinder transport and bulk transport predominate 11
Figure 4: Cylinder transport more carbon-intensive than bulk transport 12
Figure 5: Cylinders contribute disproportionately more footprint than bulk or wholesale 15
Figure 6: Diesel is the predominant energy used 16
Figure 7: South America and Europe dominate the distribution carbon footprint 17
Figure 8: Comparison of 2013 and 2012 footprints, LPG distribution 18
Figure 9: LPG lifetime footprint, with distribution by bulk and cylinder 31
Figure 10: LPG lifetime footprint by phase, with clean, base case and dirty production 32
34

Business units of the following countries are included in this footprint
Gas Supply & Risk Management

SHV Energy N.VTaurusavenue 19 - 2132 LS Hoofddorp
The Netherlands
T +31 (0) 23 5555 700 - F +31 (0) 23 5555 701E [email protected]
www.shvenergy.com