Embed Size (px)
Citation preview
http
://www.b
ps.g
o.id

http
://www.b
ps.g
o.id

STATISTIKINDONESIA
2013Statistical Yearbook of Indonesia
http
://www.b
ps.g
o.id

STATISTIK INDONESIA 2013Statistical Yearbook of Indonesia 2013
ISSN: 0126-2912No. Publikasi/Publication Number: 07330.1306Katalog BPS/BPS Catalog: 1101001
Ukuran Buku/Book Size: 17,6 x 25 cmJumlah Halaman/Number of Pages: xxxvi + 668 halaman /pages
Naskah/Manuscript:Badan Pusat Statistik BPS - Statistics Indonesia
Penyunting/Editor:Subdirektorat Indikator StatistikSub-directorate of Statistics Indicator
Gambar Kulit/Cover Design:Subdirektorat Publikasi dan Kompilasi Statistik Sub-directorate of Statistical Compilation and Publication
Gambar/Figures:Subdirektorat Indikator StatistikSub-directorate of Statistics Indicator
Diterbitkan oleh/Published by: Badan Pusat StatistikBPS - Statistics Indonesia
Boleh dikutip dengan menyebutkan sumbernyaMay be cited with reference to the source
http
://www.b
ps.g
o.id

http
://www.b
ps.g
o.id

http
://www.b
ps.g
o.id

S t a t i s t i c a l Y e a r b o o k o f I n d o n e s i a 2 0 1 3 v
KATA PENGANTAR
Statistik Indonesia merupakan seri publikasi tahunan BPS yang menyajikan beragam jenis data yang bersumber dari BPS dan institusi lain. Publikasi ini memuat gambaran umum tentang keadaan geografi dan iklim, pemerintahan, serta perkembangan kondisi sosial-demografi dan perekonomian di Indonesia. Beberapa tabel tertentu menyajikan data pada tingkat provinsi dan internasional untuk melihat keterbandingan antar wilayah dan antar negara. Untuk memudahkan pemahaman dan pemanfaatan data, disertakan juga penjelasan teknis dari setiap jenis statistik yang ditampilkan.
Jadwal terbit Publikasi Statistik Indonesia pada tahun ini dipercepat dari tahun-tahun sebelumnya, sehingga data yang disajikan hanya sampai dengan tahun 2012. Seiring dengan meningkatnya kebutuhan konsumen data, publikasi Statistik Indonesia akan terus mengalami penyempurnaan baik struktur maupun muatannya. Untuk mempermudah akses terhadap data Statistik Indonesia, Seri Publikasi Statistik Indonesia sudah bisa diunduh di website BPS (www.bps.go.id).
Publikasi ini dapat terwujud berkat kerja sama dan bantuan dari berbagai pihak. Kepada semua pihak yang telah memberikan kontribusi, kami sampaikan penghargaan dan terima kasih. Mudah-mudahan statistik yang disajikan memberi manfaat bagi banyak pihak untuk berbagai keperluan. Kami mengharapkan tanggapan dan saran dari para pengguna publikasi ini untuk perbaikan edisi yang akan datang.
Jakarta, Mei 2013 KEPALA BADAN PUSAT STATISTIK REPUBLIK INDONESIA
Dr. Suryamin, M.Sc.
http
://www.b
ps.g
o.id

S t a t i s t i k I n d o n e s i a 2 0 1 3vi
P R E F A C E
Statistical Yearbook of Indonesia is an annual publication presenting various data from BPS-Statistics Indonesia and other agencies. The publication provides general pictures of geographic and climate conditions, government, and key socio-demographic and economic characteristics of Indonesia. Data in certain tables are presented at provincial and international levels to compare socio-economic conditions among regions and countries. Technical notes for each statistics are also included in this publication to provide a better understanding in interpreting data for data users.
The 2013 Statistical Yearbook of Indonesia is scheduled earlier than those of previous years, and for that reason it covers only data in 2012 condition. In line with the increasing demand of data users the contents of Statistical Yearbook of Indonesia have been improved. To provide a better access to data covered in the statistical yearbook of Indonesia, a series of the publication can be downloaded in BPS website (www.bps.go.id).
The release of the publication has been made possible due to the assistance and contribution of various government institutions and private organizations. To all parties who have been involved in the preparation of this publication, I would like to express my high appreciation and gratitude. Hopefully this publication will be a useful resource for any purposes. Comments and suggestions to improve the contents of the publication are always welcome.
Jakarta, May 2013BPS-STATISTICS INDONESIA
Dr. Suryamin, M.Sc.Chief Statistician
http
://www.b
ps.g
o.id

S t a t i s t i c a l Y e a r b o o k o f I n d o n e s i a 2 0 1 3 vii
DAFTAR ISI/CONTENTS
Halaman
Page
Kata Pengantar/Preface ..................................................................................................................... v
Daftar Isi/Contents ............................................................................................................................. vii
Daftar Tabel/List of Tables .................................................................................................................. viii
Penjelasan Umum/Explanatory Notes ............................................................................................... xxxiii
Statistik Kunci/Key Statistics ............................................................................................................. 1
1. Geografi dan Iklim/Geography and Climate ............................................................................... 3
2. Pemerintahan/Government ........................................................................................................ 31
3. Penduduk dan Ketenagakerjaan/Population and Employment ................................................. 71
4. Sosial dan Kesejahteraan Rakyat/Social and Welfare ................................................................. 113
5. Pertanian/Agriculture ................................................................................................................. 183
6. Pertambangan dan Energi/Mining and Energy ........................................................................... 271
7. Industri Pengolahan/Manufacturing Industry ............................................................................ 285
8. Konstruksi/Construction ............................................................................................................ 311
9. Hotel dan Pariwisata/Hotel and Tourism ................................................................................... 333
10. Transportasi dan Komunikasi/Transportation and Communication ......................................... 353
11. Perbankan, Investasi, Utang Luar Negeri, Asuransi, dan Koperasi Banking, Investment, External Debt, Insurance and Cooperative ................................................. 381
12. Harga-Harga/Prices .................................................................................................................... 417
13. Pengeluaran Penduduk serta Ketersediaan dan Konsumsi Makanan Population Expenditure and Food Availability and Consumption ............................................... 463
14. Perdagangan Luar Negeri/Foreign Trade ................................................................................... 487
15. Sistem Neraca Nasional/System of National Accounts ................................................................ 543
16. Perbandingan Internasional/International Comparison ........................................................... 611
Indeks/Index ...................................................................................................................................... 625
http
://www.b
ps.g
o.id

S t a t i s t i k I n d o n e s i a 2 0 1 3viii
DAFTAR TABEL/LIST OF TABLES
Halaman Page
1. GEOGRAFI DAN IKLIM/GEOGRAPHY AND CLIMATE
1.1 KEADAAN GEOGRAFI/GEOGRAPHY CONDITION1.1.1 Luas Daerah dan Jumlah Pulau Menurut Provinsi, 2012 Total Area and Number of Islands by Province, 2012 ...................................................................................................... 91.1.2 Jumlah Desa Menurut Provinsi dan Letak Geografi, 2005–2011 Number of Villages by Province and Geographical Location, 2005–2011 ..................................................................... 101.1.3 Jumlah Desa Menurut Provinsi dan Topografi Wilayah, 2005–2011 Number of Villages by Province and Topographical Areas, 2005–2011 ......................................................................... 111.1.4 Frekuensi Gempa Berdasarkan Kedalaman dan Kekuatan Menurut Pulau di Indonesia, 2012 Earthquakes Frequency Based on Depth and Magnitude by Island in Indonesia, 2012 ............................................... 121.1.5 Luas Daerah Pengaliran dan Debit dari Beberapa Sungai yang Daerah Pengalirannya Lebih dari 1.000 km2, 2010 River Basin Area and River Water Debit of Several Rivers with River Basin Area of More Than 1,000 sq.km, 2010 .................................................................................................................................................................. 131.1.6 Rata-Rata Harian Aliran Sungai, Tinggi Aliran, dan Volume Air di Beberapa Sungai yang Daerah Pengalirannya Lebih Dari 1.000 km2, 2010 Average of Water Flow, Depth, and Volume of Water for Several Rivers with River Basin Area of More than 1,000 sq.km, 2010 ......................................................................................................................................................... 161.1.7 Status Kualitas Air Sungai, 2011 Status of River Water Quality, 2011 .................................................................................................................................... 19
1.2 KEADAAN IKLIM/CLIMATE CONDITION1.2.1 Suhu Minimum, Rata-Rata, dan Maksimum di Stasiun Pengamatan BMKG (oC), 2011 Minimum, Average, and Maximum Temperature at BMKG Monitoring Station (oC), 2011 ...................................... 201.2.2 Kecepatan Angin dan Kelembaban di Stasiun Pengamatan BMKG, 2011 Wind Velocity and Humidity at BMKG Monitoring Station, 2011 ... .............................................................................. 211.2.3 Jumlah Curah Hujan dan Jumlah Hari Hujan di Stasiun Pengamatan BMKG, 2011 Number of Precipitation and Number of Rain Days at BMKG Monitoring Station, 2011 .......................................... 221.2.4 Tekanan Udara dan Penyinaran Matahari di Stasiun Pengamatan BMKG, 2011 Atmospheric Pressure and Duration of Sunshine at BMKG Monitoring Station, 2011 . ............................................. .. 231.2.5 Rata-Rata Bulanan Konsentrasi Partikel Terlarut di Udara Beberapa Kota Menurut Bulan dan Kota (μgr/m3), 2011 dan 2012 Monthly Average of Suspended Particulate Matter in Several Cities by Month and City (μgr/m3), 2011 and 2012 ....................................................................................................................................................................... 241.2.6 Impor Komoditi Bahan Perusak Lapisan Ozon (ton), 2010–2012 Commodities Import of Ozone Depleting Substance (ton) 2010–2012 ......................................................................... 30
2. PEMERINTAHAN/GOVERNMENT
2.1 WILAYAH ADMINISTRATIF/ADMINISTRATIVE AREA2.1.1 Jumlah Kabupaten Menurut Provinsi, 2008–2012 Number of Regencies by Province, 2008–2012 .................................................................................................................. 37
http
://www.b
ps.g
o.id

S t a t i s t i c a l Y e a r b o o k o f I n d o n e s i a 2 0 1 3 ix
2.1.2 Jumlah Kota Menurut Provinsi, 2008–2012 Number of Cities by Province, 2008–2012 ........................................................................................................................ 382.1.3 Jumlah Kecamatan Menurut Provinsi, 2008–2012 Number of Subdistricts by Province, 2008–2012 .............................................................................................................. 392.1.4 Jumlah Desa Menurut Provinsi, 2008–2012 Number of Villages by Province, 2008–2012 ..................................................................................................................... 40 2.2 PEMILIHAN UMUM / GENERAL ELECTION2.2.1 Jumlah Pemilih yang Terdaftar dalam Pemilu Legislatif Dewan Perwakilan Rakyat (DPR), 2004 dan 2009 Number of Registered Voters in the Election of The House of Representative (DPR), 2004 and 2009 ....................... 412.2.2 Perolehan Suara dan Kursi Dewan Perwakilan Rakyat (DPR) Menurut Partai Politik Hasil Pemilu Tahun 2009 Number of Votes and Seats for The House of Representative (DPR) by Political Party from the 2009 General Election ...................................................................................................................................................................... 422.2.3 Perolehan Suara Sah Pemilu Presiden dan Wakil Presiden pada Putaran Pertama Menurut Provinsi dan Nama Pasangan Calon Presiden dan Wakil Presiden, 2009 Number of Valid Votes from the First Round of Presidential and Vice Presidential Election by Province and Candidate of President and Vice President, 2009 ....................................................................................................... 432.2.4 Persentase Perolehan Suara Sah Pemilu Presiden dan Wakil Presiden pada Putaran Pertama Menurut Provinsi dan Nama Pasangan Calon Presiden dan Wakil Presiden, 2009 Percentage of Valid Votes from the First Round of Presidential and Vice Presidential Election by Province and Candidate of President and Vice President, 2009 ....................................................................................... 442.2.5 Anggota Dewan Perwakilan Rakyat (DPR) Menurut Jenis Kelamin, 1955–2009 Number of Representatives in The House of Representative (DPR) by Sex, 1955–2009 ............................................. 452.2.6 Anggota Dewan Perwakilan Daerah (DPD) Menurut Jenis Kelamin Hasil Pemilu Tahun 2009 Number of Representatives of The Regional Representative Council (DPD) by Sex from the 2009 General Election ...................................................................................................................................................................... 46
2.3 SUMBER DAYA MANUSIA/HUMAN RESOURCES2.3.1 Jumlah Pegawai Negeri Sipil Menurut Provinsi dan Jenis Kelamin, Desember 2011 dan Desember 2012 Number of Civil Servants by Province and Sex, December 2011 and December 2012 ...................................................... 472.3.2 Jumlah Pegawai Negeri Sipil Menurut Jabatan dan Jenis Kelamin, Desember 2011 dan Desember 2012 Number of Civil Servants by Occupation and Sex, December 2011 and December 2012 ............................................ 482.3.3 Jumlah Pegawai Negeri Sipil Menurut Jenis Kepegawaian dan Jenis Kelamin, Desember 2011 dan Desember 2012 Number of Civil Servants by Type of Employment and Sex, December 2011 and December 2012 ............................ 492.3.4 Jumlah Pegawai Negeri Sipil Menurut Tingkat Pendidikan dan Jenis Kelamin, Desember 2011 dan Desember 2012 Number of Civil Servants by Educational Level and Sex, December 2011 and December 2012 ................................. 512.3.5 Jumlah Pegawai Negeri Sipil Menurut Tingkat Kepangkatan dan Jenis Kelamin, Desember 2011 dan Desember 2012 Number of Civil Servants by Hierarchy and Sex, December 20101 and December 2012 ............................................. 522.3.6 Jumlah Pegawai Negeri Sipil Menurut Kelompok Umur dan Jenis Kelamin, Desember 2011 dan Desember 2012 Number of Civil Servants by Age Group and Sex, December 2011 and December 2012 ............................................. 532.3.7 Jumlah Pegawai Negeri Sipil Menurut Masa Kerja dan Jenis Kelamin, Desember 2011 dan Desember 2012 Number of Civil Servants by Work Period and Sex, December 2011 and December 2012 .......................................... 54
http
://www.b
ps.g
o.id

S t a t i s t i k I n d o n e s i a 2 0 1 3x
2.4 KEUANGAN PEMERINTAH/GOVERNMENT FINANCE2.4.1 Anggaran Pendapatan dan Belanja Negara (miliar rupiah), 2011–2013 State Budget (billion rupiahs), 2011–2013 .................................................................................................................................. 552.4.2 Anggaran Pendapatan Negara (miliar rupiah), 2011–2013 The Budget of Government Revenues (billion rupiahs), 2011–2013 ..................................................................................... 562.4.3 Realisasi Penerimaan Negara (miliar rupiah), 2010–2012 Actual Government Revenues (billion rupiahs), 2010–2012 .......................................................................................... 572.4.4 Realisasi Pengeluaran Negara (miliar rupiah), 2010–2012 Actual Government Expenditures (billion rupiahs), 2010–2012 .................................................................................... 582.4.5 Anggaran Belanja Pemerintah Pusat Berdasarkan Fungsi (miliar rupiah), 2011–2013 The Budget of Central Government Expenditures by Functions (billion rupiahs), 2011–2013 .................................. 592.4.6 Ringkasan Anggaran Negara dan Realisasinya (miliar rupiah), 2011 dan 2012 Government Budget and Realization (billion rupiahs), 2011 and 2012 ........................................................................ 602.4.7 Rekapitulasi Realisasi Penerimaan dan Pengeluaran Pemerintah Daerah Provinsi (juta rupiah), 2010–2012 Summary of Actual Revenues and Expenditures of Provincial Government (million rupiahs), 2010–2012 ............. 612.4.8 Rekapitulasi Realisasi Penerimaan dan Pengeluaran Pemerintah Daerah Kabupaten/Kota (juta rupiah), 2010–2012 Summary of Actual Revenues and Expenditures of Regency/Municipality Government (million rupiahs), 2010–2012 ............................................................................................................................................. 642.4.9 Realisasi Penerimaan dan Pengeluaran Pemerintah Desa (ribu rupiah), 2009–2011 Actual Revenues and Expenditures of Village Government (thousand rupiahs), 2009–2011 ..................................... 67
3. PENDUDUK DAN KETENAGAKERJAAN/POPULATION AND EMPLOYMENT
3.1 PENDUDUK/POPULATION3.1.1 Penduduk dan Laju Pertumbuhan Penduduk Menurut Provinsi, 2000 dan 2010 Population and Population Growth Rate by Province, 2000 and 2010 .......................................................................... 783.1.2 Distribusi Persentase Penduduk dan Kepadatan Penduduk Menurut Provinsi, 2000 dan 2010 Percentage Distribution of Population and Population Density by Province, 2000 and 2010 ...................................... 793.1.3 Rasio Jenis Kelamin Penduduk Menurut Provinsi, 2000 dan 2010 Population Sex Ratio by Province, 2000 and 2010 ........................................................................................................... 803.1.4 Rumah Tangga dan Rata-Rata Banyaknya Anggota Rumah Tangga Menurut Provinsi, 2000 dan 2010 Number of Households and Average Household Size by Province, 2000 and 2010 ...................................................... 813.1.5 Migrasi Masuk Seumur Hidup Menurut Provinsi, 1980–2010 Lifetime In Migration by Province, 1980–2010 ................................................................................................................. 823.1.6 Migrasi Keluar Seumur Hidup Menurut Provinsi, 1980–2010 Lifetime Out Migration by Province, 1980–2010 .............................................................................................................. 833.1.7 Migrasi Masuk Risen Menurut Provinsi, 1980–2010 Recent In Migration by Province, 1980–2010 .................................................................................................................... 843.1.8 Migrasi Keluar Risen Menurut Provinsi, 1980–2010 Recent Out Migration by Province, 1980–2010 ............................................................................................................................. 85
3.2 KETENAGAKERJAAN/EMPLOYMENT3.2.1 Penduduk Berumur 15 Tahun Ke Atas Menurut Golongan Umur dan Jenis Kegiatan Selama Seminggu yang Lalu, 2012 Population 15 Years of Age and Over by Age Group and Type of Activity During the Previous Week, 2012 .. .......... 86
http
://www.b
ps.g
o.id

S t a t i s t i c a l Y e a r b o o k o f I n d o n e s i a 2 0 1 3 xi
3.2.2 Penduduk Berumur 15 Tahun Ke Atas Menurut Provinsi dan Jenis Kegiatan Selama Seminggu yang Lalu, 2012 Population 15 Years of Age and Over by Province and Type of Activity During the Previous Week, 2012 ....... ........ 883.2.3 Penduduk Berumur 15 Tahun Ke Atas Menurut Pendidikan Tertinggi yang Ditamatkan dan Jenis Kegiatan Selama Seminggu yang Lalu, 2012 Population 15 Years of Age and Over by Educational Attainment and Type of Activity During the Previous Week, 2012 ............................................................................................................................................................. 903.2.4 Penduduk Berumur 15 Tahun Ke Atas yang Bekerja Selama Seminggu yang Lalu Menurut Provinsi dan Lapangan Pekerjaan Utama, 2012 Population 15 Years of Age and Over Who Worked During The Previous Week by Province and Main Industry, 2012 ........................................................................................................................................................................ 923.2.5 Penduduk Berumur 15 Tahun Ke Atas yang Bekerja Selama Seminggu yang Lalu Menurut Status Pekerjaan Utama dan Lapangan Pekerjaan Utama, 2012 Population 15 Years of Age and Over Who Worked During The Previous Week by Main Employment Status and Main Industry, 2012 ........................................................................................................................................... 943.2.6 Penduduk Berumur 15 Tahun Ke Atas yang Bekerja Selama Seminggu yang Lalu Menurut Jumlah Jam Kerja pada Pekerjaan Utama dan Lapangan Pekerjaan Utama, 2012 Population 15 Years of Age and Over Who Worked During The Previous Week by Total Working Hours on Main Job and Main Industry, 2012 ................................................................................................................................ 963.2.7 Penduduk Berumur 15 Tahun Ke Atas yang Bekerja Selama Seminggu yang Lalu Menurut Lapangan Pekerjaan Utama dan Pendidikan Tertinggi yang Ditamatkan, 2012 Population 15 Years of Age and Over Who Worked During The Previous Week by Main Industry and Educational Attainment, 2012 ............................................................................................................................................. 983.2.8 Penduduk Berumur 15 Tahun Ke Atas yang Bekerja Selama Seminggu yang Lalu Menurut Golongan Umur dan Jumlah Jam Kerja Seluruhnya, 2012 Population 15 Years of Age and Over Who Worked During The Previous Week by Age Group and Total Working Hours, 2012 .................................................................................................................................................. 1003.2.9 Penduduk Berumur 15 Tahun Ke Atas yang Bekerja Selama Seminggu yang Lalu Menurut Status Pekerjaan Utama dan Pendidikan Tertinggi yang Ditamatkan, 2012 Population 15 Years of Age and Over Who Worked During The Previous Week by Main Employment Status and Educational Attainment, 2012 ...................................................................................................................................... 1023.2.10 Tingkat Pengangguran Terbuka (TPT) dan Tingkat Partisipasi Angkatan Kerja (TPAK) Menurut Provinsi, 2010–2012 Unemployment Rate (UR) and Labor Force Participation Rate (LFPR) by Province, 2010–2012 ............................................................................................................................................................................ 1043.2.11 Jumlah TKI Menurut Kawasan/Negara Penempatan dan Jenis Kelamin, 2011 dan 2012 Number of Indonesian Overseas Workers by Country of Destination and Sex, 2011 and 2012 ................................... 1053.2.12 Pencari Kerja Terdaftar, Lowongan Kerja Terdaftar, dan Penempatan/Pemenuhan Tenaga Kerja Menurut Provinsi dan Jenis Kelamin, 2012 Number of Registered Job Applicants, Registered Job Vacancies, and Placement of Workers by Province and Sex, 2012 .................................................................................................................................................... 1063.2.13 Rata-Rata Upah Nominal per Bulan Buruh Produksi/Pelaksana di Bawah Mandor/Supervisor Menurut Lapangan Usaha dan Wilayah (ribu rupiah), 2011 dan 2012 Average Monthly Nominal Wage of Production/Operational Workers Below Supervisory Level by Main Industry and Region (thousand rupiahs), 2011 and 2012 ............................................................................... 1083.2.14 Rata-Rata Upah Nominal per Bulan Buruh Produksi di Bawah Mandor di Sektor Industri Pengolahan Menurut Subsektor (ribu rupiah), 2011 dan 2012 Average Monthly Nominal Wage of Production Workers Below Supervisory Level in Manufacturing by Subsector (thousand rupiahs), 2011 and 2012 ............................................................................................................. 109
http
://www.b
ps.g
o.id

S t a t i s t i k I n d o n e s i a 2 0 1 3xii
3.2.15 Rata-Rata Upah Nominal Per Bulan Buruh Produksi di Bawah Mandor di Perusahaan Industri Besar dan Sedang Menurut Subsektor (ribu rupiah), 2011 dan 2012 Average Monthly Nominal Wage of Production Workers Below Supervisory Level in Large and Medium Manufactures by Subsector (thousand rupiahs), 2011 and 2012 ................................................................................... 1103.2.16 Rata-Rata Upah Nominal Per Bulan Buruh Produksi di Bawah Mandor di Sektor Industri Pengolahan Menurut Subsektor dan Wilayah (ribu rupiah) 2011 dan 2012 Average Monthly Nominal Wage of Production Workers Below Supervisory Level in Manufacturing by Subsector and Region (thousand rupiahs), 2011 and 2012 ........................................................................................ 1113.2.17 Upah Minimum Provinsi (UMP) Per Bulan, 2006–2012 Provincial Minimum Wage per Month, 2006–2012 ........................................................................................................ 112
4. SOSIAL DAN KESEJAHTERAAN RAKYAT/SOCIAL AND WELFARE
4.1 PENDIDIKAN/EDUCATION4.1.1 Persentase Penduduk Berumur 15 Tahun Ke Atas yang Melek Huruf Menurut Golongan Umur dan Daerah Tempat Tinggal, 2011 dan 2012 Percentage of Literate People Aged 15 Years and Over by Age Group and Urban-Rural Classification, 2011 and 2012 ....................................................................................................................................................................... 1234.1.2 Persentase Penduduk Berumur 5 Tahun Ke Atas Menurut Golongan Umur, Daerah Tempat Tinggal, dan Partisipasi Sekolah, 2012 Percentage of Population Aged 5 Years and Over by Age Group, Urban-Rural Classification, and School Participation 2012 ..................................................................................................................................................... 1244.1.3 Persentase Penduduk Usia 7–24 Tahun Menurut Jenis Kelamin, Kelompok Umur Sekolah, dan Partisipasi Sekolah, 2010–2012 Percentage of Population Aged 7–24 Years by Sex, School Age Group, and School Participation 2010–2012 .......... 1264.1.4 Jumlah Sekolah, Guru, dan Murid Taman Kanak-Kanak (TK) di Bawah Kementerian Pendidikan dan Kebudayaan Menurut Provinsi, 2009/2010–2011/2012 Number of Schools, Teachers, and Pupils in Kindergarten Under The Ministry of Education and Culture by Province, 2009/2010–2011/2012 ................................................................................................................................ 1284.1.5 Jumlah Sekolah, Guru, dan Murid Sekolah Dasar (SD) di Bawah Kementerian Pendidikan dan Kebudayaan Menurut Provinsi, 2009/2010–2011/2012 Number of Schools, Teachers, and Pupils in Primary Schools Under The Ministry of Education and Culture by Province, 2009/2010–2011/2012 ................................................................................................................................ 1304.1.6 Jumlah Sekolah, Guru, dan Murid Madrasah Ibtidaiyah (MI) di Bawah Kementerian Agama Menurut Provinsi, 2009/2010–2011/2012 Number of Schools, Teachers, and Pupils in Madrasah Ibtidaiyah (MI) Under The Ministry of Religious Affairs by Province, 2009/2010–2011/2012 ................................................................................................... 1324.1.7 Jumlah Sekolah, Guru, dan Murid Sekolah Menengah Pertama (SMP) di Bawah Kementerian Pendidikan dan Kebudayaan Menurut Provinsi, 2009/2010–2011/2012 Number of Schools, Teachers, and Pupils in Junior High Schools Under The Ministry of Education and Culture by Province, 2009/2010–2011/2012 ................................................................................................................................ 1344.1.8 Jumlah Sekolah, Guru, dan Murid Madrasah Tsanawiyah (MTs) di Bawah Kementerian Agama Menurut Provinsi, 2009/2010–2011/2012 Number of Schools, Teachers, and Pupils in Madrasah Tsanawiyah (MTs) Under The Ministry of Religious Affairs by Province, 2009/2010–2011/2012 ................................................................................................... 1364.1.9 Jumlah Sekolah, Guru, dan Murid Sekolah Menengah Atas (SMA) di Bawah Kementerian Pendidikan dan Kebudayaan Menurut Provinsi, 2009/2010–2011/2012 Number of Schools, Teachers, and Pupils in Senior High Schools Under The Ministry of Education and Culture by Province, 2009/2010–2011/2012 ................................................................................................................................ 138
http
://www.b
ps.g
o.id

S t a t i s t i c a l Y e a r b o o k o f I n d o n e s i a 2 0 1 3 xiii
4.1.10 Jumlah Sekolah, Guru, dan Murid Sekolah Menengah Kejuruan (SMK) di Bawah Kementerian Pendidikan dan Kebudayaan Menurut Provinsi, 2009/2010–2011/2012 Number of Schools, Teachers, and Pupils in Vocational High Schools Under The Ministry of Education and Culture by Province, 2009/2010–2011/2012 .......................................................................................................... 1404.1.11 Jumlah Sekolah, Guru, dan Murid Madrasah Aliyah (MA) di Bawah Kementerian Agama Menurut Provinsi, 2009/2010–2011/2012 Number of Schools, Teachers, and Pupils in Madrasah Aliyah (MA) Under The Ministry of Religious Affairs by Province, 2009/2010–2011/2012 ................................................................................................... 1424.1.12 Jumlah Perguruan Tinggi, Mahasiswa, dan Tenaga Edukatif Negeri dan Swasta di Bawah Kementerian Pendidikan dan Kebudayaan Menurut Provinsi, 2011/2012 Number of Universities, Students, and Lecturers State and Private Under the Ministry of Education and Culture by Province, 2011/2012 ....................................................................................................................................................... 1444.1.13 Jumlah Perguruan Tinggi, Mahasiswa dan Tenaga Edukatif Negeri dan Swasta di Bawah Kementerian Agama Menurut Provinsi, 2011/2012 Number of Universities, Students, and Lecturers State and Private Under the Ministry of Religious Affairs by Province, 2011/2012 ............................................................................................................................................................. 1454.1.14 Jumlah Desa yang Memiliki Fasilitas Sekolah Menurut Provinsi dan Tingkat Pendidikan, 2005–2011 Number of Villages Having Educational Facilities by Province and Educational Level, 2005–2011 ......................... 146
4.2 KESEHATAN/HEALTH4.2.1 Persentase Balita Menurut Provinsi dan Penolong Kelahiran Terakhir, 2011 dan 2012 Percentage of Children Under Five Years by Province and Last Birth Attendant, 2011 and 2012 .............................. 1484.2.2 Persentase Balita yang Pernah Mendapat Imunisasi Campak Menurut Provinsi, 2010–2012 Percentage of Children Under Five Years Who Had Measles Immunization by Province, 2010–2012 ....................... 1504.2.3 Persentase Wanita Berumur 15–49 Tahun dan Berstatus Kawin yang Sedang Menggunakan/Memakai Alat KB Menurut Provinsi, 2007–2012 Percentage of Married Women Aged 15–49 Years Old Currently Using Contraception Method by Province, 2007–2012 ....................................................................................................................................................... 1514.2.4 Persentase Penduduk yang Mempunyai Keluhan Kesehatan Selama Sebulan Terakhir Menurut Provinsi, 2007–2012 Percentage of Population Having Health Complaint During The Last Month by Province, 2007–2012 ............................................................................................................................................................................. 1524.2.5 Persentase Penduduk yang Mengobati Sendiri Selama Sebulan Terakhir Menurut Provinsi dan Jenis Obat yang Digunakan, 2010–2012 Percentage of Population Having Self Treatment During The Last Month by Province and Type of Medicine, 2010–2012 ....................................................................................................................................................... 1534.2.6 Jumlah Kasus Penyakit Menurut Provinsi dan Jenis Penyakit, 2011 Number of Disease Cases by Province and Type of Disease, 2011 ................................................................................... 1544.2.7 Jumlah Kasus Baru AIDS dan Kasus Kumulatif AIDS Menurut Provinsi di Indonesia, 2011 Number of AIDS New Cases and AIDS Cummulative Cases by Province in Indonesia, 2011 .................................... 1554.2.8 Jumlah Rumah Sakit Umum, Rumah Sakit Khusus, dan Puskesmas Menurut Provinsi, 2010 dan 2011 Number of General Hospital, Special Hospital and Public Health Centers by Province, 2010 and 2011 ................. .. 1564.2.9 Perbandingan Data Tuberkulosis di Negara-Negara ASEAN dan WHO-SEARO, 2010 Comparation of Tuberculosis Data Between ASEAN and WHO-SEARO Member Countries, 2010 ........................ 1574.2.10 Jumlah Desa yang Memiliki Sarana Kesehatan Menurut Provinsi, 2005–2011 Number of Villages Having Health Facilities by Province, 2005–2011 .......................................................................... 158
http
://www.b
ps.g
o.id

S t a t i s t i k I n d o n e s i a 2 0 1 3xiv
4.3 PERUMAHAN DAN LINGKUNGAN/HOUSING AND ENVIRONMENT4.3.1 Persentase Rumah Tangga Menurut Provinsi dan Luas Lantai (m2), 2012 Percentage of Households by Province and Floor Area (m2), 2012 .................................................................................. 1604.3.2 Persentase Rumah Tangga Menurut Provinsi dan Sumber Air Minum, 2012 Percentage of Households by Province and Source of Drinking Water, 2012 .................................................................. 1614.3.3 Persentase Rumah Tangga Menurut Provinsi dan Sumber Penerangan, 2012 Percentage of Households by Province and Source of Lighting, 2012 .............................................................................. 1624.3.4 Persentase Rumah Tangga Menurut Provinsi dan Fasilitas Tempat Buang Air Besar, 2012 Percentage of Households by Province and Toilet Facility, 2012 ...................................................................................... 1634.3.5 Persentase Rumah Tangga Menurut Provinsi dan Bahan Bakar Utama untuk Memasak, 2012 Percentage of Households by Province and Type of Cooking Fuel, 2012 ......................................................................... 1644.3.6 Persentase Rumah Tangga Menurut Provinsi dan Status Penguasaan Bangunan Tempat Tinggal, 2012 Percentage of Households by Province and Dwelling Ownership Status, 2012 ............................................................... 1654.3.7 Persentase Rumah Tangga Menurut Provinsi dan Jenis Lantai Terluas, 2012 Percentage of Households by Province and Floor Main Material, 2012 .......................................................................... 166
4.4 KRIMINALITAS/CRIME4.4.1 Jumlah Tindak Pidana Menurut Kepolisian Daerah, 2010–2012 Crime Total by Regional Police Office, 2010–2012 ........................................................................................................... 1674.4.2 Risiko Penduduk Terjadi Tindak Pidana per 100.000 Penduduk Menurut Kepolisian Daerah, 2010–2012 Crime Rate per 100,000 Population by Regional Police Office, 2010–2012 ................................................................. 1684.4.3 Selang Waktu Terjadinya Tindak Pidana Menurut Kepolisian Daerah, 2010–2012 Time Interval of Crime Occurance by Regional Police Office, 2010–2012 ..................................................................... 1694.4.4 Persentase Penyelesaian Tindak Pidana Menurut Kepolisian Daerah, 2010–2012 Percentage of Crime Clearence Rate by Regional Police Office, 2010–2012 ................................................................... 170 4.5 AGAMA DAN SOSIAL LAINNYA/RELIGION AND OTHER SOCIAL AFFAIRS4.5.1 Jumlah Jemaah Haji yang Diberangkatkan ke Tanah Suci Mekah Menurut Provinsi, 2010–2012 Number of Hajj Pilgrims Were Departured to the Holyland of Mecca by Province, 2010–2012 ................................ 1714.5.2 Nikah, Talaq dan Cerai, serta Rujuk, 2010–2012 Number of Marriages, Divorces, and Reconciliations, 2010–2012 .................................................................................. 1724.5.3 Jumlah Korban Manusia yang Diakibatkan Bencana Alam Menurut Provinsi, 2011 dan 2012 Number of Victims Due to Natural Disaster by Province, 2011 and 2012 ..................................................................... 1734.5.4 Jumlah Kerusakan Rumah yang Diakibatkan Bencana Alam Menurut Provinsi, 2011 dan 2012 Number of Damaged House Due to Natural Disaster by Province, 2011 and 2012 ..................................................... 1744.5.5 Jumlah Desa yang Mengalami Bencana Alam Menurut Provinsi, 2005–2011 Number of Villages That Had Natural Disaster by Province, 2005–2011 ..................................................................... 175
4.6 KEMISKINAN DAN PEMBANGUNAN MANUSIA/POVERTY AND HUMAN DEVELOPMENT4.6.1 Garis Kemiskinan, Jumlah, dan Persentase Penduduk Miskin, 1996–2012 Poverty Line, Number, and Percentage of Poor People, 1996–2012 ................................................................................ 1764.6.2 Jumlah dan Persentase Penduduk Miskin Menurut Provinsi, 2011 dan 2012 Number and Percentage of Poor People by Province, 2011 and 2012 ............................................................................. 1774.6.3 Garis Kemiskinan, Jumlah, dan Persentase Penduduk Miskin di Daerah Perkotaan Menurut Provinsi, 2011 dan 2012 Poverty Line, Number, and Percentage of Poor People in Urban Area by Province, 2011 and 2012 ............................ 178
http
://www.b
ps.g
o.id

S t a t i s t i c a l Y e a r b o o k o f I n d o n e s i a 2 0 1 3 xv
4.6.4 Garis Kemiskinan, Jumlah, dan Persentase Penduduk Miskin di Daerah Perdesaan Menurut Provinsi, 2011 dan 2012 Poverty Line, Number, and Percentage of Poor People in Rural Area by Province, 2011 and 2012 ............................ 1794.6.5 Indeks Kedalaman Kemiskinan dan Indeks Keparahan Kemiskinan Menurut Daerah, 1999–2012 Poverty Gap Index and Poverty Severity Index by Region, 1999–2012 ......................................................................... 1804.6.6 Karakteristik Rumah Tangga Miskin dan Rumah Tangga Tidak Miskin, 2011 dan 2012 Characteristics of Poor and Non-Poor Households, 2011 and 2012 ............................................................................... 1814.6.7 Indeks Pembangunan Manusia Menurut Provinsi, 2007–2011 Human Development Index by Province, 2007–2011 ...................................................................................................... 182
5. PERTANIAN/AGRICULTURE
5.1 TANAMAN PANGAN/FOOD CROPS5.1.1 Luas Lahan Sawah Menurut Provinsi (ha), 2006–2011 Wetland Area by Province (ha), 2006–2011 ..................................................................................................................... 1925.1.2 Luas Panen, Produksi, dan Produktivitas Tanaman Pangan, 2008–2012 Harvested Area,Production, and Productivity of Food Crops, 2008–2012 .................................................................... 1935.1.3 Luas Panen Padi Menurut Provinsi (ha), 2008–2012 Harvested Area of Paddy by Province (ha), 2008–2012 .................................................................................................. 1945.1.4 Produksi Padi Menurut Provinsi (ton), 2008–2012 Production of Paddy by Province (ton), 2008–2012 ......................................................................................................... 1955.1.5 Produktivitas Padi Menurut Provinsi (kuintal/ha), 2008–2012 Productivity of Paddy by Province (quintal/ha), 2008–2012 ......................................................................................... 1965.1.6 Luas Panen Jagung Menurut Provinsi (ha), 2008–2012 Harvested Area of Maize by Province (ha), 2008–2012 .................................................................................................. 1975.1.7 Produksi Jagung Menurut Provinsi (ton), 2008–2012 Production of Maize by Province (ton), 2008–2012 ......................................................................................................... 1985.1.8 Produktivitas Jagung Menurut Provinsi (kuintal/ha), 2008–2012 Productivity of Maize by Province (quintal/ha), 2008–2012 ......................................................................................... 1995.1.9 Luas Panen Kedelai Menurut Provinsi (ha), 2008–2012 Harvested Area of Soybeans by Province (ha), 2008–2012 ............................................................................................. 2005.1.10 Produksi Kedelai Menurut Provinsi (ton), 2008–2012 Production of Soybeans by Province (ton), 2008–2012 .................................................................................................... 2015.1.11 Produktivitas Kedelai Menurut Provinsi (kuintal/ha), 2008–2012 Productivity of Soybeans by Province (quintal/ha), 2008–2012 .................................................................................... 2025.1.12 Luas Panen Kacang Tanah Menurut Provinsi (ha), 2008–2012 Harvested Area of Peanuts by Province (ha), 2008–2012 ............................................................................................... 2035.1.13 Produksi Kacang Tanah Menurut Provinsi (ton), 2008–2012 Production of Peanuts by Province (ton), 2008–2012 ...................................................................................................... 2045.1.14 Produktivitas Kacang Tanah Menurut Provinsi (kuintal/ha), 2008–2012 Productivity of Peanuts by Province (quintal/ha), 2008–2012 ....................................................................................... 2055.1.15 Luas Panen Ubi Kayu Menurut Provinsi (ha), 2008–2012 Harvested Area of Cassava by Province (ha), 2008–2012 ............................................................................................... 2065.1.16 Produksi Ubi Kayu Menurut Provinsi (ton), 2008–2012 Production of Cassava by Province (ton), 2008–2012 ..................................................................................................... 2075.1.17 Produktivitas Ubi Kayu Menurut Provinsi (kuintal/ha), 2008–2012 Productivity of Cassava by Province (quintal/ha), 2008–2012 ...................................................................................... 2085.1.18 Luas Panen Ubi Jalar Menurut Provinsi (ha), 2008–2012 Harvested Area of Sweet Potatoes by Province (ha), 2008–2012 .................................................................................... 209
http
://www.b
ps.g
o.id
S t a t i s t i k I n d o n e s i a 2 0 1 3xvi
5.1.19 Produksi Ubi Jalar Menurut Provinsi (ton), 2008–2012 Production of Sweet Potatoes by Province (ton), 2008–2012 .......................................................................................... 2105.1.20 Produktivitas Ubi Jalar Menurut Provinsi (kuintal/ha), 2008–2012 Productivity of Sweet Potatoes by Province (quintal/ha), 2008–2012 ........................................................................... 211
5.2 HORTIKULTURA/HORTICULTURE5.2.1 Luas Panen Tanaman Sayuran Menurut Provinsi dan Jenis Tanaman (ha), 2011 dan 2012 Harvested Area of Vegetables by Province and Kind of Plants (ha), 2011 dan 2012 .................................................... 2125.2.2 Produksi Tanaman Sayuran Menurut Provinsi dan Jenis Tanaman (ton), 2011 dan 2012 Production of Vegetables by Province and Kind of Plants (ton), 2011 and 2012 .......................................................... 2145.2.3 Luas Panen Tanaman Sayuran dan Buah-Buahan Semusim Menurut Jenis Tanaman (ha), 2009–2012 Harvested Area of Seasonal Vegetables and Fruits by Kind of Plants (ha), 2009–2012 .............................................. 2165.2.4 Produksi Tanaman Sayuran dan Buah-Buahan Semusim Menurut Jenis Tanaman (ton), 2009–2012 Production of Seasonal Vegetables and Fruits by Kind of Plants (ton), 2009–2012 .................................................... 2175.2.5 Luas Panen Tanaman Biofarmaka Menurut Provinsi dan Jenis Tanaman (m2), 2011 dan 2012 Harvested Area of Medicinal Plants by Province and Kind of Plants (m2), 2011 and 2012 ........................................ 2185.2.6 Produksi Tanaman Biofarmaka Menurut Provinsi dan Jenis Tanaman (kg), 2011 dan 2012 Production of Medicinal Plants by Province and Kind of Plants (kg), 2011 and 2012 ................................................ 2205.2.7 Luas Panen Tanaman Biofarmaka Menurut Jenis Tanaman (m2), 2009–2012 Harvested Area of Medicinal Plants by Kind of Plants (m2), 2009–2012 ...................................................................... 2225.2.8 Produksi Tanaman Biofarmaka Menurut Jenis Tanaman (kg), 2009–2012 Production of Medicinal Plants by Kind of Plants (kg), 2009–2012 .............................................................................. 2235.2.9 Luas Panen Tanaman Hias Menurut Provinsi dan Jenis Tanaman (m2), 2011 dan 2012 Harvested Area of Ornamental Plants by Province and Kind of Plants (m2), 2011 and 2012 ........................................ 2245.2.10 Produksi Tanaman Hias Menurut Provinsi dan Jenis Tanaman (tangkai), 2011 dan 2012 Production of Ornamental Plants by Province and Kind of Plants (stalks), 2011 and 2012 ....................................... 2265.2.11 Luas Panen Tanaman Hias Menurut Jenis Tanaman (m2), 2009–2012 Harvested Area of Ornamental Plants by Kind of Plants (m2), 2009–2012 .................................................................. 2285.2.12 Produksi Tanaman Hias Menurut Jenis Tanaman (tangkai), 2009–2012 Production of Ornamental Plants by Kind of Plants (stalks), 2009–2012 .................................................................... 2295.2.13 Produksi Buah-Buahan Menurut Provinsi dan Jenis Tanaman (ton), 2011 dan 2012 Production of Fruits by Province and Kind of Plants (ton), 2011 and 2012 .................................................................. 2305.2.14 Produksi Buah-Buahan dan Sayuran Tahunan Menurut Jenis Tanaman (ton), 2009–2012 Production of Annual Fruits and Vegetables by Kind of Plants (ton), 2009–2012 ....................................................... 232
5.3 PERKEBUNAN/ESTATE CROPS5.3.1 Jumlah Perusahaan Perkebunan Besar Menurut Jenis Tanaman, 2008–2012 Number of Large Estate Crop Companies by Types of Crops, 2008–2012 .................................................................... 2335.3.2 Luas Areal Tanaman Perkebunan Besar Menurut Jenis Tanaman (ribu ha), 2008–2012 Planted Area of Large Estate Crops by Type of Crops (thousand ha), 2008–2012 ...................................................... 2345.3.3 Luas Areal Tanaman Perkebunan Rakyat Menurut Jenis Tanaman (ribu ha), 2008–2012 Planted Area of Smallholder Estates by Type of Crops (thousand ha), 2008–2012 ..................................................... 2355.3.4 Produksi Perkebunan Besar Menurut Jenis Tanaman (ribu ton), 2008–2012 Production of Large Estate Crops by Type of Crops (thousand tons), 2008–2012 ...................................................... 2365.3.5 Produksi Perkebunan Rakyat Menurut Jenis Tanaman (ribu ton), 2008–2012 Production of Smallholder Estate Crops by Type of Crops (thousand tons), 2008–2012 ........................................... 2375.3.6 Luas Areal Tanaman Perkebunan Menurut Provinsi dan Jenis Tanaman (ribu ha), 2011 dan 2012 Planted Area of Estate Crops by Province and Type of Crops (thousand ha), 2011 and 2012 .................................... 238
http
://www.b
ps.g
o.id

S t a t i s t i c a l Y e a r b o o k o f I n d o n e s i a 2 0 1 3 xvii
5.3.7 Produksi Perkebunan Menurut Provinsi dan Jenis Tanaman (ribu ton), 2011 dan 2012 Production of Estates by Province and Type of Crops (thousand tons), 2011 and 2012 .............................................. 240
5.4 KEHUTANAN/FORESTRY5.4.1 Luas Kawasan Hutan dan Perairan Menurut Provinsi (ribu ha) Extent of Forest Area, Inland Water, Coastal, and Marine Ecosystem by Province (thousand ha) .............................. 2425.4.2 Luas Kegiatan Reboisasi (ha), 2007–2011 Reforested Areas (ha), 2007–2011 ..................................................................................................................................... 2435.4.3 Produksi Kayu Hutan Menurut Jenis Produksi (m3), 2002–2011 Timber Production by Type of Product (m3), 2002–2011 ............................................................................................... 2445.4.4 Produksi Kayu Bulat Perusahaan Hak Pengusahaan Hutan (HPH) Menurut Provinsi (m3), 2007–2011 Production of Logs of Forest Concession Estate by Province (m3), 2007–2011 ............................................................. 2455.4.5 Luas dan Penyebaran Lahan Kritis sampai dengan Tahun 2011 (ribu ha) Extent and Distribution of Critical Land up to 2011 (thousand ha) .............................................................................. 246
5.5 PETERNAKAN/LIVESTOCK5.5.1 Populasi Ternak Menurut Provinsi dan Jenis Ternak (ribu ekor), 2011 dan 2012 Livestock Population by Province and Kind of Livestock (thousand heads), 2011 and 2012 ...................................... 2475.5.2 Populasi Unggas Menurut Provinsi dan Jenis Unggas (ribu ekor), 2011 dan 2012 Poultry Population by Province and Kind of Poultries (thousand heads), 2011 and 2012 .......................................... 2495.5.3 Jumlah Ternak yang Dipotong di Rumah Potong Hewan (RPH) Menurut Provinsi dan Jenis Ternak (ekor), 2011 dan 2012 Livestock Slaughtered at Slaughtering House (Abattoir) by Province and Kind of Livestocks (heads), 2011 and 2012 ....................................................................................................................................................................... 2515.5.4 Produksi Daging Ternak Menurut Provinsi dan Jenis Ternak (ton), 2011 dan 2012 Meat Production by Province and Kind of Livestocks (ton), 2011 and 2012 ................................................................. 2535.5.5 Produksi Daging Unggas Menurut Provinsi dan Jenis Unggas (ton), 2011 dan 2012 Meat Production by Province and Kind of Poultries (ton), 2011 and 2012 ................................................................... 2555.5.6 Produksi Telur Unggas dan Susu Sapi Menurut Provinsi (ton), 2011 dan 2012 Production of Poultry Eggs and Cow Milk by Province (ton), 2011 and 2012 .............................................................. 257 5.6 PERIKANAN/FISHERY5.6.1 Jumlah Rumah Tangga Perikanan Tangkap Menurut Provinsi dan Subsektor, 2010 dan 2011 Number of Fish Capture Households by Province and Fishery Subsector, 2010 and 2011 ........................................... 2595.6.2 Produksi Perikanan Tangkap Menurut Provinsi dan Subsektor (ton), 2010 dan 2011 Production of Fish Capture by Province and Fishery Subsector (ton), 2010 and 2011 ................................................. 2605.6.3 Jumlah Perahu/Kapal Menurut Provinsi dan Jenis Perahu/Kapal, 2010 dan 2011 Number of Fishing Boats by Province and Type of Boat, 2010 and 2011 ....................................................................... 2615.6.4 Jumlah Rumah Tangga Perikanan Budidaya Menurut Provinsi dan Jenis Budidaya, 2010 dan 2011 Number of Aquaculture Households by Province and Type of Culture, 2010 and 2011 ............................................... 2635.6.5 Produksi Perikanan Budidaya Menurut Provinsi dan Jenis Budidaya (ton), 2010 dan 2011 Production of Aquaculture by Province and Type of Culture (ton), 2010 and 2011 ..................................................... 2655.6.6 Luas Area Usaha Budidaya Perikanan Menurut Provinsi dan Jenis Budidaya (ha), 2010 dan 2011 Aquaculture Areas by Province and Type of Culture (ha), 2010 and 2011 ................................................................... 2675.6.7 Produksi Perikanan Menurut Subsektor (ribu ton), 2006–2011 Fish Production by Subsector (thousand tons), 2006–2011 ............................................................................................. 269
http
://www.b
ps.g
o.id

S t a t i s t i k I n d o n e s i a 2 0 1 3xviii
6. PERTAMBANGAN DAN ENERGI/MINING AND ENERGY
6.1 PERTAMBANGAN/MINING6.1.1 Produksi Beberapa Jenis Bahan Tambang Menurut Jenis Bahan Tambang, 2008–2012 Production of Selected Mining Material by Kind of Mining Material, 2008–2012 ....................................................... 2756.1.2 Produksi Beberapa Hasil Kilang Minyak dan Gas Menurut Jenis Hasil Kilang (barel), 2008–2012 Production of Selected Refined Oil and Gas by Kind of Rifenery Products (barrels), 2008–2012 ............................... 2766.1.3 Pemasaran Bahan Bakar Minyak Dalam Negeri Menurut Jenis Bahan Bakar Minyak (kilo liter), 2007–2011 Domestic Sales of Oil Fuels by Kind of Oil Fuels (kilo litre), 2007–2011 ....................................................................... 277
6.2 LISTRIK, GAS, DAN AIR MINUM/ELECTRICITY, GAS, AND WATER SUPPLY6.2.1 Daya Terpasang, Produksi, dan Listrik Terjual PT. PLN (Persero) Menurut Wilayah Operasi, 2012 Installed Capacity, Produced Electricity, and Sold Electricity by State Electricity Company by Operational Region, 2012 ..................................................................................................................................................... 2786.2.2 Daya Terpasang PT. PLN (Persero) Menurut Wilayah Operasi (MW), 2008–2012 Installed Capacity by State Electricity Company (PT. PLN) by Operational Region (MW), 2008–2012 ............... 2796.2.3 Produksi Listrik PT. PLN (Persero) Menurut Wilayah Operasi (ribu MWh), 2008–2012 Electricity Produced by State Electricity Company (PT. PLN)) by Operational Region (thousand MWh), 2008-2012 .............................................................................................................................................................................. 2806.2.4 Listrik Terjual PT. PLN (Persero) Menurut Wilayah Operasi (ribu MWh), 2008–2012 Sold Electricity by State Electricity Company (PT. PLN) by Operational Region (thousand MWh), 2008–2012 .............................................................................................................................................................................. 2816.2.5 Indikator Penting Perusahaan Listrik, 2008–2012 Selected Indicators of Electricity Company, 2008–2012 ................................................................................................... 2826.2.6 Indikator Penting Perusahaan Gas, 2008–2012 Selected Indicators of Gas Company, 2008–2012 ............................................................................................................. 2836.2.7 Indikator Penting Perusahaan Air Bersih, 2008–2012 Selected Indicators of Water Supply Company, 2008–2012 ............................................................................................. 284
7. INDUSTRI MANUFAKTUR/MANUFACTURING INDUSTRY
7.1 INDUSTRI BESAR DAN SEDANG/LARGE AND MEDIUM MANUFACTURING INDUSTRY7.1.1 Perusahaan, Tenaga Kerja, Pengeluaran untuk Tenaga Kerja dan Perubahan Nilai Modal Tetap Industri Besar dan Sedang, 2010–2012 Number of Establishments, Workers Engaged, Labor Costs and the Value of Change in Fixed Capital of Large and Medium Manufacturing Industry, 2010–2012 ........................................................................................... 2947.1.2 Nilai Tambah Industri Besar dan Sedang (miliar rupiah), 2010–2012 Value Added of Large and Medium Manufacturing Industry (billion rupiahs), 2010–2012 ...................................... 2967.1.3 Biaya Input Industri Besar dan Sedang (miliar rupiah), 2010–2012 Input Costs of Large and Medium Manufacturing Industry (billion rupiahs), 2010–2012 ........................................ 2987.1.4 Nilai Output Industri Besar dan Sedang (miliar rupiah), 2010–2012 Value of Gross Output of Large and Medium Manufacturing Industry (billion rupiahs), 2010–2012 ...................... 3007.1.5 Indeks Produksi Triwulanan Industri Besar dan Sedang (2010=100), 2011 dan 2012 Quarterly Production Indices of Large and Medium Manufacturing Industry (2010=100), 2011 and 2012 .......... 303
http
://www.b
ps.g
o.id
S t a t i s t i c a l Y e a r b o o k o f I n d o n e s i a 2 0 1 3 xix
7.2 INDUSTRI MIKRO DAN KECIL/MICRO AND SMALL MANUFACTURING INDUSTRY7.2.1 Banyaknya Perusahaan, Tenaga Kerja, dan Pengeluaran untuk Tenaga Kerja Perusahaan Industri Mikro dan Kecil (juta rupiah), 2010–2012 Number of Establihsments, Workers Engaged, and Labor Cost of Micro and Small Manufacturing Industry (million rupiahs), 2010–2012 ............................................................................................................................... 3057.2.2 Nilai Output, Biaya Input, dan Nilai Tambah (Harga Pasar) Perusahaan Industri Mikro dan Kecil (juta rupiah), 2010–2012 Value of Gross Output, Input Cost, and Value Added (at Market Price) of Micro and Small Manufacturing Industry (million rupiahs), 2010–2012 ... ........................................................................................................................... 3077.2.3 Indeks Produksi Triwulanan Industri Mikro dan Kecil (2010=100), 2011 dan 2012 Quarterly Production Indices of Micro and Small Manufacturing Industry (2010=100), 2011 and 2012 ... ........... 309
8. KONSTRUKSI/CONSTRUCTION
8.1 Ringkasan Statistik Konstruksi, 2011 dan 2012 Summary of Construction Statistics, 2011 dan 2012 ........................................................................................................ 3198.2 Jumlah Perusahaan Konstruksi Menurut Provinsi dan Jenis Golongan Perusahaan, 2011 dan 2012 Number of Construction Establishment by Province and Type of Establishment Group, 2011 and 2012 ................. 3208.3 Jumlah Pekerja Tetap di Perusahaan Konstruksi Menurut Provinsi (orang), 2011 dan 2012 Number of Permanent Workers at Construction Establishment by Province (person), 2011 and 2012 ................... .. 3218.4 Jumlah Profesi Tenaga Ahli di Perusahaan Konstruksi Menurut Provinsi dan Kualifikasi (orang), 2012 Number of Expert Profession Workers at Construction Establishment by Province and Qualification (person), 2012 ......................................................................................................................................................................................................... 3228.5 Jumlah Profesi Tenaga Terampil di Perusahaan Konstruksi Menurut Provinsi dan Kualifikasi (orang), 2012 Number of Skilled Profession Workers at Construction Establishment by Province and Qualification (person), 2012 ......................................................................................................................................................................................................... 3238.6 Jumlah Hari Orang Pekerja Harian Lepas di Perusahaan Konstruksi Menurut Provinsi (ribu), 2011 dan 2012 Number of Man-Days of Daily Workers at Construction Establishmet by Province (thousand), 2011 and 2012 .... 3248.7 Jumlah Balas Jasa Pekerja Tetap dan Upah Pekerja Harian Menurut Provinsi (juta rupiah), 2011 dan 2012 Number of Compensation of Permanent Workers and Wages of Daily Workers by Province (million rupiah), 2011 and 2012 ....................................................................................................................................................................... 3258.8 Nilai Konstruksi yang Diselesaikan Menurut Provinsi dan Bidang Pekerjaan (juta rupiah), 2011 dan 2012 Value of Construction Completed by Province and Kind of Works (million rupiah), 2011 and 2012 ........................ 3268.9 Indeks Pekerja Tetap, Hari Orang, Balas Jasa dan Upah, serta Nilai Konstruksi yang Diselesaikan (2010=100), 2000 –2012 Indices of Permanent Workers, Man-Days, Compensation and Wages, and Value of Construction Completed (2010=100), 2000–2012 .................................................................................................................................................... 3288.10 Indeks Pekerja Tetap, Hari Orang, Balas Jasa dan Upah, serta Nilai Konstruksi yang Diselesaikan Menurut Provinsi (2010=100), 2011 dan 2012 Indices of Permanent Workers, Man-Days, Compensation and Wages, and Value of Construction Completed by Province (2010=100), 2011 and 2012 ................ ... ..................................................................................................... 3298.11 Volume, Nilai, dan Rata-Rata Harga per Unit Pembangunan Rumah oleh Perum Perumnas, 2012 Volume, Value, and Average Price per Unit of Housing Development by Perum Perumnas, 2012 ............................... 3308.12 Banyaknya Stok Akhir Rumah yang Dibangun oleh Perum Perumnas (unit), 2012 Number of Housing Final Stock Developed by Perum Perumnas (unit), 2012 .............................................................. 3318.13 Rencana dan Realisasi Pembangunan Rumah Siap Huni (RSH) oleh Perum Perumnas (unit), 2012 Planning and Realization of The Development of Ready to Occupy Houses Developed by Perum Perumnas (unit), 2012 ......................................................................................................................................................................................................... 332
http
://www.b
ps.g
o.id

S t a t i s t i k I n d o n e s i a 2 0 1 3xx
9. HOTEL DAN PARIWISATA/HOTEL AND TOURISM
9.1 Wisatawan Mancanegara yang Datang ke Indonesia Menurut Pintu Masuk, 2008–2012 Arrivals of International Visitor to Indonesia by Port of Entry, 2008–2012 .................................................................. 3379.2 Wisatawan Mancanegara yang Datang ke Indonesia Menurut Kebangsaan, 2008–2012 Arrivals of International Visitor to Indonesia by Nationality, 2008–2012 ..................................................................... 3389.3 Wisatawan Mancanegara yang Datang ke Indonesia Menurut Negara Tempat Tinggal, 2008–2012 Arrivals of International Visitor to Indonesia by Country of Residence, 2008–2012 .................................................... 3399.4 Rata-Rata Pengeluaran Wisatawan Mancanegara per Kunjungan Menurut Negara Tempat Tinggal (US$), 2008–2012 The Average Expenditure of International Visitor per Visit by Country of Residence (US$), 2008–2012 ................. 3409.5 Rata-Rata Lama Tinggal Wisatawan Mancanegara Menurut Negara Tempat Tinggal (hari), 2008–2012 The Average Length of Stay of International Visitor by Country of Residence (day), 2008–2012 ............................... 3419.6 Penerimaan dari Wisatawan Mancanegara Menurut Negara Tempat Tinggal (juta US$), 2008–2012 Revenue from International Visitor by Country of Residence (million US$), 2008–2012 ........................................... 3429.7 Jumlah Akomodasi, Kamar, dan Tempat Tidur yang Tersedia pada Hotel Bintang Menurut Provinsi, 2008–2012 Number of Accommodations, Rooms, and Beds Available in Classified Hotel by Province, 2008–2012 ..................... 3439.8 Jumlah Akomodasi, Kamar, dan Tempat Tidur yang Tersedia pada Hotel Nonbintang Menurut Provinsi, 2008–2012 Number of Accommodations, Rooms, and Beds Available in Non-Classified Hotel by Province, 2008–2012 ............................................................................................................................................................................. 3459.9 Tingkat Penghunian Kamar Hotel dan Akomodasi Lainnya Menurut Provinsi (persen), 2008–2012 Room Occupancy Rate of Hotels and Other Accommodation by Province (percent), 2008–2012 ............................. 3479.10 Rata-Rata Lama Menginap Tamu Pada Hotel Bintang Menurut Provinsi (hari), 2008–2012 Average Length of Stay in Classified Hotel by Province (day), 2008–2012 .................................................................... 3499.11 Rata-Rata Lama Menginap Tamu Pada Hotel Nonbintang dan Akomodasi Lainnya Menurut Provinsi (hari), 2008–2012 Average Length of Stay in Non-Classified Hotel and Other Accommodation by Province (day), 2008–2012 ............................................................................................................................................................................. 351
10. TRANSPORTASI DAN KOMUNIKASI/TRANSPORTATION AND COMMUNICATION
10.1 TRANSPORTASI/TRANSPORTATION10.1.1 Panjang Jalan Menurut Provinsi dan Tingkat Kewenangan Pemerintahan (km), 2010–2012 Length of Roads by Province and Level of Goverment Authority (km), 2010–2012 .................................................... 35810.1.2 Produksi Kendaraan Bermotor Dalam Negeri (unit), 2008–2012 Number of Domestically Assembled Motor Vehicles (units), 2008–2012 ...................................................................... 36110.1.3 Jumlah Kendaraan Bermotor Menurut Provinsi dan Jenis Kendaraan (unit), 2010–2012 Number of Registered Motor Vehicles by Province and Type of Motor Vehicles (units), 2010–2012 .......................... 36210.1.4 Produksi Angkutan Kereta Api Penumpang, 2008–2012 Production of Passenger Railways Transportation, 2008–2012 ...................................................................................... 36510.1.5 Produksi Angkutan Kereta Api Barang, 2008–2012 Production of Freight Railways Transportation, 2008–2012 ........................................................................................... 36610.1.6 Bongkar Muat Barang Menurut Provinsi dan Jenis Pelayaran (ton), 2011 Unloaded and Loaded Cargo by Province and Kind of Voyage (ton), 2011 ................................................................... 36710.1.7 Banyaknya Kunjungan Kapal Pelayaran Dalam Negeri dan Luar Negeri Menurut Provinsi, 2011 Number of Ship Calls of Domestic and International Voyage by Province, 2011 ........................................................... 368
http
://www.b
ps.g
o.id
S t a t i s t i c a l Y e a r b o o k o f I n d o n e s i a 2 0 1 3 xxi
10.1.8 Jumlah Pesawat Terbang Menurut Sertifikasi Operator Angkutan Udara, 2008–2012 Number of Civil Aircraft Registered by Air Operator Certificate (AOC) and Operating Certificate (OC), 2008–2012 ............................................................................................................................................................................. 36910.1.9 Produksi Angkutan Udara Niaga Berjadwal Domestik, 2008–2012 Commercial Airlines Production of Scheduled Domestic Flight, 2008–2012 ................................................................ 37010.1.10 Produksi Angkutan Udara Niaga Berjadwal Internasional, 2008–2012 Commercial Airlines Production of Scheduled International Flight, 2008–2012 ......................................................... 37110.1.11 Lalu Lintas Penumpang dan Barang Angkutan Udara Penerbangan Dalam Negeri di Lima Bandar Udara Utama, 2007–2012 Domestic Aircraft Passenger and Freight Traffic in Five Main Airports, 2007–2012 .................................................... 37210.1.12 Lalu Lintas Penumpang dan Barang Angkutan Udara Penerbangan Luar Negeri di Lima Bandar Udara Utama, 2007–2012 International Aircraft Passenger and Freight Traffic in Five Main Airports, 2007–2012 ............................................. 37310.1.13 Lalu Lintas Angkutan Udara Penerbangan Dalam Negeri, 2008–2012 Domestic Aircraft Traffic, 2008–2012 ................................................................................................................................ 37410.1.14 Lalu Lintas Angkutan Udara Penerbangan Luar Negeri, 2008–2012 International Aircraft Traffic, 2008–2012 .......................................................................................................................... 375
10.2 POS DAN TELEKOMUNIKASI/POST AND TELECOMUNICATION10.2.1 Jumlah Desa yang Memiliki Kantor Pos Menurut Provinsi, 2005–2011 Number of Villages with Post Office by Provinces, 2005–2011 ........................................................................................ 37610.2.2 Persentase Rumah Tangga yang Memiliki/Menguasai Telepon Tetap Kabel Menurut Provinsi, 2008-2011 Percentage of Households with Fixed Line Telephone by Province, 2008–2011 ............................................................ 37710.2.3 Persentase Rumah Tangga yang Memiliki/Menguasai Telepon Seluler Menurut Provinsi, 2008-2011 Percentage of Households with Mobile Cellular Telephone by Province, 2008–2011 ................................................... 37810.2.4 Persentase Rumah Tangga yang Pernah Mengakses Internet dalam 3 Bulan Terakhir Menurut Provinsi, 2008-2011 Percentage of Households Who Used The Internet in The Last 3 Months by Province, 2008–2011 ............................ 37910.2.5 Rata-Rata Banyaknya Anggota Rumah Tangga yang Pernah Mengakses Internet dari Rumah Tangga yang Pernah Mengakses Internet dalam 3 Bulan Terakhir Menurut Provinsi dan Jenis Kelamin, 2010-2011 Average Number of Household Members Who Used The Internet from Households Who Used The Internet in The Last 3 Months by Province and Sex, 2010–2011 .................................................................................................. 380 11. PERBANKAN, INVESTASI, UTANG LUAR NEGERI, ASURANSI, DAN KOPERASI BANKING, INVESTMENT, EXTERNAL DEBT, INSURANCE, AND COOPERATIVE
11.1 PERBANKAN/BANKING11.1.1 Bank dan Kantor Bank, 2008–2012 Banks and Bank Offices, 2008–2012 .................................................................................................................................. 38611.1.2 Uang Beredar dan Faktor-Faktor yang Mempengaruhinya (miliar rupiah), 2008–2012 Broad Money and Its Affecting Factors (billion rupiahs), 2008–2012 ............................................................................ 38711.1.3 Perkembangan Dana Perbankan Menurut Jenisnya (miliar rupiah), 2008–2012 Bank Funds Development by Type of Funds (billion rupiahs), 2008–2012 ................................................................... 38811.1.4 Dana Pihak Ketiga Perbankan Syariah Menurut Jenis Dana (miliar rupiah), 2008–2012 Depositor Funds of Sharia Banks by Type of Funds (billion rupiahs), 2008–2012 ...................................................... 38911.1.5 Posisi Simpanan Masyarakat (Rupiah dan Valuta Asing) pada Bank Umum Menurut Kelompok Bank (miliar rupiah), 2008–2012 Outstanding of Private Deposits of Commercial Banks (Rupiah and Foreign Exchange) by Group of Banks (billion rupiahs), 2008–2012 .................................................................................................................................. 390
http
://www.b
ps.g
o.id

S t a t i s t i k I n d o n e s i a 2 0 1 3xxii
11.1.6 Posisi Indonesia dengan IMF (juta SDR), 2008–2012 Indonesia’s Fund Position with IMF (million SDR), 2008–2012 ................................................................................... 39111.1.7 Posisi Pinjaman Rupiah dan Valuta Asing yang Diberikan Bank Umum dan BPR Menurut Kelompok Bank (miliar rupiah), 2008–2012 Outstanding of Loans in Rupiahs and Foreign Exchange of Commercial and Rural Banks by Group of Banks (billion rupiahs), 2008–2012 .................................................................................................................................. 39211.1.8 Posisi Kredit Perbankan dalam Rupiah dan Valuta Asing Menurut Sektor Ekonomi (miliar rupiah), 2008–2012 Value of Bank Credits in Rupiahs and Foreign Exchange by Economic Sectors (billion rupiahs), 2008–2012 ............................................................................................................................................................................. 39311.1.9 Pemberian Kredit oleh Lembaga-Lembaga Keuangan Lainnya (miliar rupiah), 2008–2012 Credits Granted by Other Financial Institutions (billion rupiahs), 2008–2012 ........................................................... 39411.1.10 Posisi Pinjaman Investasi Bank-Bank Umum dalam Rupiah dan Valuta Asing Menurut Sektor Ekonomi (miliar rupiah), 2011 dan 2012 Outstanding of Investment Credit of Commercial Banks in Rupiah and Foreign Exchange by Economic Sectors (billion rupiahs), 2011 and 2012 ........................................................................................................................................ 39511.1.11 Pinjaman Investasi Bank-Bank Umum dalam Rupiah Menurut Sektor Ekonomi (miliar rupiah), 2011 dan 2012 Investment Credit of Commercial Banks in Rupiah by Economic Sectors (billion rupiahs), 2011 and 2012 ....................................................................................................................................................................... 39611.1.12 Posisi Kredit Usaha Mikro, Kecil, dan Menengah (UMKM) pada Bank Umum (miliar rupiah), 2011–2013 Outstanding of Micro, Small, and Medium Enterprises (MSMEs) Credits of Commercial Banks (billion rupiahs), 2011–2013 .............................................................................................................................................. 39711.1.13 Posisi Simpanan Berjangka Rupiah pada Bank Umum dan BPR Menurut Golongan Pemilik (miliar rupiah), 2010–2012 Outstanding Time Deposits in Rupiah of Commercial and Rural Banks by Ownership (billion rupiahs), 2010–2012 .............................................................................................................................................. 39811.1.14 Posisi Tabungan pada Bank Umum Menurut Jenis Tabungan (miliar rupiah), 2008–2012 Outstanding Saving Deposits of Commercial Banks by Type of Deposits (billion rupiahs), 2008–2012 ............................................................................................................................................................................. 39911.1.15 Kurs Tengah Beberapa Mata Uang Asing Terhadap Rupiah di Bank Indonesia dan Harga Emas di Jakarta (rupiah), 2008–2012 Selected Foreign Exchange Middle Rates Against Rupiah at Bank Indonesia and Prices of Gold in Jakarta (rupiahs), 2008–2012 ........................................................................................................................................ 400
11.2 INVESTASI/INVESTMENT11.2.1 Realisasi Investasi Penanaman Modal Dalam Negeri Menurut Sektor Ekonomi (miliar rupiah), 2010–2012 Domestic Direct Investment Realization by Economic Sector (billion rupiahs), 2010–2012 ...................................... 40111.2.2 Realisasi Investasi Penanaman Modal Dalam Negeri Menurut Provinsi (miliar rupiah), 2010–2012 Domestic Direct Investment Realization by Province (billion rupiahs), 2010–2012 .................................................... 40211.2.3 Realisasi Investasi Penanaman Modal Luar Negeri Menurut Sektor Ekonomi (juta US$), 2010–2012 Foreign Direct Investment Realization by Economic Sectors (million US$), 2010–2012 ............................................. 40311.2.4 Realisasi Investasi Penanaman Modal Luar Negeri Menurut Provinsi (juta US$), 2010–2012 Foreign Direct Investment Realization by Province (million US$), 2010–2012 ........................................................... 40411.2.5 Realisasi Investasi Penanaman Modal Luar Negeri Menurut Negara (juta US$), 2010–2012 Foreign Direct Investment Realization by Country (million US$), 2010–2012 ............................................................ 405
11.3 UTANG LUAR NEGERI/EXTERNAL DEBT11.3.1 Posisi Utang Luar Negeri Indonesia Menurut Kelompok Peminjam (juta US$), 2008–2012 External Debt Position of Indonesia by Group of Borrower (million US$), 2008–2012 ............................................. 406
http
://www.b
ps.g
o.id

S t a t i s t i c a l Y e a r b o o k o f I n d o n e s i a 2 0 1 3 xxiii
11.3.2 Posisi Utang Luar Negeri Indonesia Menurut Kreditor (juta US$), 2008–2012 External Debt Position of Indonesia by Creditor (million US$), 2008–2012 ................................................................ 40711.3.3 Posisi Utang Luar Negeri Pemerintah dan Bank Sentral Menurut Kategori Kreditor dan Persyaratan Kredit (juta US$), 2008–2012 External Debt Position of Government and Bank Central by Creditor Category and Credit Term Outstanding (million US$), 2008–2012 ............................................................................................................................ 40811.3.4 Pembayaran Utang Luar Negeri Indonesia (juta US$), 2008–2012 External Debt Payment of Indonesia (million US$), 2008–2012 ................................................................................... 40911.3.5 Posisi Cadangan Devisa (juta US$), 2008–2012 Official Reserve Assets Position (million US$), 2008–2012 ............................................................................................ 410
11.4 ASURANSI/INSURANCE11.4.1 Jumlah Perusahaan Asuransi dan Perusahaan Penunjang Asuransi, 2008–2012 Number of Insurance Companies and Insurance Related Companies, 2008–2012 ....................................................... 41111.4.2 Rekapitulasi Neraca Perusahaan Asuransi Menurut Jenis Usaha per 31 Desember (miliar rupiah), 2012 Recapitulation of Balance Sheets of Insurance Companies at 31st December (billion rupiahs), 2012 .......................... 41211.4.3 Rekapitulasi Neraca Perusahaan Penyelenggara Program Asuransi untuk PNS, TNI-Polri, Sosial, dan Jamsostek per 31 Desember (miliar rupiah), 2012 Recapitulation of Balance Sheets Insurance Companies Running Insurance for Civil Servant, Armed Force, Social Insurance Program and Worker Social Insurance at 31st December (billion rupiahs), 2012 ............................. 413
11.5 KOPERASI/COOPERATIVE11.5.1 Jumlah Koperasi Aktif Menurut Provinsi, 2009–2012 Number of Active Cooperatives by Province, 2009–2012... ............................................................................................... 41411.5.2 Volume Usaha Koperasi Menurut Provinsi (juta rupiah), 2009–2012 Asset Scale of Cooperatives by Province (million rupiahs), 2009–2012 ......................................................................... 41511.5.3 Sisa Hasil Usaha (SHU) Koperasi Menurut Provinsi (juta rupiah), 2009–2012 Net Profit of Cooperatives by Provinces (million rupiahs), 2009–2012 ......................................................................... 416
12. HARGA-HARGA/PRICES
12.1 Rata-Rata Harga Eceran Beras di Pasar Tradisional di 33 Kota (rupiah/kg), 2009–2012 Retail Prices of Rice at Traditional Markets in 33 Cities (rupiahs/kg), 2009–2012 .................................................... 42412.2 Rata-Rata Harga Eceran Nasional Beberapa Jenis Barang (rupiah), 2009–2012 National Retail Prices of Selected Commodities (rupiahs), 2009–2012 ......................................................................... 42512.3 Indeks Harga Konsumen Gabungan 66 Kota (2007=100), 2009–2012 Composite Consumer Price Indices of 66 Cities (2007=100), 2009–2012 ................................................................... 42612.4 Indeks Harga Konsumen di 66 Kota (2007=100), 2011 dan 2012 Consumer Price Indices in 66 Cities (2007=100), 2011 and 2012 ................................................................................ 42812.5 Laju Inflasi Gabungan 66 Kota (2007=100), 2009–2012 Composite Inflation Rate of 66 Cities (2007=100), 2009–2012 ................................................................................... 43212.6 Laju Inflasi Bulanan Gabungan 66 Kota (2007=100), 2009–2012 Composite Inflation Rate (Month on Month) of 66 Cities (2007=100), 2009–2012 ................................................. 43312.7 Laju Inflasi Tahun Kalender Gabungan 66 Kota (2007=100), 2009–2012 Composite Inflation Rate of Calendar Year of 66 Cities (2007=100), 2009–2012 ..................................................... 43412.8 Laju Inflasi Tahun ke Tahun Gabungan 66 Kota (2007=100), 2009–2012 Composite Inflation Rate of Year on Year of 66 Cities (2007=100), 2009–2012 ......................................................... 435
http
://www.b
ps.g
o.id
S t a t i s t i k I n d o n e s i a 2 0 1 3xxiv
12.9 Harga Perdagangan Besar Beberapa Hasil Pertanian dan Bahan Ekspor Utama di Jakarta (rupiah per kuintal), 2007–2012 Wholesale Prices of Several Farm Crops and Major Export Commodities in Jakarta (rupiahs per quintal), 2007–2012 ....................................................................................................................................... 43612.10 Indeks Harga Perdagangan Besar Menurut Sektor (2005=100), 2007–2012 Wholesale Price Indices by Sector (2005=100), 2007–2012 .......................................................................................... 43712.11 Indeks Harga Perdagangan Besar Bahan Bangunan/Konstruksi (2005=100), 2007–2012 Wholesale Price Indices of Building/Construction Materials (2005=100), 2007–2012 ............................................. 43812.12 Indeks Harga Perdagangan Besar Bahan Bangunan/Konstruksi Menurut Jenis Bangunan/Konstruksi (2005=100), 2007–2012 Wholesale Price Indices of Building/Construction Materials by Type of Building/Construction (2005=100), 2007–2012 ............................................................................................................................................................................. 43912.13 Indeks Harga Perdagangan Besar Menurut Kelompok Penggunaan Barang dan Sektor (2005=100), 2007–2012 Wholesale Price Indices by End Use of Commodities and Sectors (2005=100), 2007–2012 ...................................... 44012.14 Indeks Harga Perdagangan Besar Menurut Kelompok Barang dalam Proses Produksi dan Sektor (2005=100), 2007–2012 Wholesale Price Indices by Group of Commodities in the Stage of Production Process and Sectors (2005=100), 2007–2012 .................................................................................................................................................... 44112.15 Indeks Harga yang Diterima Petani (It), Indeks Harga yang Dibayar Petani (Ib), dan Nilai Tukar Petani (NTP) Menurut Periode Bulan (2007=100), 2011 dan 2012 Prices Received by Farmers Indices (It), Prices Paid by Farmers Indices (Ib), and Farmers’ Terms of Trade (NTP) by Month (2007=100), 2011 and 2012 ................................................................................................... 44212.16 Indeks Harga yang Diterima Petani (It), Indeks Harga yang Dibayar Petani (Ib), dan Nilai Tukar Petani (NTP) Menurut Provinsi (2007=100), 2011 dan 2012 Prices Received by Farmers Indices (It), Prices Paid by Farmers Indices (Ib), and Farmers’ Terms of Trade (NTP) by Province (2007=100), 2011 and 2012 ................................................................................................ 44312.17 Indeks Harga yang Diterima Petani (It), Indeks Harga yang Dibayar Petani (Ib), dan Nilai Tukar Petani Subsektor Tanaman Pangan (NTPP) di Indonesia (2007=100), 2011 dan 2012 Prices Received by Farmers Indices (It), Prices Paid by Farmers Indices (Ib), and Farmers’ Terms of Trade of Food Crops Subsector (NTPP) in Indonesia (2007=100), 2011 and 2012 .................................................. 44512.18 Indeks Harga yang Diterima Petani (It), Indeks Harga yang Dibayar Petani (Ib), dan Nilai Tukar Petani Subsektor Hortikultura (NTPH) di Indonesia (2007=100), 2011 dan 2012 Prices Received by Farmers Indices (It), Prices Paid by Farmers Indices (Ib), and Farmers’ Terms of Trade of Horticulture Subsector (NTPH) in Indonesia (2007=100), 2011 and 2012 ............................................... 44712.19 Indeks Harga yang Diterima Petani (It), Indeks Harga yang Dibayar Petani (Ib), dan Nilai Tukar Petani Subsektor Tanaman Perkebunan Rakyat (NTPR) Menurut Provinsi (2007=100), 2011 dan 2012 Prices Received by Farmers Indices (It), Prices Paid by Farmers Indices (Ib), and Farmers’ Terms of Trade of Smallholders Estate Crops Subsector (NTPR) by Province (2007=100), 2011 and 2012 ........................ 44912.20 Indeks Harga yang Diterima Petani (It), Indeks Harga yang Dibayar Petani (Ib), dan Nilai Tukar Petani Subsektor Peternakan (NTPT) Menurut Provinsi (2007=100), 2011 dan 2012 Prices Received by Farmers Indices (It), Prices Paid by Farmers Indices (Ib), and Farmers’ Terms of Trade of Animal Husbandry Subsector (NTPT) by Province (2007=100), 2011 and 2012 ..................................... 45112.21 Indeks Harga yang Diterima Petani (It), Indeks Harga yang Dibayar Petani (Ib), dan Nilai Tukar Petani Subsektor Perikanan (NTN) Menurut Provinsi (2007=100), 2011 dan 2012 Prices Received by Farmers Indices (It), Prices Paid by Farmers Indices (Ib), and Farmers’ Terms of Trade of Fishery Subsector (NTN) by Province (2007=100), 2011 and 2012 ............................................................ 45312.22 Indeks Konsumsi Rumah Tangga Wilayah Perdesaan Menurut Provinsi (2007=100), 2011 dan 2012 Consumptions Indices of Rural Households by Province (2007=100), 2011 and 2012 .............................................. 455
http
://www.b
ps.g
o.id

S t a t i s t i c a l Y e a r b o o k o f I n d o n e s i a 2 0 1 3 xxv
12.23 Rata-Rata Harga Gabah Menurut Kelompok Kualitas dan HPP di Tingkat Petani dan Tingkat Penggilingan (rupiah/kg), 2002–2012 Average Price of Paddy by Group of Quality and Government Purchasing Price at Farmer and Huller Level (rupiahs/kg), 2002–2012 ................................................................................................................................................... 45712.24 Rata-Rata Harga Gabah Menurut Provinsi dan Kelompok Kualitas di Tingkat Petani (rupiah/kg), 2011 dan 2012 Average Price of Paddy by Province and Group of Quality at Farmer Level (rupiahs/kg), 2011 and 2012 ............. 45812.25 Rata-Rata Harga Gabah Menurut Provinsi dan Kelompok Kualitas di Tingkat Penggilingan (rupiah/kg), 2011 dan 2012 Average Price of Paddy by Province and Group of Quality at Huller Level (rupiahs/kg), 2011 and 2012 .............. 45912.26 Indeks Kedalaman Harga Gabah yang Berada di Bawah HPP, Januari–Desember 2012 Gap Indexes of Paddy Price Under HPP, January–December 2012 ................................................................................ 46012.27 Indeks Keparahan Harga Gabah yang Berada di Bawah HPP, Januari–Desember 2012 Severity Indexes of Paddy Price Under HPP, January–December 2012 .......................................................................... 461 13. PENGELUARAN PENDUDUK SERTA KETERSEDIAAN DAN KONSUMSI MAKANAN POPULATION EXPENDITURE AND FOOD AVAILABILITY AND CONSUMPTION
13.1 PENGELUARAN/EXPENDITURE13.1.1 Pengeluaran Rata-Rata per Kapita Sebulan di Daerah Perkotaan Menurut Kelompok Barang dan Golongan Pengeluaran per Kapita Sebulan, 2012 Monthly Average Expenditure per Capita in Urban Areas by Commodity Group and Monthly Expenditure per Capita Class, 2012 .................................................................................................................................... 46713.1.2 Pengeluaran Rata-Rata per Kapita Sebulan di Daerah Perdesaan Menurut Kelompok Barang dan Golongan Pengeluaran per Kapita Sebulan, 2012 Monthly Average Expenditure per Capita in Rural Areas by Commodity Group and Monthly Expenditure per Capita Class, 2012 .................................................................................................................................... 46913.1.3 Pengeluaran Rata-Rata per Kapita Sebulan di Daerah Perkotaan dan Perdesaan Menurut Kelompok Barang dan Golongan Pengeluaran per Kapita Sebulan, 2012 Monthly Average Expenditure per Capita in Urban and Rural Areas by Commodity Group and Monthly Expenditure per Capita Class, 2012 .................................................................................................................... 47113.1.4 Pengeluaran Rata-Rata per Kapita Sebulan Menurut Kelompok Barang (rupiah), 2011 dan 2012 Monthly Average Expenditure per Capita by Commodity Group (rupiahs), 2011 and 2012 ..................................... 47313.1.5 Persentase Pengeluaran Rata-Rata per Kapita Sebulan Menurut Kelompok Barang, 2011 dan 2012 Percentage of Monthly Average Expenditure per Capita by Commodity Group, 2011 and 2012 ............................... 47413.1.6 Pengeluaran Rata-Rata per Kapita Sebulan di Daerah Perkotaan Menurut Provinsi dan Kelompok Barang (rupiah), 2011 dan 2012 Monthly Average Expenditure per Capita in Urban Areas by Province and Commodity Groups (rupiahs), 2011 and 2012 .................................................................................................................................................... 47513.1.7 Pengeluaran Rata-Rata per Kapita Sebulan di Daerah Perdesaan Menurut Provinsi dan Kelompok Barang (rupiah), 2011 dan 2012 Monthly Average Expenditure per Capita in Rural Areas by Province and Commodity Groups (rupiahs), 2011 and 2012 .................................................................................................................................................... 47613.1.8 Pengeluaran Rata-Rata per Kapita Sebulan di Daerah Perkotaan dan Perdesaan Menurut Provinsi dan Kelompok Barang (rupiah), 2011 dan 2012 Monthly Average Expenditure per Capita in Urban and Rural Areas by Province and Commodity Groups (rupiahs), 2011 and 2012 ....................................................................................................................................... 477
http
://www.b
ps.g
o.id

S t a t i s t i k I n d o n e s i a 2 0 1 3xxvi
13.1.9 Persentase Pengeluaran Rata-Rata per Kapita Sebulan di Daerah Perkotaan Menurut Provinsi dan Kelompok Barang, 2011 dan 2012 Percentage of Monthly Average Expenditure per Capita in Urban Areas by Province and Commodity Groups, 2011 and 2012 ........................................................................................................................................................ 47813.1.10 Persentase Pengeluaran Rata-Rata per Kapita Sebulan di Daerah Perdesaan Menurut Provinsi dan Kelompok Barang, 2011 dan 2012 Percentage of Monthly Average Expenditure per Capita in Rural Areas by Province and Commodity Groups, 2011 and 2012 ........................................................................................................................................................ 47913.1.11 Persentase Pengeluaran Rata-Rata per Kapita Sebulan di Daerah Perkotaan dan Perdesaan Menurut Provinsi dan Kelompok Barang, 2011 dan 2012 Percentage of Monthly Average Expenditure per Capita in Urban and Rural Areas by Province and Commodity Groups, 2011 and 2012 ................................................................................................................................... 48013.1.12 Distribusi Pembagian Pengeluaran per Kapita dan Indeks Gini, 2010–2012 Distribution of Expenditure per Capita and Gini Index, 2010–2012 ............................................................................. 481
13.2 KETERSEDIAAN DAN KONSUMSI MAKANAN/FOOD AVAILABILITY AND CONSUMPTION13.2.1 Ketersediaan Kalori per Kapita Menurut Kelompok Bahan Makanan (kkal), 2008–2012 Availability of per Capita Calories by Food Stuffs Commodity Group (kcal), 2008–2012 ......................................... 48213.2.2 Ketersediaan Protein per Kapita Menurut Kelompok Bahan Makanan (gram), 2008–2012 Availability of per Capita Proteins by Food Stuffs Commodity Group (grams), 2008–2012 ...................................... 48313.2.3 Ketersediaan Lemak per Kapita Menurut Kelompok Bahan Makanan (gram), 2008–2012 Availability of per Capita Fats by Food Stuffs Commodity Group (grams), 2008–2012 ............................................ 48413.2.4 Konsumsi Rata–Rata per Kapita Seminggu Beberapa Macam Bahan Makanan Penting, 2011 dan 2012 Per Capita Weekly Average Consumption of Several Food Items, 2011 and 2012 ........................................................ 48513.2.5 Rata–Rata Konsumsi Kalori dan Protein per Kapita per Hari Menurut Provinsi, 2011 dan 2012 Average Daily per Capita Consumption of Calorie and Protein by Province, 2011 and 2012 ..................................... 486
14. PERDAGANGAN LUAR NEGERI/FOREIGN TRADE
14.1 PERKEMBANGAN EKSPOR IMPOR/GROWTH OF EXPORT AND IMPORT14.1.1 Nilai Ekspor dan Impor (juta US$), 1984–2012 Value of Exports and Imports (million US$), 1984–2012 ............................................................................................... 49114.1.2 Volume Ekspor dan Impor Migas (Berat bersih: ribu ton), 1999–2012 Volume of Oil and Gas Exports and Imports (Net weight: thousand tons), 1999–2012 ............................................. 49214.1.3 Nilai Ekspor dan Impor Migas (juta US$), 1999–2012 Value of Oil and Gas Exports and Imports (million US$), 1999–2012 ......................................................................... 49314.1.4 Volume Ekspor dan Impor Menurut Golongan SITC (Berat bersih : ribu ton), 2009–2011 Volume of Exports and Imports by SITC Group (Net weight : thousand tons), 2009–2011 ...................................... 49414.1.5 Nilai Ekspor dan Impor Menurut Golongan SITC (juta US$), 2009–2011 Value of Exports and Imports by SITC Group (million US$), 2009–2011 .................................................................. 495
14.2 EKSPOR/EXPORT14.2.1 Volume Ekspor Menurut Pelabuhan Utama (Berat bersih:ribu ton), 2008–2012 Volume of Exports by Major Ports (Net weight:thousand tons), 2008–2012 ............................................................... 49614.2.2 Nilai Ekspor Menurut Pelabuhan Utama (Nilai FOB:juta US$), 2008–2012 Value of Exports by Major Ports (FOB value:million US$), 2008–2012 ...................................................................... 49814.2.3 Volume Ekspor Menurut Negara Tujuan Utama (Berat bersih : ribu ton), 2008–2012 Volume of Exports by Major Countries of Destination (Net weight : thousand tons), 2008–2012 ............................. 50014.2.4 Nilai Ekspor Menurut Negara Tujuan Utama (Nilai FOB : juta US$), 2008–2012 Value of Exports by Major Countries of Destination (FOB value : million US$), 2008–2012 ................................... 501
http
://www.b
ps.g
o.id
S t a t i s t i c a l Y e a r b o o k o f I n d o n e s i a 2 0 1 3 xxvii
14.2.5 Ekspor Minyak Bumi Mentah Menurut Negara Tujuan Utama, 2008–2012 Exports of Crude Petroleum by Major Countries of Destination, 2008–2012 ............................................................... 50214.2.6 Ekspor Hasil Minyak Mentah Menurut Negara Tujuan Utama, 2008–2012 Exports of Petroleum Products by Major Countries of Destination, 2008–2012 .......................................................... 50314.2.7 Ekspor Gas Menurut Negara Tujuan Utama, 2008–2012 Exports of Gas by Major Countries of Destination, 2008–2012 ..................................................................................... 50414.2.8 Ekspor Kopi Menurut Negara Tujuan Utama, 2008–2012 Exports of Coffee by Major Countries of Destination, 2008–2012 ................................................................................. 50514.2.9 Ekspor Udang Menurut Negara Tujuan Utama, 2008–2012 Exports of Shrimp by Major Countries of Destination, 2008–2012 ............................................................................... 50614.2.10 Ekspor Teh Menurut Negara Tujuan Utama, 2008–2012 Exports of Tea by Major Countries of Destination, 2008–2012 ...................................................................................... 50714.2.11 Ekspor Tembakau Menurut Negara Tujuan Utama, 2008–2012 Exports of Tobacco by Major Countries of Destination, 2008–2012 .............................................................................. 50814.2.12 Ekspor Biji Coklat Menurut Negara Tujuan Utama, 2008–2012 Exports of Cocoa by Major Countries Destination, 2008–2012 ..................................................................................... 50914.2.13 Ekspor Ikan Tongkol/Tuna Menurut Negara Tujuan Utama, 2008–2012 Exports of Tongkol/Tuna Fish by Major Countries of Destination, 2008–2012 ........................................................... 51014.2.14 Ekspor Kepiting dan Kerang-Kerangan Menurut Negara Tujuan Utama, 2008–2012 Exports of Crabs and Scallops by Major Countries of Destination, 2008–2012 ........................................................... 51114.2.15 Ekspor Buah-Buahan Menurut Negara Tujuan Utama, 2008–2012 Exports of Fruits by Major Countries of Destination, 2008–2012 .................................................................................. 51214.2.16 Ekspor Kayu Lapis Menurut Negara Tujuan Utama, 2008–2012 Exports of Plywood by Major Countries of Destination, 2008–2012 ............................................................................. 51314.2.17 Ekspor Barang dari Tembaga Menurut Negara Tujuan Utama, 2008–2012 Exports of Copper Products by Major Countries of Destination, 2008–2012 ............................................................... 51414.2.18 Ekspor Pakaian Jadi Menurut Negara Tujuan Utama, 2008–2012 Exports of Garments by Major Countries of Destination, 2008–2012 ........................................................................... 51514.2.19 Ekspor Karet dalam Bentuk Remah Menurut Negara Tujuan Utama, 2008–2012 Exports of Crumb Rubber by Major Countries of Destination, 2008–2012 .................................................................. 51614.2.20 Ekspor Minyak Kelapa Sawit Menurut Negara Tujuan Utama, 2008–2012 Exports of Palm Oil by Major Countries of Destination, 2008–2012 ............................................................................ 51714.2.21 Ekspor Alat Listrik Menurut Negara Tujuan Utama, 2008–2012 Exports of Electric Devices by Major Countries of Destination, 2008–2012 ................................................................. 51814.2.22 Ekspor Audio Visual Menurut Negara Tujuan Utama, 2008–2012 Exports of Audio Visual by Major Countries of Destination, 2008–2012 ...................................................................... 51914.2.23 Ekspor Kertas dan Barang dari Kertas Menurut Negara Tujuan Utama, 2008–2012 Exports of Paper and Its Products by Major Countries of Destination, 2008–2012 ..................................................... 52014.2.24 Ekspor Alas Kaki Menurut Negara Tujuan Utama, 2008–2012 Exports of Footwear by Major Countries of Destination, 2008–2012 ............................................................................ 52114.2.25 Ekspor Komputer dan Bagiannya Menurut Negara Tujuan Utama, 2008–2012 Exports of Computer and Its Components by Major Countries of Destination, 2008–2012 ....................................... 52214.2.26 Ekspor Bijih Tembaga Menurut Negara Tujuan Utama, 2008–2012 Exports of Copper Ore by Major Countries of Destination, 2008–2012 ........................................................................ 52314.2.27 Ekspor Bijih Nikel Menurut Negara Tujuan Utama, 2008–2012 Exports of Nickel Ore by Major Countries of Destination, 2008–2012 .......................................................................... 52414.2.28 Ekspor Batu Bara Menurut Negara Tujuan Utama, 2008–2012 Exports of Coal by Major Countries of Destination, 2008–2012 .................................................................................... 525
http
://www.b
ps.g
o.id

S t a t i s t i k I n d o n e s i a 2 0 1 3xxviii
14.3 IMPOR/IMPORT14.3.1 Volume Impor Menurut Negara Asal Utama (Berat bersih : ribu ton), 2008–2012 Volume of Imports by Major Countries of Origin (Net weight : thousand tons), 2008–2012 ..................................... 52614.3.2 Nilai Impor Menurut Negara Asal Utama (Nilai CIF : juta US$), 2008–2012 Value of Imports by Major Countries of Origin (CIF value : million US$), 2008–2012 ............................................. 52714.3.3 Volume Impor Menurut Pelabuhan Utama (Berat bersih : ribu ton), 2008–2012 Volume of Imports by Major Ports (Net weight : thousand tons), 2008–2012 .............................................................. 52814.3.4 Nilai Impor Menurut Pelabuhan Utama (Nilai CIF : juta US$), 2008–2012 Value of Imports by Major Ports (CIF value : million US$), 2008–2012 ..................................................................... 52914.3.5 Impor Menurut Golongan Penggunaan Barang, 1997–2012 Imports by Broad Economic Category, 1997–2012 .......................................................................................................... 53014.3.6 Impor Barang Konsumsi, 1997–2012 Imports of Consumption Goods, 1997–2012 ..................................................................................................................... 53114.3.7 Impor Bahan Baku dan Barang Penolong, 1997–2012 Imports of Raw Materials and Auxilliary Goods, 1997–2012 ........................................................................................ 53214.3.8 Impor Barang Modal, 1997–2012 Imports of Capital Goods, 1997–2012 ............................................................................................................................... 53314.3.9 Impor Beras Menurut Negara Asal Utama, 2008–2012 Imports of Rice by Major Countries of Origin, 2008–2012 ............................................................................................. 53414.3.10 Impor Pupuk Menurut Negara Asal Utama, 2008–2012 Imports of Fertilizers by Major Countries of Origin, 2008–2012 .................................................................................... 53514.3.11 Impor Semen Menurut Negara Asal Utama, 2008–2012 Imports of Cement by Major Countries of Origin, 2008–2012 ....................................................................................... 53614.3.12 Impor Minyak Bumi dan Hasil-Hasilnya Menurut Negara Asal Utama, 2008–2012 Imports of Crude Petroleum and Petroleum Products by Major Countries of Origin, 2008–2012 ............................. 53714.3.13 Impor Pipa Besi dan Baja Menurut Negara Asal Utama, 2008–2012 Imports of Iron and Steel Tubes by Major Countries of Origin, 2008–2012 .................................................................. 53814.3.14 Nilai Impor Kendaraan Bermotor Menurut Negara Asal Utama (Nilai CIF:juta US$), 2008–2012 Import Value of Motor Vehicles by Major Countries of Origin (CIF Value:million US$), 2008–2012 ..................... 53914.3.15 Nilai Impor Perlengkapan Telekomunikasi Menurut Negara Asal Utama (Nilai CIF:juta US$), 2008–2012 Import Value of Telecommunication Equipments by Major Countries of Origin, (CIF Value:million US$), 2008–2012 ............................................................................................................................................................................. 54014.3.16 Impor Mesin Keperluan Industri Tertentu Menurut Negara Asal Utama, 2008–2012 Imports of Machinery for Special Industries by Major Countries of Origin, 2008–2012 ............................................ 541
15. SISTEM NERACA NASIONAL/SYSTEM OF NATIONAL ACCOUNTS
15.1 PENDAPATAN NASIONAL/NATIONAL INCOME15.1.1 Produk Domestik Bruto Atas Dasar Harga Berlaku Menurut Lapangan Usaha (miliar rupiah), 2009–2012 Gross Domestic Product at Current Market Prices by Industrial Origin (billion rupiahs), 2009–2012 .................... 55415.1.2 Produk Domestik Bruto Atas Dasar Harga Konstan 2000 Menurut Lapangan Usaha (miliar rupiah), 2009–2012 Gross Domestic Product at 2000 Constant Market Prices by Industrial Origin (billion rupiahs), 2009–2012 ............................................................................................................................................................................. 55615.1.3 Distribusi Persentase Produk Domestik Bruto Atas Dasar Harga Berlaku Menurut Lapangan Usaha, 2009–2012 Percentage Distribution of Gross Domestic Product at Current Market Prices by Industrial Origin, 2009–2012 ............................................................................................................................................................................. 558
http
://www.b
ps.g
o.id
S t a t i s t i c a l Y e a r b o o k o f I n d o n e s i a 2 0 1 3 xxix
15.1.4 Laju Pertumbuhan Produk Domestik Bruto Atas Dasar Harga Konstan 2000 Menurut Lapangan Usaha (persen), 2009–2012 Growth Rate of Gross Domestic Product at 2000 Constant Market Prices by Industrial Origin (percent), 2009–2012 ........................................................................................................................................................... 56015.1.5 Produk Domestik Bruto Menurut Jenis Pengeluaran, Produk Nasional Bruto, dan Pendapatan Nasional Atas Dasar Harga Berlaku (miliar rupiah), 2009–2012 Gross Domestic Product by Type of Expenditure, Gross National Product, and National Income at Current Market Prices (billion rupiahs), 2009–2012 ....................................................................................................... 56215.1.6 Produk Domestik Bruto Menurut Jenis Pengeluaran, Produk Nasional Bruto, dan Pendapatan Nasional Atas Dasar Harga Konstan 2000 (miliar rupiah), 2009–2012 Gross Domestic Product by Type of Expenditure, Gross National Product, and National Income at 2000 Constant Market Prices (billion rupiahs), 2009–2012 .......................................................................................... 56315.1.7 Distribusi Persentase Produk Domestik Bruto Atas Dasar Harga Berlaku Menurut Jenis Pengeluaran, 2009–2012 Percentage Distribution of Gross Domestic Product at Current Market Prices by Type of Expenditure, 2009–2012 ............................................................................................................................................................................. 56415.1.8 Laju Pertumbuhan Produk Domestik Bruto Atas Dasar Harga Konstan 2000 Menurut Jenis Pengeluaran (persen), 2009–2012 Growth Rate of Gross Domestic Product at 2000 Constant Market Prices by Type of Expenditure (percent), 2009–2012 ........................................................................................................................................................... 56515.1.9 Perkembangan Beberapa Agregat Pendapatan dan Pendapatan per Kapita Atas Dasar Harga Berlaku, 2009–2012 Trend of Several Aggregates on Income and per Capita Income at Current Market Prices, 2009–2012 ............................................................................................................................................................................. 56615.1.10 Perkembangan Beberapa Agregat Pendapatan dan Pendapatan per Kapita Atas Dasar Harga Konstan 2000, 2009–2012 Trend of Several Aggregates on Income and per Capita Income at 2000 Constant Market Prices, 2009–2012 ............................................................................................................................................................................. 56715.1.11 Laju Pertumbuhan Beberapa Agregat Pendapatan dan Pendapatan per Kapita Atas Dasar Harga Konstan 2000 (persen), 2009–2012 Growth Rate of Several Aggregates on Income and per Capita Income at 2000 Constant Market Prices (percent), 2009–2012 ........................................................................................................................................................... 568
15.2 PRODUK DOMESTIK REGIONAL BRUTO/GROSS REGIONAL DOMESTIC PRODUCT15.2.1 Produk Domestik Regional Bruto Atas Dasar Harga Berlaku Menurut Provinsi (miliar rupiah), 2008–2011 Gross Regional Domestic Product at Current Market Prices by Province (billion rupiahs), 2008–2011 ............................................................................................................................................................................. 56915.2.2 Produk Domestik Regional Bruto Atas Dasar Harga Konstan 2000 Menurut Provinsi (miliar rupiah), 2008–2011 Gross Regional Domestic Product at 2000 Constant Market Prices by Province (billion rupiahs), 2008–2011 ............................................................................................................................................................................. 57015.2.3 Produk Domestik Regional Bruto Tanpa Migas Atas Dasar Harga Berlaku Menurut Provinsi (miliar rupiah), 2008–2011 Gross Regional Domestic Product Without Oil and Gas at Current Market Prices by Province (billion rupiahs), 2008–2011 .............................................................................................................................................. 57115.2.4 Produk Domestik Regional Bruto Tanpa Migas Atas Dasar Harga Konstan 2000 Menurut Provinsi (miliar rupiah), 2008–2011 Gross Regional Domestic Product Without Oil and Gas at 2000 Constant Market Prices by Province (billion rupiahs), 2008–2011 .............................................................................................................................................. 572
http
://www.b
ps.g
o.id

S t a t i s t i k I n d o n e s i a 2 0 1 3xxx
15.2.5 Distribusi Persentase Produk Domestik Regional Bruto Atas Dasar Harga Berlaku Menurut Provinsi, 2008–2011 Percentage Distribution of Gross Regional Domestic Product at Current Market Prices by Province, 2008–2011 ............................................................................................................................................................................. 57315.2.6 Laju Pertumbuhan Produk Domestik Regional Bruto Atas Dasar Harga Konstan 2000 Menurut Provinsi (persen), 2008–2011 Growth Rate of Gross Regional Domestic Product at 2000 Constant Market Prices by Province (percent), 2008–2011 ........................................................................................................................................................... 57415.2.7 Produk Domestik Regional Bruto per Kapita Atas Dasar Harga Berlaku Menurut Provinsi (ribu rupiah), 2008–2011 Per Capita Gross Regional Domestic Product at Current Market Prices by Province (thousand rupiahs), 2008–2011 ......................................................................................................................................... 57515.2.8 Produk Domestik Regional Bruto per Kapita Atas Dasar Harga Konstan 2000 Menurut Provinsi (ribu rupiah), 2008–2011 Per Capita Gross Regional Domestic Product at 2000 Constant Market Prices by Province (thousand rupiahs), 2008–2011 ........................................................................................................................................ 57615.2.9 Produk Domestik Regional Bruto Tanpa Migas per Kapita Atas Dasar Harga Berlaku Menurut Provinsi (ribu rupiah), 2008–2011 Per Capita Gross Regional Domestic Product Without Oil and Gas at Current Market Prices by Province (thousand rupiahs), 2008–2011 .................................................................................................................... 57715.2.10 Produk Domestik Regional Bruto Tanpa Migas per Kapita Atas Dasar Harga Konstan 2000 Menurut Provinsi (ribu rupiah), 2008–2011 Per Capita Gross Regional Domestic Product Without Oil and Gas at 2000 Constant Market Prices by Province (thousand rupiahs), 2008–2011 .................................................................................................................... 57815.2.11 Laju Pertumbuhan Produk Domestik Regional Bruto per Kapita Atas Dasar Harga Konstan 2000 Menurut Provinsi (persen), 2008–2011 Growth Rate of per Capita Gross Regional Domestic Product at 2000 Constant Market Prices by Province (percent), 2008–2011 ...................................................................................................................................... 579
15.3. TABEL INPUT-OUTPUT/INPUT-OUTPUT TABLE15.3.1 Transaksi Total Atas Dasar Harga Pembeli 9 Sektor Ekonomi (miliar rupiah), 2005 Total Transaction at Purchaser’s Prices of 9 Economic Sectors (billion rupiahs), 2005 ................................................ 58015.3.2 Transaksi Total Atas Dasar Harga Produsen 9 Sektor Ekonomi (miliar rupiah), 2005 Total Transaction at Producer’s Prices of 9 Economic Sectors (billion rupiahs), 2005 .................................................. 58215.3.3 Transaksi Domestik Atas Dasar Harga Produsen 9 Sektor Ekonomi (miliar rupiah), 2005 Domestic Transaction at Producer’s Prices of 9 Economic Sectors (billion rupiahs), 2005 ........................................... 58415.3.4 Struktur Nilai Tambah Bruto (NTB) Menurut Sektor Ekonomi, 1995, 2000, dan 2005 Structure of Gross Value Added by Economic Sectors, 1995, 2000, and 2005 ............................................................... 58615.3.5 Struktur Output Menurut Sektor Ekonomi, 1995, 2000, dan 2005 Structure of Output by Economic Sectors, 1995, 2000, and 2005 ................................................................................... 58715.3.6 Indeks Daya Penyebaran dan Indeks Derajat Kepekaan Menurut Sektor Ekonomi, 1995, 2000, dan 2005 Backward and Forward Linkage by Economic Sectors, 1995, 2000, and 2005 ............................................................. 588
15.4 SISTEM NERACA SOSIAL EKONOMI/SOCIAL ACCOUNTING MATRIX15.4.1 Upah dan Gaji Menurut Klasifikasi Tenaga Kerja (miliar rupiah), 2000, 2005, dan 2008 Wages and Salaries by Worker Classifications (billion rupiahs), 2000, 2005, and 2008 ............................................. 589
http
://www.b
ps.g
o.id

S t a t i s t i c a l Y e a r b o o k o f I n d o n e s i a 2 0 1 3 xxxi
15.4.2 Rata-Rata Upah dan Gaji per Ekuivalen Tenaga Kerja (ETK) Menurut Klasifikasi Tenaga Kerja (ribu rupiah), 2000, 2005, dan 2008 Average of Wages and Salaries per Worker Equivalents by Worker Classifications (thousand rupiahs), 2000, 2005, and 2008 ........................................................................................................................................................... 59015.4.3 Nilai Upah dan Gaji Menurut Golongan Rumah Tangga (miliar rupiah), 2000, 2005, dan 2008 Value of Wages and Salaries by Household Groups (billion rupiahs), 2000, 2005, and 2008 .................................... . 59115.4.4 Rata-Rata Upah dan Gaji per Kapita Menurut Golongan Rumah Tangga (ribu rupiah), 2000, 2005, dan 2008 Average of per Capita Wages and Salaries by Household Groups (thousand rupiahs), 2000, 2005, and 2008 ........ 59215.4.5 Nilai Pendapatan Kapital Menurut Golongan Rumah Tangga (miliar rupiah), 2000, 2005, dan 2008 Value of Capital Income by Household Groups (billion rupiahs), 2000, 2005, and 2008 ........................................... 59315.4.6 Rata-Rata Pendapatan Kapital per Kapita Menurut Golongan Rumah Tangga (ribu rupiah), 2000, 2005, dan 2008 Average of per Capita Capital Income by Household Groups (thousand rupiahs), 2000, 2005, and 2008 ................ 59415.4.7 Jumlah Pendapatan Setelah Pajak Menurut Golongan Rumah Tangga (miliar rupiah), 2000, 2005, dan 2008 Total Income After Taxes by Household Groups (billion rupiahs), 2000, 2005, and 2008 ......................................... 59515.4.8 Rata-Rata Pendapatan Setelah Pajak per Kapita Menurut Golongan Rumah Tangga (ribu rupiah), 2000, 2005, dan 2008 Average of per Capita Income After Taxes by Household Groups (thousand rupiahs), 2000, 2005, and 2008 ........ 59615.4.9 Jumlah Pendapatan Menurut Golongan Rumah Tangga (miliar rupiah), 2000, 2005, dan 2008 Total Income by Household Groups (billion rupiahs), 2000, 2005, and 2008 .............................................................. 59715.4.10 Rata-Rata Jumlah Pendapatan per Kapita Menurut Golongan Rumah Tangga (ribu rupiah), 2000, 2005, dan 2008 Average of per Capita Total Income by Household Groups (thousand rupiahs), 2000, 2005, and 2008 ................... 59815.4.11 Nilai Pengeluaran Konsumsi Menurut Golongan Rumah Tangga (miliar rupiah), 2000, 2005, dan 2008 Value of Consumption Expenditure by Household Groups (billion rupiahs), 2000, 2005, and 2008 ........................ 59915.4.12 Rata-Rata Pengeluaran Konsumsi per Kapita Menurut Golongan Rumah Tangga (ribu rupiah), 2000, 2005, dan 2008 Average of per Capita Consumption Expenditure by Household Groups (thousand rupiahs), 2000, 2005, and 2008 ........................................................................................................................................................... 60015.4.13 Nilai Pendapatan Disposabel Menurut Golongan Rumah Tangga (miliar rupiah), 2000, 2005, dan 2008 Value of Disposable Income by Household Groups (billion rupiahs), 2000, 2005, and 2008 ...................................... 60115.4.14 Rata-Rata Pendapatan Disposabel per Kapita Menurut Golongan Rumah Tangga (ribu rupiah), 2000, 2005, dan 2008 Average of per Capita Disposable Income by Household Groups (thousand rupiahs), 2000, 2005, and 2008 ......... 602
15.5 NERACA ARUS DANA/FLOW OF FUNDS ACCOUNTS15.5.1 Tabungan Bruto Domestik, Investasi Nonfinansial, dan Tabungan Luar Negeri Triwulanan (triliun rupiah), 2007–2012 Quarterly Gross Domestic Saving, Non-Financial Investment, and Rest of the World Saving (trillion rupiahs), 2007–2012 .............................................................................................................................................. 60315.5.2 Tabungan Bruto, Investasi Nonfinansial, dan Pinjaman Neto Triwulanan Sektor Bank Sentral (miliar rupiah), 2007–2012 Quarterly Gross Saving, Non-Financial Investment, and Net Lending of Central Bank Sector (billion rupiahs), 2007–2012 .............................................................................................................................................. 604
http
://www.b
ps.g
o.id
S t a t i s t i k I n d o n e s i a 2 0 1 3xxxii
15.5.3 Tabungan Bruto, Investasi Nonfinansial, dan Pinjaman Neto Triwulanan Sektor Bank (miliar rupiah), 2007–2012 Quarterly Gross Saving, Non-Financial Investment, and Net Lending of Bank Sector (billion rupiahs), 2007–2012 .............................................................................................................................................. 60515.5.4 Tabungan Bruto, Investasi Nonfinansial, dan Pinjaman Neto Triwulanan Sektor Pemerintahan Umum (triliun rupiah), 2007–2012 Quarterly Gross Saving, Non-Financial Investment, and Net Lending of General Government Sector (trillion rupiahs), 2007–2012 .............................................................................................................................................. 60615.5.5 Tabungan Bruto, Investasi Nonfinansial, dan Pinjaman Neto Triwulanan Sektor Domestik Lain (triliun rupiah), 2007–2012 Quarterly Gross Saving, Non-Financial Investment, and Net Lending of Other Domestic Sectors (trillion rupiahs), 2007–2012 .............................................................................................................................................. 60715.5.6 Tabungan Bruto Menurut Sektor (triliun rupiah), 2007–2012 Gross Saving by Sectors (trillion rupiahs), 2007–2012 .................................................................................................... 60815.5.7 Investasi Nonfinansial Menurut Sektor (triliun rupiah), 2007–2012 Non-Financial Investment by Sectors (trillion rupiahs), 2007–2012 .............................................................................. 60915.5.8 Pinjaman Neto Menurut Sektor (triliun rupiah), 2007–2012 Net Lending by Sectors (trillion rupiahs), 2007–2012 ..................................................................................................... 610
16. PERBANDINGAN INTERNASIONAL/INTERNATIONAL COMPARISON
16.1 Perkiraan Penduduk Beberapa Negara (juta), 2008–2012 Estimated Population of Selected Countries (million), 2008–2012 ................................................................................ 61416.2 Kepadatan Penduduk Beberapa Negara (penduduk per km2), 2008–2012 Population Density of Selected Countries (people per sq.km), 2008–2012 .................................................................... 61516.3 Angka Harapan Hidup Penduduk Beberapa Negara (tahun), 1995–2015 Life Expectancy of Population of Selected Countries (years), 1995–2015 ..................................................................... 61616.4 Tingkat Pengangguran Beberapa Negara (persen), 2008–2012 Unemployment Rate of Selected Countries (percent), 2008–2012 ................................................................................. 61716.5 Laju Pertumbuhan Produk Domestik Bruto Beberapa Negara Menurut Harga Konstan (persen), 2008–2012 Growth Rate of Gross Domestic Product of Selected Countries at Constant Market Prices (percent), 2008–2012 ............................................................................................................................................................................. 61816.6 Laju Pertumbuhan Produk Domestik Bruto per Kapita Beberapa Negara Menurut Harga Konstan (persen), 2008–2012 Growth Rate of per Capita Gross Domestic Product of Selected Countries at Constant Market Prices (percent), 2008–2012 ........................................................................................................................................................... 61916.7 Rata-Rata Produksi Minyak Mentah per Bulan Beberapa Negara (ribu metrik ton), 2008–2012 Monthly Average of Crude Petroleum Production of Selected Countries (thousand metric ton), 2008–2012 ............................................................................................................................................................................. 62016.8 Indeks Harga Konsumen Beberapa Negara (2005=100), 2009–2012 Consumer Price Indices of Selected Countries (2005=100), 2009–2012 ...................................................................... 62116.9 Neraca Perdagangan Beberapa Negara (juta US$), 2008–2012 Balance of Trade of Selected Countries (million US$), 2008–2012 ................................................................................ 622
http
://www.b
ps.g
o.id

S t a t i s t i c a l Y e a r b o o k o f I n d o n e s i a 2 0 1 3 xxxiii
PENJELASAN UMUM/EXPLANATORY NOTES
Tanda-tanda, satuan-satuan, dan lain-lainnya yang digunakan dalam publikasi ini adalah sebagai berikut: Symbols, measurement units, and acronyms which are used in this publication, are as follows:
1. TANDA-TANDA/SYMBOLS
Data tidak tersedia/Data not available ...................................................... : ...Tidak ada atau nol /Null or zero ................................................................. : –Data dapat diabaikan/Data negligible ....................................................... : 0Tanda decimal/Decimal point ..................................................................... : ,Data tidak dapat ditampilkan/Not applicable .......................................... : NA
2. SATUAN/UNITS
barel/barrel ..................................................................................................... : 158,99 liter/litres = 1/6,2898 m3
hektar (ha)/hectare (ha) .............................................................................. : 10 000 m2
kilometer (km)/kilometres (km) ................................................................ : 1 000 meter/meters (m)knot/knot ........................................................................................................ : 1,8523 km/jam (km/hour)kuintal/quintal ............................................................................................... : 100 kgKWh ................................................................................................................ : 1 000 Watt hourMWh ............................................................................................................... : 1 000 KWhliter (untuk beras)/litre ( for rice) ............................................................... : 0,80 kgMMSCF .......................................................................................................... : 1/35,3 m3
metrik ton (m.ton)/metric ton (m. ton) ..................................................... : 0,98421 long ton = 1 000 kgons/ounce ........................................................................................................ : 28,31 gram/gramston .................................................................................................................... : 1 000 kg
Satuan lain: buah, dus, butir, helai/lembar, kaleng, batang, pulsa, ton kilometer (ton-km), jam, menit, persen (%). Other units: unit, pack, pieces, sheet, tin, pulse, ton-kilometres(ton-km), hour, minute, percent (%).
Perbedaan angka di belakang koma disebabkan oleh pembulatan angka. The difference in decimal numbers is caused by rounding.
http
://www.b
ps.g
o.id

S t a t i s t i k I n d o n e s i a 2 0 1 3xxxiv
3. SINGKATAN/ABBREVIATION
ADB : Asian Development BankAIDS : Acquired Immunodeficiency SyndromeAPBD : Anggaran Pendapatan dan Belanja Daerah Local Government BudgetAPBN : Anggaran Pendapatan dan Belanja Negara Central Government BudgetASEAN : Association of South East Asia NationBBM : Bahan Bakar Minyak OilBI : Bank Indonesia Bank of IndonesiaBKN : Badan Kepegawaian Negara State Personnel BoardBKPM : Badan Koordinasi Penanaman Modal Investment Coordinating BoardBMKG : Badan Meteorologi, Klimatologi dan Geofisika Meteorological, Climatology, and Geophysical AgencyBPIH : Biaya Penyelenggaraan Ibadah Haji Pilgrimage Coordination CostBPPBM : Biaya Produksi dan Penambahan Barang Modal Production Cost and Capital FormationBUMN : Badan Usaha Milik Negara State Owned Enterprise (SOE)BUS : Bank Umum Syariah Sharia Commercial BankCIF : Cost Insurance and FreightDAU : Dana Alokasi Umum General Allocation FundDBD : Demam Berdarah Dengue Dengue Haemorrhagic FeverDPD : Dewan Perwakilan Daerah Regional Representative CouncilDPR : Dewan Perwakilan Rakyat House of RepresentativeEIB : European Investment Bank IndonesiaETK : Ekivalen Tenaga Kerja Worker EquivalentFAO : Food Agriculture OrganizationFOB : Free on BoardFWA : Fixed Wireles AccessGBHN : Garis-Garis Besar Haluan Negara National Development GuidelinesGKG : Gabah Kering Giling Dry Unhusked RiceGKP : Gabah Kering Panen Dried Harvested GrainHIV : Human Immunodeficiency VirusHPP : Harga Pembelian Pemerintah Government Purchasing PriceIBRD : International Bank for Reconstruction and DevelopmentIDA : International Development AssociationIDB : Islamic Development BankIFAD : International Fund for Agricultural DevelopmentIHPB : Indeks Harga Perdagangan Besar Wholesale Price IndexIHK : Indeks Harga Konsumen Consumer Price Index (CPI)IHP : Indeks Harga Perdesaan Rural Price IndiciesIHSG : Indeks Harga Saham Gabungan Composite Stock Price IndiciesILO : International Labor OrganizationIMF : International Monetary FundIMK : Industri Mikro Kecil Micro and Small Scale IndustryIUOTO : International Union of Office Travel OrganizationJamsostek : Jaminan Sosial Tenaga Kerja Worker Social InsuranceKB : Keluarga Berencana Family Planning
http
://www.b
ps.g
o.id
S t a t i s t i c a l Y e a r b o o k o f I n d o n e s i a 2 0 1 3 xxxv
KBLI : Klasifikasi Baku Lapangan Usaha Indonesia Indonesia Standard Industrial Classification (ISIC)KC : Kantor Cabang Branch OfficeKCP : Kantor Cabang Pembantu Sub Branch OfficeKCD : Kepala Cabang Dinas Chief of Subdistrict Branch AgencyKILM : Key Indicators of the Labor Market KNLH : Kementerian Negara Lingkungan Hidup Ministry of EnvironmentKPKN : Kontor Perbendaharaan dan Kas Negara Government Treasury Offices and Commercial BankKP3 : Kesatuan Pelaksanaan Pengamanan Pelabuhan Unity of Port Security ImplementationKUA : Kantor Urusan Agama The Religious Affairs OfficeMI : Madrasah Ibtidaiyah Islamic Primary SchoolMigas : Minyak dan gas Oil and gasMTs : Madrasah Tsanawiyah Islamic Junior High SchoolMA : Madrasah Aliyah Islamic Senior High SchoolNAD : Neraca Arus Dana Flow of Fund AccountsNAFTA : North America Free Trade AreaNBM : Neraca Bahan Makanan Food Balance Sheet NIB : Nordic Investment Bank Indonesia NIEs : Newly Industrializing Economies NTN : Nilai Tukar Petani Subsektor Perikanan Fishery Farmer Terms of TradeNTP : Nilai Tukar Petani Farmer Terms of TradeNTPH : Nilai Tukar Petani Subsektor Hortikultura Horticulture Farmer Terms of TradeNTPP : Nilai Tukar Petani Subsektor Tanaman Pangan Food Crops Farmer Terms of TradeNTPR : Nilai Tukar Petani Subsektor Perkebunan Rakyat Estate Crops Farmer Terms of TradeNTPT : Nilai Tukar Petani Subsektor Peternakan Animal Husbandry Farmer Terms of TradeODA : Official Development Asistance ONH : Ongkos Naik Haji Expenses for Pilgrimage to MeccaPAM : Perusahaan Air Minum Water Supply CompanyPDB : Produk Domestik Bruto Gross Domestic Product (GDP)PDRB : Produk Domestik Regional Bruto Gross Regional Domestic Product (GRDP) PEB : Pemberitahuan Ekspor Barang Export DeclarationPertamina : Perusahaan Pertambangan Minyak dan State Oil and Natural Gas Company Gas Bumi Negara Perumnas : Perumahan Nasional National Housing CorporationPIB : Pemberitahuan Impor Barang Import DeclarationPLN : Perusahaan Listrik Negara State Electricity CorporationPMA : Penanaman Modal Asing Foreign InvestmentPMDN : Penanaman Modal Dalam Negeri Domestic InvestmentPNB : Produk Nasional Bruto Gross National Product (GNP)PNS : Pegawai Negeri Sipil Civil ServantPodes : Potensi Desa Village Potential CensusPolri : Kepolisian Republik Indonesia Indonesian National PolicePSTN : Public Switched Telephone NetworkPuskesmas : Pusat Kesehatan Masyarakat Public Health CentreRPH : Rumah Pemotongan Hewan Slaughtering HouseRS : Rumah Sederhana Simple HouseRSH : Rumah Siap Huni Ready to Occupy HouseRSS : Rumah Sangat Sederhana Very Simple House
http
://www.b
ps.g
o.id

S t a t i s t i k I n d o n e s i a 2 0 1 3xxxvi
Sakernas : Survei Angkatan Kerja Nasional National Labor Force SurveySAR : Special Administrative RegionSBH : Survei Biaya Hidup Cost of Living Survey (CLS)SDR : Special Drawing Right SEARO : South East Asia Region Office SHU : Sisa Hasil Usaha Net ProfitSITC : Standard International Trade Code SNSE : Sistem Necara Sosial Ekonomi Social Accounting Matrix (SAM) SP : Sensus Penduduk Population CensusSST : Satuan Sambungan Telepon Telephone Connection UnitsSUB : Survei Upah Buruh Wage SurveySupas : Survei Penduduk Antarsensus Intercensal Population SurveySusenas : Survei Sosial Ekonomi Nasional National Socio Economic SurveyTBM : Tanaman Bahan Makanan Food CropsTHR : Tunjangan Hari Raya Incentive for “Lebaran” dayTKHI : Tim Kesehatan Haji Indonesia Medical Team of Indonesia Pilgrim Counselor TKI : Tenaga Kerja Indonesia Indonesian Overseas WorkersTNI : Tentara Nasional Indonesia Indonesian National Defense ForceTPAK : Tingkat Partisipasi Angkatan Kerja Labor Force Participation Rate (LFPR)TPH : Tim Pembimbing Haji Indonesia Team of Indonesia Moslem Pilgrim CounselorTPR : Tanaman Perkebunan Rakyat Plantation CropsTPT : Tingkat Pengangguran Terbuka Unemployment Rate (UR)UMP : Upah Minimum Provinsi Provincial Minimum WageUSA : United States of AmericaWHO : World Health OrganizationWTO : World Tourism OrganizationWIB : Waktu Indonesia Barat Western Indonesian Time (GMT+7)
http
://www.b
ps.g
o.id

K E Y S T A T I S T I C S
S t a t i s t i c a l Y e a r b o o k o f I n d o n e s i a 2 0 1 3 1
Statistik Kunci, 2003–2012Key Statistics, 2003–2012
Rincian/Description Satuan/Unit 2003 2004 2005 2006 2007
(1) (2) (3) (4) (5) (6) (7)
SOSIAL/SOCIALPenduduk1/Population 1 juta/million 213,6 216,4 219,8 222,7 225,6
Laju Pertumbuhan Penduduk1/Population Growth 1 % 1,34 1,33 1,32 1,30 1,28
Angka Kelahiran Total-AKT1/Total Fertility Rate-TFR anak/child 2,3 2,3 2,2 2,2 2,18
Angka Kematian Bayi-AKB (per 1000 kelahiran hidup) 1 bayi 35,5 33,9 28,9 28,2 27,5
Infant Mortality Rate-IMR (per 1000 life births) 1 infant
Angka Harapan Hidup1-e0/Life Expectancy Rate 1 tahun/years 68,2 68,6 70,0 70,2 70,4
Angka Melek Huruf Usia 15+/Literacy Rate Aged 15+ % 89,8 90,4 90,9 91,5 91,9
Tingkat Partisipasi Angkatan Kerja -TPAK 3
Labour Force Participation Rate-LFPR 3% 67,9 67,6 66,8 66,2 67,0
Tingkat Pengangguran Terbuka-TPT 3 % 9,7 9,9 11,2 10,3 9,1
Unemployment Rate-UR 3
Penduduk Miskin/Poor People 4 juta/million 37,3 36,1 35,1 39,3 37,2
Persentase Penduduk Miskin 4
Percentage of Poor People 4
% 17,42 16,66 15,97 17,75 16,58
Indeks Pembangunan Manusia-IPM -- ... 68,7 69,6 70,1 70,6
Human Development Index
EKONOMI/ECONOMIC
Produk Domestik Bruto (PDB) Harga Berlaku triliun rupiah 2 013,7 2 295,8 2 774,3 3 339,2 3 950,9
Gross Domestic Bruto (GDP) at Current Price trillion rupiahsLaju Pertumbuhan Ekonomi/Economic Growth % 4,8 5,0 5,7 5,5 6,3
PDB Per Kapita Harga Berlaku5 juta rupiah 9,4 10,6 12,7 15,0 17,4
Per Capita of GDP at Current Price5 million rupiahsInflasi/Inflation (y-o-y) % 5,1 6 6,4 7 17,1 7 6,6 7 6,6 7
Ekspor/Export miliar/billion US$ 61,1 71,6 85,7 100,8 114,1
Impor/Import miliar/billion US$ 32,6 46,5 57,7 61,1 74,5
Wisatawan Asing/Foreign Tourists juta/million 4,5 5,3 5,0 4,9 5,5
Uang Beredar Luas (M2) triliun rupiah 955,7 1 033,5 1 203,2 1 382,5 1 649,7
Broad Money trillion rupiahsPosisi Cadangan Devisa/Reserve Asset Position miliar/billion US$ 36,3 36,3 34,7 42,6 56,9
Realisasi Penanaman Modal Dalam Negeri-PMDN triliun rupiah 12,2 15,4 30,7 20,8 34,9
Realization of Domestic Investment trillion rupiahsRealisasi Penanaman Modal Asing-PMA miliar/billion US$ 5,4 4,6 8,9 6,0 10,3
Realization of Foreign Investment
Suku Bunga Sertifikat Bank Indonesia (1 bulan) 9 % 8,3 7,4 12,8 9,8 8,0
Interest Rate of Bank Indonesia Certificate (1 month) 9
Kurs Tengah US$/Middle Rates of US$ rupiah/rupiahs 8 465 9 290 9 830 9 020 9 419
Indeks Harga Saham Gabungan (IHSG) -- 679,3 1 000,2 1 162,6 1 805,5 2 745,8
Composite Stocks Price Index (CSPI)
http
://www.b
ps.g
o.id

S T A T I S T I K K U N C I
S t a t i s t i k I n d o n e s i a 2 0 1 32
Rincian/Description Satuan/Unit 2008 2009 2010 2011 2012
(1) (2) (8) (9) (10) (11) (12)SOSIAL/SOCIAL
Penduduk1/Population 1 juta/million 228,5 231,4 238,5 r 241,0 244,2Laju Pertumbuhan Penduduk1/Population Growth 1 % 1,25 1,22 1,32 r 1,32 1,31Angka Kelahiran Total-AKT1/Total Fertility Rate-TFR anak/child 2,17 2,16 2,39 r 2,37 2,35Angka Kematian Bayi-AKB (per 1000 kelahiran hidup) 1 bayi 26,8 26,2 28,0 r 27,7 27,4Infant Mortality Rate-IMR (per 1000 life births) 1 infantAngka Harapan Hidup1-e0/Life Expectancy Rate 1 tahun/years 70,5 70,7 70,2 r 70,3 70,3Angka Melek Huruf Usia 15+/Literacy Rate Aged 15+ % 92,2 92,6 92,9 92,8 93,4 2
Tingkat Partisipasi Angkatan Kerja -TPAK 3 % 67,2 67,2 67,7 68,3 67,9Labour Force Participation Rate-LFPR 3
Tingkat Pengangguran Terbuka-TPT 3 % 8,4 7,9 7,1 6,6 6,1Unemployment Rate-UR 3
Penduduk Miskin/Poor People 4 juta/million 35,0 32,5 31,0 30,0 29,1 Persentase Penduduk Miskin 4 % 15,42 14,15 13,3 12,5 12,0 Percentage of Poor People 4
Indeks Pembangunan Manusia-IPM – 71,2 71,8 72,3 72,8 ...Human Development Index
EKONOMI/ECONOMICProduk Domestik Bruto (PDB) Harga Berlaku triliun rupiah 4 948,7 5 606,2 6 446,9 7 422,8 x 8 241,9 xx
Gross Domestic Bruto (GDP) at Current Price trillion rupiahsLaju Pertumbuhan Ekonomi/Economic Growth % 6,0 4,6 6,2 6,5 x 6,2 xx
PDB Per Kapita Harga Berlaku5 juta rupiah 21,4 23,9 27,0 30,8 x 33,7 xx
Per Capita of GDP at Current Price5 million rupiahsInflasi/Inflation (y-o-y) % 11,1 8 2,8 8 7,0 8 3,8 8 4,3 8
Ekspor/Export miliar/billion US$ 137,0 116,5 157,8 203,5 190,0 Impor/Import miliar/billion US$ 129,2 96,8 135,7 177,4 191,7 Wisatawan Asing/Foreign Tourists juta/million 6,2 6,3 7,0 7,6 8,0 Uang Beredar Luas (M2) triliun rupiah 1 895,8 2 141,4 2 471,2 2 877,2 3 304,6 Broad Money trillion rupiahsPosisi Cadangan Devisa/Reserve Asset Position miliar/billion US$ 51,6 66,1 96,2 110,1 112,8 Realisasi Penanaman Modal Dalam Negeri-PMDN triliun rupiah 20,4 37,8 60,6 76,0 92,2Realization of Domestic Investment trillion rupiahsRealisasi Penanaman Modal Asing-PMA miliar/billion US$ 14,9 10,8 16,2 19,5 24,6Realization of Foreign InvestmentSuku Bunga Sertifikat Bank Indonesia (1 bulan) 9 % 10,8 6,5 6,6 5,0 4,8 Interest Rate of Bank Indonesia Certificate (1 month) 9
Kurs Tengah US$/Middle Rates of US$ rupiah/rupiahs 10 950 9 400 8 991 9 068 9 670 Indeks Harga Saham Gabungan (IHSG) – 1 355,4 2 534,4 3 703,5 3 822,0 r 4 316,7 Composite Stocks Price Index (CSPI)
Catatan/Notes: r Angka diperbaiki/Revised figures x Angka sementara/Preliminary figure xx Angka sangat sementara/Very preliminary figure 1 Sebelum 2005: proyeksi penduduk berdasarkan hasil SP2000; 2005–2009: berdasarkan hasil SUPAS 2005; mulai 2010: estimasi hasil SP2010 Before 2005: population projection based on SP2000; 2005–2009: based on SUPAS 2005; since 2010: estimation based on SP2010 result 2 Data Susenas triwulan III-2012/ Data susenas quarter III-2012 3 Kondisi Agustus kecuali 2005 (November)/Condition at August except 2005 (November) 4 Tahun 2003–2005 kondisi Februari, mulai 2006 kondisi Maret/Years 2003–2005 condition at February, since 2006 condition at March 5 Mulai 2009 menggunakan data penduduk hasil estimasi SP2010/Since 2009 using estimation based on 2010 Population Census result
6 IHK 44 kota (1996 = 100)/CPI 44 cities (1996 = 100) 7 IHK 45 kota (2002 = 100)/CPI 45 cities (2002 = 100) 8 IHK 66 kota (2007 = 100)/CPI 66 cities (2007 = 100) 9 Mulai 2010: menggunakan SBI 9 bulan/Since 2010: using SBI 9 month
Lanjutan Statistik Kunci/Continued Key Statistics
http
://www.b
ps.g
o.id
1GEOGRAFI DAN IKLIMGeography and Climate
http
://www.b
ps.g
o.id

http
://www.b
ps.g
o.id

G E O G R A P H Y A N D C L I M A T E
S t a t i s t i c a l Y e a r b o o k o f I n d o n e s i a 2 0 1 3 5
PENJELASAN TEKNIS
1. Secara astronomis Indonesia terletak antara 60 08’ Lintang Utara dan 110 15’ Lintang Selatan dan antara 940 45’−1410 05’ Bujur Timur dan dilalui oleh garis ekuator atau garis khatulistiwa yang terletak pada garis lintang 00.
2. Berdasarkan posisi geografisnya, negara Indonesia memiliki batas-batas: Utara - Negara Malaysia, Singapura, Filipina, dan Laut Cina Selatan; Selatan - Negara Australia dan Samudera Hindia; Barat - Samudera Hindia; Timur - Negara Papua Nugini, Timor Leste, dan Samudera Pasifik.
3. Berdasarkan letak geografisnya, kepulauan Indonesia berada di antara Benua Asia dan Benua Australia, serta di antara Samudera Hindia dan Samudera Pasifik.
4. Indonesia terdiri dari 33 provinsi yang terletak di lima pulau besar dan empat kepulauan, yaitu:
- Pulau Sumatera: Aceh, Sumatera Utara, Sumatera Barat, Riau, Jambi, Sumatera Selatan, Bengkulu, dan Lampung.
- Kepulauan Riau: Kepulauan Riau.
- Kepulauan Bangka Belitung: Kepulauan Bangka Belitung.
- Pulau Jawa: DKI Jakarta, Jawa Barat, Banten, Jawa Tengah, DI Yogyakarta, dan Jawa Timur.
- Kepulauan Nusa Tenggara (Sunda Kecil): Bali, Nusa Tenggara Barat, dan Nusa Tenggara Timur.
- Pulau Kalimantan: Kalimantan Barat, Kaliman-tan Tengah, Kalimantan Selatan, dan Kalimantan Timur.
- Pulau Sulawesi: Sulawesi Utara, Gorontalo, Su-lawesi Tengah, Sulawesi Selatan, Sulawesi Barat, dan Sulawesi Tenggara.
- Kepulauan Maluku: Maluku dan Maluku Utara.
- Pulau Papua: Papua dan Papua Barat.
TECHNICAL NOTES
1. Astronomically, Indonesia is located between 60 08’ North latitude and 110 15’ South latitude, and between 940 45’ and 1410 05’ East longitude and lies on equator line located at 00 latitude line.
2. In terms of geographic position, Indonesia has boundaries as follows: North - Malaysia, Singapore, Philippines, and South China Sea; South - Australia and Indian Ocean; West - Indian Ocean; East - Papua New Gunea, Timor Leste, and Pasific Ocean.
3. In terms of geographic location, Indonesia is located between Asian Continent and Australian Continent, and between Indian Ocean and Pasific Ocean.
4. Indonesia has 33 provinces spreading over five main islands and four archipelago. These include:
- Sumatera Island: Aceh, Sumatera Utara, Sumatera Barat, Riau, Jambi, Sumatera Selatan, Bengkulu, and Lampung.
- Riau Archipelago: Kepulauan Riau.
- Bangka Belitung Archipelago: Kepulauan Bangka Belitung.
- Jawa Island: DKI Jakarta, Jawa Barat, Banten, Jawa Tengah, DI Yogyakarta, and Jawa Timur.
- Nusa Tenggara Archipelago (Sunda Kecil): Bali, Nusa Tenggara Barat, and Nusa Tenggara Timur.
- Kalimantan Island: Kalimantan Barat, Kalimantan Tengah, Kalimantan Selatan, and Kalimantan Timur.
- Sulawesi Island: Sulawesi Utara, Gorontalo, Sulawesi Tengah, Sulawesi Selatan, Sulawesi Barat, and Sulawesi Tenggara.
- Maluku Archipelago: Maluku and Maluku Utara.
- Papua Island: Papua and Papua Barat.
http
://www.b
ps.g
o.id

G E O G R A F I D A N I K L I M
S t a t i s t i k I n d o n e s i a 2 0 1 36
5. Badan Pusat Statistik (BPS) telah melakukan pendataan Potensi Desa (Podes) sejak tahun 1980. Dalam kurun waktu 10 tahun, pengumpulan data Podes dilakukan 3 kali, yaitu menjelang penyelenggaraan Sensus Penduduk, Sensus Pertanian, dan Sensus Ekonomi. Pada dekade 1990–2003 pengumpulan data Podes dilakukan bersamaan dengan penyelenggaraan sensus, selain itu pada tahun 1994 dan 1995 pernah dilakukan berkenaan dengan program Inpres Desa Tertinggal (IDT). Sejak tahun 2008 kegiatan pendataan Podes dilaksanakan secara independen terlepas dari kegiatan sensus, kecuali adanya pertanyaan-pertanyaan terkait persiapan suatu sensus yang dikemas dalam kuesioner modul.
6. Sejak tahun 2008, pendataan Podes mengalami perubahan dengan adanya penambahan kuesioner suplemen kecamatan dan kabupaten/kota. Penambahan kuesioner tersebut bertujuan untuk meningkatkan manfaat data Podes bagi para konsumen data dan pemerintah daerah dalam perencanaan pembangunan wilayah.
7. Data Podes merupakan satu-satunya sumber data kewilayahan yang muatannya beragam dan memberi gambaran tentang situasi pembangunan suatu wilayah (regional). Ini berbeda dengan data dari hasil pendekatan rumah tangga yang lebih menekankan pada dimensi aktivitas sektoral. Keduanya sama penting dan menjadi kekayaan BPS.
8. Cakupan Wilayah Pencacahan Podes dilakukan terhadap seluruh
wilayah administrasi setingkat desa/kelurahan seperti nagari dan lainnya di seluruh Indonesia, termasuk Unit Permukiman Transmigrasi (UPT) dan Satuan Permukiman Transmigrasi (SPT) yang masih dibina oleh kementerian terkait. Berdasarkan hasil Podes 2011 ada sebanyak 78.609 wilayah setingkat desa, yang tersebar di 497 kabupaten/kota.
9. Metode Pengumpulan Data Pengumpulan data Podes dilakukan dengan cara
sensus (complete enumeration). Pencacahan dilakukan melalui wawancara langsung oleh petugas pencacah (PCL) terhadap kepala desa/lurah, staf yang ditunjuk, atau nara sumber lain yang relevan.
5. BPS-Statistics Indonesia has already recorded village potential (Podes) data since 1980. Within one decade, the activity of Podes data collection is carried out prior to three census activities: Population Census, Agricultural Census, and Economic Census. With respect to the implementation of IDT program (geographic poverty targeting) the collection of Podes data was ever carried out in 1994 and 1995. Since 2008 Podes has been carried out independently from the implementation of census activities, except for some variables that related to preparation of census in modul questionnaire.
6. Since 2008, Podes has been changed especially in providing additional information from subdistrict and regency/municipality, using separate questionnaires. The goal of these changes was to provide more benefits for data users and local government in regional development planning.
7. Podes data is the only one source of spatial data consisting of various information and providing a picture of development progress in a region. The Podes data are different from data resulted from household surveys focusing on the dimension of sectoral activities. Both kind of data are important and become the trade mark of BPS on the data richness aspect.
8. Podes Coverage Podes enumeration is conducted in the entire village-
level areas such as nagari etc in Indonesia including Transmigration Resettlement Unit (TRU) under related ministries. There were 78,609 village-level areas, spread over 497 regencies/municipalities based on the result of Podes 2011.
9. Method of Data Collection The collection of Podes data was conducted by a census
method (complete enumeration). The enumeration was undertaken by interviewing directly to village head, staff member of village office entrusted to answer, or other relevant sources.
http
://www.b
ps.g
o.id
G E O G R A P H Y A N D C L I M A T E
S t a t i s t i c a l Y e a r b o o k o f I n d o n e s i a 2 0 1 3 7
10. Desa tepi laut adalah desa/kelurahan yang memiliki sebagian wilayah yang bersinggungan/berbatasan langsung dengan laut, baik berupa pantai landai/datar maupun tebing karang.
11. Desa bukan tepi laut adalah desa/kelurahan yang wilayahnya tidak bersinggungan langsung dengan laut.
12. Desa lembah adalah desa/kelurahan yang wilayahnya sebagian besar merupakan daerah rendah yang terletak di antara dua gunung/pegunungan atau daerah yang mempunyai kedudukan lebih rendah dibandingkan daerah sekitarnya.
13. Desa lereng/punggung bukit adalah desa/kelurahan yang wilayahnya sebagian besar merupakan bagian dari gunung/pegunungan/bukit yang letaknya di antara puncak sampai lembah.
14. Desa hamparan adalah desa/kelurahan yang sebagian besar wilayahnya datar, rata, dan membentang.
15. Peraturan Pemerintah Nomor 82 Tahun 2001 tentang Pengolahan Kualitas Air dan Pengendalian Pencemaran Air, klasifikasi mutu air ditetapkan menjadi empat kelas yaitu: Kelas I, Kelas II, Kelas III, dan Kelas IV.
16. Kelas I, air yang dapat digunakan untuk air bahan baku air minum dan atau peruntukan lain yang mensyaratkan mutu air yang sama dengan kegunaan tersebut.
17. Kelas II, air yang dapat digunakan untuk prasarana atau sarana rekreasi air, pembudidayaan ikan air tawar, peternakan, air untuk mengairi pertanaman, dan atau peruntukan lain yang mensyaratkan mutu air yang sama dengan kegunaan tersebut.
18. Kelas III, air yang dapat digunakan untuk pembudidayaan ikan air tawar, peternakan, air untuk mengairi pertanaman, dan atau peruntukan lain yang mensyaratkan mutu air yang sama dengan kegunaan tersebut.
10. Coastal village is a village which has some areas that intersect/directly adjacent to the sea, either gently sloping/flat beach or cliffs/reef.
11. Non coastal village is a village which has no area that intersect/directly adjacent to the sea.
12. Valley village/river basin area is a village with the largest part of the village is a low area between two mountains or area that have a position lower than the surrounding areas.
13. Slope village is a village with the largest part of the village is a part of the mountain/hill which lies between the peak to the valley.
14. Flat village is a village with the largest part of the village is a part or side of parcels of land that looked plane, flat, and stretches.
15. Government Regulation Number 82 year 2001 on Water Quality Management and Water Pollution Control states that water quality is classified into four categories: Class I, Class II, Class III, and Class IV.
16. Class I, water that can be used for drinking and other uses requiring the same water quality category.
17. Class II, water that can be used for water recreation infrastructure, fresh water fish culture, animal husbandry, watering cropping, and other uses requiring the same water quality category.
18. Class III, water that can be used for fresh water fish culture, animal husbandry, watering cropping, and other uses requiring the same water quality category.
http
://www.b
ps.g
o.id
G E O G R A F I D A N I K L I M
S t a t i s t i k I n d o n e s i a 2 0 1 38
19. Kelas IV, air yang dapat digunakan untuk pertanaman, dan atau peruntukan lain yang mensyaratkan mutu air yang sama dengan kegunaan tersebut.
20. Penentuan status mutu air sungai dilakukan dengan Metode Indeks Pencemaran (IP).
21. Metode IP: Status mutu air dihitung berdasarkan data sesaat dengan Metode Indeks Pencemaran Keputusan Menteri Lingkungan Hidup Nomor 115 tahun 2003, dibandingkan dengan kriteria mutu air kelas I dan kriteria mutu air kelas II Peraturan Pemerintah Nomor 82 tahun 2001. Status mutu yang diperoleh merupakan status mutu sesaat dan hanya berdasarkan parameter tertentu yang dipantau di tiap sungai dengan jumlah dan jenis yang berbeda.
19. Class IV, water that can be used for watering cropping and other uses requiring the same water quality category.
20. Determination of river water quality status with Pollutant Index Method.
21. Pollutant Index Method: Status of water quality is assessed based on the transient data by Pollutant Index Method pursuant to Decree of Minister of Environment Number 115 Year 2003, compared to the water quality criteria Class I and the water quality criteria Class II of Government Regulation Number 82 Year 2001. The quality status obtained is transient quality status and only based on certain parameters monitored at every river at different amount and with different types of parameters.
http
://www.b
ps.g
o.id

G E O G R A P H Y A N D C L I M A T E
S t a t i s t i c a l Y e a r b o o k o f I n d o n e s i a 2 0 1 3 9
Luas Daerah dan Jumlah Pulau Menurut Provinsi, 2012Total Area and Number of Islands by Province, 2012
Tabel –––––– 1.1.1Table
1.1 KEADAAN GEOGRAFI GEOGRAPHY CONDITION
ProvinsiProvince
Ibu Kota Provinsi Provincial Capital
Luas 1 Area 1
(km2/sq.km)
Persentase Terhadap Luas Indonesia Percentage to
Indonesia
Jumlah Pulau 2Number of Islands 2
(1) (2) (3) (4) (5)Aceh Banda Aceh 57 956,00 3,03 663 Sumatera Utara Medan 72 981,23 3,82 419 Sumatera Barat Padang 42 012,89 2,20 391 Riau Pekanbaru 87 023,66 4,55 139 Kepulauan Riau Tanjung Pinang 8 201,72 0,43 2 408 Jambi Jambi 50 058,16 2,62 19 Sumatera Selatan Palembang 91 592,43 4,79 53 Kepulauan Bangka Belitung Pangkal Pinang 16 424,06 0,86 950 Bengkulu Bengkulu 19 919,33 1,04 47 Lampung Bandar Lampung 34 623,80 1,81 188 DKI Jakarta Jakarta 664,01 0,03 218 Jawa Barat Bandung 35 377,76 1,85 131 Banten Serang 9 662,92 0,51 131 Jawa Tengah Semarang 32 800,69 1,72 296 DI Yogyakarta Yogyakarta 3 133,15 0,16 23 Jawa Timur Surabaya 47 799,75 2,50 287 Bali Denpasar 5 780,06 0,30 85 Nusa Tenggara Barat Mataram 18 572,32 0,97 864 Nusa Tenggara Timur Kupang 48 718,10 2,55 1 192 Kalimantan Barat Pontianak 147 307,00 7,71 339 Kalimantan Tengah Palangka Raya 153 564,50 8,04 32 Kalimantan Selatan Banjarmasin 38 744,23 2,03 320 Kalimantan Timur Samarinda 204 534,34 10,70 370
Sulawesi Utara Manado 13 851,64 0,72 668 Gorontalo Gorontalo 11 257,07 0,59 136Sulawesi Tengah Palu 61 841,29 3,24 750 Sulawesi Selatan Makassar 46 717,48 2,44 2953 Sulawesi Barat Mamuju 16 787,18 0,88 –Sulawesi Tenggara Kendari 38 067,70 1,99 651 Maluku Ambon 46 914,03 2,46 1 422 Maluku Utara Ternate 31 982,50 1,67 1 474 Papua Jayapura 319 036,05 16,70 598 Papua Barat Manokwari 97 024,27 5,08 1 945
Indonesia Jakarta 1 910 931,32 100,00 17 504
Catatan/Note: 1 Berdasarkan Peraturan Menteri Dalam Negeri No. 66 Tahun 2011 tanggal 28 Desember 2011/Based on Minister of Home Affairs Regulation No.66/2011, December 28, 2011
2 Berdasarkan informasi Kementerian Dalam Negeri Tahun 2004/Based on information from Ministry of Home Affairs, 2004 3 Termasuk Sulawesi Barat/Including Sulawesi Barat
Sumber/Source: Direktorat Jenderal Pemerintahan Umum, Kementerian Dalam Negeri/Directorate General of Regional Authority, Ministry of Home Affairs
http
://www.b
ps.g
o.id

G E O G R A F I D A N I K L I M
S t a t i s t i k I n d o n e s i a 2 0 1 310
[Diolah dari Hasil Sensus Potensi Desa (Podes), BPS/Based on Village Potential Census, BPS‒Statistics Indonesia]
ProvinsiProvince
Tepi Laut/Coastal Bukan Tepi Laut/Non-Coastal
2005 2008 2011 2005 2008 2011
(1) (2) (3) (4) (5) (6) (7)
Aceh 660 678 761 5 308 5 746 5 722Sumatera Utara 1 175 375 396 4 740 5 392 5 401Sumatera Barat 99 102 116 802 822 917Riau 406 186 232 1 326 1 418 1 423Kepulauan Riau 2 … 267 299 … 59 54Jambi 28 28 29 1 207 1 275 1 343Sumatera Selatan 19 22 34 2 759 3 057 3 152Kepulauan Bangka Belitung 105 137 163 216 207 198Bengkulu 157 166 182 1 067 1 185 1 327Lampung 186 203 231 2 005 2 136 2 233
DKI Jakarta 16 15 16 251 252 251Jawa Barat 193 217 217 5 615 5 654 5 688Banten 123 124 131 1 359 1 380 1 404Jawa Tengah 334 329 347 8 230 8 245 8 230DI Yogyakarta 32 33 33 406 405 405Jawa Timur 571 611 655 7 906 7 894 7 847
Bali 156 167 177 545 545 539Nusa Tenggara Barat 184 241 279 636 672 805Nusa Tenggara Timur 815 841 943 1 923 1 962 2 023
Kalimantan Barat 138 153 163 1 392 1 638 1 804Kalimantan Tengah 34 41 45 1 317 1 407 1 483Kalimantan Selatan 131 135 166 1 828 1 839 1 834Kalimantan Timur 168 179 218 1 176 1 238 1 247
Sulawesi Utara 509 627 721 760 867 972Gorontalo 110 136 191 340 448 540Sulawesi Tengah 770 839 901 760 847 914Sulawesi Selatan 547 485 504 2 739 2 461 2 478Sulawesi Barat 2 … 122 148 … 414 490Sulawesi Tenggara 658 771 813 1 027 1 257 1 308
Maluku 733 772 859 140 134 165Maluku Utara 568 772 856 213 264 223Papua 3 827 474 522 2 512 2 837 3 402Papua Barat 2 … 416 536 … 789 903
Indonesia 9 452 10 664 11 884 60 505 64 746 66 725
Jumlah Desa Menurut Provinsi dan Letak Geografi, 2005–2011Number of Villages by Province and Geographical Location, 2005–2011
Tabel –––––– 1.1.2Table
Catatan/Note: 1 Data tahun 2005 tidak termasuk Kabupaten Nias dan Nias Selatan/The 2005 data excluded Regency of Nias and Nias Selatan 2 Data tahun 2005 tergabung dengan provinsi induknya/The 2005 data were included in their main province 3 Tidak semua desa/kelurahan dicacah/Not all villages were enumerated
http
://www.b
ps.g
o.id

G E O G R A P H Y A N D C L I M A T E
S t a t i s t i c a l Y e a r b o o k o f I n d o n e s i a 2 0 1 3 11
[Diolah dari Hasil Sensus Potensi Desa (Podes), BPS/Based on Village Potential Census, BPS‒Statistics Indonesia]
ProvinsiProvince
LembahValley
LerengSlope
HamparanFlat
20051 2008 1 2011 2005 1 2008 1 2011 2005 1 2008 1 2011
(1) (2) (3) (4) (5) (6) (7) (8) (9) (10)
Aceh 457 427 206 937 1 020 896 3 914 4 299 5 381Sumatera Utara 2 316 300 264 1 390 1 686 1 674 3 034 3 406 3 859Sumatera Barat 72 60 66 282 273 235 448 489 732Riau 194 222 11 77 105 83 1 055 1 091 1 561Kepulauan Riau 3 ... 2 13 ... 11 55 ... 46 285Jambi 298 235 39 206 162 157 703 878 1 176Sumatera Selatan 496 325 69 262 253 68 2 001 2 479 3 049Kepulauan Bangka Belitung 4 2 – 2 11 - 210 194 361Bengkulu 102 114 87 326 304 309 639 767 1 113Lampung 74 71 65 280 293 270 1 651 1 772 2 129
DKI Jakarta – – – – – – 251 252 267Jawa Barat 110 79 181 1 715 1 749 1 569 3 790 3 826 4 155Banten 41 28 37 243 243 248 1 075 1 109 1 250Jawa Tengah 88 56 181 2 166 2 132 2 069 5 976 6 057 6 327DI Yogyakarta – – 5 97 100 118 309 305 315Jawa Timur 106 81 159 1 323 1 287 1 392 6 477 6 526 6 951
Bali 3 1 20 98 90 138 444 454 558Nusa Tenggara Barat 19 15 63 129 144 169 488 513 852Nusa Tenggara Timur 117 112 317 1 296 1 333 1 385 510 517 1 264
Kalimantan Barat 456 466 151 308 394 250 628 778 1 566Kalimantan Tengah 789 768 49 133 151 95 395 488 1 384Kalimantan Selatan 172 102 42 193 207 181 1 463 1 530 1 777Kalimantan Timur 409 424 180 289 278 218 478 536 1 067
Sulawesi Utara 57 71 110 263 323 560 440 473 1 023Gorontalo 25 10 39 89 128 194 226 310 498Sulawesi Tengah 113 84 184 208 259 332 439 504 1 299Sulawesi Selatan 192 107 109 933 802 870 1 614 1 552 2 003Sulawesi Barat 3 ... 66 63 ... 215 275 ... 133 300Sulawesi Tenggara 53 94 127 264 284 358 710 879 1 636
Maluku 12 3 37 52 54 239 76 77 748Maluku Utara 23 15 48 33 50 596 157 199 435Papua 4 370 317 591 1 230 1 631 1 969 912 889 1 364Papua Barat 3 ... 188 232 ... 249 383 ... 352 824
Indonesia 5 168 4 845 3 745 14 824 16 221 17 355 40 513 43 680 57 509
Jumlah Desa Menurut Provinsi dan Topografi Wilayah, 2005–2011Number of Villages by Province and Topographical Areas, 2005–2011
Tabel –––––– 1.1.3Table
Catatan/Note: 1 Jumlah desa tidak termasuk desa tepi laut/Number of villages excluded coastal villages 2 Data tahun 2005 tidak termasuk Kabupaten Nias dan Nias Selatan/The 2005 data excluded Regency of Nias and Nias Selatan 3 Data tahun 2005 tergabung dengan provinsi induknya/The 2005 data were included in their main province 4 Tidak semua desa/kelurahan dicacah/Not all villages were enumerated
http
://www.b
ps.g
o.id
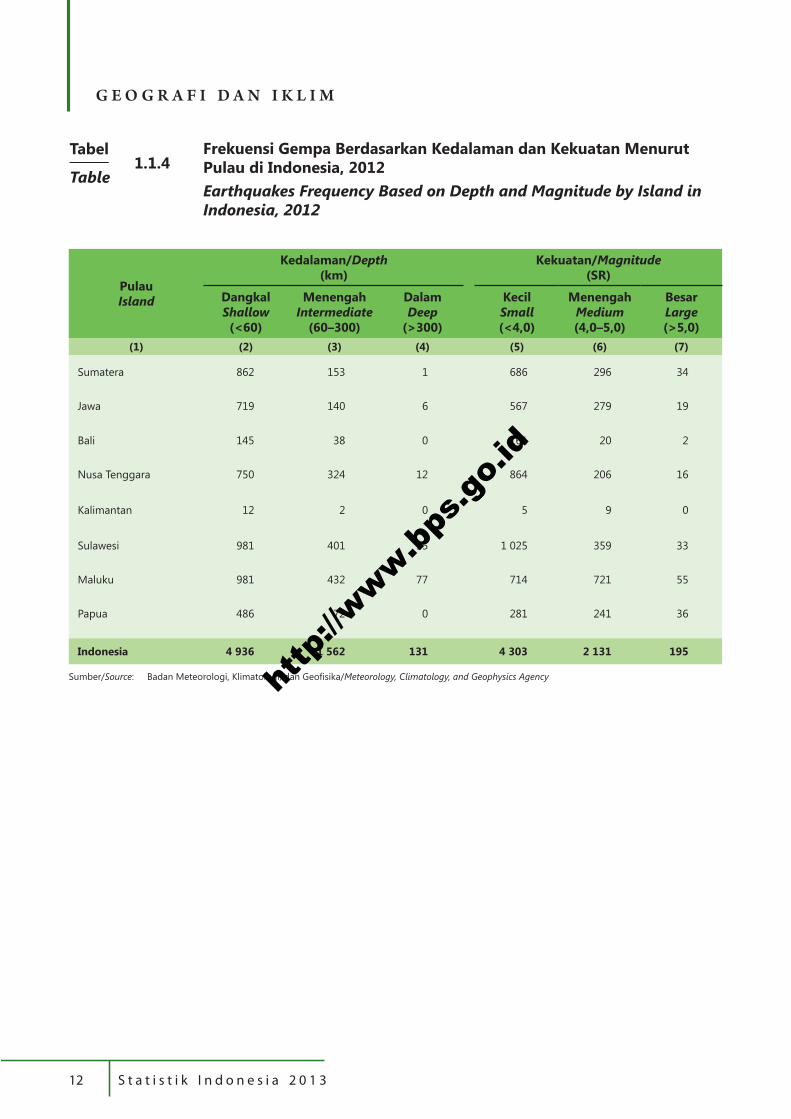
G E O G R A F I D A N I K L I M
S t a t i s t i k I n d o n e s i a 2 0 1 312
Frekuensi Gempa Berdasarkan Kedalaman dan Kekuatan Menurut Pulau di Indonesia, 2012 Earthquakes Frequency Based on Depth and Magnitude by Island in Indonesia, 2012
Tabel –––––– 1.1.4Table
PulauIsland
Kedalaman/Depth (km)
Kekuatan/Magnitude (SR)
Dangkal Shallow
(<60)
Menengah Intermediate
(60–300)
Dalam Deep
(>300)
Kecil Small (<4,0)
Menengah Medium (4,0–5,0)
Besar Large (>5,0)
(1) (2) (3) (4) (5) (6) (7)
Sumatera 862 153 1 686 296 34
Jawa 719 140 6 567 279 19
Bali 145 38 0 161 20 2
Nusa Tenggara 750 324 12 864 206 16
Kalimantan 12 2 0 5 9 0
Sulawesi 981 401 35 1 025 359 33
Maluku 981 432 77 714 721 55
Papua 486 72 0 281 241 36
Indonesia 4 936 1 562 131 4 303 2 131 195
Sumber/Source: Badan Meteorologi, Klimatologi, dan Geofisika/Meteorology, Climatology, and Geophysics Agencyhttp
://www.b
ps.g
o.id

G E O G R A P H Y A N D C L I M A T E
S t a t i s t i c a l Y e a r b o o k o f I n d o n e s i a 2 0 1 3 13
Luas Daerah Pengaliran dan Debit dari Beberapa Sungai yang Daerah Pengalirannya Lebih dari 1.000 km2, 2010River Basin Area and River Water Debit of Several Rivers with River Basin Area of More Than 1,000 sq.km, 2010
Tabel–––––– 1.1.5Table
Provinsi dan Induk Sungai
Province and Main River
Kabupaten Regency
Kecamatan Subdistrict
Desa Village
Luas Daerah Pengaliran
Sungai River Basin Area
(km2/sq.km)
Debit (m3/det)Debit (m3/sec)
Terbesar Maximum
Terkecil Minimum
(1) (2) (3) (4) (5) (6) (7)
Sumatera UtaraSungai Wampu Langkat Stabat Stabat Baru 3 808,8 817,0 84,3Sungai Bingei Langkat Binjai Utara Pahlawan 1 621,3 394,0 25,8Sungai Ular Deli Serdang Galang Pulau Tagor Baru 1 012,5 293,0 23,9Sungai Asahan Asahan Kisaran Timur Kisaran Naga 1 046,3 157,0 14,3Batang Barumuin Labuhan Batu Seroja 6 781,0 1 342,0 27,2Batang Toru Tapanuli Selatan Batang Toru Hapesong 2 773,0 254,0 16,0
RiauBatang Rokan Rokan Hulu Rokan IV Koto Lb.Bendahara 4 848,0 645,2 15,7Batang Rokan Rokan Hulu Rambah Ujung Gurap 1 304,0 179,2 19,2Sungai Siak Kampar Tapung Pantai Cermin 1 716,0 188,6 16,4Batang Kampar Kampar Air Tiris D. Bingkuang 4 000,0 1 654,0 190,2Batang Kampar Kampar Kampar Kiri Lipat Kain 3 431,0 728,9 57,1Batang Kampar Kuantan Singingi Singingi Hilir Koto Baru 1 170,0 324,1 10,0Batang Kuantan Kuantan Singingi Hulu Kuantan Lb.Ambacang 7 467,0 1 326,8 93,0Batang Kuantan Kuantan Singingi Kuantan Kamp.Berhala 8 526,0 1 294,2 43,9Batang Kuantan Indragiri Hulu Seberida Lb.Bangko 1 009,0 176,3 17,4
JambiBatang Hari Merangin Benso 1 258,0 252,0 39,7Batang Hari Merangin Bangko 3 645,0 945,0 15,8Batang Hari Merangin Muara Siau Rantau Panjang 1 046,0 154,0 68,9Batang Hari Merangin Bangko Barat Pulau Rengas 2 916,0 425,0 42,0Batang Hari Tebo Tengah Ilir Muara Kilis 17 824,0 2 094,0 316,8Batang Hari Batang Hari Muara Tembesi Muara Tembesi 36 135,0 3 826,0 494,1Batang Hari Muaro Jambi Jambi Luar Kota Sungai Duren 38 704,0 7 417,0 627,3Batang Hari Bungo Bathin III Air Gemuruh 1 810,0 232,0 51,7
LampungWay Tulang Bawang Way Kanan Pakuan Ratu Pakuan Ratu 3 355,0 603,0 70,3Way Seputih Lampung Tengah Gunung Sugih Buyut Udik 1 648,0 234,0 21,5Way Sekampung Pesawaran Gedong Tataan Pujo Rahayu 1 696,0 251,0 17,0
http
://www.b
ps.g
o.id
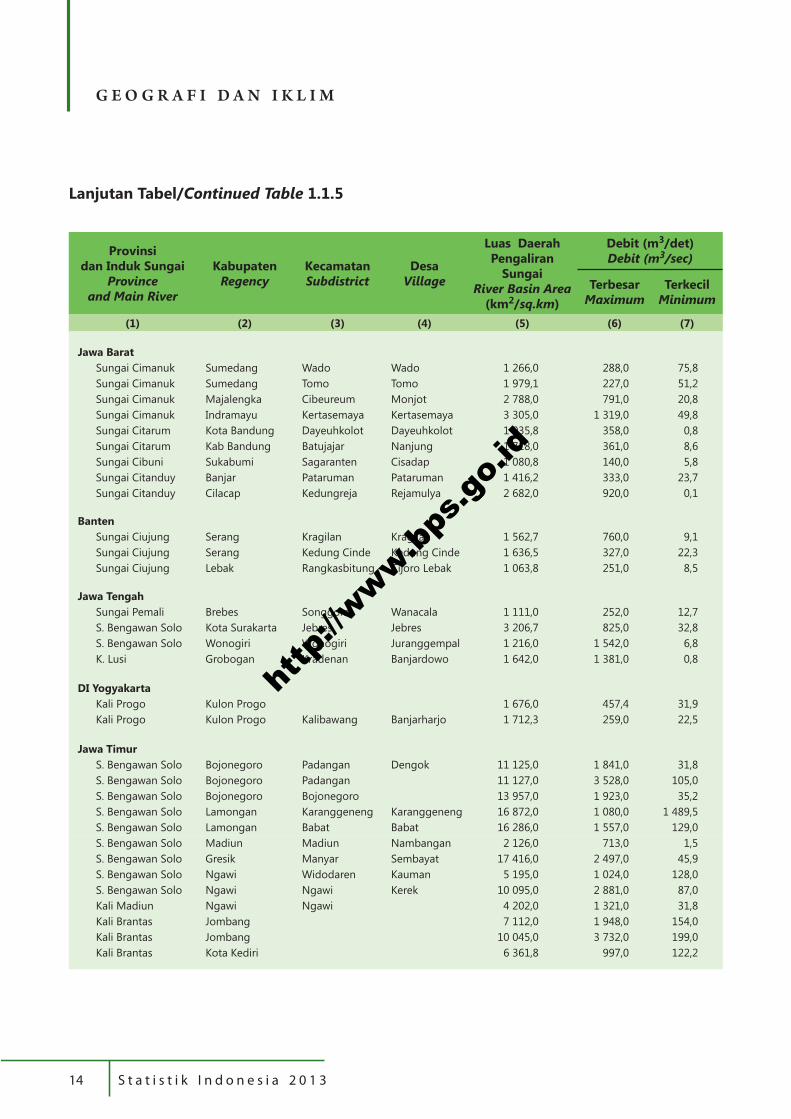
G E O G R A F I D A N I K L I M
S t a t i s t i k I n d o n e s i a 2 0 1 314
Lanjutan Tabel/Continued Table 1.1.5
Provinsi dan Induk Sungai
Province and Main River
Kabupaten Regency
Kecamatan Subdistrict
Desa Village
Luas Daerah Pengaliran
Sungai River Basin Area
(km2/sq.km)
Debit (m3/det)Debit (m3/sec)
Terbesar Maximum
Terkecil Minimum
(1) (2) (3) (4) (5) (6) (7)
Jawa BaratSungai Cimanuk Sumedang Wado Wado 1 266,0 288,0 75,8Sungai Cimanuk Sumedang Tomo Tomo 1 979,1 227,0 51,2Sungai Cimanuk Majalengka Cibeureum Monjot 2 788,0 791,0 20,8Sungai Cimanuk Indramayu Kertasemaya Kertasemaya 3 305,0 1 319,0 49,8Sungai Citarum Kota Bandung Dayeuhkolot Dayeuhkolot 1 035,8 358,0 0,8Sungai Citarum Kab Bandung Batujajar Nanjung 1 718,0 361,0 8,6Sungai Cibuni Sukabumi Sagaranten Cisadap 1 080,8 140,0 5,8Sungai Citanduy Banjar Pataruman Pataruman 1 416,2 333,0 23,7Sungai Citanduy Cilacap Kedungreja Rejamulya 2 682,0 920,0 0,1
BantenSungai Ciujung Serang Kragilan Kragilan 1 562,7 760,0 9,1Sungai Ciujung Serang Kedung Cinde Kedung Cinde 1 636,5 327,0 22,3Sungai Ciujung Lebak Rangkasbitung Cijoro Lebak 1 063,8 251,0 8,5
Jawa TengahSungai Pemali Brebes Songgom Wanacala 1 111,0 252,0 12,7S. Bengawan Solo Kota Surakarta Jebres Jebres 3 206,7 825,0 32,8S. Bengawan Solo Wonogiri Wonogiri Juranggempal 1 216,0 1 542,0 6,8K. Lusi Grobogan Kradenan Banjardowo 1 642,0 1 381,0 0,8
DI YogyakartaKali Progo Kulon Progo 1 676,0 457,4 31,9Kali Progo Kulon Progo Kalibawang Banjarharjo 1 712,3 259,0 22,5
Jawa TimurS. Bengawan Solo Bojonegoro Padangan Dengok 11 125,0 1 841,0 31,8S. Bengawan Solo Bojonegoro Padangan 11 127,0 3 528,0 105,0S. Bengawan Solo Bojonegoro Bojonegoro 13 957,0 1 923,0 35,2S. Bengawan Solo Lamongan Karanggeneng Karanggeneng 16 872,0 1 080,0 1 489,5S. Bengawan Solo Lamongan Babat Babat 16 286,0 1 557,0 129,0S. Bengawan Solo Madiun Madiun Nambangan 2 126,0 713,0 1,5S. Bengawan Solo Gresik Manyar Sembayat 17 416,0 2 497,0 45,9S. Bengawan Solo Ngawi Widodaren Kauman 5 195,0 1 024,0 128,0S. Bengawan Solo Ngawi Ngawi Kerek 10 095,0 2 881,0 87,0Kali Madiun Ngawi Ngawi 4 202,0 1 321,0 31,8Kali Brantas Jombang 7 112,0 1 948,0 154,0Kali Brantas Jombang 10 045,0 3 732,0 199,0Kali Brantas Kota Kediri 6 361,8 997,0 122,2
http
://www.b
ps.g
o.id

G E O G R A P H Y A N D C L I M A T E
S t a t i s t i c a l Y e a r b o o k o f I n d o n e s i a 2 0 1 3 15
Lanjutan Tabel/Continued Table 1.1.5
Sumber/Source: Data Tahunan Debit Sungai 2010, Pusat Penelitian dan Pengembangan Sumber Daya Air 2010 Annual Data of River Flow, Research and Development Center of Water Resources
Provinsi dan Induk Sungai
Province and Main River
Kabupaten Regency
Kecamatan Subdistrict
Desa Village
Luas Daerah Pengaliran
Sungai River Basin Area
(km2/sq.km)
Debit (m3/det)Debit (m3/sec)
Terbesar Maximum
Terkecil Minimum
(1) (2) (3) (4) (5) (6) (7)
Nusa Tenggara TimurAe Sesa Nagakeo Aesesa Mbay 1 089,0 96,1 8,1
Kalimantan BaratSungai Kapuas Sanggau Kembayan 2 290,0 325,0 13,2Sungai Kapuas Sanggau Nanga Nanga Taman 1 356,0 284,0 17,1Sungai Kapuas Sintang Kayan Hilir Mentunai 2 580,0 535,0 31,4Sungai Kapuas Pontianak Ngabang Manggu 3 710,0 593,0 40,8
Kalimantan TengahSungai Barito Kapuas Kapuas Tengah Pujon 30 536,0 5 276,0 138,5Sungai Barito Barito Timur Dusun Tengah Ampah 1 531,0 128,0 8,4Sungai Kapuas Kapuas Kapuas Tengah Pujon 4 741,0 1 270,0 108,1Sungai Kahayan Palangkaraya Jekan Raya Palangka 14 175,0 2 716,0 26,3Sungai Kahayan Gunung Mas Kurun Kuala Kurun 5 591,0 1 471,0 209,0Sungai Katingan Barito Selatan Kasongan Kasongan 11 929,0 1 615,0 521,3Sungai Lamandau Kota Waringin Barat Arut Utara Pangkut 1 968,0 289,0 84,7Sungai Lamandau Lamandau Bulik Nanga Bulik 7 082,0 1 529,0 309,7
Kalimantan TimurSungai Mahakam Tenggarong Kota Bangun Kota Bangun 5 675,0 1 169,0 284,2Sungai Mahakam Kutai Barat Melak Melak Ulu 25 000,0 3 378,0 781,5
GorontaloSungai Paguyaman Gorontalo Boliyohuto Parungi 1 886,7 426,0 12,3Sungai Randangan Pohuwato Marisa Marisa 1 375,0 300,0 11,8
Sulawesi TengahSungai Tambalako Morowali Lembo Kumpi 1 353,0 134,0 21,1
Sulawesi SelatanSungai Rongkong Luwu Sabang Sabang 1 030,0 189,0 10,8Sungai Cenranae Wajo Sengkang Madukeling 6 437,0 143,0 103,9Sungai Cenranae Bone Lappariaja Ujung Lamuru 1 625,0 291,0 3,0Sungai Cenranae Sidrap Duapitue Tanrutedong 1 123,0 567,0 8,5Sungai Sadang Enrekang Cendana 5 760,0 2 073,0 82,4Sungai Sadang Pinrang Duampanua Kaballangang 5 985,0 1 246,0 109,3
Sulawesi TenggaraL. Lalindu Konawe Utara Asera Asera 2 482,5 1 055,0 39,0Lawe Sampara Konawe Pondidaha Amesiu 1 201,0 155,0 0,4L. Roraya Konawe Selatan Mowila Kondoano 1 747,0 3 910,0 0,1
http
://www.b
ps.g
o.id

G E O G R A F I D A N I K L I M
S t a t i s t i k I n d o n e s i a 2 0 1 316
Rata-Rata Harian Aliran Sungai, Tinggi Aliran, dan Volume Air di Beberapa Sungai yang Daerah Pengalirannya Lebih dari 1.000 km2, 2010Average of Water Flow, Depth, and Volume of Water for Several Rivers with River Basin Area of More than 1,000 sq.km, 2010
Tabel –––––– 1.1.6Table
Provinsi dan Induk Sungai
Province and Main River
Kabupaten Regency
Kecamatan Subdistrict
Desa Village
Rata-RataBesarnya
Aliran(m3/det)
Average ofWater Flow
(m3/sec)
Rata-RataAliran
(lt/det/km2)Average of
Flow(l/sec/sq.km)
TinggiAliran(mm)Depth
ofWater (mm)
VolumeAir
(juta m3)Water
Volume(million
m3)(1) (2) (3) (4) (5) (6) (7) (8)
Sumatera UtaraSungai Wampu Langkat Stabat Stabat Baru 210,0 55,3 1 745,0 6 648,0Sungai Bingei Langkat Binjai Utara Pahlawan 41,9 25,8 816,0 1 323,0Sungai Ular Deli Serdang Galang Pulau Tagor Baru 42,3 41,8 1 319,0 1 335,0Sungai Asahan Asahan Kisaran Timur Kisaran Naga 46,8 44,8 1 175,7 1 229,8Batang Barumuin Labuhan Batu Seroja 325,1 47,9 1 513,0 1 026,0Batang Toru Tapanuli Selatan Batang Toru Hapesong 63,2 22,8 719,0 1 994,0
RiauBatang Rokan Rokan Hulu Rokan IV Koto Lb.Bendahara 139,0 28,7 906,0 4 392,0Batang Rokan Rokan Hulu Rambah Ujung Gurap 69,4 53,2 1 679,0 2 190,0Sungai Siak Kampar Tapung Pantai Cermin 83,4 48,6 1 533,0 2 631,0Batang Kampar Kampar Air Tiris Danau Bingkuang 350,0 87,7 2 767,0 1 106,0Batang Kampar Kampar Kampar Kiri Lipat Kain 88,5 25,7 813,0 2 791,0Batang Kampar Kuantan Singingi Singingi Hilir Koto Baru 69,7 59,6 1 880,0 2 200,0Batang Kuantan Kuantan Singingi Hulu Kuantan Lb.Ambacang 362,0 48,5 1 532,0 1 144,0Batang Kuantan Kuantan Singingi Kuantan Kamp.Berhala 431,0 50,6 1 597,0 1 362,0Batang Kuantan Indragiri Hulu Seberida Lb.Bangko 31,2 30,9 975,0 984,0
JambiBatang Hari Merangin Benso 54,1 43,0 1 357,0 1 708,0Batang Hari Merangin Bangko 134,0 36,8 1 161,0 4 232,0Batang Hari Merangin Muara Siau Rantau Panjang 51,9 49,6 1 566,0 1 638,0Batang Hari Merangin Bangko Pulau Rengas 102,0 35,0 1 105,0 3 223,0Batang Hari Tebo Tengah Ilir Muara Kilis 631,0 35,4 1 117,0 1 991,0Batang Hari Batang Hari Muara Tembesi Muara Tembesi 1 777,0 49,1 1 550,0 5 604,0Batang Hari Muaro Jambi Jambi Luar Kota Sungai Duren 2 624,0 67,8 2 138,0 8 277,0Batang Hari Bungo Bathin III Air Gemuruh 79,6 43,9 1 386,0 2 510,0
LampungWay Tulang Bawang Way Kanan Pakuan Ratu Pakuan Ratu 196,0 58,5 1 847,0 6 197,0Way Seputih Lampung Tengah Gunung Sugih Buyut Udik 84,7 51,4 1 621,0 2 672,0Way Sekampung Lampung Selatan Gedong Tataan Pujo Rahayu 60,2 35,5 1 120,0 1 900,0
http
://www.b
ps.g
o.id
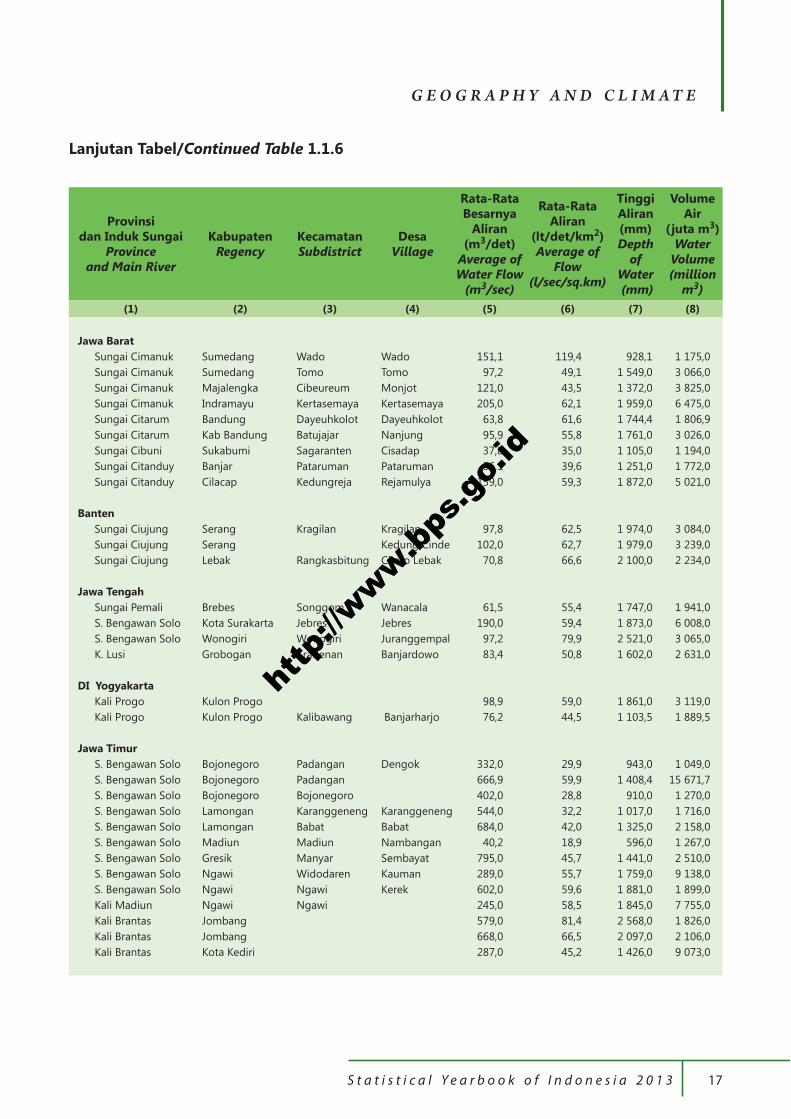
G E O G R A P H Y A N D C L I M A T E
S t a t i s t i c a l Y e a r b o o k o f I n d o n e s i a 2 0 1 3 17
Provinsi dan Induk Sungai
Province and Main River
Kabupaten Regency
Kecamatan Subdistrict
Desa Village
Rata-RataBesarnya
Aliran(m3/det)
Average ofWater Flow
(m3/sec)
Rata-RataAliran
(lt/det/km2)Average of
Flow(l/sec/sq.km)
TinggiAliran(mm)Depth
ofWater (mm)
VolumeAir
(juta m3)Water
Volume(million
m3)(1) (2) (3) (4) (5) (6) (7) (8)
Jawa BaratSungai Cimanuk Sumedang Wado Wado 151,1 119,4 928,1 1 175,0Sungai Cimanuk Sumedang Tomo Tomo 97,2 49,1 1 549,0 3 066,0Sungai Cimanuk Majalengka Cibeureum Monjot 121,0 43,5 1 372,0 3 825,0Sungai Cimanuk Indramayu Kertasemaya Kertasemaya 205,0 62,1 1 959,0 6 475,0Sungai Citarum Bandung Dayeuhkolot Dayeuhkolot 63,8 61,6 1 744,4 1 806,9Sungai Citarum Kab Bandung Batujajar Nanjung 95,9 55,8 1 761,0 3 026,0Sungai Cibuni Sukabumi Sagaranten Cisadap 37,8 35,0 1 105,0 1 194,0Sungai Citanduy Banjar Pataruman Pataruman 56,1 39,6 1 251,0 1 772,0Sungai Citanduy Cilacap Kedungreja Rejamulya 159,0 59,3 1 872,0 5 021,0
BantenSungai Ciujung Serang Kragilan Kragilan 97,8 62,5 1 974,0 3 084,0Sungai Ciujung Serang Kedung Cinde 102,0 62,7 1 979,0 3 239,0Sungai Ciujung Lebak Rangkasbitung Cijoro Lebak 70,8 66,6 2 100,0 2 234,0
Jawa TengahSungai Pemali Brebes Songgom Wanacala 61,5 55,4 1 747,0 1 941,0S. Bengawan Solo Kota Surakarta Jebres Jebres 190,0 59,4 1 873,0 6 008,0S. Bengawan Solo Wonogiri Wonogiri Juranggempal 97,2 79,9 2 521,0 3 065,0K. Lusi Grobogan Kradenan Banjardowo 83,4 50,8 1 602,0 2 631,0
DI YogyakartaKali Progo Kulon Progo 98,9 59,0 1 861,0 3 119,0Kali Progo Kulon Progo Kalibawang Banjarharjo 76,2 44,5 1 103,5 1 889,5
Jawa TimurS. Bengawan Solo Bojonegoro Padangan Dengok 332,0 29,9 943,0 1 049,0S. Bengawan Solo Bojonegoro Padangan 666,9 59,9 1 408,4 15 671,7S. Bengawan Solo Bojonegoro Bojonegoro 402,0 28,8 910,0 1 270,0S. Bengawan Solo Lamongan Karanggeneng Karanggeneng 544,0 32,2 1 017,0 1 716,0S. Bengawan Solo Lamongan Babat Babat 684,0 42,0 1 325,0 2 158,0S. Bengawan Solo Madiun Madiun Nambangan 40,2 18,9 596,0 1 267,0S. Bengawan Solo Gresik Manyar Sembayat 795,0 45,7 1 441,0 2 510,0S. Bengawan Solo Ngawi Widodaren Kauman 289,0 55,7 1 759,0 9 138,0S. Bengawan Solo Ngawi Ngawi Kerek 602,0 59,6 1 881,0 1 899,0Kali Madiun Ngawi Ngawi 245,0 58,5 1 845,0 7 755,0Kali Brantas Jombang 579,0 81,4 2 568,0 1 826,0Kali Brantas Jombang 668,0 66,5 2 097,0 2 106,0Kali Brantas Kota Kediri 287,0 45,2 1 426,0 9 073,0
Lanjutan Tabel/Continued Table 1.1.6
http
://www.b
ps.g
o.id
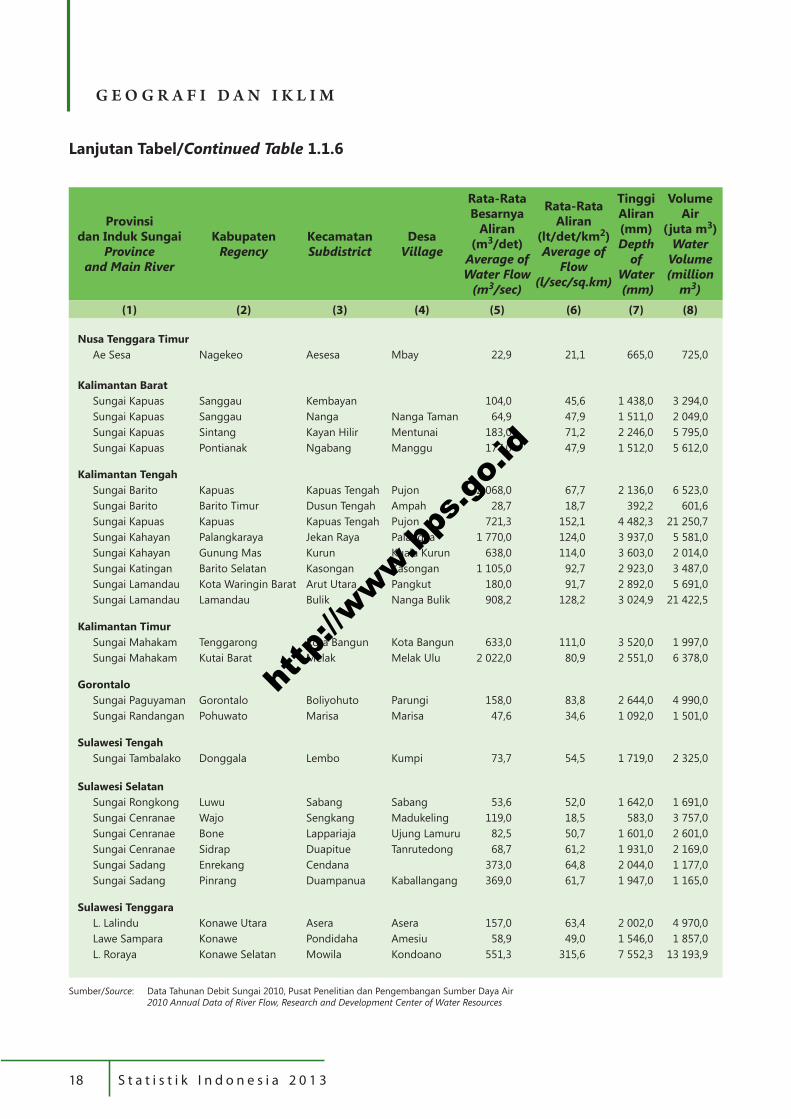
G E O G R A F I D A N I K L I M
S t a t i s t i k I n d o n e s i a 2 0 1 318
Provinsi dan Induk Sungai
Province and Main River
Kabupaten Regency
Kecamatan Subdistrict
Desa Village
Rata-RataBesarnya
Aliran(m3/det)
Average ofWater Flow
(m3/sec)
Rata-RataAliran
(lt/det/km2)Average of
Flow(l/sec/sq.km)
TinggiAliran(mm)Depth
ofWater (mm)
VolumeAir
(juta m3)Water
Volume(million
m3)(1) (2) (3) (4) (5) (6) (7) (8)
Nusa Tenggara TimurAe Sesa Nagekeo Aesesa Mbay 22,9 21,1 665,0 725,0
Kalimantan BaratSungai Kapuas Sanggau Kembayan 104,0 45,6 1 438,0 3 294,0Sungai Kapuas Sanggau Nanga Nanga Taman 64,9 47,9 1 511,0 2 049,0Sungai Kapuas Sintang Kayan Hilir Mentunai 183,0 71,2 2 246,0 5 795,0Sungai Kapuas Pontianak Ngabang Manggu 177,0 47,9 1 512,0 5 612,0
Kalimantan TengahSungai Barito Kapuas Kapuas Tengah Pujon 2 068,0 67,7 2 136,0 6 523,0Sungai Barito Barito Timur Dusun Tengah Ampah 28,7 18,7 392,2 601,6Sungai Kapuas Kapuas Kapuas Tengah Pujon 721,3 152,1 4 482,3 21 250,7Sungai Kahayan Palangkaraya Jekan Raya Palangka 1 770,0 124,0 3 937,0 5 581,0Sungai Kahayan Gunung Mas Kurun Kuala Kurun 638,0 114,0 3 603,0 2 014,0Sungai Katingan Barito Selatan Kasongan Kasongan 1 105,0 92,7 2 923,0 3 487,0Sungai Lamandau Kota Waringin Barat Arut Utara Pangkut 180,0 91,7 2 892,0 5 691,0Sungai Lamandau Lamandau Bulik Nanga Bulik 908,2 128,2 3 024,9 21 422,5
Kalimantan TimurSungai Mahakam Tenggarong Kota Bangun Kota Bangun 633,0 111,0 3 520,0 1 997,0Sungai Mahakam Kutai Barat Melak Melak Ulu 2 022,0 80,9 2 551,0 6 378,0
GorontaloSungai Paguyaman Gorontalo Boliyohuto Parungi 158,0 83,8 2 644,0 4 990,0Sungai Randangan Pohuwato Marisa Marisa 47,6 34,6 1 092,0 1 501,0
Sulawesi TengahSungai Tambalako Donggala Lembo Kumpi 73,7 54,5 1 719,0 2 325,0
Sulawesi SelatanSungai Rongkong Luwu Sabang Sabang 53,6 52,0 1 642,0 1 691,0Sungai Cenranae Wajo Sengkang Madukeling 119,0 18,5 583,0 3 757,0Sungai Cenranae Bone Lappariaja Ujung Lamuru 82,5 50,7 1 601,0 2 601,0Sungai Cenranae Sidrap Duapitue Tanrutedong 68,7 61,2 1 931,0 2 169,0Sungai Sadang Enrekang Cendana 373,0 64,8 2 044,0 1 177,0Sungai Sadang Pinrang Duampanua Kaballangang 369,0 61,7 1 947,0 1 165,0
Sulawesi TenggaraL. Lalindu Konawe Utara Asera Asera 157,0 63,4 2 002,0 4 970,0Lawe Sampara Konawe Pondidaha Amesiu 58,9 49,0 1 546,0 1 857,0L. Roraya Konawe Selatan Mowila Kondoano 551,3 315,6 7 552,3 13 193,9
Lanjutan Tabel/Continued Table 1.1.6
Sumber/Source: Data Tahunan Debit Sungai 2010, Pusat Penelitian dan Pengembangan Sumber Daya Air 2010 Annual Data of River Flow, Research and Development Center of Water Resources
http
://www.b
ps.g
o.id

G E O G R A P H Y A N D C L I M A T E
S t a t i s t i c a l Y e a r b o o k o f I n d o n e s i a 2 0 1 3 19
Status Kualitas Air Sungai, 2011Status of River Water Quality, 2011
Tabel –––––– 1.1.7Table
Provinsi Province
Nama SungaiRiver Name
JumlahTitik
SamplingTotal
Sampling Drop
Frekuensi Sampling Sampling Frequency
Kisaran Status Mutu Air Sungai Berdasarkan Kriteria Mutu Air
Peraturan Pemerintah 82/2001 Kelas II Range of River Water Quality Status Pursuant to Water Quality Criteria
Regulation Government 82/2001 Class II(1) (2) (3) (4) (5)
Aceh Tamiang 6 5 memenuhi−cemar ringan/compliant−lightly polluted Sumatera Utara Batahan 6 5 memenuhi−cemar ringan/compliant−lightly polluted Sumatera Barat Batang Hari 6 5 memenuhi−cemar ringan/compliant−lightly polluted Riau Kampar 10 5 memenuhi−cemar ringan/compliant−lightly polluted Kepulauan Riau Duriangkang 6 5 memenuhi−cemar sedang/compliant−polluted Jambi Batang Hari 12 5 memenuhi−cemar ringan/compliant−lightly polluted Sumatera Selatan Musi 18 5 memenuhi−cemar ringan/compliant−lightly polluted Kepulauan Bangka Belitung Baturusa 6 5 memenuhi−cemar ringan/compliant−lightly polluted Bengkulu Musi 8 5 memenuhi/compliant Lampung Mesuji 6 4 cemar ringan−cemar sedang/lightly polluted−polluted
DKI Jakarta Ciliwung 5 4 memenuhi−cemar ringan/compliant−lightly polluted Jawa Barat Ciliwung 5 5 cemar ringan−cemar sedang/lightly polluted−polluted
Citarum 7 5 memenuhi−cemar sedang/compliant−pollutedCisadane 3 5 cemar ringan−cemar berat/lightly polluted−heavy polluted
Banten Cidurian 6 5 memenuhi−cemar sedang/compliant−polluted Jawa Tengah Bengawan Solo 5 5 memenuhi−cemar ringan/compliant−lightly polluted
Progo 6 5 memenuhi−cemar ringan/compliant−lightly pollutedCisanggarung 2 4 memenuhi−cemar ringan/compliant−lightly pollutedCitandui 2 4 memenuhi−cemar ringan/compliant−lightly polluted
DI Yogyakarta Opak 10 5 memenuhi−cemar ringan/compliant−lightly pollutedProgo 8 5 memenuhi−cemar ringan/compliant−lightly pollutedSerang 3 5 memenuhi−cemar ringan/compliant−lightly polluted
Jawa Timur Bengawan Solo 11 5 memenuhi−cemar sedang/compliant−pollutedMadiun 9 5 memenuhi−cemar sedang/compliant−polluted
Bali Tukad Ayung 6 5 memenuhi−cemar ringan/compliant−lightly polluted Nusa Tenggara Barat Jangkok 6 5 memenuhi−cemar ringan/compliant−lightly polluted Nusa Tenggara Timur Noelmina 6 5 memenuhi−cemar sedang/compliant−polluted
Kalimantan Barat Kapuas 6 5 memenuhi−cemar ringan/compliant−lightly polluted Kalimantan Tengah Barito 9 5 memenuhi−cemar berat/compliant−heavy polluted Kalimantan Selatan Martapura 6 5 memenuhi−cemar ringan/compliant−lightly polluted
Barito 6 5 memenuhi−cemar sedang/compliant−polluted Kalimantan Timur Mahakam 5 5 memenuhi−cemar ringan/compliant−lightly polluted
Sulawesi Utara Sangkup 7 5 memenuhi−cemar ringan/compliant−lightly polluted Gorontalo Andagile 6 5 memenuhi/compliant Sulawesi Tengah Lariang 6 5 memenuhi/compliant Sulawesi Selatan Saddang 6 5 memenuhi−cemar sedang/compliant−polluted Jeneberang 6 5 memenuhi−cemar sedang/compliant−polluted Sulawesi Barat Lariang 6 4 memenuhi−cemar sedang/compliant−polluted Sulawesi Tenggara Laso Lalin 6 5 memenuhi−cemar ringan/compliant−lightly polluted
Maluku Batu Gajah 3 5 cemar ringan−cemar berat/lightly polluted−heavy polluted Wai Siah 3 5 memenuhi−cemar sedang/compliant−polluted
Maluku Utara Tabobo 6 3 memenuhi−cemar ringan/compliant−lightly polluted Tanjung Buli 6 3 memenuhi/compliant
Papua Sentani 6 5 cemar ringan/lightly pollutedPapua Barat ... ... ... ...
Sumber/Source: Kementerian Lingkungan Hidup/Ministry for Environment
http
://www.b
ps.g
o.id
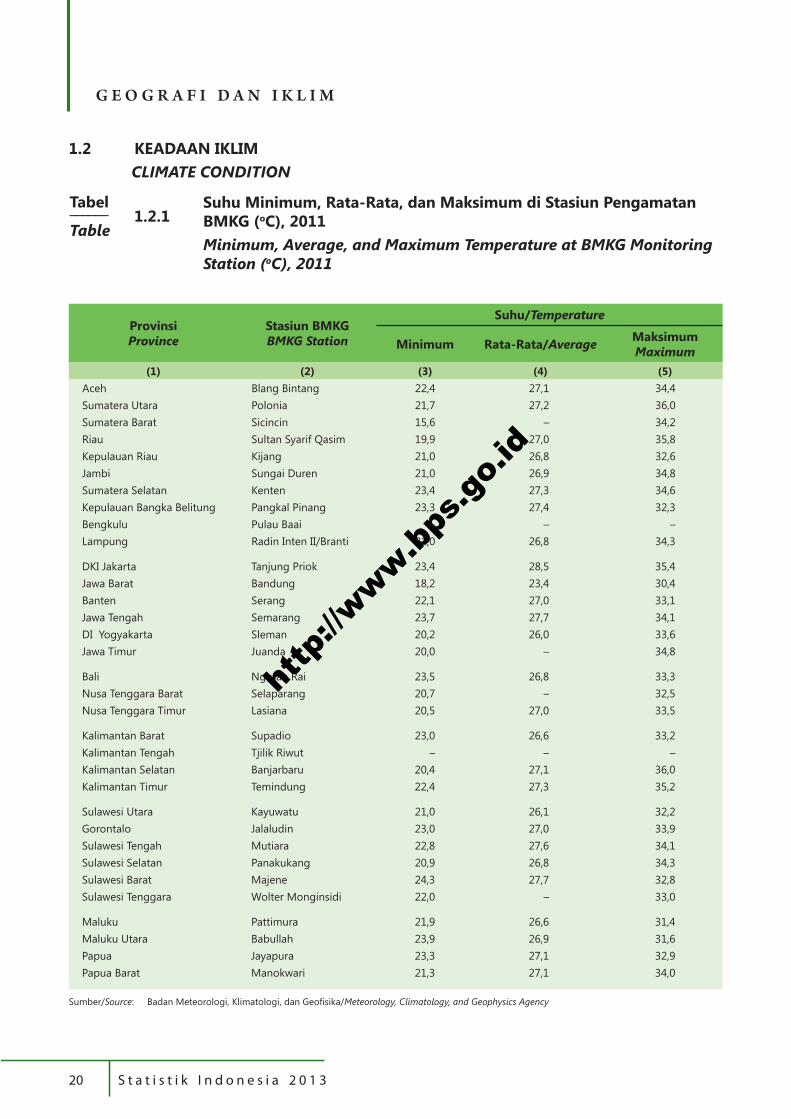
G E O G R A F I D A N I K L I M
S t a t i s t i k I n d o n e s i a 2 0 1 320
Suhu Minimum, Rata-Rata, dan Maksimum di Stasiun Pengamatan BMKG (oC), 2011Minimum, Average, and Maximum Temperature at BMKG Monitoring Station (oC), 2011
Tabel–––––– 1.2.1Table
1.2 KEADAAN IKLIM CLIMATE CONDITION
Sumber/Source: Badan Meteorologi, Klimatologi, dan Geofisika/Meteorology, Climatology, and Geophysics Agency
ProvinsiProvince
Stasiun BMKGBMKG Station
Suhu/Temperature
Minimum Rata-Rata/Average MaksimumMaximum
(1) (2) (3) (4) (5)Aceh Blang Bintang 22,4 27,1 34,4Sumatera Utara Polonia 21,7 27,2 36,0Sumatera Barat Sicincin 15,6 – 34,2Riau Sultan Syarif Qasim 19,9 27,0 35,8Kepulauan Riau Kijang 21,0 26,8 32,6Jambi Sungai Duren 21,0 26,9 34,8Sumatera Selatan Kenten 23,4 27,3 34,6Kepulauan Bangka Belitung Pangkal Pinang 23,3 27,4 32,3Bengkulu Pulau Baai – – – Lampung Radin Inten II/Branti 21,0 26,8 34,3
DKI Jakarta Tanjung Priok 23,4 28,5 35,4Jawa Barat Bandung 18,2 23,4 30,4Banten Serang 22,1 27,0 33,1Jawa Tengah Semarang 23,7 27,7 34,1DI Yogyakarta Sleman 20,2 26,0 33,6Jawa Timur Juanda 20,0 – 34,8
Bali Ngurah Rai 23,5 26,8 33,3Nusa Tenggara Barat Selaparang 20,7 – 32,5Nusa Tenggara Timur Lasiana 20,5 27,0 33,5
Kalimantan Barat Supadio 23,0 26,6 33,2Kalimantan Tengah Tjilik Riwut – – – Kalimantan Selatan Banjarbaru 20,4 27,1 36,0Kalimantan Timur Temindung 22,4 27,3 35,2
Sulawesi Utara Kayuwatu 21,0 26,1 32,2Gorontalo Jalaludin 23,0 27,0 33,9Sulawesi Tengah Mutiara 22,8 27,6 34,1Sulawesi Selatan Panakukang 20,9 26,8 34,3Sulawesi Barat Majene 24,3 27,7 32,8Sulawesi Tenggara Wolter Monginsidi 22,0 – 33,0
Maluku Pattimura 21,9 26,6 31,4Maluku Utara Babullah 23,9 26,9 31,6Papua Jayapura 23,3 27,1 32,9Papua Barat Manokwari 21,3 27,1 34,0
http
://www.b
ps.g
o.id
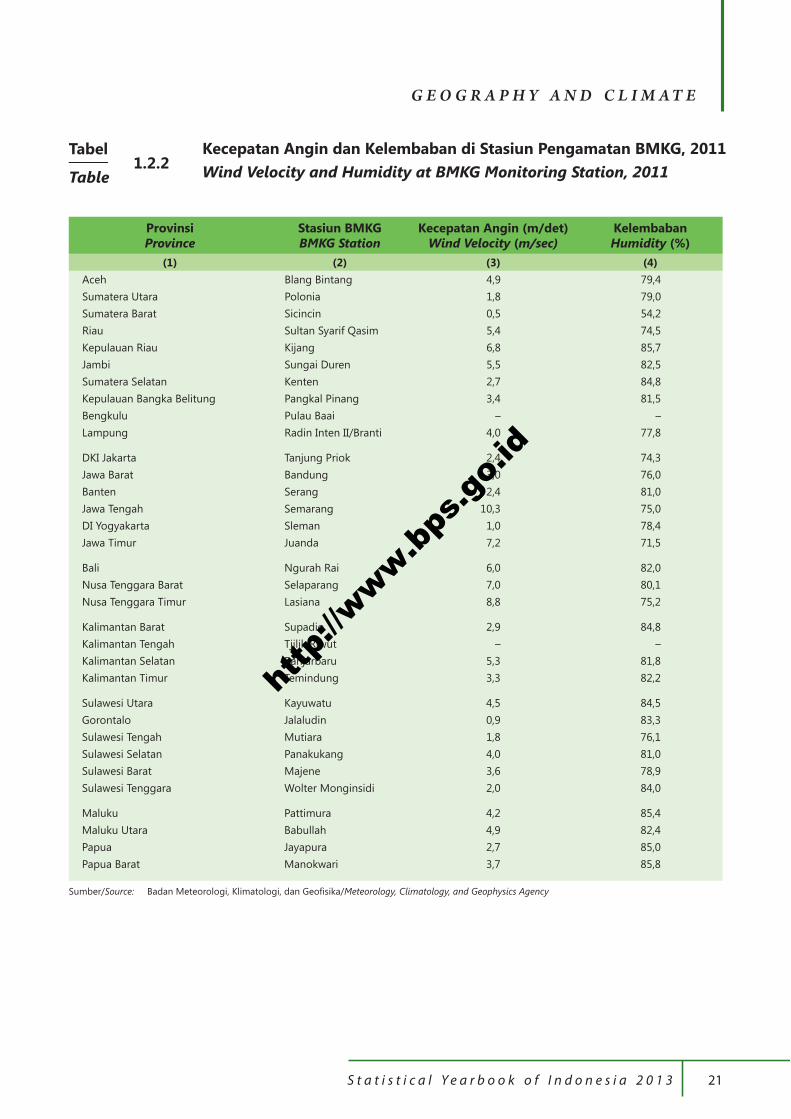
G E O G R A P H Y A N D C L I M A T E
S t a t i s t i c a l Y e a r b o o k o f I n d o n e s i a 2 0 1 3 21
ProvinsiProvince
Stasiun BMKGBMKG Station
Kecepatan Angin (m/det)Wind Velocity (m/sec)
KelembabanHumidity (%)
(1) (2) (3) (4)Aceh Blang Bintang 4,9 79,4Sumatera Utara Polonia 1,8 79,0Sumatera Barat Sicincin 0,5 54,2Riau Sultan Syarif Qasim 5,4 74,5Kepulauan Riau Kijang 6,8 85,7Jambi Sungai Duren 5,5 82,5Sumatera Selatan Kenten 2,7 84,8Kepulauan Bangka Belitung Pangkal Pinang 3,4 81,5Bengkulu Pulau Baai – – Lampung Radin Inten II/Branti 4,0 77,8
DKI Jakarta Tanjung Priok 2,4 74,3Jawa Barat Bandung 3,0 76,0Banten Serang 2,4 81,0Jawa Tengah Semarang 10,3 75,0DI Yogyakarta Sleman 1,0 78,4Jawa Timur Juanda 7,2 71,5
Bali Ngurah Rai 6,0 82,0Nusa Tenggara Barat Selaparang 7,0 80,1Nusa Tenggara Timur Lasiana 8,8 75,2
Kalimantan Barat Supadio 2,9 84,8Kalimantan Tengah Tjilik Riwut – –Kalimantan Selatan Banjarbaru 5,3 81,8Kalimantan Timur Temindung 3,3 82,2
Sulawesi Utara Kayuwatu 4,5 84,5Gorontalo Jalaludin 0,9 83,3Sulawesi Tengah Mutiara 1,8 76,1Sulawesi Selatan Panakukang 4,0 81,0Sulawesi Barat Majene 3,6 78,9Sulawesi Tenggara Wolter Monginsidi 2,0 84,0
Maluku Pattimura 4,2 85,4Maluku Utara Babullah 4,9 82,4Papua Jayapura 2,7 85,0Papua Barat Manokwari 3,7 85,8
Kecepatan Angin dan Kelembaban di Stasiun Pengamatan BMKG, 2011Wind Velocity and Humidity at BMKG Monitoring Station, 2011
Tabel –––––– 1.2.2Table
Sumber/Source: Badan Meteorologi, Klimatologi, dan Geofisika/Meteorology, Climatology, and Geophysics Agency
http
://www.b
ps.g
o.id

G E O G R A F I D A N I K L I M
S t a t i s t i k I n d o n e s i a 2 0 1 322
ProvinsiProvince
Stasiun BMKGBMKG Station
Jumlah Curah Hujan Number of Precipitation (mm)
Jumlah Hari Hujan (hari)Number of Rainy Days
(day)(1) (2) (3) (4)
Aceh Blang Bintang 1 268 150Sumatera Utara Polonia 2 042 225Sumatera Barat Sicincin – – Riau Sultan Syarif Qasim 2 405 211Kepulauan Riau Kijang 3 893 205Jambi Sungai Duren 2 295 209Sumatera Selatan Kenten 2 593 217Kepulauan Bangka Belitung Pangkal Pinang 2 921 213Bengkulu Pulau Baai – –Lampung Radin Inten II/Branti 1 568 118
DKI Jakarta Tanjung Priok 1 274 - Jawa Barat Bandung 1 789 215Banten Serang 1 141 165Jawa Tengah Semarang 1 879 174DI Yogyakarta Sleman 2 285 170Jawa Timur Juanda 1 790 –
Bali Ngurah Rai 1 890 174Nusa Tenggara Barat Selaparang – –Nusa Tenggara Timur Lasiana 1 699 140
Kalimantan Barat Supadio 3 129 196Kalimantan Tengah Tjilik Riwut – –Kalimantan Selatan Banjarbaru 2 751 195Kalimantan Timur Temindung 2 990 231
Sulawesi Utara Kayuwatu 3 031 276Gorontalo Jalaludin 2 272 215Sulawesi Tengah Mutiara 667 –Sulawesi Selatan Panakukang 3 465 176Sulawesi Barat Majene 1 660 175Sulawesi Tenggara Wolter Monginsidi 1 511 121
Maluku Pattimura 3 988 257Maluku Utara Babullah 2 962 239Papua Jayapura 2 226 196Papua Barat Manokwari 2 681 246
Jumlah Curah Hujan dan Jumlah Hari Hujan di Stasiun Pengamatan BMKG, 2011Number of Precipitations and Number of Rainy Days at BMKG Monitoring Station, 2011
Tabel –––––– 1.2.3Table
Sumber/Source: Badan Meteorologi, Klimatologi dan Geofisika/Meteorology, Climatology, and Geophysics Agency
http
://www.b
ps.g
o.id

G E O G R A P H Y A N D C L I M A T E
S t a t i s t i c a l Y e a r b o o k o f I n d o n e s i a 2 0 1 3 23
ProvinsiProvince
Stasiun BMKGBMKG Station
Tekanan Udara Atmospheric Pressure (mb)
Penyinaran MatahariDuration of Sunshine (%)
(1) (2) (3) (4)Aceh Blang Bintang 1 009,4 52,2Sumatera Utara Polonia – 44,4Sumatera Barat Sicincin 990,8 32,8Riau Sultan Syarif Qasim 1 008,7 42,3Kepulauan Riau Kijang 1 010,1 39,9Jambi Sungai Duren 1 010,2 54,1Sumatera Selatan Kenten 1 009,6 54,0Kepulauan Bangka Belitung Pangkal Pinang 1 009,2 54,9Bengkulu Pulau Baai – – Lampung Radin Inten II/Branti 1 009,4 56,4
DKI Jakarta Tanjung Priok 1 009,5 60,9Jawa Barat Bandung 922,1 61,0Banten Serang 1 008,8 61,0Jawa Tengah Semarang 1 009,6 67,5DI Yogyakarta Sleman 995,2 22,9Jawa Timur Juanda 1 010,1 69,1
Bali Ngurah Rai 1 009,0 72,0Nusa Tenggara Barat Selaparang 1 009,7 68,0Nusa Tenggara Timur Lasiana 1 009,1 73,3
Kalimantan Barat Supadio 1 008,9 68,7 Kalimantan Tengah Tjilik Riwut – – Kalimantan Selatan Banjarbaru 968,0 – Kalimantan Timur Temindung 1 011,3 38,8
Sulawesi Utara Kayuwatu 1 009,4 54,3Gorontalo Jalaludin 1 009,7 60,9Sulawesi Tengah Mutiara 1 009,9 54,4Sulawesi Selatan Panakukang 1 010,8 64,0Sulawesi Barat Majene 1 010,1 75,2Sulawesi Tenggara Wolter Monginsidi – –
Maluku Pattimura 1 009,2 49,4Maluku Utara Babullah 1 010,1 51,3Papua Jayapura 1 008,0 58,0Papua Barat Manokwari 1 007,9 46,0
Tekanan Udara dan Penyinaran Matahari di Stasiun Pengamatan BMKG, 2011Atmospheric Pressure and Duration of Sunshine at BMKG Monitoring Station, 2011
Tabel –––––– 1.2.4Table
Sumber/Source: Badan Meteorologi, Klimatologi dan Geofisika/Meteorology, Climatology, and Geophysics Agency
http
://www.b
ps.g
o.id
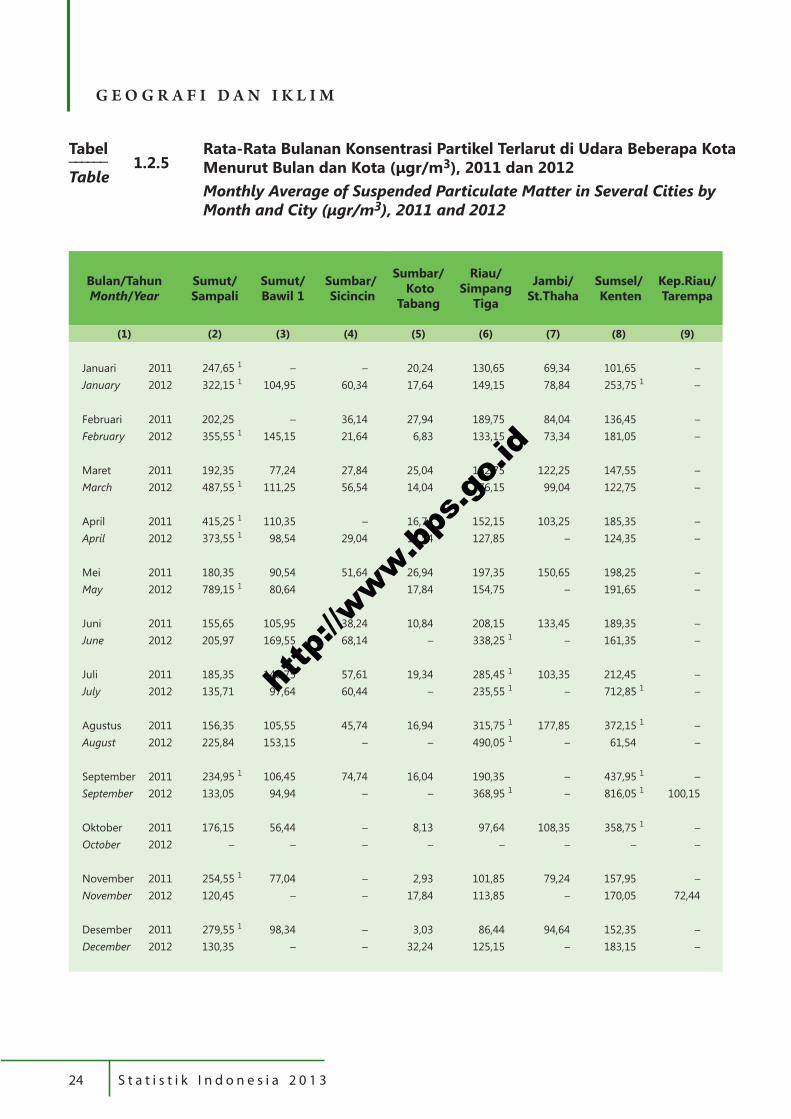
G E O G R A F I D A N I K L I M
S t a t i s t i k I n d o n e s i a 2 0 1 324
Rata-Rata Bulanan Konsentrasi Partikel Terlarut di Udara Beberapa Kota Menurut Bulan dan Kota (μgr/m3), 2011 dan 2012Monthly Average of Suspended Particulate Matter in Several Cities by Month and City (μgr/m3), 2011 and 2012
Tabel –––––– 1.2.5Table
Bulan/TahunMonth/Year
Sumut/Sampali
Sumut/Bawil 1
Sumbar/ Sicincin
Sumbar/ Koto
Tabang
Riau/ Simpang
Tiga
Jambi/St.Thaha
Sumsel/ Kenten
Kep.Riau/Tarempa
(1) (2) (3) (4) (5) (6) (7) (8) (9)
Januari 2011 247,65 1 – – 20,24 130,65 69,34 101,65 –January 2012 322,15 1 104,95 60,34 17,64 149,15 78,84 253,75 1 –
Februari 2011 202,25 – 36,14 27,94 189,75 84,04 136,45 –February 2012 355,55 1 145,15 21,64 6,83 133,15 73,34 181,05 –
Maret 2011 192,35 77,24 27,84 25,04 162,75 122,25 147,55 –March 2012 487,55 1 111,25 56,54 14,04 176,15 99,04 122,75 –
April 2011 415,25 1 110,35 – 16,74 152,15 103,25 185,35 –April 2012 373,55 1 98,54 29,04 18,54 127,85 – 124,35 –
Mei 2011 180,35 90,54 51,64 26,94 197,35 150,65 198,25 –May 2012 789,15 1 80,64 – 17,84 154,75 – 191,65 –
Juni 2011 155,65 105,95 38,24 10,84 208,15 133,45 189,35 –June 2012 205,97 169,55 68,14 – 338,25 1 – 161,35 –
Juli 2011 185,35 140,75 57,61 19,34 285,45 1 103,35 212,45 –July 2012 135,71 97,64 60,44 – 235,55 1 – 712,85 1 –
Agustus 2011 156,35 105,55 45,74 16,94 315,75 1 177,85 372,15 1 –August 2012 225,84 153,15 – – 490,05 1 – 61,54 –
September 2011 234,95 1 106,45 74,74 16,04 190,35 – 437,95 1 –September 2012 133,05 94,94 – – 368,95 1 – 816,05 1 100,15
Oktober 2011 176,15 56,44 – 8,13 97,64 108,35 358,75 1 –October 2012 – – – – – – – –
November 2011 254,55 1 77,04 – 2,93 101,85 79,24 157,95 –November 2012 120,45 – – 17,84 113,85 – 170,05 72,44
Desember 2011 279,55 1 98,34 – 3,03 86,44 94,64 152,35 –December 2012 130,35 – – 32,24 125,15 – 183,15 –
http
://www.b
ps.g
o.id
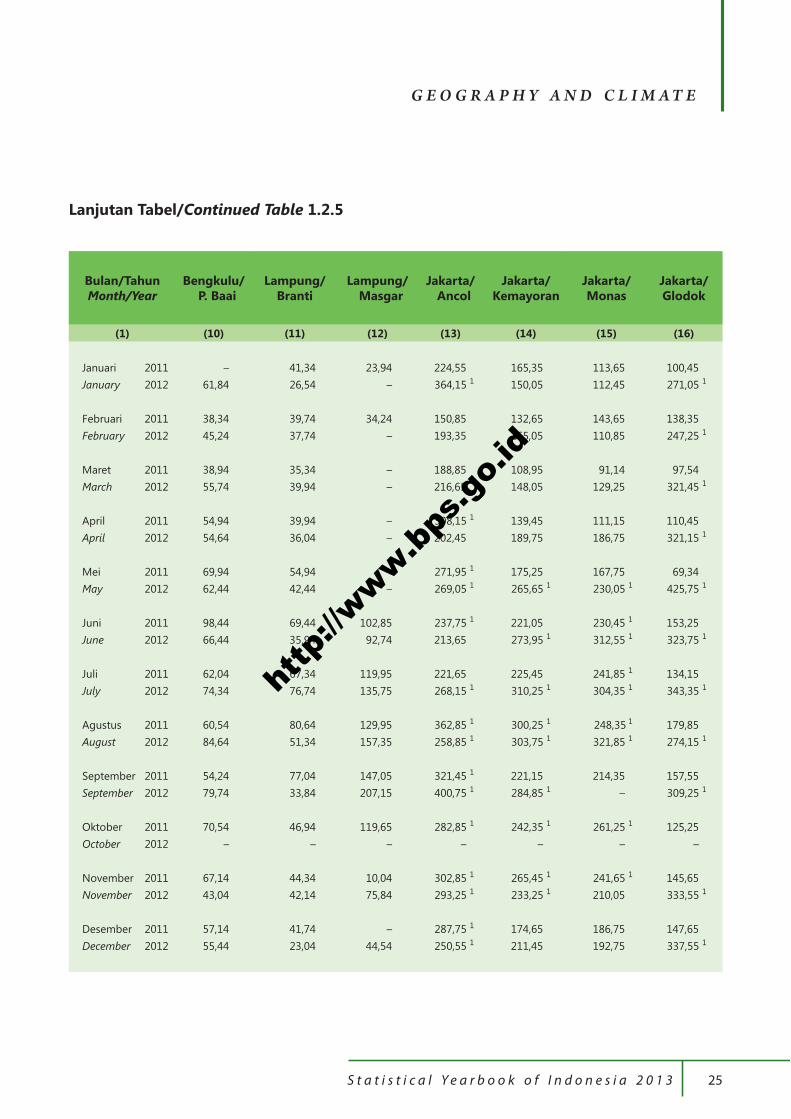
G E O G R A P H Y A N D C L I M A T E
S t a t i s t i c a l Y e a r b o o k o f I n d o n e s i a 2 0 1 3 25
Lanjutan Tabel/Continued Table 1.2.5
Bulan/TahunMonth/Year
Bengkulu/ P. Baai
Lampung/Branti
Lampung/ Masgar
Jakarta/ Ancol
Jakarta/ Kemayoran
Jakarta/Monas
Jakarta/Glodok
(1) (10) (11) (12) (13) (14) (15) (16)
Januari 2011 – 41,34 23,94 224,55 165,35 113,65 100,45January 2012 61,84 26,54 – 364,15 1 150,05 112,45 271,05 1
Februari 2011 38,34 39,74 34,24 150,85 132,65 143,65 138,35February 2012 45,24 37,74 – 193,35 165,05 110,85 247,25 1
Maret 2011 38,94 35,34 – 188,85 108,95 91,14 97,54March 2012 55,74 39,94 – 216,65 148,05 129,25 321,45 1
April 2011 54,94 39,94 – 308,15 1 139,45 111,15 110,45April 2012 54,64 36,04 – 202,45 189,75 186,75 321,15 1
Mei 2011 69,94 54,94 – 271,95 1 175,25 167,75 69,34May 2012 62,44 42,44 – 269,05 1 265,65 1 230,05 1 425,75 1
Juni 2011 98,44 69,44 102,85 237,75 1 221,05 230,45 1 153,25June 2012 66,44 35,94 92,74 213,65 273,95 1 312,55 1 323,75 1
Juli 2011 62,04 67,34 119,95 221,65 225,45 241,85 1 134,15July 2012 74,34 76,74 135,75 268,15 1 310,25 1 304,35 1 343,35 1
Agustus 2011 60,54 80,64 129,95 362,85 1 300,25 1 248,35 1 179,85August 2012 84,64 51,34 157,35 258,85 1 303,75 1 321,85 1 274,15 1
September 2011 54,24 77,04 147,05 321,45 1 221,15 214,35 157,55September 2012 79,74 33,84 207,15 400,75 1 284,85 1 – 309,25 1
Oktober 2011 70,54 46,94 119,65 282,85 1 242,35 1 261,25 1 125,25October 2012 – – – – – – –
November 2011 67,14 44,34 10,04 302,85 1 265,45 1 241,65 1 145,65November 2012 43,04 42,14 75,84 293,25 1 233,25 1 210,05 333,55 1
Desember 2011 57,14 41,74 – 287,75 1 174,65 186,75 147,65December 2012 55,44 23,04 44,54 250,55 1 211,45 192,75 337,55 1
http
://www.b
ps.g
o.id

G E O G R A F I D A N I K L I M
S t a t i s t i k I n d o n e s i a 2 0 1 326
Lanjutan Tabel/Continued Table 1.2.5
Bulan/TahunMonth/Year
Jabar/ Bandung
Jabar/ Citeko
Jabar/ Darmaga
Banten/ Tangerang
Banten/ Ciledug
Jateng/ Semarang
Jateng/ Cilacap
(1) (17) (18) (19) (20) (21) (22) (23)
Januari 2011 135,35 34,04 85,14 140,65 165,95 92,04 57,14January 2012 122,25 18,24 78,24 257,65 1 – 167,15 45,34
Februari 2011 134,65 31,24 88,44 – 172,85 119,75 52,64February 2012 107,15 24,84 80,94 278,65 1 – 242,35 1 30,54
Maret 2011 176,55 35,64 79,34 131,45 109,05 127,85 42,74March 2012 101,65 27,04 69,64 333,75 1 114,85 174,35 46,04
April 2011 188,45 20,74 81,64 239,55 1 194,15 100,65 45,14April 2012 131,85 38,44 108,45 386,85 1 178,25 272,95 1 32,04
Mei 2011 211,95 32,64 130,35 284,85 1 200,25 167,05 33,84May 2012 161,65 33,14 125,15 409,95 1 207,05 301,25 1 23,94
Juni 2011 217,05 36,84 165,05 423,65 1 219,45 – 74,24June 2012 207,35 53,24 133,05 517,95 1 233,15 1 373,35 1 20,44
Juli 2011 289,45 1 75,84 166,35 – 189,38 255,25 1 40,04July 2012 235,55 1 87,44 153,75 966,75 1 266,15 1 346,65 1 30,24
Agustus 2011 259,05 1 94,64 199,15 345,29 1 261,09 1 303,95 1 60,14August 2012 272,75 1 106,45 178,35 611,25 1 308,95 1 383,05 1 32,44
September 2011 254,05 1 89,84 135,15 – 361,25 1 273,65 1 47,54September 2012 261,55 1 101,65 131,65 466,95 1 – 357,05 1 54,24
Oktober 2011 184,05 81,84 163,55 332,65 1 274,06 1 200,75 25,34October 2012 – – – – – – –
November 2011 135,55 39,34 120,05 260,45 1 307,95 1 189,05 25,24November 2012 141,65 51,04 116,85 196,95 125,55 141,45 39,74
Desember 2011 154,25 29,94 96,24 171,15 – 187,75 33,24December 2012 76,34 34,34 73,94 177,45 94,84 155,15 63,84
http
://www.b
ps.g
o.id
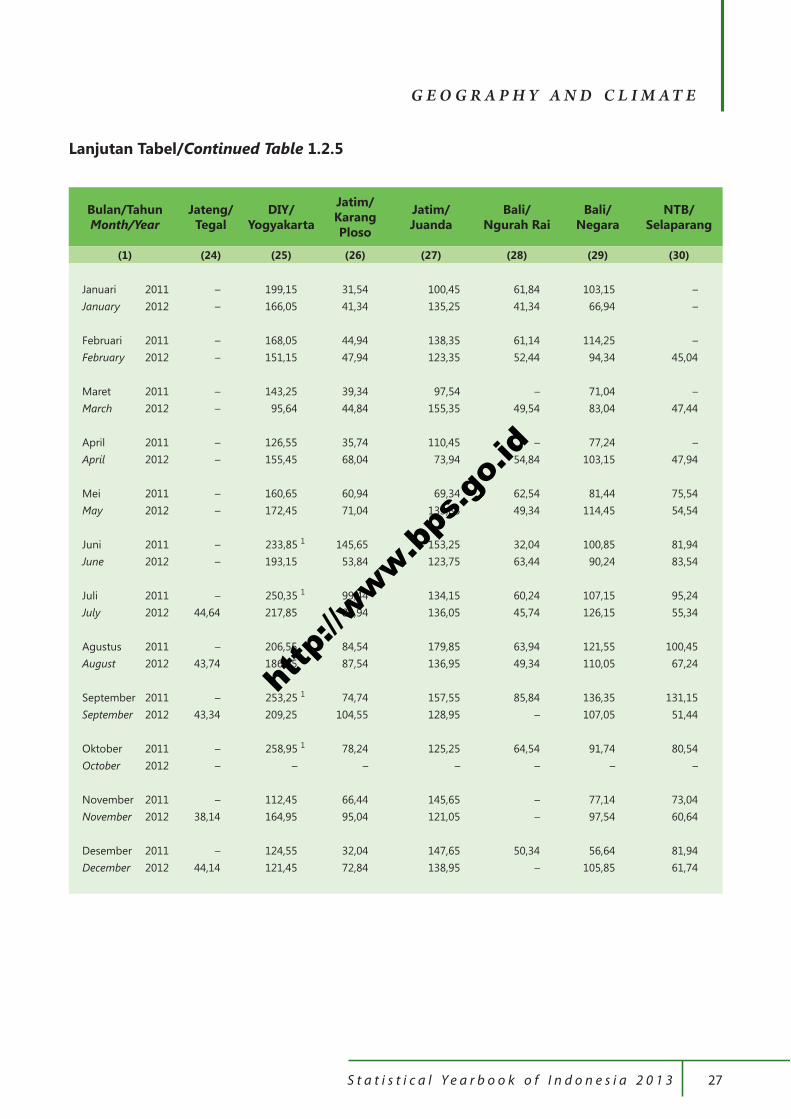
G E O G R A P H Y A N D C L I M A T E
S t a t i s t i c a l Y e a r b o o k o f I n d o n e s i a 2 0 1 3 27
Lanjutan Tabel/Continued Table 1.2.5
Bulan/TahunMonth/Year
Jateng/ Tegal
DIY/ Yogyakarta
Jatim/ Karang Ploso
Jatim/Juanda
Bali/ Ngurah Rai
Bali/ Negara
NTB/ Selaparang
(1) (24) (25) (26) (27) (28) (29) (30)
Januari 2011 – 199,15 31,54 100,45 61,84 103,15 –January 2012 – 166,05 41,34 135,25 41,34 66,94 –
Februari 2011 – 168,05 44,94 138,35 61,14 114,25 –February 2012 – 151,15 47,94 123,35 52,44 94,34 45,04
Maret 2011 – 143,25 39,34 97,54 – 71,04 –March 2012 – 95,64 44,84 155,35 49,54 83,04 47,44
April 2011 – 126,55 35,74 110,45 – 77,24 –April 2012 – 155,45 68,04 73,94 54,84 103,15 47,94
Mei 2011 – 160,65 60,94 69,34 62,54 81,44 75,54May 2012 – 172,45 71,04 133,85 49,34 114,45 54,54
Juni 2011 – 233,85 1 145,65 153,25 32,04 100,85 81,94June 2012 – 193,15 53,84 123,75 63,44 90,24 83,54
Juli 2011 – 250,35 1 99,44 134,15 60,24 107,15 95,24July 2012 44,64 217,85 83,94 136,05 45,74 126,15 55,34
Agustus 2011 – 206,55 84,54 179,85 63,94 121,55 100,45August 2012 43,74 186,45 87,54 136,95 49,34 110,05 67,24
September 2011 – 253,25 1 74,74 157,55 85,84 136,35 131,15September 2012 43,34 209,25 104,55 128,95 – 107,05 51,44
Oktober 2011 – 258,95 1 78,24 125,25 64,54 91,74 80,54October 2012 – – – – – – –
November 2011 – 112,45 66,44 145,65 – 77,14 73,04November 2012 38,14 164,95 95,04 121,05 – 97,54 60,64
Desember 2011 – 124,55 32,04 147,65 50,34 56,64 81,94December 2012 44,14 121,45 72,84 138,95 – 105,85 61,74
http
://www.b
ps.g
o.id
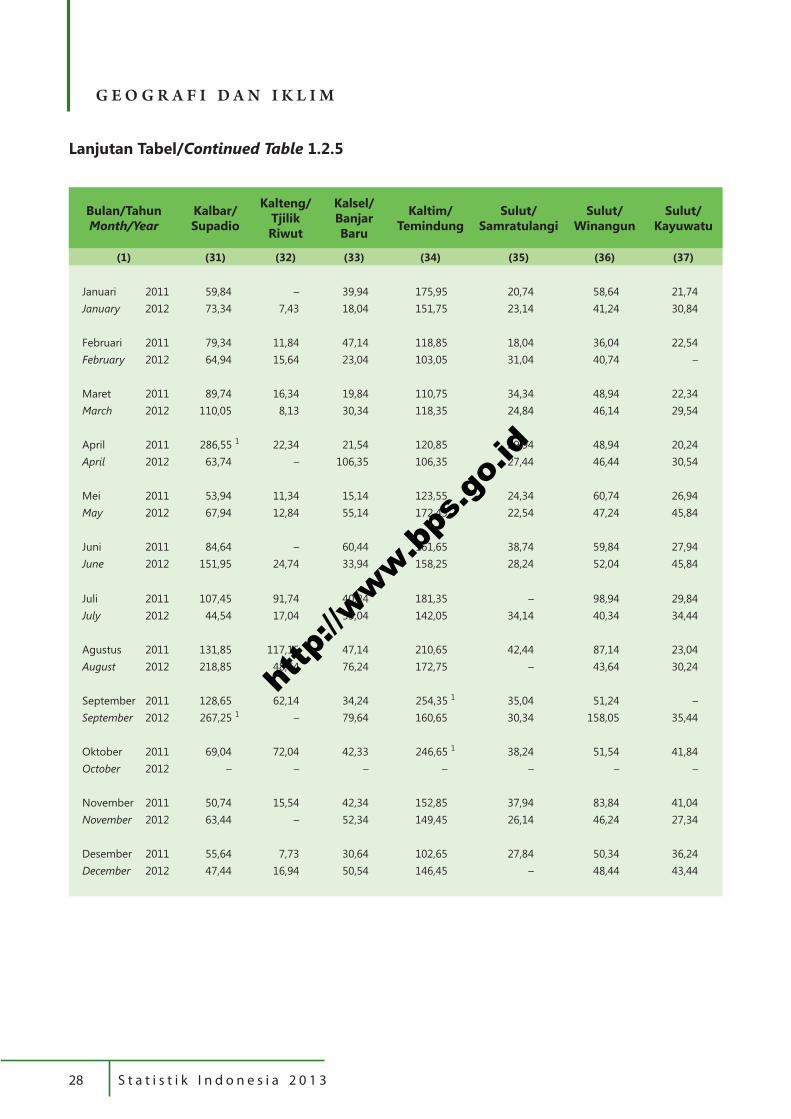
G E O G R A F I D A N I K L I M
S t a t i s t i k I n d o n e s i a 2 0 1 328
Lanjutan Tabel/Continued Table 1.2.5
Bulan/TahunMonth/Year
Kalbar/Supadio
Kalteng/Tjilik Riwut
Kalsel/ BanjarBaru
Kaltim/ Temindung
Sulut/ Samratulangi
Sulut/ Winangun
Sulut/Kayuwatu
(1) (31) (32) (33) (34) (35) (36) (37)
Januari 2011 59,84 – 39,94 175,95 20,74 58,64 21,74January 2012 73,34 7,43 18,04 151,75 23,14 41,24 30,84
Februari 2011 79,34 11,84 47,14 118,85 18,04 36,04 22,54February 2012 64,94 15,64 23,04 103,05 31,04 40,74 –
Maret 2011 89,74 16,34 19,84 110,75 34,34 48,94 22,34March 2012 110,05 8,13 30,34 118,35 24,84 46,14 29,54
April 2011 286,55 1 22,34 21,54 120,85 29,94 48,94 20,24April 2012 63,74 – 106,35 106,35 27,44 46,44 30,54
Mei 2011 53,94 11,34 15,14 123,55 24,34 60,74 26,94May 2012 67,94 12,84 55,14 172,45 22,54 47,24 45,84
Juni 2011 84,64 – 60,44 161,65 38,74 59,84 27,94June 2012 151,95 24,74 33,94 158,25 28,24 52,04 45,84
Juli 2011 107,45 91,74 40,24 181,35 – 98,94 29,84July 2012 44,54 17,04 55,04 142,05 34,14 40,34 34,44
Agustus 2011 131,85 117,15 47,14 210,65 42,44 87,14 23,04August 2012 218,85 48,64 76,24 172,75 – 43,64 30,24
September 2011 128,65 62,14 34,24 254,35 1 35,04 51,24 –September 2012 267,25 1 – 79,64 160,65 30,34 158,05 35,44
Oktober 2011 69,04 72,04 42,33 246,65 1 38,24 51,54 41,84October 2012 – – – – – – –
November 2011 50,74 15,54 42,34 152,85 37,94 83,84 41,04November 2012 63,44 – 52,34 149,45 26,14 46,24 27,34
Desember 2011 55,64 7,73 30,64 102,65 27,84 50,34 36,24December 2012 47,44 16,94 50,54 146,45 – 48,44 43,44
http
://www.b
ps.g
o.id

G E O G R A P H Y A N D C L I M A T E
S t a t i s t i c a l Y e a r b o o k o f I n d o n e s i a 2 0 1 3 29
Lanjutan Tabel/Continued Table 1.2.5
Bulan/TahunMonth/Year
Sulsel/ Panakukang
Sulsel/ Bawil 4
Sulteng/Mutiara
Sultra/ Beto
Ambari
Sulbar/Majene
Maluku/Patimura
Papua/ Mokmer
Papua/ Angkasa
Pura
(1) (38) (39) (40) (41) (42) (43) (44) (45)
Januari 2011 96,64 74,34 – 9,43 – 11,44 19,64 19,44January 2012 98,94 87,44 – 26,04 58,24 16,84 – 32,74
Februari 2011 160,75 111,45 – 5,33 – 12,24 22,74 13,24February 2012 118,25 82,74 – 24,74 32,54 17,24 – 56,14
Maret 2011 137,75 145,25 – 11,94 – 11,74 16,74 9,33March 2012 118,45 78,64 – 56,94 46,14 20,34 – 45,54
April 2011 167,95 – – 20,34 – 11,54 – 7,73April 2012 201,85 106,85 – 64,54 46,74 16,24 – 36,94
Mei 2011 178,75 – – 19,14 – 11,94 – 3,13May 2012 130,55 104,05 – 23,44 35,34 34,54 – 27,74
Juni 2011 207,35 – 77,14 25,14 – 25,74 21,36 4,63June 2012 174,15 107,65 – 33,94 35,94 7,33 – 12,74
Juli 2011 299,55 1 – 48,24 27,64 – 7,63 33,79 4,13July 2012 190,45 98,04 – 38,34 38,04 7,23 – 19,14
Agustus 2011 338,15 1 – – 32,54 – 15,74 29,44 5,33August 2012 294,45 1 – 41,14 40,84 14,04 – 23,54
September 2011 253,65 1 – – 37,34 – 14,24 30,04 1,33September 2012 318,85 1 – – 53,34 42,44 21,44 – 127,45
Oktober 2011 188,05 – – 47,24 – 14,14 46,64 2,63October 2012 – – – – – – – –
November 2011 199,85 – – 30,74 – 21,34 30,84 34,74November 2012 145,55 – – 48,44 34,24 17,64 28,24 153,75
Desember 2011 113,55 – – 26,94 – 19,34 – 36,04December 2012 116,35 – – 32,74 26,94 22,14 21,14 162,75
Catatan/Note: 1 Melewati ambang batas 230 μgr/m3/24 jam/Over threshold 230 μgr/m3/24 hoursSumber/Source: Badan Meteorologi, Klimatologi, dan Geofisika/Meteorology, Climatology, and Geophysics Agency
http
://www.b
ps.g
o.id

G E O G R A F I D A N I K L I M
S t a t i s t i k I n d o n e s i a 2 0 1 330
[Diolah dari dokumen kepabeanan Ditjen Bea dan Cukai (PIB)/Based on customs declaration documents from Directorate General of Customs and Excise (Imports Declaration)]
KomoditiCommodity
Kode HSHS Code 2010 2011 2012
(1) (2) (3) (4) (5)
Carbon Tetrachloride 2903.14.00.00 – – –
1,1,1, Trichloroethane 2903.19.20.00 – – –
Bromomethane (Methyl bromide) 2903.39.10.00 2 170,20 1 372,60 247 ,20
Chlorodifluoromethane 2903.71.00.00 6 162,96 1 5 511,88 1 3 478,77
Diclorotrifluoroethanes 2903.72.00.00 ... ... 137,75
Diclorofluoroethanes 2903.73.00.00 ... ... 875,38
Chlorodifluoroethanes 2903.74.00.00 ... ... 300,69
Dicloropentafluoropropanes 2903.75.00.00 ... ... 27,11
Bromochlorodifluoromethane, Bromotrifluoro methane, and dibromotetrafluoroethane 2903.76.00.00 – – –
Other, perhalogenated only with fluorine and chlorine 2903.77.00.00 137,84 65,62 20,00
Other, halogenated derivatives of cyclanic, cyclenic, or cycloterpenic hydrocarbon 2903.79.00.00 ... ... 579,25
Other mixtures containing halogenated, derivatives methane, ethane containing cfcs, pfcs, hfcs
3824.71.90.00 – – 29,35
Catatan/Notes: 1 Data tahun 2010 dan 2011 merupakan gabungan dari komoditi dengan kode HS 2903.71.00.00, 2903.72.00.00, 2903.73.00.00, 2903.74.00.00, 2903.75.00.00 dan 2903.79.00.00 ( karena ada perubahan kode HS 2012)
Jenis Bahan Perusak Lapisan Ozon Menurut Peraturan Menteri Perdagangan Republik Indonesia No.03/M-DAG/PER/1/2012 The 2010 and 2011 data are composite of commodities with HS Code 2903.71.00.00, 2903.72.00.00, 2903.73.00.00, 2903.74.00.00,
2903.75.00.00 and 2903.79.00.00 (due to the change of 2012 HS Code) Ozone Depleting Substance According to the Regulation of the Minister of Trade of the Republic of Indonesia No.03/M-DAG/PER/1/2012
Impor Komoditi Bahan Perusak Lapisan Ozon (ton), 2010–2012Commodities Import of Ozone Depleting Substance (ton), 2010–2012
Tabel–––––– 1.2.6Table
http
://www.b
ps.g
o.id

G O V E R N M E N T
S t a t i s t i c a l Y e a r b o o k o f I n d o n e s i a 2 0 1 3 31
2PEMERINTAHANGovernment
http
://www.b
ps.g
o.id

http
://www.b
ps.g
o.id
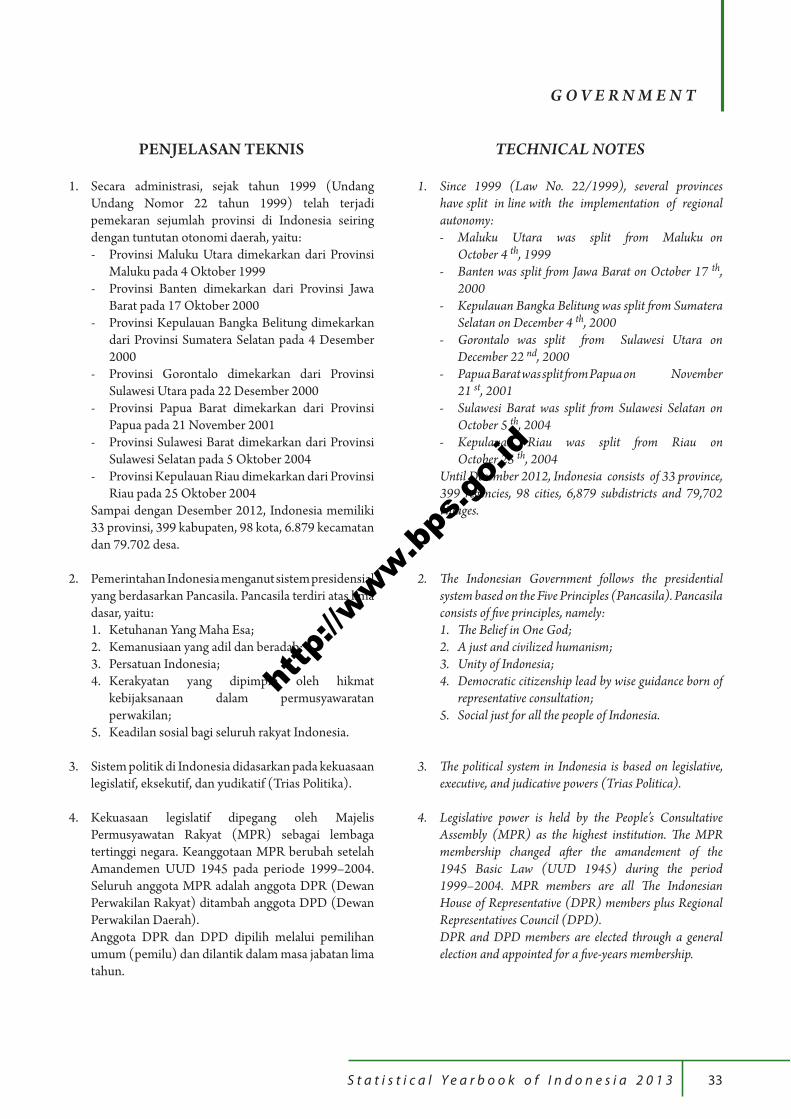
G O V E R N M E N T
S t a t i s t i c a l Y e a r b o o k o f I n d o n e s i a 2 0 1 3 33
PENJELASAN TEKNIS
1. Secara administrasi, sejak tahun 1999 (Undang Undang Nomor 22 tahun 1999) telah terjadi pemekaran sejumlah provinsi di Indonesia seiring dengan tuntutan otonomi daerah, yaitu:
- Provinsi Maluku Utara dimekarkan dari Provinsi Maluku pada 4 Oktober 1999
- Provinsi Banten dimekarkan dari Provinsi Jawa Barat pada 17 Oktober 2000
- Provinsi Kepulauan Bangka Belitung dimekarkan dari Provinsi Sumatera Selatan pada 4 Desember 2000
- Provinsi Gorontalo dimekarkan dari Provinsi Sulawesi Utara pada 22 Desember 2000
- Provinsi Papua Barat dimekarkan dari Provinsi Papua pada 21 November 2001
- Provinsi Sulawesi Barat dimekarkan dari Provinsi Sulawesi Selatan pada 5 Oktober 2004
- Provinsi Kepulauan Riau dimekarkan dari Provinsi Riau pada 25 Oktober 2004
Sampai dengan Desember 2012, Indonesia memiliki 33 provinsi, 399 kabupaten, 98 kota, 6.879 kecamatan dan 79.702 desa.
2. Pemerintahan Indonesia menganut sistem presidensial yang berdasarkan Pancasila. Pancasila terdiri atas lima dasar, yaitu:
1. Ketuhanan Yang Maha Esa; 2. Kemanusiaan yang adil dan beradab; 3. Persatuan Indonesia; 4. Kerakyatan yang dipimpin oleh hikmat
kebijaksanaan dalam permusyawaratan perwakilan;
5. Keadilan sosial bagi seluruh rakyat Indonesia.
3. Sistem politik di Indonesia didasarkan pada kekuasaan legislatif, eksekutif, dan yudikatif (Trias Politika).
4. Kekuasaan legislatif dipegang oleh Majelis Permusyawatan Rakyat (MPR) sebagai lembaga tertinggi negara. Keanggotaan MPR berubah setelah Amandemen UUD 1945 pada periode 1999–2004. Seluruh anggota MPR adalah anggota DPR (Dewan Perwakilan Rakyat) ditambah anggota DPD (Dewan Perwakilan Daerah).
Anggota DPR dan DPD dipilih melalui pemilihan umum (pemilu) dan dilantik dalam masa jabatan lima tahun.
TECHNICAL NOTES
1. Since 1999 (Law No. 22/1999), several provinces have split in line with the implementation of regional autonomy:
- Maluku Utara was split from Maluku on October 4 th, 1999
- Banten was split from Jawa Barat on October 17 th, 2000
- Kepulauan Bangka Belitung was split from Sumatera Selatan on December 4 th, 2000
- Gorontalo was split from Sulawesi Utara on December 22 nd, 2000
- Papua Barat was split from Papua on November 21 st, 2001
- Sulawesi Barat was split from Sulawesi Selatan on October 5 th, 2004
- Kepulauan Riau was split from Riau on October 25 th, 2004
Until December 2012, Indonesia consists of 33 province, 399 regencies, 98 cities, 6,879 subdistricts and 79,702 villages.
2. The Indonesian Government follows the presidential system based on the Five Principles (Pancasila). Pancasila consists of five principles, namely:
1. The Belief in One God; 2. A just and civilized humanism; 3. Unity of Indonesia; 4. Democratic citizenship lead by wise guidance born of
representative consultation; 5. Social just for all the people of Indonesia.
3. The political system in Indonesia is based on legislative, executive, and judicative powers (Trias Politica).
4. Legislative power is held by the People’s Consultative Assembly (MPR) as the highest institution. The MPR membership changed after the amandement of the 1945 Basic Law (UUD 1945) during the period 1999–2004. MPR members are all The Indonesian House of Representative (DPR) members plus Regional Representatives Council (DPD).
DPR and DPD members are elected through a general election and appointed for a five-years membership.
http
://www.b
ps.g
o.id
P E M E R I N T A H A N
S t a t i s t i k I n d o n e s i a 2 0 1 334
5. Lembaga eksekutif berpusat pada presiden, wakil presiden, dan kabinet. Sistem pemerintahan di Indonesia adalah Presidensial, sehingga para menteri berada di bawah dan bertanggung jawab kepada presiden.
6. Lembaga yudikatif sejak masa reformasi dan adanya amandemen UUD 1945 dijalankan oleh Mahkamah Agung, termasuk pengaturan administrasi para hakim.
7. Susunan pemerintahan Republik Indonesia periode tahun 2009–2014 terdiri dari presiden, wakil presiden, lembaga tinggi negara, kementerian, setingkat menteri, dan Lembaga Pemerintahan Non Kementerian (LPNK).
8. Lembaga tinggi negara terdiri dari Majelis Permusyawaran Rakyat (MPR), Dewan Perwakilan Rakyat (DPR), Badan Pemeriksa Keuangan (BPK), dan Mahkamah Agung (MA).
9. Kementerian terdiri dari kementerian koordinator, kementerian, dan kementerian negara.
10. Kementerian koordinator terdiri dari bidang politik, hukum, dan keamanan (Polhukam), bidang perekonomian, dan bidang kesejahteraan rakyat.
11. Kementerian terdiri dari Sekretariat Negara, Kementerian Dalam Negeri, Kementerian Luar Negeri, Kementerian Pertahanan, Kementerian Hukum dan Hak Asasi Manusia, Kementerian Keuangan, Kementerian Energi dan Sumber Daya Mineral, Kementerian Perindustrian, Kementerian Perdagangan, Kementerian Pertanian, Kementerian Kehutanan, Kementerian Perhubungan, Kementerian Kelautan dan Perikanan, Kementerian Tenaga Kerja dan Transmigrasi, Kementerian Pekerjaan Umum, Kementerian Kesehatan, Kementerian Pendidikan dan Kebudayaan, Kementerian Sosial, Kementerian Agama, Kementerian Pariwisata dan Ekonomi Kreatif, dan Kementerian Komunikasi dan Informatika.
12. Kementerian Negara terdiri dari Kementerian Negara Badan Usaha Milik Negara, Kementerian Negara Koperasi dan Usaha Kecil dan Menengah (UKM), Kementerian Negara Lingkungan Hidup,
5. The executives consist of president, vice president, and ministerial cabinet. In Indonesia the ministerial cabinet follows the Presidential Cabinet system where every minister is responsible to the president and does not represent political parties in the parliament.
6. Since the reformation era and after the amandement of UUD 1945, The judicative power has been run by the Supreme Court, including the administrative arrangement of judges.
7. The government structure of the Republic of Indonesia period 2009–2014 consist of president, vice president, state higher institution, ministry, ministry level institution, and non ministry institution.
8. State higher institution consist of People’s Consultative Assembly, The House of Representative, The Audit Board of the Republic of Indonesia, and Supreme Court.
9. Ministry consist of coordinating ministry, departmental ministry, and state ministry.
10. Coordinating ministry consist of Coordinating Ministry for Political, Legal, and Security Affairs, Coordinating Ministry for the Economy, and Coordinating Ministry for People Welfare.
11. Departmental Ministry consist of State Secretary, Ministry of Home Affairs, Ministry of Foreign Affairs, Ministry of Defense, Ministry of Justice and Human Rights, Ministry of Finance, Ministry of Energy and Mineral Resources, Ministry of Industry, Ministry of Trade, Ministry of Agriculture, Ministry of Forestry, Ministry of Transportation, Ministry of Maritime Affairs and Fisheries, Ministry of Manpower and Transmigration, Ministry of Public Work, Ministry of Health, Ministry of Education and Culture, Ministry of Social Services, Ministry of Religious Affairs, Ministry of Tourism and Creative Economy, and Ministry of Communication and Informatics.
12. State Ministry consist of State Ministry for State Owned Enterprises, State Ministry for Cooperatives and Small and Medium Enterprises, State Ministry of Environment, State Ministry for the Empowerment of State Apparatus
http
://www.b
ps.g
o.id
G O V E R N M E N T
S t a t i s t i c a l Y e a r b o o k o f I n d o n e s i a 2 0 1 3 35
Kementerian Negara Pendayagunaan Aparatur Negara dan Reformasi Birokrasi, Kementerian Negara Perencanaan Pembangunan Nasional, Kementerian Negara Pemberdayaan Perempuan dan Perlindungan Anak, Kementerian Negara Pembangunan Daerah Tertinggal, Kementerian Negara Pemuda dan Olahraga, Kementerian Negara Perumahan Rakyat, dan Kementerian Negara Riset dan Teknologi.
13. Setingkat Menteri terdiri dari Sekretariat Kabinet, Kejaksaan Agung, Tentara Nasional Indonesia, Kepolisian Negara Republik Indonesia, dan unit kerja Presiden Bidang Pengawasan dan Pengendalian Pembangunan.
14. Lembaga Pemerintahan Non Kementerian terdiri dari Arsip Nasional Republik Indonesia, Badan Intelijen Negara, Badan Kepegawaian Negara, Badan Kependudukan dan Keluarga Berencana Nasional, Badan Koordinasi Penanaman Modal, Badan Koordinasi Survei dan Pemetaan Nasional, Badan Meteorologi, Klimatologi, dan Geofisika, Badan Narkotika Nasional, Badan Nasional Penanggulangan Bencana, Badan Nasional Penanggulangan Terorisme, Badan Nasional Penempatan dan Perlindungan Tenaga Kerja Indonesia, Badan Pengawasan Obat dan Makanan, Badan Pengawasan Perdagangan Berjangka Komoditi, Badan Pengawas Tenaga Nuklir, Badan Pengawasan Keuangan dan Pembangunan, Badan Pengembangan Kebudayaan dan Pariwisata, Badan Pengkajian dan Penerapan Teknologi, Badan Perencanaan Pembangunan Nasional, Badan Pertanahan Nasional, Badan Pusat Statistik, Badan SAR Nasional, Badan Standardisasi Nasional, Badan Tenaga Nuklir Nasional, Badan Urusan Logistik, Lembaga Administrasi Negara, Lembaga Ilmu Pengetahuan Indonesia, Lembaga Ketahanan Nasional, Lembaga Kebijakan Pengadaan Barang/Jasa Pemerintah, Lembaga Penerbangan dan Antariksa Nasional, Lembaga Sandi Negara, dan Perpustakaan Negara Republik Indonesia.
15. Cakupan statistik keuangan negara meliputi keuangan pemerintah pusat, keuangan pemerintah daerah provinsi, keuangan pemerintah kabupaten/kota, dan keuangan pemerintah desa.
16. Statistik keuangan pemerintah pusat bersumber dari Kementerian Keuangan, sedangkan Statistik Keuangan
and Bureaucracy Reform, State Ministry for the National Development Planning Agency, State Ministry for Women Empowerment and Child Protection, State Ministry for Acceleration Development Backward Regions, State Ministry for Youth and Sports Affairs, State Ministry for Public Housing, and State Ministry for Research and Technology.
13. Ministry Level Officials consist of Attorney General, Indonesian National Defense Force, Indonesian Police, and Chief of The Presidential Work Unit for Development Monitoring and Control.
14. Non Ministry Institution consist of National Archive of the Republic of Indonesia, State Intelligence Board, National Civil Service Agency, National Population and Family Planning Board, Investment Coordinating Board, National Coordinating Agency for Surveys and Mapping, Meteorology, Climatology, and Geophysics Board, National Narcotics Agency, National Agency for Disaster Management, National Counter Terrorism Agency, Protection Agency and Indonesian Manpower Placement, National Agency of Drugs and Foods Control, Commodity Futures Trading Controlling Board, Nuclear Energy Controlling Board, Audit and Development Supervising Agency, Culture and Tourism Development Board, Agency for the Assesment and Application Technology, National Development Planning Board, National Land Agency, BPS-Statistics Indonesia, National Search and Rescue Agency, National Standardization Board, National Nuclear Energy Board, Logistic Concern Board, National Institute of Administration, National Institute of Science, National Resilience Institute, Government Procurement Policy Board, National Institute of Space and Aeronautics, National Crypto Agency, and National Library of Republic of Indonesia.
15. Public finance statistics consists of central government finance, provincial government finance, regency/city-level government finance, and village-level government finance.
16. Statistics on central government finance are obtained from the Ministry of Finance, while data on provincial
http
://www.b
ps.g
o.id

P E M E R I N T A H A N
S t a t i s t i k I n d o n e s i a 2 0 1 336
Pemerintah Daerah Provinsi dan Kabupaten/Kota dikumpulkan oleh Badan Pusat Statistik melalui masing-masing kantor gubernur dan bupati/walikota. Sejak tahun 2000 sektor keuangan negara dihitung berdasarkan tahun kalender yang berakhir pada bulan Desember.
17. Pada Statistik Keuangan Pemerintah Desa, perkiraan pengeluaran dan pendapatan diperoleh dari Survei Keuangan Tingkat Desa berdasarkan sampel lebih kurang 10 persen dari seluruh desa di Indonesia.
and regency/city levels are collected by the BPS through the provincial and regency/city offices. Since 2000 the financial sector is based on calendar year ending in December.
17. At village level, the financial statistics are obtained through a Village Financial Survey. This survey is conducted on a sample basis covering about 10 percent of the total villages in Indonesia.
http
://www.b
ps.g
o.id

G O V E R N M E N T
S t a t i s t i c a l Y e a r b o o k o f I n d o n e s i a 2 0 1 3 37
Jumlah Kabupaten Menurut Provinsi, 2008–2012Number of Regencies by Province, 2008–2012
Tabel –––––– 2.1.1Table
2.1 WILAYAH ADMINISTRATIF ADMINISTRATIVE AREA
ProvinsiProvince 2008 2009 2010 2011 2012
(1) (2) (3) (4) (5) (6)
Aceh 18 18 18 18 18Sumatera Utara 23 25 25 25 25Sumatera Barat 12 12 12 12 12Riau 9 10 10 10 10Kepulauan Riau 5 5 5 5 5Jambi 9 9 9 9 9Sumatera Selatan 11 11 11 11 11Kepulauan Bangka Belitung 6 6 6 6 6Bengkulu 9 9 9 9 9Lampung 9 12 12 12 12
DKI Jakarta 1 1 1 1 1Jawa Barat 17 17 17 17 17Banten 4 4 4 4 4Jawa Tengah 29 29 29 29 29DI Yogyakarta 4 4 4 4 4Jawa Timur 29 29 29 29 29
Bali 8 8 8 8 8Nusa Tenggara Barat 8 8 8 8 8Nusa Tenggara Timur 19 20 20 20 20
Kalimantan Barat 12 12 12 12 12Kalimantan Tengah 13 13 13 13 13Kalimantan Selatan 11 11 11 11 11Kalimantan Timur 10 10 10 10 10
Sulawesi Utara 11 11 11 11 11Gorontalo 5 5 5 5 5Sulawesi Tengah 10 10 10 10 10Sulawesi Selatan 21 21 21 21 21Sulawesi Barat 5 5 5 5 5Sulawesi Tenggara 10 10 10 10 10
Maluku 9 9 9 9 9Maluku Utara 6 7 7 7 7Papua 26 28 28 28 28Papua Barat 8 10 10 10 10
Indonesia 387 399 399 399 399
Sumber/Source: Direktorat Jenderal Pemerintahan Umum, Kementerian Dalam Negeri Directorate General of Regional Authority, Ministry of Home Affairs
http
://www.b
ps.g
o.id
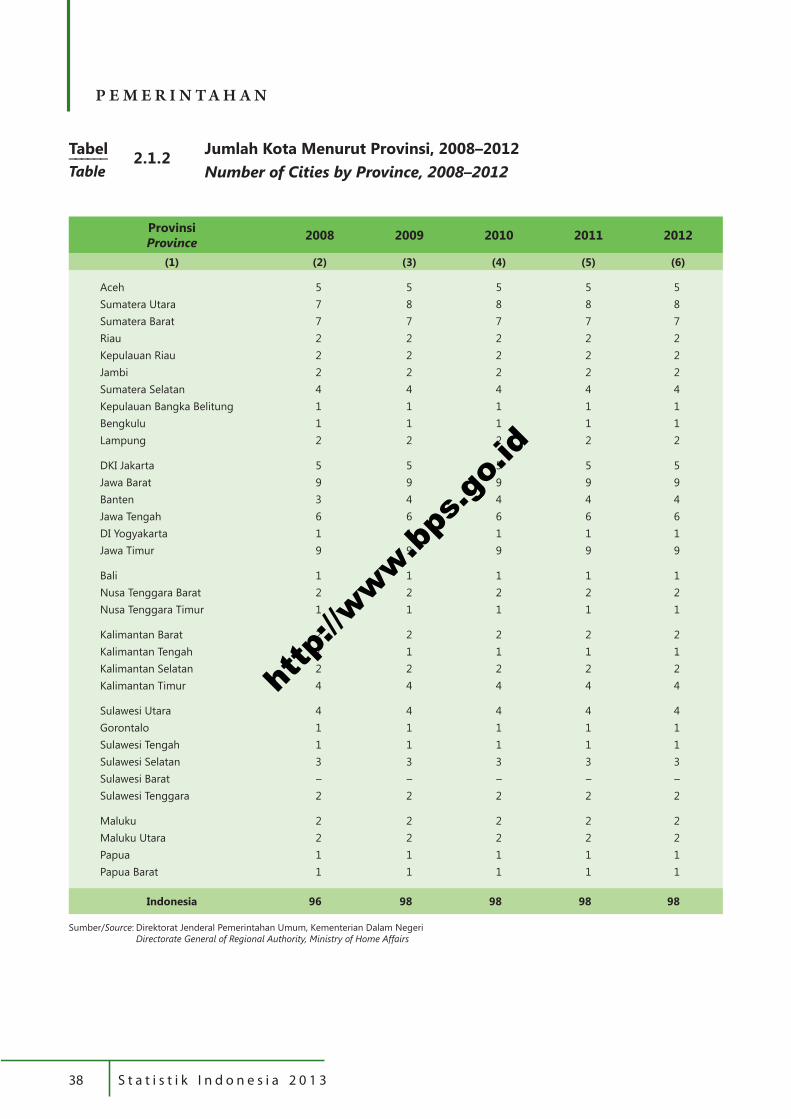
P E M E R I N T A H A N
S t a t i s t i k I n d o n e s i a 2 0 1 338
Jumlah Kota Menurut Provinsi, 2008–2012Number of Cities by Province, 2008–2012
Tabel –––––– 2.1.2Table
ProvinsiProvince 2008 2009 2010 2011 2012
(1) (2) (3) (4) (5) (6)
Aceh 5 5 5 5 5Sumatera Utara 7 8 8 8 8Sumatera Barat 7 7 7 7 7Riau 2 2 2 2 2Kepulauan Riau 2 2 2 2 2Jambi 2 2 2 2 2Sumatera Selatan 4 4 4 4 4Kepulauan Bangka Belitung 1 1 1 1 1Bengkulu 1 1 1 1 1Lampung 2 2 2 2 2
DKI Jakarta 5 5 5 5 5Jawa Barat 9 9 9 9 9Banten 3 4 4 4 4Jawa Tengah 6 6 6 6 6DI Yogyakarta 1 1 1 1 1Jawa Timur 9 9 9 9 9
Bali 1 1 1 1 1Nusa Tenggara Barat 2 2 2 2 2Nusa Tenggara Timur 1 1 1 1 1
Kalimantan Barat 2 2 2 2 2Kalimantan Tengah 1 1 1 1 1Kalimantan Selatan 2 2 2 2 2Kalimantan Timur 4 4 4 4 4
Sulawesi Utara 4 4 4 4 4Gorontalo 1 1 1 1 1Sulawesi Tengah 1 1 1 1 1Sulawesi Selatan 3 3 3 3 3Sulawesi Barat – – – – –Sulawesi Tenggara 2 2 2 2 2
Maluku 2 2 2 2 2Maluku Utara 2 2 2 2 2Papua 1 1 1 1 1Papua Barat 1 1 1 1 1
Indonesia 96 98 98 98 98
Sumber/Source: Direktorat Jenderal Pemerintahan Umum, Kementerian Dalam Negeri Directorate General of Regional Authority, Ministry of Home Affairs
http
://www.b
ps.g
o.id

G O V E R N M E N T
S t a t i s t i c a l Y e a r b o o k o f I n d o n e s i a 2 0 1 3 39
Jumlah Kecamatan Menurut Provinsi, 2008–2012Number of Subdistricts by Province, 2008–2012
Tabel –––––– 2.1.3Table
ProvinsiProvince 2008 2009 2010 2011 2012
(1) (2) (3) (4) (5) (6)
Aceh 276 276 280 287 289Sumatera Utara 407 417 419 421 422Sumatera Barat 166 176 176 176 176Riau 152 151 153 157 163Kepulauan Riau 59 59 59 59 63Jambi 128 128 131 131 138Sumatera Selatan 216 217 220 223 230Kepulauan Bangka Belitung 40 43 44 46 47Bengkulu 110 121 123 124 127Lampung 204 206 214 214 225
DKI Jakarta 44 44 44 44 44Jawa Barat 620 625 625 626 626Banten 154 154 154 154 155Jawa Tengah 573 573 573 573 573DI Yogyakarta 78 78 78 78 78Jawa Timur 661 662 662 662 664
Bali 57 57 57 57 57Nusa Tenggara Barat 116 116 116 116 116Nusa Tenggara Timur 285 287 289 293 306
Kalimantan Barat 175 175 175 176 176Kalimantan Tengah 119 125 125 130 136Kalimantan Selatan 149 151 151 151 152Kalimantan Timur 136 136 136 146 150
Sulawesi Utara 150 156 159 159 164Gorontalo 65 66 66 70 77Sulawesi Tengah 147 154 155 161 170Sulawesi Selatan 304 304 304 304 306Sulawesi Barat 66 69 69 69 69Sulawesi Tenggara 184 201 201 204 209
Maluku 70 73 77 86 95Maluku Utara 110 112 112 112 112Papua 368 385 385 389 389Papua Barat 131 154 167 175 175
Indonesia 6 520 6 651 6 699 6 773 6 879
Sumber/Source: Berdasarkan Laporan BPS Provinsi/Kabupaten/Kota Based on the BPS Province/Regency/City Report
http
://www.b
ps.g
o.id
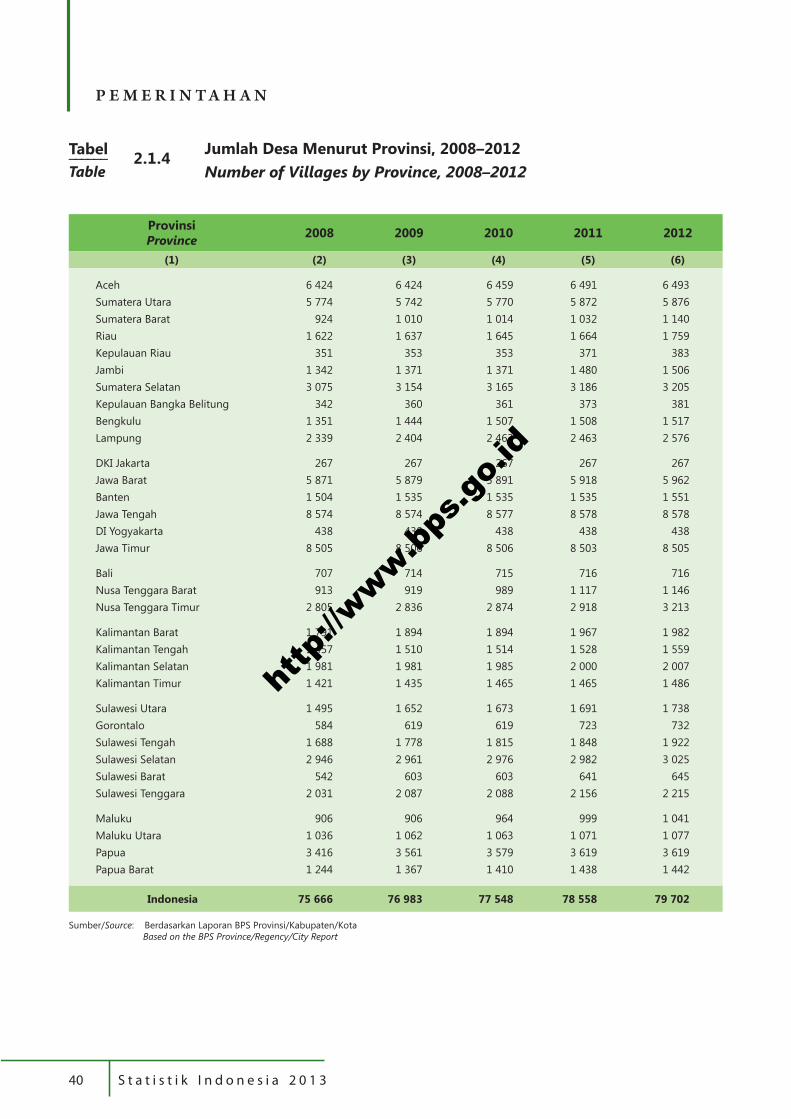
P E M E R I N T A H A N
S t a t i s t i k I n d o n e s i a 2 0 1 340
Jumlah Desa Menurut Provinsi, 2008–2012Number of Villages by Province, 2008–2012
Tabel –––––– 2.1.4Table
ProvinsiProvince 2008 2009 2010 2011 2012
(1) (2) (3) (4) (5) (6)
Aceh 6 424 6 424 6 459 6 491 6 493Sumatera Utara 5 774 5 742 5 770 5 872 5 876Sumatera Barat 924 1 010 1 014 1 032 1 140Riau 1 622 1 637 1 645 1 664 1 759Kepulauan Riau 351 353 353 371 383Jambi 1 342 1 371 1 371 1 480 1 506Sumatera Selatan 3 075 3 154 3 165 3 186 3 205Kepulauan Bangka Belitung 342 360 361 373 381Bengkulu 1 351 1 444 1 507 1 508 1 517Lampung 2 339 2 404 2 463 2 463 2 576
DKI Jakarta 267 267 267 267 267Jawa Barat 5 871 5 879 5 891 5 918 5 962Banten 1 504 1 535 1 535 1 535 1 551Jawa Tengah 8 574 8 574 8 577 8 578 8 578DI Yogyakarta 438 438 438 438 438Jawa Timur 8 505 8 506 8 506 8 503 8 505
Bali 707 714 715 716 716Nusa Tenggara Barat 913 919 989 1 117 1 146Nusa Tenggara Timur 2 805 2 836 2 874 2 918 3 213
Kalimantan Barat 1 791 1 894 1 894 1 967 1 982Kalimantan Tengah 1 457 1 510 1 514 1 528 1 559Kalimantan Selatan 1 981 1 981 1 985 2 000 2 007Kalimantan Timur 1 421 1 435 1 465 1 465 1 486
Sulawesi Utara 1 495 1 652 1 673 1 691 1 738Gorontalo 584 619 619 723 732Sulawesi Tengah 1 688 1 778 1 815 1 848 1 922Sulawesi Selatan 2 946 2 961 2 976 2 982 3 025Sulawesi Barat 542 603 603 641 645Sulawesi Tenggara 2 031 2 087 2 088 2 156 2 215
Maluku 906 906 964 999 1 041Maluku Utara 1 036 1 062 1 063 1 071 1 077Papua 3 416 3 561 3 579 3 619 3 619Papua Barat 1 244 1 367 1 410 1 438 1 442
Indonesia 75 666 76 983 77 548 78 558 79 702
Sumber/Source: Berdasarkan Laporan BPS Provinsi/Kabupaten/Kota Based on the BPS Province/Regency/City Report
http
://www.b
ps.g
o.id

G O V E R N M E N T
S t a t i s t i c a l Y e a r b o o k o f I n d o n e s i a 2 0 1 3 41
Jumlah Pemilih yang Terdaftar dalam Pemilu Legislatif Dewan Perwakilan Rakyat (DPR), 2004 dan 2009Number of Registered Voters in the Election of The House of Representative (DPR), 2004 and 2009
Tabel –––––– 2.2.1Table
2.2 PEMILIHAN UMUM GENERAL ELECTION
ProvinsiProvince 2004 2009
(1) (2) (3)
Aceh 2 566 721 3 009 965Sumatera Utara 7 629 631 9 180 973Sumatera Barat 2 898 699 3 155 148Riau 2 924 199 3 366 383
Kepulauan Riau 892 210 1 131 676Jambi 1 726 138 2 086 780Sumatera Selatan 4 412 609 5 192 693Kepulauan Bangka Belitung 662 841 782 255Bengkulu 1 059 842 1 214 171Lampung 4 596 512 5 351 733
DKI Jakarta 6 461 955 7 026 772Jawa Barat 26 163 780 29 002 479Banten 5 832 054 6 581 587Jawa Tengah 22 801 364 26 190 629DI Yogyakarta 2 457 168 2 751 761Jawa Timur 26 506 904 29 514 290
Bali 2 470 945 2 667 065Nusa Tenggara Barat 2 606 084 3 135 420Nusa Tenggara Timur 2 469 616 2 760 518
Kalimantan Barat 2 559 805 3 154 887Kalimantan Tengah 1 202 390 1 506 244Kalimantan Selatan 2 142 145 2 478 976Kalimantan Timur 1 909 572 2 349 862
Sulawesi Utara 1 487 438 1 679 814Gorontalo 583 028 688 272Sulawesi Tengah 1 430 632 1 658 693Sulawesi Selatan 5 452 471 5 630 977Sulawesi Barat …1 753 203Sulawesi Tenggara 1 179 076 1 487 818
Maluku 806 546 1 020 421Maluku Utara 551 037 691 863Papua 1 204 644 2 064 532Papua Barat 352 313 521 735
Luar Negeri/Overseas ... 1 475 847
Indonesia 148 000 369 171 265 442
Catatan/Note: 1 Tergabung dengan provinsi induknya/Included in its main provinceSumber/Source: Komisi Pemilihan Umum/The National General Election Commission
http
://www.b
ps.g
o.id
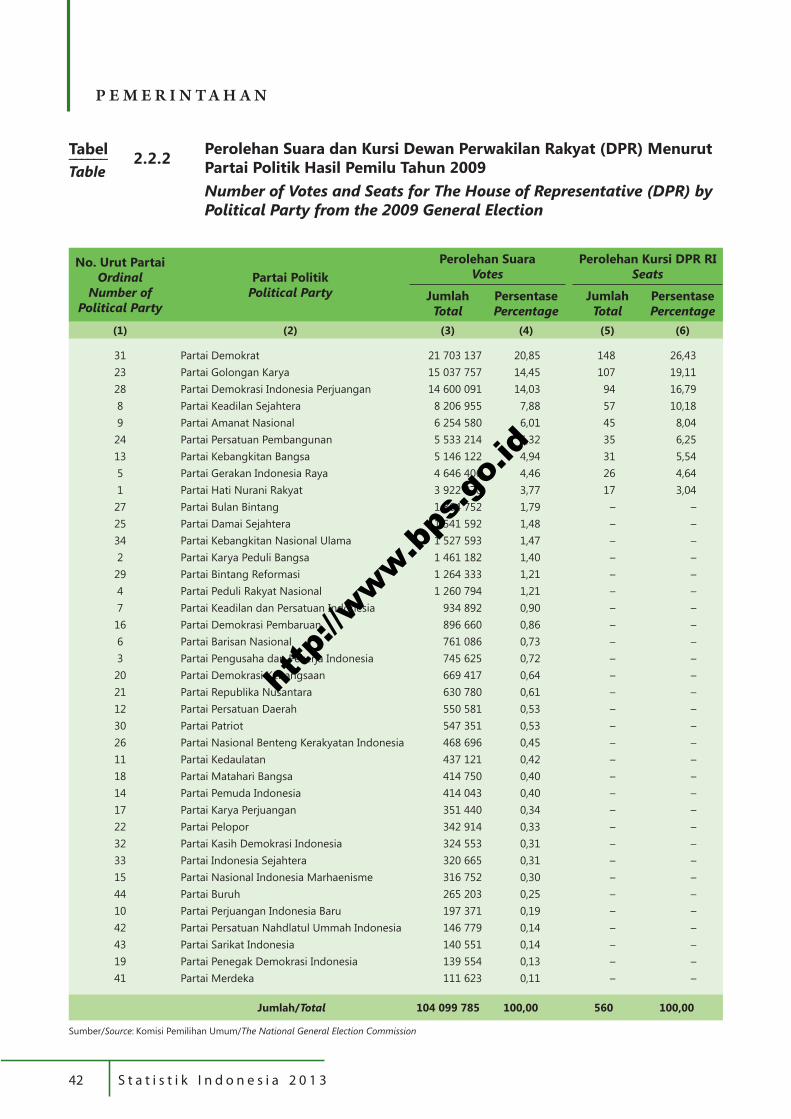
P E M E R I N T A H A N
S t a t i s t i k I n d o n e s i a 2 0 1 342
Perolehan Suara dan Kursi Dewan Perwakilan Rakyat (DPR) Menurut Partai Politik Hasil Pemilu Tahun 2009Number of Votes and Seats for The House of Representative (DPR) by Political Party from the 2009 General Election
Tabel –––––– 2.2.2Table
No. Urut Partai Ordinal
Number of Political Party
Partai Politik Political Party
Perolehan Suara Votes
Perolehan Kursi DPR RI Seats
Jumlah Total
Persentase Percentage
Jumlah Total
Persentase Percentage
(1) (2) (3) (4) (5) (6)
31 Partai Demokrat 21 703 137 20,85 148 26,4323 Partai Golongan Karya 15 037 757 14,45 107 19,1128 Partai Demokrasi Indonesia Perjuangan 14 600 091 14,03 94 16,798 Partai Keadilan Sejahtera 8 206 955 7,88 57 10,189 Partai Amanat Nasional 6 254 580 6,01 45 8,0424 Partai Persatuan Pembangunan 5 533 214 5,32 35 6,2513 Partai Kebangkitan Bangsa 5 146 122 4,94 31 5,545 Partai Gerakan Indonesia Raya 4 646 406 4,46 26 4,641 Partai Hati Nurani Rakyat 3 922 870 3,77 17 3,0427 Partai Bulan Bintang 1 864 752 1,79 – –25 Partai Damai Sejahtera 1 541 592 1,48 – –34 Partai Kebangkitan Nasional Ulama 1 527 593 1,47 – –2 Partai Karya Peduli Bangsa 1 461 182 1,40 – –29 Partai Bintang Reformasi 1 264 333 1,21 – –4 Partai Peduli Rakyat Nasional 1 260 794 1,21 – –7 Partai Keadilan dan Persatuan Indonesia 934 892 0,90 – –16 Partai Demokrasi Pembaruan 896 660 0,86 – –6 Partai Barisan Nasional 761 086 0,73 – –3 Partai Pengusaha dan Pekerja Indonesia 745 625 0,72 – –20 Partai Demokrasi Kebangsaan 669 417 0,64 – –21 Partai Republika Nusantara 630 780 0,61 – –12 Partai Persatuan Daerah 550 581 0,53 – –30 Partai Patriot 547 351 0,53 – –26 Partai Nasional Benteng Kerakyatan Indonesia 468 696 0,45 – –11 Partai Kedaulatan 437 121 0,42 – –18 Partai Matahari Bangsa 414 750 0,40 – –14 Partai Pemuda Indonesia 414 043 0,40 – –17 Partai Karya Perjuangan 351 440 0,34 – –22 Partai Pelopor 342 914 0,33 – –32 Partai Kasih Demokrasi Indonesia 324 553 0,31 – –33 Partai Indonesia Sejahtera 320 665 0,31 – –15 Partai Nasional Indonesia Marhaenisme 316 752 0,30 – –44 Partai Buruh 265 203 0,25 – –10 Partai Perjuangan Indonesia Baru 197 371 0,19 – –42 Partai Persatuan Nahdlatul Ummah Indonesia 146 779 0,14 – –43 Partai Sarikat Indonesia 140 551 0,14 – –19 Partai Penegak Demokrasi Indonesia 139 554 0,13 – –41 Partai Merdeka 111 623 0,11 – –
Jumlah/Total 104 099 785 100,00 560 100,00
Sumber/Source: Komisi Pemilihan Umum/The National General Election Commission
http
://www.b
ps.g
o.id
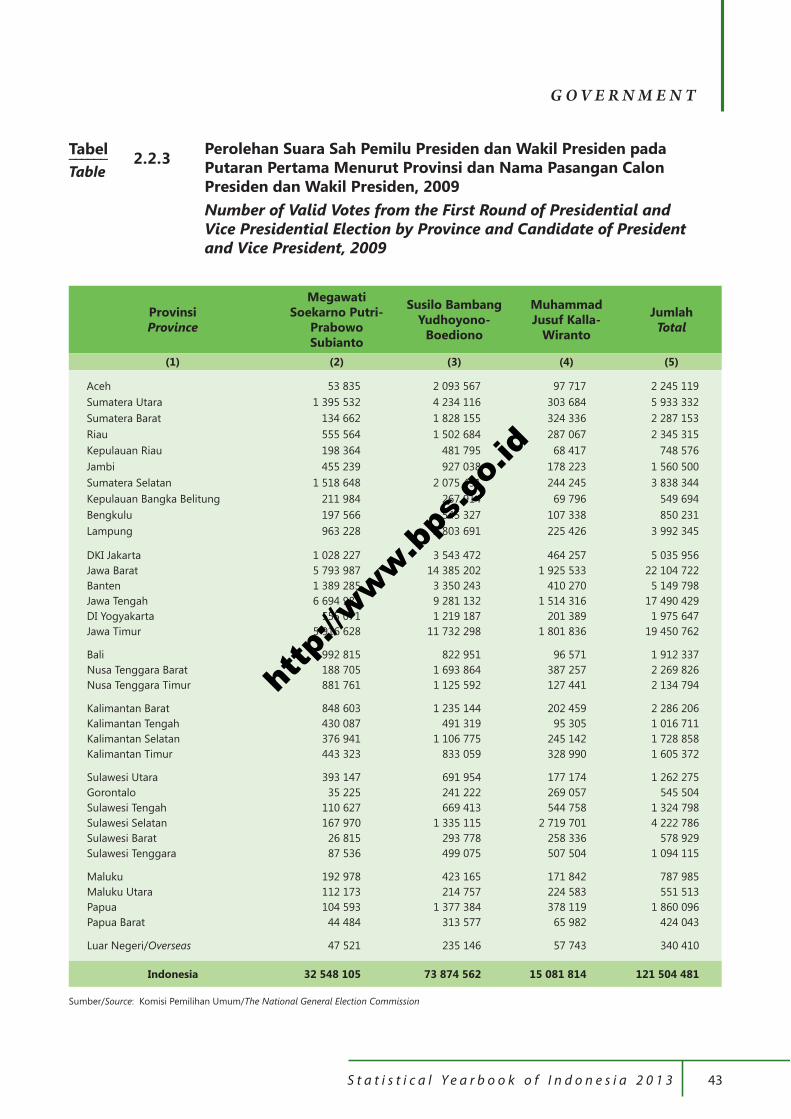
G O V E R N M E N T
S t a t i s t i c a l Y e a r b o o k o f I n d o n e s i a 2 0 1 3 43
Perolehan Suara Sah Pemilu Presiden dan Wakil Presiden pada Putaran Pertama Menurut Provinsi dan Nama Pasangan Calon Presiden dan Wakil Presiden, 2009Number of Valid Votes from the First Round of Presidential and Vice Presidential Election by Province and Candidate of President and Vice President, 2009
Tabel –––––– 2.2.3Table
ProvinsiProvince
Megawati Soekarno Putri-
Prabowo Subianto
Susilo Bambang Yudhoyono-
Boediono
Muhammad Jusuf Kalla-
Wiranto
Jumlah Total
(1) (2) (3) (4) (5)
Aceh 53 835 2 093 567 97 717 2 245 119Sumatera Utara 1 395 532 4 234 116 303 684 5 933 332Sumatera Barat 134 662 1 828 155 324 336 2 287 153Riau 555 564 1 502 684 287 067 2 345 315Kepulauan Riau 198 364 481 795 68 417 748 576Jambi 455 239 927 038 178 223 1 560 500Sumatera Selatan 1 518 648 2 075 451 244 245 3 838 344Kepulauan Bangka Belitung 211 984 267 914 69 796 549 694Bengkulu 197 566 545 327 107 338 850 231Lampung 963 228 2 803 691 225 426 3 992 345
DKI Jakarta 1 028 227 3 543 472 464 257 5 035 956Jawa Barat 5 793 987 14 385 202 1 925 533 22 104 722Banten 1 389 285 3 350 243 410 270 5 149 798Jawa Tengah 6 694 981 9 281 132 1 514 316 17 490 429DI Yogyakarta 555 071 1 219 187 201 389 1 975 647Jawa Timur 5 916 628 11 732 298 1 801 836 19 450 762
Bali 992 815 822 951 96 571 1 912 337Nusa Tenggara Barat 188 705 1 693 864 387 257 2 269 826Nusa Tenggara Timur 881 761 1 125 592 127 441 2 134 794
Kalimantan Barat 848 603 1 235 144 202 459 2 286 206Kalimantan Tengah 430 087 491 319 95 305 1 016 711Kalimantan Selatan 376 941 1 106 775 245 142 1 728 858Kalimantan Timur 443 323 833 059 328 990 1 605 372
Sulawesi Utara 393 147 691 954 177 174 1 262 275Gorontalo 35 225 241 222 269 057 545 504Sulawesi Tengah 110 627 669 413 544 758 1 324 798Sulawesi Selatan 167 970 1 335 115 2 719 701 4 222 786Sulawesi Barat 26 815 293 778 258 336 578 929Sulawesi Tenggara 87 536 499 075 507 504 1 094 115
Maluku 192 978 423 165 171 842 787 985Maluku Utara 112 173 214 757 224 583 551 513Papua 104 593 1 377 384 378 119 1 860 096Papua Barat 44 484 313 577 65 982 424 043
Luar Negeri/Overseas 47 521 235 146 57 743 340 410
Indonesia 32 548 105 73 874 562 15 081 814 121 504 481
Sumber/Source: Komisi Pemilihan Umum/The National General Election Commission
http
://www.b
ps.g
o.id

P E M E R I N T A H A N
S t a t i s t i k I n d o n e s i a 2 0 1 344
Persentase Perolehan Suara Sah Pemilu Presiden dan Wakil Presiden pada Putaran Pertama Menurut Provinsi dan Nama Pasangan Calon Presiden dan Wakil Presiden, 2009Percentage of Valid Votes from the First Round of Presidential and Vice Presidential Election by Province and Candidate of President and Vice President, 2009
Tabel –––––– 2.2.4Table
ProvinsiProvince
Megawati Soekarno Putri-
Prabowo Subianto
Susilo Bambang Yudhoyono-
Boediono
Muhammad Jusuf Kalla-
Wiranto
Jumlah Total
(1) (2) (3) (4) (5)
Aceh 2,40 93,25 4,35 100,00Sumatera Utara 23,52 71,36 5,12 100,00Sumatera Barat 5,89 79,93 14,18 100,00Riau 23,69 64,07 12,24 100,00Kepulauan Riau 26,50 64,36 9,14 100,00Jambi 29,17 59,41 11,42 100,00Sumatera Selatan 39,57 54,07 6,36 100,00Kepulauan Bangka Belitung 38,56 48,74 12,70 100,00Bengkulu 23,24 64,14 12,62 100,00Lampung 24,13 70,23 5,65 100,00
DKI Jakarta 20,42 70,36 9,22 100,00Jawa Barat 26,21 65,08 8,71 100,00Banten 26,98 65,06 7,97 100,00Jawa Tengah 38,28 53,06 8,66 100,00DI Yogyakarta 28,10 61,71 10,19 100,00Jawa Timur 30,42 60,32 9,26 100,00
Bali 51,92 43,03 5,05 100,00Nusa Tenggara Barat 8,31 74,63 17,06 100,00Nusa Tenggara Timur 41,30 52,73 5,97 100,00
Kalimantan Barat 37,12 54,03 8,86 100,00Kalimantan Tengah 42,30 48,32 9,37 100,00Kalimantan Selatan 21,80 64,02 14,18 100,00Kalimantan Timur 27,61 51,89 20,49 100,00
Sulawesi Utara 31,15 54,82 14,04 100,00Gorontalo 6,46 44,22 49,32 100,00Sulawesi Tengah 8,35 50,53 41,12 100,00Sulawesi Selatan 3,98 31,62 64,41 100,00Sulawesi Barat 4,63 50,75 44,62 100,00Sulawesi Tenggara 8,00 45,61 46,38 100,00
Maluku 24,49 53,70 21,81 100,00Maluku Utara 20,34 38,94 40,72 100,00Papua 5,62 74,05 20,33 100,00Papua Barat 10,49 73,95 15,56 100,00
Luar Negeri/Overseas 13,96 69,08 16,96 100,00
Indonesia 26,79 60,80 12,41 100,00
Sumber/Source: Komisi Pemilihan Umum/The National General Election Commission
http
://www.b
ps.g
o.id

G O V E R N M E N T
S t a t i s t i c a l Y e a r b o o k o f I n d o n e s i a 2 0 1 3 45
Anggota Dewan Perwakilan Rakyat (DPR) Menurut Jenis Kelamin, 1955–2009Number of Representatives in The House of Representative (DPR) by Sex, 1955–2009
Tabel –––––– 2.2.5Table
Tahun Pemilu Year of General Election
Laki-laki/Male Perempuan/Female Laki-laki + Perempuan Male + Female
Jumlah Total
Persentase Percentage
Jumlah Total
Persentase Percentage
Jumlah Total
Persentase Percentage
(1) (2) (3) (4) (5) (6) (7)
1955 256 94,12 16 5,88 272 100,00
1971 429 93,26 31 6,74 460 100,00
1977 423 91,96 37 8,04 460 100,00
1982 418 90,87 42 9,13 460 100,00
1987 441 88,20 59 11,80 500 100,00
1992 438 87,60 62 12,40 500 100,00
1997 442 88,40 58 11,60 500 100,00
1999 456 91,20 44 8,80 500 100,00
2004 485 88,18 65 11,82 550 100,00
2009 460 82,14 100 17,86 560 100,00
Sumber/Source: Komisi Pemilihan Umum/The National General Election Commission
http
://www.b
ps.g
o.id
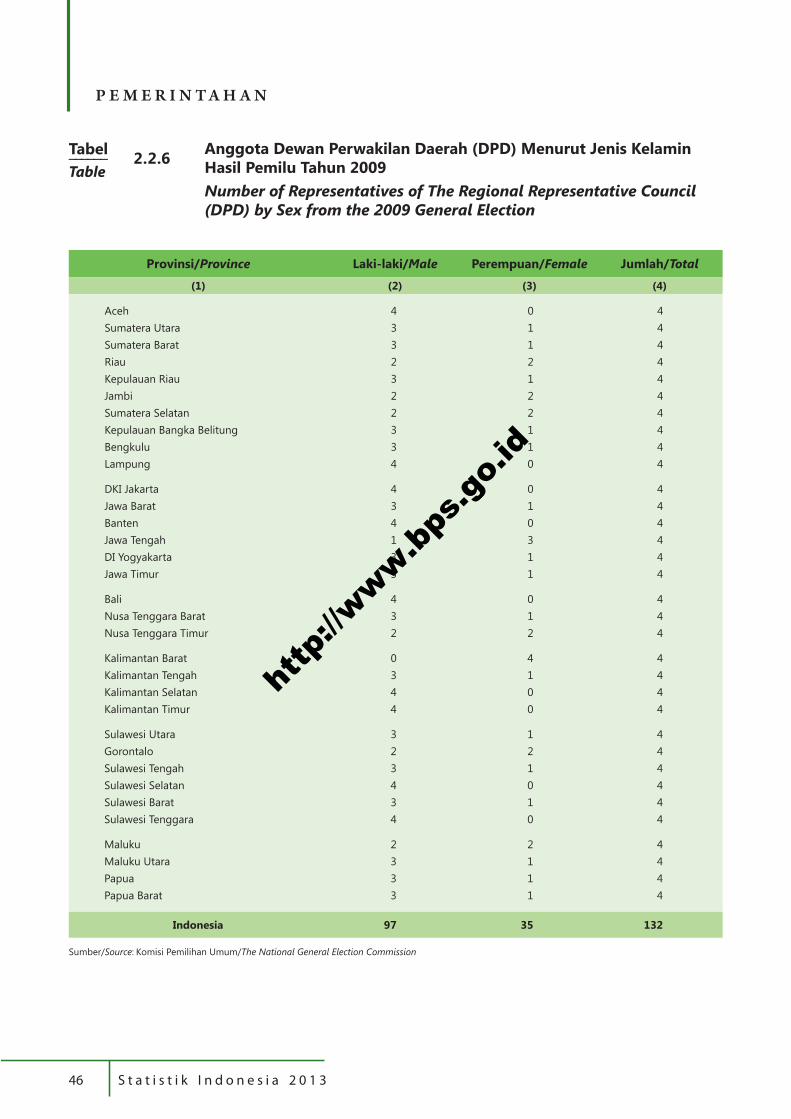
P E M E R I N T A H A N
S t a t i s t i k I n d o n e s i a 2 0 1 346
Anggota Dewan Perwakilan Daerah (DPD) Menurut Jenis Kelamin Hasil Pemilu Tahun 2009Number of Representatives of The Regional Representative Council (DPD) by Sex from the 2009 General Election
Tabel –––––– 2.2.6Table
Provinsi/Province Laki-laki/Male Perempuan/Female Jumlah/Total
(1) (2) (3) (4)
Aceh 4 0 4Sumatera Utara 3 1 4Sumatera Barat 3 1 4Riau 2 2 4Kepulauan Riau 3 1 4Jambi 2 2 4Sumatera Selatan 2 2 4Kepulauan Bangka Belitung 3 1 4Bengkulu 3 1 4Lampung 4 0 4
DKI Jakarta 4 0 4Jawa Barat 3 1 4Banten 4 0 4Jawa Tengah 1 3 4DI Yogyakarta 3 1 4Jawa Timur 3 1 4
Bali 4 0 4Nusa Tenggara Barat 3 1 4Nusa Tenggara Timur 2 2 4
Kalimantan Barat 0 4 4Kalimantan Tengah 3 1 4Kalimantan Selatan 4 0 4Kalimantan Timur 4 0 4
Sulawesi Utara 3 1 4Gorontalo 2 2 4Sulawesi Tengah 3 1 4Sulawesi Selatan 4 0 4Sulawesi Barat 3 1 4Sulawesi Tenggara 4 0 4
Maluku 2 2 4Maluku Utara 3 1 4Papua 3 1 4Papua Barat 3 1 4
Indonesia 97 35 132
Sumber/Source: Komisi Pemilihan Umum/The National General Election Commission
http
://www.b
ps.g
o.id

G O V E R N M E N T
S t a t i s t i c a l Y e a r b o o k o f I n d o n e s i a 2 0 1 3 47
Jumlah Pegawai Negeri Sipil Menurut Provinsi dan Jenis Kelamin, Desember 2011 dan Desember 2012Number of Civil Servants by Province and Sex, December 2011 and December 2012
Tabel –––––– 2.3.1Table
2.3 SUMBER DAYA MANUSIA HUMAN RESOURCES
ProvinsiProvince
2011 2012
Laki-LakiMale
PerempuanFemale
JumlahTotal
Laki-LakiMale
PerempuanFemale
JumlahTotal
(1) (2) (3) (4) (5) (6) (7)
Aceh 75 736 90 498 166 234 74 600 89 645 164 245 Sumatera Utara 110 983 141 820 252 803 108 183 139 641 247 824 Sumatera Barat 57 039 85 072 142 111 55 647 83 516 139 163 Riau 50 031 55 500 105 531 48 961 54 941 103 902 Kepulauan Riau 18 862 16 082 34 944 18 926 16 113 35 039 Jambi 43 259 40 309 83 568 42 017 39 806 81 823 Sumatera Selatan 66 960 75 144 142 104 64 997 74 255 139 252 Kepulauan Bangka Belitung 15 588 16 124 31 712 15 391 16 028 31 419 Bengkulu 33 670 31 409 65 079 32 776 30 952 63 728 Lampung 67 090 63 532 130 622 64 347 62 266 126 613
DKI Jakarta 180 356 126 230 306 586 169 948 121 184 291 132 Jawa Barat 252 867 205 884 458 751 245 485 203 637 449 122 Banten 53 242 44 965 98 207 51 693 44 472 96 165 Jawa Tengah 262 830 217 799 480 629 251 594 212 514 464 108 DI Yogyakarta 48 713 40 203 88 916 46 753 39 346 86 099 Jawa Timur 287 527 231 555 519 082 276 937 227 355 504 292
Bali 57 743 41 724 99 467 55 784 40 998 96 782 Nusa Tenggara Barat 58 402 36 552 94 954 56 839 36 073 92 912 Nusa Tenggara Timur 72 182 55 530 127 712 69 923 54 803 124 726
Kalimantan Barat 53 236 41 551 94 787 51 600 40 973 92 573 Kalimantan Tengah 41 121 37 798 78 919 40 278 37 402 77 680 Kalimantan Selatan 50 362 47 271 97 633 49 256 46 553 95 809 Kalimantan Timur 57 875 45 650 103 525 56 762 45 245 102 007
Sulawesi Utara 33 950 46 773 80 723 33 134 45 821 78 955 Gorontalo 14 545 20 602 35 147 14 348 20 327 34 675 Sulawesi Tengah 44 547 43 131 87 678 43 326 42 437 85 763 Sulawesi Selatan 97 944 108 161 206 105 94 979 106 485 201 464 Sulawesi Barat 16 643 15 336 31 979 16 811 15 346 32 157 Sulawesi Tenggara 45 348 37 191 82 539 43 879 36 616 80 495
Maluku 32 814 37 493 70 307 32 033 36 921 68 954 Maluku Utara 22 406 21 408 43 814 22 137 21 285 43 422 Papua 57 287 34 212 91 499 60 226 36 424 96 650 Papua Barat 22 020 15 131 37 151 22 979 16 053 39 032
Luar Negeri/Overseas – – – – – –
Indonesia 2 403 178 2 167 640 4 570 818 2 332 549 2 135 433 4 467 982
Sumber/Source: Badan Kepegawaian Negara (BKN)/National Civil Service Agency
http
://www.b
ps.g
o.id

P E M E R I N T A H A N
S t a t i s t i k I n d o n e s i a 2 0 1 348
Jumlah Pegawai Negeri Sipil Menurut Jabatan dan Jenis Kelamin, Desember 2011 dan Desember 2012Number of Civil Servants by Occupation and Sex, December 2011 and December 2012
Tabel –––––– 2.3.2Table
JabatanOccupation
2011 2012
Laki-LakiMale
PerempuanFemale
JumlahTotal
Laki-LakiMale
PerempuanFemale
JumlahTotal
(1) (2) (3) (4) (5) (6) (7)
Fungsional Tertentu 927 462 1 227 731 2 155 193 935 838 1 316 252 2 252 090 Specific Functional
Fungsional Umum/Staf 1 328 365 894 570 2 222 935 1 225 945 751 485 1 977 430 General Functional
Struktural/Structural 147 351 45 339 192 690 170 766 67 696 238 462
Eselon V/5 th Echelon 7 573 2 463 10 036 2 744 1 240 3 984
Eselon IV/4 th Echelon 106 288 37 074 143 362 112 734 53 991 166 725
Eselon III/3 rd Echelon 28 289 5 327 33 616 44 633 10 868 55 501
Eselon II/2 nd Echelon 4 805 435 5 240 10 110 1 490 11 600
Eselon I/1 st Echelon 396 40 436 545 107 652
Jumlah/Total 2 403 178 2 167 640 4 570 818 2 332 549 2 135 433 4 467 982
Sumber/Source: Badan Kepegawaian Negara (BKN)/National Civil Service Agency
http
://www.b
ps.g
o.id

G O V E R N M E N T
S t a t i s t i c a l Y e a r b o o k o f I n d o n e s i a 2 0 1 3 49
Jumlah Pegawai Negeri Sipil Menurut Jenis Kepegawaian dan Jenis Kelamin, Desember 2011 dan Desember 2012Number of Civil Servants by Type of Employment and Sex, December 2011 and December 2012
Tabel –––––– 2.3.3Table
Jenis KepegawaianType of Employment
2011 2012
Laki-LakiMale
PerempuanFemale
JumlahTotal
Laki-LakiMale
PerempuanFemale
JumlahTotal
(1) (2) (3) (4) (5) (6) (7)
1. Jumlah Pegawai Negeri Sipil Pusat Total Central Civil Servants
568 676 355 901 924 577 550 256 349 398 899 654
a. Pegawai Negeri Sipil Pusat Central Civil Servants
557 674 351 940 909 614 539 616 345 507 885 123
b. PNS Pusat diperbantukan pada Instansi lain Central Civil Servants working to assist other Institutions
788 383 1 171 756 375 1 131
c. PNS Pusat dipekerjakan pada Instansi lain Central Civil Servants who were employed at other Institutions
1 871 774 2 645 1 804 756 2 560
d. PNS Pusat diperbantukan pada BUMN/Badan lain Central Civil Servants working to assist State-Owned Companies/others
1 943 282 2 225 1 894 277 2 171
e. PNS Pusat dipekerjakan pada BUMN/Badan lain Central Civil Servants who were employed at State-Owned Companies/others
6 400 2 522 8 922 6 186 2 483 8 669
2. Jumlah Pegawai Negeri Sipil ProvinsiTotal Provincial Civil Servants
183 823 132 182 316 005 178 298 130 059 308 357
a. Pegawai Negeri Sipil Daerah Provinsi Provincial Regional Civil Servants
183 299 131 682 314 981 177 794 129 572 307 366
b. PNS Pusat diperbantukan pada Pemerintah Daerah Provinsi Central Civil Servants working to assist the Provincial Government
153 202 355 149 197 346
c. PNS Pusat dipekerjakan pada Pemerintah Daerah ProvinsiCentral Civil Servants who were employed at the Provincial Government
158 188 346 150 183 333
d. PNS Provinsi diperbantukan pada Instansi lain Provincial Civil Servants working to assist other Institutions
91 36 127 88 36 124
e. PNS Provinsi dipekerjakan pada Instansi lain Provincial Civil Servants who were employed at other Institutions
110 65 175 105 62 167
http
://www.b
ps.g
o.id

P E M E R I N T A H A N
S t a t i s t i k I n d o n e s i a 2 0 1 350
Jenis KepegawaianType of Employment
2011 2012
Laki-LakiMale
PerempuanFemale
JumlahTotal
Laki-LakiMale
PerempuanFemale
JumlahTotal
(1) (2) (3) (4) (5) (6) (7)
f. PNS Provinsi diperbantukan pada BUMN/Badan lain Provincial Civil Servants working to assist in State-Owned Companies/others
7 6 13 7 6 13
g. PNS Provinsi dipekerjakan pada BUMN/Badan lain Provincial Civil Servants who were employed at State-Owned Companies/others
5 3 8 5 3 8
3. Jumlah Pegawai Negeri Sipil Kabupaten/Kota Total Regency/City Civil Servants
1 650 679 1 679 557 3 330 236 1 603 995 1 655 976 3 259 971
a. Pegawai Negeri Sipil Kabupaten/Kota Regency/City Civil Servants
1 648 405 1 676 618 3 325 023 1 601 785 1 653 079 3 254 864
b. PNS Pusat diperbantukan pada Pemerintah Daerah Kabupaten/Kota Central Civil Servants working to assist the Regency/City Local Government
121 119 240 115 117 232
c. PNS Pusat dipekerjakan pada Pemerintah Daerah Kabupaten/Kota Central Civil Servants who were employed at Regency/City Local Government
1 954 2 689 4 643 1 902 2 650 4 552
d. PNS Kabupaten/Kota diperbantukan pada Instansi lain Regency/City Civil Servants working to assist other Institutions
55 27 82 53 27 80
e. PNS Kabupaten/Kota dipekerjakan pada Instansi lain Regency/City Civil Servants who were employed at other Institutions
109 91 200 105 90 195
f. PNS Kabupaten/Kota diperbantukan pada BUMN/Badan lain Regency/City Civil Servants working to assist at State-Owned Companies/others
15 6 21 15 6 21
g. PNS Kabupaten/Kota dipekerjakan pada BUMN/Badan lain Regency/City Civil Servants who were employed at State-Owned Companies/others
20 7 27 20 7 27
Jumlah/Total 2 403 178 2 167 640 4 570 818 2 332 549 2 135 433 4 467 982
Lanjutan Tabel/Continued Table 2.3.3
Sumber/Source: Badan Kepegawaian Negara (BKN)/National Civil Service Agency
http
://www.b
ps.g
o.id
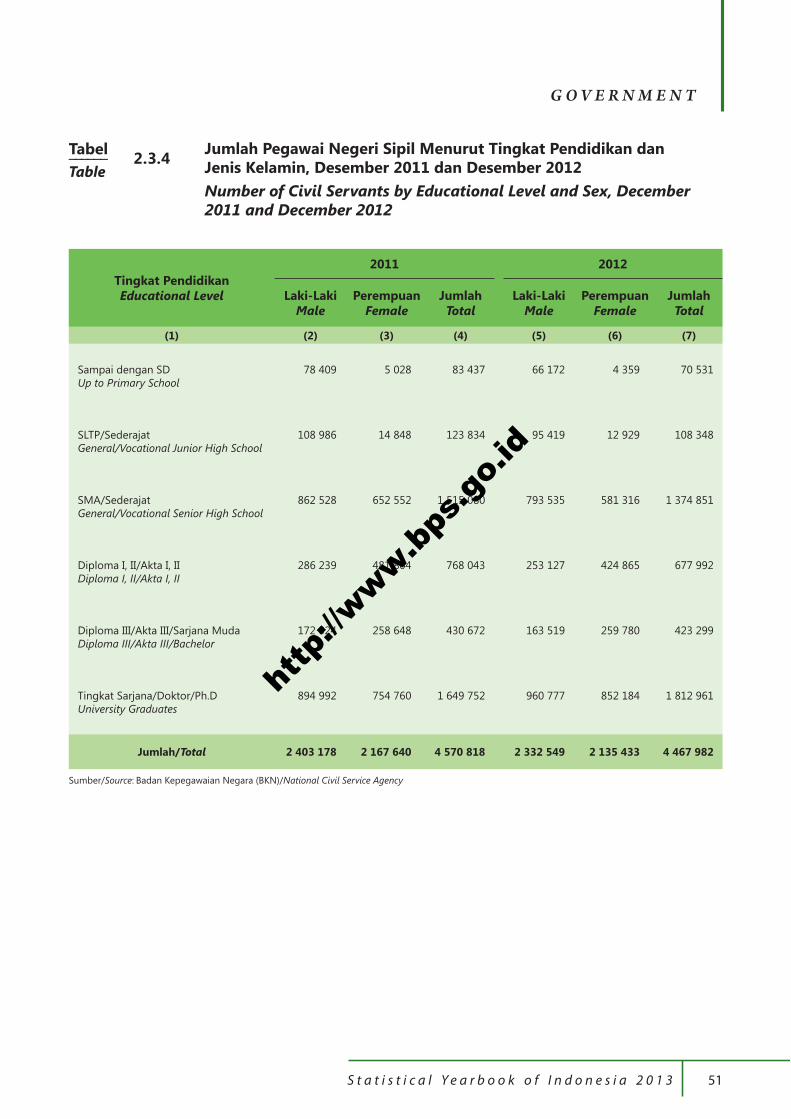
G O V E R N M E N T
S t a t i s t i c a l Y e a r b o o k o f I n d o n e s i a 2 0 1 3 51
Jumlah Pegawai Negeri Sipil Menurut Tingkat Pendidikan dan Jenis Kelamin, Desember 2011 dan Desember 2012Number of Civil Servants by Educational Level and Sex, December 2011 and December 2012
Tabel –––––– 2.3.4Table
Tingkat PendidikanEducational Level
2011 2012
Laki-LakiMale
PerempuanFemale
JumlahTotal
Laki-LakiMale
PerempuanFemale
JumlahTotal
(1) (2) (3) (4) (5) (6) (7)
Sampai dengan SD Up to Primary School
78 409 5 028 83 437 66 172 4 359 70 531
SLTP/Sederajat General/Vocational Junior High School
108 986 14 848 123 834 95 419 12 929 108 348
SMA/Sederajat General/Vocational Senior High School
862 528 652 552 1 515 080 793 535 581 316 1 374 851
Diploma I, II/Akta I, II Diploma I, II/Akta I, II
286 239 481 804 768 043 253 127 424 865 677 992
Diploma III/Akta III/Sarjana Muda Diploma III/Akta III/Bachelor
172 024 258 648 430 672 163 519 259 780 423 299
Tingkat Sarjana/Doktor/Ph.D University Graduates
894 992 754 760 1 649 752 960 777 852 184 1 812 961
Jumlah/Total 2 403 178 2 167 640 4 570 818 2 332 549 2 135 433 4 467 982
Sumber/Source: Badan Kepegawaian Negara (BKN)/National Civil Service Agency
http
://www.b
ps.g
o.id

P E M E R I N T A H A N
S t a t i s t i k I n d o n e s i a 2 0 1 352
Jumlah Pegawai Negeri Sipil Menurut Tingkat Kepangkatan dan Jenis Kelamin, Desember 2011 dan Desember 2012Number of Civil Servants by Hierarchy and Sex, December 2011 and December 2012
Tabel –––––– 2.3.5Table
Pangkat/Golongan/RuangHierarchy
2011 2012
Laki-LakiMale
PerempuanFemale
JumlahTotal
Laki-LakiMale
PerempuanFemale
JumlahTotal
(1) (2) (3) (4) (5) (6) (7)
1. I/A (Juru Muda) 19 144 1 510 20 654 11 796 1 004 12 800
2. I/B (Juru Muda Tingkat I) 13 042 884 13 926 16 736 1 168 17 904
3. I/C (Juru) 38 630 4 297 42 927 26 905 3 032 29 937
4. I/D (Juru Tingkat I) 24 370 2 271 26 641 26 437 2 382 28 819
Golongan I/Range I 95 186 8 962 104 148 81 874 7 586 89 460
5. II/A (Pengatur Muda) 276 329 148 468 424 797 211 766 95 218 306 984
6. II/B (Pengatur Muda Tingkat I) 193 701 192 821 386 522 206 695 166 195 372 890
7. II/C (Pengatur) 148 320 196 646 344 966 145 782 195 017 340 799
8. II/D (Pengatur Tingkat I) 91 337 90 722 182 059 86 696 95 954 182 650
Golongan II/Range II 709 687 628 657 1 338 344 650 939 552 384 1 203 323
9. III/A (Penata Muda) 340 545 356 390 696 935 301 487 321 544 623 031
10. III/B (Penata Muda Tingkat I) 292 609 268 398 561 007 297 579 294 847 592 426
11. III/C (Penata) 211 737 182 905 394 642 221 880 202 326 424 206
12. III/D (Penata Tingkat I) 259 662 229 534 489 196 256 690 228 073 484 763
Golongan III/Range III 1 104 553 1 037 227 2 141 780 1 077 636 1 046 790 2 124 426
13. IV/A (Pembina) 407 476 448 378 855 854 419 130 469 754 888 884
14. IV/B (Pembina Tingkat I) 64 702 39 000 103 702 77 397 52 003 129 400
15. IV/C (Pembina Utama Muda) 15 845 4 150 19 995 18 491 5 197 23 688
16. IV/D (Pembina Utama Madya) 4 209 978 5 187 5 141 1 333 6 474
17. IV/E (Pembina Utama) 1 520 288 1 808 1 941 386 2 327
Golongan IV/Range IV 493 752 492 794 986 546 522 100 528 673 1 050 773
Jumlah/Total 2 403 178 2 167 640 4 570 818 2 332 549 2 135 433 4 467 982
Sumber/Source: Badan Kepegawaian Negara (BKN)/National Civil Service Agency
http
://www.b
ps.g
o.id

G O V E R N M E N T
S t a t i s t i c a l Y e a r b o o k o f I n d o n e s i a 2 0 1 3 53
Jumlah Pegawai Negeri Sipil Menurut Kelompok Umur dan Jenis Kelamin, Desember 2011 dan Desember 2012Number of Civil Servants by Age Group and Sex, December 2011 and December 2012
Tabel –––––– 2.3.6Table
Kelompok UmurAge Group
2011 2012
Laki-LakiMale
PerempuanFemale
JumlahTotal
Laki-LakiMale
PerempuanFemale
JumlahTotal
(1) (2) (3) (4) (5) (6) (7)
18–20 2 293 1 384 3 677 1 727 693 2 420
21–25 61 791 97 768 159 559 42 060 60 795 102 855
26–30 219 402 285 839 505 241 197 550 266 046 463 596
31–35 275 481 306 104 581 585 270 653 311 712 582 365
36–40 298 088 289 804 587 892 290 660 284 723 575 383
41–45 436 518 392 772 829 290 410 262 378 808 789 070
46–50 526 597 416 039 942 636 527 047 425 590 952 637
51–55 461 338 278 880 740 218 464 625 303 636 768 261
56–60 116 639 97 229 213 868 118 829 97 907 216 736
61–65 4 722 1 743 6 465 8 663 5 382 14 045
66–70 309 78 387 473 141 614
Jumlah/Total 2 403 178 2 167 640 4 570 818 2 332 549 2 135 433 4 467 982
Sumber/Source: Badan Kepegawaian Negara (BKN)/National Civil Service Agency
http
://www.b
ps.g
o.id
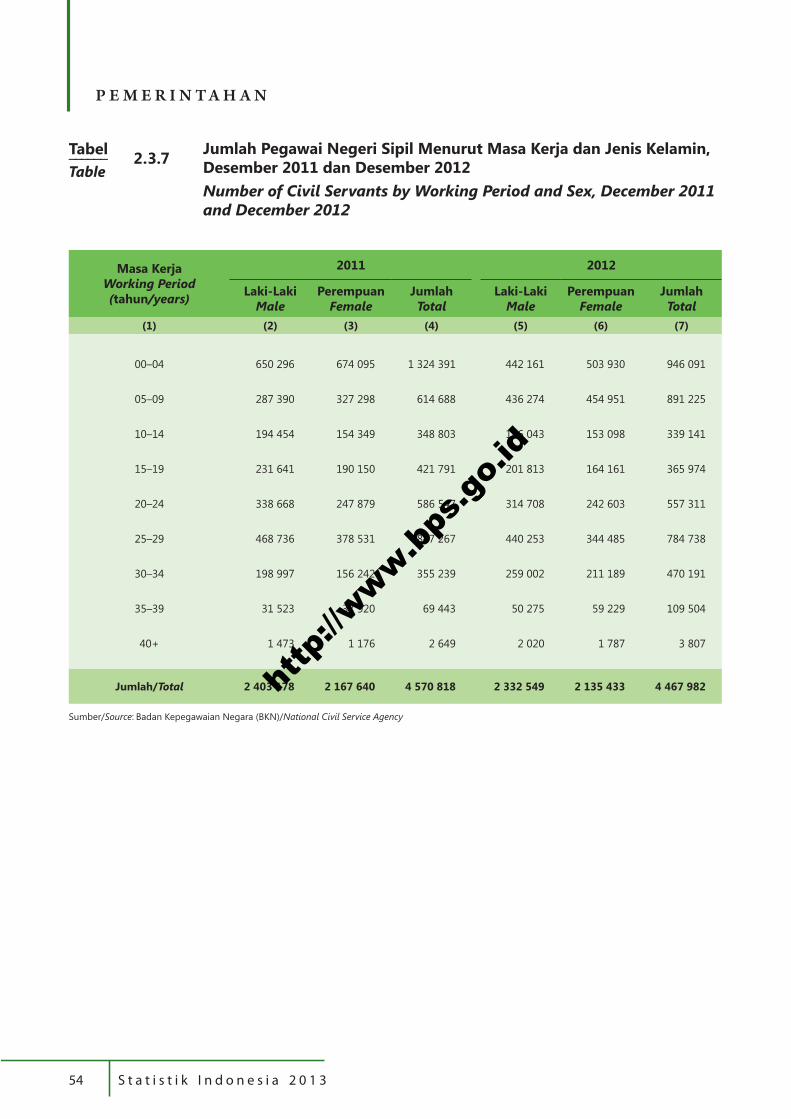
P E M E R I N T A H A N
S t a t i s t i k I n d o n e s i a 2 0 1 354
Jumlah Pegawai Negeri Sipil Menurut Masa Kerja dan Jenis Kelamin, Desember 2011 dan Desember 2012Number of Civil Servants by Working Period and Sex, December 2011 and December 2012
Tabel –––––– 2.3.7Table
Masa KerjaWorking Period(tahun/years)
2011 2012
Laki-LakiMale
PerempuanFemale
JumlahTotal
Laki-LakiMale
PerempuanFemale
JumlahTotal
(1) (2) (3) (4) (5) (6) (7)
00–04 650 296 674 095 1 324 391 442 161 503 930 946 091
05–09 287 390 327 298 614 688 436 274 454 951 891 225
10–14 194 454 154 349 348 803 186 043 153 098 339 141
15–19 231 641 190 150 421 791 201 813 164 161 365 974
20–24 338 668 247 879 586 547 314 708 242 603 557 311
25–29 468 736 378 531 847 267 440 253 344 485 784 738
30–34 198 997 156 242 355 239 259 002 211 189 470 191
35–39 31 523 37 920 69 443 50 275 59 229 109 504
40+ 1 473 1 176 2 649 2 020 1 787 3 807
Jumlah/Total 2 403 178 2 167 640 4 570 818 2 332 549 2 135 433 4 467 982
Sumber/Source: Badan Kepegawaian Negara (BKN)/National Civil Service Agency
http
://www.b
ps.g
o.id

G O V E R N M E N T
S t a t i s t i c a l Y e a r b o o k o f I n d o n e s i a 2 0 1 3 55
2.4 KEUANGAN PEMERINTAH GOVERNMENT FINANCE
Anggaran Pendapatan dan Belanja Negara (miliar rupiah), 2011–2013State Budget (billion rupiahs), 2011–2013
Tabel –––––– 2.4.1Table
Sumber/Source: Kementerian Keuangan/Ministry of Finance
Rincian/Description 2011 2012 2013
(1) (2) (3) (4)
Pendapatan dan Hibah/Revenue and Grant 1 104 902 1 311 387 1 529 673
Penerimaan Dalam Negeri/Domestic Revenue 1 101 162 1 310 562 1 525 189Penerimaan pajak/Tax revenue 850 255 1 032 570 1 192 994
Pajak dalam negeri/Domestic taxes 827 246 989 637 1 134 289Pajak perdagangan internasional/International trade taxes 23 009 42 933 58 705
Penerimaan bukan pajak/Non-tax revenue 250 907 277 992 332 195Penerimaan sumber daya alam/Natural resources revenue 163 119 177 264 197 205Bagian laba BUMN/Profit transfer from SOE 27 590 28 001 33 500Penerimaan bukan pajak lainnya/Other non-tax revenue 45 167 53 492 77 991Pendapatan Badan Layanan Umum (BLU)/Public Service Institution 15 031 19 235 23 499
Hibah/Grants 3 740 825 4 484
Pengeluaran/Expenditure 1 229 558 1 435 407 1 683 011
Pengeluaran Pemerintah Pusat/Central Government Expenditure 836 578 964 997 1 154 381Belanja pegawai/Personnel expenditure 180 825 215 862 241 606Belanja barang/Material expenditure 137 850 188 002 200 735Belanja modal/Capital expenditure 135 854 151 975 184 364Pembayaran bunga utang/Interest payment 115 209 122 217 113 244Subsidi/Subsidy 187 624 208 850 317 219
Subsidi BBM/Oil subsidy 136 614 168 560 274 743Subsidi non BBM/Non-oil subsidy 51 010 40 290 42 476
Belanja hibah/Grant 771 1 797 3 621Bantuan sosial/Social expenditure 63 184 47 764 73 609Belanja lainnya/Other expenditure 15 261 28 530 19 983
Pengeluaran untuk Daerah/Expenditure for Regions 392 980 470 410 528 630Dana perimbangan/Balance funds 334 324 399 986 444 798
Dana bagi hasil/Revenue sharing 83 558 100 055 101 962Dana alokasi umum/General allocation funds 225 533 273 815 311 139Dana alokasi khusus/Specific allocation funds 25 233 26 116 31 697
Dana otonomi khusus dan penyeimbang Special autonomous region and balancing funds
58 656 70 424 83 832
Keseimbangan Primer/Primary Balance -9 447 -1 802 -40 094
Surplus/Defisit Anggaran/Overall Balance -124 656 -124 020 -153 338
Pembiayaan Bersih/ Net Financing 124 656 124 020 153 338Pembiayaan Dalam Negeri/Domestic Financing 125 266 125 912 172 792
Perbankan dalam negeri/Domestic bank financing 12 657 8 947 14 307Nonperbankan dalam negeri/Domestic non-banking financing 112 609 116 965 158 485
Pembiayaan Luar Negeri/Foreign Financing -610 -1 892 -19 454Pinjaman bruto luar negeri/Gross drawing 58 933 54 282 45 919Penerusan pinjaman/Subsidiary loan agreement -11 725 -8 914 -6 968Pembayaran cicilan pokok utang luar negeri/Amortizations -47 818 -47 260 -58 405
http
://www.b
ps.g
o.id

P E M E R I N T A H A N
S t a t i s t i k I n d o n e s i a 2 0 1 356
Anggaran Pendapatan Negara (miliar rupiah), 2011–2013Budget of Government Revenues (billion rupiahs), 2011–2013
Tabel –––––– 2.4.2Table
Sumber/Source: Kementerian Keuangan/Ministry of Finance
Sumber Penerimaan/Source of Revenue 2011 2012 2013
(1) (2) (3) (4)
Penerimaan Dalam Negeri/Domestic Revenue 1 101 162 1 310 562 1 525 189
Penerimaan Pajak/Tax Revenue 850 255 1 032 570 1 192 994
Pajak dalam negeri/Domestic tax 827 246 989 637 1 134 289Pajak penghasilan/Income tax 420 494 519 965 584 890
Nonmigas/Non-oil and gas 364 940 459 049 513 509Migas/Oil and gas 55 554 60 916 71 381
Pajak pertambahan nilai barang dan jasa, dan pajak penjualan atas barang mewahValue added tax on goods and services, and tax on sale of luxury goods
312 110 352 950 423 708
Pajak bumi dan bangunan/Land and building tax 27 682 35 647 27 344Bea perolehan atas tanah dan bangunan Tax of rights in land and building
– – –
Cukai/Excise duties 62 760 75 443 92 004Pajak lainnya/Other taxes 4 200 5 632 6 343
Pajak perdagangan internasional/International trade taxes 23 009 42 933 58 705Bea masuk/Import duties 17 902 23 734 27 003Pajak ekspor/Export tax 5 107 19 199 31 702
Penerimaan Bukan Pajak/Non-Tax Revenue 250 907 277 992 332 195
Penerimaan sumber daya alam/Natural resources revenue 163 119 177 264 197 205Penerimaan minyak bumi/Oil revenues 107 541 113 682 120 918Penerimaan gas alam/Natural gas revenues 41 799 45 790 53 951Penerimaan pertambangan umum/General mining revenues 10 365 14 454 17 599Penerimaan kehutanan/Forestry revenues 2 908 2 955 4 154Penerimaan perikanan/Fishery revenues 150 150 180Penerimaan pertambangan panas bumiGeothermal mining revenues
356 233 403
Bagian laba BUMN/Profit transfer from SOE 27 590 28 001 33 500Penerimaan bukan pajak lainnya/Other non-tax revenue 45 167 53 492 77 991Pendapatan Badan Layanan Umum (BLU)/Public Service Institution 15 031 19 235 23 499
Hibah/Grant 3 740 825 4 484
Jumlah/Total 1 104 902 1 311 387 1 529 673
http
://www.b
ps.g
o.id

G O V E R N M E N T
S t a t i s t i c a l Y e a r b o o k o f I n d o n e s i a 2 0 1 3 57
Realisasi Penerimaan Negara 1 (miliar rupiah), 2010–2012Actual Government Revenues 1 (billion rupiahs), 2010–2012
Tabel –––––– 2.4.3Table
Catatan/Note: 1 Angka Lembaga Kebijakan Pengadaan Barang/Jasa Pemerintah (LKPP)/Government Procurement Policy Board figures 2 Angka APBN-P/APBN-P figures Sumber/Source: Kementerian Keuangan/Ministry of Finance
Sumber Penerimaan/Source of Revenues 2010 2011 20122
(1) (2) (3) (4)
Penerimaan Dalam Negeri/Domestic Revenue 992 249 1 205 346 1 357 380
Penerimaan Pajak/Tax Revenue 723 307 873 874 1 016 237
Pajak dalam negeri/Domestic tax 694 392 819 752 968 293Pajak penghasilan/Income tax 357 045 431 122 513 650
Nonmigas/Non-oil and gas 298 173 358 026 445 733Migas/Oil and gas 58 872 73 096 67 917
Pajak pertambahan nilai barang dan jasa, dan pajak penjualan atas barang mewah Value added tax on goods and services, and tax on sale of luxury goods
230 605 277 800 336 057
Pajak bumi dan bangunan/Land and building tax 28 581 29 893 29 687Bea perolehan atas tanah dan bangunan 8 026 -1 –Tax of rights in land and building
Cukai/Excise duties 66 166 77 010 83 267Pajak lainnya/Other taxes 3 969 3 928 5 632
Pajak perdagangan internasional/International trade taxes 28 915 54 122 47 944Bea masuk/Import duties 20 017 24 266 24 738Pajak ekspor/Export tax 8 898 28 856 23 206
Penerimaan Bukan Pajak/Non-Tax Revenue 268 942 331 472 341 143
Penerimaan sumber daya alam/Natural resources revenue 168 825 213 823 217 159Penerimaan minyak bumi/Oil revenues 111 815 141 303 150 847Penerimaan gas alam/Natural gas revenues 40 918 52 187 47 464Penerimaan pertambangan umum/General mining revenues 12 647 16 370 15 274Penerimaan kehutanan/Forestry revenues 3 009 3 216 3 075Penerimaan perikanan/Fishery revenues 92 184 150Penerimaan pertambangan panas bumiGeothermal mining revenues
344 563 349
Bagian laba BUMN/Profit transfer from SOE 30 097 28 184 30 776Penerimaan bukan pajak lainnya/Other non-tax revenue 59 429 69 361 72 799Pendapatan Badan Layanan Umum (BLU)/Public Service Institution 10 591 20 104 20 408
Hibah/Grant 3 023 5 254 825
Jumlah/Total 995 272 1 210 600 1 358 205
http
://www.b
ps.g
o.id

P E M E R I N T A H A N
S t a t i s t i k I n d o n e s i a 2 0 1 358
Realisasi Pengeluaran Negara 1 (miliar rupiah), 2010–2012Actual Government Expenditures 1 (billion rupiahs), 2010–2012
Tabel –––––– 2.4.4Table
Catatan/Note: 1 Angka Lembaga Kebijakan Pengadaan Barang/Jasa Pemerintah (LKPP)/Government Procurement Policy Board figures 2 Angka APBN-P/APBN-P figuresSumber/Source: Kementerian Keuangan/Ministry of Finance
Jenis Pengeluaran/Kind of Expenditures 2010 2011 2012 2
(1) (2) (3) (4)
Pengeluaran Pemerintah Pusat/Central Government 697 406 883 722 1 069 534Belanja pegawai/Personnel expenditure 148 078 175 738 212 255
Belanja barang/Material expenditure 97 597 124 640 162 012
Belanja modal/Capital expenditure 80 287 117 855 176 052
Pembayaran bunga utang/Interest payment 88 383 93 262 117 785Utang dalam negeri/Domestic interest 61 480 66 825 84 749Utang luar negeri/External interest 26 903 26 437 33 036
Subsidi/Subsidy 192 707 295 358 245 076Subsidi energi/Energy subsidy 139 953 255 609 202 353Subsidi non energi/Non-energy subsidy 52 754 39 749 42 723
Belanja hibah/Grant 70 300 1 791
Bantuan sosial/Social expenditure 68 611 71 104 86 028
Belanja lainnya/Other expenditures 21 673 5 465 68 535
Pengeluaran untuk Daerah/Region Expenditure 344 727 411 325 478 776
Dana perimbangan/Balance funds 316 711 347 246 408 352
Dana bagi hasil/Sharing revenue 92 183 96 909 108 422Dana alokasi umum/General allocation funds 203 572 225 534 273 814Dana alokasi khusus/Specific allocation funds 20 956 24 803 26 116
Dana otonomi khusus dan penyeimbang 28 016 64 079 70 424Specific autonomy funds and balancing
Jumlah/Total 1 042 133 1 295 047 1 548 310
http
://www.b
ps.g
o.id
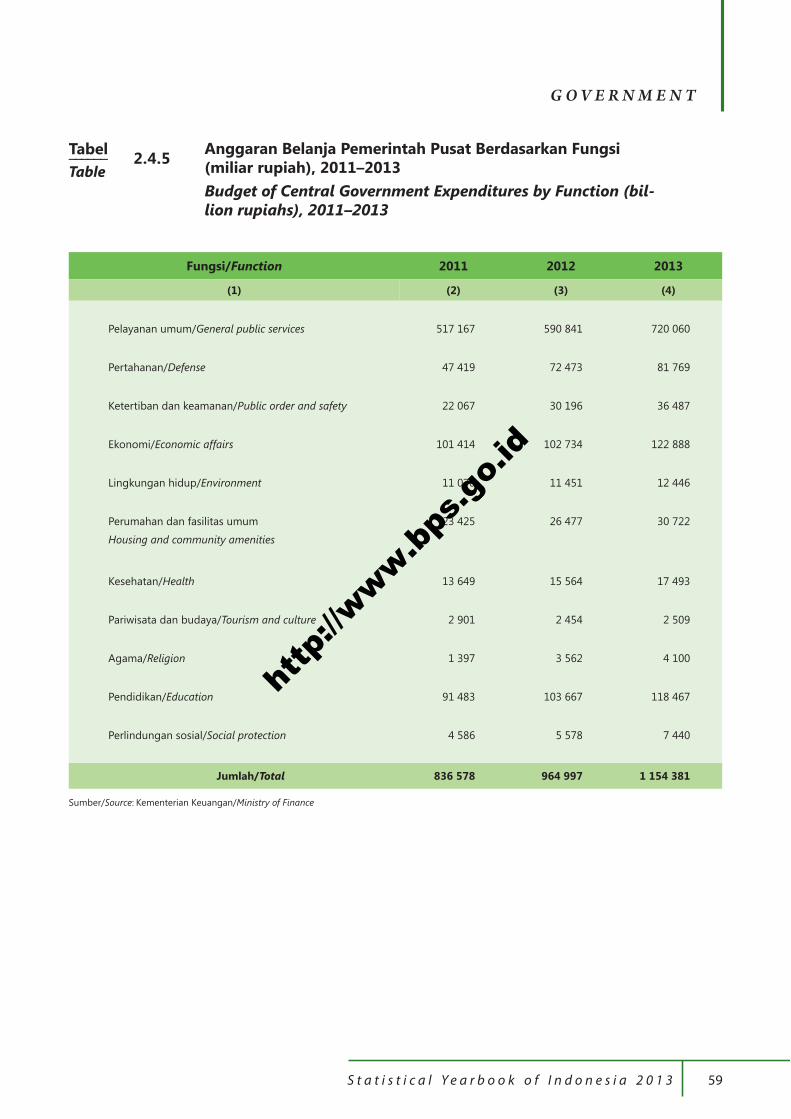
G O V E R N M E N T
S t a t i s t i c a l Y e a r b o o k o f I n d o n e s i a 2 0 1 3 59
Anggaran Belanja Pemerintah Pusat Berdasarkan Fungsi (miliar rupiah), 2011–2013Budget of Central Government Expenditures by Function (bil-lion rupiahs), 2011–2013
Tabel –––––– 2.4.5Table
Sumber/Source: Kementerian Keuangan/Ministry of Finance
Fungsi/Function 2011 2012 2013
(1) (2) (3) (4)
Pelayanan umum/General public services 517 167 590 841 720 060
Pertahanan/Defense 47 419 72 473 81 769
Ketertiban dan keamanan/Public order and safety 22 067 30 196 36 487
Ekonomi/Economic affairs 101 414 102 734 122 888
Lingkungan hidup/Environment 11 070 11 451 12 446
Perumahan dan fasilitas umum 23 425 26 477 30 722
Housing and community amenities
Kesehatan/Health 13 649 15 564 17 493
Pariwisata dan budaya/Tourism and culture 2 901 2 454 2 509
Agama/Religion 1 397 3 562 4 100
Pendidikan/Education 91 483 103 667 118 467
Perlindungan sosial/Social protection 4 586 5 578 7 440
Jumlah/Total 836 578 964 997 1 154 381
http
://www.b
ps.g
o.id
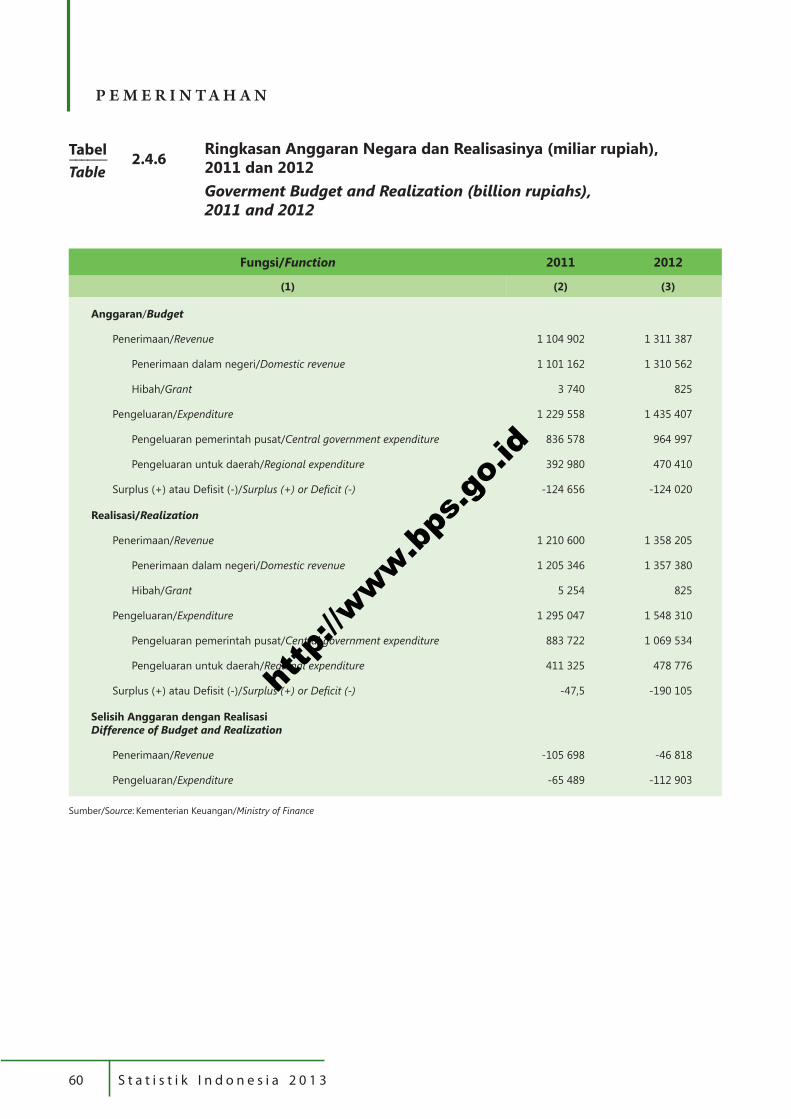
P E M E R I N T A H A N
S t a t i s t i k I n d o n e s i a 2 0 1 360
Ringkasan Anggaran Negara dan Realisasinya (miliar rupiah), 2011 dan 2012Goverment Budget and Realization (billion rupiahs), 2011 and 2012
Tabel –––––– 2.4.6Table
Sumber/Source: Kementerian Keuangan/Ministry of Finance
Fungsi/Function 2011 2012
(1) (2) (3)
Anggaran/Budget
Penerimaan/Revenue 1 104 902 1 311 387
Penerimaan dalam negeri/Domestic revenue 1 101 162 1 310 562
Hibah/Grant 3 740 825
Pengeluaran/Expenditure 1 229 558 1 435 407
Pengeluaran pemerintah pusat/Central government expenditure 836 578 964 997
Pengeluaran untuk daerah/Regional expenditure 392 980 470 410
Surplus (+) atau Defisit (-)/Surplus (+) or Deficit (-) -124 656 -124 020
Realisasi/Realization
Penerimaan/Revenue 1 210 600 1 358 205
Penerimaan dalam negeri/Domestic revenue 1 205 346 1 357 380
Hibah/Grant 5 254 825
Pengeluaran/Expenditure 1 295 047 1 548 310
Pengeluaran pemerintah pusat/Central government expenditure 883 722 1 069 534
Pengeluaran untuk daerah/Regional expenditure 411 325 478 776
Surplus (+) atau Defisit (-)/Surplus (+) or Deficit (-) -47,5 -190 105
Selisih Anggaran dengan RealisasiDifference of Budget and Realization
Penerimaan/Revenue -105 698 -46 818
Pengeluaran/Expenditure -65 489 -112 903
http
://www.b
ps.g
o.id

G O V E R N M E N T
S t a t i s t i c a l Y e a r b o o k o f I n d o n e s i a 2 0 1 3 61
Rekapitulasi Realisasi Penerimaan dan Pengeluaran Pemerintah Daerah Provinsi (juta rupiah), 2010–2012Summary of Actual Revenues and Expenditures of Provincial Government (million rupiahs), 2010–2012
Tabel –––––– 2.4.7Table
[Diolah dari Hasil Survei Statistik Keuangan Pemerintah Daerah Provinsi, BPS/Based on Financial Statistics of Provincial Government Survey, BPS–Statistics Indonesia]
ProvinsiProvince
TahunYear
Penerimaan/Revenue Pengeluaran/Expenditure
PendapatanRevenue
PembiayaanFinancing
BelanjaExpenditure
PembiayaanFinancing
(1) (2) (3) (4) (5) (6)
Aceh 2010 6 967 815 1 842 989 7 528 516 1 282 288 2011 7 610 320 1 306 726 7 374 625 1 542 421 2012 1 8 714 808 804 131 9 511 939 7 000
Sumatera Utara 2010 3 885 636 346 533 3 666 706 565 463 2011 4 958 482 404 885 4 611 477 751 890 2012 1 7 332 537 700 028 7 677 853 354 712
Sumatera Barat 2010 1 920 971 673 887 2 239 753 355 105 2011 2 071 161 335 221 2 328 765 77 617 2012 1 2 917 855 275 605 3 121 167 72 293
Riau 2010 4 346 845 114 588 4 267 433 194 000 2011 5 440 441 421 520 4 265 130 1 596 831 2012 1 5 487 776 953 880 6 366 656 75 000
Kepulauan Riau 2010 1 853 590 242 174 1 723 575 372 189 2011 1 876 879 375 005 1 947 593 304 291 2012 1 2 038 209 373 080 2 387 789 23 500
Jambi 2010 1 640 186 201 205 1 488 130 353 261 2011 2 078 807 353 260 1 750 242 681 825 2012 1 1 734 302 208 201 1 942 503 –
Sumatera Selatan 2010 3 224 160 315 251 3 108 037 431 374 2011 3 963 985 390 315 3 806 080 548 220 2012 1 4 939 148 213 204 4 742 452 409 900
Kepulauan Bangka Belitung 2010 848 025 264 130 862 716 249 439 2011 1 193 497 240 433 1 176 684 257 246 2012 1 1 385 019 75 000 1 450 019 10 000
Bengkulu 2010 1 000 861 10 570 971 199 40 232 2011 1 166 982 39 679 1 009 215 197 446 2012 1 1 542 457 43 698 1 586 155 –
Lampung 2010 2 091 684 79 029 2 004 899 165 814 2011 2 527 991 161 182 2 566 079 123 094 2012 1 2 809 750 43 500 2 838 250 15 000
DKI Jakarta 2010 23 025 987 3 748 512 21 552 896 5 221 603 2011 28 297 361 4 926 078 26 423 682 6 799 757 2012 1 30 642 744 5 380 601 33 827 032 2 196 313
http
://www.b
ps.g
o.id
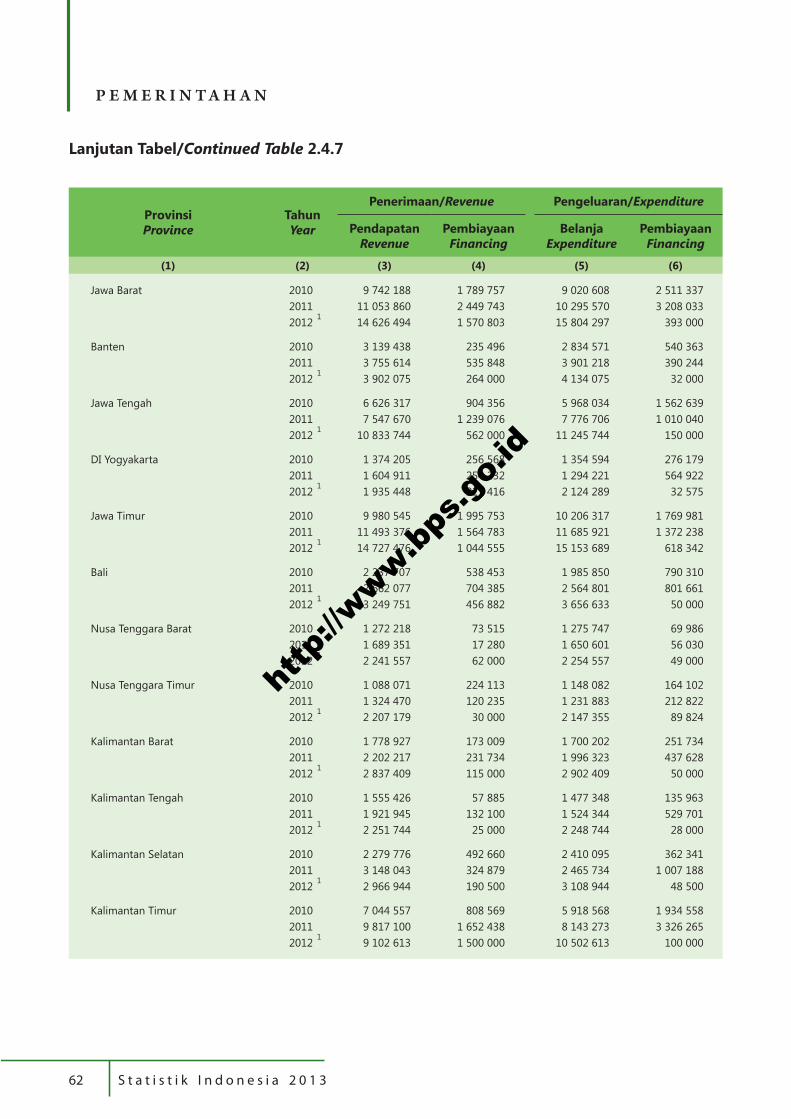
P E M E R I N T A H A N
S t a t i s t i k I n d o n e s i a 2 0 1 362
Lanjutan Tabel/Continued Table 2.4.7
ProvinsiProvince
TahunYear
Penerimaan/Revenue Pengeluaran/Expenditure
PendapatanRevenue
PembiayaanFinancing
BelanjaExpenditure
PembiayaanFinancing
(1) (2) (3) (4) (5) (6)
Jawa Barat 2010 9 742 188 1 789 757 9 020 608 2 511 337 2011 11 053 860 2 449 743 10 295 570 3 208 033 2012 1 14 626 494 1 570 803 15 804 297 393 000
Banten 2010 3 139 438 235 496 2 834 571 540 363 2011 3 755 614 535 848 3 901 218 390 244 2012 1 3 902 075 264 000 4 134 075 32 000
Jawa Tengah 2010 6 626 317 904 356 5 968 034 1 562 639 2011 7 547 670 1 239 076 7 776 706 1 010 040 2012 1 10 833 744 562 000 11 245 744 150 000
DI Yogyakarta 2010 1 374 205 256 568 1 354 594 276 179 2011 1 604 911 254 232 1 294 221 564 922 2012 1 1 935 448 221 416 2 124 289 32 575
Jawa Timur 2010 9 980 545 1 995 753 10 206 317 1 769 981 2011 11 493 376 1 564 783 11 685 921 1 372 238 2012 1 14 727 476 1 044 555 15 153 689 618 342
Bali 2010 2 237 707 538 453 1 985 850 790 310 2011 2 662 077 704 385 2 564 801 801 661 2012 1 3 249 751 456 882 3 656 633 50 000
Nusa Tenggara Barat 2010 1 272 218 73 515 1 275 747 69 986 2011 1 689 351 17 280 1 650 601 56 030 2012 1 2 241 557 62 000 2 254 557 49 000
Nusa Tenggara Timur 2010 1 088 071 224 113 1 148 082 164 102 2011 1 324 470 120 235 1 231 883 212 822 2012 1 2 207 179 30 000 2 147 355 89 824
Kalimantan Barat 2010 1 778 927 173 009 1 700 202 251 734 2011 2 202 217 231 734 1 996 323 437 628 2012 1 2 837 409 115 000 2 902 409 50 000
Kalimantan Tengah 2010 1 555 426 57 885 1 477 348 135 963 2011 1 921 945 132 100 1 524 344 529 701 2012 1 2 251 744 25 000 2 248 744 28 000
Kalimantan Selatan 2010 2 279 776 492 660 2 410 095 362 341 2011 3 148 043 324 879 2 465 734 1 007 188 2012 1 2 966 944 190 500 3 108 944 48 500
Kalimantan Timur 2010 7 044 557 808 569 5 918 568 1 934 558 2011 9 817 100 1 652 438 8 143 273 3 326 265 2012 1 9 102 613 1 500 000 10 502 613 100 000
http
://www.b
ps.g
o.id

G O V E R N M E N T
S t a t i s t i c a l Y e a r b o o k o f I n d o n e s i a 2 0 1 3 63
Lanjutan Tabel/Continued Table 2.4.7
Catatan/Note: 1 APBD/Regional budget
ProvinsiProvince
TahunYear
Penerimaan/Revenue Pengeluaran/Expenditure
PendapatanRevenue
PembiayaanFinancing
BelanjaExpenditure
PembiayaanFinancing
(1) (2) (3) (4) (5) (6)
Sulawesi Utara 2010 1 158 671 347 026 1 137 423 368 274 2011 1 365 705 109 274 1 285 865 189 114 2012 1 1 717 270 100 699 1 817 969 –
Gorontalo 2010 593 415 65 071 567 081 91 405 2011 697 576 96 844 724 528 69 892 2012 1 913 402 60 000 938 402 35 000
Sulawesi Tengah 2010 1 177 610 177 052 1 127 257 227 405 2011 1 410 594 220 705 1 426 082 205 217 2012 1 1 779 107 158 092 1 931 199 6 000
Sulawesi Selatan 2010 2 564 076 230 448 2 486 160 308 364 2011 3 110 567 290 515 3 177 044 224 038 2012 1 4 601 370 159 572 4 760 942 –
Sulawesi Barat 2010 610 378 23 221 607 672 25 927 2011 718 871 25 752 731 368 13 255 2012 1 952 009 19 000 969 009 2 000
Sulawesi Tenggara 2010 1 055 174 106 197 1 125 688 35 683 2011 1 288 980 198 733 1 328 025 159 688 2012 1 1 846 011 180 696 2 021 707 5 000
Maluku 2010 952 661 58 385 950 281 60 765 2011 1 138 187 55 485 1 109 921 83 751 2012 1 1 412 177 22 680 1 429 870 4 987
Maluku Utara 2010 695 829 2 873 682 723 15 979 2011 936 792 15 732 724 375 228 149 2012 1 1 125 033 145 000 1 170 033 100 000
Papua 2010 5 661 736 142 103 5 650 475 153 364 2011 6 227 545 955 939 6 290 376 893 108 2012 1 7 295 602 75 000 7 182 634 187 968
Papua Barat 2010 3 407 803 129 160 3 104 772 432 191 2011 3 699 884 353 184 3 629 960 423 108 2012 1 3 893 382 130 000 3 998 381 25 001
Indonesia 2010 116 802 488 16 670 538 112 153 408 21 319 618 2011 140 001 241 20 503 200 132 217 711 28 286 730 2012 1 165 962 402 16 163 823 176 955 310 5 170 915
http
://www.b
ps.g
o.id
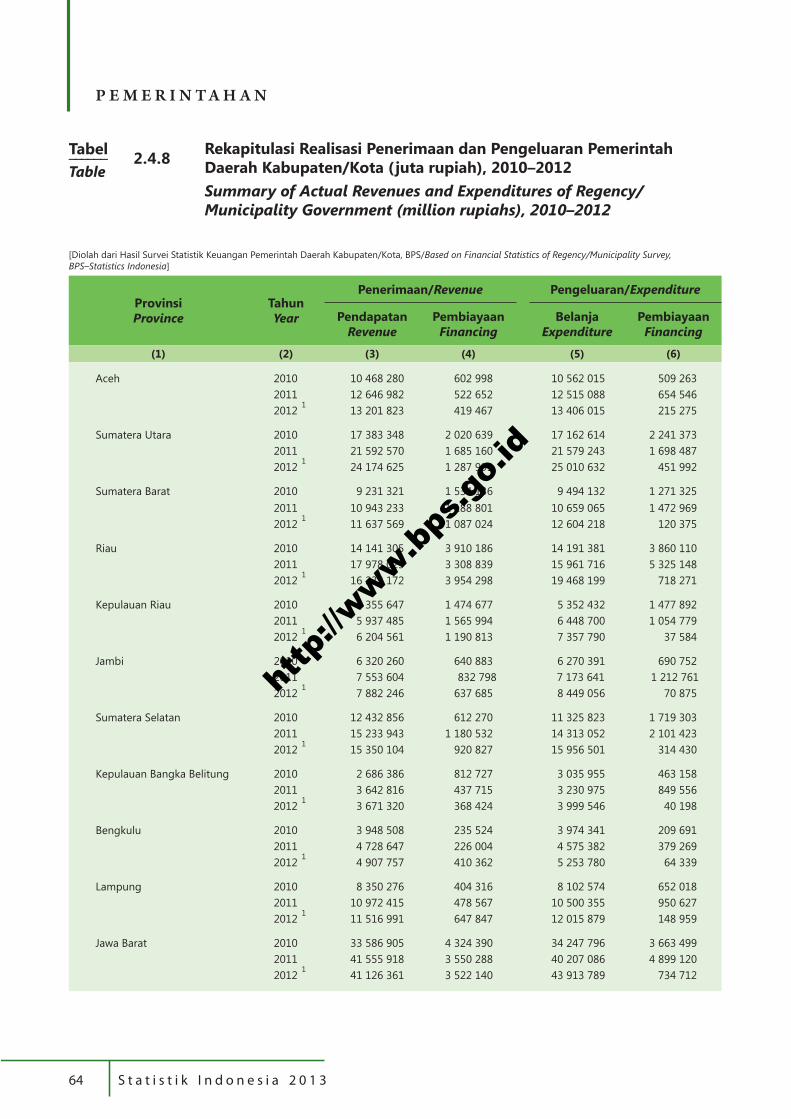
P E M E R I N T A H A N
S t a t i s t i k I n d o n e s i a 2 0 1 364
Rekapitulasi Realisasi Penerimaan dan Pengeluaran Pemerintah Daerah Kabupaten/Kota (juta rupiah), 2010–2012Summary of Actual Revenues and Expenditures of Regency/ Municipality Government (million rupiahs), 2010–2012
Tabel –––––– 2.4.8Table
[Diolah dari Hasil Survei Statistik Keuangan Pemerintah Daerah Kabupaten/Kota, BPS/Based on Financial Statistics of Regency/Municipality Survey, BPS–Statistics Indonesia]
ProvinsiProvince
TahunYear
Penerimaan/Revenue Pengeluaran/Expenditure
PendapatanRevenue
PembiayaanFinancing
BelanjaExpenditure
PembiayaanFinancing
(1) (2) (3) (4) (5) (6)
Aceh 2010 10 468 280 602 998 10 562 015 509 263 2011 12 646 982 522 652 12 515 088 654 546 2012 1 13 201 823 419 467 13 406 015 215 275
Sumatera Utara 2010 17 383 348 2 020 639 17 162 614 2 241 373 2011 21 592 570 1 685 160 21 579 243 1 698 487 2012 1 24 174 625 1 287 999 25 010 632 451 992
Sumatera Barat 2010 9 231 321 1 534 136 9 494 132 1 271 325 2011 10 943 233 1 188 801 10 659 065 1 472 969 2012 1 11 637 569 1 087 024 12 604 218 120 375
Riau 2010 14 141 305 3 910 186 14 191 381 3 860 110 2011 17 978 025 3 308 839 15 961 716 5 325 148 2012 1 16 232 172 3 954 298 19 468 199 718 271
Kepulauan Riau 2010 5 355 647 1 474 677 5 352 432 1 477 892 2011 5 937 485 1 565 994 6 448 700 1 054 779 2012 1 6 204 561 1 190 813 7 357 790 37 584
Jambi 2010 6 320 260 640 883 6 270 391 690 752 2011 7 553 604 832 798 7 173 641 1 212 761 2012 1 7 882 246 637 685 8 449 056 70 875
Sumatera Selatan 2010 12 432 856 612 270 11 325 823 1 719 303 2011 15 233 943 1 180 532 14 313 052 2 101 423 2012 1 15 350 104 920 827 15 956 501 314 430
Kepulauan Bangka Belitung 2010 2 686 386 812 727 3 035 955 463 158 2011 3 642 816 437 715 3 230 975 849 556 2012 1 3 671 320 368 424 3 999 546 40 198
Bengkulu 2010 3 948 508 235 524 3 974 341 209 691 2011 4 728 647 226 004 4 575 382 379 269 2012 1 4 907 757 410 362 5 253 780 64 339
Lampung 2010 8 350 276 404 316 8 102 574 652 018 2011 10 972 415 478 567 10 500 355 950 627 2012 1 11 516 991 647 847 12 015 879 148 959
Jawa Barat 2010 33 586 905 4 324 390 34 247 796 3 663 499 2011 41 555 918 3 550 288 40 207 086 4 899 120 2012 1 41 126 361 3 522 140 43 913 789 734 712
http
://www.b
ps.g
o.id
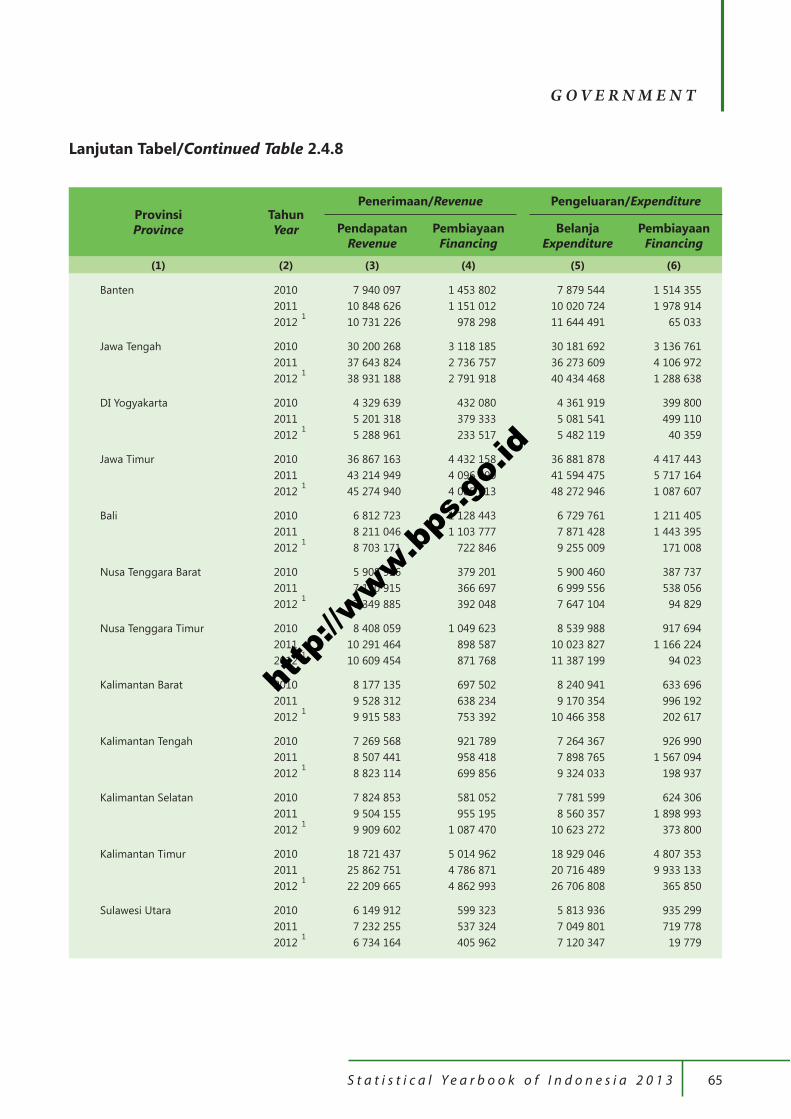
G O V E R N M E N T
S t a t i s t i c a l Y e a r b o o k o f I n d o n e s i a 2 0 1 3 65
Lanjutan Tabel/Continued Table 2.4.8
ProvinsiProvince
TahunYear
Penerimaan/Revenue Pengeluaran/Expenditure
PendapatanRevenue
PembiayaanFinancing
BelanjaExpenditure
PembiayaanFinancing
(1) (2) (3) (4) (5) (6)
Banten 2010 7 940 097 1 453 802 7 879 544 1 514 355 2011 10 848 626 1 151 012 10 020 724 1 978 914 2012 1 10 731 226 978 298 11 644 491 65 033
Jawa Tengah 2010 30 200 268 3 118 185 30 181 692 3 136 761 2011 37 643 824 2 736 757 36 273 609 4 106 972 2012 1 38 931 188 2 791 918 40 434 468 1 288 638
DI Yogyakarta 2010 4 329 639 432 080 4 361 919 399 800 2011 5 201 318 379 333 5 081 541 499 110 2012 1 5 288 961 233 517 5 482 119 40 359
Jawa Timur 2010 36 867 163 4 432 158 36 881 878 4 417 443 2011 43 214 949 4 096 690 41 594 475 5 717 164 2012 1 45 274 940 4 085 613 48 272 946 1 087 607
Bali 2010 6 812 723 1 128 443 6 729 761 1 211 405 2011 8 211 046 1 103 777 7 871 428 1 443 395 2012 1 8 703 171 722 846 9 255 009 171 008
Nusa Tenggara Barat 2010 5 908 996 379 201 5 900 460 387 737 2011 7 170 915 366 697 6 999 556 538 056 2012 1 7 349 885 392 048 7 647 104 94 829
Nusa Tenggara Timur 2010 8 408 059 1 049 623 8 539 988 917 694 2011 10 291 464 898 587 10 023 827 1 166 224 2012 1 10 609 454 871 768 11 387 199 94 023
Kalimantan Barat 2010 8 177 135 697 502 8 240 941 633 696 2011 9 528 312 638 234 9 170 354 996 192 2012 1 9 915 583 753 392 10 466 358 202 617
Kalimantan Tengah 2010 7 269 568 921 789 7 264 367 926 990 2011 8 507 441 958 418 7 898 765 1 567 094 2012 1 8 823 114 699 856 9 324 033 198 937
Kalimantan Selatan 2010 7 824 853 581 052 7 781 599 624 306 2011 9 504 155 955 195 8 560 357 1 898 993 2012 1 9 909 602 1 087 470 10 623 272 373 800
Kalimantan Timur 2010 18 721 437 5 014 962 18 929 046 4 807 353 2011 25 862 751 4 786 871 20 716 489 9 933 133 2012 1 22 209 665 4 862 993 26 706 808 365 850
Sulawesi Utara 2010 6 149 912 599 323 5 813 936 935 299 2011 7 232 255 537 324 7 049 801 719 778 2012 1 6 734 164 405 962 7 120 347 19 779
http
://www.b
ps.g
o.id
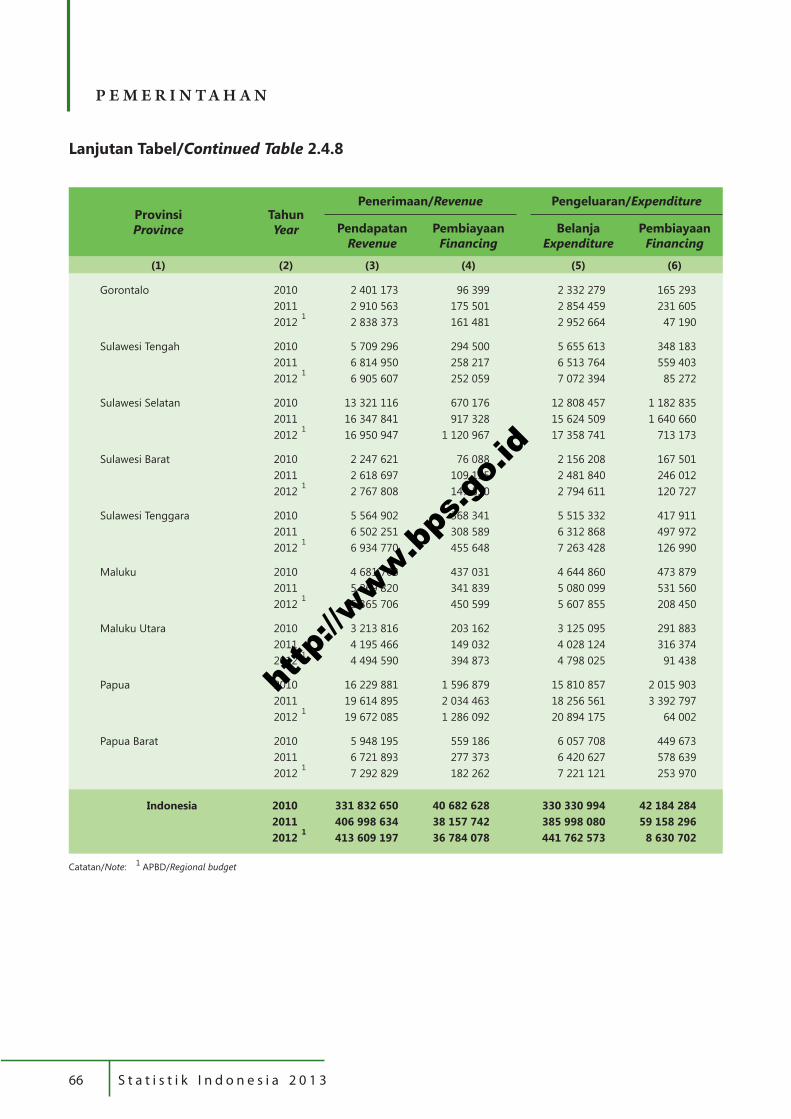
P E M E R I N T A H A N
S t a t i s t i k I n d o n e s i a 2 0 1 366
Lanjutan Tabel/Continued Table 2.4.8
Catatan/Note: 1 APBD/Regional budget
ProvinsiProvince
TahunYear
Penerimaan/Revenue Pengeluaran/Expenditure
PendapatanRevenue
PembiayaanFinancing
BelanjaExpenditure
PembiayaanFinancing
(1) (2) (3) (4) (5) (6)
Gorontalo 2010 2 401 173 96 399 2 332 279 165 293 2011 2 910 563 175 501 2 854 459 231 605 2012 1 2 838 373 161 481 2 952 664 47 190
Sulawesi Tengah 2010 5 709 296 294 500 5 655 613 348 183 2011 6 814 950 258 217 6 513 764 559 403 2012 1 6 905 607 252 059 7 072 394 85 272
Sulawesi Selatan 2010 13 321 116 670 176 12 808 457 1 182 835 2011 16 347 841 917 328 15 624 509 1 640 660 2012 1 16 950 947 1 120 967 17 358 741 713 173
Sulawesi Barat 2010 2 247 621 76 088 2 156 208 167 501 2011 2 618 697 109 155 2 481 840 246 012 2012 1 2 767 808 147 530 2 794 611 120 727
Sulawesi Tenggara 2010 5 564 902 368 341 5 515 332 417 911 2011 6 502 251 308 589 6 312 868 497 972 2012 1 6 934 770 455 648 7 263 428 126 990
Maluku 2010 4 681 708 437 031 4 644 860 473 879 2011 5 269 820 341 839 5 080 099 531 560 2012 1 5 365 706 450 599 5 607 855 208 450
Maluku Utara 2010 3 213 816 203 162 3 125 095 291 883 2011 4 195 466 149 032 4 028 124 316 374 2012 1 4 494 590 394 873 4 798 025 91 438
Papua 2010 16 229 881 1 596 879 15 810 857 2 015 903 2011 19 614 895 2 034 463 18 256 561 3 392 797 2012 1 19 672 085 1 286 092 20 894 175 64 002
Papua Barat 2010 5 948 195 559 186 6 057 708 449 673 2011 6 721 893 277 373 6 420 627 578 639 2012 1 7 292 829 182 262 7 221 121 253 970
Indonesia 2010 331 832 650 40 682 628 330 330 994 42 184 284 2011 406 998 634 38 157 742 385 998 080 59 158 296 2012 1 413 609 197 36 784 078 441 762 573 8 630 702
http
://www.b
ps.g
o.id

G O V E R N M E N T
S t a t i s t i c a l Y e a r b o o k o f I n d o n e s i a 2 0 1 3 67
Realisasi Penerimaan dan Pengeluaran Pemerintah Desa(ribu rupiah), 2009–2011Actual Revenues and Expenditures of Village Government (thousand rupiahs), 2009–2011
Tabel –––––– 2.4.9Table
[Diolah dari Hasil Survei Statistik Keuangan Pemerintahan Desa, BPS/Based on Financial Statistics of Village Government Survey, BPS–Statistics Indonesia]
ProvinsiProvince
TahunYear
Perkotaan/Urban Perdesaan/Rural
PendapatanRevenue
BelanjaExpenditure
PendapatanRevenue
BelanjaExpenditure
(1) (2) (3) (4) (5) (6)
Aceh 2009 72 151 307 70 260 526 447 734 175 436 706 3482010 96 872 569 94 204 998 759 127 722 745 143 0802011 x 99 696 483 96 591 608 955 988 832 941 108 654
Sumatera Utara 2009 54 951 559 54 940 944 343 671 037 343 730 4692010 49 644 074 49 491 644 281 590 765 280 792 8172011 x 54 716 366 53 098 296 326 270 703 324 790 481
Sumatera Barat 2009 22 897 607 22 159 181 129 147 813 123 607 9092010 26 768 284 26 526 871 128 847 610 126 720 0162011 x 33 692 666 31 086 591 153 611 835 141 468 654
Riau 2009 18 505 254 17 772 401 243 466 343 238 646 8442010 25 191 411 25 019 535 357 155 799 353 367 7002011 x 41 804 703 32 077 039 472 877 281 412 121 741
Kepulauan Riau 2009 2 559 389 2 376 674 41 883 144 40 315 2182010 3 428 685 3 289 592 55 947 357 51 124 2622011 x 6 295 035 5 922 951 85 391 979 82 303 571
Jambi 2009 8 479 885 8 449 001 159 509 096 158 487 9152010 10 818 811 10 380 871 179 490 963 177 737 5552011 x 15 902 360 15 593 970 215 117 139 213 615 894
Sumatera Selatan 2009 8 888 409 8 661 793 321 506 600 318 301 7822010 10 433 768 10 267 443 347 968 589 342 895 8272011 x 11 329 011 11 106 526 396 455 181 372 854 137
Kepulauan Bangka Belitung 2009 13 212 411 12 501 480 73 387 894 72 805 3782010 21 772 992 20 395 365 89 647 266 84 587 2512011 x 23 779 621 20 497 122 108 950 631 103 081 082
Bengkulu 2009 3 809 744 3 784 946 99 486 541 99 001 9352010 3 762 073 3 657 865 117 410 568 116 888 0122011 x 3 579 781 3 551 699 153 659 404 136 513 729
Lampung 2009 15 028 507 15 022 275 240 393 873 238 175 0002010 15 167 837 15 076 834 291 795 817 286 742 7582011 x 16 068 133 15 483 574 355 917 780 337 429 644
Jawa Barat 2009 495 257 264 492 602 880 746 452 308 742 481 3322010 572 598 021 566 709 424 845 732 285 836 484 3262011 x 790 359 808 755 622 846 1 237 432 015 1 199 770 717
http
://www.b
ps.g
o.id
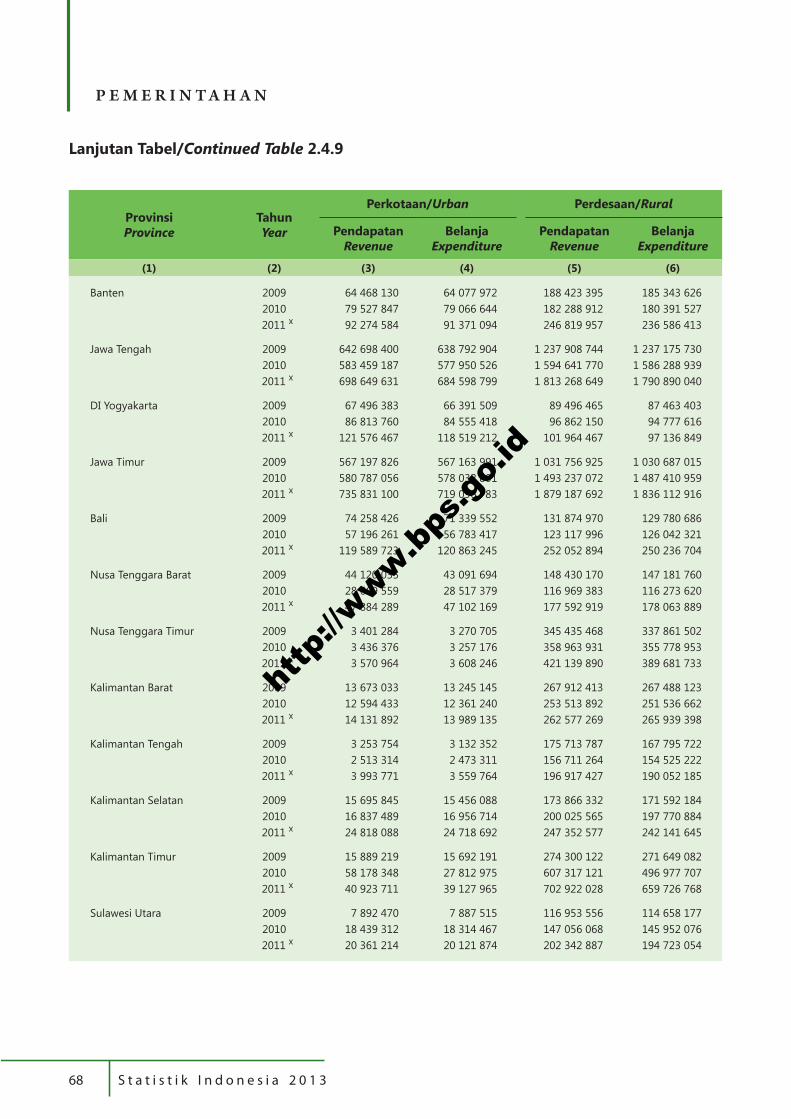
P E M E R I N T A H A N
S t a t i s t i k I n d o n e s i a 2 0 1 368
Lanjutan Tabel/Continued Table 2.4.9
ProvinsiProvince
TahunYear
Perkotaan/Urban Perdesaan/Rural
PendapatanRevenue
BelanjaExpenditure
PendapatanRevenue
BelanjaExpenditure
(1) (2) (3) (4) (5) (6)
Banten 2009 64 468 130 64 077 972 188 423 395 185 343 6262010 79 527 847 79 066 644 182 288 912 180 391 5272011 x 92 274 584 91 371 094 246 819 957 236 586 413
Jawa Tengah 2009 642 698 400 638 792 904 1 237 908 744 1 237 175 7302010 583 459 187 577 950 526 1 594 641 770 1 586 288 9392011 x 698 649 631 684 598 799 1 813 268 649 1 790 890 040
DI Yogyakarta 2009 67 496 383 66 391 509 89 496 465 87 463 4032010 86 813 760 84 555 418 96 862 150 94 777 6162011 x 121 576 467 118 519 212 101 964 467 97 136 849
Jawa Timur 2009 567 197 826 567 163 991 1 031 756 925 1 030 687 0152010 580 787 056 578 032 801 1 493 237 072 1 487 410 9592011 x 735 831 100 719 096 783 1 879 187 692 1 836 112 916
Bali 2009 74 258 426 71 339 552 131 874 970 129 780 6862010 57 196 261 56 783 417 123 117 996 126 042 3212011 x 119 589 723 120 863 245 252 052 894 250 236 704
Nusa Tenggara Barat 2009 44 120 035 43 091 694 148 430 170 147 181 7602010 28 669 559 28 517 379 116 969 383 116 273 6202011 x 47 884 289 47 102 169 177 592 919 178 063 889
Nusa Tenggara Timur 2009 3 401 284 3 270 705 345 435 468 337 861 5022010 3 436 376 3 257 176 358 963 931 355 778 9532011 x 3 570 964 3 608 246 421 139 890 389 681 733
Kalimantan Barat 2009 13 673 033 13 245 145 267 912 413 267 488 1232010 12 594 433 12 361 240 253 513 892 251 536 6622011 x 14 131 892 13 989 135 262 577 269 265 939 398
Kalimantan Tengah 2009 3 253 754 3 132 352 175 713 787 167 795 7222010 2 513 314 2 473 311 156 711 264 154 525 2222011 x 3 993 771 3 559 764 196 917 427 190 052 185
Kalimantan Selatan 2009 15 695 845 15 456 088 173 866 332 171 592 1842010 16 837 489 16 956 714 200 025 565 197 770 8842011 x 24 818 088 24 718 692 247 352 577 242 141 645
Kalimantan Timur 2009 15 889 219 15 692 191 274 300 122 271 649 0822010 58 178 348 27 812 975 607 317 121 496 977 7072011 x 40 923 711 39 127 965 702 922 028 659 726 768
Sulawesi Utara 2009 7 892 470 7 887 515 116 953 556 114 658 1772010 18 439 312 18 314 467 147 056 068 145 952 0762011 x 20 361 214 20 121 874 202 342 887 194 723 054
http
://www.b
ps.g
o.id

G O V E R N M E N T
S t a t i s t i c a l Y e a r b o o k o f I n d o n e s i a 2 0 1 3 69
Lanjutan Tabel/Continued Table 2.4.9
ProvinsiProvince
TahunYear
Perkotaan/Urban Perdesaan/Rural
PendapatanRevenue
BelanjaExpenditure
PendapatanRevenue
BelanjaExpenditure
(1) (2) (3) (4) (5) (6)
Gorontalo 2009 9 301 655 9 290 874 55 296 626 54 546 4142010 7 859 401 7 889 163 59 741 847 59 611 0722011 x 7 727 540 7 645 246 57 683 695 56 631 887
Sulawesi Tengah 2009 2 544 279 2 497 779 140 719 830 137 276 3802010 2 201 883 2 192 512 125 500 512 125 309 5812011 x 2 521 797 2 525 520 139 236 076 138 659 781
Sulawesi Selatan 2009 10 066 389 9 904 930 340 230 505 336 896 3802010 9 889 951 9 706 420 374 013 226 371 025 9112011 x 10 673 523 10 292 286 412 372 207 383 292 123
Sulawesi Barat 2009 886 870 886 870 54 128 330 53 033 2682010 1 277 695 1 151 470 69 974 705 68 911 7492011 x 1 126 695 1 025 355 72 397 912 68 314 273
Sulawesi Tenggara 2009 3 648 746 3 623 123 221 235 134 219 939 4632010 5 994 788 5 906 115 328 425 483 325 015 5332011 x 6 333 393 6 099 893 495 004 907 483 439 489
Maluku 2009 6 423 834 6 141 865 71 575 474 69 019 9372010 5 231 112 5 038 900 64 610 261 63 584 7132011 x 4 611 732 4 327 010 75 885 532 72 337 082
Maluku Utara 2009 5 663 059 5 467 819 114 148 490 110 302 5572010 5 025 777 5 016 599 96 972 213 94 463 6352011 x 5 073 042 5 043 042 103 535 845 85 898 773
Papua 2009 8 374 202 7 598 581 406 515 134 392 510 7522010 6 877 394 6 794 731 485 056 151 460 343 7252011 x 10 685 577 12 134 653 658 656 663 610 305 250
Papua Barat 2009 3 129 100 2 915 162 136 646 202 135 461 3212010 4 328 503 4 292 983 222 370 222 218 267 3462011 x 5 703 440 5 526 440 257 750 918 240 960 468
Indonesia 2009 2 285 824 275 2 266 400 722 2 266 400 722 7 565 238 4442010 2 413 597 971 2 359 091 403 2 359 091 403 8 469 923 6122011 x 3 075 286 140 2 981 928 645 2 981 928 645 10 382 743 355
Catatan/Note: x Angka sementara/Preliminary figures
http
://www.b
ps.g
o.id

http
://www.b
ps.g
o.id

P O P U L A T I O N A N D E M P L O Y M E N T
S t a t i s t i c a l Y e a r b o o k o f I n d o n e s i a 2 0 1 3 71
3PENDUDUK DANKETENAGAKERJAAN
Population andEmployment
http
://www.b
ps.g
o.id

http
://www.b
ps.g
o.id

P O P U L A T I O N A N D E M P L O Y M E N T
S t a t i s t i c a l Y e a r b o o k o f I n d o n e s i a 2 0 1 3 73
PENJELASAN TEKNIS
1. Sumber utama data kependudukan adalah sensus penduduk yang dilaksanakan setiap sepuluh tahun sekali. Sensus penduduk telah dilaksanakan sebanyak enam kali sejak Indonesia merdeka, yaitu tahun 1961, 1971, 1980, 1990, 2000, dan 2010. Dalam publikasi ini, data yang disajikan merupakan hasil SP2000 dan SP2010.
Di dalam sensus penduduk, pencacahan dilakukan terhadap seluruh penduduk yang berdomisili di wilayah teritorial Indonesia termasuk warga negara asing kecuali anggota korps diplomatik negara sahabat beserta keluarganya.
Metode pengumpulan data dalam sensus dilakukan dengan wawancara antara petugas sensus dengan responden dan juga melalui e-census. Pencatatan penduduk menggunakan konsep usual residence, yaitu konsep dimana penduduk biasa bertempat tinggal. Bagi penduduk yang bertempat tinggal tetap dicacah di mana mereka biasa tinggal, sedangkan untuk penduduk yang tidak bertempat tinggal tetap dicacah di tempat di mana mereka ditemukan petugas sensus pada malam ‘Hari Sensus’. Termasuk penduduk yang tidak bertempat tinggal tetap adalah tuna wisma, awak kapal berbendera Indonesia, penghuni perahu/rumah apung, masyarakat terpencil/terasing, dan pengungsi. Bagi mereka yang mempunyai tempat tinggal tetap dan sedang bepergian ke luar wilayah lebih dari enam bulan, tidak dicacah di tempat tinggalnya, tetapi dicacah di tempat tujuannya.
Semua tabel kependudukan (Tabel 3.1.1–3.1.4)
merujuk pada pertengahan tahun untuk tahun 2000 dan bulan Mei untuk tahun 2010.
2. Penduduk Indonesia adalah semua orang yang berdomisili di wilayah teritorial Republik Indonesia selama 6 bulan atau lebih dan atau mereka yang berdomisili kurang dari 6 bulan tetapi bertujuan menetap.
3. Rata-rata pertumbuhan penduduk adalah angka yang menunjukkan tingkat pertambahan penduduk per tahun dalam jangka waktu tertentu.
4. Kepadatan penduduk adalah banyaknya penduduk per kilometer persegi.
TECHNICAL NOTES
1. The main source of demographic data is population census, which is conducted every ten years. Population Census has been conducted six times since Indonesia’s independence: 1961, 1971, 1980, 1990, 2000, and 2010. This publication is the result of the 2000 and 2010 population census.
The population census enumerates all residents domicile in the entire territory of Republic of Indonesia including foreign citizenship except the diplomatic corps members and their families.
The method of data collection in a population census carried out by interviews with respondents and e-census. Enumeration of the population uses the concept of “usual residence”, which is the concept of “places where people usually live”. De jure was applied to the permanent residents, while de facto was applied to non-permanent residents. The permanent residents were enumerated in place where they normally live, the non-permanent residents were enumerated where they were found by the enumerators, on the night of ‘Census Day’. The non permanent residents include homeless people, ship crew, boat people, remote area community, and internally displaced persons. For those who had permanent residence and had been travelling away from their former home for six months or more were enumerated in their permanent places, thus were recorded in their recent places.
All tables of population (i.e., Tables 3.1.1–3.1.4) refer to mid-year population for 2000 Cencus and May for 2010 Census.
2. The population of Indonesia are all residents of the entire territory of Republic of Indonesia who have stayed for six months or longer, and those who intended to stay more than six months even though their length of stay is less than six months.
3. The average growth rate of population is the annual population growth rate over a certain period.
4. Population density is the number of inhabitants per square kilometer.
http
://www.b
ps.g
o.id

P E N D U D U K D A N K E T E N A G A K E R J A A N
S t a t i s t i k I n d o n e s i a 2 0 1 374
5. Rasio jenis kelamin adalah perbandingan antara banyaknya penduduk laki-laki dengan banyaknya penduduk perempuan pada suatu daerah dan waktu tertentu. Biasanya dinyatakan dengan banyaknya penduduk laki-laki untuk 100 penduduk perempuan.
6. Rumah tangga adalah seseorang atau sekelompok orang yang mendiami sebagian atau seluruh bangunan fisik/sensus, dan biasanya tinggal bersama serta pengelolaan makan dari satu dapur. Yang dimaksud makan dari satu dapur adalah jika pengurusan kebutuhan sehari-harinya dikelola bersama-sama menjadi satu.
7. Anggota rumah tangga adalah semua orang yang biasanya bertempat tinggal di suatu rumah tangga, baik yang berada di rumah pada waktu pencacahan maupun yang sementara tidak ada.
8. Rata-rata anggota rumah tangga adalah angka yang menunjukkan rata-rata jumlah anggota rumah tangga per rumah tangga.
9. Sumber utama data ketenagakerjaan adalah Survei Angkatan Kerja Nasional (Sakernas). Survei ini khusus dirancang untuk mengumpulkan informasi/data ketenagakerjaan. Pada beberapa survei sebelumnya, pengumpulan data ketenagakerjaan dipadukan dalam kegiatan lainnya, seperti Survei Sosial Ekonomi Nasional (Susenas), Sensus Penduduk (SP), dan Survei Penduduk Antar Sensus (SUPAS). Sakernas pertama kali diselenggarakan pada tahun 1976, kemudian dilanjutkan pada tahun 1977 dan 1978. Pada tahun 1986–1993, Sakernas diselenggarakan secara triwulanan di seluruh provinsi di Indonesia, baru sejak tahun 1994–2001, Sakernas dilaksanakan secara tahunan, yaitu setiap bulan Agustus. Pada tahun 2002–2004, di samping Sakernas Tahunan dilakukan pula Sakernas Triwulanan. Pada tahun 2005–2010, pengumpulan data Sakernas dilaksanakan secara semesteran pada Februari (Semester I) dan Agustus (Semester II). Tahun 2011 mulai dilakukan kembali secara triwulanan, yaitu Februari (Triwulan I), Mei (Triwulan II), Agustus (Triwulan III), dan November (Triwulan IV). Sakernas Triwulanan ini dimaksudkan untuk memantau indikator ketenagakerjaan secara dini di Indonesia yang mengacu pada the Key Indicators of the Labour Market (KILM) yang direkomendasikan oleh ILO (The International Labour Organization).
5. Sex ratio is the ratio of males population to females population in a given area and time, usually expressed as the number of males for every 100 females.
6. Household is an individual or group of people living in a physical/census building unit or part of it and usually commit on a common provision for food and other essentials of living. Common provision for food means one organising daily needs for all of household members.
7. Household member are those who usually lives in a household regardless of their location at the time of enumeration.
8. Average household size is the average number of household members per household.
9. The main source of employment data is National Labour Force Survey (Sakernas). This survey is specifically designed to collect information on labour force statistics. Previously, the collection of such data was integrated with other surveys, such as National Socio-Economic Survey (Susenas), Population Census (SP), and Inter-censal Population Survey (SUPAS). The first Sakernas was conducted in 1976, then conducted anually during the period 1977–1978. During 1986–1993, Sakernas was conducted quarterly in all provinces in Indonesia, only since 1994 until 2001 Sakernas was conducted yearly, every August of the year. During the period 2002–2004, besides a yearly Sakernas, BPS also conducted a quarterly Sakernas. During the period 2005–2010, Sakernas has been conducted in semester period, i.e. February (Semester I) and August (Semester II). In 2011 is conducted back on a quarterly basis which is: February (First Quarter), May (Second Quarter), August (Third Quarter), and November (Fourth Quarter). A Quarterly Sakernas is aimed to monitor the prompt indicators of Indonesian labour market which referred to the Key Indicators of the Labour Market (KILM) recommended by ILO (The International Labour Organization).
http
://www.b
ps.g
o.id

P O P U L A T I O N A N D E M P L O Y M E N T
S t a t i s t i c a l Y e a r b o o k o f I n d o n e s i a 2 0 1 3 75
Sejak Sakernas 2001, konsep status pekerjaan dan pengangguran mengalami perluasan dan penyempurnaan. Status pekerjaan yang pada Sakernas 2000 hanya 5 kategori, mulai tahun 2001 ditambahkan kategori baru, yaitu: pekerja bebas di pertanian dan pekerja bebas di nonpertanian. Selain itu, dalam rangka menyesuaikan dengan konsep ILO, konsep pengangguran terbuka diperluas yaitu disamping mencakup penduduk yang aktif mencari pekerjaan, mencakup pula kelompok penduduk yang sedang mempersiapkan usaha/pekerjaan baru, dan kelompok penduduk yang tidak mencari pekerjaan, karena merasa tidak mungkin mendapatkan pekerjaan serta kelompok penduduk yang tidak aktif mencari pekerjaan dengan alasan sudah mempunyai pekerjaan tetapi belum mulai bekerja.
Hasil Sakernas Triwulan I (Februari 2012), II (Mei 2012), dan IV (November 2012) disajikan sampai tingkat provinsi (jumlah sampel 50.000 rumah tangga). Sementara Sakernas Triwulan III (Agustus 2012) disajikan sampai tingkat kabupaten/kota karena jumlah sampel cukup besar sekitar 200.000 rumah tangga, dimana jumlah tersebut terdiri dari 50.000 rumah tangga merupakan sampel Sakernas Triwulanan dan 150.000 rumah tangga sampel Sakernas tambahan. Tingkat pemasukan dokumen pada Sakernas Agustus 2012 sebesar 97,57 persen Faktor pengali yang digunakan berdasarkan jumlah penduduk menurut kabupaten/kota hasil akhir SP2010 yang diperkirakan ke Agustus 2012.
10. Penduduk usia kerja adalah penduduk yang berumur 15 tahun ke atas.
11. Angkatan kerja adalah penduduk usia kerja (15 tahun ke atas) yang bekerja, atau punya pekerjaan namun sementara tidak bekerja dan pengangguran.
12. Bekerja adalah melakukan pekerjaan dengan maksud memperoleh atau membantu memperoleh pendapatan atau keuntungan dan lamanya bekerja paling sedikit 1 jam secara terus menerus dalam seminggu yang lalu (termasuk pekerja keluarga tanpa upah yang membantu dalam suatu usaha/kegiatan ekonomi).
Since 2001 Sakernas, the concept of employment status and unemployment was revised. The employment status, previously covered only 5 categories, but since 2001 two new categories of casual employee both in agriculture and non-agriculture sectors have been added. In addition, to adapt the ILO concept, the concept of open unemployment was also extended. Open unemployment covers population who were looking for work, population who were establishing a new business/firm/establishment, discouraged job seekers, and those who were not actively looking for work with the reason of already having job but not starting to work.
The results of Sakernas for first quarter (February 2012), second quarter (May 2012), and fourth quarter (November 2012) was presented at the province level (sampel size 50,000 households). The results of Sakernas for the third quarter (August 2012) was published up to regency/municipality level, as the sample size was quite big around 200,000 households, that consist of 50,000 households from quarterly sample and 150,000 households were addition sample package. A response rate for August 2012 Sakernas was 97.57 percent. The inflation factor has been used based on final result of SP2010 for population by regency/municipality that was approximated to August 2012.
10. Working age population is persons of 15 years and over.
11. Labor force or economically active are persons of 15 years and over, who in the previous week were working, temporarily absent from work but having jobs, and unemployment.
12. The concept of working means activity intended to earn income by doing work or helping to do work at least one hour continuously during the reference week (including unpaid family worker/s for any economic activity).
http
://www.b
ps.g
o.id
P E N D U D U K D A N K E T E N A G A K E R J A A N
S t a t i s t i k I n d o n e s i a 2 0 1 376
13. Jumlah jam kerja seluruhnya adalah jumlah jam kerja yang digunakan untuk bekerja (tidak termasuk jam kerja istirahat resmi dan jam kerja yang digunakan untuk hal-hal di luar pekerjaan).
14. Lapangan usaha adalah bidang kegiatan dari pekerjaan/tempat bekerja di mana seseorang bekerja. Klasifikasi lapangan usaha mengikuti Klasifikasi Baku Lapangan Usaha Indonesia (KBLI) dalam 1 digit.
15. Status pekerjaan adalah kedudukan seseorang dalam unit usaha/kegiatan dalam melakukan pekerjaan.
16. Pekerja tak dibayar adalah seseorang yang bekerja membantu usaha untuk memperoleh penghasilan/keuntungan yang dilakukan oleh salah seorang anggota rumah tangga atau bukan anggota rumah tangga tanpa mendapat upah/gaji.
17. Data Tenaga Kerja Indonesia (TKI) dikumpulkan oleh Unit Pelaksana Teknis (UPT) Badan Nasional Penempatan dan Perlindungan Tenaga Kerja Indonesia (BNP2TKI). UPT yang dimaksud di atas yaitu Balai Pelayanan Penempatan dan Perlindungan Tenaga Kerja Indonesia (BP3TKI). Setiap bulan UPT melaporkan data TKI ke Pusat Penelitian dan Informasi.
18. Survei Upah Buruh (SUB) diselenggarakan BPS sejak tahun 1979/1980, empat kali dalam setahun (triwulanan) dengan pendekatan perusahaan. Dalam pelaksanaannya, survei ini mengalami berbagai perubahan baik dari segi metodologi maupun cakupan. Pada mulanya sampel perusahaan relatif besar dan pertanyaan yang diajukan relatif rinci. Mulai tahun 1992 jumlah sampel dikurangi dan kuesioner disederhanakan.
Kemudian mulai tahun 2008, pemilihan sampel perusahaan untuk semua sektor dilakukan dengan teknik Probability Proporsional to Size with Control Selection. Pada Tahun 2012, total sampel perusahaan industri adalah 2.175 perusahaan, mencakup perusahaan besar (total pekerja 100 orang atau lebih) dan perusahaan sedang (total pekerja 20–99 orang), sampel hotel menjadi 868 hotel, dan sampel perusahaan pertambangan menjadi 50 perusahaan.
13. Total working hours is the total hours spent by an employee to perform all jobs (excluding the time used for other activities which are not classified as work).
14. Industry is field of a person’s activity or establishment. The classification of industries follows the Indonesia Standard Industrial Classification (KBLI) in one digit.
15. Employment status is the status of a person at his place of work or establishment where he was employed.
16. Unpaid worker is a person who intended to work without pay in an establishment run by other members of the family, relative or neighbour.
17. Indonesian Overseas Workers (TKI) data were collected by a technical unit in the National Authority for the Placement and Protection of Indonesian Overseas Workers (BNP2TKI). Every month this technical unit are reported the data to the Centre for Research and Information.
18. BPS-Statistics Indonesia has conducted the quarterly wage survey since 1979/1980 using the establishment approach. Design and coverage have changed over time in response to the changing of user needs. Initially, the total sample size was relatively big and items asked in the questionnaire were quite detailed, but since 1992, the sample size was reduced and the questionnaire was simplified.
Starting in 2008, the sample selection of establishment in all sectors was based on a Probability Proportional to Size with Control Selection sampling technique. In 2012, the number of establishments selected in the manufacturing sector was 2,175 establishments, covering large establishments (with 100 or more workers) and medium establishments (with 20–99 workers), while the total sample of hotels and non-oil and gas mining sectors were 868 and 50 respectively.
http
://www.b
ps.g
o.id
P O P U L A T I O N A N D E M P L O Y M E N T
S t a t i s t i c a l Y e a r b o o k o f I n d o n e s i a 2 0 1 3 77
Tujuan utama SUB adalah mengumpulkan data upah secara berkala bagi buruh produksi/pelaksana yang berstatus di bawah mandor/supervisor.
19. Upah buruh adalah pendapatan yang diterima buruh dalam bentuk uang, yang mencakup bukan hanya komponen upah/gaji pokok, tetapi juga lembur dan tunjangan-tunjangan yang diterima secara rutin/reguler (tunjangan transport, uang makan, dan tunjangan lainnya sejauh diterima dalam bentuk uang), tidak termasuk Tunjangan Hari Raya (THR), tunjangan bersifat tahunan, kuartalan, tunjangan-tunjangan lain yang bersifat tidak rutin, dan tunjangan dalam bentuk natura.
The main objective of the survey is to regularly collect wage statistics for production/operational workers below supervisory level.
19. Wage/salary is the income earned by labour in monetary term, covering not only all kinds of renumeration received regularly, but also additional cash and other incentives (such as for transportation, lunch, and other incentives in cash), excluding regular bonuses, such as incentives for major religious festival days “Lebaran”, and other incentives at the end of the year, quarterly incentives, other irregular incentives, and other incentives in the form of goods.
http
://www.b
ps.g
o.id

P E N D U D U K D A N K E T E N A G A K E R J A A N
S t a t i s t i k I n d o n e s i a 2 0 1 378
3.1 PENDUDUK POPULATION
[Diolah dari Hasil Sensus Penduduk (SP) 2000 dan 2010, BPS/Based on 2000 and 2010 Population Census, BPS-Statistics Indonesia]
ProvinsiProvince
Penduduk Population
Laju Pertumbuhan Penduduk per TahunAnnual Population Growth Rate (%)
2000 2010 1990–2000 1 2000–2010
(1) (2) (3) (4) (5)
Aceh 3 929 234 4 494 410 1,46 2,36 2
Sumatera Utara 11 642 488 12 982 204 1,32 1,10Sumatera Barat 4 248 515 4 846 909 0,62 1,34Riau 3 907 763 5 538 367 4,27 3,58Kepulauan Riau 1 040 207 1 679 163 – 4,95Jambi 2 407 166 3 092 265 1,83 2,56Sumatera Selatan 6 210 800 7 450 394 1,24 1,85Kepulauan Bangka Belitung 899 968 1 223 296 – 3,14Bengkulu 1 455 500 1 715 518 2,20 1,67Lampung 6 730 751 7 608 405 1,17 1,24
DKI Jakarta 8 361 079 9 607 787 0,13 1,41Jawa Barat 35 724 093 43 053 732 2,24 1,90Banten 8 098 277 10 632 166 – 2,78Jawa Tengah 31 223 258 32 382 657 0,94 0,37DI Yogyakarta 3 121 045 3 457 491 0,72 1,04Jawa Timur 34 765 993 37 476 757 0,70 0,76
Bali 3 150 057 3 890 757 1,31 2,15Nusa Tenggara Barat 4 008 601 4 500 212 1,81 1,17Nusa Tenggara Timur 3 823 154 4 683 827 1,63 2,07
Kalimantan Barat 4 016 353 4 395 983 2,28 0,91Kalimantan Tengah 1 855 473 2 212 089 2,98 1,79Kalimantan Selatan 2 984 026 3 626 616 1,45 1,99Kalimantan Timur 2 451 895 3 553 143 2,80 3,81
Sulawesi Utara 2 000 872 2 270 596 1,40 1,28Gorontalo 833 496 1 040 164 – 2,26Sulawesi Tengah 2 175 993 2 635 009 2,52 1,95Sulawesi Selatan 7 159 170 8 034 776 1,48 1,17Sulawesi Barat 891 618 1 158 651 – 2,68Sulawesi Tenggara 1 820 379 2 232 586 3,14 2,08
Maluku 1 166 300 1 533 506 0,67 2,80Maluku Utara 815 101 1 038 087 – 2,47Papua 1 684 144 2 833 381 3,10 5,39Papua Barat 529 689 760 422 – 3,71
Indonesia 205 132 458 237 641 326 1,40 1,49
Tabel –––––– 3.1.1Table
Penduduk dan Laju Pertumbuhan Penduduk Menurut Provinsi, 2000 dan 2010Population and Population Growth Rate by Province, 2000 and 2010
Catatan/Note: 1 Laju pertumbuhan penduduk provinsi hasil pemekaran digabungkan dengan provinsi induknya Population growth rate of splitting provinces was included in their main provinces Laju pertumbuhan penduduk 1990–2000 sebesar 1,40 persen mencakup Provinsi Timor Timur pada tahun 1990 Population growth rate of 1990–2000 at 1,40 percent included Timor Timur in 1990 Laju pertumbuhan penduduk 1990–2000 tanpa Provinsi Timor Timur dihitung dengan periode 115 bulan diperoleh sebesar 1,45 persen per
tahun Population growth rate of 1990–2000 excluding Timor Timur was calculated by 115 months period which was 1,45 percent per year
2 Rata-rata Laju Pertumbuhan Penduduk per tahun 2000–2010 untuk Aceh dihitung dengan menggunakan data Sensus Penduduk Aceh Nias (SPAN) 2005 dan SP 2010
Annual growth rate of population 2000–2010 to Aceh was calculated using data Aceh Nias Population Censusu (SPAN) 2005 and 2010 Population Census
http
://www.b
ps.g
o.id
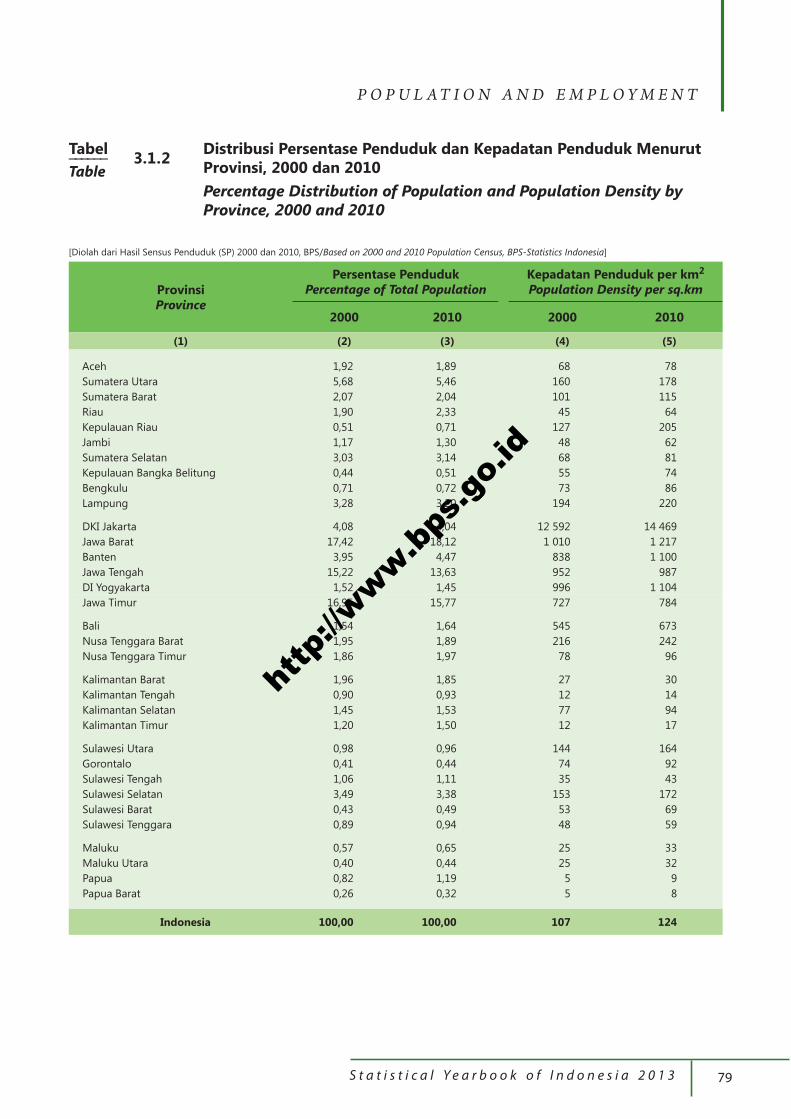
P O P U L A T I O N A N D E M P L O Y M E N T
S t a t i s t i c a l Y e a r b o o k o f I n d o n e s i a 2 0 1 3 79
Distribusi Persentase Penduduk dan Kepadatan Penduduk Menurut Provinsi, 2000 dan 2010Percentage Distribution of Population and Population Density by Province, 2000 and 2010
Tabel –––––– 3.1.2Table
[Diolah dari Hasil Sensus Penduduk (SP) 2000 dan 2010, BPS/Based on 2000 and 2010 Population Census, BPS-Statistics Indonesia]
ProvinsiProvince
Persentase Penduduk Percentage of Total Population
Kepadatan Penduduk per km2
Population Density per sq.km
2000 2010 2000 2010
(1) (2) (3) (4) (5)
Aceh 1,92 1,89 68 78Sumatera Utara 5,68 5,46 160 178Sumatera Barat 2,07 2,04 101 115Riau 1,90 2,33 45 64Kepulauan Riau 0,51 0,71 127 205Jambi 1,17 1,30 48 62Sumatera Selatan 3,03 3,14 68 81Kepulauan Bangka Belitung 0,44 0,51 55 74Bengkulu 0,71 0,72 73 86Lampung 3,28 3,20 194 220
DKI Jakarta 4,08 4,04 12 592 14 469Jawa Barat 17,42 18,12 1 010 1 217Banten 3,95 4,47 838 1 100Jawa Tengah 15,22 13,63 952 987DI Yogyakarta 1,52 1,45 996 1 104Jawa Timur 16,95 15,77 727 784
Bali 1,54 1,64 545 673Nusa Tenggara Barat 1,95 1,89 216 242Nusa Tenggara Timur 1,86 1,97 78 96
Kalimantan Barat 1,96 1,85 27 30Kalimantan Tengah 0,90 0,93 12 14Kalimantan Selatan 1,45 1,53 77 94Kalimantan Timur 1,20 1,50 12 17
Sulawesi Utara 0,98 0,96 144 164Gorontalo 0,41 0,44 74 92Sulawesi Tengah 1,06 1,11 35 43Sulawesi Selatan 3,49 3,38 153 172Sulawesi Barat 0,43 0,49 53 69Sulawesi Tenggara 0,89 0,94 48 59
Maluku 0,57 0,65 25 33Maluku Utara 0,40 0,44 25 32Papua 0,82 1,19 5 9Papua Barat 0,26 0,32 5 8
Indonesia 100,00 100,00 107 124
http
://www.b
ps.g
o.id

P E N D U D U K D A N K E T E N A G A K E R J A A N
S t a t i s t i k I n d o n e s i a 2 0 1 380
Tabel –––––– 3.1.3Table
Rasio Jenis Kelamin Penduduk Menurut Provinsi, 2000 dan 2010Population Sex Ratio by Province, 2000 and 2010
[Diolah dari Hasil Sensus Penduduk (SP) 2000 dan 2010, BPS/Based on 2000 and 2010 Population Census, BPS-Statistics Indonesia]
ProvinsiProvince 2000 2010
(1) (2) (3)
Aceh 101,0 100,2Sumatera Utara 99,8 99,8Sumatera Barat 96,1 98,4Riau 104,2 106,3Kepulauan Riau 104,2 105,5Jambi 104,0 104,6Sumatera Selatan 101,0 103,7Kepulauan Bangka Belitung 105,0 108,0Bengkulu 103,3 104,6Lampung 106,1 106,1
DKI Jakarta 102,3 102,8Jawa Barat 102,1 103,6Banten 101,5 104,7Jawa Tengah 99,5 98,8DI Yogyakarta 98,2 97,7Jawa Timur 97,8 97,5
Bali 101,0 101,7Nusa Tenggara Barat 94,9 94,3Nusa Tenggara Timur 98,8 98,7
Kalimantan Barat 104,6 104,6Kalimantan Tengah 107,0 109,0Kalimantan Selatan 100,5 102,6Kalimantan Timur 109,8 111,3
Sulawesi Utara 105,2 104,4Gorontalo 100,2 100,7Sulawesi Tengah 104,6 105,2Sulawesi Selatan 95,1 95,5Sulawesi Barat 95,1 100,8Sulawesi Tenggara 100,7 101,0
Maluku 102,5 102,3Maluku Utara 104,5 104,9Papua 112,0 113,4Papua Barat 112,6 112,4
Indonesia 100,6 101,4
http
://www.b
ps.g
o.id

P O P U L A T I O N A N D E M P L O Y M E N T
S t a t i s t i c a l Y e a r b o o k o f I n d o n e s i a 2 0 1 3 81
Tabel –––––– 3.1.4Table
Rumah Tangga dan Rata-Rata Banyaknya Anggota Rumah Tangga Menurut Provinsi, 2000 dan 2010Number of Households and Average Household Size by Province, 2000 and 2010
[Diolah dari Hasil Sensus Penduduk (SP) 2000 dan 2010, BPS/Based on 2000 and 2010 Population Census, BPS-Statistics Indonesia]
ProvinsiProvince
Rumah Tangga Household
(ribu/thousand)
Rata-Rata Banyaknya Anggota Rumah Tangga Average Household Size
2000 2010 2000 2010
(1) (2) (3) (4) (5)
Aceh 921,9 1 066,5 4,3 4,2Sumatera Utara 2 609,8 3 037,7 4,5 4,3Sumatera Barat 1 020,4 1 152,5 4,2 4,2Riau 932,5 1 328,6 4,2 4,2Kepulauan Riau 270,0 441,8 3,8 3,8Jambi 594,3 770,8 4,1 4,0Sumatera Selatan 1 495,3 1 813,6 4,2 4,1Kepulauan Bangka Belitung 214,2 311,2 4,2 3,9Bengkulu 358,5 432,9 4,1 4,0Lampung 1 633,4 1 934,6 4,1 3,9
DKI Jakarta 2 232,1 2 510,0 3,7 3,8Jawa Barat 9 560,7 11 493,7 3,7 3,7Banten 2 001,8 2 596,6 4,0 4,1Jawa Tengah 7 900,3 8 704,5 4,0 3,7DI Yogyakarta 923,4 1 038,0 3,4 3,3Jawa Timur 9 499,8 10 381,1 3,7 3,6
Bali 799,8 1 028,3 3,9 3,8Nusa Tenggara Barat 1 032,4 1 252,6 3,9 3,6Nusa Tenggara Timur 793,7 1 014,0 4,8 4,6
Kalimantan Barat 901,3 1 023,1 4,5 4,3Kalimantan Tengah 482,1 572,8 3,8 3,9Kalimantan Selatan 785,2 975,3 3,8 3,7Kalimantan Timur 613,1 871,1 4,0 4,1
Sulawesi Utara 544,7 581,9 3,7 3,9Gorontalo 214,3 244,0 3,9 4,3Sulawesi Tengah 503,5 620,6 4,3 4,2Sulawesi Selatan 1 617,1 1 848,0 4,4 4,3Sulawesi Barat 199,3 258,6 4,5 4,5Sulawesi Tenggara 409,3 502,1 4,4 4,4
Maluku 242,7 316,7 4,8 4,8Maluku Utara 149,1 214,4 5,5 4,8Papua 415,4 658,8 4,5 4,3Papua Barat 137,0 168,1 4,3 4,5
Indonesia 52 008,3 61 164,5 3,9 3,9
http
://www.b
ps.g
o.id

P E N D U D U K D A N K E T E N A G A K E R J A A N
S t a t i s t i k I n d o n e s i a 2 0 1 382
Tabel –––––– 3.1.5Table
[Diolah dari Hasil Sensus Penduduk, BPS/Based on Population Census BPS-Statistics Indonesia]
ProvinsiProvince 1980 1990 2000 2010
(1) (2) (3) (4) (5)
Aceh 146 307 194 709 100 166 213 553Sumatera Utara 570 863 459 652 447 897 521 847Sumatera Barat 134 712 217 796 245 000 344 254Riau 356 272 689 036 1 175 960 1 911 760Kepulauan Riau 1 – – 432 725 801 073Jambi 298 366 473 434 566 153 738 961Sumatera Selatan 617 745 936 817 987 157 1 017 990Kepulauan Bangka Belitung 2 – – 94 334 206 705Bengkulu 122 785 251 621 355 048 347 651Lampung 1 793 053 1 730 903 1 485 218 1 463 929
DKI Jakarta 2 599 367 3 170 215 3 541 972 4 077 515Jawa Barat 1 003 758 2 408 626 3 271 882 5 225 271Banten 3 – – 1 758 408 2 766 750Jawa Tengah 350 724 516 315 708 308 902 711DI Yogyakarta 180 367 266 500 385 117 562 384Jawa Timur 465 949 575 541 781 590 925 510
Bali 65 271 124 919 221 722 406 921Nusa Tenggara Barat 56 081 69 466 107 605 115 832Nusa Tenggara Timur 42 614 r 48 159 106 053 185 083
Kalimantan Barat 112 244 199 829 269 722 293 229Kalimantan Tengah 142 257 241 192 423 014 526 737Kalimantan Selatan 145 417 274 745 360 324 487 245Kalimantan Timur 296 963 604 549 856 251 1 308 485
Sulawesi Utara 91 460 89 096 147 091 206 139Gorontalo 4 – – 26 888 64 585Sulawesi Tengah 187 024 287 447 369 634 452 792Sulawesi Selatan 118 984 225 279 266 055 364 288Sulawesi Barat 5 – – 104 458 172 113Sulawesi Tenggara 106 027 237 602 366 817 447 484
Maluku 130 109 186 735 75 540 123 165Maluku Utara 6 – – 60 834 107 681Papua 96 079 262 873 226 773 435 773Papua Barat 7 – – 130 767 250 196
Catatan/Note: Istilah migrasi seumur hidup disebut bila tempat tinggal seseorang pada saat pencacahan berbeda dengan tempat lahirnya Lifetime migration terminology if someone’s residence at the time of enumeration was different from his/her place of birth 1 Kepulauan Riau merupakan pemekaran dari Riau/Kepulauan Riau was split from Riau 2 Kepulauan Bangka Belitung merupakan pemekaran dari Sumatera Selatan/Kepulauan Bangka Belitung was split from Sumatera Selatan 3 Banten merupakan pemekaran dari Jawa Barat/Banten was split from Jawa Barat 4 Gorontalo merupakan pemekaran dari Sulawesi Utara/Gorontalo was split from Sulawesi Utara 5 Sulawesi Barat merupakan pemekaran dari Sulawesi Selatan/Sulawesi Barat was split from Sulawesi Selatan 6 Maluku Utara merupakan pemekaran dari Maluku/Maluku Utara was split from Maluku 7 Papua Barat merupakan pemekaran dari Papua/Papua Barat was split from Papua
Migrasi Masuk Seumur Hidup Menurut Provinsi, 1980–2010Lifetime In Migration by Province, 1980–2010
http
://www.b
ps.g
o.id

P O P U L A T I O N A N D E M P L O Y M E N T
S t a t i s t i c a l Y e a r b o o k o f I n d o n e s i a 2 0 1 3 83
Migrasi Keluar Seumur Hidup Menurut Provinsi, 1980–2010Lifetime Out Migration by Province, 1980–2010
Tabel –––––– 3.1.6Table
[Diolah dari Hasil Sensus Penduduk, BPS/Based on Population Census BPS-Statistics Indonesia]
ProvinsiProvince 1980 1990 2000 2010
(1) (2) (3) (4) (5)
Aceh 116 010 125 563 244 314 264 194Sumatera Utara 417 659 770 093 1 336 772 2 298 140Sumatera Barat 558 804 642 908 937 799 1 151 433Riau 86 540 127 672 180 778 314 303Kepulauan Riau 1 – – 57 416 84 751Jambi 47 151 77 299 149 376 181 189Sumatera Selatan 333 024 443 384 525 954 779 239Kepulauan Bangka Belitung 2 – – 120 027 114 379Bengkulu 39 019 46 720 73 390 110 893Lampung 57 664 167 565 385 748 713 809
DKI Jakarta 400 767 1 052 234 1 836 664 3 000 081Jawa Barat 1 487 935 1 751 879 2 046 279 2 514 344Banten 3 – – 475 440 552 987Jawa Tengah 3 227 892 4 524 988 5 354 459 6 829 637DI Yogyakarta 253 447 508 215 784 154 901 539Jawa Timur 1 597 851 2 479 487 3 063 297 3 864 218
Bali 117 828 221 599 250 724 269 245Nusa Tenggara Barat 44 487 96 774 145 546 197 243Nusa Tenggara Timur 47 534 99 442 156 602 268 998
Kalimantan Barat 72 358 116 735 154 620 226 982Kalimantan Tengah 25 086 47 700 53 291 92 935Kalimantan Selatan 169 561 201 936 255 595 312 390Kalimantan Timur 34 059 63 533 90 635 148 585
Sulawesi Utara 121 231 153 466 151 326 217 774Gorontalo 4 – – 113 050 117 058Sulawesi Tengah 33 912 48 360 74 463 122 195Sulawesi Selatan 511 725 641 961 897 616 1 409 614Sulawesi Barat 5 – – 73 360 89 607Sulawesi Tenggara 89 957 107 673 95 189 177 075
Maluku 64 725 95 361 157 066 211 980Maluku Utara 6 – – 43 712 62 813Papua 15 559 30 786 43 586 87 545Papua Barat 7 – – 28 763 48 955
Catatan/Note: Istilah migrasi seumur hidup disebut bila tempat tinggal seseorang pada saat pencacahan berbeda dengan tempat lahirnya Lifetime migration terminology if someone’s residence at the time of enumeration was different from his/her place of birth 1 Kepulauan Riau merupakan pemekaran dari Riau/Kepulauan Riau was split from Riau 2 Kepulauan Bangka Belitung merupakan pemekaran dari Sumatera Selatan/Kepulauan Bangka Belitung was split from Sumatera Selatan 3 Banten merupakan pemekaran dari Jawa Barat/Banten was split from Jawa Barat 4 Gorontalo merupakan pemekaran dari Sulawesi Utara/Gorontalo was split from Sulawesi Utara 5 Sulawesi Barat merupakan pemekaran dari Sulawesi Selatan/Sulawesi Barat was split from Sulawesi Selatan 6 Maluku Utara merupakan pemekaran dari Maluku/Maluku Utara was split from Maluku 7 Papua Barat merupakan pemekaran dari Papua/Papua Barat was split from Papua
http
://www.b
ps.g
o.id

P E N D U D U K D A N K E T E N A G A K E R J A A N
S t a t i s t i k I n d o n e s i a 2 0 1 384
Migrasi Masuk Risen Menurut Provinsi, 1980–2010Recent In Migration by Province, 1980–2010
Tabel –––––– 3.1.7Table
[Diolah dari Hasil Sensus Penduduk, BPS/Based on Population Census BPS-Statistics Indonesia]
ProvinsiProvince 1980 1990 2000 2010
(1) (2) (3) (4) (5)
Aceh 51 208 56 326 15 369 63 987Sumatera Utara 95 586 107 882 139 887 123 962Sumatera Barat 93 117 129 049 109 016 130 180Riau 98 652 245 465 358 815 294 957Kepulauan Riau 1 – – 206 664 210 056Jambi 107 273 136 397 109 534 110 114Sumatera Selatan 221 165 212 196 163 250 117 396Kepulauan Bangka Belitung 2 – – 36 536 60 808Bengkulu 66 902 82 831 68 832 47 827Lampung 507 803 212 298 149 013 92 439
DKI Jakarta 766 363 833 029 702 202 643 959Jawa Barat 551 960 1 350 596 1 097 021 1 048 964Banten 3 – – 620 299 465 080Jawa Tengah 183 761 384 753 354 204 301 417DI Yogyakarta 98 856 161 740 196 586 227 364Jawa Timur 203 175 328 607 185 966 243 061
Bali 37 254 65 967 87 225 102 425Nusa Tenggara Barat 26 221 37 401 59 964 47 648Nusa Tenggara Timur 25 976 27 107 69 910 49 339
Kalimantan Barat 39 380 43 809 49 202 42 650Kalimantan Tengah 49 699 78 791 124 387 122 969Kalimantan Selatan 61 704 98 330 89 320 103 455Kalimantan Timur 112 620 194 531 155 498 213 558
Sulawesi Utara 45 498 34 736 54 504 48 042Gorontalo 4 – – 9 257 26 695Sulawesi Tengah 83 595 70 034 75 328 61 961Sulawesi Selatan 65 208 119 455 80 648 120 638Sulawesi Barat 5 – – 33 739 37 206Sulawesi Tenggara 51 014 71 143 110 289 64 097
Maluku 46 904 68 701 18 657 29 236Maluku Utara 6 – – 14 764 24 462Papua 33 420 73 776 49 736 66 562Papua Barat 7 – – 25 890 53 905
Catatan/Note: Istilah migrasi seumur hidup disebut bila tempat tinggal seseorang pada saat pencacahan berbeda dengan tempat lahirnya Lifetime migration terminology if someone’s residence at the time of enumeration was different from his/her place of birth 1 Kepulauan Riau merupakan pemekaran dari Riau/Kepulauan Riau was split from Riau 2 Kepulauan Bangka Belitung merupakan pemekaran dari Sumatera Selatan/Kepulauan Bangka Belitung was split from Sumatera Selatan 3 Banten merupakan pemekaran dari Jawa Barat/Banten was split from Jawa Barat 4 Gorontalo merupakan pemekaran dari Sulawesi Utara/Gorontalo was split from Sulawesi Utara 5 Sulawesi Barat merupakan pemekaran dari Sulawesi Selatan/Sulawesi Barat was split from Sulawesi Selatan 6 Maluku Utara merupakan pemekaran dari Maluku/Maluku Utara was split from Maluku 7 Papua Barat merupakan pemekaran dari Papua/Papua Barat was split from Papua
http
://www.b
ps.g
o.id
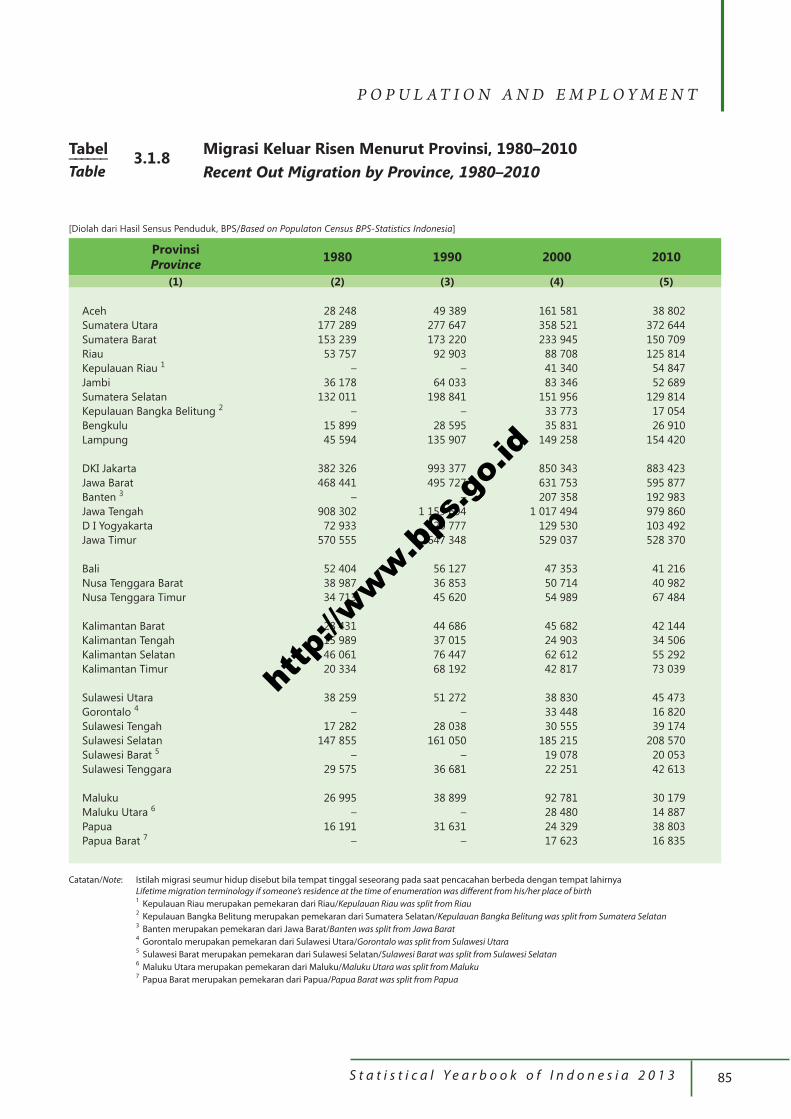
P O P U L A T I O N A N D E M P L O Y M E N T
S t a t i s t i c a l Y e a r b o o k o f I n d o n e s i a 2 0 1 3 85
Migrasi Keluar Risen Menurut Provinsi, 1980–2010Recent Out Migration by Province, 1980–2010
Tabel –––––– 3.1.8Table
[Diolah dari Hasil Sensus Penduduk, BPS/Based on Populaton Census BPS-Statistics Indonesia]
ProvinsiProvince 1980 1990 2000 2010
(1) (2) (3) (4) (5)
Aceh 28 248 49 389 161 581 38 802Sumatera Utara 177 289 277 647 358 521 372 644Sumatera Barat 153 239 173 220 233 945 150 709Riau 53 757 92 903 88 708 125 814Kepulauan Riau 1 – – 41 340 54 847Jambi 36 178 64 033 83 346 52 689Sumatera Selatan 132 011 198 841 151 956 129 814Kepulauan Bangka Belitung 2 – – 33 773 17 054Bengkulu 15 899 28 595 35 831 26 910Lampung 45 594 135 907 149 258 154 420
DKI Jakarta 382 326 993 377 850 343 883 423Jawa Barat 468 441 495 727 631 753 595 877Banten 3 – – 207 358 192 983Jawa Tengah 908 302 1 159 694 1 017 494 979 860D I Yogyakarta 72 933 120 777 129 530 103 492Jawa Timur 570 555 647 348 529 037 528 370
Bali 52 404 56 127 47 353 41 216Nusa Tenggara Barat 38 987 36 853 50 714 40 982Nusa Tenggara Timur 34 713 45 620 54 989 67 484
Kalimantan Barat 28 431 44 686 45 682 42 144Kalimantan Tengah 15 989 37 015 24 903 34 506Kalimantan Selatan 46 061 76 447 62 612 55 292Kalimantan Timur 20 334 68 192 42 817 73 039
Sulawesi Utara 38 259 51 272 38 830 45 473Gorontalo 4 – – 33 448 16 820Sulawesi Tengah 17 282 28 038 30 555 39 174Sulawesi Selatan 147 855 161 050 185 215 208 570Sulawesi Barat 5 – – 19 078 20 053Sulawesi Tenggara 29 575 36 681 22 251 42 613
Maluku 26 995 38 899 92 781 30 179Maluku Utara 6 – – 28 480 14 887Papua 16 191 31 631 24 329 38 803Papua Barat 7 – – 17 623 16 835
Catatan/Note: Istilah migrasi seumur hidup disebut bila tempat tinggal seseorang pada saat pencacahan berbeda dengan tempat lahirnya Lifetime migration terminology if someone’s residence at the time of enumeration was different from his/her place of birth 1 Kepulauan Riau merupakan pemekaran dari Riau/Kepulauan Riau was split from Riau 2 Kepulauan Bangka Belitung merupakan pemekaran dari Sumatera Selatan/Kepulauan Bangka Belitung was split from Sumatera Selatan 3 Banten merupakan pemekaran dari Jawa Barat/Banten was split from Jawa Barat 4 Gorontalo merupakan pemekaran dari Sulawesi Utara/Gorontalo was split from Sulawesi Utara 5 Sulawesi Barat merupakan pemekaran dari Sulawesi Selatan/Sulawesi Barat was split from Sulawesi Selatan 6 Maluku Utara merupakan pemekaran dari Maluku/Maluku Utara was split from Maluku 7 Papua Barat merupakan pemekaran dari Papua/Papua Barat was split from Papua
http
://www.b
ps.g
o.id

P E N D U D U K D A N K E T E N A G A K E R J A A N
S t a t i s t i k I n d o n e s i a 2 0 1 386
Penduduk Berumur 15 Tahun Ke Atas Menurut Golongan Umur dan Jenis Kegiatan Selama Seminggu yang Lalu, 2012Population 15 Years of Age and Over by Age Group and Type of Activity During the Previous Week, 2012
Tabel –––––– 3.2.1Table
3.2 KETENAGAKERJAAN EMPLOYMENT
[Diolah dari Hasil Survei Angkatan Kerja Nasional (Sakernas) Agustus, BPS/Based on August National Labor Force Survey, BPS-Statistics Indonesia]
Golongan Umur
Age Group
Angkatan Kerja/Economically Active Persentase Bekerja
TerhadapAngkatan Kerja
Percentage ofWorking to
EconomicallyActive
BekerjaWorking
Pengangguran Terbuka 1 Unemployment 1 Jumlah
Angkatan Kerja
Total of Economically
Active
Pernah Bekerja
Ever Worked
Tidak Pernah BekerjaNever
Worked
Jumlah Total
(1) (2) (3) (4) (5) (6) (7)
15–19 6 005 740 364 597 1 773 273 2 137 870 8 143 610 73,75
20–24 10 677 632 662 436 1 257 585 1 920 021 12 597 653 84,76
25–29 14 164 310 579 577 529 090 1 108 667 15 272 977 92,74
30–34 16 470 562 445 291 273 001 718 292 17 188 854 95,82
35–39 14 062 028 234 918 144 934 379 852 14 441 880 97,37
40–44 14 113 185 230 226 105 548 335 774 14 448 959 97,68
45–49 11 078 642 170 575 78 038 248 613 11 327 255 97,81
50–54 9 674 950 173 523 77 357 250 880 9 925 830 97,47
55–59 6 003 524 72 154 22 315 94 469 6 097 993 98,45
60 + 8 557 581 44 791 5 727 50 518 8 608 099 99,41
Jumlah/Total 110 808 154 2 978 088 4 266 868 7 244 956 118 053 110 93,86
Catatan/Note: 1 1. Mencari pekerjaan/Looking for work 2. Mempersiapkan usaha/Establishing a new business/firm 3. Merasa tidak mungkin mendapat pekerjaan/Feeling hopeless in looking for work (discouraged job seekers) 4. Sudah punya pekerjaan tetapi belum mulai bekerja/Having job already but not starting to work yet
http
://www.b
ps.g
o.id

P O P U L A T I O N A N D E M P L O Y M E N T
S t a t i s t i c a l Y e a r b o o k o f I n d o n e s i a 2 0 1 3 87
Golongan Umur
Age Group
Bukan Angkatan Kerja/Economically Inactive
Jumlah Total
Persentase Angkatan
Kerja TerhadapPenduduk
Usia KerjaPercentage ofEconomically
Active toWorking AgePopulation
SekolahAttending
School
Mengurus Rumah TanggaHousekeeping
LainnyaOthers
Jumlah Bukan
Angkatan Kerja
Total of Economically
Inactive
(1) (8) (9) (10) (11) (12) (13)
15–19 12 028 175 1 913 582 1 489 603 15 431 360 23 574 970 34,54
20–24 1 874 135 3 382 230 580 559 5 836 924 18 434 577 68,34
25–29 163 270 4 365 628 307 777 4 836 675 20 109 652 75,95
30–34 15 179 4 905 622 187 699 5 108 500 22 297 354 77,09
35–39 1 824 3 658 896 145 201 3 805 921 18 247 801 79,14
40–44 794 3 221 497 138 104 3 360 395 17 809 354 81,13
45–49 1 256 2 474 120 128 784 2 604 160 13 931 415 81,31
50–54 – 2 214 800 228 635 2 443 435 12 369 265 80,25
55–59 – 1 866 175 469 224 2 335 399 8 433 392 72,31
60+ – 5 626 264 4 484 560 10 110 824 18 718 923 45,99
Jumlah/Total 14 084 633 33 628 814 8 160 146 55 873 593 173 926 703 67,88
Lanjutan Tabel/Continued Table 3.2.1
http
://www.b
ps.g
o.id

P E N D U D U K D A N K E T E N A G A K E R J A A N
S t a t i s t i k I n d o n e s i a 2 0 1 388
Penduduk Berumur 15 Tahun Ke Atas Menurut Provinsi dan Jenis Kegiatan Selama Seminggu yang Lalu, 2012Population 15 Years of Age and Over by Province and Type of Activity During the Previous Week, 2012
Tabel –––––– 3.2.2Table
[Diolah dari Hasil Survei Angkatan Kerja Nasional (Sakernas) Agustus, BPS/Based on August National Labor Force Survey, BPS-Statistics Indonesia]
ProvinsiProvince
Angkatan Kerja/Economically Active Persentase Bekerja
TerhadapAngkatan Kerja
Percentage ofWorking to
EconomicallyActive
BekerjaWorking
Pengangguran Terbuka 1 Unemployment 1 Jumlah
Angkatan Kerja
Total of Economically
Active
Pernah Bekerja
Ever Worked
Tidak Pernah BekerjaNever
Worked
Jumlah Total
(1) (2) (3) (4) (5) (6) (7)
Aceh 1 798 547 29 821 150 123 179 944 1 978 491 90,90Sumatera Utara 5 751 682 98 681 281 301 379 982 6 131 664 93,80Sumatera Barat 2 037 642 39 690 102 494 142 184 2 179 826 93,48Riau 2 399 002 36 183 71 591 107 774 2 506 776 95,70Kepulauan Riau 824 567 28 295 18 503 46 798 871 365 94,63Jambi 1 423 624 15 705 31 591 47 296 1 470 920 96,78Sumatera Selatan 3 532 932 69 995 143 446 213 441 3 746 373 94,30Kepulauan Bangka Belitung 583 102 9 795 11 266 21 061 604 163 96,51Bengkulu 830 266 7 856 23 272 31 128 861 394 96,39Lampung 3 449 307 72 125 116 465 188 590 3 637 897 94,82
DKI Jakarta 4 838 596 242 198 287 778 529 976 5 368 572 90,13Jawa Barat 18 321 108 805 545 1 023 441 1 828 986 20 150 094 90,92Banten 4 605 847 228 356 290 854 519 210 5 125 057 89,87Jawa Tengah 16 132 890 506 577 455 564 962 141 17 095 031 94,37DI Yogyakarta 1 867 708 44 039 33 111 77 150 1 944 858 96,03Jawa Timur 19 081 995 384 009 435 554 819 563 19 901 558 95,88
Bali 2 268 708 28 845 18 480 47 325 2 316 033 97,96Nusa Tenggara Barat 1 978 764 46 854 63 094 109 948 2 088 712 94,74Nusa Tenggara Timur 2 095 683 15 452 46 904 62 356 2 158 039 97,11
Kalimantan Barat 2 106 514 24 579 51 431 76 010 2 182 524 96,52Kalimantan Tengah 1 070 210 8 395 26 658 35 053 1 105 263 96,83Kalimantan Selatan 1 821 327 40 178 60 646 100 824 1 922 151 94,75Kalimantan Timur 1 619 118 46 028 112 235 158 263 1 777 381 91,10
Sulawesi Utara 957 292 26 740 54 096 80 836 1 038 128 92,21Gorontalo 445 729 4 672 15 672 20 344 466 073 95,64Sulawesi Tengah 1 165 442 16 606 31 015 47 621 1 213 063 96,07Sulawesi Selatan 3 351 908 59 251 149 732 208 983 3 560 891 94,13Sulawesi Barat 548 783 3 077 8 902 11 979 560 762 97,86Sulawesi Tenggara 975 879 11 345 29 733 41 078 1 016 957 95,96
Maluku 610 362 8 969 40 622 49 591 659 953 92,49Maluku Utara 443 946 5 471 16 693 22 164 466 110 95,24Papua 1 527 933 7 328 50 173 57 501 1 585 434 96,37Papua Barat 341 741 5 428 14 428 19 856 361 597 94,51
Indonesia 110 808 154 2 978 088 4 266 868 7 244 956 118 053 110 93,86
Catatan/Note: 1 1. Mencari pekerjaan/Looking for work 2. Mempersiapkan usaha/Establishing a new business/firm 3. Merasa tidak mungkin mendapat pekerjaan/Feeling hopeless in looking for work (discouraged job seekers) 4. Sudah punya pekerjaan tetapi belum mulai bekerja/Having job already but not starting to work yet
http
://www.b
ps.g
o.id

P O P U L A T I O N A N D E M P L O Y M E N T
S t a t i s t i c a l Y e a r b o o k o f I n d o n e s i a 2 0 1 3 89
ProvinsiProvince
Bukan Angkatan Kerja/Economically Inactive
Jumlah Total
Persentase Angkatan
Kerja TerhadapPenduduk
Usia KerjaPercentage OfEconomically
Active toWorking AgePopulation
SekolahAttending
School
Mengurus Rumah Tangga
Housekeeping
LainnyaOthers
Jumlah Bukan
Angkatan Kerja
Total of Economically
Inactive
(1) (8) (9) (10) (11) (12) (13)
Aceh 364 089 647 495 212 889 1 224 473 3 202 964 61,77Sumatera Utara 790 921 1 583 473 328 259 2 702 653 8 834 317 69,41Sumatera Barat 363 390 624 206 213 470 1 201 066 3 380 892 64,47Riau 436 378 917 237 124 866 1 478 481 3 985 257 62,90Kepulauan Riau 99 473 297 287 47 151 443 911 1 315 276 66,25Jambi 218 501 480 057 91 210 789 768 2 260 688 65,07Sumatera Selatan 493 912 956 518 188 929 1 639 359 5 385 732 69,56Kepulauan Bangka Belitung 64 640 217 983 33 279 315 902 920 065 65,67Bengkulu 128 374 194 289 45 249 367 912 1 229 306 70,07Lampung 461 623 1 168 514 221 548 1 851 685 5 489 582 66,27
DKI Jakarta 725 773 1 146 251 261 595 2 133 619 7 502 191 71,56Jawa Barat 2 541 018 7 343 026 1 560 003 11 444 047 31 594 141 63,78Banten 709 458 1 714 143 332 257 2 755 858 7 880 915 65,03Jawa Tengah 1 651 811 4 075 680 1 110 886 6 838 377 23 933 408 71,43DI Yogyakarta 279 521 412 624 108 069 800 214 2 745 072 70,85Jawa Timur 2 090 695 5 184 928 1 409 747 8 685 370 28 586 928 69,62
Bali 229 810 347 065 116 065 692 940 3 008 973 76,97Nusa Tenggara Barat 274 209 608 085 192 686 1 074 980 3 163 692 66,02Nusa Tenggara Timur 311 336 438 984 149 014 899 334 3 057 373 70,58
Kalimantan Barat 255 499 486 461 116 312 858 272 3 040 796 71,77Kalimantan Tengah 126 833 300 117 49 022 475 972 1 581 235 69,90Kalimantan Selatan 98 077 473 694 178 373 750 144 2 672 295 71,93Kalimantan Timur 246 473 577 100 66 145 889 718 2 667 099 66,64
Sulawesi Utara 157 741 375 735 104 627 638 103 1 676 231 61,93Gorontalo 24 391 186 623 61 798 272 812 738 885 63,08Sulawesi Tengah 49 533 436 335 128 437 614 305 1 827 368 66,38Sulawesi Selatan 371 582 1 296 592 438 920 2 107 094 5 667 985 62,82Sulawesi Barat 14 310 168 279 38 405 220 994 781 756 71,73Sulawesi Tenggara 93 939 326 707 72 380 493 026 1 509 983 67,35
Maluku 126 714 191 804 57 444 375 962 1 035 915 63,71Maluku Utara 47 334 151 971 37 114 236 419 702 529 66,35Papua 163 383 216 999 43 329 423 711 2 009 145 78,91Papua Barat 73 892 82 552 20 668 177 112 538 709 67,12
Indonesia 14 084 633 33 628 814 8 160 146 55 873 593 173 926 703 67,88
Lanjutan Tabel/Continued Table 3.2.2
http
://www.b
ps.g
o.id
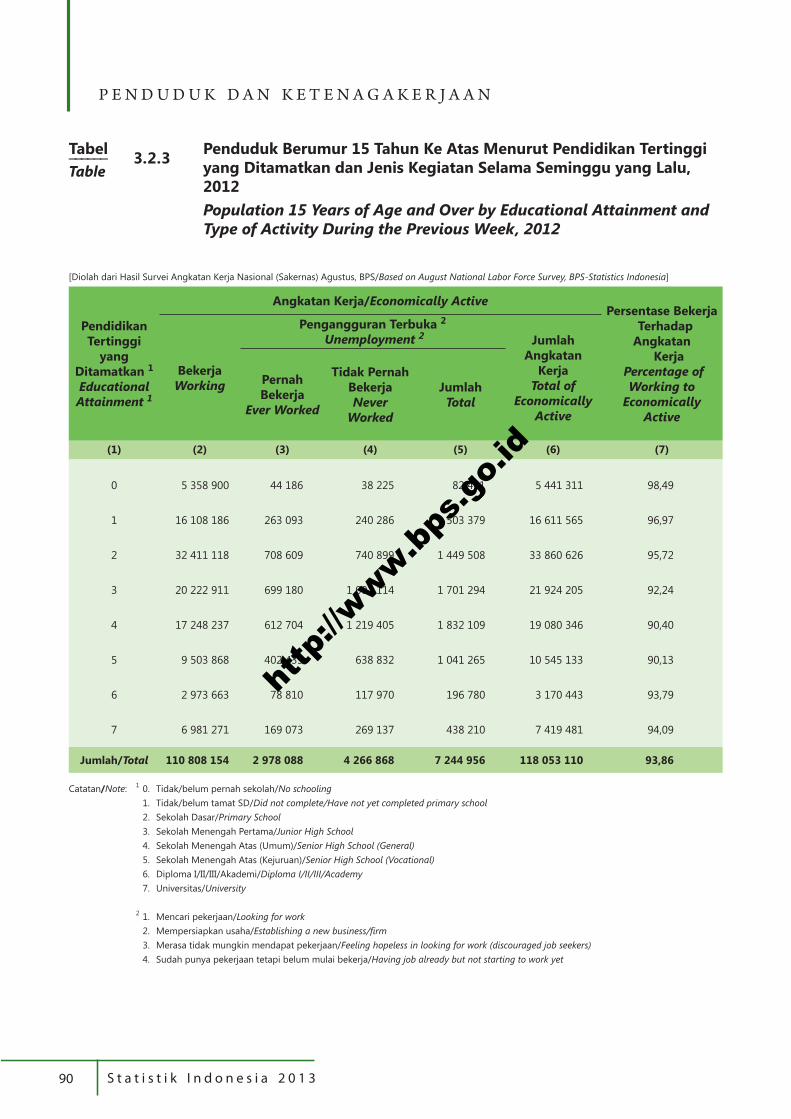
P E N D U D U K D A N K E T E N A G A K E R J A A N
S t a t i s t i k I n d o n e s i a 2 0 1 390
Penduduk Berumur 15 Tahun Ke Atas Menurut Pendidikan Tertinggi yang Ditamatkan dan Jenis Kegiatan Selama Seminggu yang Lalu, 2012Population 15 Years of Age and Over by Educational Attainment and Type of Activity During the Previous Week, 2012
Tabel –––––– 3.2.3Table
[Diolah dari Hasil Survei Angkatan Kerja Nasional (Sakernas) Agustus, BPS/Based on August National Labor Force Survey, BPS-Statistics Indonesia]
PendidikanTertinggi
yang Ditamatkan 1EducationalAttainment 1
Angkatan Kerja/Economically ActivePersentase Bekerja
TerhadapAngkatan Kerja
Percentage ofWorking to
EconomicallyActive
BekerjaWorking
Pengangguran Terbuka 2 Unemployment 2 Jumlah
Angkatan Kerja
Total of Economically
Active
Pernah Bekerja
Ever Worked
Tidak Pernah BekerjaNever
Worked
Jumlah Total
(1) (2) (3) (4) (5) (6) (7)
0 5 358 900 44 186 38 225 82 411 5 441 311 98,49
1 16 108 186 263 093 240 286 503 379 16 611 565 96,97
2 32 411 118 708 609 740 899 1 449 508 33 860 626 95,72
3 20 222 911 699 180 1 002 114 1 701 294 21 924 205 92,24
4 17 248 237 612 704 1 219 405 1 832 109 19 080 346 90,40
5 9 503 868 402 433 638 832 1 041 265 10 545 133 90,13
6 2 973 663 78 810 117 970 196 780 3 170 443 93,79
7 6 981 271 169 073 269 137 438 210 7 419 481 94,09
Jumlah/Total 110 808 154 2 978 088 4 266 868 7 244 956 118 053 110 93,86
Catatan/Note: 1 0. Tidak/belum pernah sekolah/No schooling 1. Tidak/belum tamat SD/Did not complete/Have not yet completed primary school 2. Sekolah Dasar/Primary School 3. Sekolah Menengah Pertama/Junior High School 4. Sekolah Menengah Atas (Umum)/Senior High School (General) 5. Sekolah Menengah Atas (Kejuruan)/Senior High School (Vocational) 6. Diploma I/II/III/Akademi/Diploma I/II/III/Academy 7. Universitas/University
2
1. Mencari pekerjaan/Looking for work 2. Mempersiapkan usaha/Establishing a new business/firm 3. Merasa tidak mungkin mendapat pekerjaan/Feeling hopeless in looking for work (discouraged job seekers) 4. Sudah punya pekerjaan tetapi belum mulai bekerja/Having job already but not starting to work yet
http
://www.b
ps.g
o.id

P O P U L A T I O N A N D E M P L O Y M E N T
S t a t i s t i c a l Y e a r b o o k o f I n d o n e s i a 2 0 1 3 91
PendidikanTertinggi
yang Ditamatkan 1EducationalAttainment 1
Bukan Angkatan Kerja/Economically Inactive
Jumlah Total
Persentase Angkatan
Kerja TerhadapPenduduk
Usia KerjaPercentage ofEconomically
Active toWorking AgePopulation
SekolahAttending
School
Mengurus Rumah TanggaHousekeeping
LainnyaOthers
Jumlah Bukan
Angkatan Kerja
Total of Economically
Inactive
(1) (8) (9) (10) (11) (12) (13)
0 – 2 511 513 1 778 489 4 290 002 9 731 313 55,92
1 144 457 5 472 569 1 823 924 7 440 950 24 052 515 69,06
2 2 243 068 10 436 715 1 785 482 14 465 265 48 325 891 70,07
3 8 344 187 7 067 918 1 242 509 16 654 614 38 578 819 56,83
4 2 707 315 5 021 556 840 896 8 569 767 27 650 113 69,01
5 512 451 2 061 991 420 615 2 995 057 13 540 190 77,88
6 64 531 538 262 103 991 706 784 3 877 227 81,77
7 68 624 518 290 164 240 751 154 8 170 635 90,81
Jumlah/Total 14 084 633 33 628 814 8 160 146 55 873 593 173 926 703 67,88
Lanjutan Tabel/Continued Table 3.2.3
http
://www.b
ps.g
o.id

P E N D U D U K D A N K E T E N A G A K E R J A A N
S t a t i s t i k I n d o n e s i a 2 0 1 392
Penduduk Berumur 15 Tahun Ke Atas yang Bekerja Selama Seminggu yang Lalu Menurut Provinsi dan Lapangan Pekerjaan Utama, 2012Population 15 Years of Age and Over Who Worked During the Previous Week by Province and Main Industry, 2012
Tabel –––––– 3.2.4Table
[Diolah dari Hasil Survei Angkatan Kerja Nasional (Sakernas) Agustus, BPS/Based on August National Labor Force Survey, BPS-Statistics Indonesia]
ProvinsiProvince
Lapangan Pekerjaan Utama 1/Main Industry 1
1 2 3 4 5
(1) (2) (3) (4) (5) (6)
Aceh 842 866 14 171 73 844 3 171 130 746Sumatera Utara 2 495 971 41 059 442 014 18 308 363 795Sumatera Barat 827 302 32 020 159 038 4 953 113 385Riau 1 073 024 44 655 146 435 8 042 122 539Kepulauan Riau 98 336 17 466 194 223 3 220 61 981Jambi 783 501 27 836 47 303 2 832 62 169Sumatera Selatan 1 991 353 48 608 196 967 6 837 141 795Kepulauan Bangka Belitung 166 607 129 147 35 971 1 866 31 250Bengkulu 436 880 7 503 33 849 1 672 40 755Lampung 1 666 372 27 939 329 416 5 132 189 897
DKI Jakarta 25 498 14 827 706 871 6 107 175 913Jawa Barat 3 966 550 191 271 3 863 392 50 125 1 287 391Banten 602 859 63 943 1 190 185 15 866 237 977Jawa Tengah 5 064 377 91 208 3 297 707 26 564 1 207 067DI Yogyakarta 502 570 13 602 282 602 2 721 132 849Jawa Timur 7 472 200 142 660 2 834 939 31 125 1 251 741
Bali 572 685 7 637 311 225 6 347 185 764Nusa Tenggara Barat 875 660 48 800 168 272 3 840 93 972Nusa Tenggara Timur 1 291 191 29 537 158 501 2 176 81 634
Kalimantan Barat 1 253 299 83 926 77 978 4 157 110 206Kalimantan Tengah 593 001 67 150 27 768 1 631 50 708Kalimantan Selatan 754 530 89 491 130 110 4 615 97 245Kalimantan Timur 459 077 161 898 96 777 6 186 104 930
Sulawesi Utara 312 137 29 993 57 886 3 825 76 026Gorontalo 168 496 18 788 37 986 812 29 465Sulawesi Tengah 581 345 30 685 62 251 3 108 63 044Sulawesi Selatan 1 475 783 25 753 225 880 14 256 181 433Sulawesi Barat 314 290 3 837 27 471 - 23 000Sulawesi Tenggara 399 425 31 608 63 469 1 983 62 430
Maluku 298 994 10 632 37 379 3 506 19 290Maluku Utara 244 167 10 907 14 883 935 17 396Papua 1 112 814 32 100 16 998 2 129 27 687Papua Barat 158 974 10 362 17 652 880 16 182
Indonesia 38 882 134 1 601 019 15 367 242 248 927 6 791 662
Catatan/Note: 1 1. Pertanian, Kehutanan, Perburuan, dan Perikanan/Agriculture, Forestry, Hunting, and Fisheries
2. Pertambangan dan Penggalian/Mining and Quarrying 3. Industri Pengolahan/Manufacturing Industry 4. Listrik, Gas, dan Air/Electricity, Gas, and Water 5. Bangunan/Construction 6. Perdagangan Besar, Eceran, Rumah Makan, dan Hotel/Wholesale Trade, Retail Trade, Restaurants, and Hotels 7. Angkutan, Pergudangan, dan Komunikasi/Transportation, Warehousing, and Communication 8. Keuangan, Asuransi, Usaha Persewaan Bangunan, Tanah, dan Jasa Perusahaan/Financing, Insurance, Real Estate, and Business Services 9. Jasa Kemasyarakatan, Sosial, dan Perorangan/Community, Sosial, and Personal Services
http
://www.b
ps.g
o.id
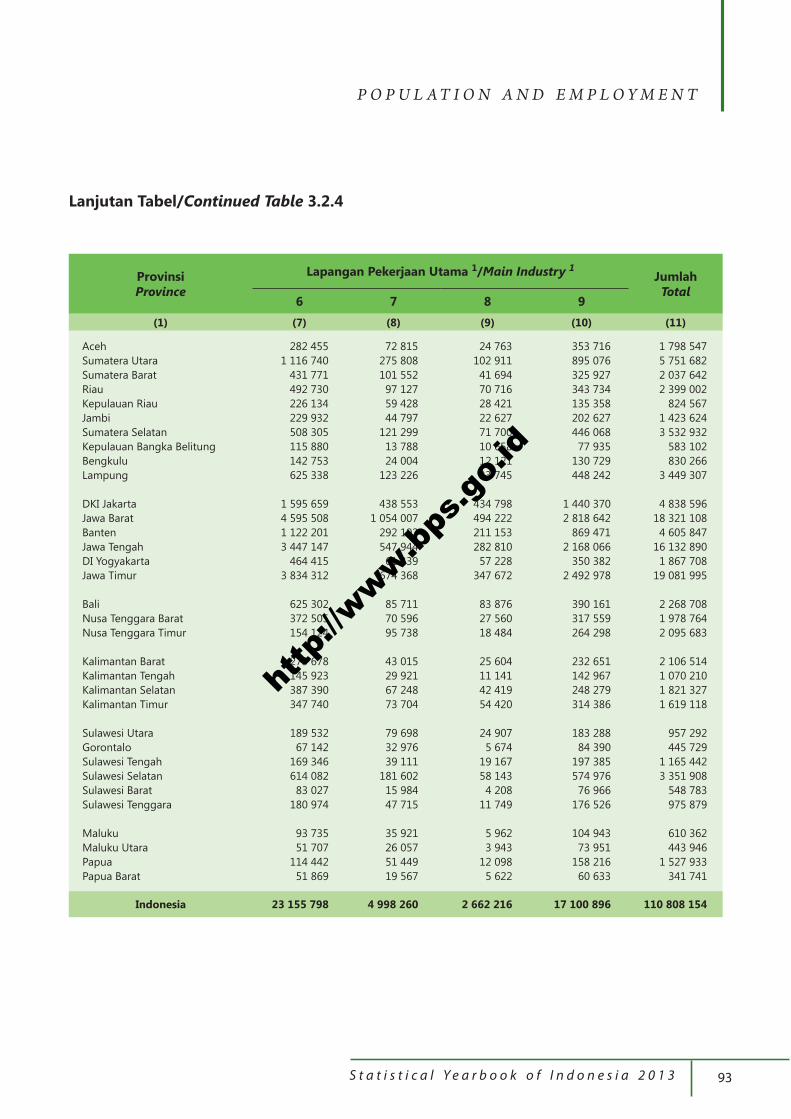
P O P U L A T I O N A N D E M P L O Y M E N T
S t a t i s t i c a l Y e a r b o o k o f I n d o n e s i a 2 0 1 3 93
ProvinsiProvince
Lapangan Pekerjaan Utama 1/Main Industry 1 Jumlah Total
6 7 8 9(1) (7) (8) (9) (10) (11)
Aceh 282 455 72 815 24 763 353 716 1 798 547Sumatera Utara 1 116 740 275 808 102 911 895 076 5 751 682Sumatera Barat 431 771 101 552 41 694 325 927 2 037 642Riau 492 730 97 127 70 716 343 734 2 399 002Kepulauan Riau 226 134 59 428 28 421 135 358 824 567Jambi 229 932 44 797 22 627 202 627 1 423 624Sumatera Selatan 508 305 121 299 71 700 446 068 3 532 932Kepulauan Bangka Belitung 115 880 13 788 10 658 77 935 583 102Bengkulu 142 753 24 004 12 121 130 729 830 266Lampung 625 338 123 226 33 745 448 242 3 449 307
DKI Jakarta 1 595 659 438 553 434 798 1 440 370 4 838 596Jawa Barat 4 595 508 1 054 007 494 222 2 818 642 18 321 108Banten 1 122 201 292 192 211 153 869 471 4 605 847Jawa Tengah 3 447 147 547 944 282 810 2 168 066 16 132 890DI Yogyakarta 464 415 61 339 57 228 350 382 1 867 708Jawa Timur 3 834 312 674 368 347 672 2 492 978 19 081 995
Bali 625 302 85 711 83 876 390 161 2 268 708Nusa Tenggara Barat 372 505 70 596 27 560 317 559 1 978 764Nusa Tenggara Timur 154 124 95 738 18 484 264 298 2 095 683
Kalimantan Barat 275 678 43 015 25 604 232 651 2 106 514Kalimantan Tengah 145 923 29 921 11 141 142 967 1 070 210Kalimantan Selatan 387 390 67 248 42 419 248 279 1 821 327Kalimantan Timur 347 740 73 704 54 420 314 386 1 619 118
Sulawesi Utara 189 532 79 698 24 907 183 288 957 292Gorontalo 67 142 32 976 5 674 84 390 445 729Sulawesi Tengah 169 346 39 111 19 167 197 385 1 165 442Sulawesi Selatan 614 082 181 602 58 143 574 976 3 351 908Sulawesi Barat 83 027 15 984 4 208 76 966 548 783Sulawesi Tenggara 180 974 47 715 11 749 176 526 975 879
Maluku 93 735 35 921 5 962 104 943 610 362Maluku Utara 51 707 26 057 3 943 73 951 443 946Papua 114 442 51 449 12 098 158 216 1 527 933Papua Barat 51 869 19 567 5 622 60 633 341 741
Indonesia 23 155 798 4 998 260 2 662 216 17 100 896 110 808 154
Lanjutan Tabel/Continued Table 3.2.4
http
://www.b
ps.g
o.id

P E N D U D U K D A N K E T E N A G A K E R J A A N
S t a t i s t i k I n d o n e s i a 2 0 1 394
Penduduk Berumur 15 Tahun Ke Atas yang Bekerja Selama Seminggu yang Lalu Menurut Status Pekerjaan Utama dan Lapangan Pekerjaan Utama, 2012Population 15 Years of Age and Over Who Worked During the Previous Week by Main Employment Status and Main Industry, 2012
Tabel –––––– 3.2.5Table
[Diolah dari Hasil Survei Angkatan Kerja Nasional (Sakernas) Agustus, BPS/Based on August National Labor Force Survey, BPS-Statistics Indonesia]
Status Pekerjaan UtamaMain Employment Status
Lapangan Pekerjaan Utama 1/Main Industry 1
1 2 3 4 5
(1) (2) (3) (4) (5) (6)
Berusaha sendiri tanpa dibantu orang lain 4 717 795 231 543 1 372 731 11 317 209 643Own account worker
Berusaha dibantu buruh tidak tetap/ 12 004 093 70 196 1 310 005 378 81 668buruh tak dibayarEmployer assisted by temporary worker/unpaid worker
Berusaha dibantu buruh tetap/buruh dibayar 1 202 011 65 808 618 482 3 528 287 224Employer assisted by permanent worker/paid worker
Buruh/Karyawan/Pegawai 3 314 084 834 846 9 935 139 224 660 2 678 422Regular employee
Pekerja bebas di pertanian 5 339 998 – – – –Casual employee in agriculture
Pekerja bebas di nonpertanian – 331 911 789 564 8 983 3 506 377Casual employee not in agriculture
Pekerja keluarga/tak dibayar 12 304 153 66 715 1 341 321 NA 28 328Family worker/unpaid worker
Jumlah/Total 38 882 134 1 601 019 15 367 242 248 927 6 791 662
Catatan/Note: 1 1. Pertanian, Kehutanan, Perburuan, dan Perikanan/Agriculture, Forestry, Hunting, and Fisheries 2. Pertambangan dan Penggalian/Mining and Quarrying 3. Industri Pengolahan/Manufacturing Industry 4. Listrik, Gas, dan Air/Electricity, Gas, and Water 5. Bangunan/Construction 6. Perdagangan Besar, Eceran, Rumah Makan, dan Hotel/Wholesale Trade, Retail Trade, Restaurants, and Hotels 7. Angkutan, Pergudangan, dan Komunikasi/Transportation, Warehousing, and Communication 8. Keuangan, Asuransi, Usaha Persewaan Bangunan, Tanah, dan Jasa Perusahaan/Financing, Insurance, Real Estate, and Business Services 9. Jasa Kemasyarakatan, Sosial, dan Perorangan/Community, Sosial, and Personal Services
http
://www.b
ps.g
o.id
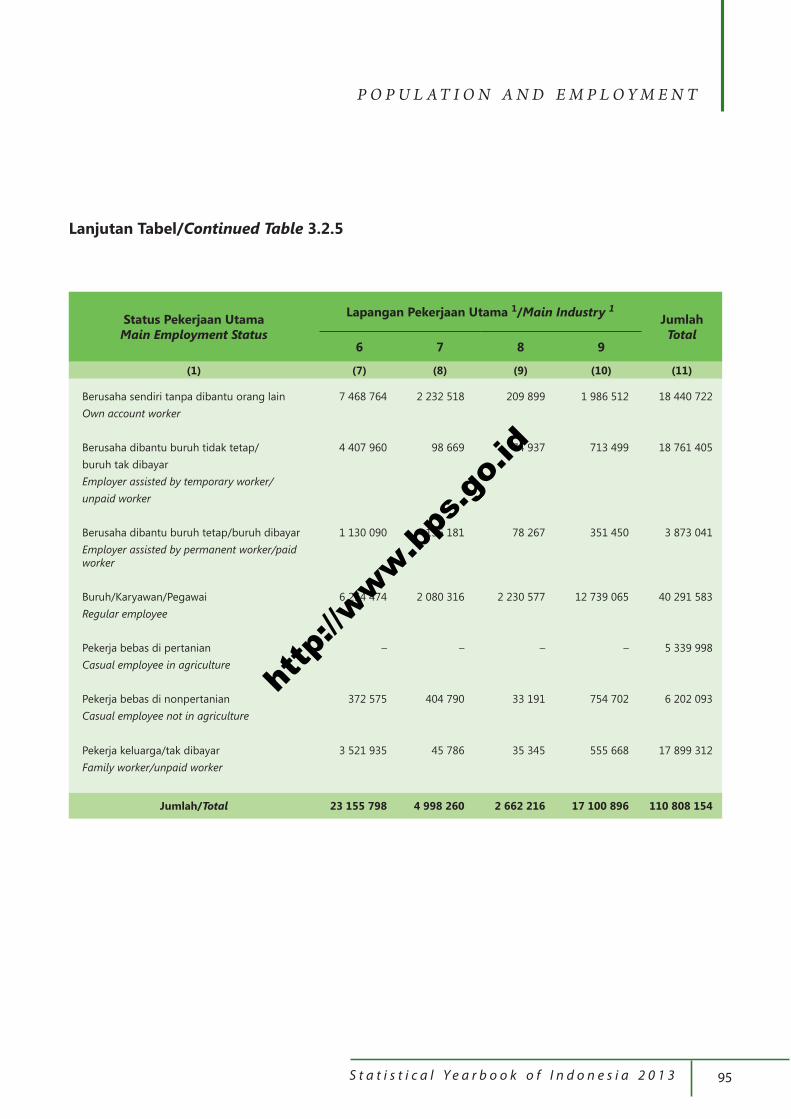
P O P U L A T I O N A N D E M P L O Y M E N T
S t a t i s t i c a l Y e a r b o o k o f I n d o n e s i a 2 0 1 3 95
Status Pekerjaan UtamaMain Employment Status
Lapangan Pekerjaan Utama 1/Main Industry 1 Jumlah Total
6 7 8 9
(1) (7) (8) (9) (10) (11)
Berusaha sendiri tanpa dibantu orang lain 7 468 764 2 232 518 209 899 1 986 512 18 440 722Own account worker
Berusaha dibantu buruh tidak tetap/ 4 407 960 98 669 74 937 713 499 18 761 405buruh tak dibayarEmployer assisted by temporary worker/unpaid worker
Berusaha dibantu buruh tetap/buruh dibayar 1 130 090 136 181 78 267 351 450 3 873 041Employer assisted by permanent worker/paid worker
Buruh/Karyawan/Pegawai 6 254 474 2 080 316 2 230 577 12 739 065 40 291 583Regular employee
Pekerja bebas di pertanian – – – – 5 339 998Casual employee in agriculture
Pekerja bebas di nonpertanian 372 575 404 790 33 191 754 702 6 202 093Casual employee not in agriculture
Pekerja keluarga/tak dibayar 3 521 935 45 786 35 345 555 668 17 899 312Family worker/unpaid worker
Jumlah/Total 23 155 798 4 998 260 2 662 216 17 100 896 110 808 154
Lanjutan Tabel/Continued Table 3.2.5
http
://www.b
ps.g
o.id

P E N D U D U K D A N K E T E N A G A K E R J A A N
S t a t i s t i k I n d o n e s i a 2 0 1 396
Penduduk Berumur 15 Tahun Ke Atas yang Bekerja Selama Seminggu yang Lalu Menurut Jumlah Jam Kerja pada Pekerjaan Utama dan Lapangan Pekerjaan Utama, 2012Population 15 Years of Age and Over Who Worked During the Previous Week by Total Working Hours on Main Job and Main Industry, 2012
Tabel –––––– 3.2.6Table
[Diolah dari Hasil Survei Angkatan Kerja Nasional (Sakernas) Agustus, BPS/Based on August National Labor Force Survey, BPS-Statistics Indonesia]
Jumlah Jam Kerja pada Pekerjaan Utama (jam)Total Working Hours on
Main Job (hours)
Lapangan Pekerjaan Utama 1/Main Industry 1
1 2 3 4 5
(1) (2) (3) (4) (5) (6)
0 2 1 127 093 58 234 238 728 7 426 156 581
1–4 278 792 3 060 23 504 442 4 366
5–9 1 404 304 13 951 127 337 1 188 34 512
10–14 3 121 574 24 214 252 907 1 548 27 253
15–19 3 650 756 35 734 311 647 875 91 649
20–24 6 120 116 76 629 623 996 5 489 178 749
25–34 8 985 279 166 751 1 291 546 19 172 419 447
35–44 8 652 561 371 388 3 996 765 94 912 1 303 342
45–54 3 487 676 406 854 6 331 964 81 968 3 176 462
55–59 1 039 479 159 910 997 497 14 105 875 196
60–74 835 872 209 803 977 665 15 891 491 636
75+ 178 632 74 491 193 686 5 911 32 469
Jumlah/Total 38 882 134 1 601 019 15 367 242 248 927 6 791 662
Catatan/Note: 1 1. Pertanian, Kehutanan, Perburuan, dan Perikanan/Agriculture, Forestry, Hunting, and Fisheries 2. Pertambangan dan Penggalian/Mining and Quarrying 3. Industri Pengolahan/Manufacturing Industry 4. Listrik, Gas, dan Air/Electricity, Gas, and Water 5. Bangunan/Construction 6. Perdagangan Besar, Eceran, Rumah Makan, dan Hotel/Wholesale Trade, Retail Trade, Restaurants, and Hotels 7. Angkutan, Pergudangan, dan Komunikasi/Transportation, Warehousing, and Communication 8. Keuangan, Asuransi, Usaha Persewaan Bangunan, Tanah, dan Jasa Perusahaan/Financing, Insurance, Real Estate, and Business Services 9. Jasa Kemasyarakatan, Sosial, dan Perorangan/Community, Sosial, and Personal Services
2 Sementara tidak bekerja/Temporarily out of work
http
://www.b
ps.g
o.id

P O P U L A T I O N A N D E M P L O Y M E N T
S t a t i s t i c a l Y e a r b o o k o f I n d o n e s i a 2 0 1 3 97
Jumlah Jam Kerja pada Pekerjaan Utama (jam)
Total Working Hours on Main Job (hours)
Lapangan Pekerjaan Utama 1/Main Industry 1 Jumlah Total
6 7 8 9
(1) (7) (8) (9) (10) (11)
0 2 651 051 103 893 71 875 601 282 3 016 163
1–4 68 057 5 245 18 470 88 442 490 378
5–9 251 378 29 339 29 645 256 719 2 148 373
10–14 572 221 60 874 32 802 433 386 4 526 779
15–19 524 625 67 215 41 044 518 484 5 242 029
20–24 1 116 145 180 921 68 937 1 041 616 9 412 598
25–34 2 081 857 443 245 142 322 2 497 647 16 047 266
35–44 4 574 804 1 081 699 860 513 6 087 352 27 023 336
45–54 5 552 212 1 395 669 987 530 3 142 302 24 562 637
55–59 2 343 426 479 072 130 052 813 679 6 852 416
60–74 3 734 240 886 625 226 402 1 201 197 8 579 331
75+ 1 685 782 264 463 52 624 418 790 2 906 848
Jumlah/Total 23 155 798 4 998 260 2 662 216 17 100 896 110 808 154
Lanjutan Tabel/Continued Table 3.2.6
http
://www.b
ps.g
o.id
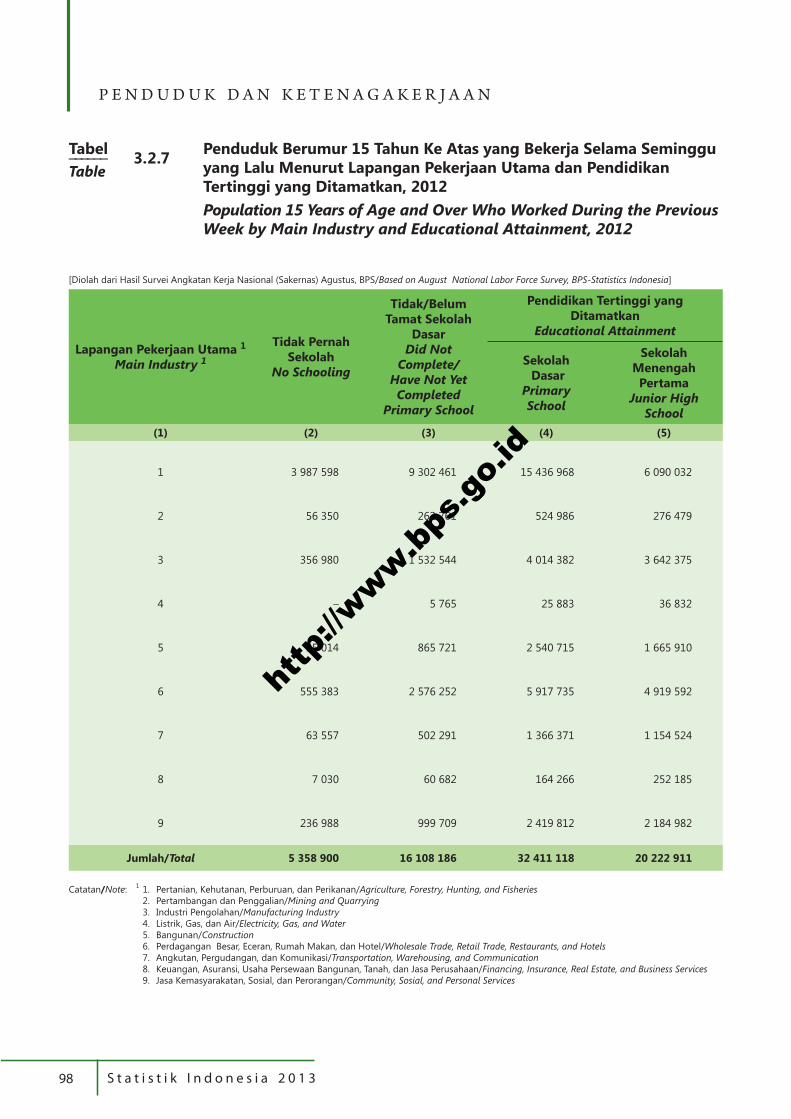
P E N D U D U K D A N K E T E N A G A K E R J A A N
S t a t i s t i k I n d o n e s i a 2 0 1 398
Penduduk Berumur 15 Tahun Ke Atas yang Bekerja Selama Seminggu yang Lalu Menurut Lapangan Pekerjaan Utama dan Pendidikan Tertinggi yang Ditamatkan, 2012Population 15 Years of Age and Over Who Worked During the Previous Week by Main Industry and Educational Attainment, 2012
Tabel –––––– 3.2.7Table
[Diolah dari Hasil Survei Angkatan Kerja Nasional (Sakernas) Agustus, BPS/Based on August National Labor Force Survey, BPS-Statistics Indonesia]
Lapangan Pekerjaan Utama 1Main Industry 1
Tidak Pernah Sekolah
No Schooling
Tidak/Belum Tamat Sekolah
Dasar Did Not
Complete/ Have Not YetCompleted
Primary School
Pendidikan Tertinggi yang Ditamatkan
Educational Attainment
Sekolah Dasar
PrimarySchool
Sekolah Menengah Pertama
Junior High School
(1) (2) (3) (4) (5)
1 3 987 598 9 302 461 15 436 968 6 090 032
2 56 350 262 761 524 986 276 479
3 356 980 1 532 544 4 014 382 3 642 375
4 – 5 765 25 883 36 832
5 95 014 865 721 2 540 715 1 665 910
6 555 383 2 576 252 5 917 735 4 919 592
7 63 557 502 291 1 366 371 1 154 524
8 7 030 60 682 164 266 252 185
9 236 988 999 709 2 419 812 2 184 982
Jumlah/Total 5 358 900 16 108 186 32 411 118 20 222 911
Catatan/Note: 1 1. Pertanian, Kehutanan, Perburuan, dan Perikanan/Agriculture, Forestry, Hunting, and Fisheries 2. Pertambangan dan Penggalian/Mining and Quarrying 3. Industri Pengolahan/Manufacturing Industry 4. Listrik, Gas, dan Air/Electricity, Gas, and Water 5. Bangunan/Construction 6. Perdagangan Besar, Eceran, Rumah Makan, dan Hotel/Wholesale Trade, Retail Trade, Restaurants, and Hotels 7. Angkutan, Pergudangan, dan Komunikasi/Transportation, Warehousing, and Communication 8. Keuangan, Asuransi, Usaha Persewaan Bangunan, Tanah, dan Jasa Perusahaan/Financing, Insurance, Real Estate, and Business Services 9. Jasa Kemasyarakatan, Sosial, dan Perorangan/Community, Sosial, and Personal Services
http
://www.b
ps.g
o.id

P O P U L A T I O N A N D E M P L O Y M E N T
S t a t i s t i c a l Y e a r b o o k o f I n d o n e s i a 2 0 1 3 99
Lapangan Pekerjaan Utama 1Main Industry 1
Pendidikan Tertinggi yang Ditamatkan Educational Attainment
Jumlah Total
Sekolah Menengah AtasSenior High School Diploma I/II/
III/AkademiDiploma I/II/III/Academy
UniversitasUniversityUmum
General School
KejuruanVocational
School
(1) (6) (7) (8) (9) (10)
1 2 753 128 980 458 134 852 196 637 38 882 134
2 252 106 134 192 35 170 58 975 1 601 019
3 2 869 876 2 269 635 237 201 444 249 15 367 242
4 70 954 66 670 15 600 27 223 248 927
5 791 402 573 724 61 799 197 377 6 791 662
6 5 131 385 2 658 912 548 333 848 206 23 155 798
7 1 001 337 558 151 142 042 209 987 4 998 260
8 750 328 429 078 261 169 737 478 2 662 216
9 3 627 721 1 833 048 1 537 497 4 261 139 17 100 896
Jumlah/Total 17 248 237 9 503 868 2 973 663 6 981 271 110 808 154
Lanjutan Tabel/Continued Table 3.2.7
http
://www.b
ps.g
o.id

P E N D U D U K D A N K E T E N A G A K E R J A A N
S t a t i s t i k I n d o n e s i a 2 0 1 3100
Penduduk Berumur 15 Tahun Ke Atas yang Bekerja Selama Seminggu yang Lalu Menurut Golongan Umur dan Jumlah Jam Kerja Seluruhnya, 2012Population 15 Years of Age and Over Who Worked During the Previous Week by Age Group and Total Working Hours, 2012
Tabel –––––– 3.2.8Table
[Diolah dari Hasil Survei Angkatan Kerja Nasional (Sakernas) Agustus, BPS/Based on August National Labor Force Survey, BPS-Statistics Indonesia]
Golongan UmurAge Group
Jumlah Jam Kerja Seluruhnya (jam)/Total Working Hours (hours)
0 1 1–4 5–9 10–14 15–19 20–24 25–34
(1) (2) (3) (4) (5) (6) (7) (8)
15–19 82 533 67 319 268 875 480 512 343 329 526 431 679 583
20–24 195 761 42 588 186 977 353 882 391 764 708 567 1 201 794
25–29 340 721 43 777 180 642 365 089 478 289 900 817 1 661 855
30–34 362 028 46 325 230 678 472 228 569 575 1 036 248 1 953 003
35–39 349 183 37 144 204 128 391 404 483 335 891 359 1 761 461
40–44 403 678 39 891 205 518 418 129 504 894 984 463 1 859 630
45–49 337 907 45 615 150 903 354 797 436 506 785 769 1 601 828
50–54 307 623 42 377 179 966 358 415 440 069 794 652 1 524 881
55–59 233 164 30 331 131 049 279 915 313 879 527 582 1 049 616
60+ 403 565 80 695 288 723 642 112 657 870 1 012 018 1 593 240
Jumlah/Total 3 016 163 476 062 2 027 459 4 116 483 4 619 510 8 167 906 14 886 891
Catatan/Note: 1 Sementara tidak bekerja/Temporarily out of work
http
://www.b
ps.g
o.id

P O P U L A T I O N A N D E M P L O Y M E N T
S t a t i s t i c a l Y e a r b o o k o f I n d o n e s i a 2 0 1 3 101
Golongan UmurAge Group
Jumlah Jam Kerja Seluruhnya (jam)/Total Working Hours (hours) Jumlah Total
35–44 45–54 55–59 60–74 75+
(1) (9) (10) (11) (12) (13) (14)
15–19 1 291 309 1 366 259 346 906 406 185 146 499 6 005 740
20–24 2 519 104 3 258 154 719 258 849 463 250 320 10 677 632
25–29 3 618 723 4 021 314 956 458 1 225 937 370 688 14 164 310
30–34 4 174 091 4 301 286 1 206 680 1 581 963 536 457 16 470 562
35–39 3 457 876 3 546 535 1 113 730 1 347 682 478 191 14 062 028
40–44 3 492 845 3 312 602 1 076 041 1 349 472 466 022 14 113 185
45–49 2 866 890 2 321 056 800 880 1 034 349 342 142 11 078 642
50–54 2 528 591 1 821 199 627 469 779 262 270 446 9 674 950
55–59 1 468 036 980 647 366 461 467 016 155 828 6 003 524
60+ 1 825 533 1 040 877 388 999 445 856 178 093 8 557 581
Jumlah/Total 27 242 998 25 969 929 7 602 882 9 487 185 3 194 686 110 808 154
Lanjutan Tabel/Continued Table 3.2.8
http
://www.b
ps.g
o.id

P E N D U D U K D A N K E T E N A G A K E R J A A N
S t a t i s t i k I n d o n e s i a 2 0 1 3102
Penduduk Berumur 15 Tahun Ke Atas yang Bekerja Selama Seminggu yang Lalu Menurut Status Pekerjaan Utama dan Pendidikan Tertinggi yang Ditamatkan, 2012Population 15 Years of Age and Over Who Worked During the Previous Week by Main Employment Status and Educational Attainment, 2012
Tabel –––––– 3.2.9Table
[Diolah dari Hasil Survei Angkatan Kerja Nasional (Sakernas) Agustus, BPS/Based on August National Labor Force Survey, BPS-Statistics Indonesia]
Status Pekerjaan UtamaMain Employment Status
Tidak Pernah Sekolah
No Schooling
Tidak/Belum Tamat Sekolah Dasar
Did Not Complete/
Have Not Yet Completed
Primary School
Pendidikan Tertinggi yang Ditamatkan
Educational Attainment
Sekolah Dasar
PrimarySchool
Sekolah Menengah Pertama
Junior High School
(1) (2) (3) (4) (5)
Berusaha sendiri tanpa dibantu orang lainOwn account worker
1 016 211 3 357 765 6 213 779 3 690 921
Berusaha dibantu buruh tidak tetap/buruh tak dibayarEmployer assisted by temporary worker/unpaid worker
1 709 796 4 198 843 6 998 103 2 918 018
Berusaha dibantu buruh tetap/buruh dibayarEmployer assisted by permanent worker/paid worker
96 157 432 158 956 513 705 582
Buruh/Karyawan/Pegawai Regular employee
334 288 2 358 942 6 740 264 7 063 100
Pekerja bebas di pertanianCasual employee in agriculture
501 304 1 511 927 2 415 939 651 989
Pekerja bebas di nonpertanianCasual employee not in agriculture
157 436 986 484 2 711 052 1 461 618
Pekerja keluarga/tak dibayarFamily worker/unpaid worker
1 543 708 3 262 067 6 375 468 3 731 683
Jumlah/Total 5 358 900 16 108 186 32 411 118 20 222 911
http
://www.b
ps.g
o.id

P O P U L A T I O N A N D E M P L O Y M E N T
S t a t i s t i c a l Y e a r b o o k o f I n d o n e s i a 2 0 1 3 103
Status Pekerjaan UtamaMain Employment Status
Pendidikan Tertinggi yang Ditamatkan Educational Attainment
Jumlah Total
Sekolah Menengah AtasSenior High School
Diploma I/II/III/
AkademiDiploma I/II/III/
Academy
UniversitasUniversityUmum
General School
KejuruanVocational
School
(1) (6) (7) (8) (9) (10)
Berusaha sendiri tanpa dibantu orang lainOwn account worker
2 526 741 1 149 640 197 435 288 230 18 440 722
Berusaha dibantu buruh tidak tetap/buruh tak dibayarEmployer assisted by temporary worker/unpaid worker
1 834 249 743 578 139 052 219 766 18 761 405
Berusaha dibantu buruh tetap/buruh dibayarEmployer assisted by permanent worker/paid worker
840 091 338 074 122 463 382 003 3 873 041
Buruh/Karyawan/Pegawai Regular employee
9 361 861 6 156 468 2 378 329 5 898 331 40 291 583
Pekerja bebas di pertanianCasual employee in agriculture
184 473 70 979 1 626 1 761 5 339 998
Pekerja bebas di nonpertanianCasual employee not in agriculture
532 595 318 579 16 940 17 389 6 202 093
Pekerja keluarga/tak dibayarFamily worker/unpaid worker
1 968 227 726 550 117 818 173 791 17 899 312
Jumlah/Total 17 248 237 9 503 868 2 973 663 6 981 271 110 808 154
Lanjutan Tabel/Continued Table 3.2.9
http
://www.b
ps.g
o.id

P E N D U D U K D A N K E T E N A G A K E R J A A N
S t a t i s t i k I n d o n e s i a 2 0 1 3104
Tingkat Pengangguran Terbuka (TPT) dan Tingkat Partisipasi Angkatan Kerja (TPAK) Menurut Provinsi, 2010–2012Unemployment Rate (UR) and Labor Force Participation Rate (LFPR) by Province, 2010–2012
Tabel –––––– 3.2.10Table
[Diolah dari Hasil Survei Angkatan Kerja Nasional (Sakernas) Februari dan Agustus, BPS/Based on February and August National Labor Force Survey, BPS-Statistics Indonesia]
ProvinsiProvince
TPT/UR TPAK/LFPR
2010 2011 2012 2010 2011 2012
Agust.Augst.
Feb.Feb.
Agust. Augst.
Feb.Feb.
Agust. Augst.
Agust.Augst.
Feb.Feb.
Agust. Augst.
Feb.Feb.
Agust. Augst.
(1) (2) (3) (4) (5) (6) (7) (8) (9) (10) (11)
Aceh 8,37 8,27 7,43 7,88 9,10 63,17 66,64 63,78 65,85 61,77Sumatera Utara 7,43 7,18 6,37 6,31 6,20 69,51 73,53 72,09 74,55 69,41Sumatera Barat 6,95 7,14 6,45 6,25 6,52 66,36 68,42 66,19 69,92 64,47Riau 8,72 7,17 5,32 5,17 4,30 63,66 68,36 66,38 66,91 62,90Kepulauan Riau 6,90 7,04 7,80 5,87 5,37 68,85 68,14 67,48 69,33 66,25Jambi 5,39 3,85 4,02 3,65 3,22 65,78 69,91 67,67 69,40 65,07Sumatera Selatan 6,65 6,07 5,77 5,59 5,70 70,23 71,51 71,15 73,55 69,56Kepulauan Bangka Belitung 5,63 3,25 3,61 2,78 3,49 66,53 68,92 68,43 68,11 65,67Bengkulu 4,59 3,41 2,37 2,14 3,61 71,86 74,25 73,83 74,85 70,07Lampung 5,57 5,24 5,78 5,12 5,18 67,95 71,13 68,00 71,98 66,27
DKI Jakarta 11,05 10,83 10,80 10,72 9,87 67,83 67,94 69,36 70,83 71,56Jawa Barat 10,33 9,84 9,83 9,78 9,08 62,38 65,38 62,27 64,26 63,78Banten 13,68 13,50 13,06 10,74 10,13 65,34 68,03 67,79 69,36 65,03Jawa Tengah 6,21 6,07 5,93 5,88 5,63 70,60 71,94 70,77 71,58 71,43DI Yogyakarta 5,69 5,47 3,97 4,09 3,97 69,76 72,11 68,77 70,47 70,85Jawa Timur 4,25 4,18 4,16 4,13 4,12 69,08 71,39 69,49 69,55 69,62
Bali 3,06 2,86 2,32 2,11 2,04 77,38 78,49 76,45 77,42 76,97Nusa Tenggara Barat 5,29 5,35 5,33 5,21 5,26 66,63 69,69 66,12 69,27 66,02Nusa Tengggara Timur 3,34 2,67 2,69 2,39 2,89 72,77 75,10 71,72 74,77 70,58
Kalimantan Barat 4,62 4,99 3,88 3,36 3,48 73,17 74,97 73,93 74,50 71,77Kalimantan Tengah 4,14 3,66 2,55 2,71 3,17 69,86 73,51 72,89 73,79 69,90Kalimantan Selatan 5,25 5,62 5,23 4,32 5,25 71,26 70,68 73,31 71,24 71,93Kalimantan Timur 10,10 10,21 9,84 9,29 8,90 66,41 67,66 68,51 69,89 66,64
Sulawesi Utara 9,61 9,19 8,62 8,32 7,79 63,31 64,71 65,32 66,82 61,93Gorontalo 5,16 4,61 4,26 4,81 4,36 64,42 63,90 64,12 64,36 63,08Sulawesi Tengah 4,61 4,27 4,01 3,73 3,93 69,22 73,31 73,11 74,63 66,38Sulawesi Selatan 8,37 6,69 6,56 6,46 5,87 64,14 65,01 64,32 64,56 62,82Sulawesi Barat 3,25 2,70 2,82 2,07 2,14 71,46 76,08 72,27 72,64 71,73Sulawesi Tenggara 4,61 4,34 3,06 3,10 4,04 71,86 72,42 71,42 73,10 67,35
Maluku 9,97 7,72 7,38 7,11 7,51 66,48 69,43 69,47 66,98 63,71Maluku Utara 6,03 5,62 5,55 5,31 4,76 65,11 70,24 67,45 67,82 66,35Papua 3,55 3,72 3,94 2,90 3,63 80,99 81,51 78,45 79,27 78,91Papua Barat 7,68 8,28 8,94 6,57 5,49 69,29 71,50 70,78 72,27 67,12
Indonesia 7,14 6,80 6,56 6,32 6,14 67,72 69,96 68,34 69,66 67,88
http
://www.b
ps.g
o.id

P O P U L A T I O N A N D E M P L O Y M E N T
S t a t i s t i c a l Y e a r b o o k o f I n d o n e s i a 2 0 1 3 105
Jumlah TKI Menurut Kawasan/Negara Penempatan dan Jenis Kelamin, 2011 dan 2012Number of Indonesian Overseas Workers by Country of Destination and Sex, 2011 and 2012
Tabel –––––– 3.2.11Table
Kawasan/Negara Penempatan
Country of Destination
2011 2012
Laki-LakiMale
PerempuanFemale
JumlahTotal
Laki-LakiMale
PerempuanFemale
JumlahTotal
(1) (2) (3) (4) (5) (6) (7)
Asia Pasifik dan AmerikaAsia Pacific and America
158 722 196 549 355 271 168 548 193 288 361 836
1. Malaysia 94 580 38 728 133 308 86 041 47 982 134 0232. Singapura/Singapore 6 930 40 851 47 781 10 023 31 533 41 5563. Brunei Darussalam 7 162 3 643 10 805 8 295 4 851 13 1464. Hongkong 1 161 49 122 50 283 1 463 44 015 45 4785. Taiwan 15 200 62 022 77 222 18 683 62 388 81 0716. Korea Selatan/Korea, Republic of 10 989 401 11 390 13 287 306 13 5937. Jepang/Japan 2 401 107 2 508 3 152 141 3 2938. Macau 50 532 582 41 390 4319. Amerika Serikat/United States 12 964 782 13 746 14 523 830 15 35310. Lain-Lain/Others 7 285 361 7 646 13 040 852 13 892
Timur Tengah dan AfrikaMiddle East and Africa
40 951 175 678 216 629 36 072 85 213 121 285
1. Arab Saudi/Saudi Arabia 25 892 108 027 133 919 22 299 18 356 40 6552. UEA/United Emirates Arab 4 427 35 643 40 070 4 253 31 318 35 5713. Kuwait 660 2 063 2 723 498 2 020 2 5184. Bahrain 260 4 115 4 375 170 6 158 6 3285. Qatar 3 169 14 013 17 182 2 091 18 289 20 3806. Oman 420 6 872 7 292 257 8 579 8 8367. Yordania/Jordan 16 118 134 26 80 1068. Yaman 48 11 59 85 6 919. Afrika/Africa 692 45 737 408 17 42510. Lain-Lain/Others 5 367 4 771 10 138 5 985 390 6 375
Eropa/Europe 7 927 1 254 9 181 10 205 1 283 11 488
1. Italia/Italy 3 217 191 3 408 3 469 222 3 6912. Spanyol/Spain 1 433 51 1 484 1 696 50 1 7463. Belanda/Netherlands 576 16 592 778 20 7984. Inggris/United Kingdom 390 101 491 346 79 4255. Jerman/Germany 274 25 299 641 56 6976. Lain-Lain/Others 2 037 870 2 907 3 275 856 4 131
Jumlah/Total 207 600 373 481 581 081 214 825 279 784 494 609
Sumber/Source: Badan Nasional Penempatan dan Perlindungan Tenaga Kerja Indonesia (BNP2TKI) The National Authority for The Placement and Protection of Indonesian Overseas Workers
http
://www.b
ps.g
o.id

P E N D U D U K D A N K E T E N A G A K E R J A A N
S t a t i s t i k I n d o n e s i a 2 0 1 3106
Pencari Kerja Terdaftar, Lowongan Kerja Terdaftar, dan Penempatan/Pemenuhan Tenaga Kerja Menurut Provinsi dan Jenis Kelamin, 2012 1
Number of Registered Job Applicants, Registered Job Vacancies, and Placement of Workers by Province and Sex, 2012 1
Tabel –––––– 3.2.12Table
ProvinsiProvince
Pencari Kerja TerdaftarRegistered Job Applicants
Laki-LakiMale
PerempuanFemale
JumlahTotal
(1) (2) (3) (4)
Aceh 1 969 3 820 5 789Sumatera Utara 2 121 4 693 6 814Sumatera Barat 3 504 5 138 8 642Riau 146 108 254Kepulauan Riau 32 30 62Jambi 2 491 1 682 4 173Sumatera Selatan 3 305 1 817 5 122Kepulauan Bangka Belitung 2 155 1 014 3 169Bengkulu 4 002 3 677 7 679Lampung 11 619 9 052 20 671
DKI Jakarta 8 901 7 279 16 180Jawa Barat 37 549 43 508 81 057Banten 20 776 21 593 42 369Jawa Tengah 309 559 360 185 669 744DI Yogyakarta 4 109 3 609 7 718Jawa Timur 235 238 25 502 260 740
Bali 5 479 3 943 9 422Nusa Tenggara Barat 29 528 34 674 64 202Nusa Tenggara Timur 13 176 11 238 24 414
Kalimantan Barat 506 513 1 019Kalimantan Tengah 1 029 327 1 356Kalimantan Selatan 4 932 1 921 6 853Kalimantan Timur 12 510 3 487 15 997
Sulawesi Utara 6 479 5 402 11 881Gorontalo 30 35 65Sulawesi Tengah 1 275 1 172 2 447Sulawesi Selatan 1 757 2 440 4 197Sulawesi Barat 24 20 44Sulawesi Tenggara 1 286 1 659 2 945
Maluku 2 003 2 164 4 167Maluku Utara 430 154 584Papua 4 116 4 162 8 278Papua Barat 738 585 1 323
Indonesia 732 774 566 603 1 299 377
Catatan/Note: 1 Semester I-2012/First semester-2012
Sumber/Source: Kementerian Tenaga Kerja dan Transmigrasi/Ministry of Manpower and Transmigration
http
://www.b
ps.g
o.id
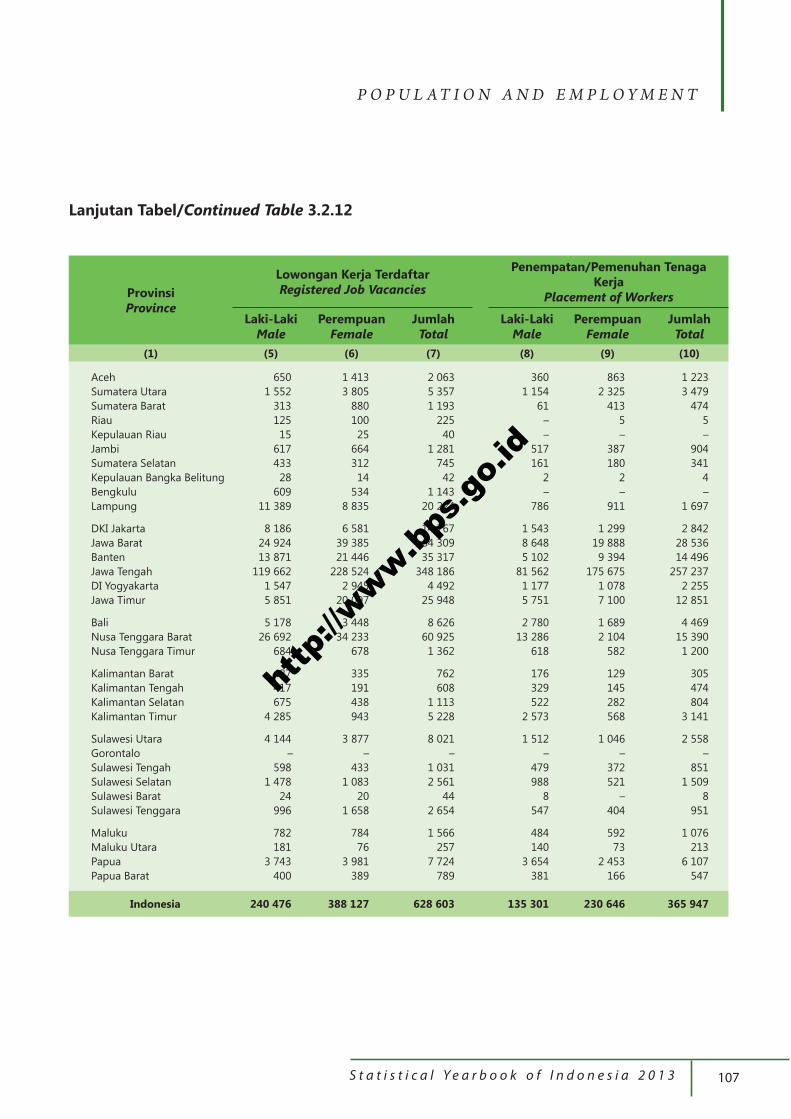
P O P U L A T I O N A N D E M P L O Y M E N T
S t a t i s t i c a l Y e a r b o o k o f I n d o n e s i a 2 0 1 3 107
ProvinsiProvince
Lowongan Kerja TerdaftarRegistered Job Vacancies
Penempatan/Pemenuhan Tenaga Kerja
Placement of Workers
Laki-LakiMale
PerempuanFemale
JumlahTotal
Laki-LakiMale
PerempuanFemale
JumlahTotal
(1) (5) (6) (7) (8) (9) (10)
Aceh 650 1 413 2 063 360 863 1 223Sumatera Utara 1 552 3 805 5 357 1 154 2 325 3 479Sumatera Barat 313 880 1 193 61 413 474Riau 125 100 225 – 5 5Kepulauan Riau 15 25 40 – – –Jambi 617 664 1 281 517 387 904Sumatera Selatan 433 312 745 161 180 341Kepulauan Bangka Belitung 28 14 42 2 2 4Bengkulu 609 534 1 143 – – –Lampung 11 389 8 835 20 224 786 911 1 697
DKI Jakarta 8 186 6 581 14 767 1 543 1 299 2 842Jawa Barat 24 924 39 385 64 309 8 648 19 888 28 536Banten 13 871 21 446 35 317 5 102 9 394 14 496Jawa Tengah 119 662 228 524 348 186 81 562 175 675 257 237DI Yogyakarta 1 547 2 945 4 492 1 177 1 078 2 255Jawa Timur 5 851 20 097 25 948 5 751 7 100 12 851
Bali 5 178 3 448 8 626 2 780 1 689 4 469Nusa Tenggara Barat 26 692 34 233 60 925 13 286 2 104 15 390Nusa Tenggara Timur 684 678 1 362 618 582 1 200
Kalimantan Barat 427 335 762 176 129 305Kalimantan Tengah 417 191 608 329 145 474Kalimantan Selatan 675 438 1 113 522 282 804Kalimantan Timur 4 285 943 5 228 2 573 568 3 141
Sulawesi Utara 4 144 3 877 8 021 1 512 1 046 2 558Gorontalo – – – – – –Sulawesi Tengah 598 433 1 031 479 372 851Sulawesi Selatan 1 478 1 083 2 561 988 521 1 509Sulawesi Barat 24 20 44 8 – 8Sulawesi Tenggara 996 1 658 2 654 547 404 951
Maluku 782 784 1 566 484 592 1 076Maluku Utara 181 76 257 140 73 213Papua 3 743 3 981 7 724 3 654 2 453 6 107Papua Barat 400 389 789 381 166 547
Indonesia 240 476 388 127 628 603 135 301 230 646 365 947
Lanjutan Tabel/Continued Table 3.2.12
http
://www.b
ps.g
o.id

P E N D U D U K D A N K E T E N A G A K E R J A A N
S t a t i s t i k I n d o n e s i a 2 0 1 3108
Rata-Rata Upah Nominal Per Bulan Buruh Produksi/Pelaksana di Bawah Mandor/Supervisor Menurut Lapangan Usaha dan Wilayah (ribu rupiah), 2011 dan 2012Average Monthly Nominal Wage of Production/Operational Workers Below Supervisory Level by Main Industry and Region (thousand rupiahs), 2011 and 2012
Tabel –––––– 3.2.13Table
[Diolah dari Hasil Survei Upah Buruh, BPS/Based on Labor Wage Survey, BPS-Statistics Indonesia]
Lapangan Usaha dan Wilayah/Main Industry and
Region
Triwulan/Quarter2011
Triwulan/Quarter2012
I II III IV x I x II x III IV xx
(1) (2) (3) (4) (5) (6) (7) (8) (9)Lapangan Usaha/Main Industry
Industri PengolahanManufacturing
1 343,5 1 320,3 1 397,1 x 1 467,4 1 459,7 1 524,9 1 492,8 xx 1 500,1
Hotel/Hotels 1 249,7 1 240,5 1 255,6 1 298,0 1 285,2 1 305,6 1 309,7 x 1 318,6
Pertambangan NonmigasNon-oil and Gas Mining
4 011,4 4 077,4 4 058,3 x 3 880,5 3 732,5 3 764,0 3 762,7 xx 3 578,4
Wilayah/Region
Khusus untuk Sektor Industri Pengolahan/Only for Manufacturing
Jawa Barat, DKI Jakarta, dan Banten
1 567,5 1 528,9 1 550,3 x 1 554,2 1 614,9 1 708,2 1 833,1 xx 1 858,7
Jabodetabek (Jakarta, Bogor, Depok, Tangerang, Bekasi)
1 741,0 1 671,7 1 686,7 x 1 706,4 1 749,4 1773,6 1759,6 xx 1784,5
Luar JabodetabekOuter Jabodetabek
1 312,3 1 370,6 1 319,8 x 1 306,9 1 398,9 1 431,2 1 445,8 xx 1 445,2
Jawa Tengah dan DI Yogyakarta 949,2 975,8 1 005,0 x 1 001,3 1 002,6 1 024,3 1 030,4 xx 1 028,5
Jawa Timur dan Bali 1 183,4 1 165,0 1 122,1 x 1 095,5 1 129,8 1 141,2 1 164,5 xx 1 198,2Sugresid (Surabaya,Gresik,Sidoarjo)
1 350,5 1 379,5 1 354,4 x 1 384,0 1 345,3 1 453,4 1 496,9 xx 1 472,8
Luar Sugresid/Outer Sugresid 1 061,4 1 072,1 1 053,2 x 1 003,6 1 071,8 1 073,0 1 101,8 xx 1 138,3
Luar Jawa-Bali/Outer Jawa-Bali 1 569,5 1 570,9 1 533,0 x 1 510,9 1 603,2 1 581,5 1 636,0 xx 1 672,0
Catatan/Note: x Angka sementara/Preliminary figures xxAngka sangat sementara/Very preliminary figures Masing-masing triwulan merujuk pada bulan Maret, Juni, September, dan Desember Each quarter refers to March, June, September, and December, respectively
http
://www.b
ps.g
o.id

P O P U L A T I O N A N D E M P L O Y M E N T
S t a t i s t i c a l Y e a r b o o k o f I n d o n e s i a 2 0 1 3 109
Rata-Rata Upah Nominal Per Bulan Buruh Produksi di Bawah Mandor di Sektor Industri Pengolahan Menurut Subsektor (ribu rupiah), 2011 dan 2012Average Monthly Nominal Wage of Production Workers Below Supervisory Level in Manufacturing by Subsector (thousand rupiahs), 2011 and 2012
Tabel –––––– 3.2.14Table
[Diolah dari Hasil Survei Upah Buruh, BPS/Based on Labor Wage Survey, BPS-Statistics Indonesia]
SubsektorSubsector
Triwulan/Quarter2011
Triwulan/Quarter2012
I II III x IV x I x II x III xx IV xx
(1) (2) (3) (4) (5) (6) (7) (8) (9)Makanan/Food 1 209,1 1 208,4 1 199,4 1 139,0 1 199,6 1 296,9 1 301,8 1 336,2
Bahan Makanan/Basic Food 1 464,1 1 457,5 1 459,1 1 466,3 1 441,6 1 646,4 1 642,5 1 657,9Makanan Jadi/Processed Food 1 133,3 1 210,0 1 240,6 1 410,9 1 377,7 1 485,1 1 434,7 1 285,8Tembakau/RokokCigarettes/Tobacco 961,1 951,6 960,3 988,0 1 195,9 1 184,6 1 157,2 1 045,3
Makanan Lainnya/Other Foods 1 364,8 1 291,0 1 337,0 1 537,5 1 504,7 1 510,6 1 612,2 1 689,8
Tekstil/Textile 1 288,0 1 307,5 1 391,2 1474,9 1 432,5 1 488,4 1 369,6 1 374,3Bahan Pakaian/Basic Textile 1 115,2 1 090,1 1 256,6 1 039,5 1 088,5 1 232,9 1 273,2 1 160,7Pakaian Jadi/Garment 1 403,6 1 404,5 1 449,7 1 410,7 1 434,4 1 439,7 1 550,9 1 588,2Tekstil Lainnya/Other Textiles 1 381,5 1 478,9 1 479,2 1 373,9 1 472,3 1 434,1 1 462,0 1 432,1
Kayu/Wood 1 173,3 1 196,3 1 232,9 1 266,4 1 251,1 1 230,8 1 305,6 1 350,1Kayu Olahan/Processed Wood 1 236,4 1 272,1 1 318,3 1 334,1 1 312,3 1 310,6 1 374,8 1 404,3Furnitur/Furniture 1 097,0 1 093,4 1 112,5 1 096,0 1 157,2 1 093,1 1 197,8 1 269,2
Kertas/PercetakanPaper/Printing
1 546,5 1 565,7 1 568,6 1 553,4 1595,7 1 501,5 1 580,2 1 526,4
Kertas/Paper 1 758,6 1 734,4 1 713,2 1 764,7 1781,3 1 707,5 1 761,8 1 615,1Percetakan/Printing 1 315,5 1 378,8 1 267,8 1 319,6 1470,6 1 482,7 1 583,4 1 545,2
Kimia/KaretChemical/Rubber
1 387,7 1 410,0 1 410,8 1 565,2 1 447,6 1 454,5 1 539,8 1 552,0
Karet/Rubber 1 328,3 1 443,5 1 434,5 1 307,1 1 469,4 1 467,8 1 461,3 1 540,9Plastik/Plastic 1 255,2 1 238,7 1 290,8 1 258,4 1 279,2 1 363,2 1 375,8 1 391,7Kimia Lainnya/Other Chemicals 1 595,6 1 593,6 1 511,9 1 514,7 1 588,3 1 608,3 1 748,5 1 712,2
Mineral NonlogamNon-metallic Mineral
1 160,0 1 232,9 1 343,4 1 496,4 1 494,5 1 494,8 1 454,1 1 395,6
Semen/KapurCement/Limestone
1 419,6 1 614,1 1 615,2 1 622,6 1 626,6 1 697,9 1 686,2 1 445,7
Tanah LiatBricks/Tiles
685,9 698,8 796,9 894,9 895,4 887,6 866,8 869,4
Mineral Nonlogam LainnyaNon-metallic Minerals 1 360,9 1 340,0 1 352,1 1 521,6 1 518,9 1 597,0 1 545,2 1 667,1
Logam/Metals 2 120,4 2 032,5 2 121,9 2 006,3 2 137,8 2 053,4 2 149,2 2 058,1
Lainnya/Others 1 668,0 1 407,8 1 492,2 1 509,3 1 571,7 1 582,0 1 760,8 1 800,9
Semua Industri/All Industries 1 343,5 1 320,3 1 397,1 1 467,4 1 459,7 1 524,9 1 492,8 1 500,1
Catatan/Note: x Angka sementara/Preliminary figures xxAngka sangat sementara/Very preliminary figures Masing-masing triwulan merujuk pada bulan Maret, Juni, September, dan Desember Each quarter refers to March, June, September, and December, respectively
http
://www.b
ps.g
o.id

P E N D U D U K D A N K E T E N A G A K E R J A A N
S t a t i s t i k I n d o n e s i a 2 0 1 3110
Rata-Rata Upah Nominal Per Bulan Buruh Produksi di Bawah Mandor di Perusahaan Industri Besar dan Sedang Menurut Subsektor (ribu rupiah), 2011 dan 2012Average Monthly Nominal Wage of Production Workers Below Supervisory Level in Large and Medium Manufactures by Subsector (thousand rupiahs), 2011 and 2012
Tabel –––––– 3.2.15Table
[Diolah dari Hasil Survei Upah Buruh, BPS/Based on Labor Wage Survey, BPS-Statistics Indonesia]
SubsektorSubsector
Triwulan/Quarter2011
Triwulan/Quarter2012
I II III x IV x I x II x III xx IV xx
(1) (2) (3) (4) (5) (6) (7) (8) (9)
Industri Besar 1Large Manufactures 1
1 402,6 1 375,8 1 414,7 1 473,8 1 482,4 1 457,9 1 530,6 1 600,4
Makanan/Food 1 280,0 1 266,1 1 232,9 1 142,0 1 265,6 1 372,7 1 456,3 1 483,9Tekstil/Textile 1 320,4 1 347,6 1 488,1 1 325,2 1 379,8 1 378,9 1 363,4 1 496,3
Kayu/Wood 1 224,9 1 243,4 1 461,2 1 228,6 1 268,7 1 291,6 1 372,9 1 418,6
Kertas dan KimiaPaper and Chemicals
1 455,9 1 501,0 1 514,0 1 433,2 1 516,3 1 539,7 1 615,0 1 632,8
Mineral Nonlogam dan LogamNon-metallic Mineral and Metals
1 884,6 1 852,9 1 770,0 1 754,0 1 851,6 1 866,2 1 862,8 1 844,0
Lainnya/Others 1 695,5 1 392,3 1 363,8 1 507,5 1 636,0 1 654,6 1 625,8 1 899,1
Industri Sedang 2Medium Manufactures 2
1 057,1 1 051,0 1 085,0 1 086,2 1 091,0 1181,4 1 170,7 1 178,4
Makanan/Food 925,8 959,8 958,5 979,1 1 020,5 1 006,7 1 002,9 1 066,2Tekstil/Textile 1 031,0 981,7 1 163,1 1 116,8 1 116,9 1 053,7 1 192,2 1 116,8
Kayu/Wood 1 025,9 1 059,5 1 069,3 1 118,6 1 001,6 1 114,6 1 157,6 1 241,9
Kertas dan KimiaPaper and Chemicals
1 219,4 1 181,9 1 169,3 1 251,3 1 233,9 1 250,7 1 396,9 1 389,0
Mineral Nonlogam dan LogamNon-metallic Mineral and Metals
1 027,4 938,0 910,1 979,4 1 008,7 1 136,6 1 163,1 1 183,8
Lainnya/Others 1 442,0 1 500,8 1 559,5 1 513,3 1 462,4 1406,5 1526,0 1 529,2
Catatan/Note: x Angka sementara/Preliminary figures xxAngka sangat sementara/Very preliminary figures 1 100 Pekerja atau lebih/100 Workers or more 2 20–99 Pekerja/20–99 Workers Masing-masing triwulan merujuk pada bulan Maret, Juni, September, dan Desember Each quarter refers to March, June, September, and December, respectively
http
://www.b
ps.g
o.id
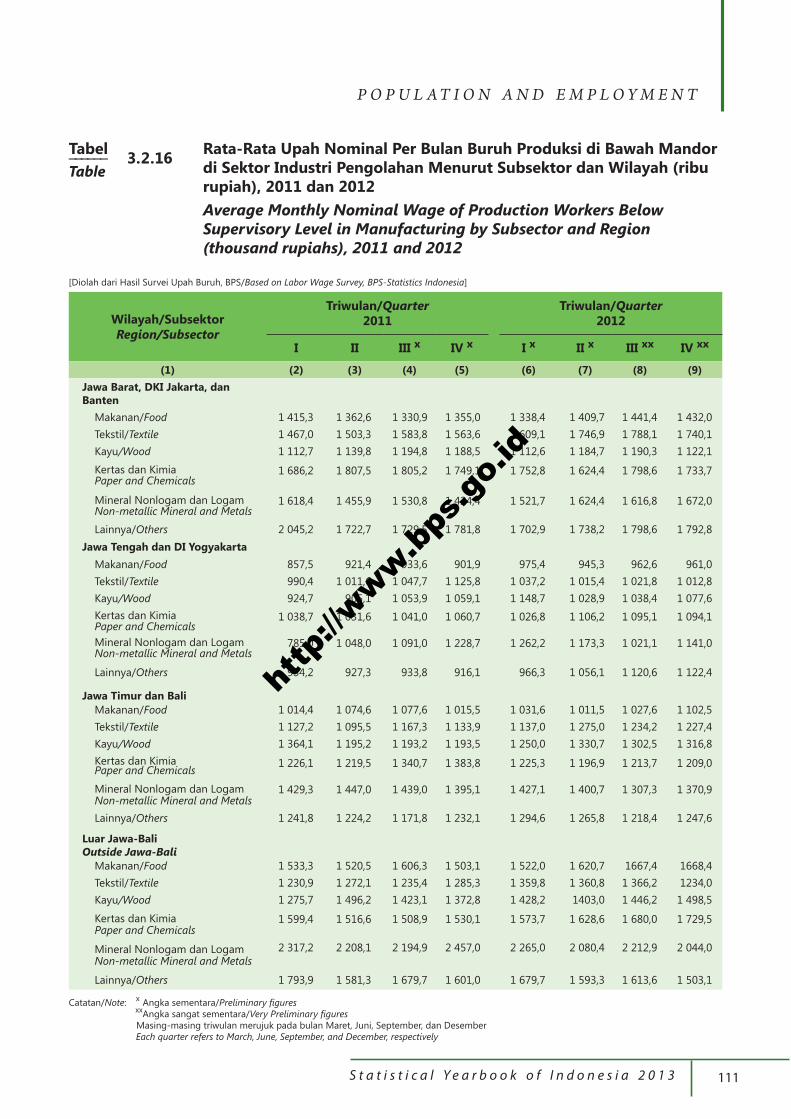
P O P U L A T I O N A N D E M P L O Y M E N T
S t a t i s t i c a l Y e a r b o o k o f I n d o n e s i a 2 0 1 3 111
Rata-Rata Upah Nominal Per Bulan Buruh Produksi di Bawah Mandor di Sektor Industri Pengolahan Menurut Subsektor dan Wilayah (ribu rupiah), 2011 dan 2012Average Monthly Nominal Wage of Production Workers Below Supervisory Level in Manufacturing by Subsector and Region (thousand rupiahs), 2011 and 2012
Tabel –––––– 3.2.16Table
[Diolah dari Hasil Survei Upah Buruh, BPS/Based on Labor Wage Survey, BPS-Statistics Indonesia]
Wilayah/SubsektorRegion/Subsector
Triwulan/Quarter2011
Triwulan/Quarter2012
I II III x IV x I x II x III xx IV xx
(1) (2) (3) (4) (5) (6) (7) (8) (9)Jawa Barat, DKI Jakarta, dan Banten
Makanan/Food 1 415,3 1 362,6 1 330,9 1 355,0 1 338,4 1 409,7 1 441,4 1 432,0Tekstil/Textile 1 467,0 1 503,3 1 583,8 1 563,6 1 609,1 1 746,9 1 788,1 1 740,1Kayu/Wood 1 112,7 1 139,8 1 194,8 1 188,5 1 112,6 1 184,7 1 190,3 1 122,1
Kertas dan KimiaPaper and Chemicals
1 686,2 1 807,5 1 805,2 1 749,1 1 752,8 1 624,4 1 798,6 1 733,7
Mineral Nonlogam dan LogamNon-metallic Mineral and Metals
1 618,4 1 455,9 1 530,8 1 424,4 1 521,7 1 624,4 1 616,8 1 672,0
Lainnya/Others 2 045,2 1 722,7 1 729,5 1 781,8 1 702,9 1 738,2 1 798,6 1 792,8Jawa Tengah dan DI Yogyakarta
Makanan/Food 857,5 921,4 933,6 901,9 975,4 945,3 962,6 961,0Tekstil/Textile 990,4 1 011,6 1 047,7 1 125,8 1 037,2 1 015,4 1 021,8 1 012,8Kayu/Wood 924,7 905,1 1 053,9 1 059,1 1 148,7 1 028,9 1 038,4 1 077,6Kertas dan KimiaPaper and Chemicals
1 038,7 1 031,6 1 041,0 1 060,7 1 026,8 1 106,2 1 095,1 1 094,1
Mineral Nonlogam dan LogamNon-metallic Mineral and Metals
785,0 1 048,0 1 091,0 1 228,7 1 262,2 1 173,3 1 021,1 1 141,0
Lainnya/Others 934,2 927,3 933,8 916,1 966,3 1 056,1 1 120,6 1 122,4
Jawa Timur dan BaliMakanan/Food 1 014,4 1 074,6 1 077,6 1 015,5 1 031,6 1 011,5 1 027,6 1 102,5Tekstil/Textile 1 127,2 1 095,5 1 167,3 1 133,9 1 137,0 1 275,0 1 234,2 1 227,4Kayu/Wood 1 364,1 1 195,2 1 193,2 1 193,5 1 250,0 1 330,7 1 302,5 1 316,8Kertas dan KimiaPaper and Chemicals
1 226,1 1 219,5 1 340,7 1 383,8 1 225,3 1 196,9 1 213,7 1 209,0
Mineral Nonlogam dan LogamNon-metallic Mineral and Metals
1 429,3 1 447,0 1 439,0 1 395,1 1 427,1 1 400,7 1 307,3 1 370,9
Lainnya/Others 1 241,8 1 224,2 1 171,8 1 232,1 1 294,6 1 265,8 1 218,4 1 247,6
Luar Jawa-BaliOutside Jawa-Bali
Makanan/Food 1 533,3 1 520,5 1 606,3 1 503,1 1 522,0 1 620,7 1667,4 1668,4Tekstil/Textile 1 230,9 1 272,1 1 235,4 1 285,3 1 359,8 1 360,8 1 366,2 1234,0Kayu/Wood 1 275,7 1 496,2 1 423,1 1 372,8 1 428,2 1403,0 1 446,2 1 498,5
Kertas dan KimiaPaper and Chemicals
1 599,4 1 516,6 1 508,9 1 530,1 1 573,7 1 628,6 1 680,0 1 729,5
Mineral Nonlogam dan LogamNon-metallic Mineral and Metals
2 317,2 2 208,1 2 194,9 2 457,0 2 265,0 2 080,4 2 212,9 2 044,0
Lainnya/Others 1 793,9 1 581,3 1 679,7 1 601,0 1 679,7 1 593,3 1 613,6 1 503,1
Catatan/Note: x Angka sementara/Preliminary figures xxAngka sangat sementara/Very Preliminary figures Masing-masing triwulan merujuk pada bulan Maret, Juni, September, dan Desember Each quarter refers to March, June, September, and December, respectively
http
://www.b
ps.g
o.id

P E N D U D U K D A N K E T E N A G A K E R J A A N
S t a t i s t i k I n d o n e s i a 2 0 1 3112
ProvinsiProvince 2006 2007 2008 2009 2010 2011 2012
(1) (2) (3) (4) (5) (6) (7) (8)Aceh 820 000 850 000 1 000 000 1 200 000 1 300 000 1 350 000 1 400 000Sumatera Utara 737 794 761 000 822 205 905 000 965 000 1 035 500 1 200 000Sumatera Barat 650 000 750 000 800 000 880 000 940 000 1 055 000 1 150 000Riau 637 000 710 000 800 000 901 600 1 016 000 1 120 000 1 238 000Kepulauan Riau 760 000 805 000 833 000 892 000 925 000 975 000 1 015 000Jambi 563 000 658 000 724 000 800 000 900 000 1 028 000 1 142 500
Sumatera Selatan 604 000 662 000 743 000 824 730 927 825 1 048 440 1 195 220
Kepulauan Bangka Belitung 640 000 720 000 813 000 850 000 910 000 1 024 000 1 110 000Bengkulu 516 000 644 838 683 528 735 000 780 000 815 000 930 000Lampung 505 000 555 000 617 000 691 000 767 500 855 000 975 000
DKI Jakarta 819 100 900 560 972 604 1 069 865 1 118 009 1 290 000 1 529 150Jawa Barat 447 654 516 840 568 193 628 191 671 500 732 000 780 000 1
Banten 661 613 746 500 837 000 917 500 955 300 1 000 000 1 042 000Jawa Tengah 450 000 500 000 547 000 575 000 660 000 675 000 765 000 1
DI Yogyakarta 460 000 500 000 586 000 700 000 745 694 808 000 892 660Jawa Timur 390 000 448 500 500 000 570 000 630 000 705 000 745 000 1
Bali 510 000 622 000 682 650 760 000 829 316 890 000 967 500Nusa Tenggara Barat 550 000 645 000 730 000 832 500 890 775 950 000 1 000 000Nusa Tenggara Timur 550 000 600 000 650 000 725 000 800 000 850 000 925 000
Kalimantan Barat 512 000 560 000 645 000 705 000 741 000 802 500 900 000Kalimantan Tengah 634 260 665 973 765 868 873 089 986 590 1 134 580 1 327 459Kalimantan Selatan 629 000 745 000 825 000 930 000 1 024 500 1 126 000 1 225 000Kalimantan Timur 701 640 766 500 815 000 955 000 1 002 000 1 084 000 1 177 000
Sulawesi Utara 713 500 750 000 845 000 929 500 1 000 000 1 050 000 1 250 000Gorontalo 527 000 560 000 600 000 675 000 710 000 762 500 837 500Sulawesi Tengah 575 000 615 000 670 000 720 000 777 500 827 500 885 000Sulawesi Selatan 612 000 673 200 740 520 905 000 1 000 000 1 100 000 1 200 000Sulawesi Barat 612 000 691 464 760 500 909 400 944 200 1 006 000 1 127 000Sulawesi Tenggara 573 400 640 000 700 000 770 000 860 000 930 000 1 032 300
Maluku 575 000 635 000 700 000 775 000 840 000 900 000 975 000Maluku Utara 528 000 660 000 700 000 770 000 847 000 889 350 960 498Papua 822 500 987 000 1 105 500 1 216 100 1 316 500 1 403 000 1 585 000Papua Barat 822 500 987 000 1 105 500 1 180 000 1 210 000 1 410 000 1 450 000
Indonesia 602 702 673 261 743 174 841 529 908 824 988 829 1 088 903 r
Tabel –––––– 3.2.17Table
Upah Minimum Provinsi (UMP) Per Bulan, 2006–2012Provincial Minimum Wage per Month, 2006–2012
Catatan/Note: r Angka diperbaiki/Revised figures 1 Provinsi Jawa Barat, Jawa Tengah, dan Jawa Timur baru menetapkan UMP tahun 2012 pada tahun 2013 Jawa Barat, Jawa Tengah, and Jawa Timur Provinces set the 2012 Minimum Wage per Month in 2013
Sumber/Source: Kementerian Tenaga Kerja dan Transmigrasi/Ministry of Manpower and Transmigration
http
://www.b
ps.g
o.id
4SOSIAL DANKESEJAHTERAAN RAKYAT
Social and Welfarehttp
://www.b
ps.g
o.id

http
://www.b
ps.g
o.id
S O C I A L A N D W E L F A R E
S t a t i s t i c a l Y e a r b o o k o f I n d o n e s i a 2 0 1 3 115
PENJELASAN TEKNIS
1. Tidak/belum pernah sekolah adalah mereka yang tidak pernah atau belum pernah terdaftar dan tidak pernah atau belum pernah aktif mengikuti pendidikan di suatu jenjang pendidikan formal. Termasuk juga yang tamat/belum tamat taman kanak-kanak tetapi tidak melanjutkan ke sekolah dasar.
2. Masih bersekolah adalah mereka yang terdaftar dan aktif mengikuti pendidikan formal dan nonformal (Paket A, B, atau C), baik pendidikan dasar, menengah maupun pendidikan tinggi. Bagi mahasiswa yang sedang cuti dianggap masih bersekolah.
3. Tidak bersekolah lagi adalah mereka yang pernah terdaftar dan aktif mengikuti pendidikan di suatu jenjang pendidikan formal dan nonformal (Paket A, B, atau C), tetapi pada saat pencacahan tidak lagi terdaftar dan tidak aktif mengikuti pendidikan.
4. Tamat sekolah adalah menyelesaikan pelajaran yang ditandai dengan lulus ujian akhir pada kelas atau tingkat terakhir suatu jenjang pendidikan di sekolah negeri maupun swasta dengan mendapatkan tanda tamat belajar/ijazah. Seseorang yang belum mengikuti pelajaran pada kelas tertinggi tetapi telah mengikuti ujian akhir dan lulus dianggap tamat sekolah.
5. Dapat membaca dan menulis artinya dapat membaca dan menulis kata-kata/kalimat sederhana dengan suatu aksara tertentu.
6. Sekolah adalah lembaga pendidikan formal yang dimulai dari pendidikan dasar, menengah, dan tinggi. Pendidikan yang dicatat adalah pendidikan formal berdasar kurikulum Kementerian Pendidikan dan Kebudayaan, termasuk pendidikan yang diselenggarakan oleh pondok pesantren dengan memakai kurikulum Kementerian Pendidikan dan Kebudayaan, seperti madrasah ibtidaiyah (MI), madrasah tsanawiyah (MTs), dan madrasah aliyah (MA). Pondok pesantren/madrasah diniyah adalah sekolah yang tidak memakai kurikulum dari Kementerian Pendidikan dan Kebudayaan.
TECHNICAL NOTES
1. Not/never attending school is someone who has never attended or never been registered in a formal education, such as primary, secondary, and tertiary education. Those who just completed kindergarten are considered as never attended school.
2. Attending school is someone who is currently attending primary, secondary, or tertiary education, including package A, package B, or package C. College student who postpones his/her study is considered as attending school.
3. Not attending school anymore is someone who had enrolled and participated in formal and non-formal education in the past including package A, package B, or packace C, but currently does nat attend school.
4. Completed particular level of education is someone who has completed particular level of education in private or public school and accepting graduation certificate. Someone who has never attended the highest grade but passed the final exam is considered as completed particular level of education.
5. Able to read and write is the ability to read and write a simple sentence in any letter of alphabets.
6. School is a formal education institution starting from primary, secondary, and tertiary education. The education data recorded in the survey covering data on formal education based on the curriculum set up by Ministry of Education and Culture including education carried out by muslim boarding school (pondok pesantren) implementing the Ministry of Education and Culture curriculum, such as madrasah ibtidaiyah (islamic primary school), madrasah tsanawiyah (islamic junior high school), and madrasah aliyah (islamic senior high school). Pondok pesantren/madrasah diniyah (islamic boarding school/islamic school) is school which does not implement curriculum from the Ministry of Education and Culture.
http
://www.b
ps.g
o.id
S O S I A L D A N K E S E J A H T E R A A N R A K Y A T
S t a t i s t i k I n d o n e s i a 2 0 1 3116
7. Madrasah ibtidaiyah adalah lembaga pendidikan berciri khas Islam pada jenjang sekolah dasar (SD). Madrasah tsanawiyah adalah lembaga pendidikan berciri khas Islam pada jenjang sekolah menengah pertama (SMP), madrasah aliyah adalah lembaga pendidikan berciri khas Islam pada jenjang sekolah menengah atas (SMA).
8. Rumah sakit (RS) adalah tempat pemeriksaan dan perawatan kesehatan, biasanya berada di bawah pengawasan dokter/tenaga medis, termasuk rumah sakit khusus seperti rumah sakit perawatan paru-paru dan RS jantung.
9. Rumah sakit bersalin/rumah bersalin adalah rumah sakit yang dilengkapi dengan fasilitas untuk melahirkan, pemeriksaan kehamilan, pemeriksaan ibu dan anak serta berada di bawah pengawasan dokter dan atau bidan senior.
10. Poliklinik adalah tempat pemeriksaan kesehatan, biasanya tanpa fasilitas perawatan menginap, berada di bawah pengawasan dokter/tenaga medis, tidak termasuk klinik yang terdapat di pusat kesehatan masyarakat (puskesmas)/rumah sakit. Poliklinik yang karena satu dan lain hal menyediakan tempat perawatan menginap, tetap digolongkan ke dalam poliklinik (bukan rumah sakit).
11. Pusat kesehatan masyarakat (Puskesmas) adalah unit pelayanan kesehatan milik pemerintah yang bertanggung jawab terhadap pelayanan kesehatan masyarakat untuk wilayah kecamatan, sebagian kecamatan, atau kelurahan. Tim puskesmas sesuai jadwal dapat melakukan kegiatan puskesmas keliling ke tempat-tempat tertentu dalam wilayah kerjanya, untuk mendekatkan pelayanan dengan masyarakat.
12. Puskesmas pembantu (Pustu) yaitu unit pelayanan kesehatan masyarakat yang membantu kegiatan puskesmas di sebagian dari wilayah kerja. Pada beberapa daerah balai pengobatan telah berubah fungsi menjadi pustu walaupun papan nama masih tertulis balai pengobatan.
13. Apotek adalah tempat penjualan obat yang mempunyai izin operasi dari Kementerian Kesehatan, u.p. Badan POM, di bawah pengawasan apoteker.
7. Madrasah ibtidaiyah is islamic school at primary education. Madrasah tsanawiyah is islamic school at lower secondary education and madrasah aliyah is islamic school at higher secondary education.
8 Hospital is a place for health check, usually controlled/supervised by doctors/medical personnel. Including in this category are special hospitals such lung hospital and coronary hospital.
9. Maternity hospital/maternal health care center is a hospital completed with health facilities for birth delivery, pregnancy check and consultation, and post-natal check, under the supervision of doctor and or senior midwives.
10. Polyclinic is a place for health check and consultation usually under the control of doctor/medical personnel without in-patient facilities, excluding clinic located in the public health center (PHC)/hospital. In the case of polyclinic that provides in-patient facilities due to a special reason, it remains to be classified as a polyclinic (not hospital).
11. Public health center (PHC) is a health centre provided by the government that is responsible for the delivery of health services to the community at the subdistrict level, part of subdistrict or villages. Officials in the PHC as scheduled can provide health services in their working areas in the effort of closing their services to the community through mobile PHC program.
12. Subsidiary of public health center is a health facility that assists the public health centre in its part of working area. In several regions, health check points (balai pengobatan) has changes their status into subsidiary public health centre, although their sign written in the board remains unchanged.
13. Pharmacy is a place of selling medicines having permit operation from the Ministry of Health, through The National Agency of Drug and Food Control, under the control of pharmacist.
http
://www.b
ps.g
o.id
S O C I A L A N D W E L F A R E
S t a t i s t i c a l Y e a r b o o k o f I n d o n e s i a 2 0 1 3 117
14. Imunisasi adalah memasukkan kuman atau racun penyakit tertentu yang sudah dilemahkan (vaksin) ke dalam tubuh dengan cara disuntik atau diminum (diteteskan dalam mulut) dengan maksud agar terjadi kekebalan tubuh terhadap penyakit tersebut.
15. Keluhan kesehatan adalah keadaan seseorang yang mengalami gangguan kesehatan atau kejiwaan, baik karena penyakit akut, penyakit kronis, kecelakaan, kriminal, atau hal lain.
16. Mengobati sendiri adalah upaya oleh anggota rumah tangga/keluarga dengan melakukan pengobatan sendiri tanpa datang ke tempat fasilitas kesehatan atau memanggil dokter/petugas kesehatan ke rumahnya (misal minum obat modern, jamu, kerokan, kompres, kop, pijat) agar sembuh atau menjadi lebih ringan keluhan kesehatannya.
17. Angka penemuan kasus tuberkulosis adalah jumlah kasus baru tuberkulosis (TB) dan kasus TB yang didiagnosis kambuh yang diobati dalam program penanggulangan TB nasional dan dilaporkan kepada WHO, dibagi dengan perkiraan WHO terhadap jumlah kasus insiden tuberkulosis pada tahun yang sama, dinyatakan sebagai persentase.
18. Angka keberhasilan pengobatan tuberkulosis smear positive/Basil Tahan Asam (BTA) positif adalah proporsi (dinyatakan sebagai persentase) kasus TB BTA positif yang terdaftar di bawah program pengendalian TB nasional pada tahun tertentu dimana dinyatakan berhasil menyelesaikan pengobatan. Dengan atau tanpa bukti bakteriologi keberhasilan (“sembuh” dan “menyelesaikan pengobatan” masing-masing).
19. Kasus kumulatif AIDS adalah kumulatif kasus AIDS sampai dengan referensi waktu tertentu.
20. Luas lantai adalah luas lantai yang ditempati dan digunakan untuk keperluan sehari-hari (sebatas atap).
21. Air leding adalah sumber air yang berasal dari air yang telah melalui proses penjernihan dan penyehatan sebelum dialirkan kepada konsumen melalui instalasi berupa saluran air. Sumber air ini biasanya diusahakan oleh PAM/PDAM/BPAM.
14. Immunization is putting enervated microbe of a certain disease into human body by injection or drinking (dropping into mouth) to make the body immune to that disease.
15. Health complaint is a condition where a person has health or mental problems because of acute illness, chronically illness, accident, crimes, or others.
16. Self treatment is an effort of household members/family to have a health treatment by themselves without visiting health facilities or a doctor/health personnel ( for instance, by taking modern medicine, herb medicine, chief with a coin, compress, cupping suction, massage) in order to recover from illness or reduce the health complaint.
17. The case detection rate for all forms of tuberculosis is the number of new and replase tuberculosis cases diagnosed and treated in national tuberculosis control programmes and notified to WHO, divided by WHO’s estimate of the number of incident tuberculosis cases for the same year, expressed as a percentage.
18. The treatment success rate for new pulmonary smear-positive tuberculosis cases is the proportion (expressed as a percentage) of new smear-positive tuberculosis cases registered under a national tuberculosis control programme in a given year that succesfully completed treatment. With or without bacteriological evidence of succes (“cured” and “treatment completed” respectively).
19. Cummulative AIDS case is cummulative AIDS cases with reference to a particular time.
20. Floor area is the total area which is occupied and utilized daily.
21. Pipe water is refined water distributed by water refinery company.
http
://www.b
ps.g
o.id
S O S I A L D A N K E S E J A H T E R A A N R A K Y A T
S t a t i s t i k I n d o n e s i a 2 0 1 3118
22. Sumur terlindung adalah air yang berasal dari dalam tanah yang digali dan lingkar sumur tersebut dilindungi oleh tembok paling sedikit 0,8 meter di atas tanah dan 3 meter ke bawah tanah, serta ada lantai semen sejauh 1 meter dari lingkar sumur.
23. Status penguasaan bangunan tempat tinggal milik sendiri adalah jika tempat tinggal tersebut pada waktu pencacahan betul-betul sudah milik kepala rumah tangga atau salah seorang anggota rumah tangga. Rumah yang dibeli secara angsuran melalui kredit bank atau rumah dengan status sewa beli dianggap rumah milik sendiri.
24. Peristiwa tindak pidana yang dilaporkan ialah setiap peristiwa yang diterima kepolisian dari laporan masyarakat, atau peristiwa dimana pelakunya tertangkap tangan oleh kepolisian.
25. Jumlah tindak pidana menggambarkan jumlah kasus tindak pidana yang terjadi pada kurun waktu tertentu.
26. Resiko penduduk terjadi tindak pidana per 100.000 penduduk
Jumlah peristiwa tindak pidana tahun t = __________________________ x 100.000 Jumlah penduduk tahun t
Resiko penduduk terjadi tindak pidana per 100.000 penduduk mengindikasikan peluang penduduk berisiko terkena tindak pidana. Biasanya dinyatakan dalam setiap 100.000 penduduk.
27. Selang waktu terjadi tindak pidana tahun t
365 x 24 x 60 x 60 = _________________________
x (detik) Jumlah peristiwa tindak pidana tahun t
Selang waktu terjadi tindak pidana tahun t mengindikasikan selang waktu terjadinya satu tindak kejahatan dengan kejahatan yang lain.
28. Persentase penyelesaian tindak pidana
Jumlah peristiwa tindak pidana yang diselesaikan =
_____________________________ x 100% Jumlah peristiwa tindak pidana yang dilaporkan
22. Protected wells is water that comes from the soil were excavated and the circumference of the well was protected by walls at least 0.8 meters above ground and 3 meters underground, and cement floor as far as 1 meter from the well circumference.
23. Own ownership property status is a status of dwelling occupied belongs to the head of household or one of the household member. Houses bought through bank credit or houses with leasing status were also categorized as an own property.
24. Reported crime incidence includes all criminal cases reported and received by police office, and all crimes caught by police.
25. Crime total refers to the number of criminal cases occurring during a given period.
26. Crime rate
Number of criminal cases year t =
______________________ x 100,000
Total population year t
Crime rate indicates the probability of population exposed to risk of crime, expressed in every 100,000 people.
27. Crime clock
365 x 24 x 60 x 60 =
____________________ x (second)
Number of criminal cases year t
Crime clock indicates the time interval of occurrence between one crime to another crime.
28. Crime clearance rate
Number of cleared criminal cases =
_______________________ x 100%
Number of reported criminal cases
http
://www.b
ps.g
o.id

S O C I A L A N D W E L F A R E
S t a t i s t i c a l Y e a r b o o k o f I n d o n e s i a 2 0 1 3 119
Persentase penyelesaian peristiwa tindak pidana menyatakan persentase penyelesaian tindak pidana oleh polisi. Suatu tindak pidana dinyatakan sebagai kasus yang selesai di tingkat kepolisian, apabila:1. berkas perkaranya sudah siap untuk diserahkan
atau telah diserahkan kepada kejaksaan;2. dalam hal delik aduan, pengaduannya dicabut
dalam tenggang waktu yang telah ditentukan menurut undang-undang;
3. telah diselesaikan oleh kepolisian berdasarkan azas plichmatigheid (kewajiban berdasarkan kewenangan hukum);
4. kasus yang dimaksud tidak termasuk kompetensi kepolisian;
5. tersangka meninggal dunia;6. kasus kadaluwarsa.
29. Bencana alam adalah bencana yang diakibatkan oleh peristiwa atau serangkaian peristiwa yang disebabkan oleh alam, antara lain berupa gempa bumi, tsunami, gunung meletus, banjir, kekeringan, angin topan, dan tanah longsor (UU No. 24 Tahun 2007).
30. Korban meninggal adalah orang yang dilaporkan tewas atau meninggal dunia akibat bencana.
31. Korban hilang adalah orang yang dilaporkan hilang atau tidak ditemukan atau tidak diketahui keberadaannya setelah terjadi bencana.
32. Korban luka/sakit adalah orang yang mengalami luka-luka atau sakit, dalam keadaan luka ringan, luka sedang maupun luka parah/berat, baik yang berobat jalan maupun rawat inap.
33. Rusak Berat adalah kriteria kerusakan yang mengakibatkan bangunan roboh atau sebagian besar komponen struktur rusak.
34. Rusak sedang adalah kriteria kerusakan yang mengakibatkan sebagian kecil komponen struktur rusak, dan komponen penunjang rusak namun bangunan masih tetap berdiri.
35. Rusak ringan adalah kriteria kerusakan yang mengakibatkan sebagian komponen struktur retak (struktur masih bisa digunakan) dan bangunan masih tetap berdiri.
Crime clearence rate refers to percentage of crime clearance by police. A criminal case is categorized as a cleared case by police, if:
1. All documents are ready to submit or already submitted to justice court;
2. In the case of attense that warrants complaint, the complaint was withdraw within a given period state in the law;
3. The case was cleared by police based on the principle of plichmatigheid (obligation on the basis of law outhority);
4. The case was not the responsibility of police office;5. The suspect died;6. The case was out of date.
29. Natural disaster is a disaster that is caused by a natural occurrence or a series of natural occurrences that includes earthquake, tsunami, vulcanic eruption, flood, drought, cyclone, and landslide (Law No. 24 of 2007).
30. Fatality is a person reported killed or death in the wake of a disaster.
31. Missing person is a person reported missing or who cannot be located or who cannot be accounted for in the wake of a disaster.
32. Casualty is a person suffering injury or illness, in a state of light injury, moderate injury, or heavy injury, which in undergoing treatment as either an outpatient or inpatient.
33. Severely damaged is the criteria of damage that resulted most buildings collapsed or damaged its structural components.
34. Damaged is the criteria of damage that resulted defective fraction of structural components and supporting components damaged, but the building still stands.
35. Lightly damaged is the criteria of damage that resulted partially cracked structural components, but the structure still can be used and the building still stands.
http
://www.b
ps.g
o.id

S O S I A L D A N K E S E J A H T E R A A N R A K Y A T
S t a t i s t i k I n d o n e s i a 2 0 1 3120
36. Badan Pusat Statistik (BPS) pertama kali melakukan penghitungan jumlah dan persentase penduduk miskin pada tahun 1984. Penghitungan jumlah dan persentase penduduk miskin mencakup periode 1976-1981. Data dasar yang digunakan adalah Survei Sosial Ekonomi Nasional (Susenas) Modul Konsumsi. Sejak itu, setiap tiga tahun sekali BPS secara rutin mengeluarkan data jumlah dan persentase penduduk miskin yang disajikan menurut daerah perkotaan dan perdesaan.
37. Sejak tahun 2003, BPS secara rutin mengeluarkan data jumlah dan persentase penduduk miskin setiap tahun. Hal ini bisa terwujud karena sejak tahun 2003 BPS mengumpulkan data Susenas Panel Modul Konsumsi setiap bulan Februari atau Maret. Mulai bulan Maret 2007 jumlah sampel yang digunakan diperbesar dari 10.000 rumahtangga menjadi 68.800 rumahtangga. Maret 2011, jumlah sampel yang digunakan menjadi 75.000 rumah tangga.
38. Estimasi tingkat kemiskinan tahun 2000 dan 2001 untuk level provinsi dan nasional didasarkan atas Susenas Kor. Estimasi tingkat kemiskinan tahun 2003 dan 2004 untuk level provinsi didasarkan atas Susenas Kor, sementara untuk level nasional didasarkan pada Susenas Panel Modul Konsumsi.
39. Untuk provinsi-provinsi yang tidak dicakup dalam sampel Susenas pada tahun 2000-2002 dilakukan estimasi. Data tahun 2000 termasuk estimasi untuk Aceh dan Maluku. Data tahun 2001 termasuk estimasi untuk Provinsi Aceh. Data tahun 2002 termasuk estimasi untuk Provinsi Aceh, Maluku, Maluku Utara, dan Papua.
40. Untuk mengukur kemiskinan, BPS menggunakan konsep kemampuan memenuhi kebutuhan dasar (basic needs approach). Dengan pendekatan ini, kemiskinan dipandang sebagai ketidakmampuan dari sisi ekonomi untuk memenuhi kebutuhan dasar makanan dan bukan makanan yang diukur dari sisi pengeluaran. Metode yang digunakan adalah menghitung Garis Kemiskinan (GK), yang terdiri dari dua komponen yaitu Garis Kemiskinan Makanan (GKM) dan Garis Kemiskinan Non-Makanan (GKNM). Penghitungan Garis Kemiskinan dilakukan secara terpisah untuk daerah perkotaan dan perdesaan.
36. BPS-Statistics Indonesia measured poverty incidence for the first time in 1984. The measurement covered the period of 1976-1981. Basic data used to measure poverty were obtained from the results of the National Socio Economic Survey (Susenas)–Consumption Module. Since then BPS-Statistics Indonesia routinely released the figures of poverty incidence once every three years which were presented by urban and rural areas.
37. BPS-Statistics Indonesia has started to release the figures of poverty incidence annually since 2003. This could be realized because BPS-Statistics Indonesia has started to collect panel data in the implementation of Susenas-Consumption Module every February or March. Starting from March 2007, the number of sample size was enlarged from 10,000 households to 68,800 households. In 2011, the sample size uses further increased to 75,000 households.
38. The estimation of poverty incidence for province and
national levels in 2000 and 2001 was based on Susenas-Core. The estimation of poverty incidence for province level in 2003 and 2004 was also based on Susenas-Core, while the estimation of the national level was based on the Susenas-Consumption Module Panel.
39. For provinces that were not included in the implementation of Susenas during the period 2000-2002, the figures of poverty incidence was estimated. Data in 2000 included the estimation for Aceh and Maluku. Data in 2001 included the estimation for Aceh. Data in 2002 included the estimation for Aceh, Maluku, Maluku Utara, and Papua.
40. To measure poverty, BPS-Statistics Indonesia has used the concept of basic needs approach. Therefore, poverty is viewed as economic inability to fulfill food and non-food basic needs which are measured by consumption/expenditure. The method used is calculating poverty line, which consists of two components that are Food Poverty Line (FPL) and Non-Food Poverty Line (NFPL). The poverty line was calculated separately for urban and rural areas.
http
://www.b
ps.g
o.id

S O C I A L A N D W E L F A R E
S t a t i s t i c a l Y e a r b o o k o f I n d o n e s i a 2 0 1 3 121
41. Penduduk miskin adalah penduduk yang memiliki rata-rata pengeluaran per kapita per bulan di bawah Garis Kemiskinan.
42. Garis Kemiskinan Makanan (GKM) merupakan nilai pengeluaran kebutuhan minimum makanan yang disetarakan dengan 2.100 kkalori per kapita per hari. Garis Kemiskinan Non-Makanan (GKNM) adalah kebutuhan minimum untuk perumahan, sandang, pendidikan, kesehatan, dan kebutuhan dasar lainnya.
43. Sejak Desember 1998 digunakan standar kemiskinan
baru yang merupakan penyempurnaan standar yang lama. Penyempurnaan standar ini meliputi perluasan cakupan komoditi yang diperhitungkan dalam kebutuhan dasar. Disamping itu penyempurnaan juga dilakukan dengan mempertimbangkan keterbandingan antardaerah (provinsi serta perkotaan-perdesaan) dan antarwaktu yang disebabkan oleh adanya perbedaan tingkat harga antardaerah yaitu dengan cara melakukan standardisasi harga terhadap harga di DKI Jakarta. Penyempurnaan standar kemiskinan ini diharapkan dapat mengukur tingkat kemiskinan secara lebih realistis.
44. Ukuran Kemiskinana. Head Count Index (HCI-P0) adalah persentase
penduduk miskin yang berada di bawah Garis Kemiskinan (GK).
b. Indeks Kedalaman Kemiskinan (Poverty Gap Index-P1) merupakan ukuran rata-rata kesenjangan pengeluaran masing-masing penduduk miskin terhadap garis kemiskinan. Semakin tinggi nilai indeks, semakin jauh rata-rata pengeluaran penduduk dari garis kemiskinan.
c. Indeks Keparahan Kemiskinan (Poverty Severity Index-P2) memberikan gambaran mengenai penyebaran pengeluaran di antara penduduk miskin. Semakin tinggi nilai indeks, semakin tinggi ketimpangan pengeluaran di antara penduduk miskin.
41. A person whose expenditure per capita per month is below the poverty line is considered to be poor.
42. The Food Poverty Line refers to the daily minimum requirement of 2,100 kcal per capita per day. The Non-Food Poverty Line refers to the minimum requirement for household necessities for clothing, education, health, and other basic individual needs.
43. A new standard to measure poverty has been adopted since December 1998. This new standard was the revision of the old standard. The revised standard included the extension of the commodity coverage to be accounted in estimating the minimum basic needs. The new standard was also improved in its regional comparability, by using the reference population of the same real income (expenditure) class across regions so that it is also comparable over time. The revised poverty standard hopefully was able to measure the incidence of poverty more realistically.
44. Poverty Measuresa. Head Count Index (HCI-P0) simply measures the
percentage of the population that is counted as poor, often denoted by P0.
b. Poverty Gap Index-P1 measures the extent to which individuals fall below the poverty line (the poverty gaps) as a proportion of the poverty line. Higher value of the index shows that the gap between average expenditure of the poor and the poverty line is wider.
c. Poverty Severity Index-P2 describes inequality among the poor. This is simply a weighted sum of poverty gaps (as a proportion of the poverty line), where the weights are the proportionate poverty gaps themselves. Hence, by squaring the poverty gap index, the measure implicitly puts more weight on observations that fall well below the poverty line. Higher value of the index shows that inequality among the poor is higher.
http
://www.b
ps.g
o.id

S O S I A L D A N K E S E J A H T E R A A N R A K Y A T
S t a t i s t i k I n d o n e s i a 2 0 1 3122
Foster-Greer-Thorbecke (1984) merumuskan suatu ukuran yang digunakan untuk mengukur tingkat kemiskinan sebagai berikut:
dimana:a = 0, 1, 2z = Garis kemiskinanyi = Rata-rata pengeluaran perkapita sebulan
penduduk yang berada di bawah garis kemiskinan (i=1,2,…,q), yi < z
q = Banyaknya penduduk yang berada di bawah garis kemiskinan
n = Jumlah penduduk
Jika a=0, diperoleh Head Count Index (P0), jika a=1 diperoleh indeks kedalaman kemiskinan (Poverty Gap Index-P1) dan jika a=2 disebut indeks keparahan kemiskinan (Poverty Severity Index-P2).
Foster-Greer-Thorbecke (1984) developed poverty measures that may be written as:
where:a = 0, 1, 2z = the poverty lineyi = Average expenditure per capita per month of the
poor (i=1,2,…,q), yi < zq = the number of poorn = the total population
if a=0 is obtained Head Count Index (P0), if a=1 is obtained Poverty Gap Index-P1 , and if a=2 is obtained Poverty Severity Index-P2 .
http
://www.b
ps.g
o.id
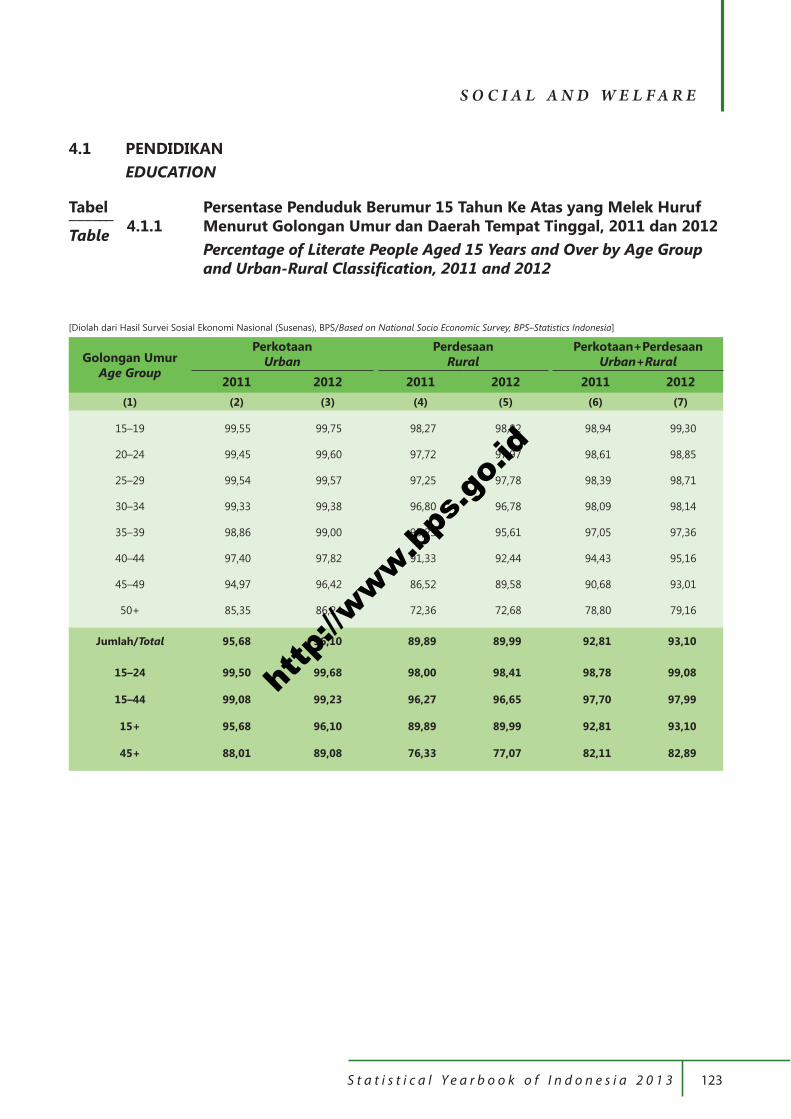
S O C I A L A N D W E L F A R E
S t a t i s t i c a l Y e a r b o o k o f I n d o n e s i a 2 0 1 3 123
Persentase Penduduk Berumur 15 Tahun Ke Atas yang Melek Huruf Menurut Golongan Umur dan Daerah Tempat Tinggal, 2011 dan 2012Percentage of Literate People Aged 15 Years and Over by Age Group and Urban-Rural Classification, 2011 and 2012
Tabel ––––––
4.1.1Table
4.1 PENDIDIKANEDUCATION
[Diolah dari Hasil Survei Sosial Ekonomi Nasional (Susenas), BPS/Based on National Socio Economic Survey, BPS–Statistics Indonesia]
Golongan UmurAge Group
Perkotaan Urban
Perdesaan Rural
Perkotaan+Perdesaan Urban+Rural
2011 2012 2011 2012 2011 2012(1) (2) (3) (4) (5) (6) (7)
15–19 99,55 99,75 98,27 98,82 98,94 99,30
20–24 99,45 99,60 97,72 97,97 98,61 98,85
25–29 99,54 99,57 97,25 97,78 98,39 98,71
30–34 99,33 99,38 96,80 96,78 98,09 98,14
35–39 98,86 99,00 95,23 95,61 97,05 97,36
40–44 97,40 97,82 91,33 92,44 94,43 95,16
45–49 94,97 96,42 86,52 89,58 90,68 93,01
50+ 85,35 86,24 72,36 72,68 78,80 79,16
Jumlah/Total 95,68 96,10 89,89 89,99 92,81 93,10
15–24 99,50 99,68 98,00 98,41 98,78 99,08
15–44 99,08 99,23 96,27 96,65 97,70 97,99
15+ 95,68 96,10 89,89 89,99 92,81 93,10
45+ 88,01 89,08 76,33 77,07 82,11 82,89
http
://www.b
ps.g
o.id
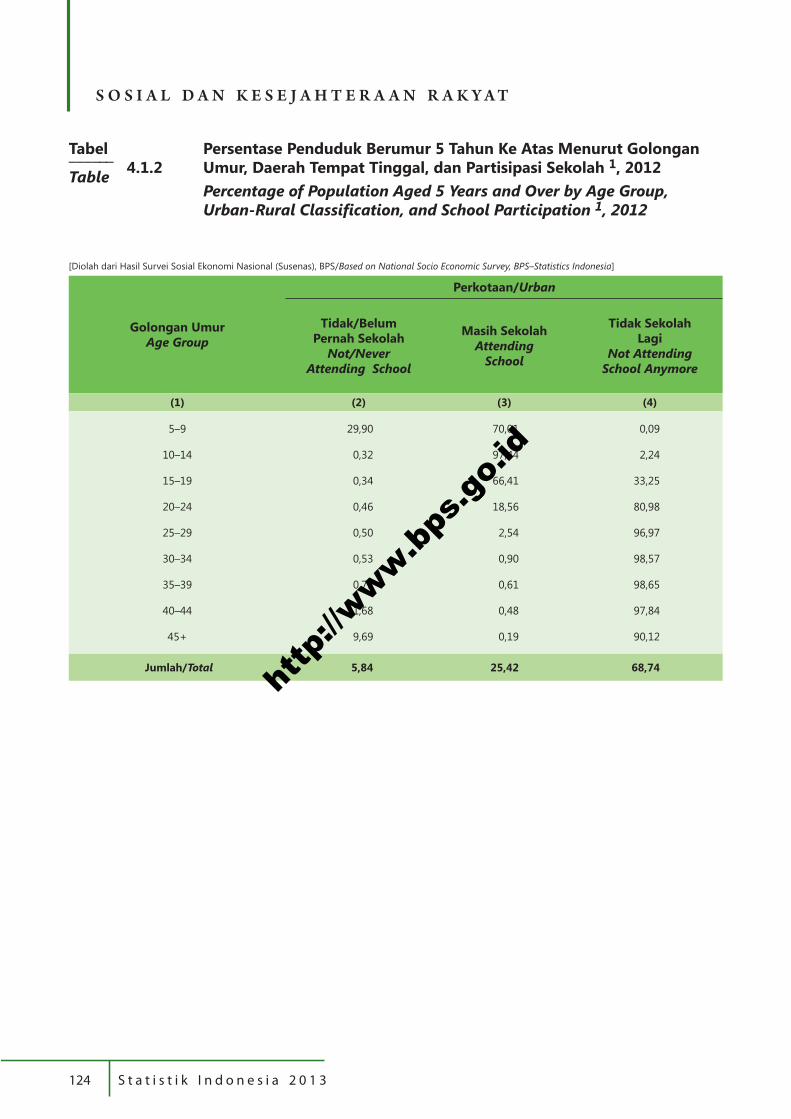
S O S I A L D A N K E S E J A H T E R A A N R A K Y A T
S t a t i s t i k I n d o n e s i a 2 0 1 3124
Persentase Penduduk Berumur 5 Tahun Ke Atas Menurut Golongan Umur, Daerah Tempat Tinggal, dan Partisipasi Sekolah 1, 2012Percentage of Population Aged 5 Years and Over by Age Group, Urban-Rural Classification, and School Participation 1, 2012
Tabel ––––––
4.1.2Table
[Diolah dari Hasil Survei Sosial Ekonomi Nasional (Susenas), BPS/Based on National Socio Economic Survey, BPS–Statistics Indonesia]
Golongan Umur Age Group
Perkotaan/Urban
Tidak/BelumPernah Sekolah
Not/NeverAttending School
Masih SekolahAttending
School
Tidak Sekolah Lagi
Not Attending School Anymore
(1) (2) (3) (4)
5–9 29,90 70,01 0,09
10–14 0,32 97,44 2,24
15–19 0,34 66,41 33,25
20–24 0,46 18,56 80,98
25–29 0,50 2,54 96,97
30–34 0,53 0,90 98,57
35–39 0,73 0,61 98,65
40–44 1,68 0,48 97,84
45+ 9,69 0,19 90,12
Jumlah/Total 5,84 25,42 68,74http
://www.b
ps.g
o.id
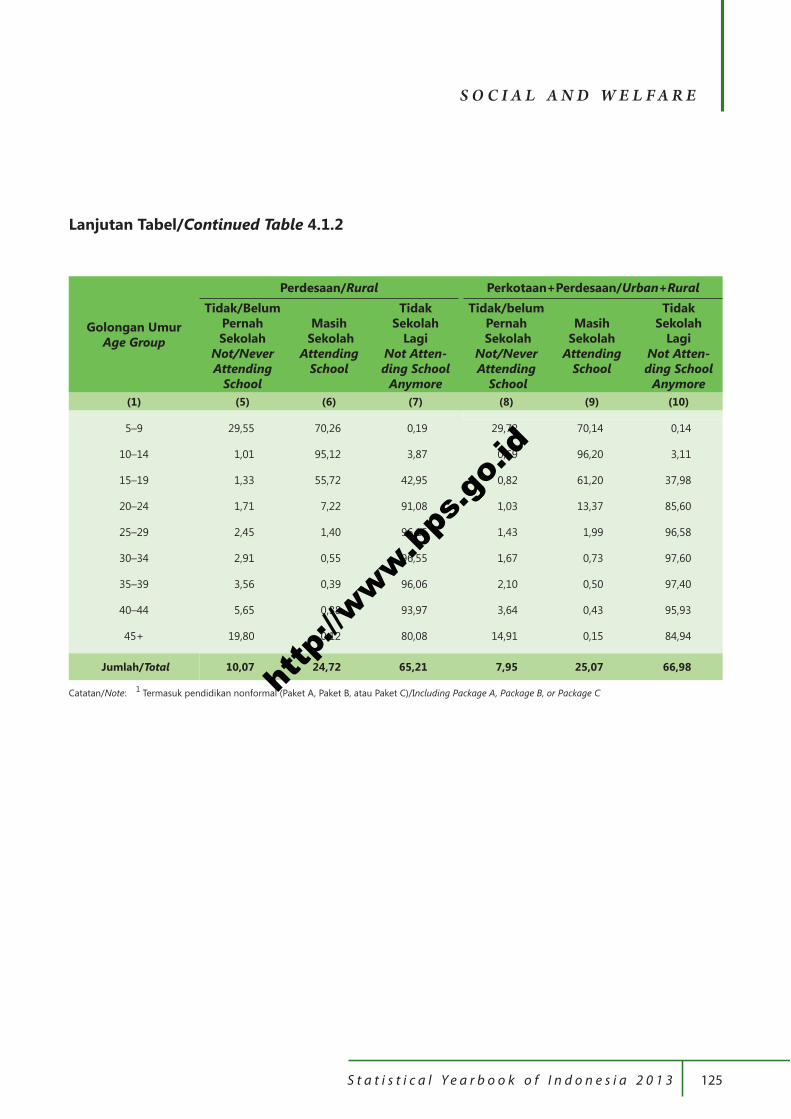
S O C I A L A N D W E L F A R E
S t a t i s t i c a l Y e a r b o o k o f I n d o n e s i a 2 0 1 3 125
Lanjutan Tabel/Continued Table 4.1.2
Golongan Umur Age Group
Perdesaan/Rural Perkotaan+Perdesaan/Urban+RuralTidak/Belum
Pernah Sekolah
Not/NeverAttending
School
Masih Sekolah
AttendingSchool
Tidak Sekolah
LagiNot Atten-ding School
Anymore
Tidak/belumPernah
SekolahNot/NeverAttending
School
Masih Sekolah
AttendingSchool
Tidak Sekolah
LagiNot Atten-ding School
Anymore (1) (5) (6) (7) (8) (9) (10)
5–9 29,55 70,26 0,19 29,72 70,14 0,14
10–14 1,01 95,12 3,87 0,69 96,20 3,11
15–19 1,33 55,72 42,95 0,82 61,20 37,98
20–24 1,71 7,22 91,08 1,03 13,37 85,60
25–29 2,45 1,40 96,15 1,43 1,99 96,58
30–34 2,91 0,55 96,55 1,67 0,73 97,60
35–39 3,56 0,39 96,06 2,10 0,50 97,40
40–44 5,65 0,38 93,97 3,64 0,43 95,93
45+ 19,80 0,12 80,08 14,91 0,15 84,94
Jumlah/Total 10,07 24,72 65,21 7,95 25,07 66,98
Catatan/Note: 1 Termasuk pendidikan nonformal (Paket A, Paket B, atau Paket C)/Including Package A, Package B, or Package Chttp
://www.b
ps.g
o.id

S O S I A L D A N K E S E J A H T E R A A N R A K Y A T
S t a t i s t i k I n d o n e s i a 2 0 1 3126
Persentase Penduduk Usia 7–24 Tahun Menurut Jenis Kelamin, Kelompok Umur Sekolah, dan Partisipasi Sekolah 1, 2010–2012Percentage of Population Aged 7–24 Years by Sex, School Age Group, and School Participation 1, 2010–2012
Tabel ––––––
4.1.3Table
[Diolah dari Hasil Survei Sosial Ekonomi Nasional (Susenas), BPS/Based on National Socio Economic Survey, BPS–Statistics Indonesia]
Jenis Kelamin danKelompok Umur Sekolah
Sex and SchoolAge Group
2010
Tidak/BelumPernah Sekolah
Not/NeverAttending School
Masih SekolahAttending
School
Tidak Sekolah Lagi
Not Attending School Anymore
(1) (2) (3) (4)
Laki–Laki/Male
7–12 1,33 97,74 0,9413–15 0,83 85,15 14,0116–18 0,90 56,86 42,2419–24 1,11 14,18 84,717–24 1,11 65,73 33,16
Perempuan/Female
7–12 1,02 98,32 0,6613–15 0,90 87,41 11,6916–18 0,95 55,12 43,9419–24 1,29 13,37 85,347–24 1,07 64,15 34,78
Laki–Laki + PerempuanMale + Female
7–12 1,18 98,02 0,8013–15 0,86 86,24 12,8916–18 0,92 56,01 43,0719–24 1,20 13,77 85,037–24 1,09 64,95 33,96
http
://www.b
ps.g
o.id

S O C I A L A N D W E L F A R E
S t a t i s t i c a l Y e a r b o o k o f I n d o n e s i a 2 0 1 3 127
Lanjutan Tabel/Continued Table 4.1.3
Jenis Kelamin dan Kelompok Umur SekolahSex and School
Age Group
2011 2012Tidak/Belum
Pernah Sekolah
Not/NeverAttending
School
Masih Sekolah
AttendingSchool
Tidak Sekolah
LagiNot Atten-ding School
Anymore
Tidak/BelumPernah
SekolahNot/NeverAttending
School
Masih Sekolah
AttendingSchool
Tidak Sekolah
LagiNot Atten-ding School
Anymore(1) (5) (6) (7) (8) (9) (10)
Laki-Laki/Male
7–12 1,62 97,36 1,02 1,37 97,79 0,8413–15 0,93 86,54 12,53 0,77 88,67 10,5616–18 0,96 58,11 40,93 0,82 61,24 37,9419–24 1,13 14,94 83,94 0,91 15,93 83,167–24 1,26 66,19 32,56 1,05 67,07 31,88
Perempuan/Female
7–12 1,43 97,81 0,75 1,13 98,21 0,6713–15 0,75 89,12 10,13 0,76 90,91 8,3316–18 0,90 57,57 41,53 0,80 61,61 37,5819–24 1,37 13,61 85,02 1,11 16,34 82,557–24 1,22 64,49 34,29 1,01 67,03 31,96
Laki–Laki + PerempuanMale + Female
7–12 1,53 97,58 0,89 1,25 97,99 0,7513–15 0,84 87,78 11,37 0,77 89,76 9,4716–18 0,93 57,85 41,21 0,81 61,42 37,7719–24 1,25 14,26 84,49 1,01 16,13 82,867–24 1,24 65,36 33,40 1,03 67,05 31,92
Catatan/Note: 1 Termasuk pendidikan nonformal (Paket A, Paket B, atau Paket C)/Including Package A, Package B, or Package C
http
://www.b
ps.g
o.id

S O S I A L D A N K E S E J A H T E R A A N R A K Y A T
S t a t i s t i k I n d o n e s i a 2 0 1 3128
Jumlah Sekolah, Guru, dan Murid Taman Kanak-Kanak (TK) di Bawah Kementerian Pendidikan dan Kebudayaan Menurut Provinsi, 2009/2010–2011/2012Number of Schools, Teachers, and Pupils in Kindergarten Under The Ministry of Education and Culture by Province, 2009/2010–2011/2012
Tabel ––––––
4.1.4Table
ProvinsiProvince
Sekolah/Schools
2009/2010 2010/2011 2011/2012(1) (2) (3) (4)
Aceh 1 318 1 498 1 507Sumatera Utara 1 149 1 245 1 551Sumatera Barat 1 865 1 950 1 971Riau 1 389 1 472 1 499Kepulauan Riau 397 455 473Jambi 961 1 002 1 002Sumatera Selatan 1 007 1 189 1 199Kepulauan Bangka Belitung 222 226 286Bengkulu 425 467 528Lampung 1 856 2 049 2 098
DKI Jakarta 1 955 1 857 1 857Jawa Barat 6 195 5 955 5 999Banten 1 366 1 599 1 611Jawa Tengah 13 036 12 862 12 935DI Yogyakarta 2 030 2 112 2 135Jawa Timur 15 976 16 413 16 471
Bali 1 164 1 239 1 296Nusa Tenggara Barat 1 177 1 236 1 265Nusa Tenggara Timur 1 087 1 147 1 147
Kalimantan Barat 565 605 614Kalimantan Tengah 882 884 999Kalimantan Selatan 1 793 1 799 2 050Kalimantan Timur 1 005 1 016 1 054
Sulawesi Utara 1 228 1 228 1 291Gorontalo 472 627 680Sulawesi Tengah 1 198 1 149 1 174Sulawesi Selatan 3 115 3 214 3 323Sulawesi Barat 507 513 513Sulawesi Tenggara 1 077 1 129 1 142
Maluku 310 351 403Maluku Utara 259 266 266Papua 377 378 384Papua Barat 187 194 194
Indonesia 67 550 69 326 70 917
http
://www.b
ps.g
o.id

S O C I A L A N D W E L F A R E
S t a t i s t i c a l Y e a r b o o k o f I n d o n e s i a 2 0 1 3 129
Lanjutan Tabel/Continued Table 4.1.4
ProvinsiProvince
Guru/Teachers Murid/Pupils
2009/2010 2010/2011 2011/2012 2009/2010 2010/2011 2011/2012(1) (5) (6) (7) (8) (9) (10)
Aceh 5 639 6 079 6 725 61 732 74 970 79 225Sumatera Utara 4 922 5 013 4 900 71 659 73 639 99 501Sumatera Barat 5 901 4 927 5 193 70 880 72 351 96 806Riau 4 845 5 201 5 578 69 179 70 762 75 615Kepulauan Riau 1 385 1 546 1 482 20 124 20 553 24 331Jambi 3 237 2 407 2 491 36 342 39 715 47 971Sumatera Selatan 4 023 4 091 4 291 50 101 52 673 60 134Kepulauan Bangka Belitung 958 768 851 14 950 15 501 23 188Bengkulu 2 022 1 156 1 451 18 572 19 105 25 727Lampung 6 439 6 975 7 030 88 123 90 098 104 991
DKI Jakarta 7 885 10 303 10 283 122 203 124 646 125 469Jawa Barat 21 698 21 008 21 710 274 889 280 368 312 202Banten 5 167 5 962 5 769 66 174 67 431 80 840Jawa Tengah 32 628 24 978 26 602 486 511 496 250 641 941DI Yogyakarta 6 846 5 965 6 105 78 339 89 716 115 372Jawa Timur 46 528 42 049 43 634 744 329 760 282 826 369
Bali 4 402 4 548 4 452 61 673 63 333 68 080Nusa Tenggara Barat 4 381 3 197 3 183 54 311 57 890 62 063Nusa Tenggara Timur 2 705 1 970 2 174 40 984 45 569 52 723
Kalimantan Barat 1 996 2 130 2 164 26 849 27 412 31 980Kalimantan Tengah 2 550 3 697 3 557 37 775 38 555 47 365Kalimantan Selatan 6 460 5 752 5 711 75 468 76 976 95 823Kalimantan Timur 3 397 4 353 4 518 52 020 53 156 60 274
Sulawesi Utara 2 512 2 694 2 584 36 906 38 473 62 406Gorontalo 1 475 1 748 1 773 21 773 30 561 33 962Sulawesi Tengah 3 904 2 706 2 813 39 710 40 530 57 649Sulawesi Selatan 10 157 8 778 8 839 112 336 114 622 152 527Sulawesi Barat 1 741 1 185 1 304 19 545 19 942 24 209Sulawesi Tenggara 3 106 3 762 3 737 40 747 43 544 55 409
Maluku 746 938 904 11 657 13 757 18 308Maluku Utara 784 805 889 9 671 10 280 12 931Papua 1 355 1 147 1 221 21 895 23 756 25 971Papua Barat 499 412 488 9 766 9 961 11 079
Indonesia 212 293 198 250 204 406 2 947 193 3 056 377 3 612 441
Sumber/Source: Kementerian Pendidikan dan Kebudayaan/Ministry of Educations and Culture
http
://www.b
ps.g
o.id

S O S I A L D A N K E S E J A H T E R A A N R A K Y A T
S t a t i s t i k I n d o n e s i a 2 0 1 3130
Jumlah Sekolah, Guru, dan Murid Sekolah Dasar (SD) di Bawah Kementerian Pendidikan dan Kebudayaan Menurut Provinsi, 2009/2010–2011/2012Number of Schools, Teachers, and Pupils in Primary Schools Under The Ministry of Education and Culture by Province, 2009/2010–2011/2012
Tabel ––––––
4.1.5Table
ProvinsiProvince
Sekolah/Schools
2009/2010 2010/2011 2011/2012(1) (2) (3) (4)
Aceh 3 288 3 339 3 339Sumatera Utara 8 533 9 351 9 343Sumatera Barat 4 030 4 127 4 131Riau 3 111 3 392 3 394Kepulauan Riau 707 818 838Jambi 2 291 2 354 2 363Sumatera Selatan 4 225 4 521 4 539Kepulauan Bangka Belitung 785 790 777Bengkulu 1 231 1 329 1 329Lampung 4 861 4 557 4 539
DKI Jakarta 3 012 2 957 3 112Jawa Barat 19 681 19 759 19 874Banten 4 703 4 475 4 501Jawa Tengah 19 639 19 739 19 331DI Yogyakarta 1 760 1 924 1 907Jawa Timur 19 305 19 923 19 701
Bali 2 443 2 429 2 411Nusa Tenggara Barat 2 842 3 041 3 058Nusa Tenggara Timur 4 357 4 551 4 721
Kalimantan Barat 3 811 4 087 4 141Kalimantan Tengah 2 572 2 495 2 471Kalimantan Selatan 2 936 2 910 2 869Kalimantan Timur 2 168 2 212 2 221
Sulawesi Utara 2 385 2 205 2 205Gorontalo 881 865 900Sulawesi Tengah 2 723 2 750 2 729Sulawesi Selatan 6 176 6 301 6 283Sulawesi Barat 1 231 1 269 1 287Sulawesi Tenggara 2 185 2 229 2 262
Maluku 1 593 1 706 1 713Maluku Utara 1 111 1 229 1 249Papua 1 890 2 240 2 316Papua Barat 786 930 972
Indonesia 143 252 146 804 146 826
http
://www.b
ps.g
o.id

S O C I A L A N D W E L F A R E
S t a t i s t i c a l Y e a r b o o k o f I n d o n e s i a 2 0 1 3 131
Lanjutan Tabel/Continued Table 4.1.5
ProvinsiProvince
Guru/Teachers Murid/Pupils 2009/2010 2010/2011 2011/2012 2009/2010 2010/2011 2011/2012
(1) (5) (6) (7) (8) (9) (10)
Aceh 44 499 44 506 44 001 545 904 547 507 546 790Sumatera Utara 92 080 104 032 92 557 1 835 439 1 851 403 1 848 532Sumatera Barat 42 832 41 217 39 250 685 821 690 930 688 840Riau 39 129 43 898 40 054 738 902 733 719 735 413Kepulauan Riau 9 501 10 145 9 358 164 536 163 099 170 794Jambi 24 458 25 690 22 446 419 898 427 538 421 888Sumatera Selatan 53 588 55 431 54 417 962 782 956 761 958 005Kepulauan Bangka Belitung 8 272 7 931 8 322 148 905 146 343 147 642Bengkulu 12 988 15 058 13 847 238 342 245 836 243 589Lampung 53 069 56 140 53 601 1 034 354 1 029 645 1 017 863
DKI Jakarta 36 063 36 677 34 514 841 897 837 030 837 875Jawa Barat 198 607 199 968 189 303 4 570 905 4 735 438 4 798 996Banten 54 020 53 755 51 235 1 275 000 1 304 014 1 274 396Jawa Tengah 192 910 167 176 161 153 3 406 414 3 407 492 3 383 070DI Yogyakarta 21 018 19 843 18 664 300 889 304 902 305 157Jawa Timur 202 799 207 535 198 245 3 285 901 3 309 523 3 304 905
Bali 24 056 24 387 22 511 420 298 420 671 421 665Nusa Tenggara Barat 33 416 32 629 30 468 568 420 569 423 559 926Nusa Tenggara Timur 40 649 42 261 37 597 796 671 789 221 796 149
Kalimantan Barat 36 594 36 694 28 172 660 115 650 467 655 931Kalimantan Tengah 19 298 22 747 20 962 322 848 329 171 328 432Kalimantan Selatan 29 003 29 575 28 805 411 418 420 434 421 022Kalimantan Timur 23 629 28 907 26 209 436 969 431 010 437 285
Sulawesi Utara 18 828 18 792 16 936 279 115 277 455 280 172Gorontalo 8 528 8 920 8 085 162 077 165 885 166 675Sulawesi Tengah 23 032 22 213 21 924 367 683 364 637 361 561Sulawesi Selatan 69 007 67 018 58 974 1 036 846 1 045 018 1 041 568Sulawesi Barat 11 883 10 957 10 179 180 273 182 268 180 271Sulawesi Tenggara 22 689 26 486 21 772 348 984 355 909 348 700
Maluku 14 778 16 693 15 293 262 136 272 592 272 028Maluku Utara 8 092 8 389 7 652 169 895 170 829 173 173Papua 12 333 11 174 10 691 325 766 322 756 333 487Papua Barat 5 478 4 392 4 384 123 198 121 289 122 119
Indonesia 1 487 126 1 501 236 1 401 581 27 328 601 27 580 215 27 583 919
Catatan/Note: Pada tahun 2010/2011 terjadi perubahan konsep pada penghitungan jumlah guru, dimana mulai tahun tersebut guru harus ditetapkan berada di satu sekolah meskipun mengajar di beberapa sekolah.
In 2010/2011, there is a change in concept of measuring the number of teacher. Since this year, a teacher should be registered only in one school even he/she is teaching in some schools.
Sumber/Source: Kementerian Pendidikan dan Kebudayaan/Ministry of Educations and Culture
http
://www.b
ps.g
o.id
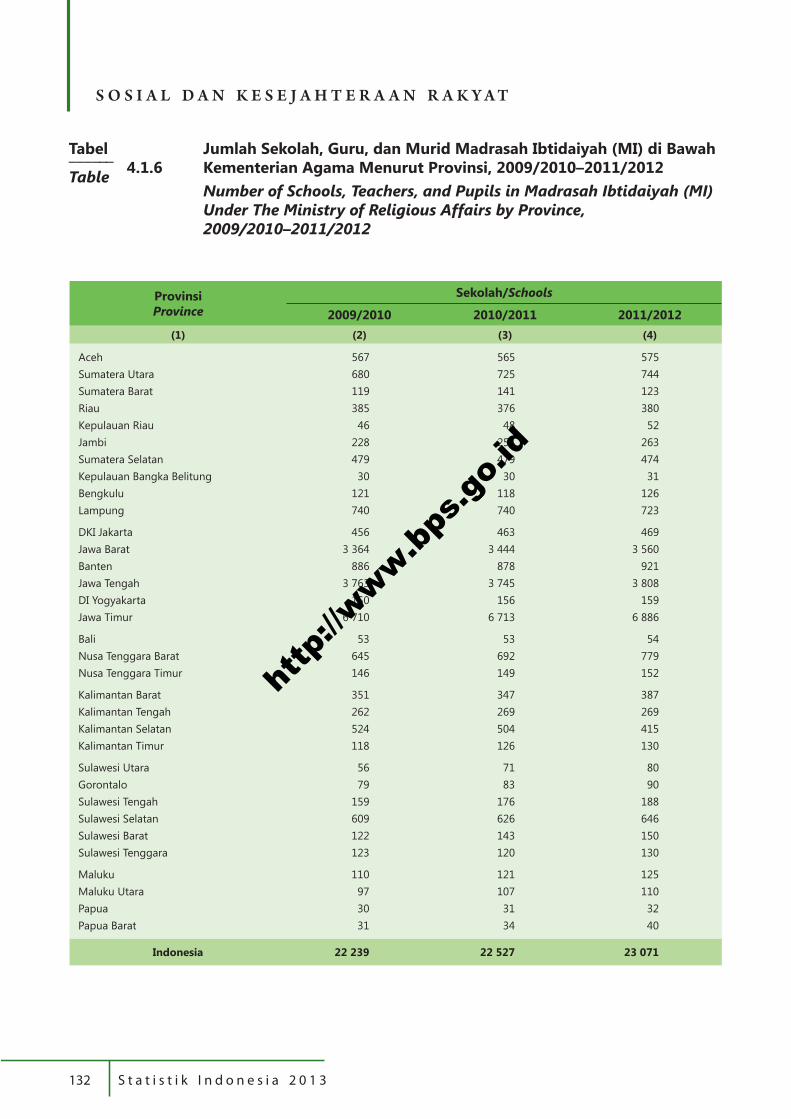
S O S I A L D A N K E S E J A H T E R A A N R A K Y A T
S t a t i s t i k I n d o n e s i a 2 0 1 3132
Jumlah Sekolah, Guru, dan Murid Madrasah Ibtidaiyah (MI) di Bawah Kementerian Agama Menurut Provinsi, 2009/2010–2011/2012Number of Schools, Teachers, and Pupils in Madrasah Ibtidaiyah (MI) Under The Ministry of Religious Affairs by Province, 2009/2010–2011/2012
Tabel ––––––
4.1.6Table
ProvinsiProvince
Sekolah/Schools
2009/2010 2010/2011 2011/2012(1) (2) (3) (4)
Aceh 567 565 575Sumatera Utara 680 725 744Sumatera Barat 119 141 123Riau 385 376 380Kepulauan Riau 46 48 52Jambi 228 254 263Sumatera Selatan 479 479 474Kepulauan Bangka Belitung 30 30 31Bengkulu 121 118 126Lampung 740 740 723
DKI Jakarta 456 463 469Jawa Barat 3 364 3 444 3 560Banten 886 878 921Jawa Tengah 3 763 3 745 3 808DI Yogyakarta 150 156 159Jawa Timur 6 710 6 713 6 886
Bali 53 53 54Nusa Tenggara Barat 645 692 779Nusa Tenggara Timur 146 149 152
Kalimantan Barat 351 347 387Kalimantan Tengah 262 269 269Kalimantan Selatan 524 504 415Kalimantan Timur 118 126 130
Sulawesi Utara 56 71 80Gorontalo 79 83 90Sulawesi Tengah 159 176 188Sulawesi Selatan 609 626 646Sulawesi Barat 122 143 150Sulawesi Tenggara 123 120 130
Maluku 110 121 125Maluku Utara 97 107 110Papua 30 31 32Papua Barat 31 34 40
Indonesia 22 239 22 527 23 071
http
://www.b
ps.g
o.id

S O C I A L A N D W E L F A R E
S t a t i s t i c a l Y e a r b o o k o f I n d o n e s i a 2 0 1 3 133
Lanjutan Tabel/Continued Table 4.1.6
ProvinsiProvince
Guru/Teachers Murid/Pupils
2009/2010 2010/2011 2011/2012 2009/2010 2010/2011 2011/2012(1) (5) (6) (7) (8) (9) (10)
Aceh 11 279 11 069 11 035 113 685 120 912 122 720Sumatera Utara 7 165 7 612 7 944 100 807 106 544 117 292Sumatera Barat 1 638 1 634 1 889 16 675 17 296 17 821Riau 3 870 4 025 3 405 40 686 40 332 38 037Kepulauan Riau 539 478 639 8 089 11 170 9 378Jambi 2 509 2 830 2 759 14 813 19 236 20 996Sumatera Selatan 5 073 5 407 3 388 65 079 60 220 71 866Kepulauan Bangka Belitung 355 375 401 4 565 4 644 5 242Bengkulu 1 257 1 381 1 508 12 624 13 133 14 716Lampung 7 619 7 624 7 914 93 879 95 760 94 829
DKI Jakarta 5 184 5 994 6 092 91 295 89 058 90 936Jawa Barat 33 757 33 856 87 171 556 945 569 630 572 662Banten 9 091 9 869 8 024 140 143 512 461 150 262Jawa Tengah 36 705 38 398 37 489 504 186 146 307 525 627DI Yogyakarta 1 760 1 843 1 786 12 911 13 490 15 541Jawa Timur 81 468 83 331 84 638 817 988 808 753 862 334
Bali 807 909 911 11 267 18 171 12 829Nusa Tenggara Barat 7 513 8 410 10 701 75 791 71 219 85 919Nusa Tenggara Timur 1 592 1 682 1 644 19 477 20 415 22 070
Kalimantan Barat 5 224 4 031 4 986 46 927 49 129 50 499Kalimantan Tengah 2 510 2 648 1 904 33 668 35 407 35 398Kalimantan Selatan 6 973 7 376 1 639 65 895 67 832 67 185Kalimantan Timur 1 217 1 705 1 462 16 199 18 347 19 852
Sulawesi Utara 579 693 264 7 256 9 268 8 090Gorontalo 845 869 980 8 616 9 815 10 078Sulawesi Tengah 1 434 1 717 1 883 12 421 16 709 19 605Sulawesi Selatan 6 911 7 393 7 244 62 635 65 323 66 978Sulawesi Barat 1 326 1 413 1 838 9 966 13 208 13 966Sulawesi Tenggara 1 253 1 350 982 13 137 15 690 14 836
Maluku 802 1 005 1 546 15 199 17 159 17 215Maluku Utara 944 1 044 1 229 10 862 14 210 13 951Papua 315 422 412 5 057 6 381 6 434Papua Barat 285 344 347 4 477 4 997 5 295
Indonesia 249 799 258 737 306 054 3 013 220 3 082 226 3 200 459
Sumber/Source: Kementerian Agama/Ministry of Religious Affairs
http
://www.b
ps.g
o.id

S O S I A L D A N K E S E J A H T E R A A N R A K Y A T
S t a t i s t i k I n d o n e s i a 2 0 1 3134
Jumlah Sekolah, Guru, dan Murid Sekolah Menengah Pertama (SMP) di Bawah Kementerian Pendidikan dan Kebudayaan Menurut Provinsi, 2009/2010–2011/2012Number of Schools, Teachers, and Pupils in Junior High Schools Under The Ministry of Education and Culture by Province, 2009/2010–2011/2012
Tabel ––––––
4.1.7Table
ProvinsiProvince
Sekolah/Schools
2009/2010 2010/2011 2011/2012(1) (2) (3) (4)
Aceh 858 881 930Sumatera Utara 2 183 2 208 2 258Sumatera Barat 679 689 742Riau 853 868 946Kepulauan Riau 263 272 268Jambi 550 566 598Sumatera Selatan 1 127 1 139 1 161Kepulauan Bangka Belitung 174 179 189Bengkulu 350 365 386Lampung 1 208 1 208 1 215
DKI Jakarta 1 024 1 030 943Jawa Barat 3 427 3 440 4 106Banten 1 032 1 036 1 166Jawa Tengah 3 009 3 032 3 182DI Yogyakarta 430 451 477Jawa Timur 3 591 3 605 4 080
Bali 361 366 397Nusa Tenggara Barat 523 558 700Nusa Tenggara Timur 886 903 1 193
Kalimantan Barat 995 1 004 1 078Kalimantan Tengah 536 545 673Kalimantan Selatan 530 535 572Kalimantan Timur 624 640 707
Sulawesi Utara 611 640 670Gorontalo 236 246 304Sulawesi Tengah 481 481 699Sulawesi Selatan 1 209 1 225 1 418Sulawesi Barat 230 236 285Sulawesi Tenggara 527 533 643
Maluku 513 522 546Maluku Utara 254 262 393Papua 434 447 522Papua Barat 158 178 221
Indonesia 29 866 30 290 33 668
http
://www.b
ps.g
o.id

S O C I A L A N D W E L F A R E
S t a t i s t i c a l Y e a r b o o k o f I n d o n e s i a 2 0 1 3 135
Lanjutan Tabel/Continued Table 4.1.7
ProvinsiProvince
Guru/Teachers Murid/Pupils
2009/2010 2010/2011 2011/2012 2009/2010 2010/2011 2011/2012(1) (5) (6) (7) (8) (9) (10)
Aceh 19 024 17 034 16 882 214 213 210 599 201 740Sumatera Utara 43 728 38 479 34 062 674 698 653 486 626 521Sumatera Barat 17 546 16 087 15 508 224 999 227 182 207 553Riau 13 552 14 137 12 994 196 263 208 150 224 331Kepulauan Riau 3 761 3 291 3 023 57 851 59 515 59 871Jambi 9 105 8 237 7 157 115 314 119 109 120 312Sumatera Selatan 23 970 19 318 17 824 317 458 306 270 323 034Kepulauan Bangka Belitung 2 689 2 312 2 529 43 354 43 815 46 429Bengkulu 5 847 6 060 5 491 85 367 85 828 85 632Lampung 18 886 19 254 17 668 315 411 319 388 312 784
DKI Jakarta 22 331 19 432 16 777 383 321 384 234 343 594Jawa Barat 80 431 67 632 57 806 1 485 479 1 569 460 1 655 657Banten 22 391 16 023 14 341 369 527 390 960 388 888Jawa Tengah 73 726 62 034 58 516 1 292 350 1 289 618 1 203 429DI Yogyakarta 12 071 9 684 9 246 133 706 133 079 124 716Jawa Timur 86 107 69 825 68 151 1 218 905 1 217 332 1 214 436
Bali 12 235 10 441 9 925 172 864 173 435 177 462Nusa Tenggara Barat 13 087 9 948 9 020 165 885 165 854 175 637Nusa Tenggara Timur 14 629 13 831 10 687 224 933 221 657 263 454
Kalimantan Barat 12 092 10 527 7 643 193 659 190 505 195 281Kalimantan Tengah 6 178 6 943 6 242 83 028 87 129 87 126Kalimantan Selatan 7 871 8 188 7 997 107 735 106 668 105 710Kalimantan Timur 9 584 10 011 8 851 145 951 142 873 157 198
Sulawesi Utara 8 467 8 164 7 473 114 521 119 400 111 023Gorontalo 3 335 3 441 3 214 44 217 43 048 44 731Sulawesi Tengah 8 046 6 452 6 260 96 166 101 132 116 474Sulawesi Selatan 26 078 22 749 21 728 344 065 337 329 379 772Sulawesi Barat 3 757 2 877 2 836 49 820 49 049 58 011Sulawesi Tenggara 9 417 8 530 7 375 114 189 115 147 119 255
Maluku 6 670 6 315 5 652 87 948 90 897 90 769Maluku Utara 3 223 3 013 2 808 47 691 47 905 59 818Papua 5 920 4 531 4 631 98 490 98 430 104 824Papua Barat 2 410 1 815 1 947 35 628 37 971 39 864
Indonesia 608 164 526 615 482 264 9 255 006 9 346 454 9 425 336
Catatan/Note: Pada tahun 2010/2011 terjadi perubahan konsep pada penghitungan jumlah guru, dimana mulai tahun tersebut guru harus ditetapkan berada di satu sekolah meskipun mengajar di beberapa sekolah.In 2010/2011, there is a change in concept of measuring the number of teacher. Since this year, a teacher should be registered only in one school even he/she is teaching in some schools.
Sumber/Source: Kementerian Pendidikan dan Kebudayaan/Ministry of Educations and Culture
http
://www.b
ps.g
o.id

S O S I A L D A N K E S E J A H T E R A A N R A K Y A T
S t a t i s t i k I n d o n e s i a 2 0 1 3136
Jumlah Sekolah, Guru, dan Murid Madrasah Tsanawiyah (MTs) di Bawah Kementerian Agama Menurut Provinsi, 2009/2010–2011/2012Number of Schools, Teachers, and Pupils in Madrasah Tsanawiyah (MTs) Under The Ministry of Religious Affairs by Province, 2009/2010–2011/2012
Tabel ––––––
4.1.8Table
ProvinsiProvince
Sekolah/Schools
2009/2010 2010/2011 2011/2012(1) (2) (3) (4)
Aceh 342 341 361Sumatera Utara 878 872 891Sumatera Barat 372 379 376Riau 530 550 558Kepulauan Riau 54 57 58Jambi 317 321 343Sumatera Selatan 410 419 398Kepulauan Bangka Belitung 41 38 40Bengkulu 76 77 78Lampung 589 638 616
DKI Jakarta 226 230 234Jawa Barat 2 110 2 437 2 503Banten 752 754 799Jawa Tengah 1 455 1 508 1 527DI Yogyakarta 86 88 89Jawa Timur 2 758 2 902 3 081
Bali 26 29 28Nusa Tenggara Barat 668 678 739Nusa Tenggara Timur 60 64 64
Kalimantan Barat 234 254 265Kalimantan Tengah 131 134 149Kalimantan Selatan 297 318 245Kalimantan Timur 141 131 156
Sulawesi Utara 49 54 55Gorontalo 62 64 67Sulawesi Tengah 240 256 259Sulawesi Selatan 593 613 668Sulawesi Barat 100 126 135Sulawesi Tenggara 177 188 174
Maluku 83 92 101Maluku Utara 119 123 134Papua 27 26 27Papua Barat 19 26 26
Indonesia 14 022 14 787 15 244
http
://www.b
ps.g
o.id

S O C I A L A N D W E L F A R E
S t a t i s t i c a l Y e a r b o o k o f I n d o n e s i a 2 0 1 3 137
Lanjutan Tabel/Continued Table 4.1.8
ProvinsiProvince
Guru/Teachers Murid/Pupils
2009/2010 2010/2011 2011/2012 2009/2010 2010/2011 2011/2012(1) (5) (6) (7) (8) (9) (10)
Aceh 7 716 7 367 7 492 69 236 72 418 70 442Sumatera Utara 14 677 15 098 14 453 162 049 157 562 167 811Sumatera Barat 8 409 8 480 8 659 64 590 66 440 65 048Riau 8 576 7 188 8 708 67 828 68 210 65 901Kepulauan Riau 703 730 815 6 710 6 668 6 767Jambi 4 372 4 817 4 773 38 804 39 439 41 864Sumatera Selatan 6 619 5 901 5 242 54 177 54 187 61 920Kepulauan Bangka Belitung 500 677 746 5 993 5 765 6 737Bengkulu 1 271 1 545 1 465 9 638 10 119 10 637Lampung 8 552 8 978 11 146 93 291 93 546 95 782
DKI Jakarta 4 157 5 254 4 945 58 426 53 200 53 223Jawa Barat 46 140 46 300 86 738 484 826 492 896 541 660Banten 14 082 15 071 12 390 156 427 142 498 164 025Jawa Tengah 30 400 28 106 30 710 378 114 395 548 396 714DI Yogyakarta 2 233 2 216 2 220 21 222 21 244 23 166Jawa Timur 55 394 58 271 60 184 495 853 525 686 544 626
Bali 505 555 561 4 017 4 790 5 061Nusa Tenggara Barat 11 916 11 860 16 207 83 178 77 503 93 378Nusa Tenggara Timur 875 920 850 8 160 8 869 9 372
Kalimantan Barat 3 536 2 651 4 167 26 368 22 871 29 989Kalimantan Tengah 1 805 2 035 1 648 19 371 19 841 20 677Kalimantan Selatan 5 142 4 927 523 54 825 55 778 64 058Kalimantan Timur 1 744 1 770 2 575 19 551 20 859 23 204
Sulawesi Utara 703 745 443 6 511 7 673 8 627Gorontalo 1 019 1 028 1 022 7 584 7 916 8 938Sulawesi Tengah 3 503 3 815 3 616 23 601 28 545 28 643Sulawesi Selatan 9 971 11 725 11 654 65 867 66 566 70 832Sulawesi Barat 1 322 1 508 2 145 7 988 9 662 11 636Sulawesi Tenggara 2 704 2 562 1 457 19 287 21 211 22 959
Maluku 780 1 030 1 442 10 649 12 167 12 007Maluku Utara 1 887 1 693 1 479 12 894 11 843 13 791Papua 409 362 354 1 843 2 097 2 091Papua Barat 278 390 372 2 961 3 489 3 436
Indonesia 261 900 265 575 311 201 2 541 839 2 587 106 2 745 022
Sumber/Source: Kementrian Agama/Ministry of Religious Affairs
http
://www.b
ps.g
o.id
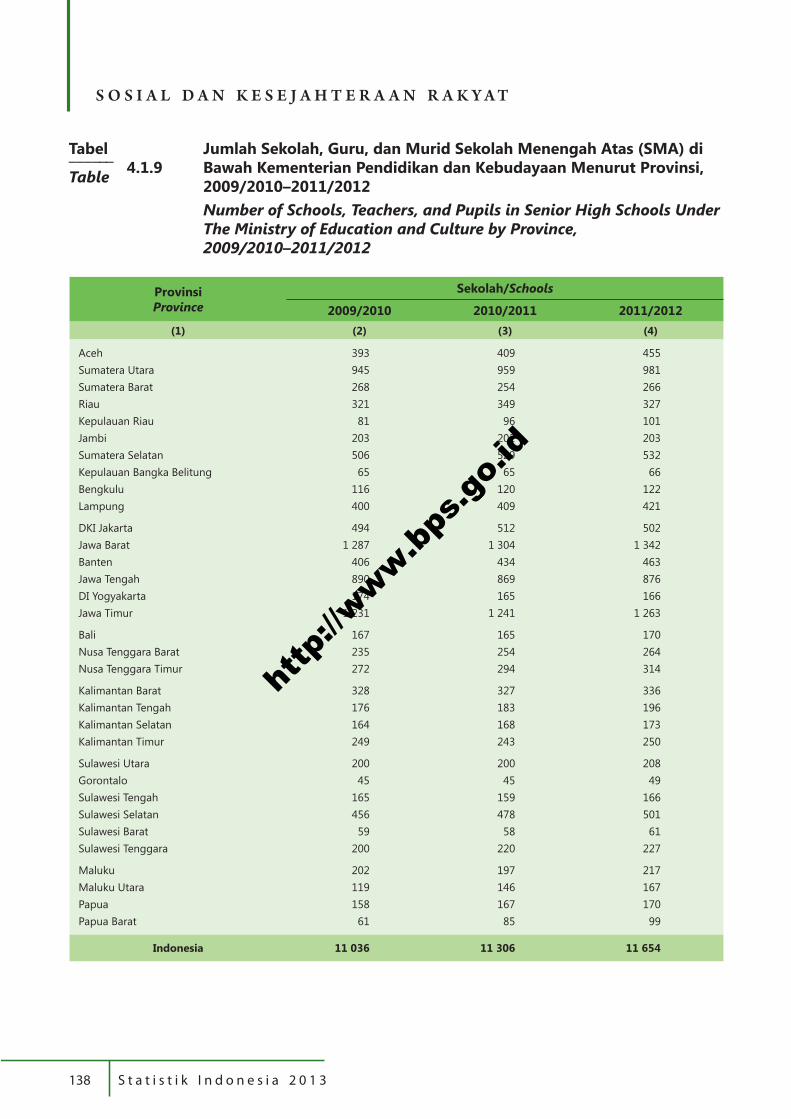
S O S I A L D A N K E S E J A H T E R A A N R A K Y A T
S t a t i s t i k I n d o n e s i a 2 0 1 3138
Jumlah Sekolah, Guru, dan Murid Sekolah Menengah Atas (SMA) di Bawah Kementerian Pendidikan dan Kebudayaan Menurut Provinsi, 2009/2010–2011/2012Number of Schools, Teachers, and Pupils in Senior High Schools Under The Ministry of Education and Culture by Province, 2009/2010–2011/2012
Tabel ––––––
4.1.9Table
ProvinsiProvince
Sekolah/Schools
2009/2010 2010/2011 2011/2012(1) (2) (3) (4)
Aceh 393 409 455Sumatera Utara 945 959 981Sumatera Barat 268 254 266Riau 321 349 327Kepulauan Riau 81 96 101Jambi 203 202 203Sumatera Selatan 506 529 532Kepulauan Bangka Belitung 65 65 66Bengkulu 116 120 122Lampung 400 409 421
DKI Jakarta 494 512 502Jawa Barat 1 287 1 304 1 342Banten 406 434 463Jawa Tengah 890 869 876DI Yogyakarta 174 165 166Jawa Timur 1 231 1 241 1 263
Bali 167 165 170Nusa Tenggara Barat 235 254 264Nusa Tenggara Timur 272 294 314
Kalimantan Barat 328 327 336Kalimantan Tengah 176 183 196Kalimantan Selatan 164 168 173Kalimantan Timur 249 243 250
Sulawesi Utara 200 200 208Gorontalo 45 45 49Sulawesi Tengah 165 159 166Sulawesi Selatan 456 478 501Sulawesi Barat 59 58 61Sulawesi Tenggara 200 220 227
Maluku 202 197 217Maluku Utara 119 146 167Papua 158 167 170Papua Barat 61 85 99
Indonesia 11 036 11 306 11 654
http
://www.b
ps.g
o.id

S O C I A L A N D W E L F A R E
S t a t i s t i c a l Y e a r b o o k o f I n d o n e s i a 2 0 1 3 139
Lanjutan Tabel/Continued Table 4.1.9
ProvinsiProvince
Guru/Teachers Murid/Pupils
2009/2010 2010/2011 2011/2012 2009/2010 2010/2011 2011/2012(1) (5) (6) (7) (8) (9) (10)
Aceh 12 494 10 853 10 807 143 828 153 790 155 268Sumatera Utara 25 701 20 593 20 539 324 474 339 080 344 301Sumatera Barat 10 951 9 671 9 658 118 109 125 408 128 789Riau 8 003 7 874 7 876 106 002 111 448 115 547Kepulauan Riau 1 651 1 812 1 803 24 387 25 877 28 027Jambi 5 373 4 178 4 177 61 232 64 856 66 681Sumatera Selatan 14 450 10 736 10 733 179 445 185 341 191 407Kepulauan Bangka Belitung 1 399 1 183 1 182 20 048 21 000 20 560Bengkulu 3 481 3 085 3 083 42 897 45 415 44 346Lampung 11 196 8 961 8 939 117 147 120 591 121 345
DKI Jakarta 15 700 12 294 12 304 193 311 196 497 187 656Jawa Barat 37 868 28 973 28 927 527 286 544 512 566 086Banten 10 365 7 529 7 500 138 949 143 152 148 069Jawa Tengah 29 447 23 706 23 692 395 730 411 985 400 184DI Yogyakarta 5 890 5 066 5 065 51 551 53 606 51 591Jawa Timur 38 248 28 195 28 171 471 793 486 028 494 472
Bali 7 288 5 325 5 320 76 770 80 018 80 374Nusa Tenggara Barat 7 149 5 195 5 182 92 056 97 108 98 556Nusa Tenggara Timur 7 811 6 409 6 388 105 221 108 186 119 906
Kalimantan Barat 6 475 4 734 4 725 82 929 85 881 93 365Kalimantan Tengah 3 352 3 576 3 563 43 760 46 170 47 903Kalimantan Selatan 4 085 3 382 3 373 46 835 49 423 51 678Kalimantan Timur 5 225 4 639 4 631 63 464 66 792 68 693
Sulawesi Utara 4 418 3 861 3 853 50 125 52 308 51 252Gorontalo 1 390 1 272 1 268 17 881 19 199 19 796Sulawesi Tengah 3 841 2 943 2 936 52 581 56 009 56 921Sulawesi Selatan 14 174 11 319 11 296 166 896 175 880 185 474Sulawesi Barat 1 582 1 185 1 182 19 111 20 379 21 709Sulawesi Tenggara 5 745 5 103 5 094 65 405 69 558 76 940
Maluku 4 291 4 157 4 135 56 060 58 629 61 205Maluku Utara 2 390 1 802 1 773 27 614 28 809 30 168Papua 3 302 2 686 2 669 41 214 42 629 45 396Papua Barat 1 420 1 033 1 014 18 665 19 575 22 802
Indonesia 316 155 253 330 252 858 3 942 776 r 4 105 139 4 196 467
Catatan/Note: r Angka diperbaiki/Revised figures Pada tahun 2010/2011 terjadi perubahan konsep pada penghitungan jumlah guru, dimana mulai tahun tersebut guru harus ditetapkan berada di satu sekolah meskipun mengajar di beberapa sekolah.In 2010/2011, there is a change in concept of measuring the number of teacher. Since this year, a teacher should be registered only in one school even he/she is teaching in some schools.
Sumber/Source: Kementerian Pendidikan dan Kebudayaan/Ministry of Educations and Culture
http
://www.b
ps.g
o.id

S O S I A L D A N K E S E J A H T E R A A N R A K Y A T
S t a t i s t i k I n d o n e s i a 2 0 1 3140
Jumlah Sekolah, Guru, dan Murid Sekolah Menengah Kejuruan (SMK) di Bawah Kementerian Pendidikan dan Kebudayaan Menurut Provinsi, 2009/2010–2011/2012Number of Schools, Teachers, and Pupils in Vocational High Schools Under The Ministry of Education and Culture by Province, 2009/2010–2011/2012
Tabel ––––––
4.1.10Table
ProvinsiProvince
Sekolah/Schools
2009/2010 2010/2011 2011/2012(1) (2) (3) (4)
Aceh 119 137 149Sumatera Utara 729 785 887Sumatera Barat 169 173 186Riau 159 176 194Kepulauan Riau 52 64 63Jambi 116 126 129Sumatera Selatan 186 196 205Kepulauan Bangka Belitung 44 45 47Bengkulu 73 71 76Lampung 267 285 326
DKI Jakarta 600 590 598Jawa Barat 1 357 1 537 1 765Banten 305 406 484Jawa Tengah 1 111 1 184 1 270DI Yogyakarta 193 191 208Jawa Timur 1 175 1 244 1 439
Bali 126 136 149Nusa Tenggara Barat 116 155 196Nusa Tenggara Timur 117 125 152
Kalimantan Barat 139 150 158Kalimantan Tengah 79 93 102Kalimantan Selatan 71 86 97Kalimantan Timur 166 180 211
Sulawesi Utara 112 130 146Gorontalo 37 43 45Sulawesi Tengah 100 107 125Sulawesi Selatan 293 326 361Sulawesi Barat 63 65 76Sulawesi Tenggara 90 99 114
Maluku 66 77 84Maluku Utara 65 68 77Papua 73 80 88Papua Barat 31 34 49
Indonesia 8 399 9 164 10 256
http
://www.b
ps.g
o.id

S O C I A L A N D W E L F A R E
S t a t i s t i c a l Y e a r b o o k o f I n d o n e s i a 2 0 1 3 141
Lanjutan Tabel/Continued Table 4.1.10
ProvinsiProvince
Guru/Teachers Murid/Pupils
2009/2010 2010/2011 2011/2012 2009/2010 2010/2011 2011/2012(1) (5) (6) (7) (8) (9) (10)
Aceh 4 181 3 217 3 205 43 316 47 278 47 474Sumatera Utara 21 211 13 284 11 856 260 094 290 527 319 618Sumatera Barat 7 816 5 208 5 195 78 675 81 491 82 289Riau 4 757 3 723 3 705 57 860 66 894 70 406Kepulauan Riau 1 961 1 023 1 024 16 532 18 907 19 814Jambi 3 586 1 934 1 931 31 415 36 729 39 057Sumatera Selatan 6 605 3 737 3 728 65 473 75 685 81 897Kepulauan Bangka Belitung 1 365 926 924 19 044 20 975 20 305Bengkulu 2 289 1 732 1 727 24 385 26 787 25 456Lampung 8 964 4 790 4 749 92 136 102 099 109 736
DKI Jakarta 19 068 10 437 10 429 248 006 257 066 235 587Jawa Barat 33 869 22 099 21 871 512 092 612 348 717 362Banten 8 367 4 994 4 916 133 113 157 292 180 664Jawa Tengah 35 467 24 524 24 438 520 387 576 001 616 910DI Yogyakarta 8 021 6 166 6 149 78 283 85 384 84 642Jawa Timur 40 255 23 430 23 235 563 951 616 451 662 926
Bali 5 563 3 241 3 228 51 944 61 666 70 447Nusa Tenggara Barat 4 101 2 304 2 263 37 710 44 958 52 493Nusa Tenggara Timur 3 822 3 227 3 200 49 229 55 470 56 632
Kalimantan Barat 3 807 2 367 2 359 45 147 48 998 49 095Kalimantan Tengah 2 424 1 689 1 680 19 033 22 342 22 740Kalimantan Selatan 2 852 2 021 2 010 32 176 37 486 37 745Kalimantan Timur 4 923 3 507 3 476 58 531 67 556 70 878
Sulawesi Utara 3 221 1 962 1 946 36 673 45 342 48 554Gorontalo 1 214 864 862 12 876 15 626 18 003Sulawesi Tengah 2 774 1 656 1 638 27 139 30 430 30 801Sulawesi Selatan 8 834 5 652 5 617 98 455 114 878 127 561Sulawesi Barat 1 597 812 801 15 154 18 363 21 206Sulawesi Tenggara 2 543 1 579 1 564 21 075 24 984 25 216
Maluku 1 724 1 571 1 564 16 779 19 097 18 110Maluku Utara 1 402 693 684 13 023 14 347 14 757Papua 2 314 1 631 1 623 25 386 27 951 26 272Papua Barat 1 105 492 477 13 976 15 750 14 504
Indonesia 262 002 166 492 164 074 3 319 068 3 737 158 4 019 157
Catatan/Note: Pada tahun 2010/2011 terjadi perubahan konsep pada penghitungan jumlah guru, dimana mulai tahun tersebut guru harus ditetapkan berada di satu sekolah meskipun mengajar di beberapa sekolah.In 2010/2011, there is a change in concept of measuring the number of teacher. Since this year, a teacher should be registered only in one school even he/she is teaching in some schools.
Sumber/Source: Kementerian Pendidikan dan Kebudayaan/Ministry of Educations and Culture
http
://www.b
ps.g
o.id

S O S I A L D A N K E S E J A H T E R A A N R A K Y A T
S t a t i s t i k I n d o n e s i a 2 0 1 3142
Jumlah Sekolah, Guru, dan Murid Madrasah Aliyah (MA) di Bawah Kementerian Agama Menurut Provinsi, 2009/2010–2011/2012Number of Schools, Teachers, and Pupils in Madrasah Aliyah (MA) Under The Ministry of Religious Affairs by Province, 2009/2010–2011/2012
Tabel ––––––
4.1.11Table
ProvinsiProvince
Sekolah/Schools
2009/2010 2010/2011 2011/2012(1) (2) (3) (4)
Aceh 196 197 202Sumatera Utara 414 435 432Sumatera Barat 181 184 184Riau 228 237 248Kepulauan Riau 30 28 29Jambi 158 176 184Sumatera Selatan 177 183 191Kepulauan Bangka Belitung 20 20 22Bengkulu 38 43 45Lampung 219 268 249
DKI Jakarta 84 87 87Jawa Barat 772 911 974Banten 277 310 314Jawa Tengah 499 539 526DI Yogyakarta 38 39 42Jawa Timur 1 184 1 252 1 304
Bali 13 16 17Nusa Tenggara Barat 329 364 409Nusa Tenggara Timur 26 25 25
Kalimantan Barat 90 103 116Kalimantan Tengah 54 57 58Kalimantan Selatan 127 132 95Kalimantan Timur 63 59 62
Sulawesi Utara 26 33 34Gorontalo 32 34 37Sulawesi Tengah 97 113 130Sulawesi Selatan 294 297 336Sulawesi Barat 46 67 72Sulawesi Tenggara 82 298 105
Maluku 29 41 45Maluku Utara 50 53 62Papua 15 14 17Papua Barat 9 11 11
Indonesia 5 897 6 426 6 664
http
://www.b
ps.g
o.id

S O C I A L A N D W E L F A R E
S t a t i s t i c a l Y e a r b o o k o f I n d o n e s i a 2 0 1 3 143
Lanjutan Tabel/Continued Table 4.1.11
ProvinsiProvince
Guru/Teachers Murid/Students
2009/2010 2010/2011 2011/2012 2009/2010 2010/2011 2011/2012(1) (5) (6) (7) (8) (9) (10)
Aceh 4 283 5 189 4 906 38 962 43 289 41 330Sumatera Utara 7 347 6 744 7 814 61 899 64 892 64 525Sumatera Barat 3 916 4 330 3 775 23 673 24 251 27 146Riau 3 659 3 415 4 190 24 875 25 204 26 729Kepulauan Riau 436 406 459 2 729 2 776 2 820Jambi 2 046 2 719 2 343 17 161 19 250 19 724Sumatera Selatan 3 032 2 996 3 313 25 319 28 076 29 014Kepulauan Bangka Belitung 307 403 475 2 549 2 363 2 908Bengkulu 718 962 980 6 177 6 422 7 011Lampung 3 293 3 645 4 972 30 063 31 806 33 303
DKI Jakarta 1 568 2 325 2 209 15 201 16 070 15 622Jawa Barat 17 567 15 114 33 326 118 396 124 744 134 281Banten 5 604 7 769 5 139 42 817 42 896 40 766Jawa Tengah 13 021 11 653 12 027 112 907 128 734 125 504DI Yogyakarta 1 290 1 440 1 259 8 917 9 016 12 875Jawa Timur 26 887 29 133 30 127 211 090 240 246 265 588
Bali 297 393 380 2 054 2 419 2 582Nusa Tenggara Barat 7 881 7 924 9 094 43 240 51 394 57 719Nusa Tenggara Timur 474 462 482 4 115 4 670 5 252
Kalimantan Barat 1 996 1 640 2 010 11 655 13 037 13 479Kalimantan Tengah 724 1 007 792 7 913 8 194 8 924Kalimantan Selatan 2 690 2 813 307 22 918 26 886 25 254Kalimantan Timur 954 1 061 1 482 7 715 7 465 7 501
Sulawesi Utara 337 478 372 1 861 3 521 4 355Gorontalo 640 518 620 4 214 3 925 4 640Sulawesi Tengah 1 814 2 339 1 872 9 538 10 782 12 288Sulawesi Selatan 5 246 5 569 6 522 33 058 32 778 37 522Sulawesi Barat 690 625 986 4 829 4 695 6 088Sulawesi Tenggara 1 536 1 561 860 9 562 9 816 10 183
Maluku 485 627 744 3 955 4 942 6 153Maluku Utara 933 798 733 6 120 5 241 6 231Papua 200 229 223 553 594 901Papua Barat 187 210 195 1 192 1 604 1 596
Indonesia 122 058 126 497 144 988 917 227 1 001 998 1 059 814
Sumber/Source: Kementerian Agama/Ministry of Religious Affairs
http
://www.b
ps.g
o.id
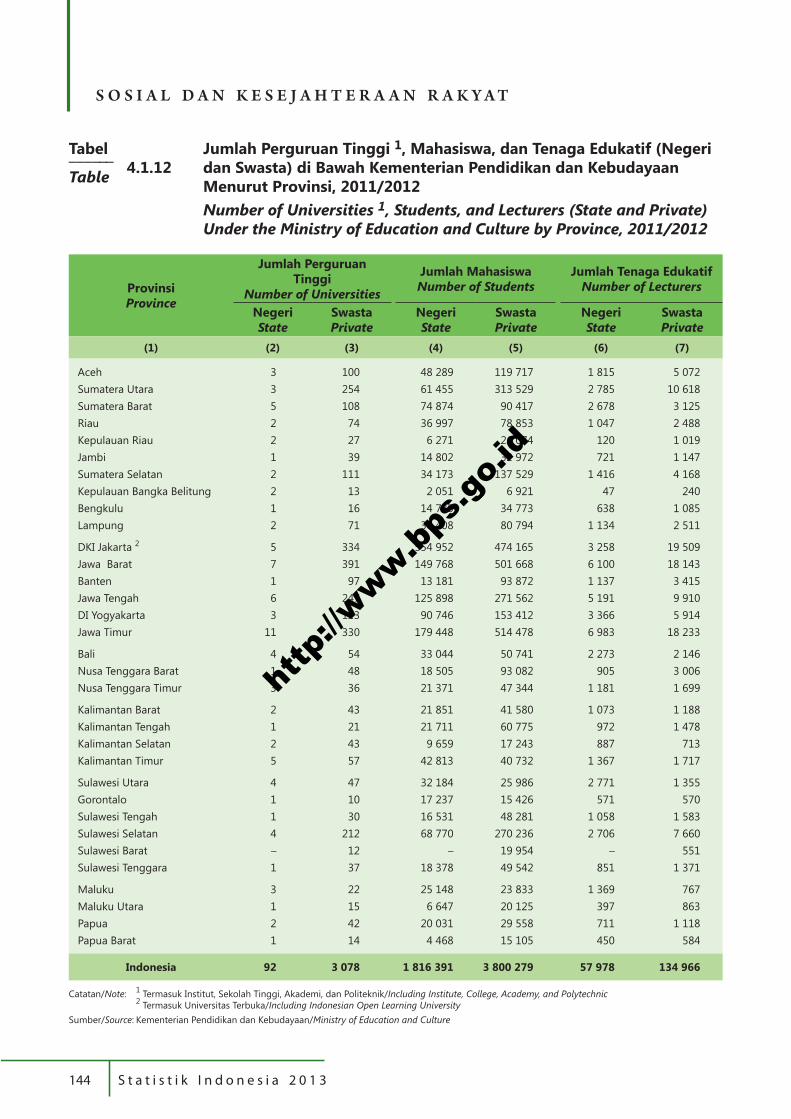
S O S I A L D A N K E S E J A H T E R A A N R A K Y A T
S t a t i s t i k I n d o n e s i a 2 0 1 3144
Jumlah Perguruan Tinggi 1, Mahasiswa, dan Tenaga Edukatif (Negeri dan Swasta) di Bawah Kementerian Pendidikan dan Kebudayaan Menurut Provinsi, 2011/2012Number of Universities 1, Students, and Lecturers (State and Private) Under the Ministry of Education and Culture by Province, 2011/2012
Tabel ––––––
4.1.12Table
ProvinsiProvince
Jumlah Perguruan Tinggi
Number of Universities
Jumlah MahasiswaNumber of Students
Jumlah Tenaga EdukatifNumber of Lecturers
NegeriState
SwastaPrivate
NegeriState
SwastaPrivate
NegeriState
SwastaPrivate
(1) (2) (3) (4) (5) (6) (7)
Aceh 3 100 48 289 119 717 1 815 5 072Sumatera Utara 3 254 61 455 313 529 2 785 10 618Sumatera Barat 5 108 74 874 90 417 2 678 3 125Riau 2 74 36 997 78 853 1 047 2 488Kepulauan Riau 2 27 6 271 26 074 120 1 019Jambi 1 39 14 802 32 972 721 1 147Sumatera Selatan 2 111 34 173 137 529 1 416 4 168Kepulauan Bangka Belitung 2 13 2 051 6 921 47 240Bengkulu 1 16 14 730 34 773 638 1 085Lampung 2 71 30 408 80 794 1 134 2 511
DKI Jakarta 2 5 334 554 952 474 165 3 258 19 509Jawa Barat 7 391 149 768 501 668 6 100 18 143Banten 1 97 13 181 93 872 1 137 3 415Jawa Tengah 6 247 125 898 271 562 5 191 9 910DI Yogyakarta 3 123 90 746 153 412 3 366 5 914Jawa Timur 11 330 179 448 514 478 6 983 18 233
Bali 4 54 33 044 50 741 2 273 2 146Nusa Tenggara Barat 1 48 18 505 93 082 905 3 006Nusa Tenggara Timur 3 36 21 371 47 344 1 181 1 699
Kalimantan Barat 2 43 21 851 41 580 1 073 1 188Kalimantan Tengah 1 21 21 711 60 775 972 1 478Kalimantan Selatan 2 43 9 659 17 243 887 713Kalimantan Timur 5 57 42 813 40 732 1 367 1 717
Sulawesi Utara 4 47 32 184 25 986 2 771 1 355Gorontalo 1 10 17 237 15 426 571 570Sulawesi Tengah 1 30 16 531 48 281 1 058 1 583Sulawesi Selatan 4 212 68 770 270 236 2 706 7 660Sulawesi Barat – 12 – 19 954 – 551Sulawesi Tenggara 1 37 18 378 49 542 851 1 371
Maluku 3 22 25 148 23 833 1 369 767Maluku Utara 1 15 6 647 20 125 397 863Papua 2 42 20 031 29 558 711 1 118Papua Barat 1 14 4 468 15 105 450 584
Indonesia 92 3 078 1 816 391 3 800 279 57 978 134 966
Catatan/Note: 1 Termasuk Institut, Sekolah Tinggi, Akademi, dan Politeknik/Including Institute, College, Academy, and Polytechnic 2 Termasuk Universitas Terbuka/Including Indonesian Open Learning UniversitySumber/Source: Kementerian Pendidikan dan Kebudayaan/Ministry of Education and Culture
http
://www.b
ps.g
o.id
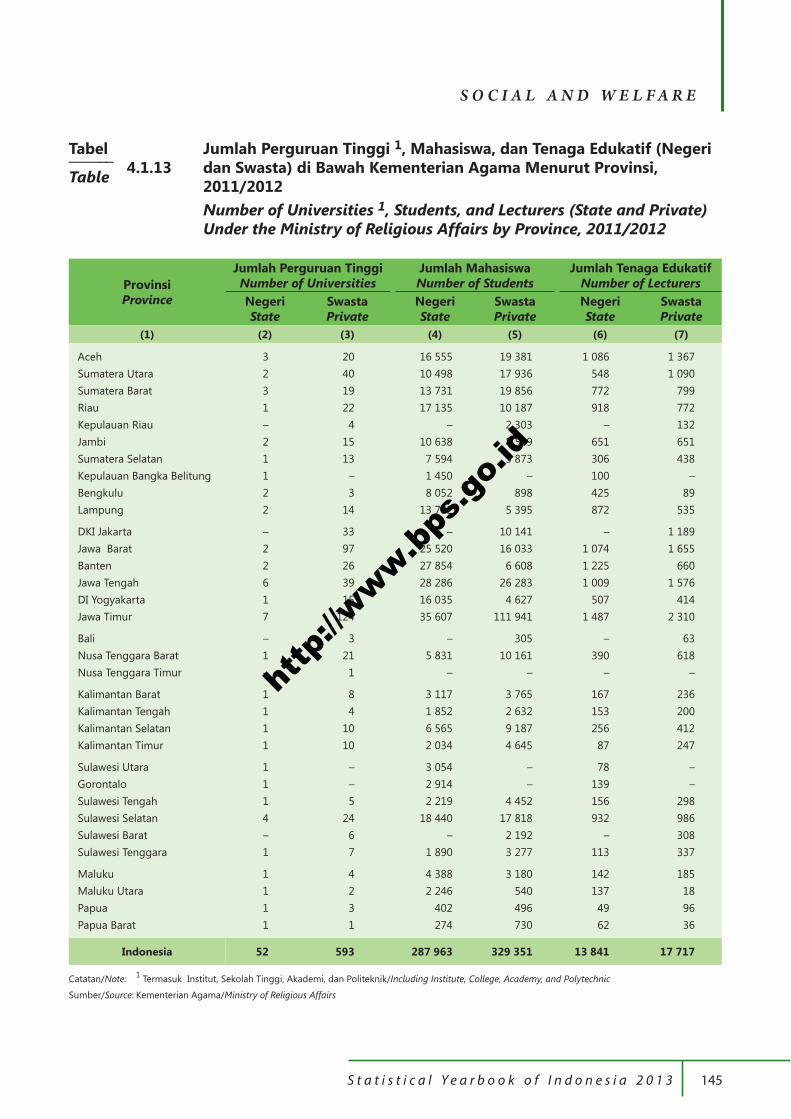
S O C I A L A N D W E L F A R E
S t a t i s t i c a l Y e a r b o o k o f I n d o n e s i a 2 0 1 3 145
Jumlah Perguruan Tinggi 1, Mahasiswa, dan Tenaga Edukatif (Negeri dan Swasta) di Bawah Kementerian Agama Menurut Provinsi, 2011/2012Number of Universities 1, Students, and Lecturers (State and Private) Under the Ministry of Religious Affairs by Province, 2011/2012
Tabel ––––––
4.1.13Table
ProvinsiProvince
Jumlah Perguruan TinggiNumber of Universities
Jumlah MahasiswaNumber of Students
Jumlah Tenaga EdukatifNumber of Lecturers
NegeriState
SwastaPrivate
NegeriState
SwastaPrivate
NegeriState
SwastaPrivate
(1) (2) (3) (4) (5) (6) (7)
Aceh 3 20 16 555 19 381 1 086 1 367Sumatera Utara 2 40 10 498 17 936 548 1 090Sumatera Barat 3 19 13 731 19 856 772 799Riau 1 22 17 135 10 187 918 772Kepulauan Riau – 4 – 2 303 – 132Jambi 2 15 10 638 8 509 651 651Sumatera Selatan 1 13 7 594 5 873 306 438Kepulauan Bangka Belitung 1 – 1 450 – 100 –Bengkulu 2 3 8 052 898 425 89Lampung 2 14 13 782 5 395 872 535
DKI Jakarta – 33 – 10 141 – 1 189Jawa Barat 2 97 25 520 16 033 1 074 1 655Banten 2 26 27 854 6 608 1 225 660Jawa Tengah 6 39 28 286 26 283 1 009 1 576DI Yogyakarta 1 15 16 035 4 627 507 414Jawa Timur 7 124 35 607 111 941 1 487 2 310
Bali – 3 – 305 – 63Nusa Tenggara Barat 1 21 5 831 10 161 390 618Nusa Tenggara Timur – 1 – – – –
Kalimantan Barat 1 8 3 117 3 765 167 236Kalimantan Tengah 1 4 1 852 2 632 153 200Kalimantan Selatan 1 10 6 565 9 187 256 412Kalimantan Timur 1 10 2 034 4 645 87 247
Sulawesi Utara 1 – 3 054 – 78 –Gorontalo 1 – 2 914 – 139 –Sulawesi Tengah 1 5 2 219 4 452 156 298Sulawesi Selatan 4 24 18 440 17 818 932 986Sulawesi Barat – 6 – 2 192 – 308Sulawesi Tenggara 1 7 1 890 3 277 113 337
Maluku 1 4 4 388 3 180 142 185Maluku Utara 1 2 2 246 540 137 18Papua 1 3 402 496 49 96Papua Barat 1 1 274 730 62 36
Indonesia 52 593 287 963 329 351 13 841 17 717
Catatan/Note: 1 Termasuk Institut, Sekolah Tinggi, Akademi, dan Politeknik/Including Institute, College, Academy, and Polytechnic
Sumber/Source: Kementerian Agama/Ministry of Religious Affairs
http
://www.b
ps.g
o.id
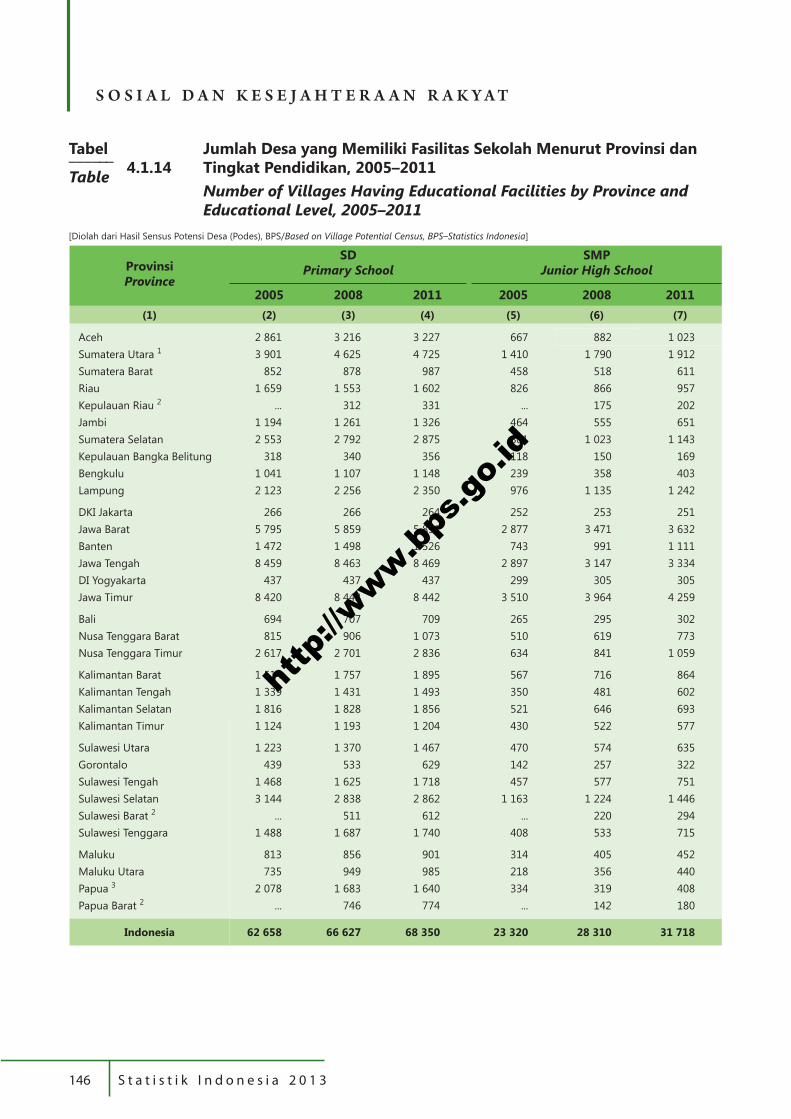
S O S I A L D A N K E S E J A H T E R A A N R A K Y A T
S t a t i s t i k I n d o n e s i a 2 0 1 3146
[Diolah dari Hasil Sensus Potensi Desa (Podes), BPS/Based on Village Potential Census, BPS–Statistics Indonesia]
ProvinsiProvince
SDPrimary School
SMPJunior High School
2005 2008 2011 2005 2008 2011(1) (2) (3) (4) (5) (6) (7)
Aceh 2 861 3 216 3 227 667 882 1 023Sumatera Utara 1 3 901 4 625 4 725 1 410 1 790 1 912Sumatera Barat 852 878 987 458 518 611Riau 1 659 1 553 1 602 826 866 957Kepulauan Riau 2 ... 312 331 ... 175 202Jambi 1 194 1 261 1 326 464 555 651Sumatera Selatan 2 553 2 792 2 875 801 1 023 1 143Kepulauan Bangka Belitung 318 340 356 118 150 169Bengkulu 1 041 1 107 1 148 239 358 403Lampung 2 123 2 256 2 350 976 1 135 1 242
DKI Jakarta 266 266 264 252 253 251Jawa Barat 5 795 5 859 5 891 2 877 3 471 3 632Banten 1 472 1 498 1 526 743 991 1 111Jawa Tengah 8 459 8 463 8 469 2 897 3 147 3 334DI Yogyakarta 437 437 437 299 305 305Jawa Timur 8 420 8 443 8 442 3 510 3 964 4 259
Bali 694 707 709 265 295 302Nusa Tenggara Barat 815 906 1 073 510 619 773Nusa Tenggara Timur 2 617 2 701 2 836 634 841 1 059
Kalimantan Barat 1 514 1 757 1 895 567 716 864Kalimantan Tengah 1 339 1 431 1 493 350 481 602Kalimantan Selatan 1 816 1 828 1 856 521 646 693Kalimantan Timur 1 124 1 193 1 204 430 522 577
Sulawesi Utara 1 223 1 370 1 467 470 574 635Gorontalo 439 533 629 142 257 322Sulawesi Tengah 1 468 1 625 1 718 457 577 751Sulawesi Selatan 3 144 2 838 2 862 1 163 1 224 1 446Sulawesi Barat 2 ... 511 612 ... 220 294Sulawesi Tenggara 1 488 1 687 1 740 408 533 715
Maluku 813 856 901 314 405 452Maluku Utara 735 949 985 218 356 440Papua 3 2 078 1 683 1 640 334 319 408Papua Barat 2 ... 746 774 ... 142 180
Indonesia 62 658 66 627 68 350 23 320 28 310 31 718
Jumlah Desa yang Memiliki Fasilitas Sekolah Menurut Provinsi dan Tingkat Pendidikan, 2005–2011Number of Villages Having Educational Facilities by Province and Educational Level, 2005–2011
Tabel ––––––
4.1.14Table
http
://www.b
ps.g
o.id

S O C I A L A N D W E L F A R E
S t a t i s t i c a l Y e a r b o o k o f I n d o n e s i a 2 0 1 3 147
ProvinsiProvince
SMUSenior High School
SMKVocational School
Perguruan TinggiUniversity
2005 2008 2011 2005 2008 2011 2005 2008 2011(1) (8) (9) (10) (11) (12) (13) (14) (15) (16)
Aceh 334 469 497 58 94 127 67 77 120Sumatera Utara 1 705 912 923 304 393 504 125 168 181Sumatera Barat 254 271 279 110 132 137 79 90 113Riau 366 384 425 93 122 163 60 60 63Kepulauan Riau 2 ... 81 90 ... 27 45 ... 20 20Jambi 198 257 262 56 83 99 35 48 33Sumatera Selatan 345 475 532 86 120 150 54 73 84Kepulauan Bangka Belitung 53 61 68 31 32 37 7 11 14Bengkulu 107 124 134 31 52 66 14 26 24Lampung 391 491 517 167 187 232 44 76 60
DKI Jakarta 228 228 222 135 157 185 122 120 137Jawa Barat 1 215 1 448 1 618 507 739 1 078 277 359 351Banten 366 469 546 111 205 302 73 123 118Jawa Tengah 1 002 1 104 1 126 560 699 883 181 210 228DI Yogyakarta 142 140 136 109 123 128 52 59 56Jawa Timur 1 452 1 728 1 873 587 757 980 260 322 353
Bali 126 131 139 64 76 104 34 47 42Nusa Tenggara Barat 257 339 422 54 85 164 41 73 65Nusa Tenggara Timur 204 247 289 73 95 147 36 47 55
Kalimantan Barat 213 268 283 65 92 108 30 45 47Kalimantan Tengah 127 171 190 35 49 78 16 15 15Kalimantan Selatan 186 246 251 46 56 69 34 51 52Kalimantan Timur 193 232 246 70 100 117 41 54 49
Sulawesi Utara 175 190 212 57 68 121 41 47 58Gorontalo 40 73 80 18 23 40 16 15 15Sulawesi Tengah 162 214 235 61 74 103 50 41 31Sulawesi Selatan 494 547 623 160 169 238 126 150 164Sulawesi Barat 2 ... 76 97 ... 40 58 ... 21 20Sulawesi Tenggara 170 247 285 27 53 84 27 37 67
Maluku 132 184 187 25 52 69 17 26 34Maluku Utara 101 155 175 18 47 72 11 21 17Papua 3 116 127 142 62 59 79 48 39 41Papua Barat 2 ... 58 82 ... 18 35 ... 25 24
Indonesia 9 854 12 147 13 186 3 780 5 078 6 802 2 018 2 596 2 751
Catatan/Note: 1 Data tahun 2005 tidak termasuk Kabupaten Nias dan Nias Selatan/The 2005 data excluded Regency of Nias and Nias Selatan 2 Data tahun 2005 tergabung dengan provinsi induknya/The 2005 data are included in their main provinces 3 Tidak semua desa/kelurahan dicacah/Not all villages were enumerated
Lanjutan Tabel/Continued Table 4.1.14
http
://www.b
ps.g
o.id
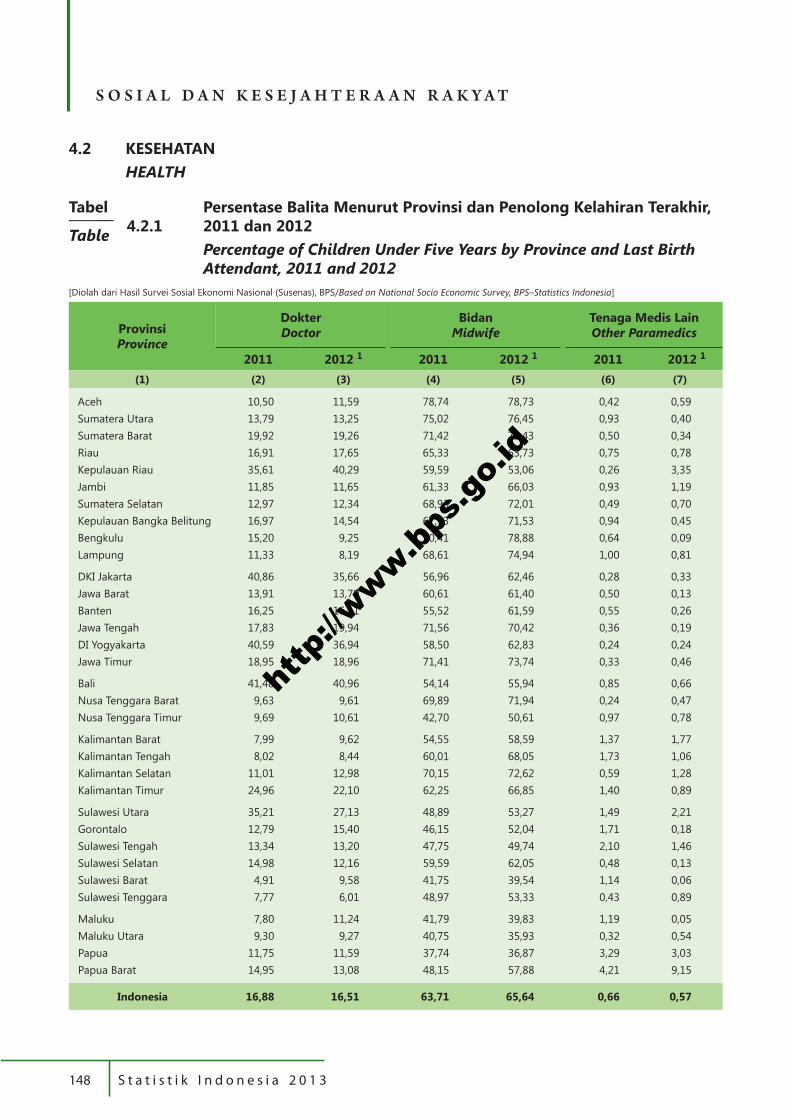
S O S I A L D A N K E S E J A H T E R A A N R A K Y A T
S t a t i s t i k I n d o n e s i a 2 0 1 3148
Persentase Balita Menurut Provinsi dan Penolong Kelahiran Terakhir, 2011 dan 2012Percentage of Children Under Five Years by Province and Last Birth Attendant, 2011 and 2012
Tabel ––––––
4.2.1Table
[Diolah dari Hasil Survei Sosial Ekonomi Nasional (Susenas), BPS/Based on National Socio Economic Survey, BPS–Statistics Indonesia]
ProvinsiProvince
DokterDoctor
BidanMidwife
Tenaga Medis LainOther Paramedics
2011 2012 1 2011 2012 1 2011 2012 1
(1) (2) (3) (4) (5) (6) (7)
Aceh 10,50 11,59 78,74 78,73 0,42 0,59Sumatera Utara 13,79 13,25 75,02 76,45 0,93 0,40Sumatera Barat 19,92 19,26 71,42 72,43 0,50 0,34Riau 16,91 17,65 65,33 63,73 0,75 0,78Kepulauan Riau 35,61 40,29 59,59 53,06 0,26 3,35Jambi 11,85 11,65 61,33 66,03 0,93 1,19Sumatera Selatan 12,97 12,34 68,93 72,01 0,49 0,70Kepulauan Bangka Belitung 16,97 14,54 67,13 71,53 0,94 0,45Bengkulu 15,20 9,25 70,41 78,88 0,64 0,09Lampung 11,33 8,19 68,61 74,94 1,00 0,81
DKI Jakarta 40,86 35,66 56,96 62,46 0,28 0,33Jawa Barat 13,91 13,70 60,61 61,40 0,50 0,13Banten 16,25 16,11 55,52 61,59 0,55 0,26Jawa Tengah 17,83 19,94 71,56 70,42 0,36 0,19DI Yogyakarta 40,59 36,94 58,50 62,83 0,24 0,24Jawa Timur 18,95 18,96 71,41 73,74 0,33 0,46
Bali 41,48 40,96 54,14 55,94 0,85 0,66Nusa Tenggara Barat 9,63 9,61 69,89 71,94 0,24 0,47Nusa Tenggara Timur 9,69 10,61 42,70 50,61 0,97 0,78
Kalimantan Barat 7,99 9,62 54,55 58,59 1,37 1,77Kalimantan Tengah 8,02 8,44 60,01 68,05 1,73 1,06Kalimantan Selatan 11,01 12,98 70,15 72,62 0,59 1,28Kalimantan Timur 24,96 22,10 62,25 66,85 1,40 0,89
Sulawesi Utara 35,21 27,13 48,89 53,27 1,49 2,21Gorontalo 12,79 15,40 46,15 52,04 1,71 0,18Sulawesi Tengah 13,34 13,20 47,75 49,74 2,10 1,46Sulawesi Selatan 14,98 12,16 59,59 62,05 0,48 0,13Sulawesi Barat 4,91 9,58 41,75 39,54 1,14 0,06Sulawesi Tenggara 7,77 6,01 48,97 53,33 0,43 0,89
Maluku 7,80 11,24 41,79 39,83 1,19 0,05Maluku Utara 9,30 9,27 40,75 35,93 0,32 0,54Papua 11,75 11,59 37,74 36,87 3,29 3,03Papua Barat 14,95 13,08 48,15 57,88 4,21 9,15
Indonesia 16,88 16,51 63,71 65,64 0,66 0,57
4.2 KESEHATANHEALTH
http
://www.b
ps.g
o.id

S O C I A L A N D W E L F A R E
S t a t i s t i c a l Y e a r b o o k o f I n d o n e s i a 2 0 1 3 149
Lanjutan Tabel/Continued Table 4.2.1
ProvinsiProvince
DukunTraditional Attendant
FamiliFamily
Lainnya 2Other
JumlahTotal
2011 2012 1 2011 2012 1 2011 2012 1 2011 2012 1
(1) (8) (9) (10) (11) (12) (13) (14) (15)
Aceh 10,00 8,72 0,29 0,37 0,05 0,00 100,00 100,00Sumatera Utara 8,03 8,41 1,80 1,40 0,19 0,09 100,00 100,00Sumatera Barat 7,42 7,76 0,60 0,00 0,21 0,21 100,00 100,00Riau 16,68 17,21 0,18 0,49 0,24 0,14 100,00 100,00Kepulauan Riau 4,30 3,31 0,22 0,00 0,46 0,00 100,00 100,00Jambi 25,60 20,59 0,17 0,18 0,09 0,37 100,00 100,00Sumatera Selatan 17,08 13,98 0,51 0,33 0,04 0,65 100,00 100,00Kepulauan Bangka Belitung 14,48 12,79 0,30 0,69 0,00 0,00 100,00 100,00Bengkulu 13,13 10,93 0,55 0,85 0,32 0,00 100,00 100,00Lampung 18,63 15,67 0,29 0,28 0,00 0,12 100,00 100,00
DKI Jakarta 1,67 1,31 0,00 0,25 0,06 0,00 100,00 100,00Jawa Barat 24,81 24,62 0,09 0,16 0,10 0,00 100,00 100,00Banten 27,62 22,03 0,00 0,00 0,00 0,00 100,00 100,00Jawa Tengah 10,05 9,25 0,11 0,19 0,09 0,00 100,00 100,00DI Yogyakarta 0,68 0,00 0,00 0,00 0,00 0,00 100,00 100,00Jawa Timur 9,14 6,53 0,11 0,20 0,09 0,12 100,00 100,00
Bali 2,20 1,80 1,15 0,65 0,24 0,00 100,00 100,00Nusa Tenggara Barat 19,66 17,59 0,49 0,31 0,20 0,09 100,00 100,00Nusa Tenggara Timur 37,30 28,32 8,88 9,50 0,48 0,17 100,00 100,00
Kalimantan Barat 35,11 29,54 0,93 0,49 0,15 0,00 100,00 100,00Kalimantan Tengah 29,91 22,12 0,30 0,21 0,06 0,13 100,00 100,00Kalimantan Selatan 18,00 12,00 0,20 1,13 0,07 0,00 100,00 100,00Kalimantan Timur 10,58 9,60 0,72 0,55 0,13 0,00 100,00 100,00
Sulawesi Utara 13,33 16,25 0,61 0,95 0,19 0,18 100,00 100,00Gorontalo 38,63 32,38 0,68 0,00 0,12 0,00 100,00 100,00Sulawesi Tengah 32,01 31,04 4,46 4,56 0,12 0,00 100,00 100,00Sulawesi Selatan 21,75 23,02 3,06 2,05 0,30 0,59 100,00 100,00Sulawesi Barat 47,34 48,46 4,86 2,36 0,41 0,00 100,00 100,00Sulawesi Tenggara 41,86 38,94 0,89 0,83 0,17 0,00 100,00 100,00
Maluku 46,33 45,06 2,72 3,61 0,02 0,21 100,00 100,00Maluku Utara 45,80 51,11 3,77 2,92 0,22 0,24 100,00 100,00Papua 11,76 7,89 32,59 39,01 2,66 1,61 100,00 100,00Papua Barat 22,76 12,18 9,13 7,71 0,21 0,00 100,00 100,00
Indonesia 17,34 15,79 1,24 1,37 0,17 0,12 100,00 100,00
Catatan/Note: 1 Data Susenas Triwulan III-2012/Data Susenas Quarter III-2012 2 Termasuk yang tidak tahu penolong kelahirannya/Including those who doubt about their birth attendant
http
://www.b
ps.g
o.id
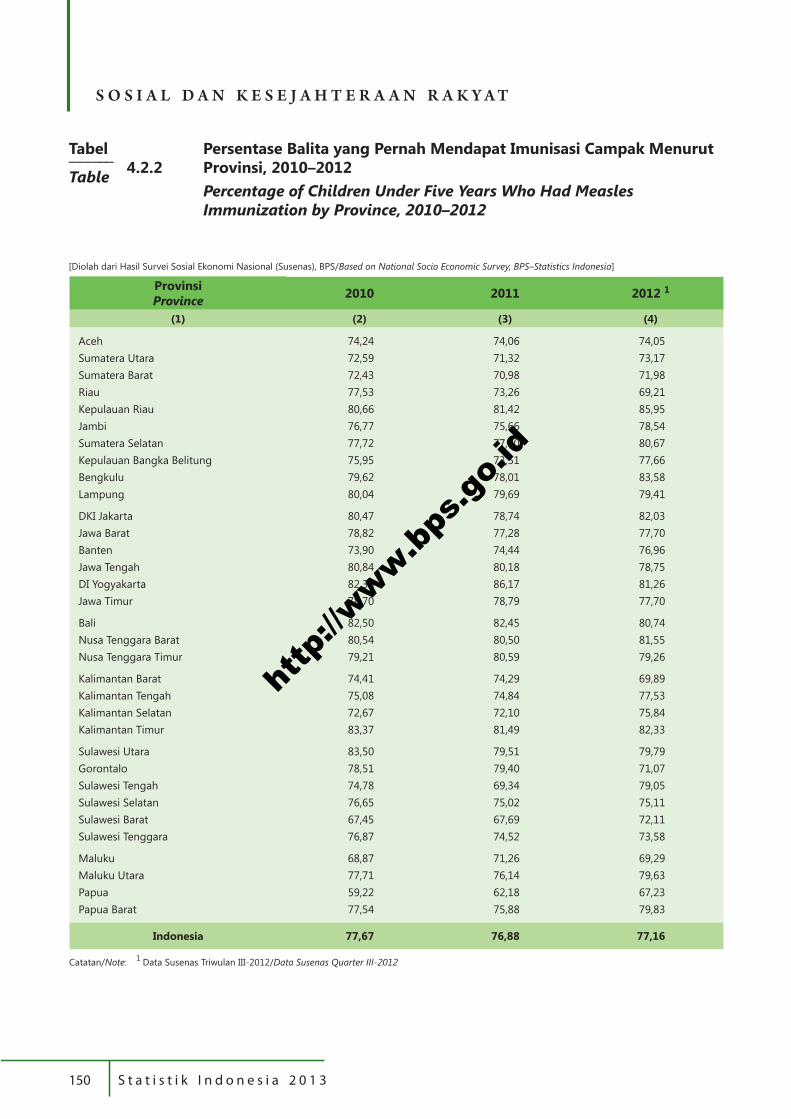
S O S I A L D A N K E S E J A H T E R A A N R A K Y A T
S t a t i s t i k I n d o n e s i a 2 0 1 3150
Persentase Balita yang Pernah Mendapat Imunisasi Campak Menurut Provinsi, 2010–2012Percentage of Children Under Five Years Who Had Measles Immunization by Province, 2010–2012
Tabel ––––––
4.2.2Table
[Diolah dari Hasil Survei Sosial Ekonomi Nasional (Susenas), BPS/Based on National Socio Economic Survey, BPS–Statistics Indonesia]
ProvinsiProvince 2010 2011 2012 1
(1) (2) (3) (4)
Aceh 74,24 74,06 74,05Sumatera Utara 72,59 71,32 73,17Sumatera Barat 72,43 70,98 71,98Riau 77,53 73,26 69,21Kepulauan Riau 80,66 81,42 85,95Jambi 76,77 75,66 78,54Sumatera Selatan 77,72 77,70 80,67Kepulauan Bangka Belitung 75,95 73,51 77,66Bengkulu 79,62 78,01 83,58Lampung 80,04 79,69 79,41
DKI Jakarta 80,47 78,74 82,03Jawa Barat 78,82 77,28 77,70Banten 73,90 74,44 76,96Jawa Tengah 80,84 80,18 78,75DI Yogyakarta 82,36 86,17 81,26Jawa Timur 78,70 78,79 77,70
Bali 82,50 82,45 80,74Nusa Tenggara Barat 80,54 80,50 81,55Nusa Tenggara Timur 79,21 80,59 79,26
Kalimantan Barat 74,41 74,29 69,89Kalimantan Tengah 75,08 74,84 77,53Kalimantan Selatan 72,67 72,10 75,84Kalimantan Timur 83,37 81,49 82,33
Sulawesi Utara 83,50 79,51 79,79Gorontalo 78,51 79,40 71,07Sulawesi Tengah 74,78 69,34 79,05Sulawesi Selatan 76,65 75,02 75,11Sulawesi Barat 67,45 67,69 72,11Sulawesi Tenggara 76,87 74,52 73,58
Maluku 68,87 71,26 69,29Maluku Utara 77,71 76,14 79,63Papua 59,22 62,18 67,23Papua Barat 77,54 75,88 79,83
Indonesia 77,67 76,88 77,16
Catatan/Note: 1 Data Susenas Triwulan III-2012/Data Susenas Quarter III-2012
http
://www.b
ps.g
o.id

S O C I A L A N D W E L F A R E
S t a t i s t i c a l Y e a r b o o k o f I n d o n e s i a 2 0 1 3 151
Persentase Wanita Berumur 15–49 Tahun dan Berstatus Kawin yang Sedang Menggunakan/Memakai Alat KB Menurut Provinsi, 2007–2012Percentage of Married Women Aged 15–49 Years Old Currently Using Contraception Method by Province, 2007–2012
Tabel ––––––
4.2.3Table
[Diolah dari Hasil Survei Sosial Ekonomi Nasional (Susenas), BPS/Based on National Socio Economic Survey, BPS–Statistics Indonesia]
ProvinsiProvince 2007 2008 2009 2010 2011 2012 1
(1) (2) (3) (4) (5) (6) (7)
Aceh 42,80 42,40 49,08 49,55 50,25 54,32Sumatera Utara 45,53 41,91 49,71 48,67 50,66 53,57Sumatera Barat 48,37 47,32 50,57 53,13 53,95 53,41Riau 54,17 52,41 56,53 56,29 57,25 57,93Kepulauan Riau 51,20 53,07 55,54 51,90 50,74 47,45Jambi 64,66 62,16 66,72 65,80 68,05 67,98Sumatera Selatan 61,97 62,92 64,63 65,78 67,03 66,13Kepulauan Bangka Belitung 63,57 64,30 66,16 68,17 66,07 68,06Bengkulu 67,30 67,62 68,46 68,98 71,33 71,92Lampung 64,03 64,58 67,81 69,28 66,91 66,52
DKI Jakarta 54,69 52,68 56,62 57,42 55,21 58,98Jawa Barat 62,28 60,51 63,67 64,57 64,88 66,54Banten 56,64 58,00 60,51 62,18 63,45 68,27Jawa Tengah 60,65 59,19 63,67 63,85 63,95 64,81DI Yogyakarta 56,11 57,42 62,21 61,93 60,90 63,59Jawa Timur 59,65 59,54 63,72 64,16 64,89 67,45
Bali 67,22 65,06 67,85 65,17 64,52 66,59Nusa Tenggara Barat 52,44 53,07 57,88 57,75 59,32 54,52Nusa Tenggara Timur 34,35 35,91 40,77 39,89 41,59 43,91
Kalimantan Barat 61,26 60,73 64,05 65,59 67,45 69,51Kalimantan Tengah 67,46 68,40 70,34 68,16 71,79 74,47Kalimantan Selatan 63,27 64,25 67,76 68,03 70,41 70,83Kalimantan Timur 55,80 55,29 58,32 61,01 61,12 63,77
Sulawesi Utara 67,07 65,19 67,54 68,38 69,12 68,49Gorontalo 64,22 59,54 62,83 64,22 63,13 67,01Sulawesi Tengah 56,83 55,91 61,50 61,08 60,52 63,64Sulawesi Selatan 43,67 43,18 48,65 50,01 51,00 53,05Sulawesi Barat 38,47 45,23 49,78 48,83 49,20 52,61Sulawesi Tenggara 46,61 46,34 50,72 52,60 53,71 52,38
Maluku 30,09 32,10 36,36 39,54 41,89 43,33Maluku Utara 41,90 43,33 48,58 53,13 51,49 52,21Papua 31,92 27,71 33,71 26,97 24,57 26,98Papua Barat 28,29 26,69 36,47 38,48 38,10 41,41
Indonesia 57,43 56,62 60,63 60,94 61,34 62,98
Catatan/Note: 1 Data Susenas Triwulan III-2012/Data Susenas Quarter III-2012
http
://www.b
ps.g
o.id

S O S I A L D A N K E S E J A H T E R A A N R A K Y A T
S t a t i s t i k I n d o n e s i a 2 0 1 3152
Persentase Penduduk yang Mempunyai Keluhan Kesehatan Selama Sebulan Terakhir Menurut Provinsi, 2007–2012Percentage of Population Having Health Complaint During The Last Month by Province, 2007–2012
Tabel ––––––
4.2.4Table
[Diolah dari Hasil Survei Sosial Ekonomi Nasional (Susenas), BPS/Based on National Socio Economic Survey, BPS–Statistics Indonesia]
ProvinsiProvince 2007 2008 2009 2010 2011 2012 1
(1) (2) (3) (4) (5) (6) (7)
Aceh 40,81 36,80 35,28 35,09 30,62 27,70Sumatera Utara 25,40 25,19 29,11 26,68 25,44 20,55Sumatera Barat 31,74 34,65 35,44 33,27 29,29 29,33Riau 30,49 30,35 29,89 30,90 24,84 24,20Kepulauan Riau 30,43 29,81 37,14 28,03 21,34 23,66Jambi 21,03 25,77 26,45 29,62 22,77 20,15Sumatera Selatan 31,34 36,18 32,24 29,68 27,19 23,40Kepulauan Bangka Belitung 36,93 36,06 43,02 33,98 31,25 28,61Bengkulu 32,18 32,50 31,53 33,74 30,72 29,43Lampung 35,98 36,49 37,45 34,65 30,59 32,75
DKI Jakarta 32,16 37,83 36,76 33,81 32,69 31,66Jawa Barat 28,89 32,07 32,24 28,00 28,93 27,09Banten 29,53 37,01 37,73 33,02 34,02 29,46Jawa Tengah 28,49 32,05 32,50 28,72 30,15 32,44DI Yogyakarta 38,41 39,10 41,32 40,12 37,51 36,86Jawa Timur 30,12 31,81 32,06 28,46 27,20 26,42
Bali 36,17 39,58 38,35 40,12 37,10 33,56Nusa Tenggara Barat 37,79 38,81 39,59 38,10 34,75 34,18Nusa Tenggara Timur 45,70 47,04 47,23 44,95 39,81 37,29
Kalimantan Barat 32,81 33,92 33,02 34,39 27,75 24,64Kalimantan Tengah 27,13 26,04 28,05 31,03 26,16 26,06Kalimantan Selatan 34,34 40,19 42,53 36,86 34,18 31,24Kalimantan Timur 27,58 27,82 28,88 30,31 22,46 21,99
Sulawesi Utara 35,05 38,43 35,78 32,54 26,05 28,07Gorontalo 44,10 49,66 48,48 42,65 40,82 34,71Sulawesi Tengah 39,12 39,65 37,61 39,05 34,02 30,77Sulawesi Selatan 29,88 28,56 31,69 30,64 27,51 25,97Sulawesi Barat 34,21 36,39 38,08 35,86 33,70 36,21Sulawesi Tenggara 35,64 36,50 35,90 35,77 26,93 28,02
Maluku 31,60 34,47 36,32 31,93 26,79 20,30Maluku Utara 35,18 35,59 27,61 32,11 21,68 17,75Papua 32,21 31,81 32,98 31,95 26,15 21,42Papua Barat 32,09 29,51 30,18 31,27 25,49 19,72
Indonesia 30,90 33,24 33,68 30,97 29,31 28,02
Catatan/Note: 1 Data Susenas Triwulan III-2012/Data Susenas Quarter 3 in 2012
http
://www.b
ps.g
o.id

S O C I A L A N D W E L F A R E
S t a t i s t i c a l Y e a r b o o k o f I n d o n e s i a 2 0 1 3 153
Persentase Penduduk yang Mengobati Sendiri Selama Sebulan Terakhir Menurut Provinsi dan Jenis Obat yang Digunakan, 2010–2012Percentage of Population Who Had Self Treatment During the Last Month by Province and Type of Medicine, 2010–2012
Tabel ––––––
4.2.5Table
[Diolah dari Hasil Survei Sosial Ekonomi Nasional (Susenas), BPS/Based on National Socio Economic Survey, BPS–Statistics Indonesia]
ProvinsiProvince
ModernModern
TradisionalTraditional
LainnyaOthers
2010 2011 2012 1 2010 2011 2012 1 2010 2011 2012 1
(1) (2) (3) (4) (5) (6) (7) (8) (9) (10)
Aceh 91,51 88,98 89,63 37,36 35,77 38,69 3,75 5,14 4,34Sumatera Utara 90,48 90,60 91,52 26,48 24,26 29,24 4,56 4,53 2,40Sumatera Barat 82,94 80,66 83,12 39,11 39,49 32,36 3,54 4,07 3,25Riau 89,59 91,60 91,39 31,70 27,25 27,02 5,54 5,13 7,11Kepulauan Riau 91,75 91,15 92,65 23,18 24,74 18,97 5,08 4,91 3,51Jambi 91,14 92,30 91,87 30,39 29,02 26,68 5,21 3,43 4,97Sumatera Selatan 91,45 91,34 92,04 34,27 25,56 28,58 8,00 5,76 4,09Kepulauan Bangka Belitung 93,87 94,15 94,72 28,69 21,49 19,00 11,91 4,88 5,28Bengkulu 91,59 89,24 91,01 32,59 28,37 30,74 4,20 5,37 6,14Lampung 91,31 88,59 88,82 29,57 27,12 24,63 6,52 6,45 6,55
DKI Jakarta 91,73 94,05 89,87 19,69 14,21 31,85 6,95 2,88 6,63Jawa Barat 93,64 93,93 95,32 22,92 18,72 19,07 4,64 3,65 2,34Banten 93,34 95,47 94,98 20,36 16,14 21,48 4,83 3,69 5,60Jawa Tengah 91,03 92,17 92,24 25,86 19,33 17,74 6,29 4,89 4,76DI Yogyakarta 86,96 87,07 91,40 23,83 17,60 19,09 5,85 5,82 4,46Jawa Timur 89,30 89,08 90,06 33,24 29,49 29,92 6,14 5,09 4,30
Bali 85,58 80,39 79,13 49,70 39,88 41,78 10,92 5,11 6,54Nusa Tenggara Barat 89,33 87,75 89,32 24,39 25,19 26,56 3,18 2,18 3,33Nusa Tenggara Timur 84,21 80,94 82,73 31,26 31,35 28,17 5,14 3,69 4,65
Kalimantan Barat 90,44 90,79 93,04 25,30 29,40 27,70 6,20 7,23 6,52Kalimantan Tengah 93,25 95,44 94,69 23,34 23,78 21,64 4,68 4,56 3,81Kalimantan Selatan 95,98 95,97 95,92 18,94 18,02 20,61 5,83 3,28 2,62Kalimantan Timur 92,83 92,07 94,48 21,97 21,77 24,63 4,05 3,86 2,03
Sulawesi Utara 92,73 90,62 92,11 17,81 17,94 14,16 3,41 4,83 3,32Gorontalo 96,10 97,44 97,61 23,75 12,51 15,69 3,54 2,25 1,36Sulawesi Tengah 92,10 90,96 90,65 27,44 22,40 19,31 4,09 3,79 6,36Sulawesi Selatan 89,89 89,84 90,26 26,72 27,16 25,40 4,67 3,33 5,05Sulawesi Barat 87,17 87,55 91,39 26,85 25,69 21,62 5,53 3,26 1,69Sulawesi Tenggara 91,49 92,57 93,07 24,21 20,70 21,17 3,75 3,94 3,69
Maluku 90,51 89,70 92,04 26,95 26,28 23,27 2,28 3,31 2,05Maluku Utara 89,11 89,30 89,21 36,54 35,27 42,48 6,51 4,35 5,34Papua 66,42 66,04 76,34 55,86 56,73 50,07 5,25 5,81 4,01Papua Barat 86,17 80,83 84,52 24,92 33,46 28,76 4,23 3,03 4,56
Indonesia 90,75 90,96 91,60 27,58 23,63 24,54 5,48 4,38 4,23
Catatan/Note: 1 Data Susenas Triwulan III-2012/Data Susenas Quarter III-2012
http
://www.b
ps.g
o.id

S O S I A L D A N K E S E J A H T E R A A N R A K Y A T
S t a t i s t i k I n d o n e s i a 2 0 1 3154
Jumlah Kasus Penyakit Menurut Provinsi dan Jenis Penyakit, 2011Number of Disease Cases by Province and Type of Disease, 2011
Tabel ––––––
4.2.6Table
ProvinsiProvince
MalariaMalaria
TB Paru Tubercu-
losis
Pneumonia 1Pneumonia 1
KustaLeprosy
Tetanus Neona-torum
Tetanus Neona-torum
CampakMeasles
Diare 2Diar-rhea 2
DBDDHF
(1) (2) (3) (4) (5) (6) (7) (8) (9)
Aceh 39 818 4 377 1 925 592 3 704 40 2 568Sumatera Utara 76 525 18 553 16 688 170 0 156 0 5 987Sumatera Barat 3 833 6 691 7 525 75 7 484 0 2 202Riau 5 134 4 732 8 145 112 7 331 163 2 955Kepulauan Riau 8 791 1 907 896 14 0 926 1 426 1 036Jambi 44 641 3 425 5 126 98 1 270 0 1 879Sumatera Selatan 15 312 8 067 18 165 296 2 479 0 2 015Kepulauan Bangka Belitung 31 715 1 405 4 126 33 0 157 0 320Bengkulu 44 368 1 769 1 309 17 0 123 0 681Lampung 25 065 7 720 4 973 143 7 716 33 1 494
DKI Jakarta 0 25 647 40 296 543 0 4 192 0 6 653Jawa Barat 35 280 62 563 168 140 2 057 2 4 276 229 13 836Banten 1 303 14 898 15 416 500 38 1 903 268 1 736Jawa Tengah 10 655 39 238 18 477 2 233 3 1 839 153 4 474DI Yogyakarta – 2 411 1 739 140 0 1 282 0 982Jawa Timur 1 810 41 467 73 786 5 284 22 1 221 32 5 372
Bali 1 587 3 183 3 215 114 0 124 0 2 996Nusa Tenggara Barat 44 937 5 321 32 669 370 0 30 0 451Nusa Tenggara Timur 233 717 5 876 5 515 282 0 276 50 304
Kalimantan Barat 98 240 5 681 2 994 52 13 222 0 729Kalimantan Tengah 35 115 2 379 623 61 0 223 179 517Kalimantan Selatan 22 086 4 905 13 005 185 0 115 0 400Kalimantan Timur 16 321 4 154 5 602 66 2 131 0 1 416
Sulawesi Utara 30 477 5 738 1 414 394 0 211 121 364Gorontalo 18 568 1 826 1 656 187 0 85 13 23Sulawesi Tengah 65 373 3 215 8 160 320 3 547 57 2 045Sulawesi Selatan 23 810 10 970 8 384 1 338 3 603 – 1 520Sulawesi Barat 21 183 1 545 2 280 159 0 3 203 88Sulawesi Tenggara 26 139 3 983 5 055 318 1 104 36 214
Maluku 8 718 3 605 2 327 671 0 0 0 11Maluku Utara 13 578 1 204 402 597 0 64 0 164Papua 228 935 6 499 ... 1 290 0 82 0 –Papua Barat 88 417 1 608 ... 660 0 14 0 –
Indonesia 1 321 451 316 562 480 033 19 371 114 21 893 0 65 432
Catatan/Note: 1 Pneumonia pada balita/Pneumonia in children under five years 2 Jumlah Kejadian luar biasa/Number of extra ordinary cases
Sumber/Source: Profil Data Kesehatan Indonesia 2011, Kementerian Kesehatan/Health Data Profile of Indonesia 2011, Ministry of Health
http
://www.b
ps.g
o.id
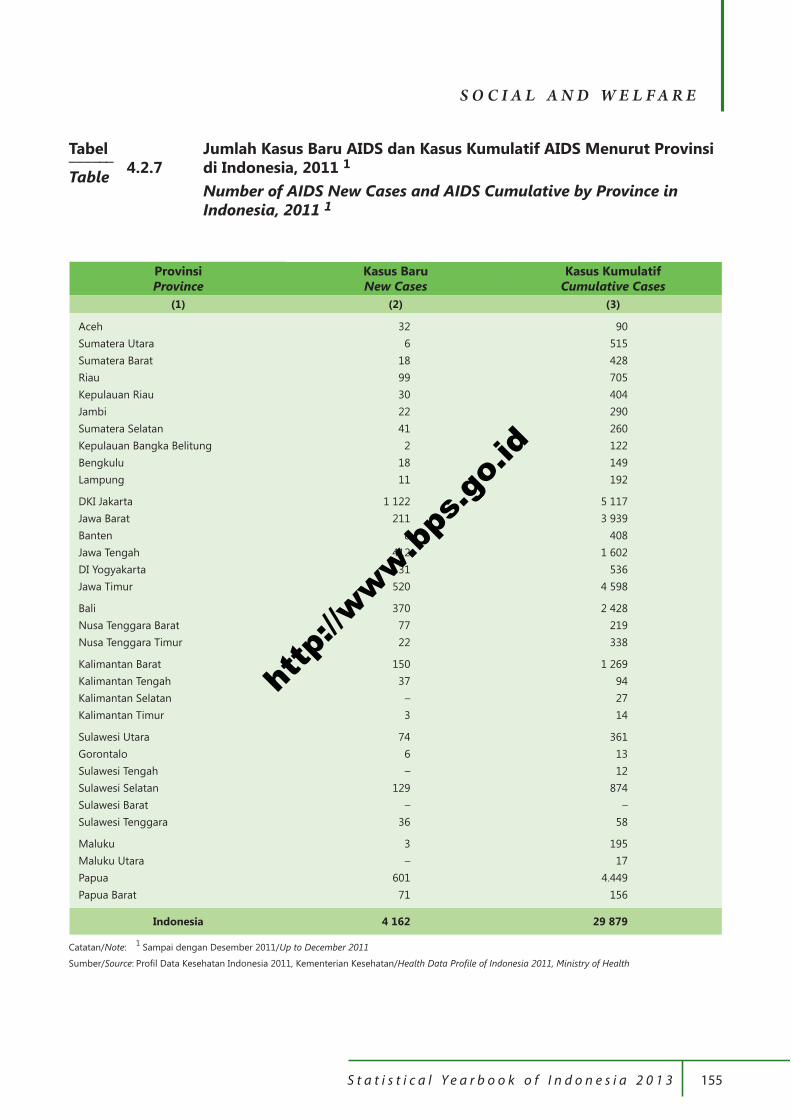
S O C I A L A N D W E L F A R E
S t a t i s t i c a l Y e a r b o o k o f I n d o n e s i a 2 0 1 3 155
Jumlah Kasus Baru AIDS dan Kasus Kumulatif AIDS Menurut Provinsi di Indonesia, 2011 1
Number of AIDS New Cases and AIDS Cumulative by Province in Indonesia, 2011 1
Tabel ––––––
4.2.7Table
Catatan/Note: 1 Sampai dengan Desember 2011/Up to December 2011
Sumber/Source: Profil Data Kesehatan Indonesia 2011, Kementerian Kesehatan/Health Data Profile of Indonesia 2011, Ministry of Health
ProvinsiProvince
Kasus BaruNew Cases
Kasus KumulatifCumulative Cases
(1) (2) (3)
Aceh 32 90Sumatera Utara 6 515Sumatera Barat 18 428Riau 99 705Kepulauan Riau 30 404Jambi 22 290Sumatera Selatan 41 260Kepulauan Bangka Belitung 2 122Bengkulu 18 149Lampung 11 192
DKI Jakarta 1 122 5 117Jawa Barat 211 3 939Banten 8 408Jawa Tengah 412 1 602DI Yogyakarta 31 536Jawa Timur 520 4 598
Bali 370 2 428Nusa Tenggara Barat 77 219Nusa Tenggara Timur 22 338
Kalimantan Barat 150 1 269Kalimantan Tengah 37 94Kalimantan Selatan – 27Kalimantan Timur 3 14
Sulawesi Utara 74 361Gorontalo 6 13Sulawesi Tengah – 12Sulawesi Selatan 129 874Sulawesi Barat – –Sulawesi Tenggara 36 58
Maluku 3 195Maluku Utara – 17Papua 601 4.449Papua Barat 71 156
Indonesia 4 162 29 879
http
://www.b
ps.g
o.id

S O S I A L D A N K E S E J A H T E R A A N R A K Y A T
S t a t i s t i k I n d o n e s i a 2 0 1 3156
Jumlah Rumah Sakit Umum, Rumah Sakit Khusus, dan Puskesmas Menurut Provinsi, 2010 dan 2011Number of General Hospitals, Special Hospitals, and Public Health Centers by Province, 2010 and 2011
Tabel ––––––
4.2.8Table
ProvinsiProvince
Rumah Sakit UmumGeneral Hospitals
Rumah Sakit KhususSpecial Hospitals
PuskesmasPublic Health Centers
2010 2011 2010 2011 2010 2011(1) (2) (3) (4) (5) (6) (7)
Aceh 38 39 5 6 315 325Sumatera Utara 134 139 14 14 506 542Sumatera Barat 31 33 12 12 246 254Riau 35 37 5 5 193 203Kepulauan Riau 19 19 2 3 66 67Jambi 20 20 2 2 169 174Sumatera Selatan 32 34 6 7 293 304Kepulauan Bangka Belitung 9 10 1 1 58 58Bengkulu 14 17 1 1 170 178Lampung 29 31 4 5 265 269
DKI Jakarta 79 81 51 51 341 341Jawa Barat 142 150 49 50 1 028 1 045Banten 25 32 12 14 217 225Jawa Tengah 153 163 56 62 867 867DI Yogyakarta 30 31 19 20 121 121Jawa Timur 149 151 35 36 946 955
Bali 32 34 9 9 114 114Nusa Tenggara Barat 14 14 3 3 150 152Nusa Tenggara Timur 29 32 1 2 309 342
Kalimantan Barat 25 26 6 7 231 234Kalimantan Tengah 15 15 0 0 174 179Kalimantan Selatan 24 24 5 5 214 224Kalimantan Timur 31 32 4 4 217 215
Sulawesi Utara 30 31 1 1 170 170Gorontalo 7 8 1 1 76 86Sulawesi Tengah 18 18 5 5 160 173Sulawesi Selatan 45 48 18 19 416 422Sulawesi Barat 5 7 0 0 81 86Sulawesi Tenggara 19 20 2 2 233 249
Maluku 21 22 2 2 156 170Maluku Utara 13 15 0 0 100 115Papua 22 26 2 2 297 336Papua Barat 10 11 0 0 106 126
Indonesia 1 299 1 370 333 351 9 005 9 321
Sumber/Source: Profil Kesehatan Indonesia 2010 dan Profil Data Kesehatan Indonesia 2011, Kementerian Kesehatan Health Profile of Indonesia 2010 and Health Data Profile of Indonesia 2011, Ministry of Health
http
://www.b
ps.g
o.id

S O C I A L A N D W E L F A R E
S t a t i s t i c a l Y e a r b o o k o f I n d o n e s i a 2 0 1 3 157
Perbandingan Data Tuberkulosis di Negara-Negara ASEAN dan WHO-SEARO, 2010Comparation of Tuberculosis Data Between ASEAN and WHO-SEARO Member Countries, 2010
Tabel ––––––
4.2.9Table
Sumber/Source: Statistik Kesehatan Dunia 2012, WHO/World Health Statistics 2012, WHO
NegaraCountry
Prevalensi Tuberkulosis per 100.000Penduduk
Tuberculosis Prevalence per 100.000 Population
Angka Insiden
Tuberkulosis per 100.000 Penduduk
Tuberculosis Incidence Rate per 100.000
Population
Angka Kematian Disebabkan Tuberkulosis
(Pada Bukan Penderita HIV)
Mortality Rate Caused by Tuberculosis (Among HIV-Negative
People)
Angka Penemuan
Kasus Tuberkulosis
Case-Detection Rate for
All Form of Tuberculosis
Angka Keberhasilan Pengobatan Tuberkulosis Smear Positif
Treatment-Success Rate for Smear-
Positive Tuberculosis
(1) (2) (3) (4) (5) (6)
Bangladesh 411 225 43 46 92
Bhutan 181 151 9,2 120 92
Brunei Darussalam 91 68 2,7 88 71
Filipina/Philippines 502 275 33 65 89
India 256 185 26 59 88
Indonesia 289 189 27 66 91
Kamboja/Cambodia 660 437 61 65 95
Korea Utara/Republic of Korea 151 97 23 90 83
Laos/Lao People Democratic Republic 130 90 11 72 93
Maladewa/Maldives 13 36 3,4 83 47
Malaysia 107 82 8,5 80 78
Myanmar 525 384 41 71 85
Nepal 238 163 21 72 90
Singapura/Singapore 44 35 2,3 87 82
Sri Lanka 101 66 9,1 69 86
Thailand 182 137 16 70 86
Timor Leste 634 498 46 – –
Vietnam 334 199 34 54 92
http
://www.b
ps.g
o.id
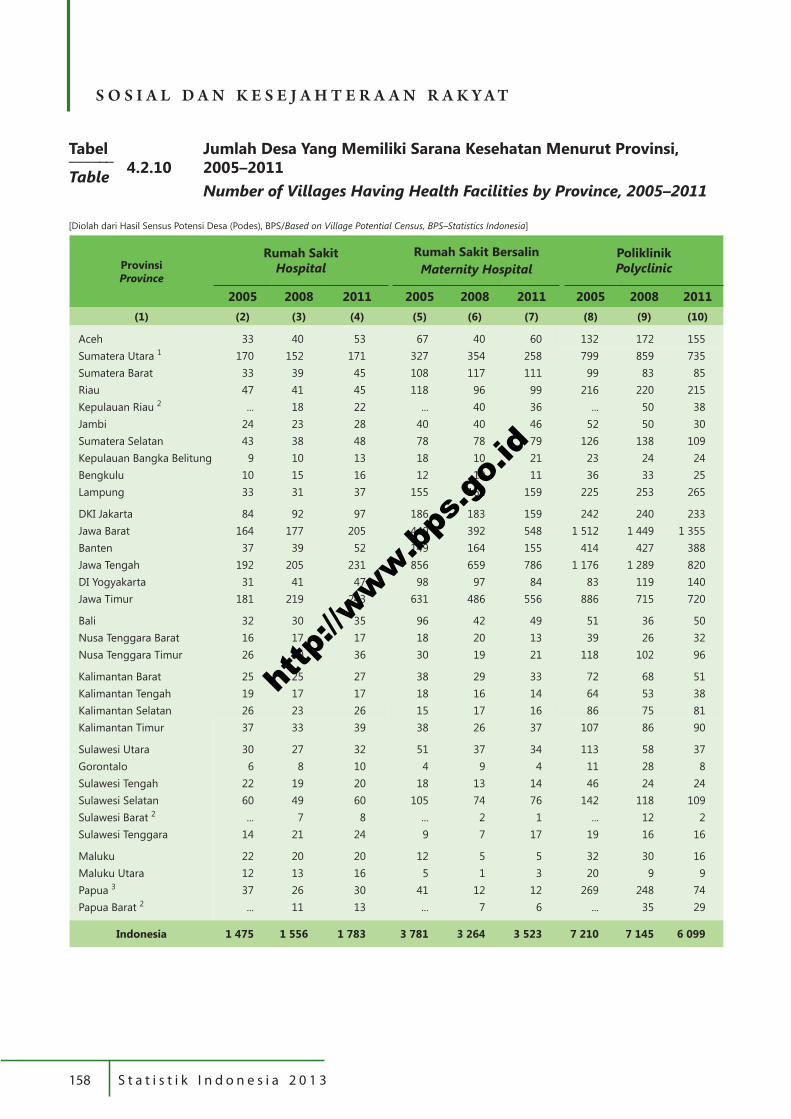
S O S I A L D A N K E S E J A H T E R A A N R A K Y A T
S t a t i s t i k I n d o n e s i a 2 0 1 3158
[Diolah dari Hasil Sensus Potensi Desa (Podes), BPS/Based on Village Potential Census, BPS–Statistics Indonesia]
ProvinsiProvince
Rumah SakitHospital
Rumah Sakit BersalinMaternity Hospital
PoliklinikPolyclinic
2005 2008 2011 2005 2008 2011 2005 2008 2011(1) (2) (3) (4) (5) (6) (7) (8) (9) (10)
Aceh 33 40 53 67 40 60 132 172 155Sumatera Utara 1 170 152 171 327 354 258 799 859 735Sumatera Barat 33 39 45 108 117 111 99 83 85Riau 47 41 45 118 96 99 216 220 215Kepulauan Riau 2 ... 18 22 ... 40 36 ... 50 38Jambi 24 23 28 40 40 46 52 50 30Sumatera Selatan 43 38 48 78 78 79 126 138 109Kepulauan Bangka Belitung 9 10 13 18 10 21 23 24 24Bengkulu 10 15 16 12 10 11 36 33 25Lampung 33 31 37 155 162 159 225 253 265
DKI Jakarta 84 92 97 186 183 159 242 240 233Jawa Barat 164 177 205 440 392 548 1 512 1 449 1 355Banten 37 39 52 149 164 155 414 427 388Jawa Tengah 192 205 231 856 659 786 1 176 1 289 820DI Yogyakarta 31 41 47 98 97 84 83 119 140Jawa Timur 181 219 243 631 486 556 886 715 720
Bali 32 30 35 96 42 49 51 36 50Nusa Tenggara Barat 16 17 17 18 20 13 39 26 32Nusa Tenggara Timur 26 30 36 30 19 21 118 102 96
Kalimantan Barat 25 25 27 38 29 33 72 68 51Kalimantan Tengah 19 17 17 18 16 14 64 53 38Kalimantan Selatan 26 23 26 15 17 16 86 75 81Kalimantan Timur 37 33 39 38 26 37 107 86 90
Sulawesi Utara 30 27 32 51 37 34 113 58 37Gorontalo 6 8 10 4 9 4 11 28 8Sulawesi Tengah 22 19 20 18 13 14 46 24 24Sulawesi Selatan 60 49 60 105 74 76 142 118 109Sulawesi Barat 2 ... 7 8 ... 2 1 ... 12 2Sulawesi Tenggara 14 21 24 9 7 17 19 16 16
Maluku 22 20 20 12 5 5 32 30 16Maluku Utara 12 13 16 5 1 3 20 9 9Papua 3 37 26 30 41 12 12 269 248 74Papua Barat 2 ... 11 13 ... 7 6 ... 35 29
Indonesia 1 475 1 556 1 783 3 781 3 264 3 523 7 210 7 145 6 099
Jumlah Desa Yang Memiliki Sarana Kesehatan Menurut Provinsi, 2005–2011Number of Villages Having Health Facilities by Province, 2005–2011
Tabel ––––––
4.2.10Table
http
://www.b
ps.g
o.id
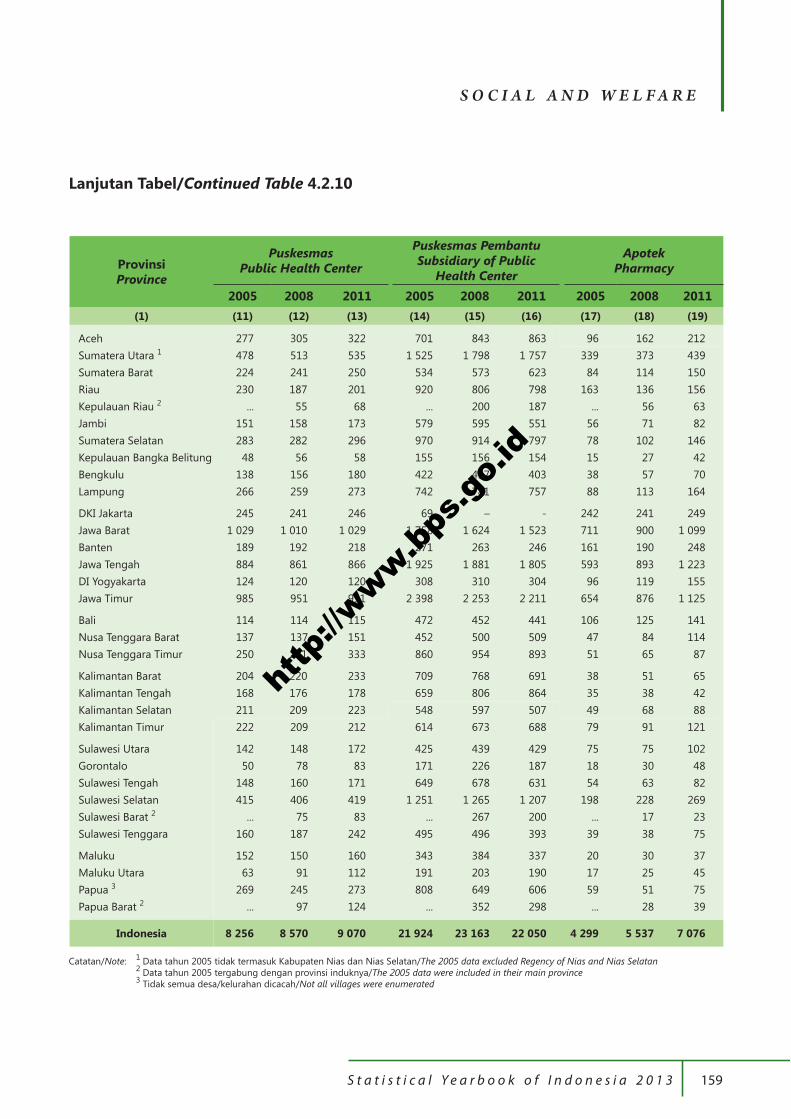
S O C I A L A N D W E L F A R E
S t a t i s t i c a l Y e a r b o o k o f I n d o n e s i a 2 0 1 3 159
ProvinsiProvince
PuskesmasPublic Health Center
Puskesmas PembantuSubsidiary of Public
Health Center
ApotekPharmacy
2005 2008 2011 2005 2008 2011 2005 2008 2011(1) (11) (12) (13) (14) (15) (16) (17) (18) (19)
Aceh 277 305 322 701 843 863 96 162 212Sumatera Utara 1 478 513 535 1 525 1 798 1 757 339 373 439Sumatera Barat 224 241 250 534 573 623 84 114 150Riau 230 187 201 920 806 798 163 136 156Kepulauan Riau 2 ... 55 68 ... 200 187 ... 56 63Jambi 151 158 173 579 595 551 56 71 82Sumatera Selatan 283 282 296 970 914 797 78 102 146Kepulauan Bangka Belitung 48 56 58 155 156 154 15 27 42Bengkulu 138 156 180 422 457 403 38 57 70Lampung 266 259 273 742 781 757 88 113 164
DKI Jakarta 245 241 246 69 – - 242 241 249Jawa Barat 1 029 1 010 1 029 1 758 1 624 1 523 711 900 1 099Banten 189 192 218 271 263 246 161 190 248Jawa Tengah 884 861 866 1 925 1 881 1 805 593 893 1 223DI Yogyakarta 124 120 120 308 310 304 96 119 155Jawa Timur 985 951 951 2 398 2 253 2 211 654 876 1 125
Bali 114 114 115 472 452 441 106 125 141Nusa Tenggara Barat 137 137 151 452 500 509 47 84 114Nusa Tenggara Timur 250 281 333 860 954 893 51 65 87
Kalimantan Barat 204 220 233 709 768 691 38 51 65Kalimantan Tengah 168 176 178 659 806 864 35 38 42Kalimantan Selatan 211 209 223 548 597 507 49 68 88Kalimantan Timur 222 209 212 614 673 688 79 91 121
Sulawesi Utara 142 148 172 425 439 429 75 75 102Gorontalo 50 78 83 171 226 187 18 30 48Sulawesi Tengah 148 160 171 649 678 631 54 63 82Sulawesi Selatan 415 406 419 1 251 1 265 1 207 198 228 269Sulawesi Barat 2 ... 75 83 ... 267 200 ... 17 23Sulawesi Tenggara 160 187 242 495 496 393 39 38 75
Maluku 152 150 160 343 384 337 20 30 37Maluku Utara 63 91 112 191 203 190 17 25 45Papua 3 269 245 273 808 649 606 59 51 75Papua Barat 2 ... 97 124 ... 352 298 ... 28 39
Indonesia 8 256 8 570 9 070 21 924 23 163 22 050 4 299 5 537 7 076
Catatan/Note: 1 Data tahun 2005 tidak termasuk Kabupaten Nias dan Nias Selatan/The 2005 data excluded Regency of Nias and Nias Selatan 2 Data tahun 2005 tergabung dengan provinsi induknya/The 2005 data were included in their main province 3 Tidak semua desa/kelurahan dicacah/Not all villages were enumerated
Lanjutan Tabel/Continued Table 4.2.10
http
://www.b
ps.g
o.id

S O S I A L D A N K E S E J A H T E R A A N R A K Y A T
S t a t i s t i k I n d o n e s i a 2 0 1 3160
Persentase Rumah Tangga Menurut Provinsi dan Luas Lantai (m2), 2012 1
Percentage of Households by Province and Floor Area (m2), 2012 1
Tabel ––––––
4.3.1Table
[Diolah dari Hasil Survei Sosial Ekonomi Nasional (Susenas), BPS/Based on National Socio Economic Survey, BPS–Statistics Indonesia]
ProvinsiProvince
Luas Lantai/Floor Area (m2) JumlahTotal<=19 20–49 50–99 100–149 150+
(1) (2) (3) (4) (5) (6) (7)
Aceh 2,46 51,10 35,93 7,31 3,21 100,00Sumatera Utara 3,47 41,46 42,75 8,97 3,35 100,00Sumatera Barat 3,76 36,07 43,82 10,92 5,43 100,00Riau 2,36 44,90 40,31 9,23 3,20 100,00Kepulauan Riau 2,81 36,97 46,83 10,07 3,32 100,00Jambi 3,87 46,57 40,26 6,01 3,28 100,00Sumatera Selatan 5,21 45,11 41,36 5,43 2,88 100,00Kepulauan Bangka Belitung 1,56 25,63 56,64 11,94 4,23 100,00Bengkulu 0,78 35,31 49,28 11,39 3,24 100,00Lampung 9,87 41,61 35,76 7,20 5,56 100,00
DKI Jakarta 21,87 35,80 23,86 8,41 10,06 100,00Jawa Barat 5,23 42,53 40,20 8,14 3,91 100,00Banten 1,62 15,44 54,19 17,89 10,87 100,00Jawa Tengah 9,32 15,22 46,55 17,45 11,47 100,00DI Yogyakarta 3,22 23,61 54,06 12,32 6,79 100,00Jawa Timur 5,53 33,03 45,76 10,58 5,10 100,00
Bali 13,76 28,46 37,02 12,53 8,22 100,00Nusa Tenggara Barat 10,79 58,60 25,08 3,41 2,12 100,00Nusa Tenggara Timur 5,38 56,21 31,67 5,05 1,68 100,00
Kalimantan Barat 1,93 43,63 42,40 7,62 4,42 100,00Kalimantan Tengah 4,25 50,34 37,06 5,60 2,75 100,00Kalimantan Selatan 5,01 42,59 41,46 7,11 3,82 100,00Kalimantan Timur 3,09 38,34 43,97 9,12 5,49 100,00
Sulawesi Utara 8,03 51,34 28,57 7,00 5,06 100,00Gorontalo 4,40 41,69 40,21 9,75 3,95 100,00Sulawesi Tengah 3,39 28,81 45,95 15,71 6,15 100,00Sulawesi Selatan 3,79 35,54 45,86 10,12 4,69 100,00Sulawesi Barat 5,06 49,51 31,70 9,70 4,03 100,00Sulawesi Tenggara 5,53 40,47 42,75 8,41 2,84 100,00
Maluku 3,88 43,42 41,93 6,94 3,84 100,00Maluku Utara 2,83 35,85 51,92 7,31 2,09 100,00Papua 5,33 56,58 30,19 5,05 2,85 100,00Papua Barat 30,78 51,81 13,82 2,62 0,98 100,00
Indonesia 5,17 34,16 44,21 10,68 5,78 100,00
4.3 PERUMAHAN DAN LINGKUNGAN HOUSING AND ENVIRONMENT
Catatan/Note: 1 Data Susenas Triwulan III-2012/Data Susenas Quarter III-2012
http
://www.b
ps.g
o.id

S O C I A L A N D W E L F A R E
S t a t i s t i c a l Y e a r b o o k o f I n d o n e s i a 2 0 1 3 161
Persentase Rumah Tangga Menurut Provinsi dan Sumber Air Minum, 2012 1
Percentage of Households by Province and Source of Drinking Water, 2012 1
Tabel ––––––
4.3.2Table
[Diolah dari Hasil Survei Sosial Ekonomi Nasional (Susenas), BPS/Based on National Socio Economic Survey, BPS–Statistics Indonesia]
ProvinsiProvince
LedingPipe
PompaPump
AirDalam
KemasanPackaged
Water
SumurTer-
lindungPro-
tectedWell
SumurTak ter-lindungUnpro-tectedWell
Mata AirTer-
lindungPro-
tectedSpring
Mata AirTak ter-lindungUnpro-tectedSpring
AirSungaiRivers
AirHujanRain-water
LainnyaOthers
JumlahTotal
(1) (2) (3) (4) (5) (6) (7) (8) (9) (10) (11) (12)
Aceh 6,35 4,48 31,81 35,09 9,58 6,79 1,85 3,40 0,60 0,06 100,00Sumatera Utara 16,58 18,01 25,73 16,34 6,67 5,87 4,08 3,57 2,92 0,23 100,00Sumatera Barat 13,27 4,71 30,75 20,04 9,44 10,03 7,01 2,85 1,42 0,48 100,00Riau 1,59 6,38 41,12 16,13 10,59 1,10 0,93 2,34 19,78 0,05 100,00Kepulauan Riau 10,15 2,90 20,91 28,41 16,03 1,06 0,16 7,97 12,22 0,20 100,00Jambi 18,89 6,72 16,67 34,74 9,54 1,54 1,68 6,72 2,77 0,73 100,00Sumatera Selatan 9,14 5,50 16,18 18,17 38,76 4,96 4,58 2,65 0,00 0,05 100,00Kep. Bangka Belitung 2,75 7,69 13,62 42,20 23,71 3,44 5,10 1,17 0,25 0,08 100,00Bengkulu 0,73 12,55 48,36 24,44 10,69 1,01 1,83 0,21 0,00 0,17 100,00Lampung 5,26 1,26 66,40 17,01 5,10 1,11 3,35 0,00 0,51 0,00 100,00
DKI Jakarta 13,96 13,81 71,72 0,50 0,00 0,00 0,00 0,00 0,01 0,00 100,00Jawa Barat 8,75 18,15 30,95 18,84 5,38 11,94 5,37 0,47 0,00 0,15 100,00Banten 14,65 17,18 12,27 32,86 4,06 13,99 3,72 0,93 0,22 0,12 100,00Jawa Tengah 8,84 8,14 14,16 58,83 4,90 4,11 0,96 0,02 0,04 0,00 100,00DI Yogyakarta 12,11 23,30 19,60 29,95 2,04 10,82 1,77 0,35 0,04 0,01 100,00Jawa Timur 4,28 29,29 36,63 16,17 5,49 1,02 4,34 2,54 0,06 0,16 100,00
Bali 25,85 5,03 35,44 5,51 0,44 19,45 2,93 1,88 3,48 0,00 100,00Nusa Tenggara Barat 14,05 8,23 12,55 39,90 8,43 13,62 2,26 0,95 0,00 0,00 100,00Nusa Tenggara Timur 14,59 2,56 3,70 22,34 6,44 31,93 12,84 4,01 1,28 0,32 100,00
Kalimantan Barat 3,42 3,33 14,24 5,22 6,40 7,07 8,48 16,57 34,42 0,85 100,00Kalimantan Tengah 8,53 15,57 26,19 9,77 8,55 1,14 2,99 22,19 4,39 0,68 100,00Kalimantan Selatan 32,58 14,85 15,40 7,86 11,75 0,33 1,05 14,32 1,11 0,74 100,00Kalimantan Timur 20,98 2,54 54,02 2,86 3,13 2,25 1,13 6,03 6,92 0,14 100,00
Sulawesi Utara 13,30 6,49 35,29 18,50 7,67 14,41 2,78 0,20 1,25 0,11 100,00Gorontalo 11,19 13,15 16,17 17,25 6,96 23,36 6,04 5,63 0,25 0,00 100,00Sulawesi Tengah 15,36 20,25 20,37 20,78 8,16 9,26 4,37 1,03 0,42 0,00 100,00Sulawesi Selatan 13,63 5,81 14,25 31,05 6,58 20,40 4,52 2,67 1,08 0,00 100,00Sulawesi Barat 15,05 5,81 19,49 39,24 6,59 8,78 2,39 2,65 0,00 0,00 100,00Sulawesi Tenggara 10,62 10,49 12,47 22,24 15,02 10,19 13,38 5,54 0,05 0,00 100,00
Maluku 10,25 9,03 8,86 32,30 5,04 24,48 3,52 4,76 1,76 0,00 100,00Maluku Utara 19,08 1,09 6,79 36,49 14,45 10,61 2,93 4,49 4,07 0,00 100,00Papua 6,50 4,48 30,92 15,00 4,39 10,82 2,62 9,90 15,19 0,19 100,00Papua Barat 4,86 3,62 17,16 5,03 5,77 10,23 29,06 11,37 12,70 0,20 100,00
Indonesia 11,79 17,64 38,85 29,79 15,67 13,44 6,33 4,40 2,16 0,15 100,00
Catatan/Note: 1 Data Susenas Triwulan III-2012/Data Susenas Quarter III-2012
http
://www.b
ps.g
o.id

S O S I A L D A N K E S E J A H T E R A A N R A K Y A T
S t a t i s t i k I n d o n e s i a 2 0 1 3162
Persentase Rumah Tangga Menurut Provinsi dan Sumber Penerangan, 2012 1
Percentage of Households by Province and Source of Lighting, 2012 1
Tabel ––––––
4.3.3Table
[Diolah dari Hasil Survei Sosial Ekonomi Nasional (Susenas), BPS/Based on National Socio Economic Survey, BPS–Statistics Indonesia]
ProvinsiProvince
Listrik PLNState
Electricity
Listrik Non-PLNPrivately
GeneratedElectricity
Petromak/Aladin
PumpedLamp
Pelita/Sentir/Obor
Oil Lamp
LainnyaOthers
JumlahTotal
(1) (2) (3) (4) (5) (6) (7)
Aceh 95,44 1,05 1,41 2,06 0,04 100,00Sumatera Utara 92,50 2,31 1,21 3,88 0,10 100,00Sumatera Barat 90,37 3,07 1,35 4,60 0,61 100,00Riau 66,78 25,85 0,51 6,56 0,30 100,00Kepulauan Riau 84,02 11,60 1,08 3,21 0,09 100,00Jambi 84,73 10,77 0,54 3,76 0,20 100,00Sumatera Selatan 86,21 6,66 0,11 6,96 0,07 100,00Kepulauan Bangka Belitung 84,52 11,74 0,10 3,21 0,43 100,00Bengkulu 89,61 7,53 0,25 2,48 0,12 100,00Lampung 87,50 10,37 0,19 1,30 0,64 100,00
DKI Jakarta 99,97 0,00 0,00 0,03 0,00 100,00Jawa Barat 98,45 0,82 0,02 0,48 0,23 100,00Banten 99,33 0,34 0,01 0,30 0,03 100,00Jawa Tengah 99,47 0,13 0,00 0,41 0,00 100,00DI Yogyakarta 98,60 1,08 0,11 0,21 0,00 100,00Jawa Timur 98,71 0,24 0,15 0,85 0,05 100,00
Bali 98,96 0,24 0,00 0,75 0,05 100,00Nusa Tenggara Barat 92,68 3,10 0,24 3,94 0,05 100,00Nusa Tenggara Timur 52,07 14,80 0,13 32,13 0,87 100,00
Kalimantan Barat 74,20 11,54 0,24 13,57 0,46 100,00Kalimantan Tengah 67,42 13,79 1,93 15,06 1,80 100,00Kalimantan Selatan 88,58 6,22 1,36 3,60 0,23 100,00Kalimantan Timur 80,12 14,73 0,89 2,65 1,62 100,00
Sulawesi Utara 96,05 2,73 0,15 1,04 0,04 100,00Gorontalo 79,99 6,56 0,15 13,07 0,24 100,00Sulawesi Tengah 87,99 4,89 0,45 6,09 0,57 100,00Sulawesi Selatan 81,89 7,02 0,02 10,95 0,12 100,00Sulawesi Barat 74,35 7,35 4,26 14,03 0,00 100,00Sulawesi Tenggara 59,13 25,18 0,00 15,60 0,09 100,00
Maluku 74,63 5,89 0,47 18,72 0,29 100,00Maluku Utara 67,49 17,08 0,47 14,96 0,00 100,00Papua 61,44 19,22 0,31 17,37 1,65 100,00Papua Barat 33,70 8,16 0,67 24,34 33,13 100,00
Indonesia 92,08 3,84 0,30 3,16 0,62 100,00
Catatan/Note: 1 Data Susenas Triwulan III-2012/Data Susenas Quarter III-2012
http
://www.b
ps.g
o.id

S O C I A L A N D W E L F A R E
S t a t i s t i c a l Y e a r b o o k o f I n d o n e s i a 2 0 1 3 163
Persentase Rumah Tangga Menurut Provinsi dan Fasilitas Tempat Buang Air Besar, 2012 1
Percentage of Households by Province and Toilet Facility, 2012 1
Tabel ––––––
4.3.4Table
[Diolah dari Hasil Survei Sosial Ekonomi Nasional (Susenas), BPS/Based on National Socio Economic Survey, BPS–Statistics Indonesia]
ProvinsiProvince
SendiriPrivate
BersamaShared
UmumPublic
Tidak adaNo Facility
JumlahTotal
(1) (2) (3) (4) (5) (6)
Aceh 61,44 7,05 6,01 25,50 100,00Sumatera Utara 76,81 5,49 3,41 14,29 100,00Sumatera Barat 56,15 10,24 3,16 30,45 100,00Riau 83,69 5,29 1,02 10,00 100,00Kepulauan Riau 69,78 7,75 1,83 20,64 100,00Jambi 73,00 9,02 3,49 14,49 100,00Sumatera Selatan 68,69 7,07 1,15 23,09 100,00Kepulauan Bangka Belitung 76,78 12,32 1,59 9,30 100,00Bengkulu 75,68 5,09 1,55 17,68 100,00Lampung 85,79 8,24 2,14 3,83 100,00
DKI Jakarta 76,61 18,04 4,80 0,55 100,00Jawa Barat 67,42 14,08 6,07 12,43 100,00Banten 66,29 13,58 3,31 16,83 100,00Jawa Tengah 73,47 22,75 0,83 2,94 100,00DI Yogyakarta 64,22 15,14 2,16 18,47 100,00Jawa Timur 61,48 10,62 1,74 26,15 100,00
Bali 65,41 20,93 0,80 13,66 100,00Nusa Tenggara Barat 38,80 16,41 2,26 42,53 100,00Nusa Tenggara Timut 60,06 14,09 2,76 23,08 100,00
Kalimantan Barat 67,38 8,79 2,47 21,35 100,00Kalimantan Tengah 56,74 22,39 8,34 12,54 100,00Kalimantan Selatan 64,36 15,59 7,67 12,38 100,00Kalimantan Timur 85,14 5,60 3,17 6,09 100,00
Sulawesi Utara 65,79 19,04 4,20 10,98 100,00Gorontalo 54,78 9,07 4,78 31,37 100,00Sulawesi Tengah 62,95 13,81 2,76 20,47 100,00Sulawesi Selatan 59,12 11,63 3,41 25,84 100,00Sulawesi Barat 30,93 17,74 10,66 40,68 100,00Sulawesi Tenggara 46,92 7,37 1,81 43,90 100,00
Maluku 52,26 10,26 7,58 29,90 100,00Maluku Utara 51,59 11,09 14,76 22,56 100,00Papua 58,21 19,42 14,53 7,84 100,00Papua Barat 47,04 12,10 4,17 36,69 100,00
Indonesia 66,53 13,06 3,65 16,76 100,00
Catatan/Note: 1 Data Susenas Triwulan III-2012/Data Susenas Quarter III-2012
http
://www.b
ps.g
o.id
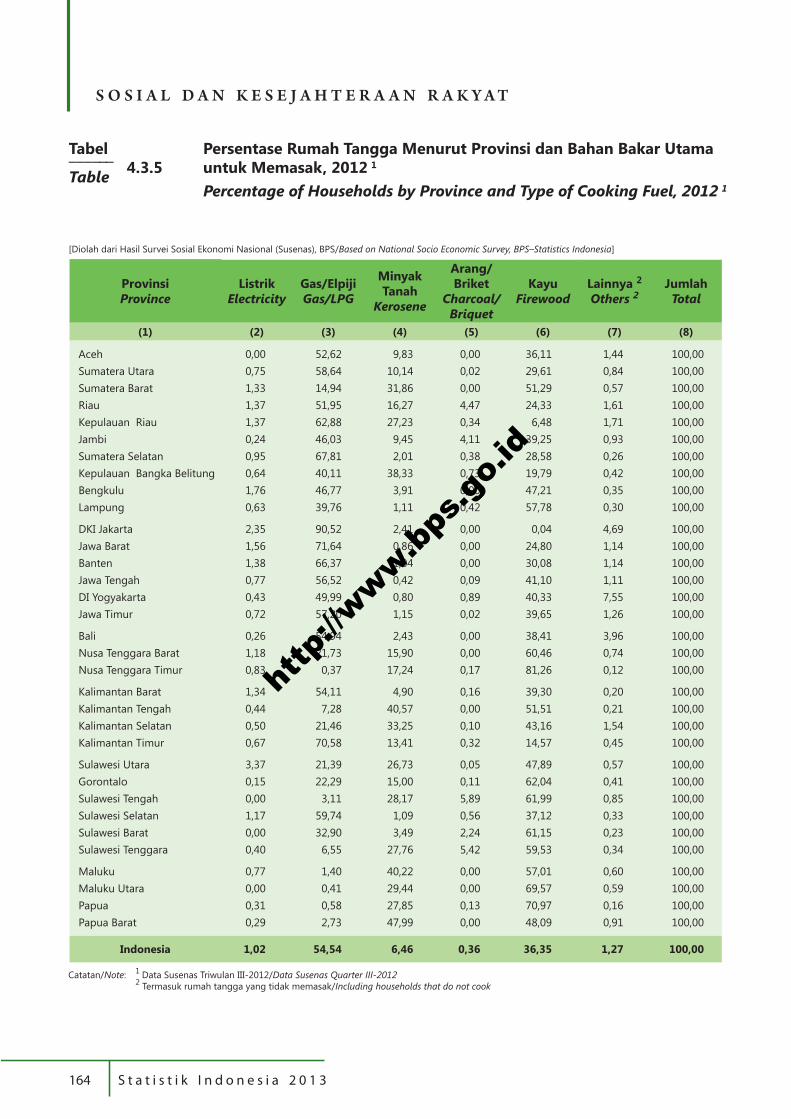
S O S I A L D A N K E S E J A H T E R A A N R A K Y A T
S t a t i s t i k I n d o n e s i a 2 0 1 3164
Persentase Rumah Tangga Menurut Provinsi dan Bahan Bakar Utamauntuk Memasak, 2012 1
Percentage of Households by Province and Type of Cooking Fuel, 2012 1
Tabel ––––––
4.3.5Table
[Diolah dari Hasil Survei Sosial Ekonomi Nasional (Susenas), BPS/Based on National Socio Economic Survey, BPS–Statistics Indonesia]
ProvinsiProvince
ListrikElectricity
Gas/ElpijiGas/LPG
MinyakTanah
Kerosene
Arang/Briket
Charcoal/Briquet
KayuFirewood
Lainnya 2Others 2
JumlahTotal
(1) (2) (3) (4) (5) (6) (7) (8)
Aceh 0,00 52,62 9,83 0,00 36,11 1,44 100,00Sumatera Utara 0,75 58,64 10,14 0,02 29,61 0,84 100,00Sumatera Barat 1,33 14,94 31,86 0,00 51,29 0,57 100,00Riau 1,37 51,95 16,27 4,47 24,33 1,61 100,00Kepulauan Riau 1,37 62,88 27,23 0,34 6,48 1,71 100,00Jambi 0,24 46,03 9,45 4,11 39,25 0,93 100,00Sumatera Selatan 0,95 67,81 2,01 0,38 28,58 0,26 100,00Kepulauan Bangka Belitung 0,64 40,11 38,33 0,73 19,79 0,42 100,00Bengkulu 1,76 46,77 3,91 0,00 47,21 0,35 100,00Lampung 0,63 39,76 1,11 0,42 57,78 0,30 100,00
DKI Jakarta 2,35 90,52 2,41 0,00 0,04 4,69 100,00Jawa Barat 1,56 71,64 0,86 0,00 24,80 1,14 100,00Banten 1,38 66,37 1,04 0,00 30,08 1,14 100,00Jawa Tengah 0,77 56,52 0,42 0,09 41,10 1,11 100,00DI Yogyakarta 0,43 49,99 0,80 0,89 40,33 7,55 100,00Jawa Timur 0,72 57,20 1,15 0,02 39,65 1,26 100,00
Bali 0,26 54,94 2,43 0,00 38,41 3,96 100,00Nusa Tenggara Barat 1,18 21,73 15,90 0,00 60,46 0,74 100,00Nusa Tenggara Timur 0,83 0,37 17,24 0,17 81,26 0,12 100,00
Kalimantan Barat 1,34 54,11 4,90 0,16 39,30 0,20 100,00Kalimantan Tengah 0,44 7,28 40,57 0,00 51,51 0,21 100,00Kalimantan Selatan 0,50 21,46 33,25 0,10 43,16 1,54 100,00Kalimantan Timur 0,67 70,58 13,41 0,32 14,57 0,45 100,00
Sulawesi Utara 3,37 21,39 26,73 0,05 47,89 0,57 100,00Gorontalo 0,15 22,29 15,00 0,11 62,04 0,41 100,00Sulawesi Tengah 0,00 3,11 28,17 5,89 61,99 0,85 100,00Sulawesi Selatan 1,17 59,74 1,09 0,56 37,12 0,33 100,00Sulawesi Barat 0,00 32,90 3,49 2,24 61,15 0,23 100,00Sulawesi Tenggara 0,40 6,55 27,76 5,42 59,53 0,34 100,00
Maluku 0,77 1,40 40,22 0,00 57,01 0,60 100,00Maluku Utara 0,00 0,41 29,44 0,00 69,57 0,59 100,00Papua 0,31 0,58 27,85 0,13 70,97 0,16 100,00Papua Barat 0,29 2,73 47,99 0,00 48,09 0,91 100,00
Indonesia 1,02 54,54 6,46 0,36 36,35 1,27 100,00
Catatan/Note: 1 Data Susenas Triwulan III-2012/Data Susenas Quarter III-2012 2 Termasuk rumah tangga yang tidak memasak/Including households that do not cook
http
://www.b
ps.g
o.id

S O C I A L A N D W E L F A R E
S t a t i s t i c a l Y e a r b o o k o f I n d o n e s i a 2 0 1 3 165
Persentase Rumah Tangga Menurut Provinsi dan Status Penguasaan Bangunan Tempat Tinggal, 2012 1
Percentage of Households by Province and Dwelling Ownership Status, 2012 1
Tabel ––––––
4.3.6Table
[Diolah dari Hasil Survei Sosial Ekonomi Nasional (Susenas), BPS/Based on National Socio Economic Survey, BPS–Statistics Indonesia]
ProvinsiProvince
Milik SendiriPrivate
Kontrak/SewaLease/Rent
LainnyaOthers
JumlahTotal
(1) (2) (3) (4) (5)
Aceh 79,33 5,08 15,59 100,00Sumatera Utara 68,41 11,63 19,96 100,00Sumatera Barat 70,56 10,18 19,26 100,00Riau 67,17 14,76 18,07 100,00Kepulauan Riau 67,82 26,60 5,58 100,00Jambi 79,53 6,02 14,44 100,00Sumatera Selatan 78,85 6,87 14,28 100,00Kepulauan Bangka Belitung 86,20 5,12 8,68 100,00Bengkulu 77,62 10,06 12,33 100,00Lampung 86,43 3,19 10,38 100,00
DKI Jakarta 56,61 30,51 12,88 100,00Jawa Barat 78,10 8,02 13,88 100,00Banten 78,85 12,07 9,08 100,00Jawa Tengah 89,42 2,54 8,04 100,00DI Yogyakarta 79,33 10,69 9,98 100,00Jawa Timur 87,47 4,78 7,75 100,00
Bali 76,97 15,32 7,70 100,00Nusa Tenggara Barat 82,63 1,94 15,43 100,00Nusa Tenggara Timut 87,46 4,17 8,37 100,00
Kalimantan Barat 86,86 1,89 11,26 100,00Kalimantan Tengah 76,81 6,99 16,20 100,00Kalimantan Selatan 70,98 9,54 19,47 100,00Kalimantan Timur 69,85 16,22 13,93 100,00
Sulawesi Utara 73,11 7,30 19,59 100,00Gorontalo 81,77 1,47 16,76 100,00Sulawesi Tengah 86,96 3,88 9,16 100,00Sulawesi Selatan 84,13 5,01 10,86 100,00Sulawesi Barat 87,66 1,93 10,41 100,00Sulawesi Tenggara 85,39 3,64 10,97 100,00
Maluku 80,62 4,80 14,58 100,00Maluku Utara 86,80 4,74 8,46 100,00Papua 80,02 8,43 11,55 100,00Papua Barat 70,06 10,72 19,22 100,00
Indonesia 80,32 7,83 11,84 100,00
Catatan/Note: 1 Data Susenas Triwulan III-2012/Data Susenas Quarter III-2012
http
://www.b
ps.g
o.id
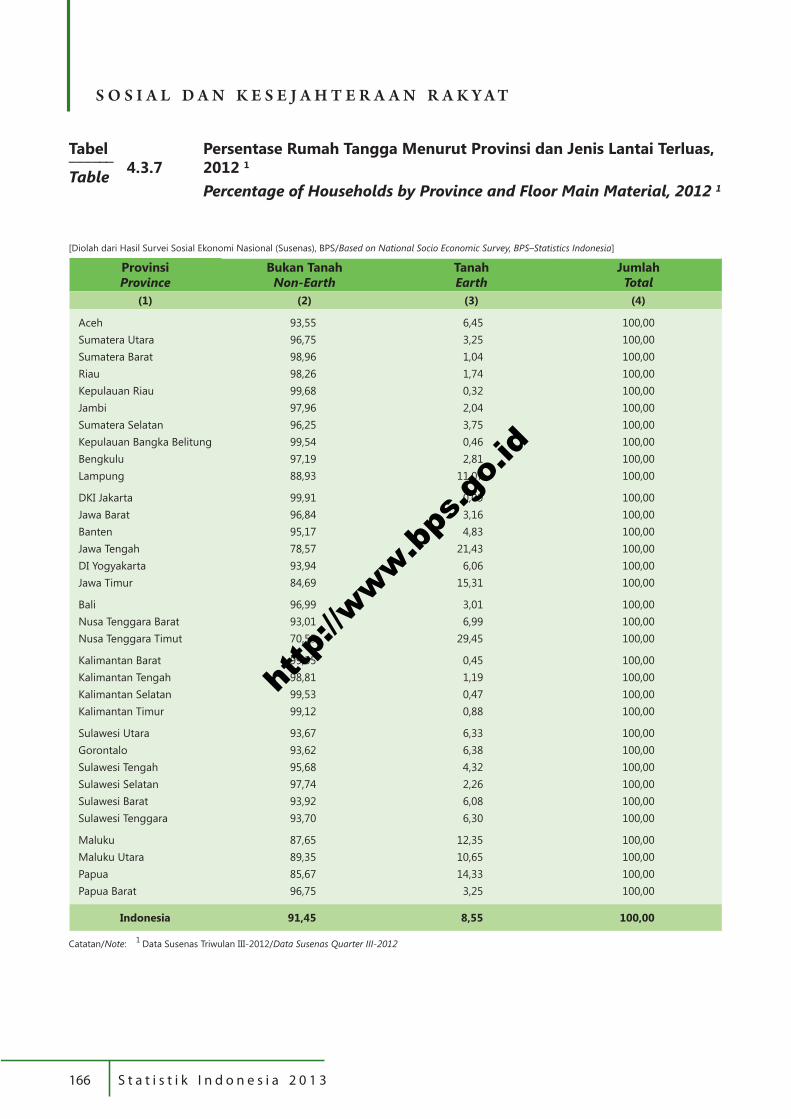
S O S I A L D A N K E S E J A H T E R A A N R A K Y A T
S t a t i s t i k I n d o n e s i a 2 0 1 3166
Persentase Rumah Tangga Menurut Provinsi dan Jenis Lantai Terluas, 2012 1
Percentage of Households by Province and Floor Main Material, 2012 1
Tabel ––––––
4.3.7Table
[Diolah dari Hasil Survei Sosial Ekonomi Nasional (Susenas), BPS/Based on National Socio Economic Survey, BPS–Statistics Indonesia]
ProvinsiProvince
Bukan TanahNon-Earth
TanahEarth
JumlahTotal
(1) (2) (3) (4)
Aceh 93,55 6,45 100,00Sumatera Utara 96,75 3,25 100,00Sumatera Barat 98,96 1,04 100,00Riau 98,26 1,74 100,00Kepulauan Riau 99,68 0,32 100,00Jambi 97,96 2,04 100,00Sumatera Selatan 96,25 3,75 100,00Kepulauan Bangka Belitung 99,54 0,46 100,00Bengkulu 97,19 2,81 100,00Lampung 88,93 11,07 100,00
DKI Jakarta 99,91 0,09 100,00Jawa Barat 96,84 3,16 100,00Banten 95,17 4,83 100,00Jawa Tengah 78,57 21,43 100,00DI Yogyakarta 93,94 6,06 100,00Jawa Timur 84,69 15,31 100,00
Bali 96,99 3,01 100,00Nusa Tenggara Barat 93,01 6,99 100,00Nusa Tenggara Timut 70,55 29,45 100,00
Kalimantan Barat 99,55 0,45 100,00Kalimantan Tengah 98,81 1,19 100,00Kalimantan Selatan 99,53 0,47 100,00Kalimantan Timur 99,12 0,88 100,00
Sulawesi Utara 93,67 6,33 100,00Gorontalo 93,62 6,38 100,00Sulawesi Tengah 95,68 4,32 100,00Sulawesi Selatan 97,74 2,26 100,00Sulawesi Barat 93,92 6,08 100,00Sulawesi Tenggara 93,70 6,30 100,00
Maluku 87,65 12,35 100,00Maluku Utara 89,35 10,65 100,00Papua 85,67 14,33 100,00Papua Barat 96,75 3,25 100,00
Indonesia 91,45 8,55 100,00
Catatan/Note: 1 Data Susenas Triwulan III-2012/Data Susenas Quarter III-2012
http
://www.b
ps.g
o.id

S O C I A L A N D W E L F A R E
S t a t i s t i c a l Y e a r b o o k o f I n d o n e s i a 2 0 1 3 167
Jumlah Tindak Pidana Menurut Kepolisian Daerah, 2010–2012Crime Total by Regional Police Office, 2010–2012
Tabel ––––––
4.4.1Table
4.4 KRIMINALITASCRIME
Kepolisian DaerahRegional Police Office 2010 2011 2012
(1) (2) (3) (4)
Aceh 9 244 9 114 9 200Sumatera Utara 33 227 37 610 33 250Sumatera Barat 10 819 11 695 13 468Riau 10 129 8 323 12 533Kepulauan Riau 4 141 3 643 3 626Jambi 3 586 4 450 6 099Sumatera Selatan 18 288 19 353 21 498Kepulauan Bangka Belitung 2 642 2 732 5 197Bengkulu 2 717 3 498 3 943Lampung 4 813 6 052 4 383
Metro Jaya 1 60 989 53 324 52 642Jawa Barat 16 869 29 296 27 247Banten 3 832 3 205 3 804Jawa Tengah 15 479 15 205 11 079DI Yogyakarta 17 622 6 326 8 987Jawa Timur 16 948 28 392 22 774
Bali 5 593 5 490 5 183Nusa Tenggara Barat 10 908 9 585 10 504Nusa Tenggara Timur 3 583 5 298 6 389
Kalimantan Barat 8 599 10 296 10 315Kalimantan Tengah 2 734 5 682 3 219Kalimantan Selatan 1 910 499 3 372Kalimantan Timur 10 007 9 439 9 639
Sulawesi Utara 8 710 11 286 6 815Gorontalo 3 080 2 602 2 458Sulawesi Tengah 13 030 7 001 8 134Sulawesi Selatan 2 15 784 22 509 18 169Sulawesi Tenggara 6 196 6 254 7 166
Maluku 4 004 1 510 1 726Maluku Utara 1 916 887 926Papua 3 5 091 7 049 7 414
Indonesia 332 490 347 605 341 159
Catatan/Note: 1 Polda Metro Jaya meliputi Polres Jakarta Selatan, Jakarta Timur, Jakarta Pusat, Jakarta Utara, Jakarta Barat, Kepulauan Seribu, Kabupaten Bekasi, Kota Bekasi, Kabupaten Tangerang, Kota Tangerang, Kota Depok, Bandara Soekarno-Hatta, dan KP3/Metro Jaya Regional Police Office consist of Police Subregionals of Jakarta Selatan, Jakarta Timur, Jakarta Pusat, Jakarta Utara, Jakarta Barat, Kepulauan Seribu, Bekasi Regency, Bekasi Municipality, Tangerang Regency, Tangerang Municipality, Depok Municipality, Soekarno-Hatta Airport, and KP3.
2 Polda Sulawesi Selatan meliputi wilayah Provinsi Sulawesi Selatan dan Sulawesi Barat/Sulawesi Selatan Regional Police Office covers Sulawesi Selatan and Sulawesi Barat Provinces.
3 Polda Papua meliputi wilayah Provinsi Papua dan Papua Barat/Papua Regional Police Office covers Papua and Papua Barat Provinces.Sumber/Source: Biro Pengendalian Operasi, Mabes POLRI/Bureau of Operation Control, Indonesian National Police Headquaters
http
://www.b
ps.g
o.id
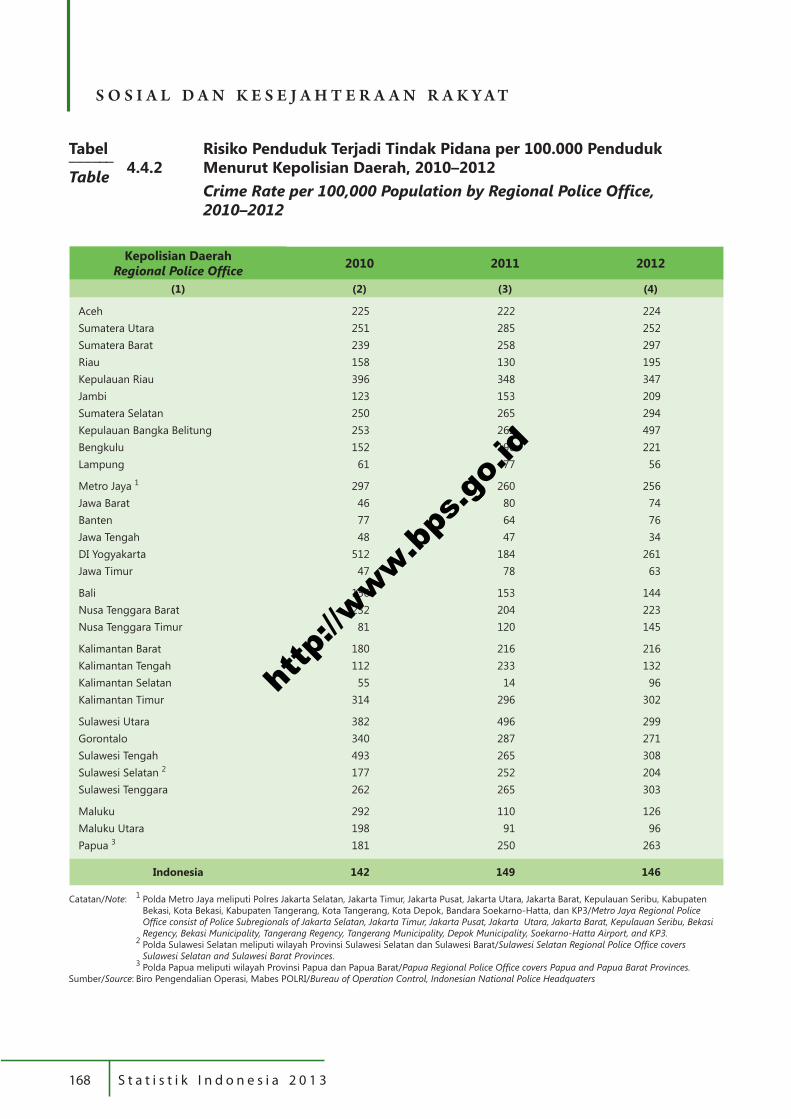
S O S I A L D A N K E S E J A H T E R A A N R A K Y A T
S t a t i s t i k I n d o n e s i a 2 0 1 3168
Risiko Penduduk Terjadi Tindak Pidana per 100.000 Penduduk Menurut Kepolisian Daerah, 2010–2012Crime Rate per 100,000 Population by Regional Police Office, 2010–2012
Tabel ––––––
4.4.2Table
Kepolisian DaerahRegional Police Office 2010 2011 2012
(1) (2) (3) (4)
Aceh 225 222 224 Sumatera Utara 251 285 252 Sumatera Barat 239 258 297 Riau 158 130 195 Kepulauan Riau 396 348 347 Jambi 123 153 209 Sumatera Selatan 250 265 294 Kepulauan Bangka Belitung 253 262 497 Bengkulu 152 196 221 Lampung 61 77 56
Metro Jaya 1 297 260 256 Jawa Barat 46 80 74 Banten 77 64 76 Jawa Tengah 48 47 34 DI Yogyakarta 512 184 261 Jawa Timur 47 78 63
Bali 156 153 144 Nusa Tenggara Barat 232 204 223 Nusa Tenggara Timur 81 120 145
Kalimantan Barat 180 216 216 Kalimantan Tengah 112 233 132 Kalimantan Selatan 55 14 96 Kalimantan Timur 314 296 302
Sulawesi Utara 382 496 299 Gorontalo 340 287 271 Sulawesi Tengah 493 265 308 Sulawesi Selatan 2 177 252 204 Sulawesi Tenggara 262 265 303
Maluku 292 110 126 Maluku Utara 198 91 96 Papua 3 181 250 263
Indonesia 142 149 146
Catatan/Note: 1 Polda Metro Jaya meliputi Polres Jakarta Selatan, Jakarta Timur, Jakarta Pusat, Jakarta Utara, Jakarta Barat, Kepulauan Seribu, Kabupaten Bekasi, Kota Bekasi, Kabupaten Tangerang, Kota Tangerang, Kota Depok, Bandara Soekarno-Hatta, dan KP3/Metro Jaya Regional Police Office consist of Police Subregionals of Jakarta Selatan, Jakarta Timur, Jakarta Pusat, Jakarta Utara, Jakarta Barat, Kepulauan Seribu, Bekasi Regency, Bekasi Municipality, Tangerang Regency, Tangerang Municipality, Depok Municipality, Soekarno-Hatta Airport, and KP3.
2 Polda Sulawesi Selatan meliputi wilayah Provinsi Sulawesi Selatan dan Sulawesi Barat/Sulawesi Selatan Regional Police Office covers Sulawesi Selatan and Sulawesi Barat Provinces.
3 Polda Papua meliputi wilayah Provinsi Papua dan Papua Barat/Papua Regional Police Office covers Papua and Papua Barat Provinces.Sumber/Source: Biro Pengendalian Operasi, Mabes POLRI/Bureau of Operation Control, Indonesian National Police Headquaters
http
://www.b
ps.g
o.id

S O C I A L A N D W E L F A R E
S t a t i s t i c a l Y e a r b o o k o f I n d o n e s i a 2 0 1 3 169
Selang Waktu Terjadinya Tindak Pidana Menurut Kepolisian Daerah, 2010–2012Time Interval of Crime Occurance by Regional Police Office, 2010–2012
Tabel ––––––
4.4.3Table
Kepolisian DaerahRegional Police Office 2010 2011 2012
(1) (2) (3) (4)
Aceh 00.56'51'' 00.57'40'' 00.57'07''Sumatera Utara 00.15'49'' 00.13'58'' 00.15'48''Sumatera Barat 00.48'34'' 00.44'56'' 00.39'01''Riau 00.51'53'' 01.03'09'' 00.41'56''Kepulauan Riau 02.06'56'' 02.24'16'' 02.24'57''Jambi 02.26'34'' 01.58'06'' 01.26'10''Sumatera Selatan 00.28'44'' 00.27'09'' 00.24'26''Kepulauan Bangka Belitung 03.18'56'' 03.12'23'' 01.41'08''Bengkulu 03.13'27'' 02.30'15'' 02.13'17''Lampung 01.49'12'' 01.26'50'' 01.59'55''
Metro Jaya 1 00.08'37'' 00.09'51'' 00.09'59''Jawa Barat 00.31'09'' 00.17'56'' 00.19'17''Banten 02.17'10'' 02.43'59'' 02.18'10''Jawa Tengah 00.33'57'' 00.34'34'' 00.47'26''DI Yogyakarta 00.29'50'' 01.23'05'' 00.58'29''Jawa Timur 00.31'01'' 00.18'30'' 00.23'04''
Bali 01.33'58'' 01.35'44'' 01.41'24''Nusa Tenggara Barat 00.48'11'' 00.54'50'' 00.50'02''Nusa Tenggara Timur 02.26'42'' 01.39'12'' 01.22'15''
Kalimantan Barat 01.01'07'' 00.51'02'' 00.50'57''Kalimantan Tengah 03.12'15'' 01.32'30'' 02.43'16''Kalimantan Selatan 04.35'11'' 17.33'18'' 02.35'52''Kalimantan Timur 00.52'31'' 00.55'41'' 00.54'31''
Sulawesi Utara 01.00'21'' 00.46'34'' 01.17'07''Gorontalo 02.50'39'' 03.21'59'' 03.33'49''Sulawesi Tengah 00.40'20'' 01.15'04'' 01.04'37''Sulawesi Selatan 2 00.33'18'' 00.23'21'' 00.28'55''Sulawesi Tenggara 01.24'50'' 01.24'02'' 01.13'20''
Maluku 02.11'16'' 05.48'04'' 05.04'31''Maluku Utara 04.34'19'' 09.52'33'' 09.27'36''Papua 3 01.43'14'' 01.14'33'' 01.10'53''
Indonesia 00.01'35'' 00.01'31'' 00.01'32''
Catatan/Note: .=jam/hours; ‘=menit/minutes; “=detik/second 1 Polda Metro Jaya meliputi Polres Jakarta Selatan, Jakarta Timur, Jakarta Pusat, Jakarta Utara, Jakarta Barat, Kepulauan Seribu, Kabupaten
Bekasi, Kota Bekasi, Kabupaten Tangerang, Kota Tangerang, Kota Depok, Bandara Soekarno-Hatta, dan KP3/Metro Jaya Regional Police Office consist of Police Subregionals of Jakarta Selatan, Jakarta Timur, Jakarta Pusat, Jakarta Utara, Jakarta Barat, Kepulauan Seribu, Bekasi Regency, Bekasi Municipality, Tangerang Regency, Tangerang Municipality, Depok Municipality, Soekarno-Hatta Airport, and KP3.
2 Polda Sulawesi Selatan meliputi wilayah Provinsi Sulawesi Selatan dan Sulawesi Barat/Sulawesi Selatan Regional Police Office covers Sulawesi Selatan and Sulawesi Barat Provinces.
3 Polda Papua meliputi wilayah Provinsi Papua dan Papua Barat/Papua Regional Police Office covers Papua and Papua Barat Provinces.Sumber/Source: Biro Pengendalian Operasi, Mabes POLRI/Bureau of Operation Control, Indonesian National Police Headquaters
http
://www.b
ps.g
o.id

S O S I A L D A N K E S E J A H T E R A A N R A K Y A T
S t a t i s t i k I n d o n e s i a 2 0 1 3170
Persentase Penyelesaian Tindak Pidana Menurut Kepolisian Daerah, 2010–2012Percentage of Crime Clearance Rate by Regional Police Office, 2010–2012
Tabel ––––––
4.4.4Table
Kepolisian DaerahRegional Police Office 2010 2011 2012
(1) (2) (3) (4)
Aceh 38,85 43,14 42,83 Sumatera Utara 58,80 45,62 42,99 Sumatera Barat 47,44 52,47 47,58 Riau 34,51 46,67 36,71 Kepulauan Riau 39,97 47,93 58,16 Jambi 46,99 39,44 55,21 Sumatera Selatan 37,67 38,63 31,17 Kepulauan Bangka Belitung 51,29 50,44 29,06 Bengkulu 62,42 47,40 77,86 Lampung 64,35 20,34 24,25
Metro Jaya 1 59,29 56,99 61,63 Jawa Barat 53,90 47,98 48,77 Banten 53,89 60,41 62,99 Jawa Tengah 90,24 109,41 82,42 DI Yogyakarta 12,83 52,96 36,89 Jawa Timur 48,04 28,97 23,50
Bali 54,64 65,28 82,58 Nusa Tenggara Barat 45,55 46,38 54,55 Nusa Tenggara Timur 61,48 100,85 65,80
Kalimantan Barat 29,95 6,28 46,20 Kalimantan Tengah 63,83 57,04 70,52 Kalimantan Selatan 67,02 56,11 85,53 Kalimantan Timur 38,35 53,14 58,17
Sulawesi Utara 52,20 95,72 101,72 Gorontalo 51,72 55,30 65,66 Sulawesi Tengah 21,11 47,29 48,67 Sulawesi Selatan 2 59,70 64,55 66,72 Sulawesi Tenggara 65,15 69,44 69,03
Maluku 14,79 26,82 55,56 Maluku Utara 17,48 54,90 70,95 Papua 3 50,05 45,69 49,38
Indonesia 49,72 52,37 52,05
Catatan/Note: 1 Polda Metro Jaya meliputi Polres Jakarta Selatan, Jakarta Timur, Jakarta Pusat, Jakarta Utara, Jakarta Barat, Kepulauan Seribu, Kabupaten Bekasi, Kota Bekasi, Kabupaten Tangerang, Kota Tangerang, Kota Depok, Bandara Soekarno-Hatta, dan KP3/Metro Jaya Regional Police Office consist of Police Subregionals of Jakarta Selatan, Jakarta Timur, Jakarta Pusat, Jakarta Utara, Jakarta Barat, Kepulauan Seribu, Bekasi Regency, Bekasi Municipality, Tangerang Regency, Tangerang Municipality, Depok Municipality, Soekarno-Hatta Airport, and KP3.
2 Polda Sulselbar meliputi wilayah Provinsi Sulawesi Selatan dan Sulawesi Barat/Sulselbar Regional Police Office covers Sulawesi Selatan and Sulawesi Barat Provinces.
3 Polda Papua meliputi wilayah Provinsi Papua dan Papua Barat/Papua Regional Police Office covers Papua and Papua Barat Provinces.Sumber/Source: Biro Pengendalian Operasi, Mabes POLRI/Bureau of Operation Control, Indonesian National Police Headquaters
http
://www.b
ps.g
o.id

S O C I A L A N D W E L F A R E
S t a t i s t i c a l Y e a r b o o k o f I n d o n e s i a 2 0 1 3 171
Jumlah Jemaah Haji yang Diberangkatkan 1 ke Tanah Suci Mekah Menurut Provinsi, 2010–2012Number of Hajj Pilgrims Were Departured to the Holyland of Mecca 1 by Province, 2010–2012
Tabel ––––––
4.5.1Table
4.5 AGAMA DAN SOSIAL LAINNYARELIGION AND OTHER SOCIAL AFFAIRS
ProvinsiProvince 2010 2011 2012
(1) (2) (3) (4)
Aceh 4 068 4 754 3 898 Sumatera Utara 8 187 8 347 8 137 Sumatera Barat 4 583 4 689 4 429 Riau 5 078 5 148 4 927 Kepulauan Riau 1 054 1 090 974 Jambi 2 725 2 800 2 576 Sumatera Selatan 6 393 6 451 6 227 Kepulauan Bangka Belitung 1 014 1 112 915 Bengkulu 1 651 1 674 1 629 Lampung 6 241 6 315 6 219
DKI Jakarta 7 613 7 648 7 112 Jawa Barat 37 522 37 810 37 269 Banten 8 708 8 748 8 594 Jawa Tengah 29 546 29 821 29 518 DI Yogyakarta 3 161 3 253 3 087 Jawa Timur 34 013 34 208 33 619
Bali 677 736 625 Nusa Tenggara Barat 4 607 4 724 4 493 Nusa Tenggara Timur 704 747 645
Kalimantan Barat 2 356 2 426 2 311 Kalimantan Tengah 1 480 1 493 1 329 Kalimantan Selatan 3 953 4 035 3 783 Kalimantan Timur 2 899 3 047 2 773
Sulawesi Utara 761 795 690 Gorontalo 949 1 009 883 Sulawesi Tengah 1 851 1 910 1 748 Sulawesi Selatan 7 425 7 587 7 226 Sulawesi Barat 1 521 1 630 1 441 Sulawesi Tenggara 1 802 1 848 1 680
Maluku 739 776 710 Maluku Utara 1 062 1 150 1 071 Papua 1 122 1 261 1 049 Papua Barat 741 807 704
Indonesia 196 206 199 849 192 291
Catatan/Note: 1 Melalui Kementerian Agama/Managed by Ministry of Religious AffairsSumber/Source: Direktorat Jenderal Penyelenggaraan Haji dan Umrah Kementerian Agama R.I./Directorate General of the Organization of Hajj and Umrah, Ministry of Religious Affairs
http
://www.b
ps.g
o.id

S O S I A L D A N K E S E J A H T E R A A N R A K Y A T
S t a t i s t i k I n d o n e s i a 2 0 1 3172
Nikah, Talaq dan Cerai, serta Rujuk, 2010–2012Number of Marriages, Divorces, and Reconciliations, 2010–2012
Tabel ––––––
4.5.2Table
ProvinsiProvince
Nikah 1,3
Marriages 1,3Talaq dan cerai 4
Divorces 4Rujuk 2,4
Reconciliations 2,4
2010 2011 2012 2010 2011 2012 2010 2011 2012(1) (2) (3) (4) (5) (6) (7) (8) (9) (10)
Aceh 40 691 42 358 42 049 2 883 3 419 4 016 – – –Sumatera Utara 101 697 110 799 108 371 5 579 6 684 8 985 – – –Sumatera Barat 49 271 52 485 48 017 4 221 4 984 6 154 – 1 –Riau 46 155 49 414 48 399 6 795 7 570 9 377 1 1 –Kepulauan Riau 14 372 14 478 14 468 – – – – – –Jambi 31 198 34 389 33 166 2 428 2 730 3 232 – – –Sumatera Selatan 84 229 89 464 88 628 4 132 5 213 6 805 – – –Kepulauan Bangka Belitung 13 079 13 608 12 240 1 569 1 845 2 350 – – –Bengkulu 17 983 18 063 18 874 1 266 1 696 2 180 – – –Lampung 89 315 87 658 90 714 3 479 4 027 5 447 – – –
DKI Jakarta 61 850 63 866 62 254 7 303 7 793 10 365 – – –Jawa Barat 457 190 505 997 489 752 84 084 51 677 63 139 49 75 11Banten 97 159 107 670 110 355 4 428 5 071 7 091 – – –Jawa Tengah 379 084 373 162 338 330 54 105 58 570 73 351 – – –DI Yogyakarta 27 272 26 957 26 543 3 925 4 349 5 441 – – –Jawa Timur 357 057 372 980 393 731 68 092 74 778 91 449 90 – –
Bali 3 708 3 764 3 900 – – – – – –Nusa Tenggara Barat 45 380 51 059 54 109 4 045 4 573 6 215 – – –Nusa Tenggara Timur 3 365 3 695 3 668 196 251 364 – – –
Kalimantan Barat 30 507 31 006 30 618 2 365 2 988 3 874 – – –Kalimantan Tengah 20 000 20 853 20 803 1 314 1 642 2 227 – – –Kalimantan Selatan 40 063 40 315 39 455 4 642 5 715 6 287 – – –Kalimantan Timur 31 795 32 449 32 184 4 609 5 316 7 360 – – –
Sulawesi Utara 7 853 8 546 8 353 753 865 1 143 – – –Gorontalo 9 475 10 460 11 263 681 827 1 190 – – –Sulawesi Tengah 22 639 22 868 22 799 1 695 1 914 2 362 – – –Sulawesi Selatan 74 943 80 024 83 426 7 673 9 122 11 742 – – –Sulawesi Barat 9 390 8 443 9 532 – – – – – –Sulawesi Tenggara 19 145 19 821 21 276 1 221 1 253 1 860 – – –
Maluku 6 467 7 210 7 195 302 291 360 – – –Maluku Utara 7 164 7 989 7 156 423 526 629 – – –Papua 4 624 4 776 4 913 976 1 102 1 485 – – –Papua Barat 3 104 3 215 3 107 – – – – – –
Indonesia 2 207 224 2 319 821 2 289 648 285 184 276 791 346 480 140 77 11
Catatan/Note: 1 Termasuk bedolan (nikah di luar KUA)/Including non formal registration 2 Hanya untuk yang beragama Islam/Applies only for moslemSumber/Source: 3 Dirjen Bimas Islam, Kementerian Agama RI/Directorate General of Islamic Community Guidance, Ministry of Religious Affairs 4 Dirjen Badan Peradilan Agama, Mahkamah Agung/Directorate General of Religious Justice Affairs, The Supreme Court
http
://www.b
ps.g
o.id

S O C I A L A N D W E L F A R E
S t a t i s t i c a l Y e a r b o o k o f I n d o n e s i a 2 0 1 3 173
Jumlah Korban Manusia yang Diakibatkan Bencana Alam Menurut Provinsi, 2011 dan 2012Number of Victims Due to Natural Disaster by Province, 2011 and 2012
Tabel ––––––
4.5.3Table
ProvinsiProvince
Meninggal DuniaFatality
Luka/SakitCasualty
HilangMissing
2011 2012 2011 2012 2011 2012(1) (2) (3) (4) (5) (6) (7)
Aceh 14 15 2 26 – 2Sumatera Utara 31 15 84 27 1 2Sumatera Barat 13 13 4 8 3 2Riau 5 – – 6 – –Kepulauan Riau – – – – – –Jambi – 2 – 48 – –Sumatera Selatan 5 4 2 – – –Kepulauan Bangka Belitung – – – – – –Bengkulu – 1 – – – –Lampung – – – – – –
DKI Jakarta – 2 – 43 – –Jawa Barat 84 34 43 56 14 4Banten 3 3 3 38 – –Jawa Tengah 74 15 219 30 37 2DI Yogyakarta 4 – 8 18 – –Jawa Timur 29 11 65 9 2 –
Bali 8 21 97 12 1 1Nusa Tenggara Barat 17 12 37 11 – 2Nusa Tenggara Timur 8 2 15 12 5 –
Kalimantan Barat 1 – 3 – – –Kalimantan Tengah – – – – – –Kalimantan Selatan 4 13 18 44 – –Kalimantan Timur 2 7 2 3 – –
Sulawesi Utara 7 6 7 9 – –Gorontalo 7 1 4 5 4 –Sulawesi Tengah 8 13 – 710 1 6Sulawesi Selatan 12 7 38 38 – –Sulawesi Barat – 14 1 7 – 2Sulawesi Tenggara – – 19 6 – –
Maluku 5 33 1 18 – 1Maluku Utara 3 6 7 22 1 8Papua 16 1 13 – – –Papua Barat – – – 6 – 1
Indonesia 360 251 692 1 212 69 33
Sumber/Source: Badan Nasional Penanggulangan Bencana/National Agency for Disaster Management
http
://www.b
ps.g
o.id

S O S I A L D A N K E S E J A H T E R A A N R A K Y A T
S t a t i s t i k I n d o n e s i a 2 0 1 3174
Jumlah Kerusakan Rumah yang Diakibatkan Bencana Alam Menurut Provinsi, 2011 dan 2012 Number of Damaged Houses Due to Natural Disaster by Province, 2011 and 2012
Tabel ––––––
4.5.4Table
Catatan/Note: r Angka diperbaiki/Revised figuresSumber/Source: Badan Nasional Penanggulangan Bencana/National Agency for Disaster Management
ProvinsiProvince
Rusak Total/Rusak BeratTotally Damaged/Severely Damaged
Rusak SedangDamaged
Rusak RinganLightly Damaged
2011 2012 2011 2012 2011 2012(1) (2) (3) (4) (5) (6) (7)
Aceh 737 135 – 36 1 175 461Sumatera Utara 580 297 202 468 3 066 767Sumatera Barat 131 267 – 365 350 1 071Riau 49 71 1 28 523 603Kepulauan Riau 1 r 4 – – 40 r –Jambi 18 162 10 – 511 60Sumatera Selatan 65 12 12 62 213 687Kepulauan Bangka Belitung – – – – 5 r –Bengkulu 6 13 – – 132 –Lampung 25 16 5 – 75 49
DKI Jakarta – 5 – – 229 460Jawa Barat 1 068 382 380 557 5 245 3 164Banten 78 133 8 – 401 1 016Jawa Tengah 1 849 590 271 177 4 841 1 813DI Yogyakarta 99 149 1 302 107 604Jawa Timur 1 002 191 354 164 6 150 685
Bali 55 3 25 – 162 113Nusa Tenggara Barat 717 310 52 2 055 745 677Nusa Tenggara Timur 1 313 3 190 15 3 732 2 478
Kalimantan Barat 71 6 – – 252 27Kalimantan Tengah 14 – – – 129 –Kalimantan Selatan 100 203 27 184 458 679Kalimantan Timur 47 8 – 1 22 7
Sulawesi Utara 473 85 319 – 1 780 32Gorontalo 494 32 – 2 527 85Sulawesi Tengah 535 754 80 311 307 1 064Sulawesi Selatan 374 513 175 441 636 3 228Sulawesi Barat 211 6 5 – 900 –Sulawesi Tenggara 341 167 119 1 511 396
Maluku 145 673 8 314 272 305Maluku Utara 66 91 29 – 199 113Papua 997 273 – 24 348 32Papua Barat 3 70 – – 25 2
Indonesia 11 664 8 811 2 098 5 495 31 068 20 678
http
://www.b
ps.g
o.id

S O C I A L A N D W E L F A R E
S t a t i s t i c a l Y e a r b o o k o f I n d o n e s i a 2 0 1 3 175
[Diolah dari Hasil Sensus Potensi Desa (Podes), BPS/Based on Village Potential Census, BPS–Statistics Indonesia]
ProvinsiProvince
BanjirFlood
Gempa BumiEarthquake
Tanah LongsorLandslide
2005 2008 2011 2005 2008 2011 2005 2008 2011(1) (2) (3) (4) (5) (6) (7) (8) (9) (10)
Aceh 1 587 1 991 1 463 3 313 745 260 293 310 227Sumatera Utara 2 662 682 649 754 196 34 392 470 407Sumatera Barat 230 243 315 217 634 496 197 205 244Riau 442 479 328 23 2 – 39 24 23Kepulauan Riau 3 ... 33 24 ... – – ... 10 11Jambi 484 402 357 35 250 132 54 51 27Sumatera Selatan 560 328 499 27 31 36 163 136 147Kepulauan Bangka Belitung 12 20 16 – 2 – – 1 –Bengkulu 79 145 215 369 776 24 53 88 114Lampung 400 251 432 29 15 7 69 58 82
DKI Jakarta 162 178 53 5 – – 2 1 1Jawa Barat 1 059 1 162 989 125 68 2 169 1 435 1 610 1 477Banten 379 535 401 48 15 41 81 127 140Jawa Tengah 1 215 1 367 1 266 25 905 116 1 014 1 254 1 410DI Yogyakarta 79 52 89 3 410 8 65 61 78Jawa Timur 1 138 1 419 1 370 95 90 10 556 696 673
Bali 31 33 71 64 27 4 52 105 162Nusa Tenggara Barat 124 199 282 76 183 166 35 28 59Nusa Tenggara Timur 498 612 557 405 21 14 459 621 565
Kalimantan Barat 552 394 740 1 – – 37 35 67Kalimantan Tengah 355 451 316 5 – – 14 10 9Kalimantan Selatan 596 533 591 1 – – 39 40 44Kalimantan Timur 411 478 463 2 – 17 41 113 71
Sulawesi Utara 228 375 336 53 186 174 227 303 294Gorontalo 150 276 307 4 12 60 24 54 57Sulawesi Tengah 420 583 565 322 40 144 101 178 143Sulawesi Selatan 721 801 746 11 16 20 355 364 278Sulawesi Barat 3 ... 181 221 ... 36 24 ... 159 220Sulawesi Tenggara 303 276 351 82 15 8 61 55 51
Maluku 71 119 122 19 60 13 31 48 68Maluku Utara 94 132 155 62 128 51 10 34 23Papua 4 290 363 411 435 38 157 275 291 336Papua Barat 3 ... 50 32 ... 30 196 ... 18 13
Indonesia 13 332 15 143 14 732 6 610 4 931 4 381 6 174 7 558 7 521
Catatan/Note: 1 Terjadi dalam tiga tahun terakhir sampai dengan saat pencacahan/Occured during the last three years by the time of enumeration 2 Data tahun 2005 tidak termasuk Kabupaten Nias dan Nias Selatan/The 2005 data excluded Regency of Nias and Nias Selatan 3 Data tahun 2005 tergabung dengan provinsi induknya/The 2005 data are included in their main provinces 4 Tidak semua desa/kelurahan dicacah/Not all villages were enumerated
Jumlah Desa Yang Mengalami Bencana Alam Menurut Provinsi 1, 2005–2011Number of Villages That Had Natural Disaster by Province 1, 2005–2011
Tabel ––––––
4.5.5Table
http
://www.b
ps.g
o.id

S O S I A L D A N K E S E J A H T E R A A N R A K Y A T
S t a t i s t i k I n d o n e s i a 2 0 1 3176
Garis Kemiskinan, Jumlah, dan Persentase Penduduk Miskin, 1996–2012Poverty Line, Number, and Percentage of Poor People, 1996–2012
Tabel ––––––
4.6.1Table
4.6 KEMISKINAN DAN PEMBANGUNAN MANUSIAPOVERTY AND HUMAN DEVELOPMENT
[Diolah dari Hasil Survei Sosial Ekonomi Nasional (Susenas), BPS/Based on National Socio Economic Survey, BPS–Statistics Indonesia]
Tahun 1Year 1
Garis Kemiskinan(rupiah)
Poverty Line(rupiah)
Jumlah Penduduk Miskin(juta)
Number of Poor People(million)
Persentase Penduduk MiskinPercentage of Poor People
KotaUrban
DesaRural
KotaUrban
DesaRural
Kota+DesaUrban+Rural
KotaUrban
DesaRural
Kota+DesaUrban+Rural
(1) (2) (3) (4) (5) (6) (7) (8) (9)
1996 42 032 31 366 9,42 24,59 34,01 13,39 19,78 17,47
1998 96 959 72 780 17,60 31,90 49,50 21,92 25,72 24,23
1999 92 409 74 272 15,64 32,33 47,97 19,41 26,03 23,43
2000 91 632 73 648 12,30 26,40 38,70 14,60 22,38 19,14
2001 100 011 80 382 8,60 29,30 37,90 9,76 24,84 18,41
2002 130 499 96 512 13,30 25,10 38,40 14,46 21,10 18,20
2003 138 803 105 888 12,20 25,10 37,30 13,57 20,23 17,42
2004 143 455 108 725 11,40 24,80 36,10 12,13 20,11 16,66
2005 150 799 117 259 12,40 22,70 35,10 11,68 19,98 15,97
2006 174 290 130 584 14,49 24,81 39,30 13,47 21,81 17,75
2007 187 942 146 837 13,56 23,61 37,17 12,52 20,37 16,58
2008 204 896 161 831 12,77 22,19 34,96 11,65 18,93 15,42
2009 222 123 179 835 11,91 20,62 32,53 10,72 17,35 14,15
2010 232 989 192 354 11,10 19,93 31,02 9,87 16,56 13,33
2011 MaretMarch 253 016 213 395 11,05 18,97 30,02 9,23 15,72 12,49
2011 SeptemberSeptember 263 594 223 181 10,95 18,94 29,89 9,09 15,59 12,36
2012 MaretMarch 267 408 229 226 10,65 18,48 29,13 8,78 15,12 11,96
2012 SeptemberSeptember 277 382 240 441 10,51 18,09 28,59 8,60 14,70 11,66
Catatan/Note: 1 Referensi waktu untuk seluruh data adalah Februari, kecuali data tahun 1998 (Desember) dan tahun 2006-2010 (Maret). Data mulai tahun 1999 tanpa Timor Timur.
Time reference for all data is February, except for 1998 (December) and 2006-2010 (March). Started in 1999, data presented excluded Timor Timur.
http
://www.b
ps.g
o.id

S O C I A L A N D W E L F A R E
S t a t i s t i c a l Y e a r b o o k o f I n d o n e s i a 2 0 1 3 177
Jumlah dan Persentase Penduduk Miskin Menurut Provinsi, 2011 dan 2012Number and Percentage of Poor People by Province, 2011 and 2012
Tabel ––––––
4.6.2Table
[Diolah dari Hasil Survei Sosial Ekonomi Nasional (Susenas), BPS/Based on National Socio Economic Survey, BPS–Statistics Indonesia]
ProvinsiProvince
Jumlah Penduduk Miskin(ribu)
Number of Poor People(thousand)
Persentase Penduduk MiskinPercentage of Poor People
2011 2012 2011 2012
SeptemberSeptember
MaretMarch
SeptemberSeptember
SeptemberSeptember
MaretMarch
SeptemberSeptember
(1) (2) (3) (4) (5) (6) (7)
Aceh 900,20 909,04 876,56 19,48 19,46 18,58Sumatera Utara 1 421,40 1 407,25 1 378,45 10,83 10,67 10,41Sumatera Barat 441,80 404,74 397,86 8,99 8,19 8,00Riau 472,50 483,07 481,31 8,17 8,22 8,05
Kepulauan Riau 122,50 131,22 131,22 6,79 7,11 6,83
Jambi 251,80 271,67 270,08 7,90 8,42 8,28Sumatera Selatan 1 061,90 1 057,03 1 042,04 13,95 13,78 13,48Kepulauan Bangka Belitung 65,60 71,36 70,21 5,16 5,53 5,37Bengkulu 303,40 311,66 310,47 17,36 17,70 17,51Lampung 1 277,90 1 253,83 1 218,99 16,58 16,18 15,65
DKI Jakarta 355,20 363,20 366,77 3,64 3,69 3,70Jawa Barat 4 650,80 4 477,53 4 421,48 10,57 10,09 9,89Banten 690,90 652,80 648,25 6,26 5,85 5,71Jawa Tengah 5 256,00 4 977,36 4 863,41 16,21 15,34 14,98DI Yogyakarta 564,20 565,32 562,11 16,14 16,05 15,88Jawa Timur 5 227,30 5 070,98 4 960,54 13,85 13,40 13,08
Bali 183,10 168,78 160,95 4,59 4,18 3,95Nusa Tenggara Barat 896,20 852,64 828,33 19,67 18,63 18,02Nusa Tenggara Timur 986,50 1 012,52 1 000,29 20,48 20,88 20,41
Kalimantan Barat 376,10 363,31 355,70 8,48 8,17 7,96Kalimantan Tengah 150,00 148,05 141,90 6,64 6,51 6,19Kalimantan Selatan 198,60 189,88 189,21 5,35 5,06 5,01Kalimantan Timur 247,10 253,34 246,11 6,63 6,68 6,38Sulawesi Utara 194,70 189,12 177,54 8,46 8,18 7,64Gorontalo 192,40 186,91 187,73 18,02 17,33 17,22
Sulawesi Tengah 432,10 418,64 409,6 16,04 15,40 14,94Sulawesi Selatan 835,50 825,79 805,92 10,27 10,11 9,82Sulawesi Barat 163,20 160,46 160,55 13,64 13,24 13,01Sulawesi Tenggara 334,30 316,33 304,25 14,61 13,71 13,06
Maluku 356,40 350,23 338,89 22,45 21,78 20,76Maluku Utara 107,10 91,79 88,30 10,00 8,47 8,06Papua 946,40 966,59 976,37 31,24 31,11 30,66Papua Barat 227,10 229,99 223,24 28,53 28,20 27,04
Indonesia 29 890,1 29 132,42 28 594,64 12,36 11,96 11,66
http
://www.b
ps.g
o.id

S O S I A L D A N K E S E J A H T E R A A N R A K Y A T
S t a t i s t i k I n d o n e s i a 2 0 1 3178
Garis Kemiskinan, Jumlah, dan Persentase Penduduk Miskin di Daerah Perkotaan Menurut Provinsi, 2011 dan 2012Poverty Line, Number, and Percentage of Poor People in Urban Area by Province, 2011 and 2012
Tabel ––––––
4.6.3Table
[Diolah dari Hasil Survei Sosial Ekonomi Nasional (Susenas), BPS/Based on National Socio Economic Survey, BPS–Statistics Indonesia]
ProvinsiProvince
Garis Kemiskinan (rupiah/kapita/bulan)
Poverty Line(rupiah/capita/month)
Jumlah Penduduk Miskin(ribu)
Number of Poor People(thousand)
Persentase Penduduk Miskin
Percentage of Poor People
2011 2012 2011 2012 2011 2012
SeptemberSeptember
MaretMarch
SeptemberSeptember
SeptemberSeptember
MaretMarch
SeptemberSeptember
SeptemberSeptember
MaretMarch
SeptemberSeptember
(1) (2) (3) (4) (5) (6) (7) (8) (9) (10)
Aceh 346 385 350 260 352 056 169,30 171,80 165,43 13,00 13,07 12,47Sumatera Utara 288 023 286 649 295 080 652,10 669,25 669,36 10,10 10,32 10,28Sumatera Barat 308 068 309 113 321 128 145,00 127,81 124,25 7,60 6,67 6,45Riau 321 390 326 725 333 933 136,10 148,17 156,41 6,00 6,43 6,68Kepulauan Riau 363 572 367 638 373 725 104,80 108,53 106,58 7,10 7,15 6,77Jambi 316 123 311 311 328 504 97,30 103,48 105,35 10,00 10,44 10,53Sumatera Selatan 288 432 290 741 296 933 407,40 388,65 367,64 14,90 14,16 13,29Kepulauan Bangka Belitung 351 414 346 781 374 284 21,00 25,13 24,01 3,40 3,95 3,73Bengkulu 297 506 299 289 318 881 88,20 93,67 92,67 16,30 17,18 16,89Lampung 282 456 283 048 297 421 224,20 239,07 237,94 11,30 12,00 11,88
DKI Jakarta 368 415 379 052 392 571 355,20 363,20 366,77 3,60 3,69 3,70Jawa Barat 234 622 239 189 249 170 2 628,40 2 576,10 2 560,02 9,10 8,84 8,71Banten 247 575 250 041 262 371 335,10 333,00 333,45 4,50 4,46 4,41Jawa Tengah 231 046 234 799 245 817 2 175,80 2 001,12 1 946,51 14,70 13,49 13,11DI Yogyakarta 273 678 274 662 284 549 298,90 305,89 306,51 12,90 13,13 13,10Jawa Timur 242 403 245 305 253 947 1 734,30 1 630,63 1 605,96 9,70 9,06 8,90
Bali 255 996 265 808 270 020 100,90 91,43 93,25 4,20 3,77 3,81Nusa Tenggara Barat 265 135 270 652 274 879 445,20 433,34 415,38 23,40 22,69 21,65Nusa Tenggara Timur 273 406 282 281 293 906 99,20 115,46 117,39 10,50 12,22 12,21
Kalimantan Barat 239 411 243 957 254 972 89,90 80,39 74,23 6,70 5,98 5,49Kalimantan Tengah 259 917 268 576 274 222 28,30 32,39 32,31 3,70 4,26 4,21Kalimantan Selatan 268 791 280 260 286 844 60,00 58,17 56,54 3,80 3,68 3,56Kalimantan Timur 359 290 368 848 384 413 87,90 95,20 91,52 3,80 4,05 3,82
Sulawesi Utara 227 069 222 697 231 794 78,10 74,38 66,81 7,50 7,11 6,36Gorontalo 202 305 209 422 217 073 14,80 16,55 17,84 4,10 4,51 4,80Sulawesi Tengah 271 260 274 497 292 578 65,90 61,17 60,20 10,10 9,24 9,02Sulawesi Selatan 206 620 210 217 215 790 133,60 129,20 133,62 4,50 4,31 4,44Sulawesi Barat 203 048 205 832 212 579 33,40 28,18 29,06 12,20 10,12 10,03Sulawesi Tenggara 208 575 206 201 215 050 28,30 31,56 29,56 4,50 4,99 4,62
Maluku 288 414 300 490 314 855 56,50 58,47 51,10 9,60 9,78 8,39Maluku Utara 264 367 268 729 276 117 8,60 7,56 8,74 3,00 2,55 2,92Papua 320 321 321 228 344 415 37,40 34,31 48,08 4,80 4,24 5,81Papua Barat 356 222 349 678 374 382 13,60 13,99 13,27 5,70 5,76 5,36
Indonesia 263 594 267 408 277 382 10 954,60 10 647,23 10 507,77 9,10 8,78 8,60
http
://www.b
ps.g
o.id
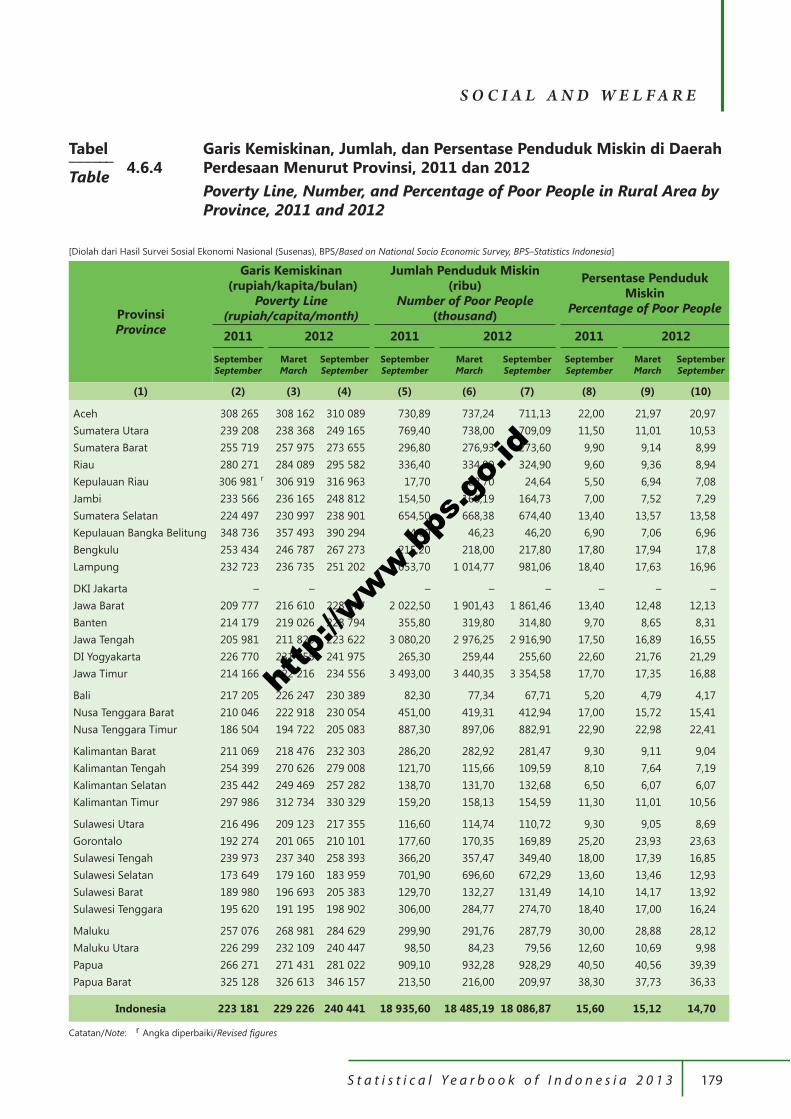
S O C I A L A N D W E L F A R E
S t a t i s t i c a l Y e a r b o o k o f I n d o n e s i a 2 0 1 3 179
Garis Kemiskinan, Jumlah, dan Persentase Penduduk Miskin di Daerah Perdesaan Menurut Provinsi, 2011 dan 2012Poverty Line, Number, and Percentage of Poor People in Rural Area by Province, 2011 and 2012
Tabel ––––––
4.6.4Table
[Diolah dari Hasil Survei Sosial Ekonomi Nasional (Susenas), BPS/Based on National Socio Economic Survey, BPS–Statistics Indonesia]
ProvinsiProvince
Garis Kemiskinan (rupiah/kapita/bulan)
Poverty Line(rupiah/capita/month)
Jumlah Penduduk Miskin(ribu)
Number of Poor People(thousand)
Persentase Penduduk Miskin
Percentage of Poor People
2011 2012 2011 2012 2011 2012
SeptemberSeptember
MaretMarch
SeptemberSeptember
SeptemberSeptember
MaretMarch
SeptemberSeptember
SeptemberSeptember
MaretMarch
SeptemberSeptember
(1) (2) (3) (4) (5) (6) (7) (8) (9) (10)
Aceh 308 265 308 162 310 089 730,89 737,24 711,13 22,00 21,97 20,97Sumatera Utara 239 208 238 368 249 165 769,40 738,00 709,09 11,50 11,01 10,53Sumatera Barat 255 719 257 975 273 655 296,80 276,93 273,60 9,90 9,14 8,99Riau 280 271 284 089 295 582 336,40 334,90 324,90 9,60 9,36 8,94Kepulauan Riau 306 981 r 306 919 316 963 17,70 22,70 24,64 5,50 6,94 7,08Jambi 233 566 236 165 248 812 154,50 168,19 164,73 7,00 7,52 7,29Sumatera Selatan 224 497 230 997 238 901 654,50 668,38 674,40 13,40 13,57 13,58Kepulauan Bangka Belitung 348 736 357 493 390 294 44,60 46,23 46,20 6,90 7,06 6,96Bengkulu 253 434 246 787 267 273 215,20 218,00 217,80 17,80 17,94 17,8Lampung 232 723 236 735 251 202 1 053,70 1 014,77 981,06 18,40 17,63 16,96
DKI Jakarta – – – – – – – – –Jawa Barat 209 777 216 610 228 577 2 022,50 1 901,43 1 861,46 13,40 12,48 12,13Banten 214 179 219 026 228 794 355,80 319,80 314,80 9,70 8,65 8,31Jawa Tengah 205 981 211 823 223 622 3 080,20 2 976,25 2 916,90 17,50 16,89 16,55DI Yogyakarta 226 770 231 855 241 975 265,30 259,44 255,60 22,60 21,76 21,29Jawa Timur 214 166 222 216 234 556 3 493,00 3 440,35 3 354,58 17,70 17,35 16,88
Bali 217 205 226 247 230 389 82,30 77,34 67,71 5,20 4,79 4,17Nusa Tenggara Barat 210 046 222 918 230 054 451,00 419,31 412,94 17,00 15,72 15,41Nusa Tenggara Timur 186 504 194 722 205 083 887,30 897,06 882,91 22,90 22,98 22,41
Kalimantan Barat 211 069 218 476 232 303 286,20 282,92 281,47 9,30 9,11 9,04Kalimantan Tengah 254 399 270 626 279 008 121,70 115,66 109,59 8,10 7,64 7,19Kalimantan Selatan 235 442 249 469 257 282 138,70 131,70 132,68 6,50 6,07 6,07Kalimantan Timur 297 986 312 734 330 329 159,20 158,13 154,59 11,30 11,01 10,56
Sulawesi Utara 216 496 209 123 217 355 116,60 114,74 110,72 9,30 9,05 8,69Gorontalo 192 274 201 065 210 101 177,60 170,35 169,89 25,20 23,93 23,63Sulawesi Tengah 239 973 237 340 258 393 366,20 357,47 349,40 18,00 17,39 16,85Sulawesi Selatan 173 649 179 160 183 959 701,90 696,60 672,29 13,60 13,46 12,93Sulawesi Barat 189 980 196 693 205 383 129,70 132,27 131,49 14,10 14,17 13,92Sulawesi Tenggara 195 620 191 195 198 902 306,00 284,77 274,70 18,40 17,00 16,24
Maluku 257 076 268 981 284 629 299,90 291,76 287,79 30,00 28,88 28,12Maluku Utara 226 299 232 109 240 447 98,50 84,23 79,56 12,60 10,69 9,98Papua 266 271 271 431 281 022 909,10 932,28 928,29 40,50 40,56 39,39Papua Barat 325 128 326 613 346 157 213,50 216,00 209,97 38,30 37,73 36,33
Indonesia 223 181 229 226 240 441 18 935,60 18 485,19 18 086,87 15,60 15,12 14,70
Catatan/Note: r Angka diperbaiki/Revised figures
http
://www.b
ps.g
o.id
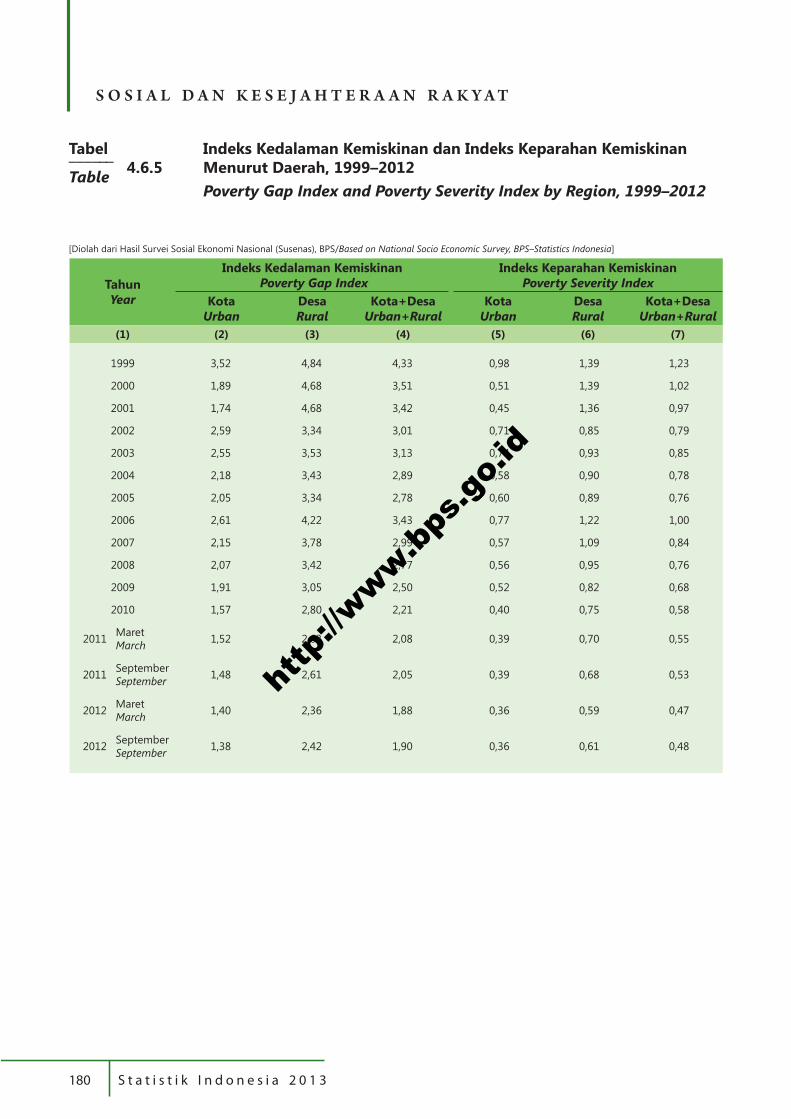
S O S I A L D A N K E S E J A H T E R A A N R A K Y A T
S t a t i s t i k I n d o n e s i a 2 0 1 3180
Indeks Kedalaman Kemiskinan dan Indeks Keparahan Kemiskinan Menurut Daerah, 1999–2012Poverty Gap Index and Poverty Severity Index by Region, 1999–2012
Tabel ––––––
4.6.5Table
[Diolah dari Hasil Survei Sosial Ekonomi Nasional (Susenas), BPS/Based on National Socio Economic Survey, BPS–Statistics Indonesia]
TahunYear
Indeks Kedalaman Kemiskinan Poverty Gap Index
Indeks Keparahan KemiskinanPoverty Severity Index
KotaUrban
DesaRural
Kota+DesaUrban+Rural
KotaUrban
DesaRural
Kota+DesaUrban+Rural
(1) (2) (3) (4) (5) (6) (7)
1999 3,52 4,84 4,33 0,98 1,39 1,23
2000 1,89 4,68 3,51 0,51 1,39 1,02
2001 1,74 4,68 3,42 0,45 1,36 0,97
2002 2,59 3,34 3,01 0,71 0,85 0,79
2003 2,55 3,53 3,13 0,74 0,93 0,85
2004 2,18 3,43 2,89 0,58 0,90 0,78
2005 2,05 3,34 2,78 0,60 0,89 0,76
2006 2,61 4,22 3,43 0,77 1,22 1,00
2007 2,15 3,78 2,99 0,57 1,09 0,84
2008 2,07 3,42 2,77 0,56 0,95 0,76
2009 1,91 3,05 2,50 0,52 0,82 0,68
2010 1,57 2,80 2,21 0,40 0,75 0,58
2011 MaretMarch 1,52 2,63 2,08 0,39 0,70 0,55
2011 SeptemberSeptember 1,48 2,61 2,05 0,39 0,68 0,53
2012 MaretMarch 1,40 2,36 1,88 0,36 0,59 0,47
2012 SeptemberSeptember 1,38 2,42 1,90 0,36 0,61 0,48
http
://www.b
ps.g
o.id

S O C I A L A N D W E L F A R E
S t a t i s t i c a l Y e a r b o o k o f I n d o n e s i a 2 0 1 3 181
Karakteristik Rumah Tangga Miskin dan Rumah Tangga Tidak Miskin, 2011 dan 2012Characteristics of Poor and Non-Poor Households, 2011 and 2012
Tabel ––––––
4.6.6Table
[Diolah dari Hasil Survei Sosial Ekonomi Nasional (Susenas), BPS/Based on National Socio Economic Survey, BPS–Statistics Indonesia]
Karakteristik Rumah TanggaCharacteristics of Household
Rumah Tangga MiskinPoor Household
Rumah Tangga Tidak MiskinNon-Poor Household
2011 2012 2011 2012SeptemberSeptember
MaretMarch
SeptemberSeptember
SeptemberSeptember
MaretMarch
SeptemberSeptember
(1) (2) (3) (4) (5) (6) (7)
Rata-rata jumlah anggota rumah tangga (orang) 4,83 4,97 4,84 3,75 3,78 3,78Number of household members (person)
Persentase kepala rumah tangga wanita 13,12 13,39 14,85 14,31 14,27 14,46Percentage of household headed by women
Rata-rata usia kepala rumah tangga (tahun) 47,28 47,39 47,72 45,87 46,01 46,06Average age of household head (years)
Rata-rata lama sekolah kepala rumah tangga (tahun) 4,91 5,13 4,87 7,61 7,76 7,74Mean years schooling of household head (years)
Tingkat pendidikan kepala rumah tangga (%)Education level of household head (%)a. Tidak tamat SD/Not completed primary school 43,64 40,63 43,97 24,21 23,70 r 23,97b. SD/Primary school 38,03 38,93 37,53 30,30 29,10 r 28,94c. SLTP/Junior high school 11,20 12,46 11,00 15,42 15,19 r 15,17d. SLTA/Senior high school 6,79 7,52 7,07 22,46 24,05 r 23,81e. PT/University 0,35 0,46 0,43 7,61 7,96 r 8,11
Sumber penghasilan utama rumah tangga (%)Main source of income (%)a. Tidak Bekerja/Unemployment 11,59 11,50 13,08 12,09 11,29 11,75b. Pertanian/Agriculture 55,34 55,51 50,90 31,13 32,69 30,23c. Industri/Manufacturing 5,69 5,71 6,95 9,91 9,23 9,76d. Lainnya/Others 27,38 27,28 29,07 46,87 46,79 48,27
Catatan/Note: r Angka diperbaiki/Revised figures
http
://www.b
ps.g
o.id

S O S I A L D A N K E S E J A H T E R A A N R A K Y A T
S t a t i s t i k I n d o n e s i a 2 0 1 3182
Indeks Pembangunan Manusia Menurut Provinsi, 2007–2011Human Development Index by Province, 2007–2011
Tabel ––––––
4.6.7Table
[Seri Publikasi Indeks Pembangunan Manusia, BPS/Series of Publication of Human Development Index, BPS–Statistics Indonesia]
ProvinsiProvince 2007 2008 2009 2010 2011
(1) (2) (3) (4) (5) (6)
Aceh 70,35 70,76 71,31 71,70 72,16Sumatera Utara 72,78 73,29 73,80 74,19 74,65Sumatera Barat 72,23 72,96 73,44 73,78 74,28Riau 74,63 75,09 75,60 76,07 76,53Kepulauan Riau 73,68 74,18 74,54 75,07 75,78Jambi 71,46 71,99 72,45 72,74 73,30Sumatera Selatan 71,40 72,05 72,61 72,95 73,42Kepulauan Bangka Belitung 71,62 72,19 72,55 72,86 73,37Bengkulu 71,57 72,14 72,55 72,92 73,40Lampung 69,78 70,30 70,93 71,42 71,94
DKI Jakarta 76,59 77,03 77,36 77,60 77,97Jawa Barat 70,71 71,12 71,64 72,29 72,73Banten 69,29 69,70 70,06 70,48 70,95Jawa Tengah 70,92 71,60 72,10 72,49 72,94DI Yogyakarta 74,15 74,88 75,23 75,77 76,32Jawa Timur 69,78 70,38 71,06 71,62 72,18
Bali 70,53 70,98 71,52 72,28 72,84Nusa Tenggara Barat 63,71 64,12 64,66 65,20 66,23Nusa Tenggara Timur 65,36 66,15 66,60 67,26 67,75
Kalimantan Barat 67,53 68,17 68,79 69,15 69,66Kalimantan Tengah 73,49 73,88 74,36 74,64 75,06Kalimantan Selatan 68,01 68,72 69,30 69,92 70,44Kalimantan Timur 73,77 74,52 75,11 75,56 76,22
Sulawesi Utara 74,68 75,16 75,68 76,09 76,54Gorontalo 68,83 69,29 69,79 70,28 70,82Sulawesi Tengah 69,34 70,09 70,70 71,14 71,62Sulawesi Selatan 69,62 70,22 70,94 71,62 72,14Sulawesi Barat 67,72 68,55 69,18 69,64 70,11Sulawesi Tenggara 68,32 69,00 69,52 70,00 70,55
Maluku 69,96 70,38 70,96 71,42 71,87Maluku Utara 67,82 68,18 68,63 69,03 69,47Papua 63,41 64,00 64,53 64,94 65,36Papua Barat 67,28 67,95 68,58 69,15 69,65
Indonesia 70,59 71,17 71,76 72,27 72,77
http
://www.b
ps.g
o.id
5PERTANIANAgriculture
http
://www.b
ps.g
o.id

http
://www.b
ps.g
o.id

A G R I C U L T U R E
S t a t i s t i c a l Y e a r b o o k o f I n d o n e s i a 2 0 1 3 185
PENJELASAN TEKNIS
1. Pengumpulan data Statistik Pertanian (SP) diselenggarakan oleh Badan Pusat Statistik bekerja sama dengan Direktorat Jenderal Tanaman Pangan, Kementerian Pertanian.
2. Data pokok tanaman pangan yang dikumpulkan adalah luas panen dan produktivitas (hasil per hektar). Produksi tanaman pangan merupakan hasil perkalian antara luas panen dengan produktivitas. Jenis data tanaman pangan yang dikumpulkan mencakup padi dan palawija (jagung, kedelai, kacang tanah, ubi kayu, dan ubi jalar). Pengumpulan data luas panen dilakukan setiap bulan oleh Mantri Pertanian/Kepala Cabang Dinas Kecamatan (KCD) dan dilaporkan dengan formulir Statistik Pertanian (SP). Pengumpulan data dilakukan dengan pendekatan area kecamatan di seluruh wilayah Indonesia. Pengumpulan data luas panen di tingkat kecamatan tersebut didasarkan pada hasil pengumpulan data dari seluruh desa/kelurahan di kecamatan bersangkutan. Pengumpulan data produktivitas tanaman pangan dilakukan melalui Survei Ubinan dengan pendekatan rumah tangga menggunakan formulir SUB-S. Periode pengumpulan data dilakukan setiap subround (empat bulanan) dengan petugas lapangan adalah Mantri Statistik (Koordinator Statistik Kecamatan/KSK) dan KCD. Pengumpulan data produktivitas dilakukan melalui pengukuran langsung pada plot ubinan berukuran 2½ m x 2½ m. Pengumpulan data produktivitas dilakukan pada waktu panen petani.
3. Pengumpulan data luas lahan sawah dilakukan setiap tahun oleh KCD dengan menggunakan formulir SP-Lahan. Data luas lahan sawah yang dilaporkan adalah kondisi akhir tahun yang berada di wilayah administrasi kecamatan mencakup lahan yang diusahakan oleh rumah tangga, perusahaan, pemerintah, dan lain-lain.
4. Produksi padi mencakup padi sawah dan padi ladang. Data produksi padi dan palawija yang disajikan adalah dalam kualitas: gabah kering giling (padi), pipilan kering (jagung), biji kering (kedelai dan kacang tanah), dan umbi basah (ubi kayu dan ubi jalar).
5. Survei Pertanian Hortikultura (SPH) diselenggarakan oleh Badan Pusat Statistik bekerja sama dengan Direktorat Jendral Hortikultura, Kementerian Pertanian.
TECHNICAL NOTES
1. Agricultural Survey is carried out by the BPS-Statistics Indonesia in cooperation with the Directorate General of Food Crops, The Ministry of Agriculture.
2. The main food crops data collected consists of harvested area and productivity (yield per hectare). Food crops production is generated by harvested area multiplied by productivity. Type of food crops data covers paddy and secondary food crops (maize, soybeans, peanuts, cassava, and sweet potatoes). The harvested area data is collected every month by the Agriculture Extension Workers (called KCD for Kepala Cabang Dinas) and reported in Agriculture Statistics Form (called SP for Statistik Pertanian). Data collection is conducted using sub district area approach in all sub district in Indonesia. Harvested area in each sub district is estimated based on the harvested area in each village in the sub district. Food crops productivity (yield per hectare) data are collected through the Crop Cutting Survey using SUB-S form based on household approach. The data collection is conducted in every sub round ( four monthly) with Sub District Statistics Coordinator (called KSK for Koordinator Statistik Kecamatan) and KCD being the enumerator.The productivity data collection is conducted by a direct measurement in 2½mx2½m crop cutting plot. The productivity measurement is conducted at the time when farmers are harvesting their crops.
3. Wetland area data is collected annually by KCD using the form called SP-Lahan. Wetland area data reported is the condition at the end of the year, and covers wetland in districts administrative area, including the land cultivated by households, firms, governments, and others.
4. The production of paddy covers the production of wetland paddy and dryland paddy. Production of paddy and secondary crops data are presented in the form of: dry unhusked rice (paddy), dry loose maize (maize), dry shells crops (soybeans and peanuts) and fresh roots (cassava and sweet potatoes).
5. The Agricultural Survey for Horticulture (SPH) is carried out by the BPS-Statistics Indonesia in cooperation with the Directorate General of Horticulture, Ministry of Agriculture.
http
://www.b
ps.g
o.id
P E R T A N I A N
S t a t i s t i k I n d o n e s i a 2 0 1 3186
6. Kuesioner yang digunakan dalam pengumpulan data SPH mencakup:a. SPH-SBS digunakan untuk data tanaman sayuran
dan buah-buahan semusim.b. SPH-BST digunakan untuk data tanaman buah-
buahan dan sayuran tahunan.c. SPH-TBF digunakan untuk data tanaman
biofarmaka.d. SPH-TH digunakan untuk data tanaman hias.
7. Metode yang digunakan dalam survei ini adalah metode pencacahan lengkap terhadap seluruh kecamatan di Indonesia dan dilaporkan secara rutin bulanan untuk SPH-SBS dan triwulanan untuk SPH-BST, SPH-TBF, SPH-TH oleh mantri tani/KCD.
8. Tanaman sayuran dan buah-buahan semusim
a. Tanaman sayuran semusim adalah tanaman sumber vitamin, garam mineral dan lain-lain yang dikonsumsi dari bagian tanaman yang berupa daun, bunga, buah dan umbinya, yang berumur kurang dari satu tahun.
b. Tanaman buah-buahan semusim adalah tanaman sumber vitamin, garam mineral dan lain-lain yang dikonsumsi dari bagian tanaman yang berupa buah, berumur kurang dari satu tahun, tidak berbentuk pohon/rumpun tetapi menjalar dan berbatang lunak.
9. Tanaman buah-buahan dan sayuran tahunan a. Tanaman buah-buahan tahunan adalah tanaman
sumber vitamin, garam mineral dan lain-lain yang dikonsumsi dari bagian tanaman yang berupa buah dan merupakan tanaman tahunan.
b. Tanaman sayuran tahunan adalah tanaman sumber vitamin, garam mineral dan lain-lain yang dikonsumsi dari bagian tanaman yang berupa daun dan atau buah yang berumur lebih dari satu tahun.
10. Tanaman biofarmaka Tanaman biofarmaka adalah tanaman yang bermanfaat
untuk obat-obatan, kosmetik dan kesehatan yang dikonsumsi atau digunakan dari bagian-bagian tanaman seperti daun, batang, buah, umbi (rimpang) ataupun akar.
11. Tanaman hias Tanaman hias adalah tanaman yang mempunyai
nilai keindahan baik bentuk, warna daun, tajuk maupun bunganya, sering digunakan untuk penghias pekarangan dan lain sebagainya.
6. The Questionnaire used to collect theArgiculture Survey for Hortikulture data are:a. SPH-SBS used for data on seasonal
vegetables and fruit plants.b. SPH-BST used for data on annual fruit and
vegetables plants.c. SPH-TBF used for data on medicinal plants.d. SPH-TH used for data on ornamental plants
7. The method used in this survey is complete enumeration for all of sub districts in Indonesia and reported monthly for SPH-SBS and quarterly for SPH-BST, SPH-TBF, SPH-TH by agriculture extension services.
8. Seasonal vegetables and fruit plants a. Seasonal vegetables plants are plants which are the
sources of vitamin, mineral salt, etc, consumed from the part of the plant in the form of leaf, flower, fruit and root with the age of less than one year.
b. Seasonal fruits plants are plants which are the sources of vitamin, mineral salt, etc, consumed from the part of the plant in the form of fruits. These plants are creeps with the age of less than one year.
9. Annual fruit and vegetable plantsa. Annual fruits plants are plants which are the sources
of vitamin, contained mineral salt, etc, consumed from the part of plant in the form of fruits and more than one year of age.
b. Annual vegetable plants are plants which are the sources of vitamin, contained mineral salt, etc, consumed from the part of the plant in the form of vegetable and more than one year of age.
10. Medicinal plants Medicinal plants are plants which are usefull for medicine.
It is consumed from parts of the plants such as leaf, flower, fruit, tubber and root.
11. Ornamental plants Ornamental plants are plants which have a beauty value,
either in shape, colour of leaf or crown of flower, and they are often used as a yard decorator.
http
://www.b
ps.g
o.id

A G R I C U L T U R E
S t a t i s t i c a l Y e a r b o o k o f I n d o n e s i a 2 0 1 3 187
12. Data yang dikumpulkan dalam SPH mencakup: data tentang luas penanaman, luas panen (untuk buah-buahan tahunan adalah banyaknya tanaman yang menghasilkan), produksi, luas rusak, luas tanaman akhir dan harga jual petani.
13. Luas panen adalah luas tanaman sayuran, buah-buahan, biofarmaka dan tanaman hias yang yang diambil hasilnya/dipanen pada perode pelaporan.
14. Luas panen untuk tanaman sayuran: luas tanaman yang dipanen sekaligus/habis/dibongkar dan luas tanaman yang dipanen berkali-kali (lebih dari satu kali)/belum habis.a. Tanaman yang dipanen sekaligus/habis/
dibongkar adalah tanaman yang sehabis panen langsung dibongkar/dicabut, terdiri dari bawang merah, bawang putih, bawang daun, kentang, kol/kubis, kembang kol, petsai/sawi, wortel, lobak dan kacang merah.
b. Tanaman yang dipanen berkali-kali (lebih dari satu kali)/belum habis adalah tanaman yang pemanenannya lebih dari satu kali dan biasanya dibongkar apabila panenan terakhir sudah tidak memadai lagi, terdiri dari : kacang panjang, cabe besar, cabe rawit, jamur, tomat, terung, buncis, ketimun, labu siam, kangkung, bayam, melon, semangka dan blewah.
15. Produksi adalah hasil menurut bentuk produk dari
setiap tanaman sayuran, buah-buahan, biofarmaka dan tanaman hias yang diambil berdasarkan luas yang dipanen pada bulan/triwulan laporan.
16. Data perkebunan besar dikumpulkan oleh BPS setiap bulan secara lengkap (sensus bulanan) dengan sistem surat pos. Khusus untuk tanaman kelapa, cengkeh, dan kapok, datanya diperoleh dari Direktorat Jenderal Perkebunan. Data perkebunan rakyat juga diperoleh dari Direktorat Jenderal Perkebunan.
17. Penghitungan luas tanaman perkebunan besar adalah pada keadaan akhir tahun dan tidak termasuk yang luasnya kurang dari 5 hektar.
18. Bentuk produksi perkebunan adalah; karet kering (karet), daun kering (teh dan tembakau), biji kering (kopi dan coklat), kulit kering (kayu manis dan kina), serat kering (rami), bunga kering (cengkeh), refined sugar (tebu dari perkebunan besar), gula mangkok (tebu dari perkebunan rakyat), ekivalen kopra (kopra), biji dan bunga (pala) serta minyak daun (sereh).
12. The Agriculture Survey for Horticulture collects the information on the planted area, harvested area ( for annual vegetables is the number of production plant), production, damaged area, plant area in the end of period, and price on the farm-gate level.
13. Harvested area is area which vegetable, fruit, medicinal and ornamental plant of crop harvested during the period of report.
14. Harvested area of vegetables: area of entirely plant harvested/demolished and plant harvested several times/undemolished.a. Entirely plants harvested/demolished are plants
usually harvested once and demolished to be substituted by other plants, consisting of : shallots, garlic, leeks, potato, cabbage, cauli flower, mustard green, carrots, chinese radish and red kidney beans.
b. Plants harvested several times/undemolished are plants usually harvested more than once and demolished in the case that the last harvest was economically not profitable. They consist of : yard long beans, chili, small chili, mushroom, tomatoes, egg plant, frech beans, cucumber, pumpkin/chajota, swamp cabbage, spinach, melon, watermelon and blewah .
15. Production is the standard production quantity form of vegetable, fruit, medicinal and ornamental plant based on harvested area reported monthly/quarterly.
16. Data on estates are collected by the BPS every month on complete basis through a mailing system. Data on coconut, clove, and kapok, as well as on smallholder plantation, are acquired from the Directorate General of Estates.
17. Planted areas of estates refer to condition at the end of the year, and exclude areas less than 5 hectares.
18. Production of estates crops are follows: dry rubber (rubber); dry leaves (tea and tobacco); dry beans (cofee and cocoa); dry bark (cassiavera and cinchona); dry fibre (rosella); dry flowers/buds (cloves); refined sugar (sugar cane from estate); cup sugar (sugar cane from smallholders); copra (copra); seeds and buds (nutmeg); and leaf oil (citronella).
http
://www.b
ps.g
o.id

P E R T A N I A N
S t a t i s t i k I n d o n e s i a 2 0 1 3188
19. Persediaan akhir tahun produksi perkebunan besar bukan merupakan cadangan penyangga (buffer stock).
20. Data Statistik Kehutanan sebagian besar merupakan data sekunder yang bersumber dari Kementerian Kehutanan.
21. Kawasan hutan adalah wilayah tertentu yang berupa
hutan, yang ditunjuk dan atau ditetapkan oleh pemerintah untuk dipertahankan keberadaannya sebagai hutan tetap. Hal ini untuk menjamin kepastian hukum mengenai status kawasan hutan, letak batas dan luas suatu wilayah tertentu yang sudah ditunjuk menjadi kawasan hutan tetap.
Kawasan hutan Indonesia ditetapkan oleh Menteri Kehutanan dalam bentuk Surat Keputusan Menteri Kehutanan tentang Penunjukan Kawasan Hutan dan Perairan Provinsi. Penunjukan Kawasan Hutan ini disusun berdasarkan hasil pemaduserasian antara Rencana Tata Ruang Wilayah Provinsi (RTRWP) dengan Tata Guna Hutan Kesepakatan (TGHK).
Penunjukan kawasan hutan mencakup pula kawasan perairan yang menjadi bagian dari Kawasan Suaka Alam (KSA) dan Kawasan Pelestarian Alam (KPA).
22. Kawasan Suaka Alam (KSA) adalah kawasan dengan ciri khas tertentu, baik di darat maupun di perairan yang mempunyai fungsi pokok sebagai kawasan pengawetan keanekaragaman tumbuhan dan satwa serta ekosistemnya, yang juga berfungsi sebagai wilayah sistem penyangga kehidupan.
23. Kawasan Pelestarian Alam (KPA) adalah kawasan
dengan ciri khas tertentu, baik di darat maupun di perairan yang mempunyai fungsi pokok perlindungan sistem penyangga kehidupan, pengawetan keanekaragaman jenis tumbuhan dan satwa, serta pemanfaatan secara lestari sumber daya alam hayati dan ekosistemnya.
24. Berdasarkan Undang-Undang No. 41 Tahun 1999 tentang Kehutanan, kawasan hutan dibagi ke dalam kelompok Hutan Konservasi, Hutan Lindung, dan Hutan Produksi.
25. Hutan konservasi adalah kawasan hutan dengan
ciri khas tertentu, yang mempunyai fungsi pokok pengawetan keanekaragaman tumbuhan dan satwa serta ekosistemnya.
19. The production availability of estates at the end of year is not the buffer stock.
20. Most of forestry statistics are secondary data obtained from the Ministry of Forestry.
21. Forest Area is a specific territory of forest ecosystem
determined and or decided by the government as a permanent forest. Such decision is important to maintain the size of forest area and to ensure its legitimation and boundary demarcation of permanent forest.
Indonesian forest area is determined by the Minister of Forestry in the format of Ministerial Decree on the Designation of Provincial Forest Area and Inland Water, Coastal and Marine Ecosystem. The designation of Forest Area is formulated based on integrated and harmonized of Provincial Spatial Planning (RTRWP) and Forest Land Use by Concensus (TGHK).
The designation of forest area in some cases also cover inland water, coastal and marine ecosystem that may become part of Sanctuary Reserve Area (KSA) and Nature Conservation Area (KPA).
22. A Sanctuary Reserve Area is a specific terrestrial or aquatic area having specific criteria for preserving biodiversity plant and animal as well as ecosystem, which also serve as life support system.
23. A Nature Conservation area is a specific terrestrial or aquatic area whose main function is to serve life support system and preserve diversity of plant and animal species, as well as to provide a sustainable utilization of living resources and their ecosystems.
24. In accordance to the Act on Forestry No. 41/1999, forest area is categorized as Conservation Forest, Protection Forest and Production Forest.
25. Conservation forest is a forest area having specific characteristic established for the purposes of conservation of animal and plant species as well as their ecosystem.
http
://www.b
ps.g
o.id
A G R I C U L T U R E
S t a t i s t i c a l Y e a r b o o k o f I n d o n e s i a 2 0 1 3 189
26. Hutan Lindung adalah kawasan hutan yang mempunyai fungsi pokok sebagai perlindungan sistem penyangga kehidupan untuk mengatur tata air, mencegah banjir, mengendalikan erosi, mencegah intrusi air laut, dan memelihara kesuburan tanah.
27. Hutan Produksi adalah kawasan hutan yang mempunyai fungsi pokok memproduksi hasil hutan. Hutan produksi terdiri dari Hutan Produksi Tetap (HP), Hutan Produksi Terbatas (HPT), dan Hutan Produksi yang dapat dikonversi.
28. Hutan konservasi terdiri dari:1. Kawasan suaka alam berupa Cagar Alam (CA)
dan Suaka Margasatwa (SM);2. Kawasan pelestarian alam berupa Taman Nasional
(TN), Taman Hutan Raya (THR), dan Taman Wisata Alam (TWA);
3. Taman Buru (TB).
29. Taman Buru adalah kawasan hutan yang ditetapkan sebagai tempat wisata berburu.
30. Lahan Kritis Penetapan lahan kritis mengacu pada lahan yang telah
sangat rusak karena kehilangan penutupan vegetasinya, sehingga kehilangan atau berkurang fungsinya sebagai penahan air, pengendali erosi, siklus hara, pengatur iklim mikro dan retensi karbon. Berdasarkan kondisi vegetasinya, kondisi lahan dapat diklasifikasikan sebagai : sangat kritis, kritis, agak kritis, potensial kritis dan kondisi normal.
31. Reboisasi Reboisasi atau rehabilitasi hutan bertujuan untuk
menghutankan kembali kawasan hutan yang kritis di wilayah daerah aliran sungai (DAS) yang dilaksanakan bersama masyarakat secara partisipatif.
32. Pemanfaatan Hasil Hutan Kayu pada Hutan Alam Pemanfaatan hasil hutan kayu adalah segala bentuk
usaha yang memanfaatkan dan mengusahakan hasil hutan kayu dengan tidak merusak lingkungan dan tidak mengurangi fungsi pokok hutan. Kegiatan ini hanya dapat dilaksanakan pada areal hutan yang memilki potensi untuk dilakukan kegiatan pemanfaatan hasil hutan kayu dan dapat dilaksanakan setelah diperoleh izin usaha.
26. Protection Forest is a forest area designated to serve life support system, maintain hydrological system, prevent of flood, erotion control, seawater intrusion, and maintain soil fertility.
27. Production forest is a forest area designated mainly to promote sustainable forest production. Production forest is classified as permanent production forest, limited production forest, and convertible production forest.
28. Conservation forest is divided into:1. Sanctuary Reserve area consists of Strict Nature
Reserve and Wildlife Sanctuary.2. Nature conservation area consists of National Park
(TN), Grand Forest Park (THR), and Nature Recreation Park (TWA);
3. Game Hunting Park (TB)
29. Game Hunting Park is forest area devoted for game hunting recreation.
30. Critical Lands Critical land refers to a piece of land severely damaged
due to lost of its vegetation cover so that its functions as water retention, erosion control, nutrient cycling , micro climate regulator and carbon retention are completely depleted. Based upon its vegetation condition, the land could be classified as : very critical, critical, slight critical, potential critical and normal condition.
31. Reforestation Reforestation or forest rehabilitation is intended to
rehabilitate the critical land inside forest area or watershed to improve their ecological and hydrological functions. The activities were conducted with active participation of local communities who live nearby the target area.
32. Commercial Utilization of Timber in Natural Forest Commercial utilization of timber as forest product
is activities to utilize timber without destructing the environment and undermining the main functions of the forest area. Those activities could only be executed in forest area with high commercial timber value with license.
http
://www.b
ps.g
o.id

P E R T A N I A N
S t a t i s t i k I n d o n e s i a 2 0 1 3190
33. Izin Usaha Pemanfaatan Hasil Hutan Kayu (IUPHHK) pada hutan alam adalah izin untuk memanfaatkan hutan produksi yang kegiatannya terdiri dari pemanenan atau penebangan, penanaman, pemeliharaan, pengamanan, pengolahan, dan pemasaran hasil hutan kayu. IUPHHK dapat diberikan kepada perorangan, koperasi, badan usaha swasta dan BUMN/BUMD.
34. Kayu Bulat Produksi hasil hutan utama yang dihasilkan dari hutan
adalah kayu bulat. Produksi kayu bulat ini dihasilkan dari hutan alam melalui kegiatan perusahaan Hak Pengusahaan Hutan (HPH/IUPHHK), kegiatan ijin pemanfaatan kayu (IPK) dalam rangka pembukaan wilayah hutan, pembangunan Hutan Tanaman Industri (HTI) serta kegiatan hutan rakyat.
35. Kayu Gergajian Merupakan kayu hasil konversi kayu bulat dengan
mengunakan mesin gergaji, mempunyai bentuk yang teratur dengan sisi-sisi sejajar dan sudut-sudutnya siku dengan ketebalan tidak lebih dari 6 cm dan kadar air tidak lebih dari 18 persen. Kayu gergajian yang diolah langsung dari kayu bulat, wajib didukung dengan dokumen yang sah.
36. Kayu Lapis Kayu Lapis adalah panel kayu yang tersusun dari
lapisan veneer dibagian luarnya, sedangkan dibagian intinya (core) bisa berupa veneer atau material lain, diikat dengan lem kemudian dipress (ditekan) sedemikian rupa sehingga menjadi panel yang kuat. Termasuk dalam artian ini adalah kayu lapis yang dilapisi lagi dengan material lain.
38. Data populasi ternak bersumber dari Direktorat Jenderal Peternakan dan Kesehatan Hewan, sedangkan data jumlah pemotongan ternak merupakan hasil Survei Laporan Pemotongan Ternak. Pengumpulan data pemotongan ternak dilakukan secara lengkap di seluruh Indonesia dari Rumah Potong Hewan (RPH) dan Keurmaster setiap triwulan. Tahun 2010 jumlah RPH yang diolah sebanyak 2.468 RPH dan Keurmaster sebanyak 3.034.
33. The license to commercially utilize timber in natural forest is license to utilize production forest for which the activities consist of harvesting or felling , planting , tending, protecting , processing , and marketing. The license could be granted to individuals, cooperatives, private companies, state-owned enterprises/local government-owned enterprises.
34. Log The main product of commercial forest operation is log.
The log is harvested from various sources such as natural forest granted to concessionaires (IUPHHK/HPH), land clearing activities (IPK), industrial forest plantation (HTI) and community forest.
35. Sawn Timber Constitutes a sawmill product derived from logs as raw
material. The product is characterized with regular forms having parallel sides at right angle to each other, thickness not more than 6 cm and moisture content not to exceed 18 percent. Sawn timber produced directly from logs must be certified by a legal document.
36. Plywood Plywood is wood panel consisting of layers pressed together
in between veneers; the core may be veneer or some other material, bound together with glue and pressed tightly together to make a strong panel. Included to this definition is plywood covered with other materials.
38. Data of domestic livestock population are obtained from the Directorate General of Livestock Service, while data on the number of animals slaughtered are based on the survey conducted by BPS quartely. This survey is a complete enumeration on all abbatoirs and keurmasters. There are 2,468 abbatoirs and 3,034 keurmasters covered in 2010.
http
://www.b
ps.g
o.id

A G R I C U L T U R E
S t a t i s t i c a l Y e a r b o o k o f I n d o n e s i a 2 0 1 3 191
39. Data statistik perikanan merupakan data sekunder yang bersumber dari Direktorat Jenderal Perikanan Tangkap dan Direktorat Jenderal Budidaya. Statistik perikanan dibedakan atas data Perikanan Tangkap dan Perikanan Budidaya. Perikanan Tangkap diklasifikasikan atas penangkapan ikan di laut dan penangkapan ikan di perairan umum. Perikanan Budidaya diklasifikasikan atas jenis budidaya yaitu budidaya laut, tambak, kolam, karamba, jaring apung dan sawah.
39. Fishery Statistics are secondary data obtained from the Directorate General of Capture Fisheries and Directorate General of Aquaculture. Fishery statistics are categorized into capture fisheries and aquaculture. Capture fisheries are further classified into marine capture fisheries and inland open water capture fisheries. Aquaculture are further classified into several types of culture: marine culture, brackish water pond, fresh water pond, cage, floating net and fish breeding in paddy fields.
http
://www.b
ps.g
o.id

P E R T A N I A N
S t a t i s t i k I n d o n e s i a 2 0 1 3192
Luas Lahan Sawah Menurut Provinsi (ha), 2006–2011Wetland Area by Province (ha), 2006–2011
Tabel –––––– 5.1.1Table
5.1 TANAMAN PANGAN FOOD CROPS
[Diolah dari Hasil Laporan Statistik Pertanian (SP) Tanaman Pangan, BPS/Based on Agriculture Statistic Report of Food Crops, BPS-Statistics Indonesia]
Provinsi/Province 2006 2007 2008 2009 2010 2011 x
(1) (2) (3) (4) (5) (6) (7)
Aceh 315 277 312 803 323 010 359 751 313 649 r 307 556Sumatera Utara 460 486 453 372 478 521 464 256 468 724 468 442Sumatera Barat 229 469 227 355 225 623 228 176 229 693 231 463Riau 124 985 128 242 122 255 122 738 115 961 115 897Kepulauan Riau 82 124 133 238 442 393Jambi 119 242 117 543 116 212 117 336 112 434 113 757Sumatera Selatan 523 922 530 204 577 821 611 072 611 386 629 355Kepulauan Bangka Belitung 4 048 4 176 3 506 5 017 4 056 5 932Bengkulu 83 885 93 779 89 244 89 614 92 976 90 217Lampung 317 413 342 507 348 732 349 144 345 437 348 435
DKI Jakarta 1 466 1 200 1 200 1 215 1 312 1 312Jawa Barat 926 782 934 845 945 544 937 373 930 268 930 507Banten 196 538 196 370 195 583 195 809 196 744 197 165Jawa Tengah 963 401 962 942 963 984 960 768 962 471 960 970DI Yogyakarta 56 218 55 540 55 332 55 325 55 523 55 291Jawa Timur 1 096 479 1 096 605 1 108 578 1 100 517 1 107 276 1 106 449
Bali 79 252 80 251 80 873 79 185 81 425 80 060Nusa Tenggara Barat 232 851 231 129 230 986 236 420 238 619 240 180Nusa Tenggara Timur 112 715 122 649 124 416 139 943 142 479 144 574
Kalimantan Barat 321 838 290 392 292 687 300 906 307 016 318 581Kalimantan Tengah 166 703 159 059 157 406 171 428 175 633 202 237Kalimantan Selatan 440 720 471 042 477 336 464 581 436 318 457 155Kalimantan Timur 90 786 92 934 84 235 88 308 82 796 90 518
Sulawesi Utara 60 262 61 098 61 133 61 134 52 789 56 181Gorontalo 25 668 27 794 31 327 29 062 29 566 28 707Sulawesi Tengah 119 463 128 250 129 016 130 879 136 241 137 786Sulawesi Selatan 552 940 560 989 567 520 565 601 572 089 576 559Sulawesi Barat 48 884 50 800 53 220 56 056 59 476 55 016Sulawesi Tenggara 62 286 65 338 82 806 89 601 83 356 r 85 585
Maluku 8 657 10 035 11 461 11 281 11 451 14 085Maluku Utara 11 867 11 782 13 630 8 890 9 478 9 093Papua 28 970 26 397 29 018 27 454 27 757 27 756Papua Barat 7 735 8 395 9 116 9 249 7 711 7 648
Indonesia 7 791 290 7 855 941 7 991 464 8 068 327 8 002 552 r 8 094 862
Catatan/Note: r Angka diperbaiki/Revised figures x Angka sementara/Preliminary figures
http
://www.b
ps.g
o.id

A G R I C U L T U R E
S t a t i s t i c a l Y e a r b o o k o f I n d o n e s i a 2 0 1 3 193
Luas Panen, Produksi, dan Produktivitas Tanaman Pangan, 2008–2012Harvested Area, Production, and Productivity of Food Crops, 2008–2012
Tabel –––––– 5.1.2Table
[Diolah dari Hasil Laporan Statistik Pertanian (SP) Tanaman Pangan, BPS/Based on Agriculture Statistic Report of Food Crops, BPS-Statistics Indonesia]
Jenis Tanaman/Crops Satuan/Unit 2008 2009 2010 2011 2012 x
(1) (2) (3) (4) (5) (6) (7)
Padi/PaddyLuas panen/Harvested area (000 ha) 12 327,4 12 883,6 13 253,5 13 203,6 13 443,4Produksi/Production (000 ton) 60 325,9 64 398,9 66 469,4 65 756,9 69 045,1Produktivitas/Productivity (kuintal/ha) 48,94 49,99 50,15 49,80 51,36
(quintal/ha)
Jagung/MaizeLuas panen/Harvested area (000 ha) 4 001,7 4 160,7 4 131,7 3 864,7 3 959,9Produksi/Production (000 ton) 16 317,3 17 629,7 18 327,6 17 643,3 19 377,0Produktivitas/Productivity (kuintal/ha) 40,78 42,37 44,36 45,65 48,93
(quintal/ha)
Kedelai/SoybeansLuas panen/Harvested area (000 ha) 591,0 722,8 660,8 622,3 567,9Produksi/Production (000 ton) 775,7 974,5 907,0 851,3 851,6Produktivitas/Productivity (kuintal/ha) 13,13 13,48 13,73 13,68 15,00
(quintal/ha)
Kacang Tanah/PeanutsLuas panen/Harvested area (000 ha) 633,9 622,6 620,6 539,5 559,5Produksi/Production (000 ton) 770,1 777,9 779,2 691,3 712,9Produktivitas/Productivity (kuintal/ha) 12,15 12,49 12,56 12,81 12,74
(quintal/ha)
Ubi Kayu/CassavaLuas panen/Harvested area (000 ha) 1 204,9 1 175,7 1 183,0 1 184,7 1 119,8Produksi/Production (000 ton) 21 757,0 22 039,1 23 918,1 24 044,0 23 922,1Produktivitas/Productivity (kuintal/ha) 180,57 187,46 202,17 202,96 213,63
(quintal/ha)
Ubi Jalar/Sweet PotatoesLuas panen/Harvested area (000 ha) 174,6 183,9 181,1 178,1 178,3Produksi/Production (000 ton) 1 881,8 2 057,9 2 051,0 2 196,0 2 483,5Produktivitas/Productivity (kuintal/ha) 107,80 111,92 113,27 123,29 139,29
(quintal/ha)
Catatan/Note: x Angka sementara/Preliminary figures
http
://www.b
ps.g
o.id

P E R T A N I A N
S t a t i s t i k I n d o n e s i a 2 0 1 3194
Luas Panen Padi Menurut Provinsi (ha), 2008–2012Harvested Area of Paddy by Province (ha), 2008–2012
Tabel –––––– 5.1.3Table
[Diolah dari Hasil Laporan Statistik Pertanian (SP) Tanaman Pangan, BPS/Based on Agriculture Statistic Report of Food Crops, BPS-Statistics Indonesia]
Provinsi/Province 2008 2009 2010 2011 2012 x
(1) (2) (3) (4) (5) (6)
Aceh 329 109 359 375 352 281 380 686 387 803Sumatera Utara 748 540 768 407 754 674 757 547 765 099Sumatera Barat 421 902 439 542 460 497 461 709 476 422Riau 147 796 149 423 156 088 145 242 144 015Kepulauan Riau 134 144 396 387 382Jambi 143 034 155 802 153 897 157 441 149 369Sumatera Selatan 718 797 746 465 769 478 784 820 769 725Kepulauan Bangka Belitung 6 266 8 063 8 180 5 299 8 057Bengkulu 127 506 132 975 133 629 127 934 144 448Lampung 506 547 570 417 590 608 606 973 641 876
DKI Jakarta 1 640 1 974 2 015 1 723 1 897Jawa Barat 1 803 628 1 950 203 2 037 657 1 964 466 1 918 799Banten 362 637 366 138 406 411 397 021 362 636Jawa Tengah 1 659 314 1 725 034 1 801 397 1 724 246 1 773 558DI Yogyakarta 140 167 145 424 147 058 150 827 152 912Jawa Timur 1 774 884 1 904 830 1 963 983 1 926 796 1 975 719
Bali 143 999 150 283 152 190 152 585 149 000Nusa Tenggara Barat 359 714 374 279 374 284 418 062 425 448Nusa Tenggara Timur 187 907 194 219 174 674 195 201 200 094
Kalimantan Barat 423 601 418 929 428 461 444 353 427 798Kalimantan Tengah 205 684 214 480 247 577 214 161 251 787Kalimantan Selatan 507 319 490 069 471 166 489 134 496 082Kalimantan Timur 157 341 146 177 150 031 140 215 140 689
Sulawesi Utara 109 951 114 745 119 771 122 108 126 931Gorontalo 46 942 48 042 45 937 52 811 51 164Sulawesi Tengah 211 876 211 232 208 628 221 846 229 080Sulawesi Selatan 836 298 862 017 886 354 889 232 981 164Sulawesi Barat 72 471 64 973 75 923 76 347 83 796Sulawesi Tenggara 102 520 98 130 107 751 118 916 124 511
Maluku 19 142 21 252 20 233 21 227 20 489Maluku Utara 14 831 13 711 16 071 16 783 17 794Papua 24 461 26 336 26 686 29 262 37 149Papua Barat 11 467 10 486 9 464 8 283 7 750
Indonesia 12 327 425 12 883 576 13 253 450 13 203 643 13 443 443
Catatan/Note: x Angka sementara/Preliminary figures
http
://www.b
ps.g
o.id

A G R I C U L T U R E
S t a t i s t i c a l Y e a r b o o k o f I n d o n e s i a 2 0 1 3 195
Catatan/Note: x Angka sementara/Preliminary figures 1 Kualitas produksi gabah kering giling/The production form is dry unhusked rice
Produksi Padi 1 Menurut Provinsi (ton), 2008–2012 Production of Paddy 1 by Province (ton), 2008–2012
Tabel –––––– 5.1.4Table
[Diolah dari Hasil Laporan Statistik Pertanian (SP) Tanaman Pangan dan Survei Ubinan, BPS/Based on Statistic Report of Food Crops and Crop Cutting Survey, BPS-Statistics Indonesia]
Provinsi/Province 2008 2009 2010 2011 2012 x
(1) (2) (3) (4) (5) (6)
Aceh 1 402 287 1 556 858 1 582 393 1 772 962 1 788 738Sumatera Utara 3 340 794 3 527 899 3 582 302 3 607 403 3 715 514Sumatera Barat 1 965 634 2 105 790 2 211 248 2 279 602 2 368 390Riau 494 260 531 429 574 864 535 788 512 152Kepulauan Riau 404 430 1 246 1 223 1 323Jambi 581 704 644 947 628 828 646 641 625 164Sumatera Selatan 2 971 286 3 125 236 3 272 451 3 384 670 3 295 247Kepulauan Bangka Belitung 15 079 19 864 22 259 15 211 22 976Bengkulu 484 900 510 160 516 869 502 552 581 911Lampung 2 341 075 2 673 844 2 807 676 2 940 795 3 093 422
DKI Jakarta 8 352 11 013 11 164 9 516 11 044Jawa Barat 10 111 069 11 322 681 11 737 070 11 633 891 11 271 861Banten 1 818 166 1 849 007 2 048 047 1 949 714 1 865 893Jawa Tengah 9 136 405 9 600 415 10 110 830 9 391 959 10 232 934DI Yogyakarta 798 232 837 930 823 887 842 934 946 224Jawa Timur 10 474 773 11 259 085 11 643 773 10 576 543 12 198 707
Bali 840 465 878 764 869 161 858 316 865 553Nusa Tenggara Barat 1 750 677 1 870 775 1 774 499 2 067 137 2 114 231Nusa Tenggara Timur 577 895 607 359 555 493 591 371 698 566
Kalimantan Barat 1 321 443 1 300 798 1 343 888 1 372 988 1 300 100Kalimantan Tengah 522 732 578 761 650 416 610 236 755 507Kalimantan Selatan 1 954 284 1 956 993 1 842 089 2 038 309 2 086 221Kalimantan Timur 586 031 555 560 588 879 552 616 553 440
Sulawesi Utara 520 193 549 087 584 030 596 223 615 062Gorontalo 237 873 256 934 253 563 273 921 245 357Sulawesi Tengah 985 418 953 396 957 108 1 041 789 1 024 316Sulawesi Selatan 4 083 356 4 324 178 4 382 443 4 511 705 5 008 143Sulawesi Barat 343 221 310 706 362 900 365 683 412 620Sulawesi Tenggara 405 256 407 367 454 644 491 567 516 291
Maluku 75 826 89 875 83 109 87 468 84 271Maluku Utara 51 599 46 253 55 401 61 430 65 686Papua 85 699 98 511 102 610 115 437 138 032Papua Barat 39 537 36 985 34 254 29 304 30 245
Indonesia 60 325 925 64 398 890 66 469 394 65 756 904 69 045 141
http
://www.b
ps.g
o.id
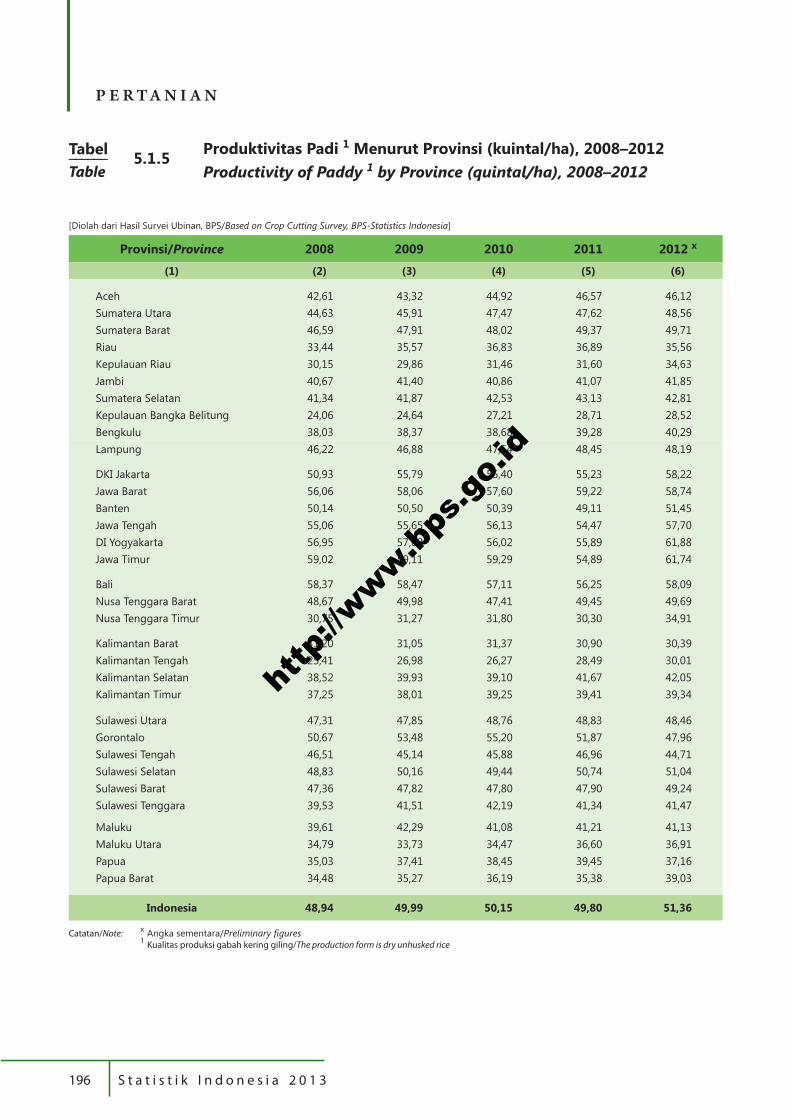
P E R T A N I A N
S t a t i s t i k I n d o n e s i a 2 0 1 3196
Produktivitas Padi 1 Menurut Provinsi (kuintal/ha), 2008–2012Productivity of Paddy 1 by Province (quintal/ha), 2008–2012
Tabel –––––– 5.1.5Table
[Diolah dari Hasil Survei Ubinan, BPS/Based on Crop Cutting Survey, BPS-Statistics Indonesia]
Provinsi/Province 2008 2009 2010 2011 2012 x
(1) (2) (3) (4) (5) (6)
Aceh 42,61 43,32 44,92 46,57 46,12Sumatera Utara 44,63 45,91 47,47 47,62 48,56Sumatera Barat 46,59 47,91 48,02 49,37 49,71Riau 33,44 35,57 36,83 36,89 35,56Kepulauan Riau 30,15 29,86 31,46 31,60 34,63Jambi 40,67 41,40 40,86 41,07 41,85Sumatera Selatan 41,34 41,87 42,53 43,13 42,81Kepulauan Bangka Belitung 24,06 24,64 27,21 28,71 28,52Bengkulu 38,03 38,37 38,68 39,28 40,29Lampung 46,22 46,88 47,54 48,45 48,19
DKI Jakarta 50,93 55,79 55,40 55,23 58,22Jawa Barat 56,06 58,06 57,60 59,22 58,74Banten 50,14 50,50 50,39 49,11 51,45Jawa Tengah 55,06 55,65 56,13 54,47 57,70DI Yogyakarta 56,95 57,62 56,02 55,89 61,88Jawa Timur 59,02 59,11 59,29 54,89 61,74
Bali 58,37 58,47 57,11 56,25 58,09Nusa Tenggara Barat 48,67 49,98 47,41 49,45 49,69Nusa Tenggara Timur 30,75 31,27 31,80 30,30 34,91
Kalimantan Barat 31,20 31,05 31,37 30,90 30,39Kalimantan Tengah 25,41 26,98 26,27 28,49 30,01Kalimantan Selatan 38,52 39,93 39,10 41,67 42,05Kalimantan Timur 37,25 38,01 39,25 39,41 39,34
Sulawesi Utara 47,31 47,85 48,76 48,83 48,46Gorontalo 50,67 53,48 55,20 51,87 47,96Sulawesi Tengah 46,51 45,14 45,88 46,96 44,71Sulawesi Selatan 48,83 50,16 49,44 50,74 51,04Sulawesi Barat 47,36 47,82 47,80 47,90 49,24Sulawesi Tenggara 39,53 41,51 42,19 41,34 41,47
Maluku 39,61 42,29 41,08 41,21 41,13Maluku Utara 34,79 33,73 34,47 36,60 36,91Papua 35,03 37,41 38,45 39,45 37,16Papua Barat 34,48 35,27 36,19 35,38 39,03
Indonesia 48,94 49,99 50,15 49,80 51,36
Catatan/Note: x Angka sementara/Preliminary figures 1 Kualitas produksi gabah kering giling/The production form is dry unhusked rice
http
://www.b
ps.g
o.id

A G R I C U L T U R E
S t a t i s t i c a l Y e a r b o o k o f I n d o n e s i a 2 0 1 3 197
Catatan/Note: x Angka sementara/Preliminary figures
Luas Panen Jagung Menurut Provinsi (ha), 2008–2012Harvested Area of Maize by Province (ha), 2008–2012
Tabel –––––– 5.1.6Table
[Diolah dari Hasil Laporan Statistik Pertanian (SP) Tanaman Pangan, BPS/Based on Agriculture Statistic Report of Food Crops, BPS-Statistics Indonesia]
Provinsi/Province 2008 2009 2010 2011 2012 x
(1) (2) (3) (4) (5) (6)
Aceh 34 164 39 731 43 885 41 853 43 675Sumatera Utara 240 413 247 782 274 822 255 291 243 098Sumatera Barat 63 219 70 882 59 801 71 116 75 657Riau 21 397 25 016 18 044 14 139 13 284Kepulauan Riau 531 502 454 434 390Jambi 9 520 10 112 8 280 6 706 6 587Sumatera Selatan 31 716 31 693 33 769 32 965 28 617Kepulauan Bangka Belitung 393 458 341 277 267Bengkulu 35 661 28 205 20 516 22 215 22 653Lampung 387 549 434 542 447 509 380 917 360 264
DKI Jakarta 20 16 15 12 3Jawa Barat 118 976 136 707 153 778 147 152 148 601Banten 6 288 8 425 8 697 4 600 3 074Jawa Tengah 639 354 661 706 631 816 520 149 553 372DI Yogyakarta 71 164 74 563 86 837 69 768 73 766Jawa Timur 1 235 933 1 295 070 1 257 721 1 204 063 1 232 523
Bali 27 251 32 305 26 706 22 739 21 008Nusa Tenggara Barat 59 078 81 543 61 593 89 307 117 030Nusa Tenggara Timur 270 717 250 536 244 583 246 893 245 323
Kalimantan Barat 42 834 41 302 45 014 45 593 44 642Kalimantan Tengah 2 104 2 821 3 247 3 195 2 734Kalimantan Selatan 20 116 22 979 22 584 19 487 21 723Kalimantan Timur 5 375 5 141 4 693 2 965 4 104
Sulawesi Utara 131 791 126 349 121 930 119 850 120 272Gorontalo 156 436 124 798 143 833 135 754 137 878Sulawesi Tengah 38 209 46 245 42 747 41 218 37 418Sulawesi Selatan 285 094 299 669 303 375 297 126 325 329Sulawesi Barat 9 110 11 694 13 308 17 372 25 141Sulawesi Tenggara 37 249 27 214 29 607 28 892 30 884
Maluku 8 045 6 749 6 293 4 808 4 766Maluku Utara 6 834 10 984 10 813 12 733 11 074Papua 4 113 3 955 3 903 3 825 3 553Papua Barat 1 070 965 1 162 1 278 1 199
Indonesia 4 001 724 4 160 659 4 131 676 3 864 692 3 959 909
http
://www.b
ps.g
o.id

P E R T A N I A N
S t a t i s t i k I n d o n e s i a 2 0 1 3198
Produksi Jagung 1 Menurut Provinsi (ton), 2008–2012Production of Maize 1 by Province (ton), 2008–2012
Tabel –––––– 5.1.7Table
[Diolah dari Hasil Laporan Statistik Pertanian (SP) Tanaman Pangan dan Survei Ubinan, BPS/Based on Statistic Report of Food Crops and Crop Cutting Survey, BPS-Statistics Indonesia]
Provinsi/Province 2008 2009 2010 2011 2012 x
(1) (2) (3) (4) (5) (6)
Aceh 112 894 137 753 167 090 168 861 167 285Sumatera Utara 1 098 969 1 166 548 1 377 718 1 294 645 1 347 124Sumatera Barat 351 843 404 795 354 262 471 849 495 497Riau 47 959 56 521 41 862 33 197 31 433Kepulauan Riau 1 125 1 064 961 923 849Jambi 34 616 38 169 30 691 25 521 25 571Sumatera Selatan 101 439 113 167 125 796 125 688 112 285Kepulauan Bangka Belitung 1 193 1 403 1 055 850 964Bengkulu 111 827 93 798 74 331 87 362 103 771Lampung 1 809 886 2 067 710 2 126 571 1 817 906 1 741 988
DKI Jakarta 39 32 31 23 6Jawa Barat 639 822 787 599 923 962 945 104 1 028 653Banten 20 169 27 083 28 557 13 863 9 819Jawa Tengah 2 679 914 3 057 845 3 058 710 2 772 575 3 041 630DI Yogyakarta 285 372 314 937 345 576 291 596 336 608Jawa Timur 5 053 107 5 266 720 5 587 318 5 443 705 6 295 301
Bali 77 619 92 998 66 355 64 606 61 873Nusa Tenggara Barat 196 263 308 863 249 005 456 915 642 674Nusa Tenggara Timur 673 112 638 899 653 620 524 638 629 386
Kalimantan Barat 181 407 166 833 168 273 160 819 170 123Kalimantan Tengah 5 982 8 048 9 345 9 208 7 895Kalimantan Selatan 95 064 113 885 116 449 99 779 112 066Kalimantan Timur 12 795 12 520 11 993 7 341 9 940
Sulawesi Utara 466 041 450 989 446 144 438 504 440 308Gorontalo 753 598 569 110 679 167 605 782 654 444Sulawesi Tengah 136 907 164 282 162 306 161 810 141 649Sulawesi Selatan 1 195 691 1 395 742 1 343 044 1 420 154 1 514 636Sulawesi Barat 40 252 58 320 58 020 82 995 122 545Sulawesi Tenggara 93 064 71 655 74 840 67 997 78 447
Maluku 18 924 15 859 15 273 13 875 18 275Maluku Utara 11 493 18 229 20 546 26 149 25 543Papua 7 155 6 787 6 834 6 885 6 393Papua Barat 1 711 1 585 1 931 2 125 2 049
Indonesia 16 317 252 17 629 748 18 327 636 17 643 250 19 377 030
Catatan/Note: x Angka sementara/Preliminary figures 1 Kualitas produksi pipilan kering/The production form is dry loose maize
http
://www.b
ps.g
o.id
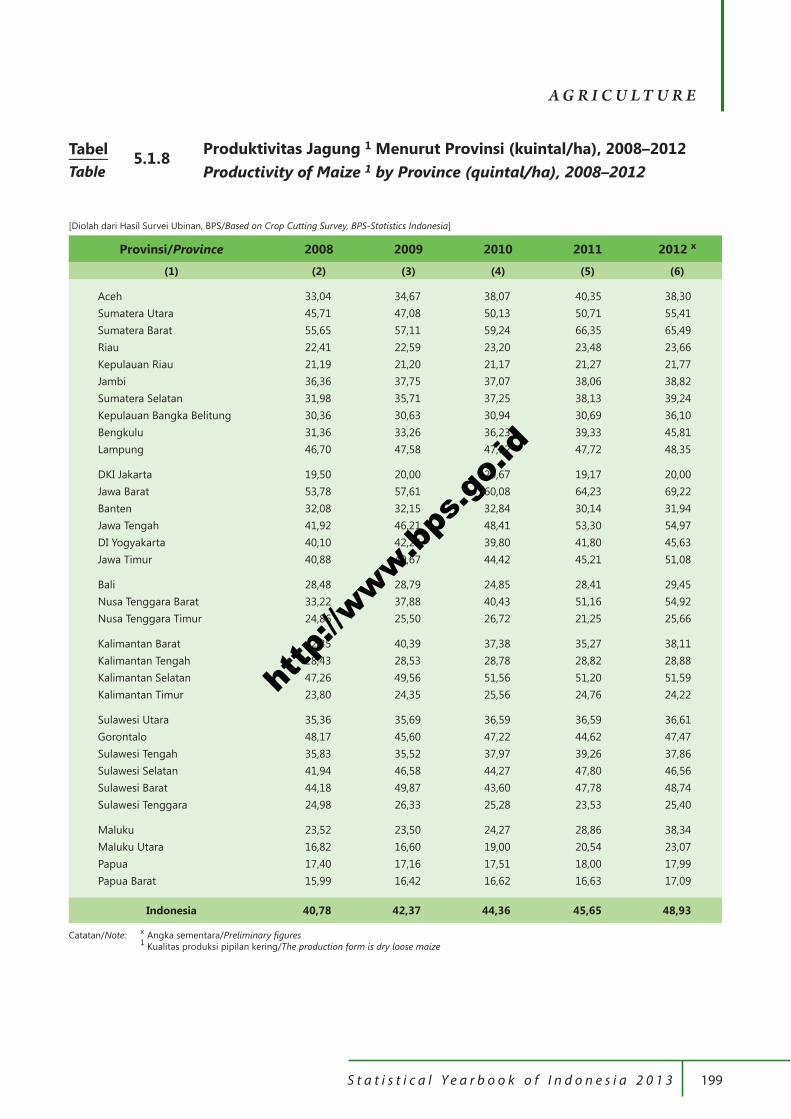
A G R I C U L T U R E
S t a t i s t i c a l Y e a r b o o k o f I n d o n e s i a 2 0 1 3 199
Catatan/Note: x Angka sementara/Preliminary figures 1 Kualitas produksi pipilan kering/The production form is dry loose maize
Produktivitas Jagung 1 Menurut Provinsi (kuintal/ha), 2008–2012Productivity of Maize 1 by Province (quintal/ha), 2008–2012
Tabel –––––– 5.1.8Table
[Diolah dari Hasil Survei Ubinan, BPS/Based on Crop Cutting Survey, BPS-Statistics Indonesia]
Provinsi/Province 2008 2009 2010 2011 2012 x
(1) (2) (3) (4) (5) (6)
Aceh 33,04 34,67 38,07 40,35 38,30Sumatera Utara 45,71 47,08 50,13 50,71 55,41Sumatera Barat 55,65 57,11 59,24 66,35 65,49Riau 22,41 22,59 23,20 23,48 23,66Kepulauan Riau 21,19 21,20 21,17 21,27 21,77Jambi 36,36 37,75 37,07 38,06 38,82Sumatera Selatan 31,98 35,71 37,25 38,13 39,24Kepulauan Bangka Belitung 30,36 30,63 30,94 30,69 36,10Bengkulu 31,36 33,26 36,23 39,33 45,81Lampung 46,70 47,58 47,52 47,72 48,35
DKI Jakarta 19,50 20,00 20,67 19,17 20,00Jawa Barat 53,78 57,61 60,08 64,23 69,22Banten 32,08 32,15 32,84 30,14 31,94Jawa Tengah 41,92 46,21 48,41 53,30 54,97DI Yogyakarta 40,10 42,24 39,80 41,80 45,63Jawa Timur 40,88 40,67 44,42 45,21 51,08
Bali 28,48 28,79 24,85 28,41 29,45Nusa Tenggara Barat 33,22 37,88 40,43 51,16 54,92Nusa Tenggara Timur 24,86 25,50 26,72 21,25 25,66
Kalimantan Barat 42,35 40,39 37,38 35,27 38,11Kalimantan Tengah 28,43 28,53 28,78 28,82 28,88Kalimantan Selatan 47,26 49,56 51,56 51,20 51,59Kalimantan Timur 23,80 24,35 25,56 24,76 24,22
Sulawesi Utara 35,36 35,69 36,59 36,59 36,61Gorontalo 48,17 45,60 47,22 44,62 47,47Sulawesi Tengah 35,83 35,52 37,97 39,26 37,86Sulawesi Selatan 41,94 46,58 44,27 47,80 46,56Sulawesi Barat 44,18 49,87 43,60 47,78 48,74Sulawesi Tenggara 24,98 26,33 25,28 23,53 25,40
Maluku 23,52 23,50 24,27 28,86 38,34Maluku Utara 16,82 16,60 19,00 20,54 23,07Papua 17,40 17,16 17,51 18,00 17,99Papua Barat 15,99 16,42 16,62 16,63 17,09
Indonesia 40,78 42,37 44,36 45,65 48,93
http
://www.b
ps.g
o.id

P E R T A N I A N
S t a t i s t i k I n d o n e s i a 2 0 1 3200
Luas Panen Kedelai Menurut Provinsi (ha), 2008–2012 Harvested Area of Soybeans by Province (ha), 2008–2012
Tabel –––––– 5.1.9Table
[Diolah dari Hasil Laporan Statistik Pertanian (SP) Tanaman Pangan, BPS/Based on Agriculture Statistic Report of Food Crops, BPS–Statistics Indonesia]
Provinsi/Province 2008 2009 2010 2011 2012 x
(1) (2) (3) (4) (5) (6)
Aceh 32 898 45 110 37 469 35 370 35 599Sumatera Utara 9 597 11 494 7 803 11 413 5 475Sumatera Barat 1 125 1 882 1 113 1 345 850Riau 4 319 4 906 5 252 6 425 3 686Kepulauan Riau 2 2 6 7 15Jambi 4 785 7 238 4 243 4 563 2 809Sumatera Selatan 5 352 9 168 7 532 8 698 7 756Kepulauan Bangka Belitung 8 1 53 1 1 Bengkulu 2 487 5.605 2 654 3 425 2 253Lampung 5 658 13.518 6 195 9 232 6 708
DKI Jakarta – – – – – Jawa Barat 23 810 41 775 36 700 35 674 30 345Banten 4 975 12 198 8 358 4 719 5 213Jawa Tengah 111 653 110 061 114 070 81 988 97 112DI Yogyakarta 32 514 31 666 33 572 28 988 28 554Jawa Timur 216 828 264 779 246 894 252 815 220 815
Bali 6 345 9 378 4 827 6 896 6 344Nusa Tenggara Barat 76 154 87 920 86 649 75 042 62 888Nusa Tenggara Timur 2 326 2 010 1 758 1 366 2 691
Kalimantan Barat 1 333 1 758 2 541 1 501 998Kalimantan Tengah 1 653 1 889 2 397 2 443 1 446Kalimantan Selatan 3 260 3 345 3 154 3 354 2 878Kalimantan Timur 2 143 1 878 1 679 1 835 1 041
Sulawesi Utara 5 227 5 652 5 739 4 746 2 232Gorontalo 1 873 4 727 2 885 1 741 3 101Sulawesi Tengah 2 362 3 618 2 786 4 632 5 621Sulawesi Selatan 19 048 25 792 23 641 21 441 19 964Sulawesi Barat 1 498 2 076 2 083 1 764 2 021Sulawesi Tenggara 4 101 6 719 2 661 5 814 3 870
Maluku 1 294 1 307 988 247 272Maluku Utara 1 047 543 787 845 978 Papua 3 657 3 626 3 763 3 549 3 732Papua Barat 1 624 1 150 571 375 603
Indonesia 590 956 722 791 660 823 622 254 567 871
Catatan/Note: x Angka sementara/Preliminary figures
http
://www.b
ps.g
o.id

A G R I C U L T U R E
S t a t i s t i c a l Y e a r b o o k o f I n d o n e s i a 2 0 1 3 201
Produksi Kedelai 1 Menurut Provinsi (ton), 2008–2012Production of Soybeans 1 by Province (ton), 2008–2012
Tabel –––––– 5.1.10Table
[Diolah dari Hasil Laporan Statistik Pertanian (SP) Tanaman Pangan dan Survei Ubinan, BPS/Based on Statistic Report of Food Crops and Crop Cutting Survey, BPS-Statistics Indonesia]
Provinsi/Province 2008 2009 2010 2011 2012 x
(1) (2) (3) (4) (5) (6)
Aceh 43 885 63 538 53 347 50 006 51 439Sumatera Utara 11 647 14 206 9 439 11 426 5 419Sumatera Barat 1 459 3 175 1 834 1 925 1 106Riau 4 689 5 298 5 830 7 100 4 182Kepulauan Riau 2 2 6 7 15Jambi 5 969 9 132 5 320 5 668 3 516Sumatera Selatan 7 305 13 702 11 664 13 710 12 162Kepulauan Bangka Belitung 8 1 52 1 1Bengkulu 2 316 5 323 2 719 3 458 2 316Lampung 6 678 16 153 7 325 10 984 7 993
DKI Jakarta – – – – –Jawa Barat 32 921 60 257 55 823 56 166 47 425Banten 6 452 15 888 11 662 5 885 5 780Jawa Tengah 167 345 175 156 187 992 112 273 152 416DI Yogyakarta 34 998 40 278 38 244 32 795 36 033Jawa Timur 277 281 355 260 339 491 366 999 361 986
Bali 9 323 13 521 5 554 8 503 8 210Nusa Tenggara Barat 95 106 95 846 93 122 88 099 74 156Nusa Tenggara Timur 2 295 2 101 1 780 1 378 2 781
Kalimantan Barat 1 562 2 046 3 477 2 027 1 339Kalimantan Tengah 1 860 2 136 2 764 2 823 1 697Kalimantan Selatan 3 818 3 838 3 809 4 376 3 860Kalimantan Timur 2 578 2 255 2 204 2 281 1 363
Sulawesi Utara 7 217 7 667 7 627 6 319 2 973Gorontalo 2 514 5 527 3 403 2 156 3 777Sulawesi Tengah 2 927 4 722 3 555 6 900 8 202Sulawesi Selatan 29 125 41 279 35 711 33 716 38 111Sulawesi Barat 2 054 3 153 3 195 2 433 3 222Sulawesi Tenggara 3 812 5 615 3 203 6 113 3 710
Maluku 1 563 1 579 1 183 297 348Maluku Utara 1 278 652 944 1 100 1 303Papua 3 983 3 998 4 152 3 959 4 156Papua Barat 1 740 1 208 600 403 650
Indonesia 775 710 974 512 907 031 851 286 851 647
Catatan/Note: x Angka sementara/Preliminary figures 1 Kualitas produksi biji kering/The production form is dry shells
http
://www.b
ps.g
o.id
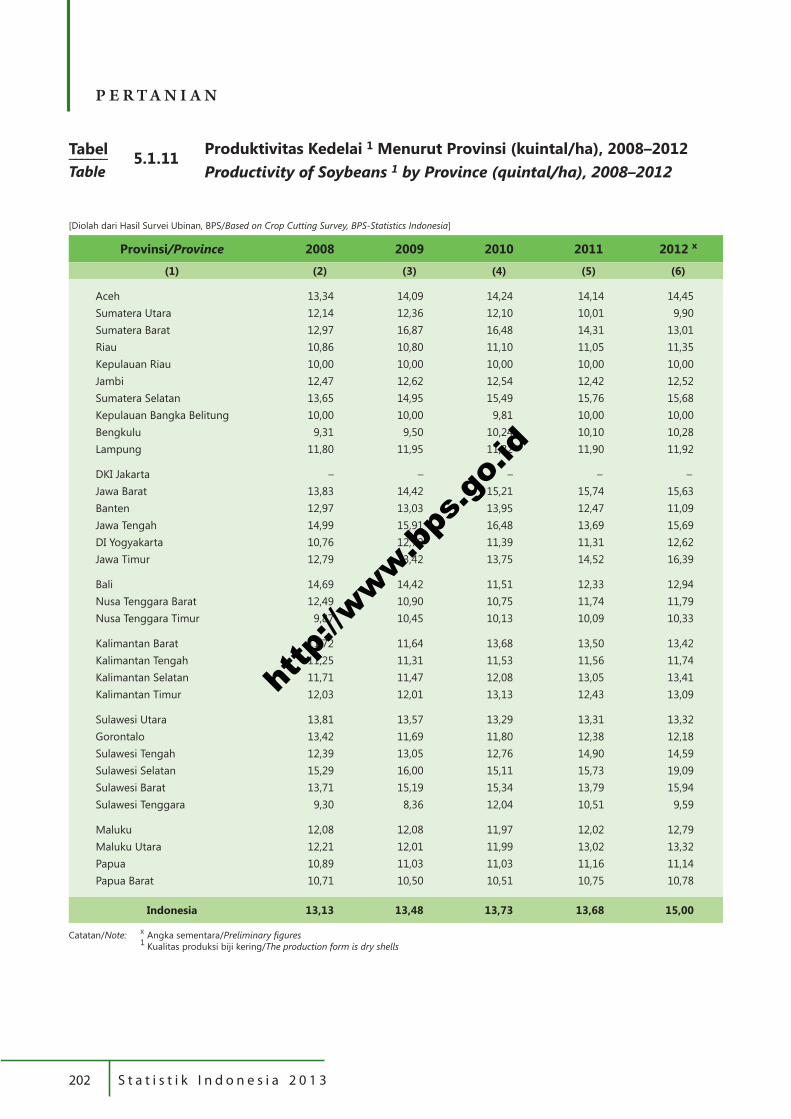
P E R T A N I A N
S t a t i s t i k I n d o n e s i a 2 0 1 3202
Produktivitas Kedelai 1 Menurut Provinsi (kuintal/ha), 2008–2012Productivity of Soybeans 1 by Province (quintal/ha), 2008–2012
Tabel –––––– 5.1.11Table
[Diolah dari Hasil Survei Ubinan, BPS/Based on Crop Cutting Survey, BPS-Statistics Indonesia]
Provinsi/Province 2008 2009 2010 2011 2012 x
(1) (2) (3) (4) (5) (6)
Aceh 13,34 14,09 14,24 14,14 14,45Sumatera Utara 12,14 12,36 12,10 10,01 9,90Sumatera Barat 12,97 16,87 16,48 14,31 13,01Riau 10,86 10,80 11,10 11,05 11,35Kepulauan Riau 10,00 10,00 10,00 10,00 10,00Jambi 12,47 12,62 12,54 12,42 12,52Sumatera Selatan 13,65 14,95 15,49 15,76 15,68Kepulauan Bangka Belitung 10,00 10,00 9,81 10,00 10,00Bengkulu 9,31 9,50 10,24 10,10 10,28Lampung 11,80 11,95 11,82 11,90 11,92
DKI Jakarta – – – – –Jawa Barat 13,83 14,42 15,21 15,74 15,63Banten 12,97 13,03 13,95 12,47 11,09Jawa Tengah 14,99 15,91 16,48 13,69 15,69DI Yogyakarta 10,76 12,72 11,39 11,31 12,62Jawa Timur 12,79 13,42 13,75 14,52 16,39
Bali 14,69 14,42 11,51 12,33 12,94Nusa Tenggara Barat 12,49 10,90 10,75 11,74 11,79Nusa Tenggara Timur 9,87 10,45 10,13 10,09 10,33
Kalimantan Barat 11,72 11,64 13,68 13,50 13,42Kalimantan Tengah 11,25 11,31 11,53 11,56 11,74Kalimantan Selatan 11,71 11,47 12,08 13,05 13,41Kalimantan Timur 12,03 12,01 13,13 12,43 13,09
Sulawesi Utara 13,81 13,57 13,29 13,31 13,32Gorontalo 13,42 11,69 11,80 12,38 12,18Sulawesi Tengah 12,39 13,05 12,76 14,90 14,59Sulawesi Selatan 15,29 16,00 15,11 15,73 19,09Sulawesi Barat 13,71 15,19 15,34 13,79 15,94Sulawesi Tenggara 9,30 8,36 12,04 10,51 9,59
Maluku 12,08 12,08 11,97 12,02 12,79Maluku Utara 12,21 12,01 11,99 13,02 13,32Papua 10,89 11,03 11,03 11,16 11,14Papua Barat 10,71 10,50 10,51 10,75 10,78
Indonesia 13,13 13,48 13,73 13,68 15,00
Catatan/Note: x Angka sementara/Preliminary figures 1 Kualitas produksi biji kering/The production form is dry shells
http
://www.b
ps.g
o.id

A G R I C U L T U R E
S t a t i s t i c a l Y e a r b o o k o f I n d o n e s i a 2 0 1 3 203
Luas Panen Kacang Tanah Menurut Provinsi (ha), 2008–2012Harvested Area of Peanuts by Province (ha), 2008–2012
Tabel –––––– 5.1.12Table
[Diolah dari Hasil Laporan Statistik Pertanian (SP) Tanaman Pangan, BPS/Based on Agriculture Statistic Report of Food Crops, BPS-Statistics Indonesia]
Provinsi/Province 2008 2009 2010 2011 2012 x
(1) (2) (3) (4) (5) (6)
Aceh 5 214 4 707 5 579 4 999 5 681Sumatera Utara 16 626 14 294 14 520 10 773 10 154Sumatera Barat 7 797 7 722 7 280 7 891 6 819Riau 2 412 2 023 2 188 1 819 1 723Kepulauan Riau 102 113 156 155 174Jambi 1 960 1 771 1 468 1 315 1 203Sumatera Selatan 5 757 4 797 4 632 3 046 3 129Kepulauan Bangka Belitung 463 405 360 342 327Bengkulu 4 622 3 499 7 030 6 384 5 403Lampung 10 316 8 667 13 967 10 148 8 420
DKI Jakarta 17 9 9 7 1Jawa Barat 54 103 61 498 67 901 48 641 53 569Banten 12 299 12 971 13 862 10 075 10 727Jawa Tengah 135 270 124 178 119 565 94 662 105 679DI Yogyakarta 64 087 62 539 58 780 59 533 60 725Jawa Timur 170 437 180 557 172 550 164 921 163 513
Bali 12 247 11 902 10 397 9 926 9 572Nusa Tenggara Barat 25 541 28 750 25 044 26 319 25 508Nusa Tenggara Timur 21 894 18 396 16 574 19 395 19 694
Kalimantan Barat 1 779 1 929 1 863 1 428 1 383Kalimantan Tengah 1 282 1 225 924 689 688Kalimantan Selatan 14 161 13 051 12 270 10 073 10 162Kalimantan Timur 2 223 2 294 2 091 1 514 1 478
Sulawesi Utara 6 573 6 450 6 611 6 908 6 293Gorontalo 1 878 1 646 1 873 955 1 003Sulawesi Tengah 5 231 6 207 5 071 6 362 6 136Sulawesi Selatan 30 690 25 785 30 528 15 192 23 351Sulawesi Barat 528 711 1 439 873 741Sulawesi Tenggara 7 781 5 999 6 918 5 887 7 496
Maluku 2 573 2 618 2 454 2 222 1 523Maluku Utara 4 305 2 766 3 682 4 430 4 824Papua 2 796 2 408 2 437 1 979 1 990Papua Barat 958 729 540 596 445
Indonesia 633 922 622 616 620 563 539 459 559 534
Catatan/Note: x Angka sementara/Preliminary figures
http
://www.b
ps.g
o.id

P E R T A N I A N
S t a t i s t i k I n d o n e s i a 2 0 1 3204
Produksi Kacang Tanah 1 Menurut Provinsi (ton), 2008–2012Production of Peanuts 1 by Province (ton), 2008–2012
Tabel –––––– 5.1.13Table
[Diolah dari Hasil Laporan Statistik Pertanian (SP) Tanaman Pangan dan Survei Ubinan, BPS/Based on Statistic Report of Food Crops and Crop Cutting Survey, BPS-Statistics Indonesia]
Provinsi/Province 2008 2009 2010 2011 2012 x
(1) (2) (3) (4) (5) (6)
Aceh 6 322 5 926 7 063 6 172 6 934Sumatera Utara 19 316 16 771 16 449 11 093 12 074Sumatera Barat 10 260 9 207 9 162 11 908 9 597Riau 2 240 2 020 2 007 1 692 1 622Kepulauan Riau 94 104 144 143 164Jambi 2 367 2 184 1 782 1 680 1 535Sumatera Selatan 7 499 6 459 6 109 3 960 4 060Kepulauan Bangka Belitung 422 387 358 339 327Bengkulu 4 585 3 472 7 253 6 444 5 802Lampung 13 088 11 090 17 617 12 911 10 694
DKI Jakarta 17 9 10 7 1Jawa Barat 78 512 89 454 99 058 73 705 76 574Banten 16 319 19 782 20 381 12 246 11 691Jawa Tengah 171 385 162 430 161 222 122 306 143 687DI Yogyakarta 63 240 65 893 58 918 64 084 62 901Jawa Timur 202 345 216 474 207 796 211 416 213 792
Bali 16 592 15 583 11 582 11 212 11 616Nusa Tenggara Barat 32 348 38 615 33 666 37 965 38 890Nusa Tenggara Timur 25 678 22 465 20 069 23 685 21 563
Kalimantan Barat 2 012 2 107 2 125 1 767 1 688Kalimantan Tengah 1 417 1 365 1 032 772 772Kalimantan Selatan 16 476 15 221 14 445 12 181 12 376Kalimantan Timur 2 465 2 547 2 468 1 817 1 808
Sulawesi Utara 8 640 8 493 8 671 9 049 8 247Gorontalo 1 849 1 655 2 261 979 1 126Sulawesi Tengah 8 758 10 225 8 424 10 513 9 473Sulawesi Selatan 36 269 32 331 41 898 24 808 27 402Sulawesi Barat 744 1 001 2 022 1 230 1 000Sulawesi Tenggara 6 938 5 089 4 942 4 540 5 199
Maluku 3 077 3 133 2 950 2 839 1 933Maluku Utara 4 951 3 181 4 235 5 095 5 745Papua 2 851 2 464 2 541 2 105 2 094Papua Barat 978 751 568 626 487
Indonesia 770 054 777 888 779 228 691 289 712 874
Catatan/Note: x Angka sementara/Preliminary figures 1 Kualitas produksi biji kering/The production form is dry shells
http
://www.b
ps.g
o.id

A G R I C U L T U R E
S t a t i s t i c a l Y e a r b o o k o f I n d o n e s i a 2 0 1 3 205
Catatan/Note: x Angka sementara/Preliminary figures 1 Kualitas produksi biji kering/The production form is dry shells
Produktivitas Kacang Tanah 1 Menurut Provinsi (kuintal/ha), 2008–2012Productivity of Peanuts 1 by Province (quintal/ha), 2008–2012
Tabel –––––– 5.1.14Table
[Diolah dari Hasil Survei Ubinan, BPS/Based on Crop Cutting Survey, BPS-Statistics Indonesia]
Provinsi/Province 2008 2009 2010 2011 2012 x
(1) (2) (3) (4) (5) (6)
Aceh 12,13 12,59 12,66 12,35 12,21Sumatera Utara 11,62 11,73 11,33 10,30 11,89Sumatera Barat 13,16 11,92 12,59 15,09 14,07Riau 9,29 9,99 9,17 9,30 9,41Kepulauan Riau 9,22 9,20 9,23 9,23 9,43Jambi 12,08 12,33 12,14 12,78 12,76Sumatera Selatan 13,03 13,46 13,19 13,00 12,98Kepulauan Bangka Belitung 9,11 9,56 9,94 9,91 10,00Bengkulu 9,92 9,92 10,32 10,09 10,74Lampung 12,69 12,80 12,61 12,72 12,70
DKI Jakarta 10,00 10,00 11,11 10,00 10,00Jawa Barat 14,51 14,55 14,59 15,15 14,29Banten 13,27 15,25 14,70 12,15 10,90Jawa Tengah 12,67 13,08 13,48 12,92 13,60DI Yogyakarta 9,87 10,54 10,02 10,76 10,36Jawa Timur 11,87 11,99 12,04 12,82 13,07
Bali 13,55 13,09 11,14 11,30 12,14Nusa Tenggara Barat 12,67 13,43 13,44 14,42 15,25Nusa Tenggara Timur 11,73 12,21 12,11 12,21 10,95
Kalimantan Barat 11,31 10,92 11,41 12,37 12,21Kalimantan Tengah 11,05 11,14 11,17 11,20 11,22Kalimantan Selatan 11,63 11,66 11,77 12,09 12,18Kalimantan Timur 11,09 11,10 11,80 12,00 12,23
Sulawesi Utara 13,14 13,17 13,12 13,10 13,11Gorontalo 9,85 10,05 12,07 10,25 11,23Sulawesi Tengah 16,74 16,47 16,61 16,52 15,44Sulawesi Selatan 11,82 12,54 13,72 16,33 11,73Sulawesi Barat 14,09 14,08 14,05 14,09 13,50Sulawesi Tenggara 8,92 8,48 7,14 7,71 6,94
Maluku 11,96 11,97 12,02 12,78 12,69Maluku Utara 11,50 11,50 11,50 11,50 11,91Papua 10,20 10,23 10,43 10,64 10,52Papua Barat 10,21 10,30 10,52 10,50 10,94
Indonesia 12,15 12,49 12,56 12,81 12,74
http
://www.b
ps.g
o.id

P E R T A N I A N
S t a t i s t i k I n d o n e s i a 2 0 1 3206
Luas Panen Ubi Kayu Menurut Provinsi (ha), 2008–2012 Harvested Area of Cassavas by Province (ha), 2008–2012
Tabel –––––– 5.1.15Table
[Diolah dari Hasil Laporan Statistik Pertanian (SP) Tanaman Pangan, BPS/Based on Agriculture Statistic Report of Food Crops, BPS-Statistics Indonesia]
Provinsi/Province 2008 2009 2010 2011 2012 x
(1) (2) (3) (4) (5) (6)
Aceh 3 093 3 910 3 084 3 085 2 974Sumatera Utara 37 941 38 611 32 402 37 929 38 749Sumatera Barat 5 265 5 020 5 522 5 571 5 502Riau 4 625 4 379 4 237 4 144 3 642Kepulauan Riau 884 868 776 721 697Jambi 2 706 2 881 2 895 2 819 2 744Sumatera Selatan 13 005 10 844 10 184 9 792 8 938Kepulauan Bangka Belitung 1 393 1 635 1 461 886 816Bengkulu 4 231 3 199 3 714 4 047 4 571Lampung 318 969 309 047 346 217 368 096 314 917
DKI Jakarta 39 26 25 15 4Jawa Barat 109 354 110 827 105 023 103 244 100 159Banten 8 271 7 407 8 237 7 374 5 677Jawa Tengah 191 053 190 851 188 080 173 195 176 849DI Yogyakarta 62 543 63 275 62 563 62 414 61 815Jawa Timur 220 394 207 507 188 158 199 407 189 982
Bali 11 599 11 088 10 809 10 683 9 346Nusa Tenggara Barat 5 688 6 514 5 352 5 167 5 979Nusa Tenggara Timur 87 906 89 154 102 460 96 705 89 282
Kalimantan Barat 13 677 11 524 11 913 10 783 10 217Kalimantan Tengah 6 269 6 378 6 488 4 181 3 932Kalimantan Selatan 8 123 8 189 5 189 5 701 5 862Kalimantan Timur 7 532 7 681 6 554 5 214 4 701
Sulawesi Utara 6 388 5 907 6 424 5 371 4 837Gorontalo 771 601 512 474 307Sulawesi Tengah 4 180 4 422 3 872 4 198 4 702Sulawesi Selatan 29 796 26 944 25 010 20 268 31 454Sulawesi Barat 3 902 2 852 2 735 2 881 2 598Sulawesi Tenggara 12 190 12 353 9 556 9 130 9 093
Maluku 8 397 8 815 9 227 7 040 6 167Maluku Utara 9 665 8 806 9 011 9 550 9 407Papua 3 032 3 046 2 988 2 867 3 020Papua Barat 2 052 1 105 2 369 1 744 844
Indonesia 1 204 933 1 175 666 1 183 047 1 184 696 1 119 784
Catatan/Note: x Angka sementara/Preliminary figures
http
://www.b
ps.g
o.id

A G R I C U L T U R E
S t a t i s t i c a l Y e a r b o o k o f I n d o n e s i a 2 0 1 3 207
Produksi Ubi Kayu 1 Menurut Provinsi (ton), 2008–2012 Production of Cassavas 1 by Province (ton), 2008–2012
Tabel –––––– 5.1.16Table
[Diolah dari Hasil Laporan Statistik Pertanian (SP) Tanaman Pangan dan Survei Ubinan, BPS/Based on Statistic Report of Food Crops and Crop Cutting Survey, BPS-Statistics Indonesia]
Provinsi/Province 2008 2009 2010 2011 2012 x
(1) (2) (3) (4) (5) (6)
Aceh 38 403 49 839 43 810 39 384 38 257Sumatera Utara 736 771 1 007 284 905 571 1 091 711 1 171 520Sumatera Barat 102 285 115 492 193 188 191 946 213 647Riau 50 772 68 046 75 904 79 480 88 577Kepulauan Riau 9 364 9 180 8 397 7 805 7 666Jambi 36 905 39 355 39 564 40 462 38 978Sumatera Selatan 197 150 166 890 159 929 159 346 143 415Kepulauan Bangka Belitung 19 722 23 332 21 427 13 276 13 586Bengkulu 49 478 37 311 43 847 47 735 57 618Lampung 7 721 882 7 569 178 8 637 594 9 193 676 8 134 658
DKI Jakarta 454 305 290 176 47Jawa Barat 2 034 854 2 086 187 2 014 402 2 058 785 2 131 123Banten 115 591 105 621 118 979 107 052 82 796Jawa Tengah 3 325 099 3 676 809 3 876 242 3 501 458 3 848 462DI Yogyakarta 892 907 1 047 684 1 114 665 867 596 866 357Jawa Timur 3 533 772 3 222 637 3 667 058 4 032 081 4 246 028
Bali 169 761 171 456 163 746 166 291 147 201Nusa Tenggara Barat 68 386 85 062 70 606 75 367 79 472Nusa Tenggara Timur 928 974 913 053 1 032 538 962 128 891 545
Kalimantan Barat 193 804 166 584 177 807 141 550 153 564Kalimantan Tengah 73 344 74 670 76 669 49 475 46 547Kalimantan Selatan 119 085 121 656 76 202 86 504 90 135Kalimantan Timur 116 218 125 714 110 061 91 858 82 843
Sulawesi Utara 83 656 77 206 84 084 70 147 63 187Gorontalo 9 215 7 117 6 171 5 910 3 776Sulawesi Tengah 70 181 82 294 74 128 83 139 93 642Sulawesi Selatan 504 198 434 862 601 437 370 125 682 995Sulawesi Barat 54 809 47 781 46 368 47 670 47 722Sulawesi Tenggara 217 727 226 927 163 350 164 850 175 719
Maluku 107 214 124 442 144 407 125 763 118 051Maluku Utara 116 838 106 443 109 033 115 940 116 515Papua 35 100 36 500 35 531 34 899 36 679Papua Barat 23 072 12 228 25 113 20 440 9 747
Indonesia 21 756 991 22 039 145 23 918 118 24 044 025 23 922 075
Catatan/Note: x Angka sementara/Preliminary figures 1 Kualitas produksi umbi basah/The production form is fresh roots
http
://www.b
ps.g
o.id

P E R T A N I A N
S t a t i s t i k I n d o n e s i a 2 0 1 3208
Produktivitas Ubi Kayu 1 Menurut Provinsi (kuintal/ha), 2008–2012Productivity of Cassavas 1 by Province (quintal/ha), 2008–2012
Tabel –––––– 5.1.17Table
[Diolah dari Hasil Survei Ubinan, BPS/Based on Crop Cutting Survey, BPS-Statistics Indonesia]
Provinsi/Province 2008 2009 2010 2011 2012 x
(1) (2) (3) (4) (5) (6)
Aceh 124,16 127,47 142,06 127,66 128,64Sumatera Utara 194,19 260,88 279,48 287,83 302,34Sumatera Barat 194,27 230,06 349,85 344,54 388,31Riau 109,78 155,39 179,15 191,80 243,21Kepulauan Riau 105,93 105,76 108,21 108,25 109,99Jambi 136,38 136,60 136,66 143,53 142,05Sumatera Selatan 151,60 153,90 157,04 162,73 160,46Kepulauan Bangka Belitung 141,58 142,70 146,66 149,84 166,50Bengkulu 116,94 116,63 118,06 117,95 126,05Lampung 242,09 244,92 249,48 249,76 258,31
DKI Jakarta 116,41 117,31 116,00 117,33 117,50Jawa Barat 186,08 188,24 191,81 199,41 212,77Banten 139,75 142,60 144,44 145,17 145,84Jawa Tengah 174,04 192,65 206,10 202,17 217,61DI Yogyakarta 142,77 165,58 178,17 139,01 140,15Jawa Timur 160,34 155,30 194,89 202,20 223,50
Bali 146,36 154,63 151,49 155,66 157,50Nusa Tenggara Barat 120,23 130,58 131,92 145,86 132,92Nusa Tenggara Timur 105,68 102,41 100,77 99,49 99,86
Kalimantan Barat 141,70 144,55 149,25 131,27 150,30Kalimantan Tengah 116,99 117,07 118,17 118,33 118,38Kalimantan Selatan 146,60 148,56 146,85 151,73 153,76Kalimantan Timur 154,30 163,67 167,93 176,18 176,22
Sulawesi Utara 130,96 130,70 130,89 130,60 130,63Gorontalo 119,52 118,42 120,53 124,68 123,00Sulawesi Tengah 167,90 186,10 191,45 198,04 199,15Sulawesi Selatan 169,22 161,39 240,48 182,62 217,14Sulawesi Barat 140,46 167,54 169,54 165,46 183,69Sulawesi Tenggara 178,61 183,70 170,94 180,56 193,25
Maluku 127,68 141,17 156,50 178,64 191,42Maluku Utara 120,89 120,88 121,00 121,40 123,86Papua 115,77 119,83 118,91 121,73 121,45Papua Barat 112,44 110,66 106,01 117,20 115,49
Indonesia 180,57 187,46 202,17 202,96 213,63
Catatan/Note: x Angka sementara/Preliminary figures 1 Kualitas produksi umbi basah/The production form is fresh roots
http
://www.b
ps.g
o.id

A G R I C U L T U R E
S t a t i s t i c a l Y e a r b o o k o f I n d o n e s i a 2 0 1 3 209
Luas Panen Ubi Jalar Menurut Provinsi (ha), 2008–2012 Harvested Area of Sweet Potatoes by Province (ha), 2008–2012
Tabel –––––– 5.1.18Table
[Diolah dari Hasil Laporan Statistik Pertanian (SP) Tanaman Pangan, BPS/Based on Agriculture Statistic Report of Food Crops, BPS-Statistics Indonesia]
Provinsi/Province 2008 2009 2010 2011 2012 x
(1) (2) (3) (4) (5) (6)
Aceh 1 325 1 519 1 101 1 137 1 264Sumatera Utara 10 316 12 359 14 874 15 466 14 595Sumatera Barat 4 082 4 153 4 380 4 348 4 372Riau 1 429 1 230 1 252 1 203 1 137Kepulauan Riau 193 185 232 234 246Jambi 2 263 2 129 2 197 3 017 3 076Sumatera Selatan 2 829 2 973 3 268 2 620 2 475Kepulauan Bangka Belitung 578 600 483 393 356Bengkulu 3 217 2 197 2 900 2 734 3 855Lampung 4 953 4 626 4 612 4 848 4 849
DKI Jakarta – – – – –Jawa Barat 27 252 33 387 30 073 27 931 26 531Banten 2 884 2 942 3 403 2 879 2 564Jawa Tengah 8 467 8 767 7 965 8 046 8 000DI Yogyakarta 610 574 599 413 440Jawa Timur 13 750 16 203 14 981 14 177 14 264
Bali 6 424 6 285 5 707 5 982 5 619Nusa Tenggara Barat 953 969 1 123 954 1 100Nusa Tenggara Timur 13 437 12 902 14 963 15 781 18 604
Kalimantan Barat 1 643 1 519 1 876 1 713 1 742Kalimantan Tengah 1 735 1 537 1 350 1 205 1 338Kalimantan Selatan 2 417 2 617 2 257 1 988 1 644Kalimantan Timur 3 114 3 439 2 618 2 239 1 691
Sulawesi Utara 4 277 5 430 5 298 4 736 4 216Gorontalo 412 358 303 260 202Sulawesi Tengah 2 616 2 815 2 462 2 306 2 516Sulawesi Selatan 6 235 5 370 5 058 5 391 6 774Sulawesi Barat 1 442 1 430 1 395 1 805 1 483Sulawesi Tenggara 3 587 3 183 3 028 3 254 3 434
Maluku 2 546 2 612 2 426 1 967 1 975Maluku Utara 4 023 3 492 3 180 3 663 3 836Papua 34 028 35 028 34 670 34 413 33 071Papua Barat 1 524 1 044 1 039 1 018 1 029
Indonesia 174 561 183 874 181 073 178 121 178 298
Catatan/Note: x Angka sementara/Preliminary figures
http
://www.b
ps.g
o.id
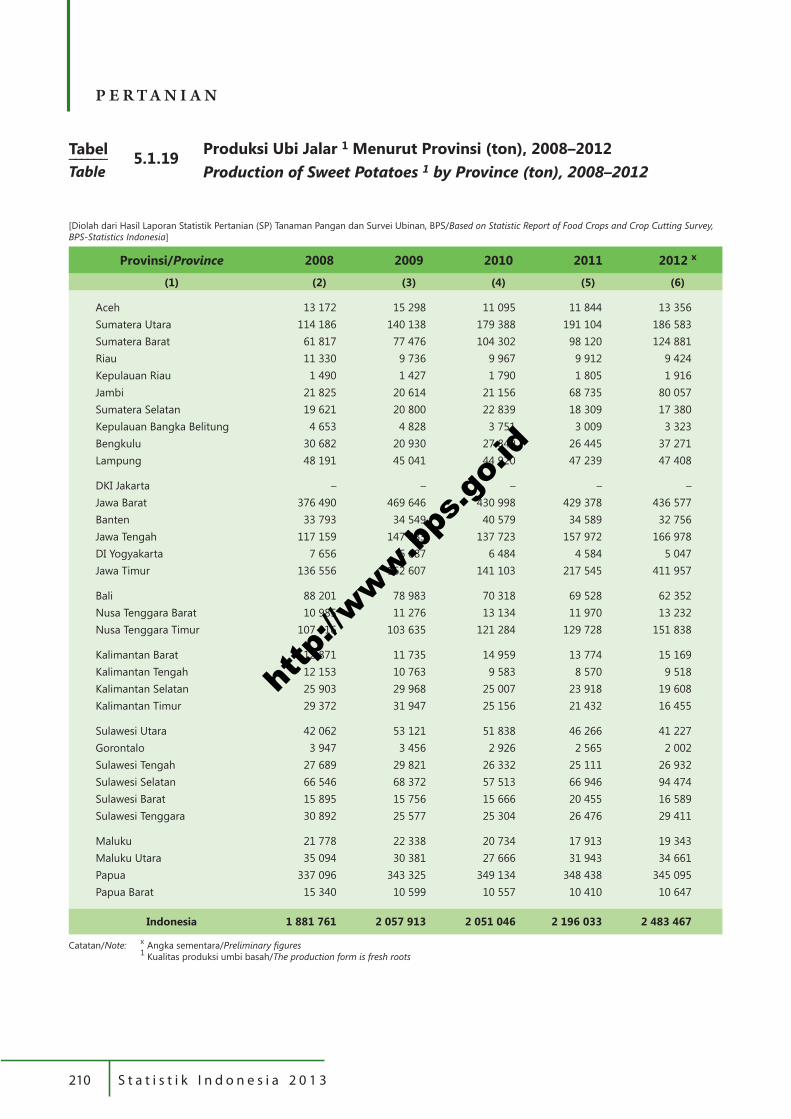
P E R T A N I A N
S t a t i s t i k I n d o n e s i a 2 0 1 3210
Produksi Ubi Jalar 1 Menurut Provinsi (ton), 2008–2012Production of Sweet Potatoes 1 by Province (ton), 2008–2012
Tabel –––––– 5.1.19Table
Catatan/Note: x Angka sementara/Preliminary figures 1 Kualitas produksi umbi basah/The production form is fresh roots
[Diolah dari Hasil Laporan Statistik Pertanian (SP) Tanaman Pangan dan Survei Ubinan, BPS/Based on Statistic Report of Food Crops and Crop Cutting Survey, BPS-Statistics Indonesia]
Provinsi/Province 2008 2009 2010 2011 2012 x
(1) (2) (3) (4) (5) (6)
Aceh 13 172 15 298 11 095 11 844 13 356Sumatera Utara 114 186 140 138 179 388 191 104 186 583Sumatera Barat 61 817 77 476 104 302 98 120 124 881Riau 11 330 9 736 9 967 9 912 9 424Kepulauan Riau 1 490 1 427 1 790 1 805 1 916Jambi 21 825 20 614 21 156 68 735 80 057Sumatera Selatan 19 621 20 800 22 839 18 309 17 380Kepulauan Bangka Belitung 4 653 4 828 3 751 3 009 3 323Bengkulu 30 682 20 930 27 840 26 445 37 271Lampung 48 191 45 041 44 920 47 239 47 408
DKI Jakarta – – – – –Jawa Barat 376 490 469 646 430 998 429 378 436 577Banten 33 793 34 549 40 579 34 589 32 756Jawa Tengah 117 159 147 083 137 723 157 972 166 978DI Yogyakarta 7 656 6 687 6 484 4 584 5 047Jawa Timur 136 556 162 607 141 103 217 545 411 957
Bali 88 201 78 983 70 318 69 528 62 352Nusa Tenggara Barat 10 985 11 276 13 134 11 970 13 232Nusa Tenggara Timur 107 316 103 635 121 284 129 728 151 838
Kalimantan Barat 12 871 11 735 14 959 13 774 15 169Kalimantan Tengah 12 153 10 763 9 583 8 570 9 518Kalimantan Selatan 25 903 29 968 25 007 23 918 19 608Kalimantan Timur 29 372 31 947 25 156 21 432 16 455
Sulawesi Utara 42 062 53 121 51 838 46 266 41 227Gorontalo 3 947 3 456 2 926 2 565 2 002Sulawesi Tengah 27 689 29 821 26 332 25 111 26 932Sulawesi Selatan 66 546 68 372 57 513 66 946 94 474Sulawesi Barat 15 895 15 756 15 666 20 455 16 589Sulawesi Tenggara 30 892 25 577 25 304 26 476 29 411
Maluku 21 778 22 338 20 734 17 913 19 343Maluku Utara 35 094 30 381 27 666 31 943 34 661Papua 337 096 343 325 349 134 348 438 345 095Papua Barat 15 340 10 599 10 557 10 410 10 647
Indonesia 1 881 761 2 057 913 2 051 046 2 196 033 2 483 467
http
://www.b
ps.g
o.id

A G R I C U L T U R E
S t a t i s t i c a l Y e a r b o o k o f I n d o n e s i a 2 0 1 3 211
Produktivitas Ubi Jalar 1 Menurut Provinsi (kuintal/ha), 2008–2012Productivity of Sweet Potatoes 1 by Province (quintal/ha), 2008–2012
Tabel –––––– 5.1.20Table
Catatan/Note: x Angka sementara/Preliminary figures 1 Kualitas produksi umbi basah/The production form is fresh roots
[Diolah dari Hasil Survei Ubinan, BPS/Based on Crop Cutting Survey, BPS–Statistics Indonesia]
Provinsi/Province 2008 2009 2010 2011 2012 x
(1) (2) (3) (4) (5) (6)
Aceh 99,41 100,71 100,77 104,17 105,66Sumatera Utara 110,69 113,39 120,61 123,56 127,84Sumatera Barat 151,44 186,55 238,13 225,67 285,64Riau 79,29 79,15 79,61 82,39 82,88Kepulauan Riau 77,20 77,14 77,16 77,14 77,89Jambi 96,44 96,82 96,29 227,83 260,26Sumatera Selatan 69,36 69,96 69,89 69,88 70,22Kepulauan Bangka Belitung 80,50 80,47 77,66 76,56 93,34Bengkulu 95,38 95,27 96,00 96,73 96,68Lampung 97,30 97,36 97,40 97,44 97,77
DKI Jakarta – – – – –Jawa Barat 138,15 140,67 143,32 153,73 164,55Banten 117,17 117,43 119,24 120,14 127,75Jawa Tengah 138,37 167,77 172,91 196,34 208,72DI Yogyakarta 125,51 116,50 108,25 110,99 114,70Jawa Timur 99,31 100,36 94,19 153,45 288,81
Bali 137,30 125,67 123,21 116,23 110,97Nusa Tenggara Barat 115,27 116,37 116,95 125,47 120,29Nusa Tenggara Timur 79,87 80,32 81,06 82,21 81,62
Kalimantan Barat 78,34 77,25 79,74 80,41 87,08Kalimantan Tengah 70,05 70,03 70,99 71,12 71,14Kalimantan Selatan 107,17 114,51 110,80 120,31 119,27Kalimantan Timur 94,32 92,90 96,09 95,72 97,31
Sulawesi Utara 98,34 97,83 97,84 97,69 97,79Gorontalo 95,80 96,54 96,57 98,65 99,11Sulawesi Tengah 105,84 105,94 106,95 108,89 107,04Sulawesi Selatan 106,73 127,32 113,71 124,18 139,47Sulawesi Barat 110,23 110,18 112,30 113,32 111,86Sulawesi Tenggara 86,12 80,36 83,57 81,36 85,65
Maluku 85,54 85,52 85,47 91,07 97,94Maluku Utara 87,23 87,00 87,00 87,20 90,36Papua 99,06 98,01 100,70 101,25 104,35Papua Barat 100,66 101,52 101,61 102,26 103,47
Indonesia 107,80 111,92 113,27 123,29 139,29
http
://www.b
ps.g
o.id

P E R T A N I A N
S t a t i s t i k I n d o n e s i a 2 0 1 3212
Luas Panen Tanaman Sayuran Menurut Provinsi dan Jenis Tanaman (ha), 2011 dan 2012Harvested Area of Vegetables by Province and Kind of Plant (ha), 2011 and 2012
Tabel –––––– 5.2.1Table
5.2 HORTIKULTURA HORTICULTURE
[Diolah dari Hasil Survei Pertanian Hortikultura SPH–SBS, BPS/Based on Agriculture Survey for Horticulture, BPS–Statistics Indonesia]
ProvinsiProvince
Bawang MerahShallot
CabeChili
KentangPotato
2011 2012 x 2011 2012 x 2011 2012 x
(1) (2) (3) (4) (5) (6) (7)
Aceh 788 808 8 612 8 142 850 474 Sumatera Utara 1 384 1 581 22 608 22 129 7 203 7 479 Sumatera Barat 3 340 3 670 8 083 8 196 1 629 1 829 Riau – 1 3 523 3 488 10 – Kepulauan Riau 1 – 538 708 – – Jambi 803 769 4 560 3 025 4 954 4 599 Sumatera Selatan 8 5 6 927 7 360 87 86 Kepulauan Bangka Belitung – 6 968 907 – – Bengkulu 82 116 5 758 6 957 460 795 Lampung 55 39 8 593 7 959 57 44
DKI Jakarta – – – – – – Jawa Barat 10 009 11 438 24 045 22 909 11 327 13 628 Banten 102 157 1 632 1 288 – – Jawa Tengah 35 711 35 828 36 572 38 895 16 585 16 102 DI Yogyakarta 1 271 1 180 3 287 3 391 2 1 Jawa Timur 20 940 22 200 61 947 63 181 6 563 10 378
Bali 817 766 4 243 4 502 145 152 Nusa Tenggara Barat 9 988 12 333 6 211 5 247 210 337 Nusa Tenggara Timur 917 725 1 459 1 981 41 85
Kalimantan Barat – – 2 572 2 203 – – Kalimantan Tengah – 3 1 529 1 653 – – Kalimantan Selatan 1 – 1 504 1 410 – – Kalimantan Timur 5 11 2 999 3 145 – –
Sulawesi Utara 654 699 2 691 2 824 7 905 6 577 Gorontalo 69 73 2 065 2 406 – – Sulawesi Tengah 1 381 1 716 3 112 2 639 80 14 Sulawesi Selatan 4 633 4 518 7 308 8 234 1 654 1 816 Sulawesi Barat 133 86 1 247 1 273 7 5 Sulawesi Tenggara 98 76 2 003 2 104 – –
Maluku 135 167 594 945 – 29 Maluku Utara 122 129 418 629 – – Papua 143 153 1 373 1 556 35 88 Papua Barat 77 62 789 910 78 –
Indonesia 93 667 99 315 239 770 242 196 59 882 64 518
http
://www.b
ps.g
o.id
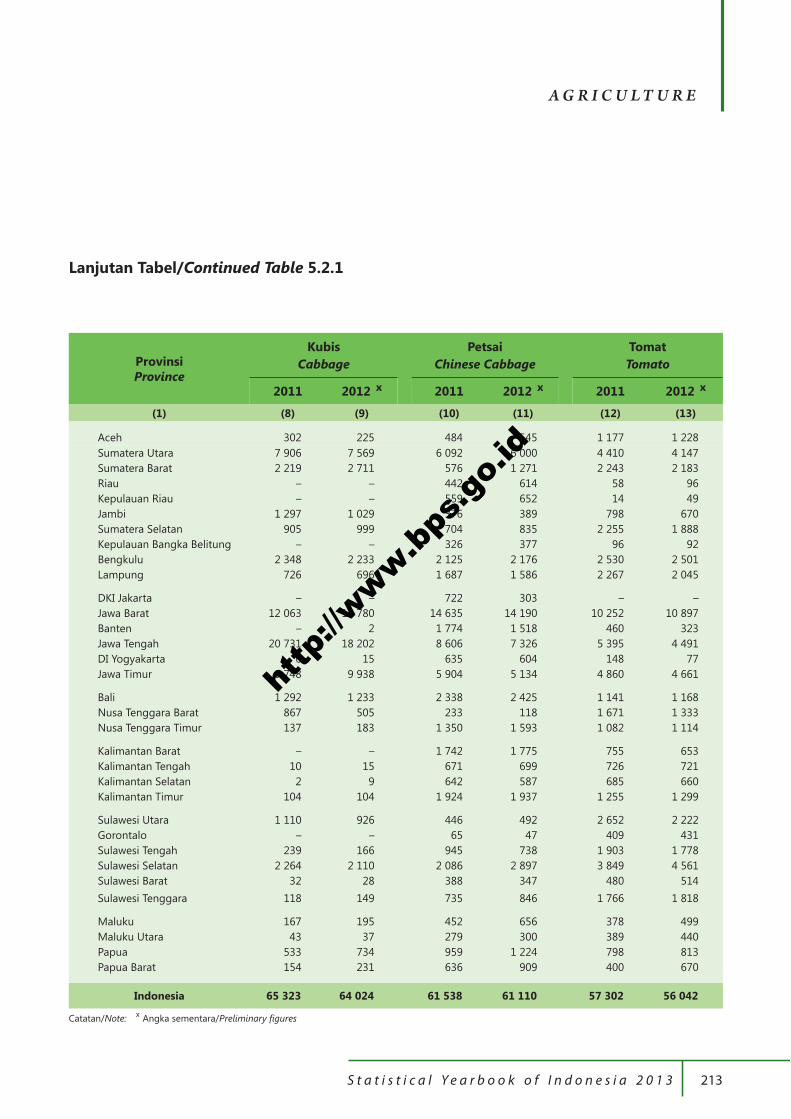
A G R I C U L T U R E
S t a t i s t i c a l Y e a r b o o k o f I n d o n e s i a 2 0 1 3 213
Lanjutan Tabel/Continued Table 5.2.1
ProvinsiProvince
KubisCabbage
PetsaiChinese Cabbage
TomatTomato
2011 2012 x 2011 2012 x 2011 2012 x
(1) (8) (9) (10) (11) (12) (13)
Aceh 302 225 484 545 1 177 1 228 Sumatera Utara 7 906 7 569 6 092 6 000 4 410 4 147 Sumatera Barat 2 219 2 711 576 1 271 2 243 2 183 Riau – – 442 614 58 96 Kepulauan Riau – – 559 652 14 49 Jambi 1 297 1 029 376 389 798 670 Sumatera Selatan 905 999 704 835 2 255 1 888 Kepulauan Bangka Belitung – – 326 377 96 92 Bengkulu 2 348 2 233 2 125 2 176 2 530 2 501 Lampung 726 696 1 687 1 586 2 267 2 045
DKI Jakarta – – 722 303 – – Jawa Barat 12 063 13 780 14 635 14 190 10 252 10 897 Banten – 2 1 774 1 518 460 323 Jawa Tengah 20 731 18 202 8 606 7 326 5 395 4 491 DI Yogyakarta 6 15 635 604 148 77 Jawa Timur 9 748 9 938 5 904 5 134 4 860 4 661
Bali 1 292 1 233 2 338 2 425 1 141 1 168 Nusa Tenggara Barat 867 505 233 118 1 671 1 333 Nusa Tenggara Timur 137 183 1 350 1 593 1 082 1 114
Kalimantan Barat – – 1 742 1 775 755 653 Kalimantan Tengah 10 15 671 699 726 721 Kalimantan Selatan 2 9 642 587 685 660 Kalimantan Timur 104 104 1 924 1 937 1 255 1 299
Sulawesi Utara 1 110 926 446 492 2 652 2 222 Gorontalo – – 65 47 409 431 Sulawesi Tengah 239 166 945 738 1 903 1 778 Sulawesi Selatan 2 264 2 110 2 086 2 897 3 849 4 561 Sulawesi Barat 32 28 388 347 480 514 Sulawesi Tenggara 118 149 735 846 1 766 1 818
Maluku 167 195 452 656 378 499 Maluku Utara 43 37 279 300 389 440 Papua 533 734 959 1 224 798 813 Papua Barat 154 231 636 909 400 670
Indonesia 65 323 64 024 61 538 61 110 57 302 56 042
Catatan/Note: x Angka sementara/Preliminary figures
http
://www.b
ps.g
o.id

P E R T A N I A N
S t a t i s t i k I n d o n e s i a 2 0 1 3214
Produksi Tanaman Sayuran Menurut Provinsi dan Jenis Tanaman (ton), 2011 dan 2012Production of Vegetables by Province and Kind of Plant (ton), 2011 and 2012
[Diolah dari Hasil Survei Pertanian Hortikultura SPH– SBS, BPS/Based on Agriculture Survey for Horticulture, BPS– Statistics Indonesia]
ProvinsiProvince
Bawang MerahShallot
CabeChili
KentangPotato
2011 2012 x 2011 2012 x 2011 2012 x
(1) (2) (3) (4) (5) (6) (7)
Aceh 2 600 4 385 49 525 90 752 8 617 6 922 Sumatera Utara 12 449 14 156 233 258 245 770 123 078 128 965 Sumatera Barat 32 442 35 838 58 981 65 104 29 530 31 300 Riau – 6 15 833 15 905 3 – Kepulauan Riau 1 – 2 395 3 337 – – Jambi 7 994 6 850 28 790 14 902 89 102 85 535 Sumatera Selatan 37 18 18 638 23 196 1 090 1 704 Kepulauan Bangka Belitung – 21 6 811 6 073 – – Bengkulu 506 696 41 495 41 617 6 469 12 611 Lampung 705 315 62 739 54 545 763 561
DKI Jakarta – – – – – – Jawa Barat 101 273 115 896 300 620 293 273 220 155 261 967 Banten 421 1 126 6 418 7 415 – – Jawa Tengah 372 256 381 813 184 358 215 124 250 404 252 607 DI Yogyakarta 14 407 11 855 16 575 18 776 30 8 Jawa Timur 198 388 221 169 255 483 343 478 85 521 161 850
Bali 9 319 8 666 31 503 29 825 2 384 2 665 Nusa Tenggara Barat 78 300 100 989 26 128 36 882 3 755 6 526 Nusa Tenggara Timur 2 436 2 061 6 312 6 909 162 322
Kalimantan Barat – – 9 456 7 575 – – Kalimantan Tengah – 1 4 097 3 615 – – Kalimantan Selatan 7 – 9 197 7 681 – – Kalimantan Timur 15 75 12 698 13 070 – –
Sulawesi Utara 5 005 4 857 10 077 10 065 114 548 91 252 Gorontalo 172 164 11 082 11 418 – – Sulawesi Tengah 10 824 5 726 19 819 13 118 1 173 144 Sulawesi Selatan 41 710 41 238 37 278 43 253 18 420 23 444 Sulawesi Barat 280 383 4 363 3 900 2 7 Sulawesi Tenggara 121 200 4 764 8 466 – –
Maluku 484 383 2 918 3 209 – 6 Maluku Utara 185 144 1 077 1 100 – – Papua 680 854 7 664 8 740 112 404 Papua Barat 107 189 2 727 2 740 170 –
Indonesia 893 124 960 074 1 483 079 1 650 833 955 488 1 068 800
Tabel –––––– 5.2.2Table
http
://www.b
ps.g
o.id
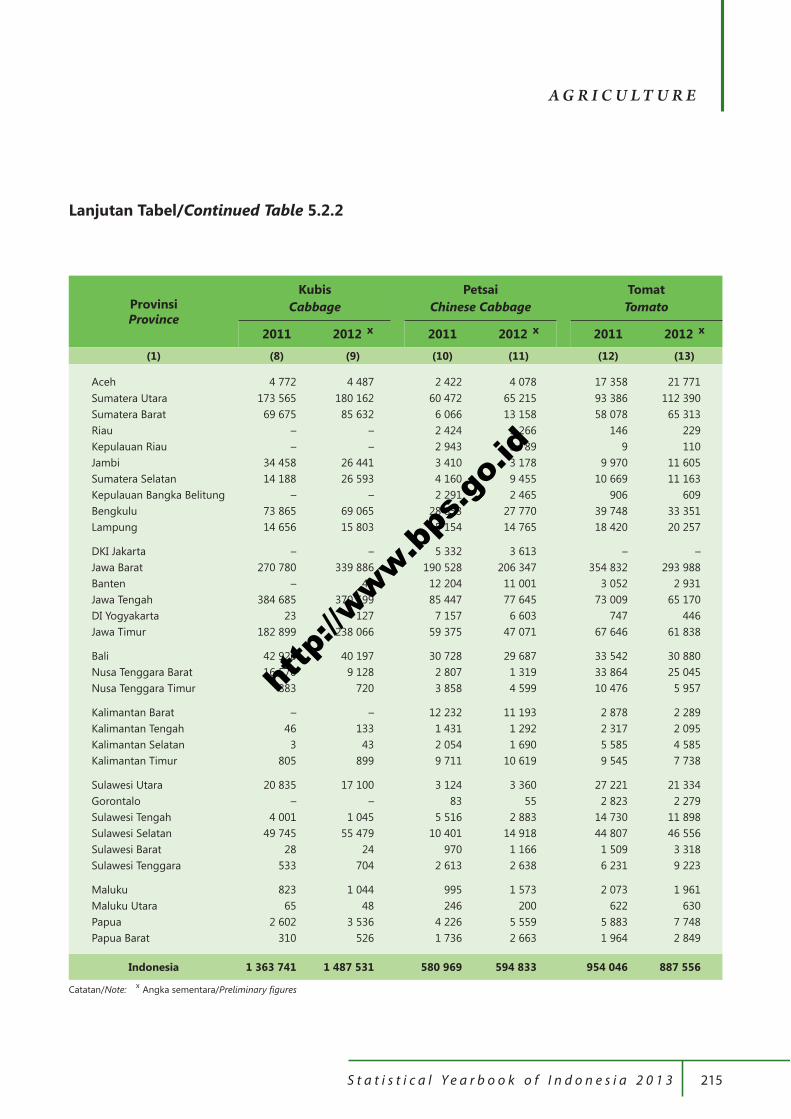
A G R I C U L T U R E
S t a t i s t i c a l Y e a r b o o k o f I n d o n e s i a 2 0 1 3 215
Lanjutan Tabel/Continued Table 5.2.2
ProvinsiProvince
KubisCabbage
PetsaiChinese Cabbage
TomatTomato
2011 2012 x 2011 2012 x 2011 2012 x
(1) (8) (9) (10) (11) (12) (13)
Aceh 4 772 4 487 2 422 4 078 17 358 21 771 Sumatera Utara 173 565 180 162 60 472 65 215 93 386 112 390 Sumatera Barat 69 675 85 632 6 066 13 158 58 078 65 313 Riau – – 2 424 3 266 146 229 Kepulauan Riau – – 2 943 3 789 9 110 Jambi 34 458 26 441 3 410 3 178 9 970 11 605 Sumatera Selatan 14 188 26 593 4 160 9 455 10 669 11 163 Kepulauan Bangka Belitung – – 2 291 2 465 906 609 Bengkulu 73 865 69 065 28 853 27 770 39 748 33 351 Lampung 14 656 15 803 15 154 14 765 18 420 20 257
DKI Jakarta – – 5 332 3 613 – – Jawa Barat 270 780 339 886 190 528 206 347 354 832 293 988 Banten – 44 12 204 11 001 3 052 2 931 Jawa Tengah 384 685 370 599 85 447 77 645 73 009 65 170 DI Yogyakarta 23 127 7 157 6 603 747 446 Jawa Timur 182 899 238 066 59 375 47 071 67 646 61 838
Bali 42 926 40 197 30 728 29 687 33 542 30 880 Nusa Tenggara Barat 16 570 9 128 2 807 1 319 33 864 25 045 Nusa Tenggara Timur 883 720 3 858 4 599 10 476 5 957
Kalimantan Barat – – 12 232 11 193 2 878 2 289 Kalimantan Tengah 46 133 1 431 1 292 2 317 2 095 Kalimantan Selatan 3 43 2 054 1 690 5 585 4 585 Kalimantan Timur 805 899 9 711 10 619 9 545 7 738
Sulawesi Utara 20 835 17 100 3 124 3 360 27 221 21 334 Gorontalo – – 83 55 2 823 2 279 Sulawesi Tengah 4 001 1 045 5 516 2 883 14 730 11 898 Sulawesi Selatan 49 745 55 479 10 401 14 918 44 807 46 556 Sulawesi Barat 28 24 970 1 166 1 509 3 318 Sulawesi Tenggara 533 704 2 613 2 638 6 231 9 223
Maluku 823 1 044 995 1 573 2 073 1 961 Maluku Utara 65 48 246 200 622 630 Papua 2 602 3 536 4 226 5 559 5 883 7 748 Papua Barat 310 526 1 736 2 663 1 964 2 849
Indonesia 1 363 741 1 487 531 580 969 594 833 954 046 887 556
Catatan/Note: x Angka sementara/Preliminary figures
http
://www.b
ps.g
o.id

P E R T A N I A N
S t a t i s t i k I n d o n e s i a 2 0 1 3216
Luas Panen Tanaman Sayuran dan Buah-Buahan Semusim Menurut Jenis Tanaman (ha), 2009–2012 Harvested Area of Seasonal Vegetables and Fruits by Kind of Plant (ha), 2009–2012
[Diolah dari Hasil Survei Pertanian Hortikultura SPH-SBS, BPS/Based on Agriculture Survey for Horticulture, BPS-Statistics Indonesia]
Jenis TanamanKind of Plants 2009 2010 2011 2012 x
(1) (2) (3) (4) (5)
Sayuran/Vegetables:
Bawang Merah/Shallot 104 009 109 634 93 667 99 315Bawang Putih/Garlic 2 293 1 816 1 828 2 619Bawang Daun/Welch Onion 53 637 57 593 55 611 57 320Kentang/Potato 71 238 66 531 59 882 64 518Kubis/Cabbage 67 793 67 531 65 323 64 024Kembang Kol/Cauliflower 8 088 8 728 9 441 11 797Petsai/Chinese Cabbage 56 414 59 450 61 538 61 110Wortel/Carrot 24 095 27 149 33 228 29 376Lobak/Radish 1 897 2 083 1 813 2 272Kacang Merah/Red/Bean 22 659 22 251 17 684 19 779Kacang Panjang/Yarldlong Bean 83 796 85 828 79 623 75 817Cabe Besar/Chili 117 178 122 755 121 063 120 094Cabe Rawit/Chili 116 726 114 350 118 707 122 102Cabe/Chili 233 904 237 105 239 770 242 196Jamur/Mushroom 700 684 497 575Tomat/Tomato 55 881 61 154 57 302 56 042Terung/Egg Plant 48 126 52 157 52 233 50 431Buncis/Green Bean 30 695 36 483 32 063 30 928Ketimun/Cucumber 56 099 56 921 53 596 51 457Labu Siam/Chajote 11 523 10 693 9 669 10 860Kangkung/Kangkong 48 944 55 164 55 704 53 350Bayam/Spinach 44 975 48 844 46 882 46 024
Buah-buahan/Fruits:
Melon/Melon 4 859 5 372 6 343 7 111Semangka/Watermelon 34 219 27 493 33 445 33 015Blewah/Cantalaupe 5 784 3 222 5 123 4 361
Tabel –––––– 5.2.3Table
Catatan/Note: x Angka sementara/Preliminary figures
http
://www.b
ps.g
o.id
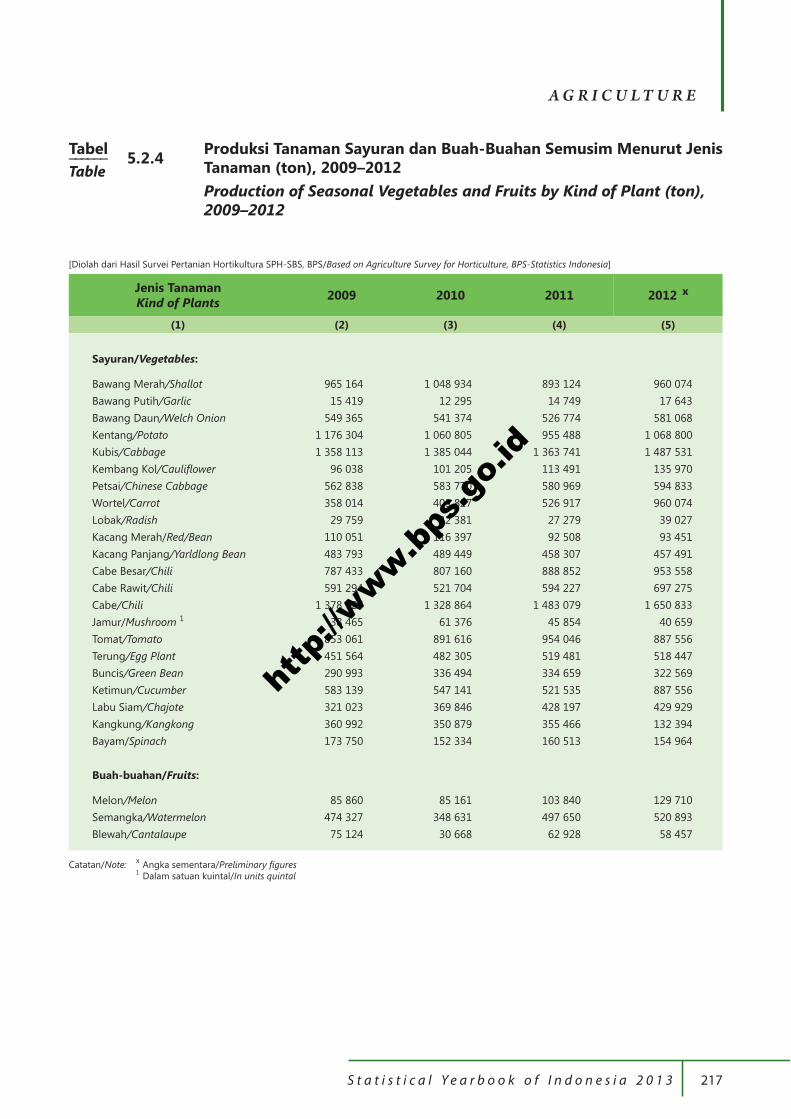
A G R I C U L T U R E
S t a t i s t i c a l Y e a r b o o k o f I n d o n e s i a 2 0 1 3 217
Produksi Tanaman Sayuran dan Buah-Buahan Semusim Menurut Jenis Tanaman (ton), 2009–2012Production of Seasonal Vegetables and Fruits by Kind of Plant (ton), 2009–2012
[Diolah dari Hasil Survei Pertanian Hortikultura SPH-SBS, BPS/Based on Agriculture Survey for Horticulture, BPS-Statistics Indonesia]
Jenis TanamanKind of Plants 2009 2010 2011 2012 x
(1) (2) (3) (4) (5)
Sayuran/Vegetables:
Bawang Merah/Shallot 965 164 1 048 934 893 124 960 074Bawang Putih/Garlic 15 419 12 295 14 749 17 643Bawang Daun/Welch Onion 549 365 541 374 526 774 581 068Kentang/Potato 1 176 304 1 060 805 955 488 1 068 800Kubis/Cabbage 1 358 113 1 385 044 1 363 741 1 487 531Kembang Kol/Cauliflower 96 038 101 205 113 491 135 970Petsai/Chinese Cabbage 562 838 583 770 580 969 594 833Wortel/Carrot 358 014 403 827 526 917 960 074Lobak/Radish 29 759 32 381 27 279 39 027Kacang Merah/Red/Bean 110 051 116 397 92 508 93 451Kacang Panjang/Yarldlong Bean 483 793 489 449 458 307 457 491Cabe Besar/Chili 787 433 807 160 888 852 953 558Cabe Rawit/Chili 591 294 521 704 594 227 697 275Cabe/Chili 1 378 727 1 328 864 1 483 079 1 650 833Jamur/Mushroom 1 38 465 61 376 45 854 40 659Tomat/Tomato 853 061 891 616 954 046 887 556Terung/Egg Plant 451 564 482 305 519 481 518 447Buncis/Green Bean 290 993 336 494 334 659 322 569Ketimun/Cucumber 583 139 547 141 521 535 887 556Labu Siam/Chajote 321 023 369 846 428 197 429 929Kangkung/Kangkong 360 992 350 879 355 466 132 394Bayam/Spinach 173 750 152 334 160 513 154 964
Buah-buahan/Fruits:
Melon/Melon 85 860 85 161 103 840 129 710Semangka/Watermelon 474 327 348 631 497 650 520 893Blewah/Cantalaupe 75 124 30 668 62 928 58 457
Tabel –––––– 5.2.4Table
Catatan/Note: x Angka sementara/Preliminary figures 1 Dalam satuan kuintal/In units quintal
http
://www.b
ps.g
o.id

P E R T A N I A N
S t a t i s t i k I n d o n e s i a 2 0 1 3218
Luas Panen Tanaman Biofarmaka Menurut Provinsi dan Jenis Tanaman (m2), 2011 dan 2012Harvested Area of Medicinal Plants by Province and Kind of Plant (m2), 2011 and 2012
[Diolah dari Hasil Survei Pertanian Hortikultura SPH–TBF, BPS/Based on Agriculture Survey for Horticulture, BPS–Statistics Indonesia]
ProvinsiProvince
JaheGinger
Laos/LengkuasGalanga
2011 2012 x 2011 2012 x
(1) (2) (3) (4) (5)
Aceh 302 234 2 053 637 808 226 148 105 Sumatera Utara 2 017 834 3 322 564 397 029 240 353 Sumatera Barat 636 805 626 586 396 499 306 662 Riau 487 297 220 353 244 577 136 031 Kepulauan Riau 34 994 20 851 34 811 55 820 Jambi 276 761 375 010 152 354 154 109 Sumatera Selatan 451 456 446 406 349 682 376 377 Kepulauan Bangka Belitung 173 353 142 330 202 419 179 000 Bengkulu 1 362 647 1 326 330 466 110 540 706 Lampung 1 746 741 1 168 486 614 916 546 471
DKI Jakarta 12 866 15 719 4 799 6 829 Jawa Barat 8 862 350 10 110 238 3 829 225 5 206 361 Banten 1 052 988 730 375 1 118 530 1 544 410 Jawa Tengah 15 133 913 13 287 884 4 374 713 4 268 298 DI Yogyakarta 1 079 740 1 187 000 1 255 580 1 218 253 Jawa Timur 11 331 178 11 391 420 3 163 864 3 321 506
Bali 400 385 399 363 60 815 98 787 Nusa Tenggara Barat 77 110 75 661 110 374 95 429 Nusa Tenggara Timur 1 328 715 1 254 298 124 527 338 582
Kalimantan Barat 1 473 515 868 587 430 644 216 619 Kalimantan Tengah 159 956 170 386 113 489 114 376 Kalimantan Selatan 4 204 715 3 358 943 47 487 22 451 Kalimantan Timur 340 274 508 227 149 121 221 556
Sulawesi Utara 268 320 570 699 70 649 99 282 Gorontalo 69 915 33 401 1 342 1 363 Sulawesi Tengah 293 556 155 090 110 595 69 891 Sulawesi Selatan 951 966 1 669 473 2 017 217 453 057 Sulawesi Barat 20 374 92 337 18 409 46 903 Sulawesi Tenggara 157 713 838 995 110 969 90 300
Maluku 50 636 61 773 66 880 105 786 Maluku Utara 122 147 – 87 972 – Papua 19 876 31 547 36 113 42 928 Papua Barat 6 881 3 567 10 580 4 469
Indonesia 54 909 211 56 517 536 20 980 517 20 271 070
Tabel –––––– 5.2.5Table
http
://www.b
ps.g
o.id

A G R I C U L T U R E
S t a t i s t i c a l Y e a r b o o k o f I n d o n e s i a 2 0 1 3 219
Lanjutan Tabel/Continued Table 5.2.5
ProvinsiProvince
KencurEast Indian Galangal
KunyitTurmeric
2011 2012 x 2011 2012 x
(1) (6) (7) (8) (9)
Aceh 14 813 8 512 1 188 634 1 147 711 Sumatera Utara 234 079 147 067 1 483 487 1 401 466 Sumatera Barat 61 770 74 546 383 347 385 592 Riau 162 679 130 465 278 437 179 877 Kepulauan Riau 7 828 14 981 17 123 20 992 Jambi 79 444 87 746 175 086 182 522 Sumatera Selatan 385 171 658 951 348 863 507 806 Kepulauan Bangka Belitung 101 970 95 786 224 126 177 464 Bengkulu 421 383 743 541 1 734 036 888 534 Lampung 1 254 215 2 583 670 697 606 617 137
DKI Jakarta 1 986 1 109 6 515 10 490 Jawa Barat 5 206 104 5 762 574 4 128 417 7 340 835 Banten 590 957 1 546 739 656 000 3 044 911 Jawa Tengah 7 300 492 5 515 296 10 230 591 9 150 305 DI Yogyakarta 808 535 885 077 1 864 038 1 916 705 Jawa Timur 2 507 333 2 403 410 11 147 204 16 042 803
Bali 480 811 480 991 249 747 208 985 Nusa Tenggara Barat 12 045 8 488 414 487 425 960 Nusa Tenggara Timur 145 710 109 482 780 299 899 732
Kalimantan Barat 447 196 193 865 636 924 337 085 Kalimantan Tengah 86 070 86 079 135 873 132 677 Kalimantan Selatan 750 521 652 275 1 499 832 839 188 Kalimantan Timur 72 314 104 375 139 427 170 431
Sulawesi Utara 10 624 30 106 74 033 344 435 Gorontalo 272 541 54 706 66 806 Sulawesi Tengah 38 923 45 058 139 068 65 622 Sulawesi Selatan 22 670 30 231 532 525 465 912 Sulawesi Barat 4 134 18 659 37 359 84 147 Sulawesi Tenggara 51 765 34 131 128 390 85 723
Maluku 2 652 10 607 42 169 54 827 Maluku Utara 25 163 – 77 840 – Papua 7 013 12 654 22 556 19 500 Papua Barat 4 299 1 757 8 959 4 990
Indonesia 21 300 941 22 478 769 39 537 704 47 221 170
Catatan/Note: x Angka sementara/Preliminary figures
http
://www.b
ps.g
o.id

P E R T A N I A N
S t a t i s t i k I n d o n e s i a 2 0 1 3220
Produksi Tanaman Biofarmaka Menurut Provinsi dan Jenis Tanaman (kg), 2011 dan 2012Production of Medicinal Plants by Province and Kind of Plant (kg), 2011 and 2012
[Diolah dari Hasil Survei Pertanian Hortikultura SPH-TBF, BPS/Based on Agriculture Survey for Horticulture, BPS-Statistics Indonesia]
ProvinsiProvince
JaheGinger
Laos/LengkuasGalanga
2011 2012 x 2011 2012 x
(1) (2) (3) (4) (5)
Aceh 609 654 7 175 552 631 606 517 125 Sumatera Utara 5 037 719 8 742 173 1 325 594 1 015 424 Sumatera Barat 2 171 861 2 669 562 1 735 937 1 593 440 Riau 773 514 479 709 671 172 404 963 Kepulauan Riau 84 786 34 110 89 815 80 940 Jambi 901 303 903 344 658 940 492 965 Sumatera Selatan 869 600 1 052 494 1 149 427 1 373 425 Kepulauan Bangka Belitung 475 672 674 102 677 288 809 751 Bengkulu 3 159 919 3 173 761 1 500 886 1 833 090 Lampung 4 665 670 1 962 681 2 344 487 2 141 960
DKI Jakarta 24 225 25 469 7 771 27 541 Jawa Barat 19 725 058 18 697 902 10 621 979 9 915 085 Banten 1 108 693 1 226 879 3 355 400 3 268 628 Jawa Tengah 20 639 107 26 174 641 10 946 153 14 231 059 DI Yogyakarta 2 021 218 2 260 754 3 065 778 2 950 323 Jawa Timur 14 564 262 17 456 590 6 788 820 7 818 648
Bali 896 974 399 865 236 988 400 278 Nusa Tenggara Barat 256 829 230 797 450 489 524 313 Nusa Tenggara Timur 2 967 882 2 475 094 1 509 229 1 626 793
Kalimantan Barat 2 712 087 2 210 477 1 814 375 952 051 Kalimantan Tengah 336 524 469 005 301 643 488 848 Kalimantan Selatan 5 258 933 4 759 398 117 588 73 428 Kalimantan Timur 1 186 537 4 072 724 1 015 081 1 063 888
Sulawesi Utara 851 200 1 208 007 220 105 252 465 Gorontalo 173 750 67 147 4 048 3 627 Sulawesi Tengah 793 872 447 058 393 779 247 558 Sulawesi Selatan 1 531 043 3 870 240 5 005 891 3 133 826 Sulawesi Barat 63 416 159 527 84 114 83 873 Sulawesi Tenggara 255 558 572 741 193 610 161 779
Maluku 138 913 50 710 211 939 90 466 Maluku Utara 390 626 – 405 920 – Papua 84 452 126 697 149 468 189 991 Papua Barat 12 282 22 017 16 164 29 549
Indonesia 94 743 139 113 851 227 57 701 484 57 797 100
Tabel –––––– 5.2.6Table
http
://www.b
ps.g
o.id

A G R I C U L T U R E
S t a t i s t i c a l Y e a r b o o k o f I n d o n e s i a 2 0 1 3 221
Lanjutan Tabel/Continued Table 5.2.6
ProvinsiProvince
KencurEast Indian Galangal
KunyitTurmeric
2011 2012 x 2011 2012 x
(1) (6) (7) (8) (9)
Aceh 20 918 30 617 2 771 123 3 915 584 Sumatera Utara 459 005 267 084 4 485 369 4 845 478 Sumatera Barat 176 899 176 899 1 040 649 1 430 250 Riau 276 021 232 763 476 709 362 939 Kepulauan Riau 15 971 22 381 30 977 36 615 Jambi 245 939 155 091 588 012 453 475 Sumatera Selatan 1 343 692 3 037 236 942 895 1 435 723 Kepulauan Bangka Belitung 289 602 361 246 499 513 586 437 Bengkulu 681 578 1 093 658 2 871 761 2 250 831 Lampung 4 014 134 2 224 070 2 184 097 1 619 250
DKI Jakarta 3 658 6 287 13 532 21 876 Jawa Barat 8 793 872 9 026 742 9 488 801 19 702 597 Banten 1 185 462 1 747 016 814 230 2 723 800 Jawa Tengah 8 397 116 11 683 983 18 928 493 20 362 434 DI Yogyakarta 1 509 501 1 653 552 4 220 136 4 461 932 Jawa Timur 2 814 569 3 459 367 22 943 433 21 933 015
Bali 432 791 389 686 647 686 658 292 Nusa Tenggara Barat 22 551 29 471 1 928 309 2 056 569 Nusa Tenggara Timur 229 120 177 857 2 451 228 2 501 173
Kalimantan Barat 1 581 957 630 250 2 271 909 1 167 748 Kalimantan Tengah 144 172 208 272 303 345 370 667 Kalimantan Selatan 796 386 643 774 1 618 181 899 435 Kalimantan Timur 232 042 257 010 487 519 642 992
Sulawesi Utara 15 289 35 104 192 140 732 467 Gorontalo 777 943 155 564 110 564 Sulawesi Tengah 123 566 109 603 459 091 235 744 Sulawesi Selatan 46 545 53 306 1 268 818 1 277 159 Sulawesi Barat 14 742 32 587 114 442 124 255 Sulawesi Tenggara 55 799 46 243 206 113 166 430
Maluku 7 754 8 006 143 990 69 309 Maluku Utara 59 856 – 172 694 – Papua 20 677 36 282 62 689 146 946 Papua Barat 4 889 3 239 20 018 23 576
Indonesia 34 016 850 37 839 625 84 803 466 97 325 562
Catatan/Note: x Angka sementara/Preliminary figures
http
://www.b
ps.g
o.id

P E R T A N I A N
S t a t i s t i k I n d o n e s i a 2 0 1 3222
Luas Panen Tanaman Biofarmaka Menurut Jenis Tanaman (m2), 2009–2012Harvested Area of Medicinal Plants by Kind of Plant (m2), 2009–2012
[Diolah dari Hasil Survei Pertanian Hortikultura SPH-TBF, BPS/Based on Agriculture Survey for Horticulture, BPS-Statistics Indonesia]
Jenis TanamanKind of Plants 2009 2010 2011 2012 x
(1) (2) (3) (4) (5)
Jahe/Ginger 68 654 046 60 534 991 54 909 211 56 517 536
Laos/Lengkuas/Galanga 23 847 358 20 617 986 20 980 517 20 271 070
Kencur/East Indian Galangal 25 617 301 19 232 965 21 300 941 22 478 769
Kunyit/Tumeric 54 544 926 45 580 703 39 537 704 47 221 170
Lempuyang/Zingiber Aromaticum 5 453 103 4 110 304 4 187 701 4 149 327
Temulawak/Java Tumeric 20 977 327 13 728 602 13 079 465 18 198 625
Temuireng/Black Tumeric 3 991 054 3 761 182 2 854 817 3 603 476
Temukunci/Chinese Keys 2 488 178 2 738 457 2 277 787 2 472 654
Dringo/Sweet Root/Calamus 355 684 339 176 341 751 300 037
Kapulaga/Java Cardamon 3 506 599 5 412 881 6 604 423 13 586 989
Mengkudu/Indian Mulberry 1 699 332 782 899 2 488 634 365 286
Kejibeling/Verbenaceae 339 984 361 214 318 929 351 973
Sambiloto/King of Bitter 1 729 218 1 665 945 1 360 761 827 500
Tabel –––––– 5.2.7Table
Catatan/Note: x Angka sementara/Preliminary figures 1 Satuan luas panen dalam pohon/The unit of harvested area are tree
http
://www.b
ps.g
o.id

A G R I C U L T U R E
S t a t i s t i c a l Y e a r b o o k o f I n d o n e s i a 2 0 1 3 223
Produksi Tanaman Biofarmaka Menurut Jenis Tanaman (kg), 2009–2012Production of Medicinal Plants by Kind of Plant (kg), 2009–2012
[Diolah dari Hasil Survei Pertanian Hortikultura SPH-TBF, BPS/Based on Agriculture Survey for Horticulture, BPS-Statistics Indonesia]
Jenis TanamanKind of Plants 2009 2010 2011 2012 x
(1) (2) (3) (4) (5)
Jahe/Ginger 122 181 084 107 734 608 94 743 139 113 851 227
Laos/Lengkuas/Galanga 59 332 313 58 961 844 57 701 484 57 797 100
Kencur/East Indian Galangal 43 635 311 29 638 127 34 016 850 37 839 625
Kunyit/Tumeric 124 047 450 107 375 347 84 803 466 97 325 562
Lempuyang/Zingiber Aromaticum 8 804 375 8 520 161 8 717 497 7 307 325
Temulawak/Java Tumeric 36 826 340 26 671 149 24 105 870 44 116 946
Temuireng/Black Tumeric 7 584 022 7 140 926 7 920 573 6 187 247
Temukunci/Chinese Keys 4 701 570 4 358 236 3 951 932 4 263 687
Dringo/Sweet Root/Calamus 1 074 901 754 551 611 608 557 016
Kapulaga/Java Cardamon 25 178 901 28 550 282 47 231 297 42 464 609
Mengkudu/Indian Mulberry 16 267 057 14 613 481 14 411 737 9 159 867
Kejibeling/Verbenaceae 943 721 1 139 223 949 017 854 103
Sambiloto/King of Bitter 4 334 768 3 845 063 3 286 262 959 375
Tabel –––––– 5.2.8Table
Catatan/Note: x Angka sementara/Preliminary figures
http
://www.b
ps.g
o.id

P E R T A N I A N
S t a t i s t i k I n d o n e s i a 2 0 1 3224
Luas Panen Tanaman Hias Menurut Provinsi dan Jenis Tanaman (m2), 2011 dan 2012Harvested Area of Ornamental Plants by Province and Kind of Plant (m2), 2011 and 2012
[Diolah dari Hasil Survei Pertanian Hortikultura SPH–TH, BPS/Based on Agriculture Survey for Horticulture, BPS–Statistics Indonesia]
ProvinsiProvince
AnggrekOrchid
KrisanChrysantemum
2011 2012 x 2011 2012 x
(1) (2) (3) (4) (5)
Aceh 152 183 – – Sumatera Utara 35 351 13 143 243 450 294 924 Sumatera Barat 4 220 2 129 10 008 5 027 Riau 2 455 1 222 1 113 565 Kepulauan Riau 1 017 788 14 120 Jambi 2 709 1 231 10 18 Sumatera Selatan 2 554 4 026 1 643 1 439 Kepulauan Bangka Belitung 268 197 42 – Bengkulu 1 068 743 1 008 3 125 Lampung 22 745 6 850 8 534 2 525
DKI Jakarta 318 548 37 980 982 70 Jawa Barat 255 890 256 586 2 113 218 2 641 185 Banten 84 156 98 065 – – Jawa Tengah 65 869 119 739 1 692 141 1 678 925 DI Yogyakarta 4 317 13 793 3 993 33 435 Jawa Timur 204 822 200 778 4 247 893 4 281 664
Bali 98 055 260 572 16 964 26 297 Nusa Tenggara Barat 2 144 2 571 543 235 Nusa Tenggara Timur – 29 – –
Kalimantan Barat 14 293 20 085 161 687 Kalimantan Tengah 1 118 1 714 19 47 Kalimantan Selatan 1 030 1 521 18 – Kalimantan Timur 24 560 13 210 2 345 1 839
Sulawesi Utara 26 266 26 918 16 472 20 794 Gorontalo 706 907 – – Sulawesi Tengah 18 970 1 216 449 38 Sulawesi Selatan 5 265 4 758 15 971 4 289 Sulawesi Barat 453 80 – – Sulawesi Tenggara 1 600 1 407 2 056 2 159
Maluku – 215 – – Maluku Utara 8 114 – 243 – Papua 1 223 3 443 231 2 657 Papua Barat – – – –
Indonesia 1 209 938 1 096 099 8 379 521 9 002 064
Tabel –––––– 5.2.9Table
http
://www.b
ps.g
o.id

A G R I C U L T U R E
S t a t i s t i c a l Y e a r b o o k o f I n d o n e s i a 2 0 1 3 225
Lanjutan Tabel/Continued Table 5.2.9
ProvinsiProvince
MawarRose
Sedap MalamTuberose
2011 2012 x 2011 2012 x
(1) (6) (7) (8) (9)
Aceh 33 185 – 46 Sumatera Utara 4 043 17 918 53 404 113 625 Sumatera Barat 1 156 1 137 876 183 Riau 2 978 627 1 189 572 Kepulauan Riau 1 026 884 75 73 Jambi 3 724 2 047 3 608 1 020 Sumatera Selatan 3 802 6 097 1 962 10 095 Kepulauan Bangka Belitung 20 46 10 12 Bengkulu 832 430 459 319 Lampung 16 909 6 679 6 290 2 399
DKI Jakarta 21 961 9 564 590 – Jawa Barat 200 060 291 827 218 965 229 983 Banten 2 252 701 30 236 39 808 Jawa Tengah 19 371 20 738 132 900 41 160 DI Yogyakarta 2 727 3 947 716 3 058 Jawa Timur 203 140 176 703 213 249 97 394
Bali 818 1 560 41 430 43 352 Nusa Tenggara Barat 1 136 1 616 888 105 Nusa Tenggara Timur – 14 – –
Kalimantan Barat 1 264 1 168 234 680 Kalimantan Tengah 1 413 614 68 166 Kalimantan Selatan 882 213 – 29 Kalimantan Timur 1 244 3 326 169 460
Sulawesi Utara 1 316 3 335 201 2 006 Gorontalo – – – – Sulawesi Tengah 4 463 295 387 100 Sulawesi Selatan 4 569 2 892 1 463 1 095 Sulawesi Barat 447 10 102 35 Sulawesi Tenggara 1 472 1 305 266 474
Maluku 20 335 – – Maluku Utara 896 – 10 – Papua 771 878 240 216 Papua Barat – – – –
Indonesia 504 745 557 091 709 987 588 465
Catatan/Note: x Angka sementara/Preliminary figures
http
://www.b
ps.g
o.id
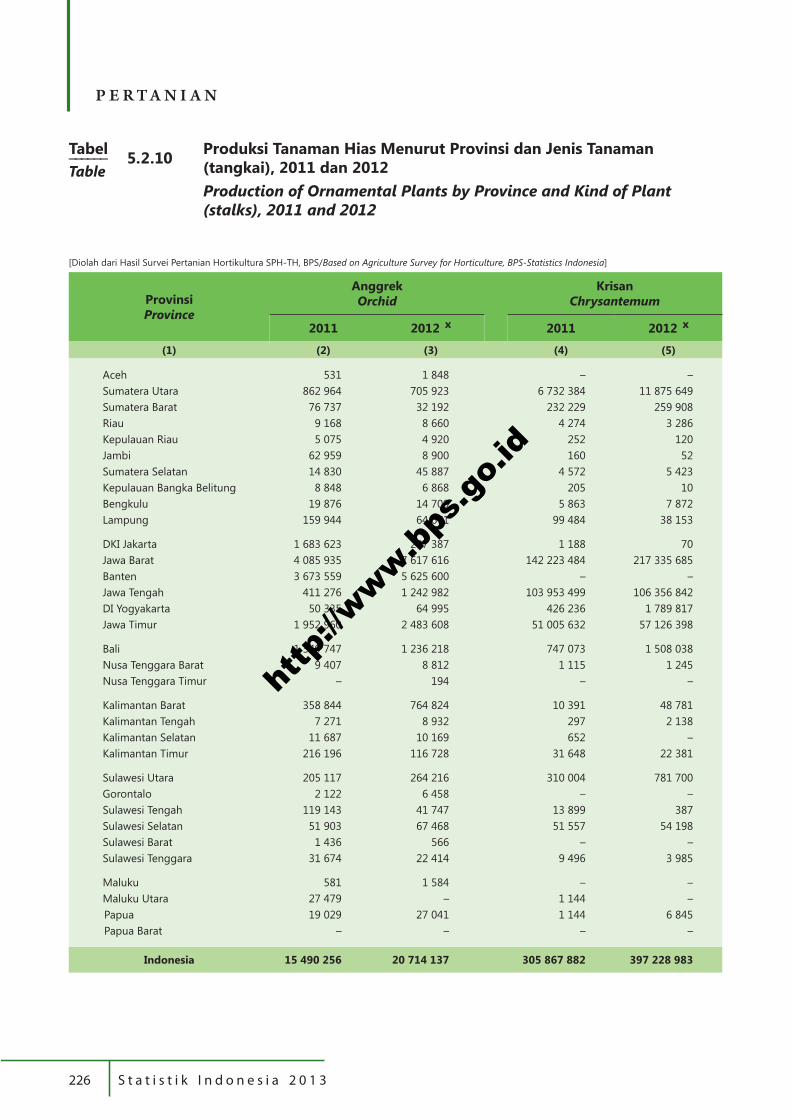
P E R T A N I A N
S t a t i s t i k I n d o n e s i a 2 0 1 3226
Produksi Tanaman Hias Menurut Provinsi dan Jenis Tanaman (tangkai), 2011 dan 2012Production of Ornamental Plants by Province and Kind of Plant (stalks), 2011 and 2012
[Diolah dari Hasil Survei Pertanian Hortikultura SPH-TH, BPS/Based on Agriculture Survey for Horticulture, BPS-Statistics Indonesia]
ProvinsiProvince
AnggrekOrchid
KrisanChrysantemum
2011 2012 x 2011 2012 x
(1) (2) (3) (4) (5)
Aceh 531 1 848 – – Sumatera Utara 862 964 705 923 6 732 384 11 875 649 Sumatera Barat 76 737 32 192 232 229 259 908 Riau 9 168 8 660 4 274 3 286 Kepulauan Riau 5 075 4 920 252 120 Jambi 62 959 8 900 160 52 Sumatera Selatan 14 830 45 887 4 572 5 423 Kepulauan Bangka Belitung 8 848 6 868 205 10 Bengkulu 19 876 14 709 5 863 7 872 Lampung 159 944 64 671 99 484 38 153
DKI Jakarta 1 683 623 207 387 1 188 70 Jawa Barat 4 085 935 7 617 616 142 223 484 217 335 685 Banten 3 673 559 5 625 600 – – Jawa Tengah 411 276 1 242 982 103 953 499 106 356 842 DI Yogyakarta 50 335 64 995 426 236 1 789 817 Jawa Timur 1 952 960 2 483 608 51 005 632 57 126 398
Bali 1 349 747 1 236 218 747 073 1 508 038 Nusa Tenggara Barat 9 407 8 812 1 115 1 245 Nusa Tenggara Timur – 194 – –
Kalimantan Barat 358 844 764 824 10 391 48 781 Kalimantan Tengah 7 271 8 932 297 2 138 Kalimantan Selatan 11 687 10 169 652 – Kalimantan Timur 216 196 116 728 31 648 22 381
Sulawesi Utara 205 117 264 216 310 004 781 700 Gorontalo 2 122 6 458 – – Sulawesi Tengah 119 143 41 747 13 899 387 Sulawesi Selatan 51 903 67 468 51 557 54 198 Sulawesi Barat 1 436 566 – – Sulawesi Tenggara 31 674 22 414 9 496 3 985
Maluku 581 1 584 – – Maluku Utara 27 479 – 1 144 – Papua 19 029 27 041 1 144 6 845 Papua Barat – – – –
Indonesia 15 490 256 20 714 137 305 867 882 397 228 983
Tabel –––––– 5.2.10Table
http
://www.b
ps.g
o.id

A G R I C U L T U R E
S t a t i s t i c a l Y e a r b o o k o f I n d o n e s i a 2 0 1 3 227
Lanjutan Tabel/Continued Table 5.2.10
ProvinsiProvince
MawarRose
Sedap MalamTuberose
2011 2012 x 2011 2012 x
(1) (6) (7) (8) (9)
Aceh 54 676 – 748 Sumatera Utara 131 198 331 473 435 750 2 663 822 Sumatera Barat 245 772 169 969 22 919 2 474 Riau 8 103 8 498 3 129 1 745 Kepulauan Riau 3 398 2 964 314 157 Jambi 74 461 16 353 34 495 5 809 Sumatera Selatan 31 128 91 739 39 812 70 541 Kepulauan Bangka Belitung 7 529 123 213 78 Bengkulu 8 343 9 125 698 4 099 Lampung 180 695 98 160 51 369 49 927
DKI Jakarta 31 841 45 879 590 259 Jawa Barat 7 770 033 12 420 736 4 021 633 4 888 555 Banten 19 804 48 862 394 941 628 628 Jawa Tengah 37 917 824 25 931 548 10 626 537 35 326 431 DI Yogyakarta 21 591 15 944 9 376 6 913 Jawa Timur 27 372 750 26 508 136 46 279 671 56 123 387
Bali 158 156 161 317 546 625 501 870 Nusa Tenggara Barat 1 787 3 376 900 317 Nusa Tenggara Timur – 227 – 15
Kalimantan Barat 40 634 93 102 14 610 54 986 Kalimantan Tengah 6 202 9 022 632 2 143 Kalimantan Selatan 25 700 23 764 680 515 Kalimantan Timur 71 518 50 515 894 638
Sulawesi Utara 15 115 33 716 9 804 29 590 Gorontalo – – – – Sulawesi Tengah 106 649 8 359 23 295 1 802 Sulawesi Selatan 39 395 48 386 9 706 17 329 Sulawesi Barat 708 332 167 117 Sulawesi Tenggara 18 933 12 634 5 183 2 526
Maluku 203 385 – – Maluku Utara 3 579 – 96 – Papua 6 670 7 674 1 426 2 178 Papua Barat – – – –
Indonesia 74 319 773 66 152 994 62 535 465 100 387 599
Catatan/Note: x Angka sementara/Preliminary figures
http
://www.b
ps.g
o.id
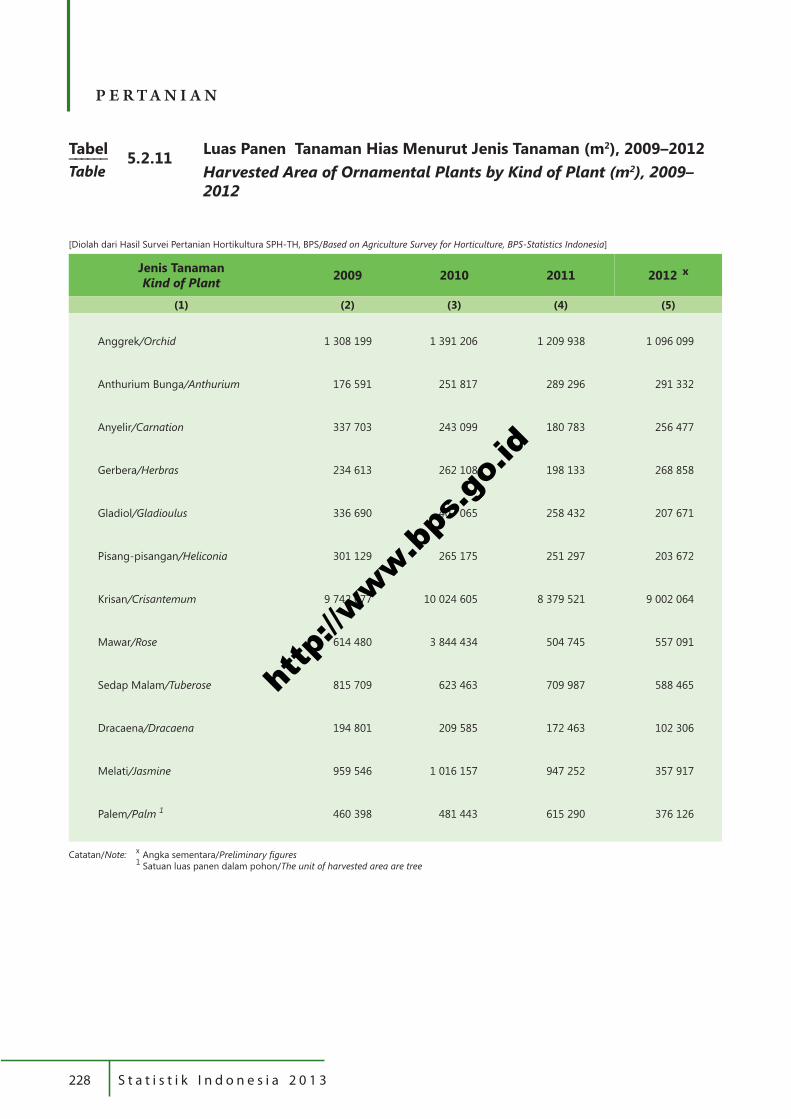
P E R T A N I A N
S t a t i s t i k I n d o n e s i a 2 0 1 3228
Luas Panen Tanaman Hias Menurut Jenis Tanaman (m2), 2009–2012 Harvested Area of Ornamental Plants by Kind of Plant (m2), 2009–2012
[Diolah dari Hasil Survei Pertanian Hortikultura SPH-TH, BPS/Based on Agriculture Survey for Horticulture, BPS-Statistics Indonesia]
Jenis TanamanKind of Plant 2009 2010 2011 2012 x
(1) (2) (3) (4) (5)
Anggrek/Orchid 1 308 199 1 391 206 1 209 938 1 096 099
Anthurium Bunga/Anthurium 176 591 251 817 289 296 291 332
Anyelir/Carnation 337 703 243 099 180 783 256 477
Gerbera/Herbras 234 613 262 108 198 133 268 858
Gladiol/Gladioulus 336 690 407 065 258 432 207 671
Pisang-pisangan/Heliconia 301 129 265 175 251 297 203 672
Krisan/Crisantemum 9 742 677 10 024 605 8 379 521 9 002 064
Mawar/Rose 614 480 3 844 434 504 745 557 091
Sedap Malam/Tuberose 815 709 623 463 709 987 588 465
Dracaena/Dracaena 194 801 209 585 172 463 102 306
Melati/Jasmine 959 546 1 016 157 947 252 357 917
Palem/Palm 1 460 398 481 443 615 290 376 126
Catatan/Note: x Angka sementara/Preliminary figures 1 Satuan luas panen dalam pohon/The unit of harvested area are tree
Tabel –––––– 5.2.11Table
http
://www.b
ps.g
o.id

A G R I C U L T U R E
S t a t i s t i c a l Y e a r b o o k o f I n d o n e s i a 2 0 1 3 229
Catatan/Note: x Angka sementara/Preliminary figures 1 Satuan produksi dalam pohon/The unit of production is tree 2 Satuan produksi dalam kg/The unit of production is kg
Produksi Tanaman Hias Menurut Jenis Tanaman (tangkai), 2009–2012 Production of Ornamental Plants by Kind of Plant (stalks), 2009–2012
[Diolah dari Hasil Survei Pertanian Hortikultura SPH-TH, BPS/Based on Agriculture Survey for Horticulture, BPS-Statistics Indonesia]
Jenis TanamanKind of Plant 2009 2010 2011 2012 x
(1) (2) (3) (4) (5)
Anggrek/Orchid 16 205 949 14 050 445 15 490 256 20 714 137
Anthurium Bunga/Anthurium 3 833 100 7 655 542 4 724 730 6 837 907
Anyelir/Carnation 5 320 824 7 607 588 5 130 332 5 358 905
Gerbera/Herbras 5 185 586 9 693 487 10 543 445 9 710 610
Gladiol/Gladioulus 9 775 500 10 064 082 5 448 740 3 502 204
Pisang-pisangan/Heliconia 4 124 174 2 961 385 2 791 257 3 284 731
Krisan/Crisantemum 107 847 072 185 232 970 305 867 882 397 228 983
Mawar/Rose 60 191 362 82 351 332 74 319 773 66 152 994
Sedap Malam/Tuberose 51 047 807 59 298 954 62 535 465 100 387 599
Dracaena/Dracaena 1 2 262 505 4 625 925 2 447 314 2 049 573
Melati/Jasmine 2 28 307 326 21 600 442 22 541 485 22 868 680
Palem/Palm 1 1 260 408 1 098 197 1 261 445 1 570 362
Tabel –––––– 5.2.12Table
http
://www.b
ps.g
o.id

P E R T A N I A N
S t a t i s t i k I n d o n e s i a 2 0 1 3230
Produksi Buah-buahan Menurut Provinsi dan Jenis Tanaman (ton), 2011 dan 2012Production of Fruits by Province and Kind of Plant (ton), 2011 and 2012
[Diolah dari Hasil Survei Pertanian Hortikultura SPH-BST BPS/Based on Agriculture Survey for Horticulture, BPS-Statistics Indonesia]
ProvinsiProvince
ManggaMango
DurianDurian
JerukOrange
2011 2012 x 2011 2012 x 2011 2012 x
(1) (2) (3) (4) (5) (6) (7)
Aceh 27 053 39 379 27 044 37 197 20 885 18 536 Sumatera Utara 31 743 35 471 79 659 102 766 579 471 362 250 Sumatera Barat 9 308 8 665 37 133 45 116 35 648 42 067 Riau 6 005 7 203 11 787 13 119 4 586 5 039 Kepulauan Riau 4 047 3 887 4 216 4 744 346 655 Jambi 3 459 3 898 16 693 32 768 43 811 45 056 Sumatera Selatan 9 284 14 294 23 100 28 344 23 995 17 934 Kepulauan Bangka Belitung 4 143 3 634 10 716 9 956 5 159 5 113 Bengkulu 5 169 5 217 33 102 14 432 9 610 10 533 Lampung 24 752 21 725 42 550 34 083 5 626 3 721
DKI Jakarta 3 602 15 413 226 937 37 419 Jawa Barat 357 188 344 927 157 030 75 913 27 106 29 800 Banten 37 286 39 216 26 291 20 342 1 855 1 841 Jawa Tengah 350 780 422 992 76 334 79 236 25 705 23 102 DI Yogyakarta 31 011 41 688 4 242 8 528 1 923 2 610 Jawa Timur 754 930 839 613 111 207 157 845 328 100 390 388
Bali 39 551 40 372 17 059 14 134 99 156 129 670 Nusa Tenggara Barat 113 830 137 689 6 431 3 587 5 430 6 914 Nusa Tenggara Timur 71 962 71 430 1 211 1 172 19 247 19 914
Kalimantan Barat 4 777 5 674 23 635 25 100 110 640 172 945 Kalimantan Tengah 4 815 5 341 17 533 12 570 5 906 7 000 Kalimantan Selatan 11 479 6 205 25 270 13 291 116 156 101 016 Kalimantan Timur 10 870 10 521 10 865 17 485 10 112 9 982
Sulawesi Utara 5 929 10 709 5 741 6 209 909 2 198 Gorontalo 4 420 3 942 1 167 939 1 294 1 211 Sulawesi Tengah 31 702 18 353 31 883 16 438 73 020 29 842 Sulawesi Selatan 124 058 158 006 37 533 38 210 58 616 46 054 Sulawesi Barat 15 780 19 805 28 353 3 987 141 682 70 903 Sulawesi Tenggara 18 572 19 833 4 615 5 171 38 790 39 484
Maluku 9 338 3 531 5 414 6 665 8 402 5 945 Maluku Utara 2 367 1 286 2 902 821 5 484 2 282 Papua 1 452 2 345 2 166 717 9 877 4 770 Papua Barat 477 1 181 861 2 846 365 567
Indonesia 2 131 139 2 363 445 883 969 834 668 1 818 949 1 609 761
Tabel –––––– 5.2.13Table
http
://www.b
ps.g
o.id

A G R I C U L T U R E
S t a t i s t i c a l Y e a r b o o k o f I n d o n e s i a 2 0 1 3 231
Lanjutan Tabel/Continued Table 5.2.13
ProvinsiProvince
PisangBanana
PepayaPapaya
SalakSalacca
2011 2012 x 2011 2012 x 2011 2012 x
(1) (8) (9) (10) (11) (12) (13)
Aceh 68 989 62 662 14 830 12 633 381 337 Sumatera Utara 429 629 363 060 36 056 31 658 360 813 350 010 Sumatera Barat 113 360 137 348 11 784 11 623 3 134 2 758 Riau 26 497 20 190 7 393 12 566 827 920 Kepulauan Riau 4 232 6 655 1 847 1 671 176 1 072 Jambi 36 942 37 797 19 575 29 791 403 841 Sumatera Selatan 109 268 182 959 4 832 7 064 1 504 920 Kepulauan Bangka Belitung 8 625 6 769 1 674 1 355 785 1 173 Bengkulu 25 082 27 844 7 705 6 934 3 802 3 649 Lampung 687 761 696 840 123 341 103 313 7 228 3 259
DKI Jakarta 695 2 194 341 1 133 32 248 Jawa Barat 1 360 126 1 191 542 98 253 75 667 68 595 40 816 Banten 248 272 257 156 5 603 8 286 1 917 1 387 Jawa Tengah 750 775 617 455 50 034 78 292 437 401 443 840 DI Yogyakarta 38 976 61 153 7 262 11 410 25 807 40 262 Jawa Timur 1 188 926 1 362 405 363 008 323 386 104 722 76 346
Bali 163 685 164 700 9 234 7 864 31 896 34 060 Nusa Tenggara Barat 61 883 91 830 11 135 6 953 22 13 Nusa Tenggara Timur 184 773 148 278 64 828 53 400 1 046 804
Kalimantan Barat 46 764 53 454 11 125 9 521 1 571 1 383 Kalimantan Tengah 17 405 19 738 2 762 3 448 917 1 205 Kalimantan Selatan 65 073 69 669 5 643 5 662 1 532 898 Kalimantan Timur 122 541 112 918 29 443 20 883 9 989 9 322
Sulawesi Utara 31 195 46 633 5 544 7 296 59 403 Gorontalo 4 190 4 405 501 422 2 1 Sulawesi Tengah 56 505 47 797 9 958 6 912 849 785 Sulawesi Selatan 153 540 149 061 35 111 42 517 14 683 13 572 Sulawesi Barat 52 258 53 816 1 662 1 404 150 75 Sulawesi Tenggara 26 190 30 678 8 831 7 959 434 392
Maluku 38 059 29 143 6 413 6 424 848 756 Maluku Utara 1 192 265 496 49 160 10 Papua 6 678 12 474 1 628 1 003 273 284 Papua Barat 2 609 5 452 399 1 376 167 362
Indonesia 6 132 695 6 074 340 958 251 899 875 1 082 125 1 032 163
Catatan/Note: x Angka sementara/Preliminary figures
http
://www.b
ps.g
o.id
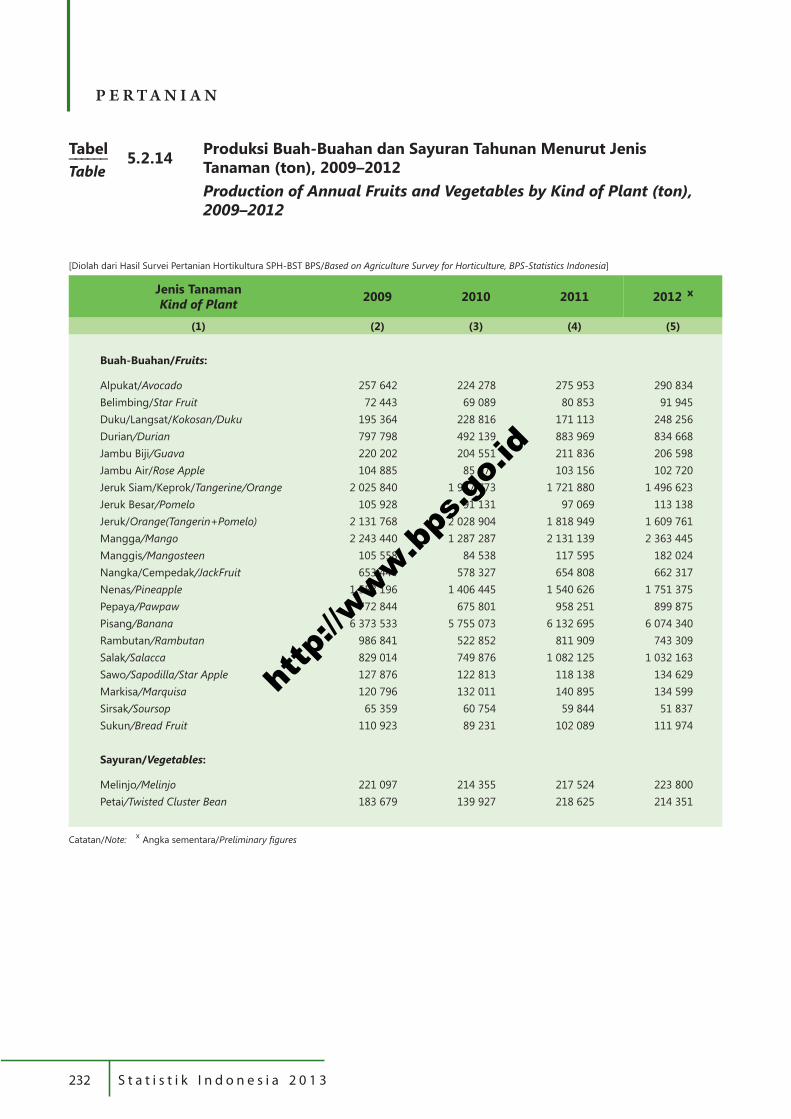
P E R T A N I A N
S t a t i s t i k I n d o n e s i a 2 0 1 3232
Produksi Buah-Buahan dan Sayuran Tahunan Menurut Jenis Tanaman (ton), 2009–2012Production of Annual Fruits and Vegetables by Kind of Plant (ton), 2009–2012
[Diolah dari Hasil Survei Pertanian Hortikultura SPH-BST BPS/Based on Agriculture Survey for Horticulture, BPS-Statistics Indonesia]
Jenis TanamanKind of Plant 2009 2010 2011 2012 x
(1) (2) (3) (4) (5)
Buah-Buahan/Fruits:
Alpukat/Avocado 257 642 224 278 275 953 290 834Belimbing/Star Fruit 72 443 69 089 80 853 91 945Duku/Langsat/Kokosan/Duku 195 364 228 816 171 113 248 256Durian/Durian 797 798 492 139 883 969 834 668Jambu Biji/Guava 220 202 204 551 211 836 206 598Jambu Air/Rose Apple 104 885 85 973 103 156 102 720Jeruk Siam/Keprok/Tangerine/Orange 2 025 840 1 937 773 1 721 880 1 496 623Jeruk Besar/Pomelo 105 928 91 131 97 069 113 138Jeruk/Orange(Tangerin+Pomelo) 2 131 768 2 028 904 1 818 949 1 609 761Mangga/Mango 2 243 440 1 287 287 2 131 139 2 363 445Manggis/Mangosteen 105 558 84 538 117 595 182 024Nangka/Cempedak/JackFruit 653 444 578 327 654 808 662 317Nenas/Pineapple 1 558 196 1 406 445 1 540 626 1 751 375Pepaya/Pawpaw 772 844 675 801 958 251 899 875Pisang/Banana 6 373 533 5 755 073 6 132 695 6 074 340Rambutan/Rambutan 986 841 522 852 811 909 743 309Salak/Salacca 829 014 749 876 1 082 125 1 032 163Sawo/Sapodilla/Star Apple 127 876 122 813 118 138 134 629Markisa/Marquisa 120 796 132 011 140 895 134 599Sirsak/Soursop 65 359 60 754 59 844 51 837Sukun/Bread Fruit 110 923 89 231 102 089 111 974
Sayuran/Vegetables:
Melinjo/Melinjo 221 097 214 355 217 524 223 800Petai/Twisted Cluster Bean 183 679 139 927 218 625 214 351
Tabel –––––– 5.2.14Table
Catatan/Note: x Angka sementara/Preliminary figures
http
://www.b
ps.g
o.id
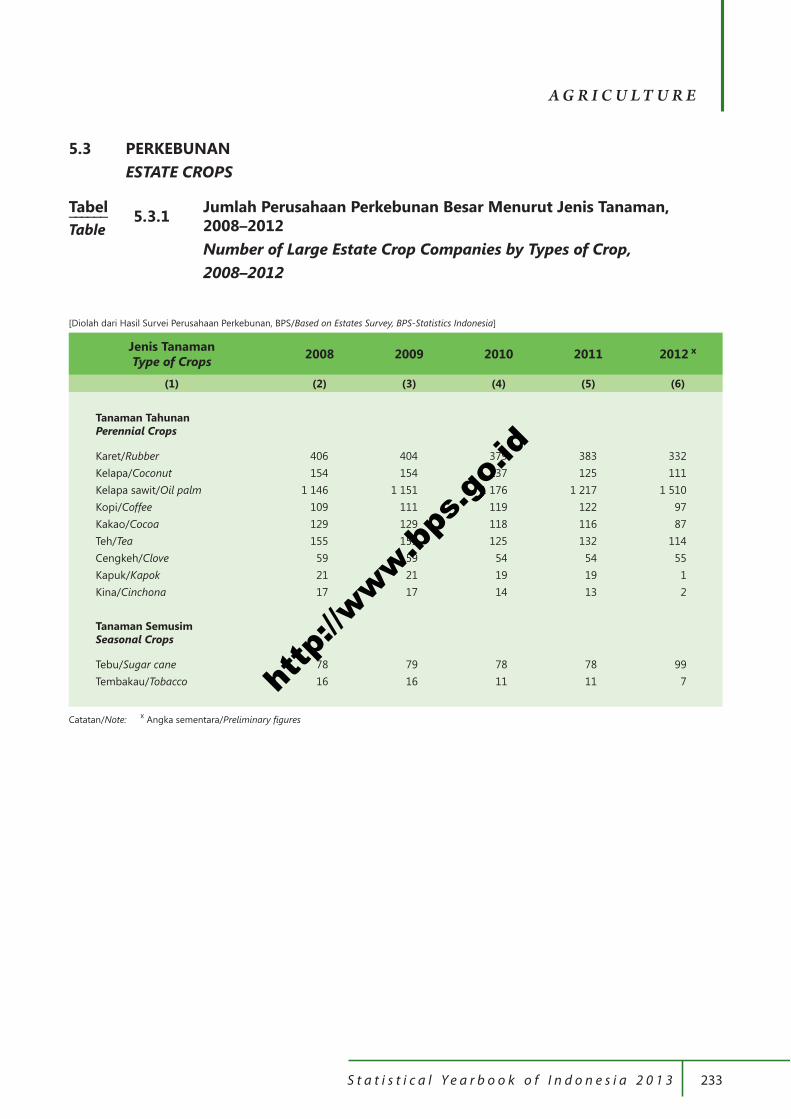
A G R I C U L T U R E
S t a t i s t i c a l Y e a r b o o k o f I n d o n e s i a 2 0 1 3 233
Jumlah Perusahaan Perkebunan Besar Menurut Jenis Tanaman, 2008–2012Number of Large Estate Crop Companies by Types of Crop,2008–2012
Tabel –––––– 5.3.1Table
5.3 PERKEBUNAN ESTATE CROPS
[Diolah dari Hasil Survei Perusahaan Perkebunan, BPS/Based on Estates Survey, BPS-Statistics Indonesia]
Jenis TanamanType of Crops 2008 2009 2010 2011 2012 x
(1) (2) (3) (4) (5) (6)
Tanaman TahunanPerennial Crops
Karet/Rubber 406 404 379 383 332Kelapa/Coconut 154 154 137 125 111Kelapa sawit/Oil palm 1 146 1 151 1 176 1 217 1 510Kopi/Coffee 109 111 119 122 97Kakao/Cocoa 129 129 118 116 87Teh/Tea 155 155 125 132 114Cengkeh/Clove 59 59 54 54 55Kapuk/Kapok 21 21 19 19 1Kina/Cinchona 17 17 14 13 2
Tanaman SemusimSeasonal Crops
Tebu/Sugar cane 78 79 78 78 99Tembakau/Tobacco 16 16 11 11 7
Catatan/Note: x Angka sementara/Preliminary figures
http
://www.b
ps.g
o.id

P E R T A N I A N
S t a t i s t i k I n d o n e s i a 2 0 1 3234
Luas Areal Tanaman Perkebunan Besar Menurut Jenis Tanaman (ribu ha), 2008–2012Planted Area of Large Estate Crops by Type of Crop (thousand ha), 2008–2012
Tabel –––––– 5.3.2Table
[Diolah dari Hasil Survei Perusahaan Perkebunan BPS/Based on Estates Survey BPS-Statistics Indonesia]
Jenis TanamanType of Crop 2008 2009 2010 2011 2012 x
(1) (2) (3) (4) (5) (6)
Tanaman TahunanPerennial Crops
Karet/Rubber 523,8 r 482,7 r 496,7 524,3 524,6Kelapa/Coconut 1 59,0 67,5 42,3 41,9 42,9Kelapa sawit/Oil palm 4 451,8 4 888,0 5 161,6 5 349,8 5 456,5Kopi/Coffee 58,3 48,7 47,6 48,7 48,7Kakao/Cocoa 98,4 95,3 92,2 94,3 94,4Teh/Tea 75,2 74,2 66,3 67,3 66,3Cengkeh/Clove 1 8,8 8,6 8,5 8,5 8,5 Kapuk/Kapok 1 5,1 4,9 4,8 4,8 4,8Kina/Cinchona 3,0 3,0 3,0 3,0 3,0
Tanaman SemusimSeasonal Crops
Tebu/Sugar cane 2 183,7 187,1 188,6 192,5 198,8Tembakau/Tobacco 2 4,6 4,2 3,4 2,9 2,9
Catatan/Note: r Angka diperbaiki/Revised figures x Angka sementara/Preliminary figures 1 Data berasal dari Direktorat Jenderal Perkebunan/Data are from Directorate General of Estates 2 Luas yang ditebang/Harvested areaht
tp://w
ww.bps
.go.
id

A G R I C U L T U R E
S t a t i s t i c a l Y e a r b o o k o f I n d o n e s i a 2 0 1 3 235
Catatan/Note: r Angka diperbaiki/Revised figures x Angka sementara/Preliminary figures 1 Luas yang ditebang/Harvested area Sumber/Source: Direktorat Jenderal Perkebunan/Directorate General of Estates
Luas Areal Tanaman Perkebunan Rakyat Menurut Jenis Tanaman (ribu ha), 2008–2012Planted Area of Smallholders Estates by Type of Crop (thousand ha), 2008–2012
Tabel –––––– 5.3.3Table
Jenis TanamanType of Crop 2008 2009 2010 2011 2012 x
(1) (2) (3) (4) (5) (6)
Tanaman TahunanPerennial Crops
Karet/Rubber 2 900,3 r 2 952,6 r 2 948,7 2 931,8 2 959,5Kelapa/Coconut 3 724,1 3 731,6 3 697,0 3 725,8 3 744,8Kelapa sawit/Oil palm 2 881,9 3 061,4 3 387,3 3 752,5 3 773,5Kopi/Coffee 1 236,8 1 217,5 1 162,8 1 185,0 1 185,2Kakao/Cocoa 1 326,8 1 491,8 1 558,4 1 638,3 1 638,5Teh/Tea 60,5 57,1 56,5 56,0 56,2Kapuk/Kapok 172,6 166,1 163,5 162,3 162,7Jambu mete/Cashew nut 572,7 571,9 569,9 574,8 585,3Pala/Nutmeg 85,0 98,8 117,3 121,4 124,2Kayu manis/Cinnamon 102,0 103,0 99,3 102,1 102,8Kemiri/Candlenut 216,9 216,7 215,0 206,7 207,8Pinang/Areca nut 137,3 144,2 146,0 148,8 149,9Lada/Pepper 183,1 185,9 179,3 177,5 178,6Panili/Vanilla 30,0 27,0 24,1 23,1 24,8Cengkeh/Clove 447,7 458,7 r 461,6 476,7 476,8
Tanaman SemusimSeasonal Crops
Tebu/Sugar cane 1 258,0 r 259,3 r 275,9 r 242,5 254,5Tembakau/Tobacco 192,1 200,2 212,9 225,9 246,9Sereh wangi/Citronella 20,1 20,0 19,9 18,8 19,6Jarak kepyar/Castor oil seeds 5,3 3,1 3,8 8,8 6,4Nilam/Patchouli 22,1 24,5 24,5 28,6 28,9
http
://www.b
ps.g
o.id

P E R T A N I A N
S t a t i s t i k I n d o n e s i a 2 0 1 3236
Produksi Perkebunan Besar Menurut Jenis Tanaman (ribu ton), 2008–2012Production of Large Estate Crops by Type of Crop (thousand tons), 2008–2012
Tabel –––––– 5.3.4Table
[Diolah dari Hasil Survei Perusahaan Perkebunan Bulanan, BPS/Based on Monthly Estates Survey, BPS-Statistics Indonesia]
Jenis TanamanType of Crop 2008 2009 2010 2011 2012 x
(1) (2) (3) (4) (5) (6)
Tanaman TahunanPerennial Crops
Karet/Rubber 594,6 r 522,3 541,5 630,4 679,4Kelapa/Coconut 1, 2 63,7 76,4 40,3 41,5 40,7Minyak kelapa sawit/Crude palm oil 12 477,8 13 872,6 14 038,1 15 177,8 15 397,9Inti sawit/Palm kernel 2 829,2 3 145,5 3 183,1 3 441,5 3 491,4Kopi/Coffee 28,1 28,7 29,0 22,2 22,9Kakao/Cocoa 62,9 67,6 65,1 67,5 68,4Teh/Tea 114,7 107,4 100,1 95,1 98,6Cengkeh/Clove 2 1,7 1,9 1,9 1,6 1,6Kapuk/Kapok 2 2,0 1,9 1,5 1,6 1,4Kina/Cinchona 0,4 0,6 0,7 0,7 0,7
Tanaman SemusimSeasonal Crops
Gula tebu/Sugar cane 1 132,2 1 132,2 1 079,8 959,9 1 149,6Tembakau/Tobacco 2 2,6 2,6 3,4 2,4 2,8
Catatan/Note: r Angka diperbaiki/Revised figures x Angka sementara/Preliminary figure 1 Ekivalen kopra/Copra equivalent 2 Data dari Direktorat Jenderal Perkebunan/Data are from Directorate General of Estates
http
://www.b
ps.g
o.id
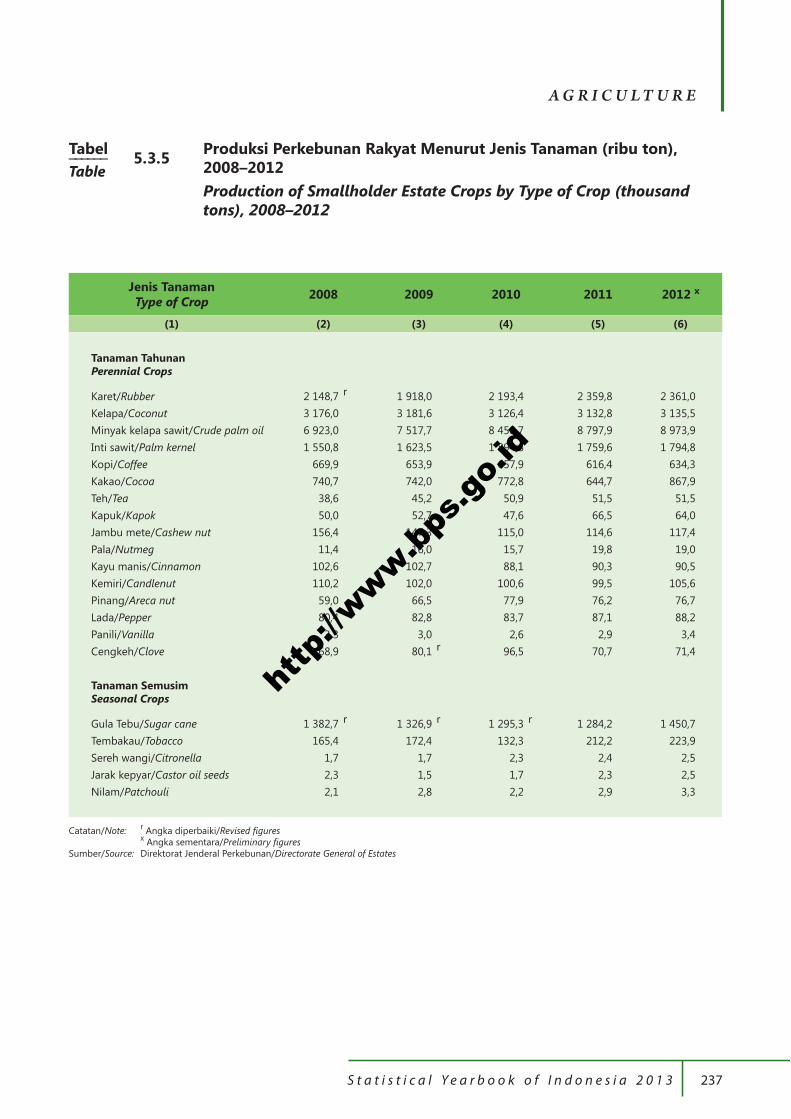
A G R I C U L T U R E
S t a t i s t i c a l Y e a r b o o k o f I n d o n e s i a 2 0 1 3 237
Catatan/Note: r Angka diperbaiki/Revised figures x Angka sementara/Preliminary figures Sumber/Source: Direktorat Jenderal Perkebunan/Directorate General of Estates
Produksi Perkebunan Rakyat Menurut Jenis Tanaman (ribu ton), 2008–2012Production of Smallholder Estate Crops by Type of Crop (thousand tons), 2008–2012
Tabel –––––– 5.3.5Table
Jenis TanamanType of Crop 2008 2009 2010 2011 2012 x
(1) (2) (3) (4) (5) (6)
Tanaman TahunanPerennial Crops
Karet/Rubber 2 148,7 r 1 918,0 2 193,4 2 359,8 2 361,0Kelapa/Coconut 3 176,0 3 181,6 3 126,4 3 132,8 3 135,5Minyak kelapa sawit/Crude palm oil 6 923,0 7 517,7 8 458,7 8 797,9 8 973,9Inti sawit/Palm kernel 1 550,8 1 623,5 1 894,8 1 759,6 1 794,8Kopi/Coffee 669,9 653,9 657,9 616,4 634,3Kakao/Cocoa 740,7 742,0 772,8 644,7 867,9Teh/Tea 38,6 45,2 50,9 51,5 51,5Kapuk/Kapok 50,0 52,7 47,6 66,5 64,0Jambu mete/Cashew nut 156,4 147,3 115,0 114,6 117,4Pala/Nutmeg 11,4 16,0 15,7 19,8 19,0Kayu manis/Cinnamon 102,6 102,7 88,1 90,3 90,5Kemiri/Candlenut 110,2 102,0 100,6 99,5 105,6Pinang/Areca nut 59,0 66,5 77,9 76,2 76,7Lada/Pepper 80,4 82,8 83,7 87,1 88,2Panili/Vanilla 3,3 3,0 2,6 2,9 3,4Cengkeh/Clove 68,9 80,1 r 96,5 70,7 71,4
Tanaman SemusimSeasonal Crops
Gula Tebu/Sugar cane 1 382,7 r 1 326,9 r 1 295,3 r 1 284,2 1 450,7Tembakau/Tobacco 165,4 172,4 132,3 212,2 223,9Sereh wangi/Citronella 1,7 1,7 2,3 2,4 2,5Jarak kepyar/Castor oil seeds 2,3 1,5 1,7 2,3 2,5Nilam/Patchouli 2,1 2,8 2,2 2,9 3,3
http
://www.b
ps.g
o.id

P E R T A N I A N
S t a t i s t i k I n d o n e s i a 2 0 1 3238
Luas Areal Tanaman Perkebunan Menurut Provinsi dan Jenis Tanaman (ribu ha), 2011 dan 2012Planted Area of Estate Crops by Province and Type of Crop (thousand ha), 2011 and 2012
Tabel –––––– 5.3.6Table
ProvinsiProvince
Kelapa SawitOil Palm
KelapaCoconut
KaretRubber
KopiCoffee
2011 2012 x 2011 2012 x 2011 2012 x 2011 2012 x
(1) (2) (3) (4) (5) (6) (7) (8) (9)
Aceh 360,2 365,9 107,5 102,2 120,3 121,2 120,7 120,7 Sumatera Utara 1 164,0 1 182,6 113,2 113,2 465,3 470,2 80,6 80,6 Sumatera Barat 370,7 375,2 91,9 92,4 131,6 136,3 40,3 40,3 Riau 1 919,0 1 940,4 521,0 521,0 390,9 393,6 4,7 4,7 Kepulauan Riau 8,7 8,8 35,3 38,1 32,1 32,4 0,0 0,0 Jambi 647,0 654,5 118,4 118,8 444,5 446,5 25,3 25,3 Sumatera Selatan 873,8 885,5 67,7 74,5 668,5 670,5 252,5 252,5 Kepulauan Bangka Belitung 186,1 189,1 9,7 9,5 29,5 29,3 0,0 0,0 Bengkulu 308,1 311,3 9,5 10,0 74,4 74,5 91,5 91,5 Lampung 123,4 125,2 129,3 129,2 85,2 84,9 161,6 161,6
DKI Jakarta – – – – – – – – Jawa Barat 14,1 14,4 183,4 183,0 54,6 55,8 29,8 29,9 Banten 14,8 15,3 100,4 100,1 23,3 23,8 9,5 9,5 Jawa Tengah – – 237,1 238,0 31,6 31,6 38,1 38,1 DI Yogyakarta – – 43,5 39,7 – – 1,4 1,4 Jawa Timur – – 297,2 297,7 26,0 25,9 99,1 99,1
Bali – – 70,8 71,0 0,1 0,1 34,1 34,1 Nusa Tenggara Barat – – 65,1 65,2 – – 12,8 12,8 Nusa Tenggara Timur – – 161,6 162,7 – – 71,8 71,8
Kalimantan Barat 700,5 710,5 108,2 108,1 388,1 390,6 12,6 12,6 Kalimantan Tengah 1 008,4 1 025,4 75,2 82,6 265,7 267,4 4,4 4,4 Kalimantan Selatan 424,8 432,1 46,5 46,9 135,0 135,9 5,0 5,0 Kalimantan Timur 657,3 667,9 29,8 29,9 60,5 65,4 10,6 10,6
Sulawesi Utara – – 277,3 279,5 – – 8,2 8,2 Gorontalo – – 70,8 71,6 – – 1,6 1,6 Sulawesi Tengah 93,8 95,0 206,8 206,6 3,2 3,2 7,4 7,4 Sulawesi Selatan 27,9 28,3 112,5 112,8 19,6 18,7 74,3 74,3 Sulawesi Barat 95,2 96,5 54,8 53,0 1,2 1,2 13,0 13,0 Sulawesi Tenggara 44,8 45,7 56,1 57,2 – – 9,8 9,8
Maluku – – 96,1 95,2 – – 1,9 1,9 Maluku Utara – – 225,2 226,5 – – 3,4 3,4 Papua 39,5 40,2 24,6 30,4 4,8 5,0 7,0 7,0 Papua Barat 20,1 20,4 21,3 21,3 0,0 0,0 0,5 0,5
Indonesia 9 102,3 9 230,1 3 767,7 3 787,7 3 456,1 3 484,1 1 233,7 1 234,0
http
://www.b
ps.g
o.id

A G R I C U L T U R E
S t a t i s t i c a l Y e a r b o o k o f I n d o n e s i a 2 0 1 3 239
Lanjutan Tabel/Continued Table 5.3.6
ProvinsiProvince
KakaoCocoa
TebuSugar Cane
TehTea
TembakauTobacco
2011 2012 x 2011 2012 x 2011 2012 x 2011 2012 x
(1) (10) (11) (12) (13) (14) (15) (16) (17)
Aceh 102,9 91,7 – – – – 0,9 1,0 Sumatera Utara 93,1 92,8 10,0 11,0 5,1 5,1 2,9 3,2 Sumatera Barat 134,1 116,6 – – 4,9 4,9 1,4 1,4 Riau 7,9 7,2 – – – – – – Kepulauan Riau 0,0 0,0 – – – – – – Jambi 2,2 2,0 – – 2,6 2,6 0,3 0,3 Sumatera Selatan 11,6 9,0 15,7 22,6 1,4 1,4 0,1 0,1 Kepulauan Bangka Belitung 0,7 0,5 – – – – – – Bengkulu 17,5 14,5 – – 0,9 0,9 – – Lampung 57,7 51,1 113,5 113,3 – – 0,7 0,7
DKI Jakarta – – – – – – – – Jawa Barat 11,9 11,2 22,3 23,0 95,6 95,1 9,2 9,2 Banten 9,1 7,4 – – 0,1 0,1 – – Jawa Tengah 8,6 7,2 51,7 54,3 10,0 9,9 45,9 43,7 DI Yogyakarta 5,4 4,9 6,7 7,0 0,1 0,1 2,1 2,1 Jawa Timur 69,2 61,2 194,9 202,7 2,4 2,2 130,8 152,9
Bali 14,8 14,9 – – – – 1,1 1,2 Nusa Tenggara Barat 7,7 6,8 – – – – 29,4 29,1 Nusa Tenggara Timur 56,8 48,4 – – – – 1,1 2,2
Kalimantan Barat 15,4 12,2 – – – – – – Kalimantan Tengah 1,0 0,8 – – – – – – Kalimantan Selatan 1,0 0,7 – – – – – – Kalimantan Timur 27,5 27,7 – – 0,0 0,0 – –
Sulawesi Utara 19,9 16,8 – – – – – – Gorontalo 15,6 12,1 7,2 7,0 – – – – Sulawesi Tengah 267,3 282,0 – – – – 0,0 0,0 Sulawesi Selatan 244,5 279,9 12,9 12,4 – – 2,6 2,4 Sulawesi Barat 181,4 191,7 – – – – – – Sulawesi Tenggara 229,4 249,7 – – – – – –
Maluku 31,4 29,8 – – – – – – Maluku Utara 38,7 36,1 – – – – – – Papua 34,8 31,0 – – – – – – Papua Barat 13,6 14,9 – – – – – –
Indonesia 1 732,6 1 733,0 435,0 453,3 123,3 122,5 228,8 249,8
Catatan/Note: x Angka sementara/Preliminary figures Sumber/Source: Direktorat Jenderal Perkebunan/Directorate General of Estate Crops
http
://www.b
ps.g
o.id

P E R T A N I A N
S t a t i s t i k I n d o n e s i a 2 0 1 3240
Produksi Perkebunan Menurut Provinsi dan Jenis Tanaman (ribu ton), 2011 dan 2012Production of Estates by Province and Type of Crop (thousand tons), 2011 and 2012
Tabel –––––– 5.3.7Table
ProvinsiProvince
Minyak Kelapa SawitCrude Palm Oil
KelapaCoconut
KaretRubber
KopiCoffee
2011 2012 x 2011 2012 x 2011 2012 x 2011 2012 x
(1) (2) (3) (4) (5) (6) (7) (8) (9)
Aceh 592,2 601,8 63,8 62,9 106,4 108,8 52,3 53,8 Sumatera Utara 4 010,7 4 097,4 94,3 95,8 481,4 501,5 56,8 58,5 Sumatera Barat 927,4 941,6 86,0 89,3 105,0 105,8 30,8 31,7 Riau 5 895,5 5 994,0 481,1 483,4 396,2 409,0 1,9 2,0 Kepulauan Riau 15,2 15,3 14,3 13,0 27,6 24,8 0,0 0,0 Jambi 1 773,1 1 802,4 114,5 114,0 319,9 339,6 12,8 13,2 Sumatera Selatan 2 417,7 2 455,6 66,0 70,8 567,3 608,2 127,4 131,1 Kepulauan Bangka Belitung 504,6 510,2 5,6 5,3 23,3 22,0 0,0 0,0 Bengkulu 827,1 840,5 7,8 8,4 62,1 58,1 53,8 55,4 Lampung 424,0 431,8 118,1 112,9 77,0 79,2 144,5 148,7
DKI Jakarta – – – – – – – – Jawa Barat 22,1 22,8 106,4 106,6 63,5 66,4 14,3 14,7 Banten 21,8 22,6 55,3 55,5 17,1 17,7 2,3 2,3 Jawa Tengah – – 182,2 182,3 34,4 36,0 10,5 10,8 DI Yogyakarta – – 49,5 43,2 – – 0,4 0,4 Jawa Timur – – 268,3 270,3 26,8 28,1 37,4 38,5
Bali – – 66,7 68,8 0,1 0,1 10,4 10,7 Nusa Tenggara Barat – – 59,7 59,8 – – 5,1 5,3 Nusa Tenggara Timur – – 62,3 64,4 – – 19,9 20,5
Kalimantan Barat 1 443,9 1 469,4 78,2 78,9 286,8 272,3 4,2 4,3 Kalimantan Tengah 2 499,3 2 526,2 70,9 77,6 216,3 202,7 1,4 1,4 Kalimantan Selatan 1 045,2 1 057,5 28,8 29,4 124,7 114,5 1,2 1,2 Kalimantan Timur 905,5 921,1 14,7 14,9 38,3 29,0 2,3 2,4
Sulawesi Utara – – 283,1 285,1 – – 3,2 3,3 Gorontalo – – 63,7 64,7 – – 0,8 0,8 Sulawesi Tengah 185,1 188,0 191,0 177,8 3,5 3,8 3,2 3,3 Sulawesi Selatan 42,7 43,9 82,2 79,5 8,8 9,3 30,6 31,5 Sulawesi Barat 249,3 252,9 50,6 49,8 1,6 1,7 5,3 5,4 Sulawesi Tenggara 16,2 16,5 40,5 40,8 – – 3,1 3,2
Maluku – – 79,7 77,5 – – 0,7 0,8 Maluku Utara – – 255,1 256,5 – – 0,5 0,5 Papua 103,1 105,1 16,3 19,4 2,2 1,7 1,5 1,5 Papua Barat 54,1 55,2 17,9 18,0 0,0 0,0 0,2 0,2
Indonesia 23 975,7 24 371,8 3 174,4 3 176,2 2 990,2 3 040,4 638,6 657,1
http
://www.b
ps.g
o.id

A G R I C U L T U R E
S t a t i s t i c a l Y e a r b o o k o f I n d o n e s i a 2 0 1 3 241
Lanjutan Tabel/Continued Table 5.3.7
ProvinsiProvince
KakaoCocoa
TebuSugar Cane
TehTea
TembakauTobacco
2011 2012 x 2011 2012 x 2011 2012 x 2011 2012 x
(1) (10) (11) (12) (13) (14) (15) (16) (17)
Aceh 24,6 32,6 – – – – 1,0 1,1 Sumatera Utara 54,5 63,6 44,9 41,5 7,1 7,1 2,3 3,0 Sumatera Barat 44,6 58,8 – – 7,3 8,4 1,3 1,4 Riau 3,6 3,9 – – – – – – Kepulauan Riau 0,0 0,0 – – – – – – Jambi 0,5 0,7 – – 4,3 3,5 0,1 0,2 Sumatera Selatan 2,0 2,7 52,5 87,3 4,1 4,0 0,1 0,1 Kepulauan Bangka Belitung 0,1 0,1 – – – – – – Bengkulu 4,1 5,5 – – 1,8 2,1 – – Lampung 20,7 26,4 631,5 747,1 – – 0,6 0,9
DKI Jakarta – – – – – – – – Jawa Barat 2,6 2,9 133,3 114,5 104,9 106,2 8,1 8,1 Banten 1,6 2,0 – – 0,0 0,0 – – Jawa Tengah 2,4 2,8 182,3 247,5 14,7 16,3 39,4 30,1 DI Yogyakarta 0,8 1,1 27,1 38,2 0,1 0,1 1,4 1,5 Jawa Timur 24,8 27,4 1 121,4 1 258,6 2,4 2,4 114,8 136,3
Bali 3,7 4,9 – – – – 1,7 1,6 Nusa Tenggara Barat 1,0 1,3 – – – – 41,0 38,5 Nusa Tenggara Timur 8,8 12,2 – – – – 0,2 0,3
Kalimantan Barat 1,9 2,6 – – – – – – Kalimantan Tengah 0,2 0,3 – – – – – – Kalimantan Selatan 0,1 0,1 – – – – – – Kalimantan Timur 8,1 10,9 – – – – – –
Sulawesi Utara 3,7 4,7 – – – – – – Gorontalo 2,9 3,9 32,2 31,8 – – – – Sulawesi Tengah 124,8 168,4 – – – – 0,0 0,0 Sulawesi Selatan 142,8 198,7 19,0 33,8 – – 2,5 3,6 Sulawesi Barat 80,2 101,3 – – – – – – Sulawesi Tenggara 114,6 154,2 – – – – – –
Maluku 9,8 12,6 – – – – – – Maluku Utara 9,8 13,3 – – – – – – Papua 9,5 11,9 – – – – – – Papua Barat 3,5 4,6 – – – – – –
Indonesia 712,2 936,3 2 244,2 2 600,4 146,6 150,1 214,5 226,7
Catatan/Note: x Angka sementara/Preliminary figures Sumber/Source: Direktorat Jenderal Perkebunan/Directorate General of Estate Crops
http
://www.b
ps.g
o.id
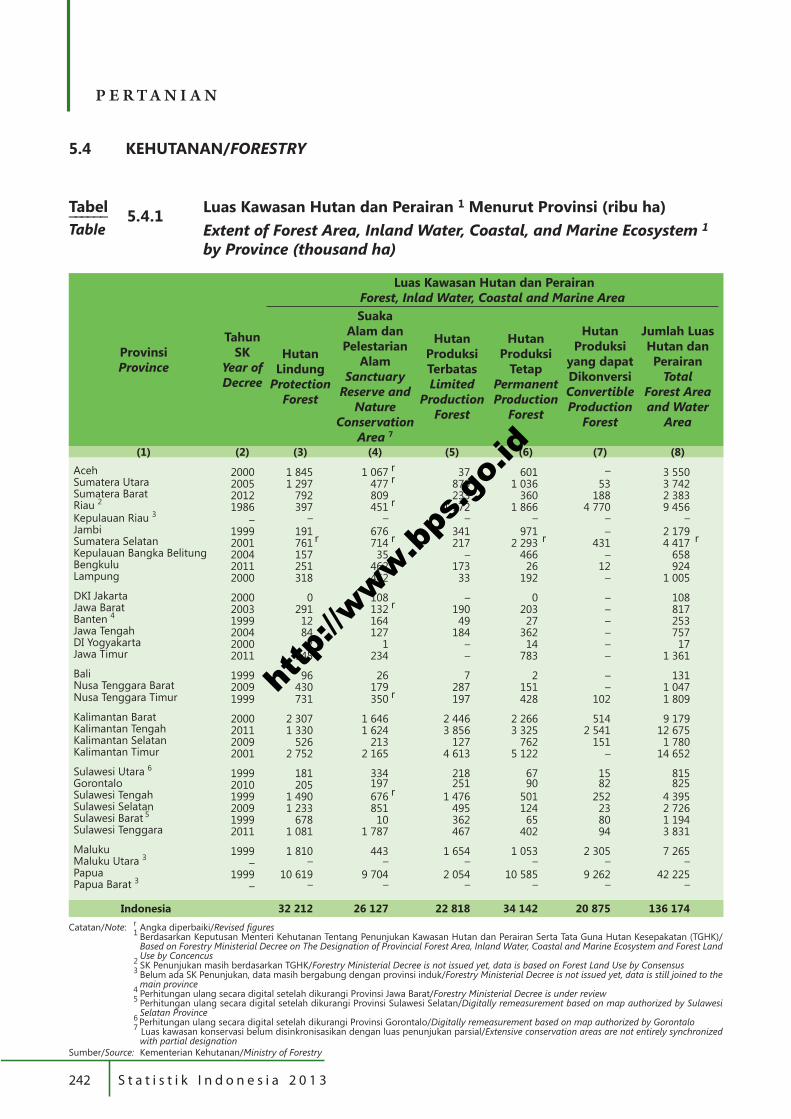
P E R T A N I A N
S t a t i s t i k I n d o n e s i a 2 0 1 3242
Luas Kawasan Hutan dan Perairan 1 Menurut Provinsi (ribu ha) Extent of Forest Area, Inland Water, Coastal, and Marine Ecosystem 1 by Province (thousand ha)
Tabel –––––– 5.4.1Table
5.4 KEHUTANAN/FORESTRY
ProvinsiProvince
Tahun SK
Year of Decree
Luas Kawasan Hutan dan PerairanForest, Inlad Water, Coastal and Marine Area
Hutan Lindung
Protection Forest
Suaka Alam dan
Pelestarian Alam
Sanctuary Reserve and
Nature Conservation
Area 7
Hutan Produksi TerbatasLimited
Production Forest
Hutan Produksi
Tetap Permanent Production
Forest
Hutan Produksi
yang dapat DikonversiConvertible Production
Forest
Jumlah Luas Hutan dan Perairan
Total Forest Area and Water
Area
(1) (2) (3) (4) (5) (6) (7) (8)
Aceh 2000 1 845 1 067 r 37 601 – 3 550Sumatera Utara 2005 1 297 477 r 879 1 036 53 3 742Sumatera Barat 2012 792 809 233 360 188 2 383Riau 2 1986 397 451 r 1 972 1 866 4 770 9 456Kepulauan Riau 3 – – – – – – –Jambi 1999 191 676 341 971 – 2 179Sumatera Selatan 2001 761 r 714 r 217 2 293 r 431 4 417 rKepulauan Bangka Belitung 2004 157 35 – 466 – 658Bengkulu 2011 251 462 r 173 26 12 924Lampung 2000 318 462 33 192 – 1 005DKI Jakarta 2000 0 108 – 0 – 108Jawa Barat 2003 291 132 r 190 203 – 817Banten 4 1999 12 164 49 27 – 253Jawa Tengah 2004 84 127 184 362 – 757DI Yogyakarta 2000 2 1 – 14 – 17Jawa Timur 2011 345 234 – 783 – 1 361Bali 1999 96 26 7 2 – 131Nusa Tenggara Barat 2009 430 179 287 151 – 1 047Nusa Tenggara Timur 1999 731 350 r 197 428 102 1 809Kalimantan Barat 2000 2 307 1 646 2 446 2 266 514 9 179Kalimantan Tengah 2011 1 330 1 624 3 856 3 325 2 541 12 675Kalimantan Selatan 2009 526 213 127 762 151 1 780Kalimantan Timur 2001 2 752 2 165 4 613 5 122 – 14 652Sulawesi Utara 6 1999 181 334 218 67 15 815Gorontalo 2010 205 197 251 90 82 825Sulawesi Tengah 1999 1 490 676 r 1 476 501 252 4 395Sulawesi Selatan 2009 1 233 851 495 124 23 2 726Sulawesi Barat 5 1999 678 10 362 65 80 1 194Sulawesi Tenggara 2011 1 081 1 787 467 402 94 3 831Maluku 1999 1 810 443 1 654 1 053 2 305 7 265Maluku Utara 3 – – – – – – –Papua 1999 10 619 9 704 2 054 10 585 9 262 42 225Papua Barat 3 – – – – – – –
Indonesia 32 212 26 127 22 818 34 142 20 875 136 174Catatan/Note: r Angka diperbaiki/Revised figures 1 Berdasarkan Keputusan Menteri Kehutanan Tentang Penunjukan Kawasan Hutan dan Perairan Serta Tata Guna Hutan Kesepakatan (TGHK)/
Based on Forestry Ministerial Decree on The Designation of Provincial Forest Area, Inland Water, Coastal and Marine Ecosystem and Forest Land Use by Concencus
2 SK Penunjukan masih berdasarkan TGHK/Forestry Ministerial Decree is not issued yet, data is based on Forest Land Use by Consensus 3 Belum ada SK Penunjukan, data masih bergabung dengan provinsi induk/Forestry Ministerial Decree is not issued yet, data is still joined to the
main province 4 Perhitungan ulang secara digital setelah dikurangi Provinsi Jawa Barat/Forestry Ministerial Decree is under review 5 Perhitungan ulang secara digital setelah dikurangi Provinsi Sulawesi Selatan/Digitally remeasurement based on map authorized by Sulawesi
Selatan Province 6 Perhitungan ulang secara digital setelah dikurangi Provinsi Gorontalo/Digitally remeasurement based on map authorized by Gorontalo 7 Luas kawasan konservasi belum disinkronisasikan dengan luas penunjukan parsial/Extensive conservation areas are not entirely synchronized
with partial designationSumber/Source: Kementerian Kehutanan/Ministry of Forestry
http
://www.b
ps.g
o.id

A G R I C U L T U R E
S t a t i s t i c a l Y e a r b o o k o f I n d o n e s i a 2 0 1 3 243
Luas Kegiatan Reboisasi (ha), 2007–2011Reforested Areas (ha), 2007–2011
Tabel –––––– 5.4.2Table
Provinsi/Province 2007 2008 2009 2010 2011
(1) (2) (3) (4) (5) (6)
Aceh 184 590 – 1 500 6 079Sumatera Utara 10 279 24 126 r 1 785 5 015 11 510Sumatera Barat 10 179 4 542 1 022 5 517 854Riau 160 3 750 1 725 8 536 3 615Kepulauan Riau 902 3 325 5 188 1 000 1 163Jambi 3 546 – – 53 355 3 690Sumatera Selatan – 2 500 – 1 558 1 760Kepulauan Bangka Belitung – 220 375 500 –Bengkulu – r 450 1 765 5 800 41 300Lampung 2 844 35 528 46 920 3 150 15 000
DKI Jakarta – 9 749 37 – –Jawa Barat 1 411 2 978 3 245 9 961 r 8 764Banten 4 700 4 310 260 3 560 –Jawa Tengah 2 483 5 323 r 7 050 4 341 200DI Yogyakarta 1 519 1 273 283 1 499 453Jawa Timur 200 17 689 15 998 17 713 1 500
Bali 2 950 966 530 821 685Nusa Tenggara Barat 6 950 14 488 3 991 1 550 2 300Nusa Tenggara Timur 1 183 21 193 1 340 1 565 4 485
Kalimantan Barat 415 9 527 1 457 5 795 5 000Kalimantan Tengah 528 15 544 3 422 – 5 000Kalimantan Selatan 73 1 200 – – 650Kalimantan Timur 2 645 1 200 – 1 900 1 700
Sulawesi Utara 1 785 12 205 1 590 1 400 1 350Gorontalo 8 950 3 155 – – 2 800Sulawesi Tengah 690 507 – – 3 000Sulawesi Selatan 7 543 26 545 4 872 1 728 9 120Sulawesi Barat 2 250 8 463 – – –Sulawesi Tenggara 755 12 365 8 200 2 195 5 000
Maluku 100 12 975 150 1 389 3 000Maluku Utara 506 5 348 1 043 1 235 1 102Papua 488 3 742 794 1 619 5 418Papua Barat – 1 290 – 900 5 000
Indonesia 76 218 267 066 113 042 145 102 151 498
Catatan/Note: r Angka diperbaiki/Revised figures Sumber/Source : Kementerian Kehutanan/Ministry of Forestry
http
://www.b
ps.g
o.id
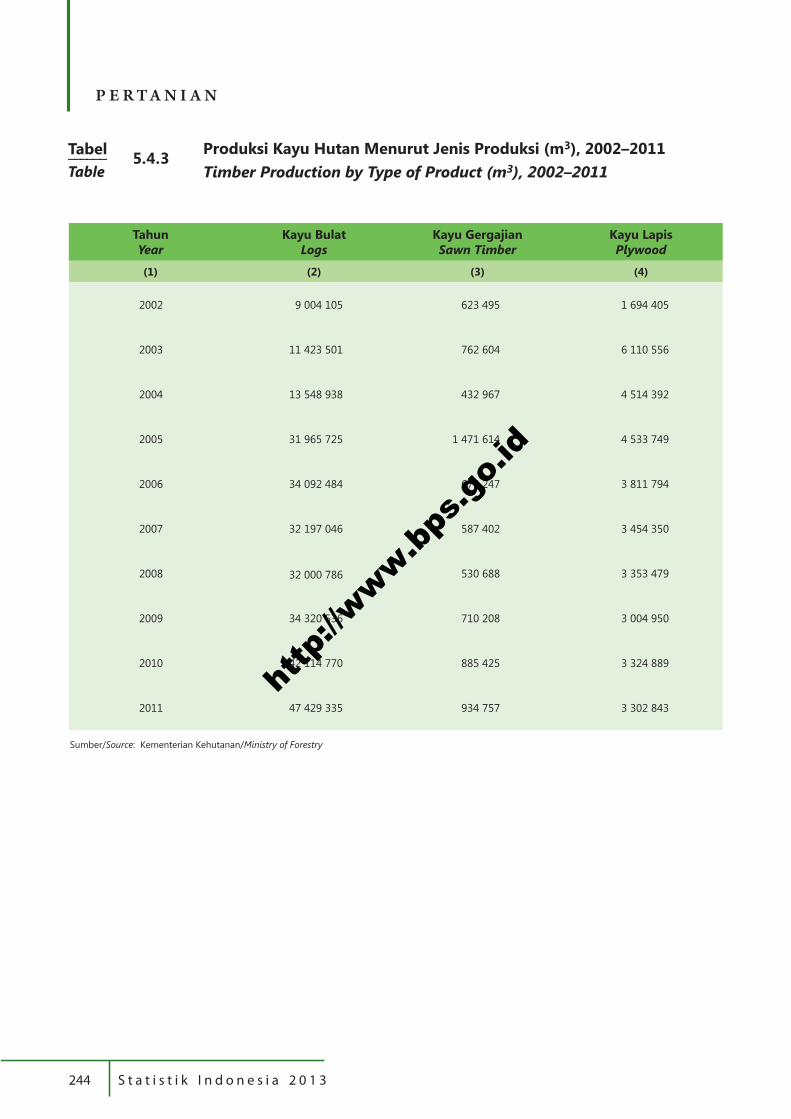
P E R T A N I A N
S t a t i s t i k I n d o n e s i a 2 0 1 3244
Produksi Kayu Hutan Menurut Jenis Produksi (m3), 2002–2011Timber Production by Type of Product (m3), 2002–2011
Tabel –––––– 5.4.3Table
TahunYear
Kayu BulatLogs
Kayu GergajianSawn Timber
Kayu LapisPlywood
(1) (2) (3) (4)
2002 9 004 105 623 495 1 694 405
2003 11 423 501 762 604 6 110 556
2004 13 548 938 432 967 4 514 392
2005 31 965 725 1 471 614 4 533 749
2006 34 092 484 679 247 3 811 794
2007 32 197 046 587 402 3 454 350
2008 32 000 786 530 688 3 353 479
2009 34 320 536 710 208 3 004 950
2010 42 114 770 885 425 3 324 889
2011 47 429 335 934 757 3 302 843
Sumber/Source: Kementerian Kehutanan/Ministry of Forestry
http
://www.b
ps.g
o.id
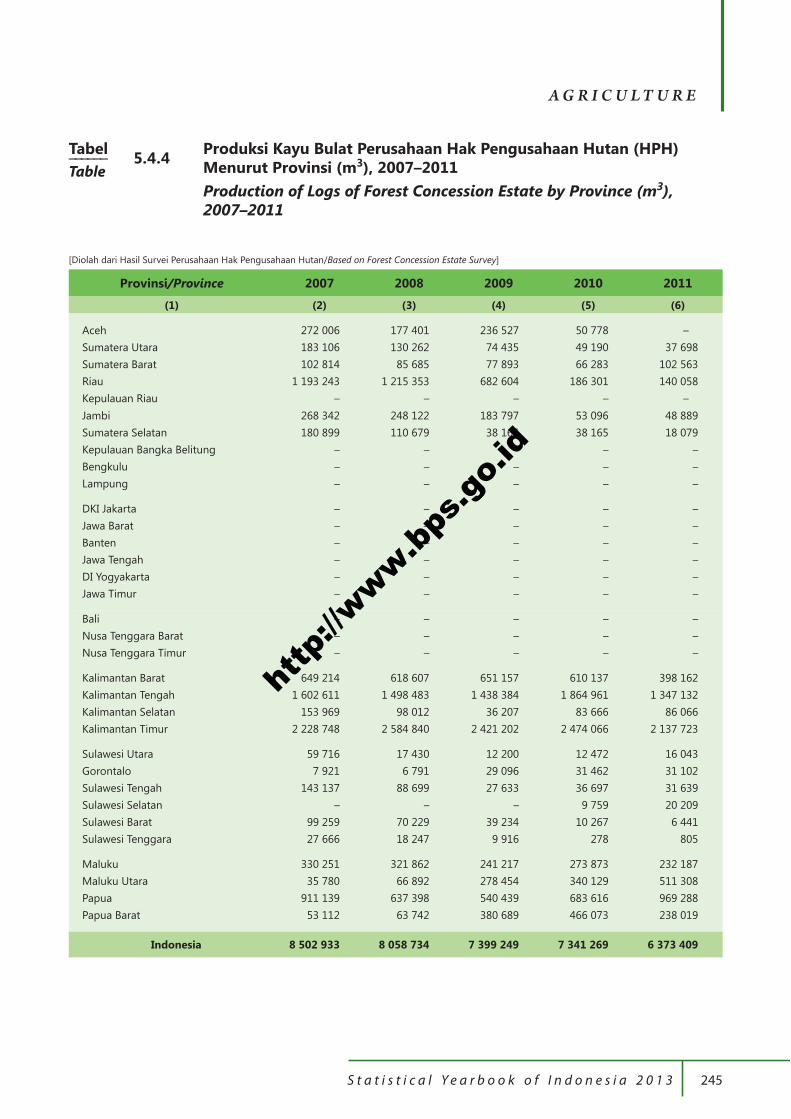
A G R I C U L T U R E
S t a t i s t i c a l Y e a r b o o k o f I n d o n e s i a 2 0 1 3 245
Produksi Kayu Bulat Perusahaan Hak Pengusahaan Hutan (HPH)Menurut Provinsi (m3), 2007–2011 Production of Logs of Forest Concession Estate by Province (m3), 2007–2011
Tabel –––––– 5.4.4Table
[Diolah dari Hasil Survei Perusahaan Hak Pengusahaan Hutan/Based on Forest Concession Estate Survey]
Provinsi/Province 2007 2008 2009 2010 2011
(1) (2) (3) (4) (5) (6)
Aceh 272 006 177 401 236 527 50 778 –Sumatera Utara 183 106 130 262 74 435 49 190 37 698Sumatera Barat 102 814 85 685 77 893 66 283 102 563Riau 1 193 243 1 215 353 682 604 186 301 140 058Kepulauan Riau – – – – –Jambi 268 342 248 122 183 797 53 096 48 889Sumatera Selatan 180 899 110 679 38 165 38 165 18 079Kepulauan Bangka Belitung – – – – –Bengkulu – – – – –Lampung – – – – –
DKI Jakarta – – – – –Jawa Barat – – – – –Banten – – – – –Jawa Tengah – – – – –DI Yogyakarta – – – – –Jawa Timur – – – – –
Bali – – – – –Nusa Tenggara Barat – – – – –Nusa Tenggara Timur – – – – –
Kalimantan Barat 649 214 618 607 651 157 610 137 398 162Kalimantan Tengah 1 602 611 1 498 483 1 438 384 1 864 961 1 347 132Kalimantan Selatan 153 969 98 012 36 207 83 666 86 066Kalimantan Timur 2 228 748 2 584 840 2 421 202 2 474 066 2 137 723
Sulawesi Utara 59 716 17 430 12 200 12 472 16 043Gorontalo 7 921 6 791 29 096 31 462 31 102Sulawesi Tengah 143 137 88 699 27 633 36 697 31 639Sulawesi Selatan – – – 9 759 20 209Sulawesi Barat 99 259 70 229 39 234 10 267 6 441Sulawesi Tenggara 27 666 18 247 9 916 278 805
Maluku 330 251 321 862 241 217 273 873 232 187Maluku Utara 35 780 66 892 278 454 340 129 511 308Papua 911 139 637 398 540 439 683 616 969 288Papua Barat 53 112 63 742 380 689 466 073 238 019
Indonesia 8 502 933 8 058 734 7 399 249 7 341 269 6 373 409
http
://www.b
ps.g
o.id
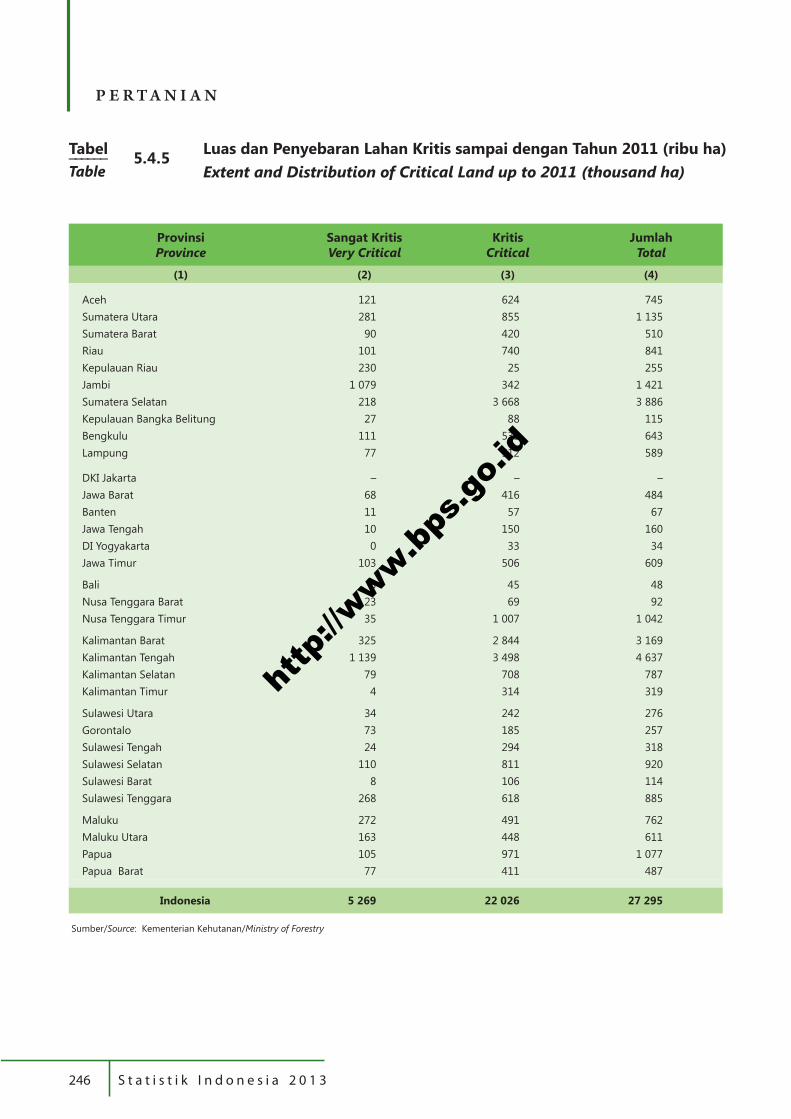
P E R T A N I A N
S t a t i s t i k I n d o n e s i a 2 0 1 3246
Luas dan Penyebaran Lahan Kritis sampai dengan Tahun 2011 (ribu ha)Extent and Distribution of Critical Land up to 2011 (thousand ha)
Tabel –––––– 5.4.5Table
ProvinsiProvince
Sangat KritisVery Critical
KritisCritical
JumlahTotal
(1) (2) (3) (4)
Aceh 121 624 745Sumatera Utara 281 855 1 135Sumatera Barat 90 420 510Riau 101 740 841Kepulauan Riau 230 25 255Jambi 1 079 342 1 421Sumatera Selatan 218 3 668 3 886Kepulauan Bangka Belitung 27 88 115Bengkulu 111 531 643Lampung 77 512 589
DKI Jakarta – – –Jawa Barat 68 416 484Banten 11 57 67Jawa Tengah 10 150 160DI Yogyakarta 0 33 34Jawa Timur 103 506 609
Bali 3 45 48Nusa Tenggara Barat 23 69 92Nusa Tenggara Timur 35 1 007 1 042
Kalimantan Barat 325 2 844 3 169Kalimantan Tengah 1 139 3 498 4 637Kalimantan Selatan 79 708 787Kalimantan Timur 4 314 319
Sulawesi Utara 34 242 276Gorontalo 73 185 257Sulawesi Tengah 24 294 318Sulawesi Selatan 110 811 920Sulawesi Barat 8 106 114Sulawesi Tenggara 268 618 885
Maluku 272 491 762Maluku Utara 163 448 611Papua 105 971 1 077Papua Barat 77 411 487
Indonesia 5 269 22 026 27 295
Sumber/Source: Kementerian Kehutanan/Ministry of Forestry
http
://www.b
ps.g
o.id

A G R I C U L T U R E
S t a t i s t i c a l Y e a r b o o k o f I n d o n e s i a 2 0 1 3 247
ProvinsiProvince
Sapi PerahMilk Cow
Sapi PotongCow
KerbauBuffalo
2011 2012 x 2011 2012 x 2011 2012 x
(1) (2) (3) (4) (5) (6) (7)
Aceh 0,0 0,0 462,8 483,6 131,5 134,1 Sumatera Utara 0,9 0,9 541,7 590,5 114,3 116,6 Sumatera Barat 0,5 0,6 327,0 349,0 100,3 108,1 Riau 0,2 0,2 159,9 179,5 37,7 39,1 Kepulauan Riau – – 17,3 17,4 0,0 0,0Jambi 0,1 0,1 119,9 125,5 46,5 47,8 Sumatera Selatan 0,2 0,2 246,3 265,6 29,1 29,5 Kepulauan Bangka Belitung 0,1 0,1 7,7 8,4 0,2 0,2 Bengkulu 0,2 0,3 98,9 104,8 20,0 21,5 Lampung 0,2 0,2 742,8 798,5 33,1 34,8
DKI Jakarta 2,7 3,0 1,7 0,8 0,2 0,2 Jawa Barat 140,0 148,0 423,0 441,4 130,2 128,8 Banten 0,0 0,0 46,9 50,9 123,1 123,5 Jawa Tengah 149,9 152,2 1 937,6 2 152,5 75,7 78,3 DI Yogyakarta 3,5 3,6 375,8 414,4 1,2 1,0 Jawa Timur 296,4 309,8 4 727,3 5 019,4 32,7 32,7
Bali 0,1 0,1 637,5 687,5 2,2 2,2 Nusa Tenggara Barat 0,0 0,0 685,8 827,7 105,4 144,1 Nusa Tenggara Timur 0,0 0,0 778,6 809,8 150,0 153,0
Kalimantan Barat 0,2 0,3 153,3 164,1 3,2 3,3 Kalimantan Tengah – – 54,6 59,4 6,5 6,8 Kalimantan Selatan 0,1 0,2 138,7 143,7 23,8 24,2 Kalimantan Timur 0,0 0,0 90,7 98,7 8,0 10,0
Sulawesi Utara 0,0 0,0 105,2 110,5 – – Gorontalo 0,0 0,0 183,9 203,0 0,0 0,0Sulawesi Tengah 0,0 0,0 230,7 249,8 3,3 3,4 Sulawesi Selatan 1,7 2,0 984,0 1 082,2 96,5 100,7 Sulawesi Barat 0,0 0,0 72,8 79,9 8,1 10,5 Sulawesi Tenggara – – 213,7 236,5 2,5 2,7
Maluku – – 74,0 78,9 17,6 19,5 Maluku Utara – – 60,8 64,1 0,9 0,2 Papua 0,0 0,0 81,8 86,8 1,2 1,3 Papua Barat – – 41,5 49,8 0,0 0,0
Indonesia 597,0 621,8 14 824,2 16 034,6 1 305,0 1 378,1
Populasi Ternak Menurut Provinsi dan Jenis Ternak (ribu ekor), 2011 dan 2012Livestock Population by Province and Kind of Livestock (thousand heads), 2011 and 2012
Tabel –––––– 5.5.1Table
5.5 PETERNAKAN LIVESTOCK
http
://www.b
ps.g
o.id
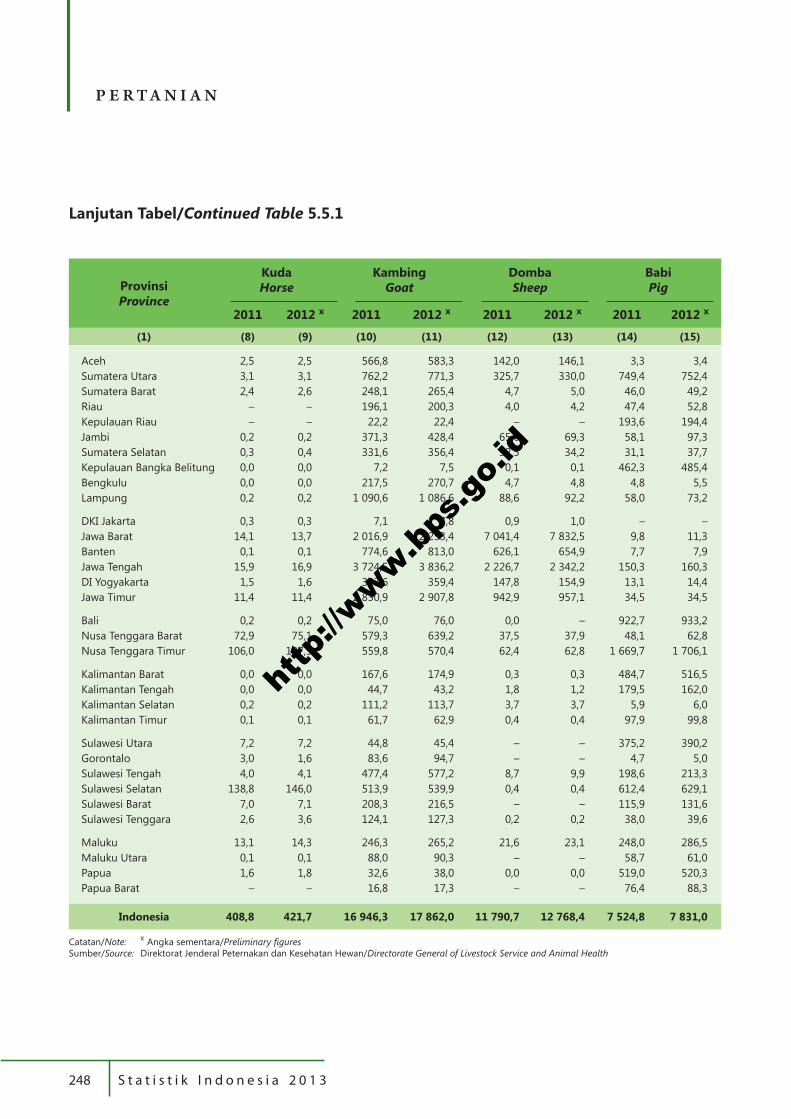
P E R T A N I A N
S t a t i s t i k I n d o n e s i a 2 0 1 3248
Lanjutan Tabel/Continued Table 5.5.1
ProvinsiProvince
KudaHorse
KambingGoat
DombaSheep
BabiPig
2011 2012 x 2011 2012 x 2011 2012 x 2011 2012 x
(1) (8) (9) (10) (11) (12) (13) (14) (15)
Aceh 2,5 2,5 566,8 583,3 142,0 146,1 3,3 3,4 Sumatera Utara 3,1 3,1 762,2 771,3 325,7 330,0 749,4 752,4 Sumatera Barat 2,4 2,6 248,1 265,4 4,7 5,0 46,0 49,2 Riau – – 196,1 200,3 4,0 4,2 47,4 52,8 Kepulauan Riau – – 22,2 22,4 – – 193,6 194,4 Jambi 0,2 0,2 371,3 428,4 65,6 69,3 58,1 97,3 Sumatera Selatan 0,3 0,4 331,6 356,4 32,5 34,2 31,1 37,7 Kepulauan Bangka Belitung 0,0 0,0 7,2 7,5 0,1 0,1 462,3 485,4 Bengkulu 0,0 0,0 217,5 270,7 4,7 4,8 4,8 5,5 Lampung 0,2 0,2 1 090,6 1 086,6 88,6 92,2 58,0 73,2
DKI Jakarta 0,3 0,3 7,1 7,8 0,9 1,0 – – Jawa Barat 14,1 13,7 2 016,9 2 253,4 7 041,4 7 832,5 9,8 11,3 Banten 0,1 0,1 774,6 813,0 626,1 654,9 7,7 7,9 Jawa Tengah 15,9 16,9 3 724,5 3 836,2 2 226,7 2 342,2 150,3 160,3 DI Yogyakarta 1,5 1,6 343,6 359,4 147,8 154,9 13,1 14,4 Jawa Timur 11,4 11,4 2 830,9 2 907,8 942,9 957,1 34,5 34,5
Bali 0,2 0,2 75,0 76,0 0,0 – 922,7 933,2 Nusa Tenggara Barat 72,9 75,1 579,3 639,2 37,5 37,9 48,1 62,8 Nusa Tenggara Timur 106,0 107,3 559,8 570,4 62,4 62,8 1 669,7 1 706,1
Kalimantan Barat 0,0 0,0 167,6 174,9 0,3 0,3 484,7 516,5 Kalimantan Tengah 0,0 0,0 44,7 43,2 1,8 1,2 179,5 162,0 Kalimantan Selatan 0,2 0,2 111,2 113,7 3,7 3,7 5,9 6,0 Kalimantan Timur 0,1 0,1 61,7 62,9 0,4 0,4 97,9 99,8
Sulawesi Utara 7,2 7,2 44,8 45,4 – – 375,2 390,2 Gorontalo 3,0 1,6 83,6 94,7 – – 4,7 5,0 Sulawesi Tengah 4,0 4,1 477,4 577,2 8,7 9,9 198,6 213,3 Sulawesi Selatan 138,8 146,0 513,9 539,9 0,4 0,4 612,4 629,1 Sulawesi Barat 7,0 7,1 208,3 216,5 – – 115,9 131,6 Sulawesi Tenggara 2,6 3,6 124,1 127,3 0,2 0,2 38,0 39,6
Maluku 13,1 14,3 246,3 265,2 21,6 23,1 248,0 286,5 Maluku Utara 0,1 0,1 88,0 90,3 – – 58,7 61,0 Papua 1,6 1,8 32,6 38,0 0,0 0,0 519,0 520,3 Papua Barat – – 16,8 17,3 – – 76,4 88,3
Indonesia 408,8 421,7 16 946,3 17 862,0 11 790,7 12 768,4 7 524,8 7 831,0
Catatan/Note: x Angka sementara/Preliminary figuresSumber/Source: Direktorat Jenderal Peternakan dan Kesehatan Hewan/Directorate General of Livestock Service and Animal Health
http
://www.b
ps.g
o.id
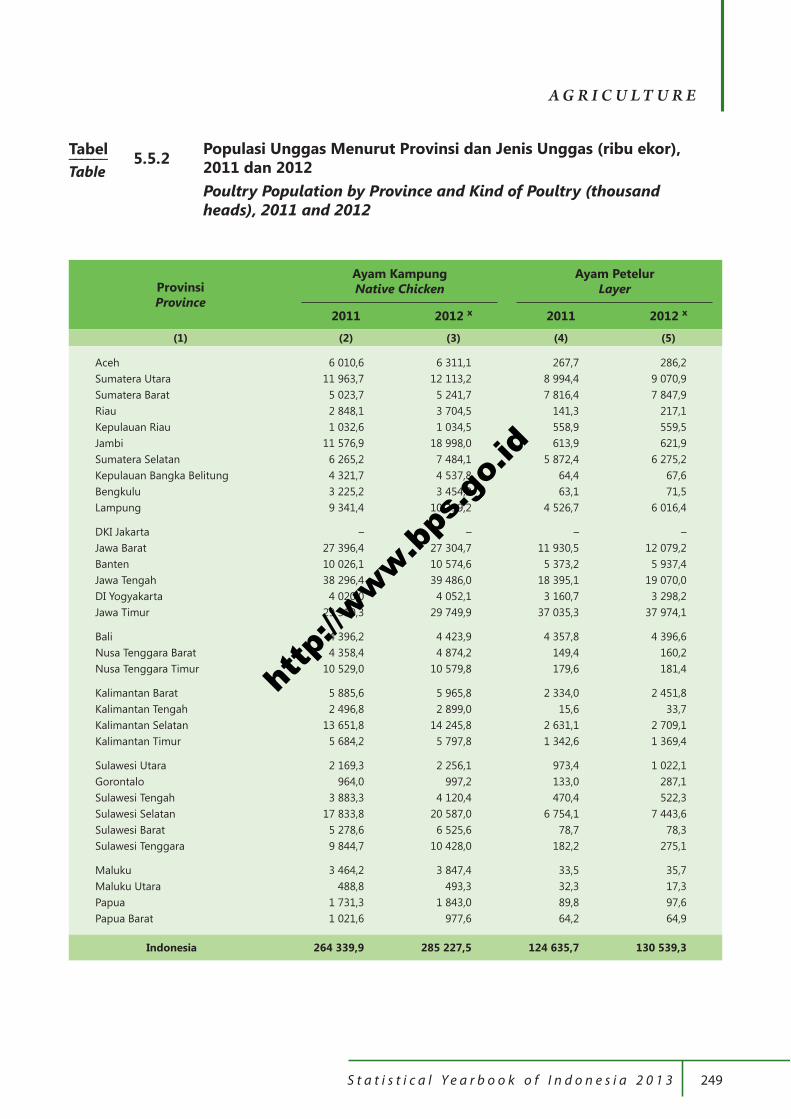
A G R I C U L T U R E
S t a t i s t i c a l Y e a r b o o k o f I n d o n e s i a 2 0 1 3 249
Populasi Unggas Menurut Provinsi dan Jenis Unggas (ribu ekor), 2011 dan 2012Poultry Population by Province and Kind of Poultry (thousand heads), 2011 and 2012
Tabel –––––– 5.5.2Table
ProvinsiProvince
Ayam KampungNative Chicken
Ayam PetelurLayer
2011 2012 x 2011 2012 x
(1) (2) (3) (4) (5)
Aceh 6 010,6 6 311,1 267,7 286,2 Sumatera Utara 11 963,7 12 113,2 8 994,4 9 070,9 Sumatera Barat 5 023,7 5 241,7 7 816,4 7 847,9 Riau 2 848,1 3 704,5 141,3 217,1 Kepulauan Riau 1 032,6 1 034,5 558,9 559,5 Jambi 11 576,9 18 998,0 613,9 621,9 Sumatera Selatan 6 265,2 7 484,1 5 872,4 6 275,2 Kepulauan Bangka Belitung 4 321,7 4 537,8 64,4 67,6 Bengkulu 3 225,2 3 454,2 63,1 71,5 Lampung 9 341,4 10 319,2 4 526,7 6 016,4
DKI Jakarta – – – – Jawa Barat 27 396,4 27 304,7 11 930,5 12 079,2 Banten 10 026,1 10 574,6 5 373,2 5 937,4 Jawa Tengah 38 296,4 39 486,0 18 395,1 19 070,0 DI Yogyakarta 4 020,0 4 052,1 3 160,7 3 298,2 Jawa Timur 29 310,3 29 749,9 37 035,3 37 974,1
Bali 4 396,2 4 423,9 4 357,8 4 396,6 Nusa Tenggara Barat 4 358,4 4 874,2 149,4 160,2 Nusa Tenggara Timur 10 529,0 10 579,8 179,6 181,4
Kalimantan Barat 5 885,6 5 965,8 2 334,0 2 451,8 Kalimantan Tengah 2 496,8 2 899,0 15,6 33,7 Kalimantan Selatan 13 651,8 14 245,8 2 631,1 2 709,1 Kalimantan Timur 5 684,2 5 797,8 1 342,6 1 369,4
Sulawesi Utara 2 169,3 2 256,1 973,4 1 022,1 Gorontalo 964,0 997,2 133,0 287,1 Sulawesi Tengah 3 883,3 4 120,4 470,4 522,3 Sulawesi Selatan 17 833,8 20 587,0 6 754,1 7 443,6 Sulawesi Barat 5 278,6 6 525,6 78,7 78,3 Sulawesi Tenggara 9 844,7 10 428,0 182,2 275,1
Maluku 3 464,2 3 847,4 33,5 35,7 Maluku Utara 488,8 493,3 32,3 17,3 Papua 1 731,3 1 843,0 89,8 97,6 Papua Barat 1 021,6 977,6 64,2 64,9
Indonesia 264 339,9 285 227,5 124 635,7 130 539,3
http
://www.b
ps.g
o.id

P E R T A N I A N
S t a t i s t i k I n d o n e s i a 2 0 1 3250
Lanjutan Tabel/Continued Table 5.5.2
ProvinsiProvince
Ayam PedagingBroiler
Itik/Itik ManilaDuck/Manila Duck
2011 2012 x 2011 2012 x
(1) (6) (7) (8) (9)
Aceh 3 085,3 3 301,2 2 328,9 2 443,0 Sumatera Utara 40 167,7 40 770,2 2 627,0 2 655,9 Sumatera Barat 15 117,3 15 247,4 1 123,3 1 201,9 Riau 38 043,7 39 761,1 274,0 338,0 Kepulauan Riau 6 675,5 6 720,6 108,9 109,0 Jambi 11 237,3 12 090,0 799,4 906,9 Sumatera Selatan 20 160,1 27 653,7 1 114,6 1 907,1 Kepulauan Bangka Belitung 7 418,2 7 789,1 32,8 34,5 Bengkulu 6 189,9 6 790,3 72,5 112,7 Lampung 25 788,9 28 348,6 618,9 620,9
DKI Jakarta 136,2 139,8 19,5 21,4 Jawa Barat 583 263,4 664 210,5 9 310,7 10 230,2 Banten 52 272,3 57 813,2 2 226,4 2 309,0 Jawa Tengah 66 239,7 55 621,1 5 451,5 5 955,4 DI Yogyakarta 5 770,8 5 898,5 516,5 535,6 Jawa Timur 149 552,7 148 520,8 3 884,3 3 942,5
Bali 6 206,6 6 252,6 761,3 775,0 Nusa Tenggara Barat 3 279,2 3 538,2 605,4 668,6 Nusa Tenggara Timur 578,8 582,7 277,1 285,2
Kalimantan Barat 21 262,4 12 215,4 441,4 441,1 Kalimantan Tengah 4 921,2 5 160,3 249,5 251,9 Kalimantan Selatan 43 647,8 44 191,1 4 488,5 4 638,9 Kalimantan Timur 36 510,4 38 446,6 223,8 226,1
Sulawesi Utara 1 557,0 1 634,8 114,4 116,1 Gorontalo 240,6 526,1 56,9 60,5 Sulawesi Tengah 5 136,2 5 906,6 331,9 428,5 Sulawesi Selatan 18 497,4 22 476,9 3 426,2 3 581,3 Sulawesi Barat 867,0 902,1 942,5 1 012,1 Sulawesi Tenggara 1 045,4 1 208,8 509,8 562,6
Maluku 145,7 130,5 406,7 443,8 Maluku Utara 79,5 251,2 41,8 62,3 Papua 2 247,8 2 360,7 81,7 85,0 Papua Barat 648,9 442,0 19,7 26,5
Indonesia 1 177 990,9 1 266 902,7 43 487,8 46 989,5
Catatan/Note: x Angka sementara/Preliminary figuresSumber/Source: Direktorat Jenderal Peternakan dan Kesehatan Hewan/Directorate General of Livestock Service and Animal Health
http
://www.b
ps.g
o.id
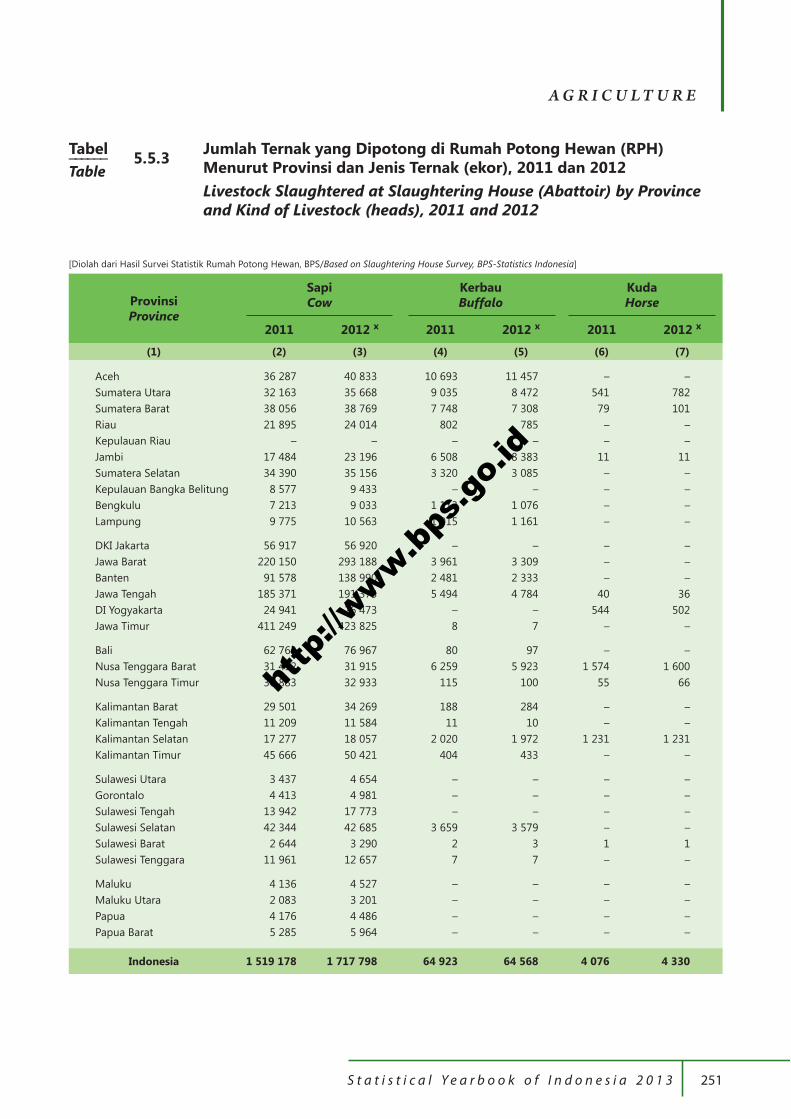
A G R I C U L T U R E
S t a t i s t i c a l Y e a r b o o k o f I n d o n e s i a 2 0 1 3 251
Jumlah Ternak yang Dipotong di Rumah Potong Hewan (RPH) Menurut Provinsi dan Jenis Ternak (ekor), 2011 dan 2012Livestock Slaughtered at Slaughtering House (Abattoir) by Province and Kind of Livestock (heads), 2011 and 2012
Tabel –––––– 5.5.3Table
[Diolah dari Hasil Survei Statistik Rumah Potong Hewan, BPS/Based on Slaughtering House Survey, BPS-Statistics Indonesia]
ProvinsiProvince
SapiCow
KerbauBuffalo
KudaHorse
2011 2012 x 2011 2012 x 2011 2012 x
(1) (2) (3) (4) (5) (6) (7)
Aceh 36 287 40 833 10 693 11 457 – – Sumatera Utara 32 163 35 668 9 035 8 472 541 782 Sumatera Barat 38 056 38 769 7 748 7 308 79 101 Riau 21 895 24 014 802 785 – – Kepulauan Riau – – – – – – Jambi 17 484 23 196 6 508 8 383 11 11 Sumatera Selatan 34 390 35 156 3 320 3 085 – – Kepulauan Bangka Belitung 8 577 9 433 – – – – Bengkulu 7 213 9 033 1 113 1 076 – – Lampung 9 775 10 563 1 015 1 161 – –
DKI Jakarta 56 917 56 920 – – – – Jawa Barat 220 150 293 188 3 961 3 309 – – Banten 91 578 138 990 2 481 2 333 – – Jawa Tengah 185 371 191 373 5 494 4 784 40 36DI Yogyakarta 24 941 26 473 – – 544 502 Jawa Timur 411 249 423 825 8 7 – –
Bali 62 763 76 967 80 97 – – Nusa Tenggara Barat 31 412 31 915 6 259 5 923 1 574 1 600 Nusa Tenggara Timur 30 883 32 933 115 100 55 66
Kalimantan Barat 29 501 34 269 188 284 – – Kalimantan Tengah 11 209 11 584 11 10 – – Kalimantan Selatan 17 277 18 057 2 020 1 972 1 231 1 231 Kalimantan Timur 45 666 50 421 404 433 – –
Sulawesi Utara 3 437 4 654 – – – – Gorontalo 4 413 4 981 – – – – Sulawesi Tengah 13 942 17 773 – – – – Sulawesi Selatan 42 344 42 685 3 659 3 579 – – Sulawesi Barat 2 644 3 290 2 3 1 1 Sulawesi Tenggara 11 961 12 657 7 7 – –
Maluku 4 136 4 527 – – – – Maluku Utara 2 083 3 201 – – – – Papua 4 176 4 486 – – – – Papua Barat 5 285 5 964 – – – –
Indonesia 1 519 178 1 717 798 64 923 64 568 4 076 4 330
http
://www.b
ps.g
o.id

P E R T A N I A N
S t a t i s t i k I n d o n e s i a 2 0 1 3252
Lanjutan Tabel/Continued Table 5.5.3
ProvinsiProvince
KambingGoat
DombaSheep
BabiPig
2011 2012 x 2011 2012 x 2011 2012 x
(1) (8) (9) (10) (11) (12) (13)
Aceh 42 721 47 693 4 080 6 782 2 702 2 747 Sumatera Utara 25 738 24 229 6 382 6 150 144 119 158 718 Sumatera Barat 7 074 10 762 – – – – Riau 229 348 – – – – Kepulauan Riau – – – – – – Jambi 12 739 18 143 3 689 4 700 4 508 3 262 Sumatera Selatan 26 170 25 950 2 183 2 090 10 723 9 917 Kepulauan Bangka Belitung 94 107 – – 16 037 16 722 Bengkulu 3 037 2 922 901 930 – – Lampung 17 892 18 764 568 581 1 996 2 481
DKI Jakarta 30 904 33 407 – – 163 059 157 592 Jawa Barat 45 604 88 697 95 711 101 840 17 095 17 850Banten 1 955 1 918 1 636 1 514 – – Jawa Tengah 155 048 144 689 83 219 78 608 14 963 14 161 DI Yogyakarta 39 898 51 124 64 917 83 020 4 296 4 452 Jawa Timur 119 875 114 109 20 338 18 402 47 875 52 452
Bali 56 362 61 940 – – 281 183 319 103 Nusa Tenggara Barat 8 390 9 324 447 745 2 019 1 887Nusa Tenggara Timur 11 825 14 533 644 895 24 349 27 729
Kalimantan Barat 3 365 3 426 – – 64 347 85 049 Kalimantan Tengah 5 250 5 462 – – 19 912 22 883 Kalimantan Selatan 4 150 6 029 872 1 300 – – Kalimantan Timur 25 710 32 321 – – 3 722 4 195
Sulawesi Utara 2 417 3 038 – – 13 181 16 885 Gorontalo 198 150 – – – – Sulawesi Tengah 1 298 1 532 19 11 1 624 1 982 Sulawesi Selatan 5 078 5 102 70 75 4 930 4 445 Sulawesi Barat 133 436 – – – – Sulawesi Tenggara 346 325 – – 40 29
Maluku – – – – 3 335 4 301 Maluku Utara 564 475 – – 8 801 8 801 Papua 583 2 644 – – 2 152 3 427 Papua Barat 870 878 – – 2 578 2 724
Indonesia 655 517 729 230 285 676 307 643 859 546 943 794
Catatan/Note: x Angka sementara/Preliminary figures
http
://www.b
ps.g
o.id

A G R I C U L T U R E
S t a t i s t i c a l Y e a r b o o k o f I n d o n e s i a 2 0 1 3 253
Produksi Daging Ternak Menurut Provinsi dan Jenis Ternak (ton), 2011 dan 2012Meat Production by Province and Kind of Livestock (ton), 2011 and 2012
Tabel –––––– 5.5.4Table
ProvinsiProvince
SapiCow
KerbauBuffalo
KudaHorse
2011 2012 x 2011 2012 x 2011 2012 x
(1) (2) (3) (4) (5) (6) (7)
Aceh 8 303 8 677 2 835 3 118 – – Sumatera Utara 18 299 18 757 4 942 5 437 111 112 Sumatera Barat 20 287 20 898 2 459 2 598 21 22 Riau 12 658 12 834 1 450 1 454 – – Kepulauan Riau 532 647 – – – – Jambi 6 515 7 013 2 519 2 420 2 2 Sumatera Selatan 13 601 14 202 1 019 1 303 – – Kepulauan Bangka Belitung 3 932 3 971 890 95 – – Bengkulu 3 276 3 644 970 1 038 – – Lampung 10 064 10 384 454 467 – –
DKI Jakarta 9 413 9 696 50 51 – – Jawa Barat 78 476 84 128 2 557 2 404 30 29 Banten 25 806 27 695 5 056 5 072 – – Jawa Tengah 60 322 62 462 2 267 2 290 2 2 DI Yogyakarta 7 657 7 734 – – 44 36 Jawa Timur 112 447 114 749 410 419 13 14
Bali 8 081 8 403 8 8 – – Nusa Tenggara Barat 10 958 12 252 2 703 2 453 356 342 Nusa Tenggara Timur 8 668 11 262 1 483 1 480 659 664
Kalimantan Barat 10 437 9 064 33 53 – – Kalimantan Tengah 3 116 3 142 26 28 – – Kalimantan Selatan 8 459 8 904 785 604 9 8 Kalimantan Timur 8 240 8 652 170 174 – –
Sulawesi Utara 4 446 4 750 – – – – Gorontalo 3 985 4 052 – – – – Sulawesi Tengah 3 058 3 366 23 27 17 18 Sulawesi Selatan 11 026 11 136 1 821 1 839 868 877 Sulawesi Barat 3 917 2 526 91 117 12 12 Sulawesi Tenggara 2 709 3 130 3 2 9 9
Maluku 1 320 1 409 222 246 32 34 Maluku Utara 274 330 – – – – Papua 2 737 2 952 84 92 – – Papua Barat 2 316 2 657 – – – –
Indonesia 485 335 505 478 35 330 35 289 2 185 2 181
http
://www.b
ps.g
o.id
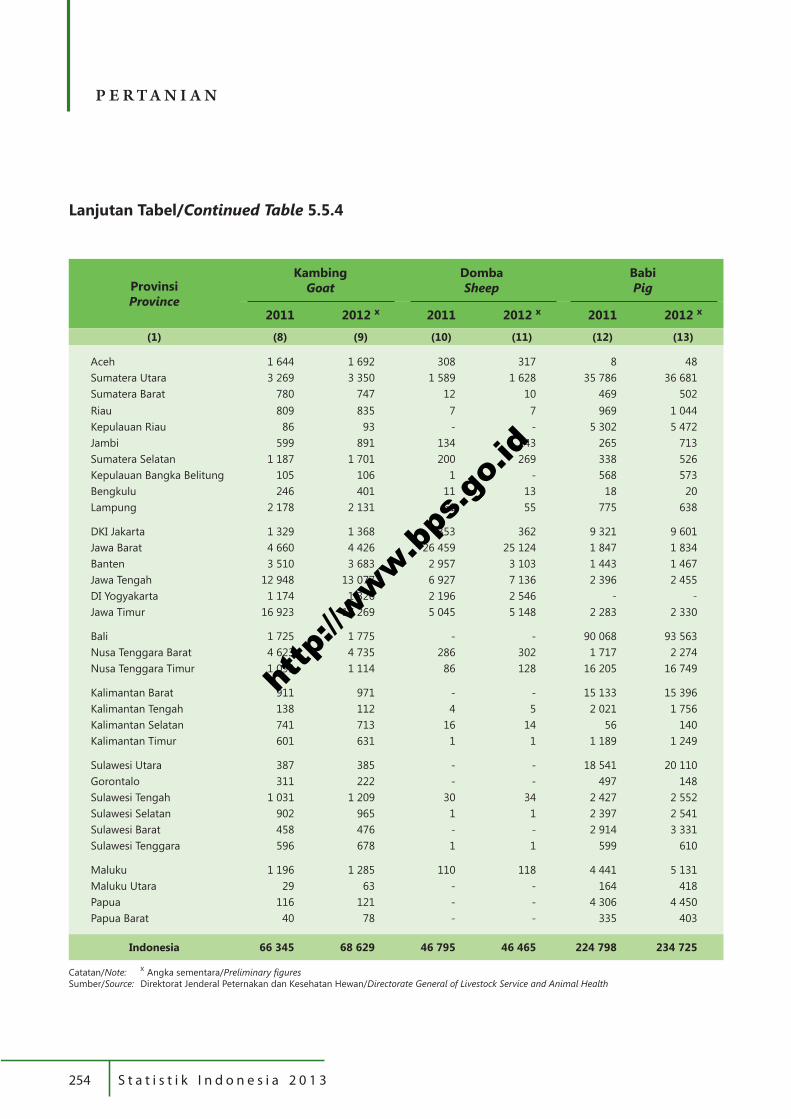
P E R T A N I A N
S t a t i s t i k I n d o n e s i a 2 0 1 3254
Lanjutan Tabel/Continued Table 5.5.4
ProvinsiProvince
KambingGoat
DombaSheep
BabiPig
2011 2012 x 2011 2012 x 2011 2012 x
(1) (8) (9) (10) (11) (12) (13)
Aceh 1 644 1 692 308 317 8 48 Sumatera Utara 3 269 3 350 1 589 1 628 35 786 36 681 Sumatera Barat 780 747 12 10 469 502 Riau 809 835 7 7 969 1 044 Kepulauan Riau 86 93 - - 5 302 5 472 Jambi 599 891 134 143 265 713 Sumatera Selatan 1 187 1 701 200 269 338 526 Kepulauan Bangka Belitung 105 106 1 - 568 573 Bengkulu 246 401 11 13 18 20 Lampung 2 178 2 131 61 55 775 638
DKI Jakarta 1 329 1 368 353 362 9 321 9 601 Jawa Barat 4 660 4 426 26 459 25 124 1 847 1 834 Banten 3 510 3 683 2 957 3 103 1 443 1 467 Jawa Tengah 12 948 13 077 6 927 7 136 2 396 2 455 DI Yogyakarta 1 174 1 326 2 196 2 546 - - Jawa Timur 16 923 17 269 5 045 5 148 2 283 2 330
Bali 1 725 1 775 - - 90 068 93 563 Nusa Tenggara Barat 4 623 4 735 286 302 1 717 2 274 Nusa Tenggara Timur 1 093 1 114 86 128 16 205 16 749
Kalimantan Barat 911 971 - - 15 133 15 396 Kalimantan Tengah 138 112 4 5 2 021 1 756 Kalimantan Selatan 741 713 16 14 56 140 Kalimantan Timur 601 631 1 1 1 189 1 249
Sulawesi Utara 387 385 - - 18 541 20 110 Gorontalo 311 222 - - 497 148 Sulawesi Tengah 1 031 1 209 30 34 2 427 2 552 Sulawesi Selatan 902 965 1 1 2 397 2 541 Sulawesi Barat 458 476 - - 2 914 3 331 Sulawesi Tenggara 596 678 1 1 599 610
Maluku 1 196 1 285 110 118 4 441 5 131 Maluku Utara 29 63 - - 164 418 Papua 116 121 - - 4 306 4 450 Papua Barat 40 78 - - 335 403
Indonesia 66 345 68 629 46 795 46 465 224 798 234 725
Catatan/Note: x Angka sementara/Preliminary figuresSumber/Source: Direktorat Jenderal Peternakan dan Kesehatan Hewan/Directorate General of Livestock Service and Animal Health
http
://www.b
ps.g
o.id
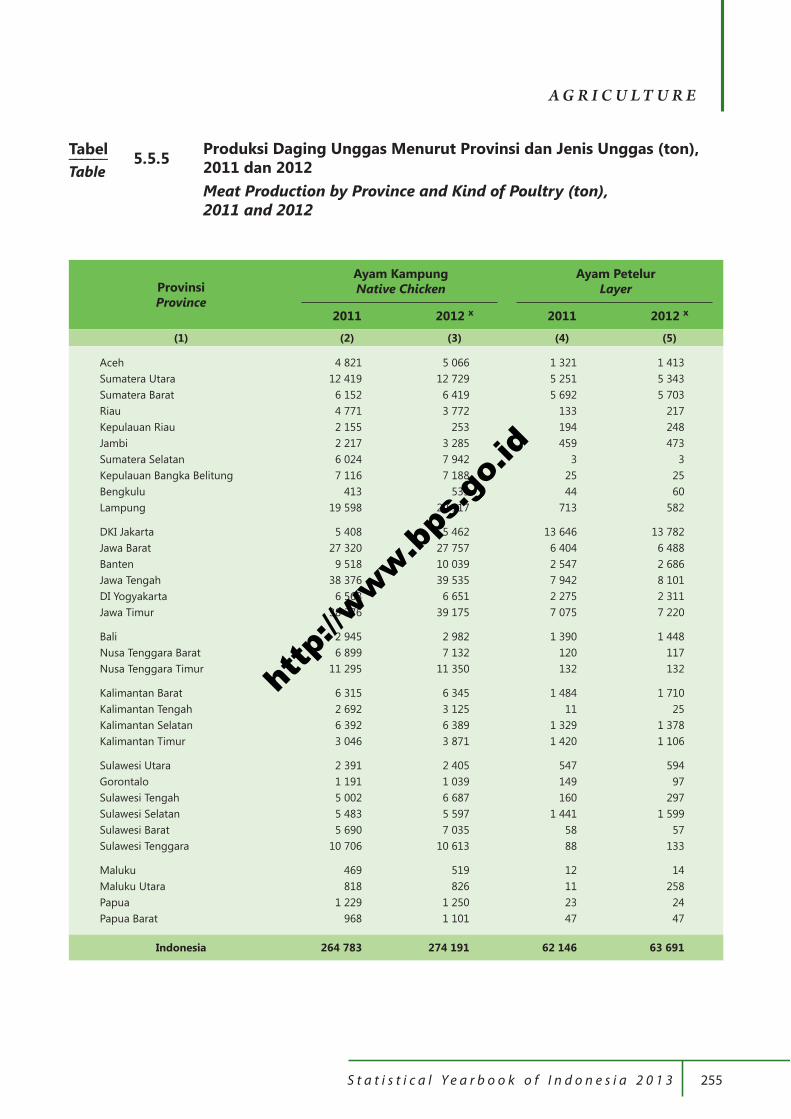
A G R I C U L T U R E
S t a t i s t i c a l Y e a r b o o k o f I n d o n e s i a 2 0 1 3 255
Produksi Daging Unggas Menurut Provinsi dan Jenis Unggas (ton), 2011 dan 2012Meat Production by Province and Kind of Poultry (ton), 2011 and 2012
Tabel –––––– 5.5.5Table
ProvinsiProvince
Ayam KampungNative Chicken
Ayam PetelurLayer
2011 2012 x 2011 2012 x
(1) (2) (3) (4) (5)
Aceh 4 821 5 066 1 321 1 413 Sumatera Utara 12 419 12 729 5 251 5 343 Sumatera Barat 6 152 6 419 5 692 5 703 Riau 4 771 3 772 133 217 Kepulauan Riau 2 155 253 194 248 Jambi 2 217 3 285 459 473 Sumatera Selatan 6 024 7 942 3 3 Kepulauan Bangka Belitung 7 116 7 188 25 25 Bengkulu 413 535 44 60 Lampung 19 598 20 117 713 582
DKI Jakarta 5 408 5 462 13 646 13 782 Jawa Barat 27 320 27 757 6 404 6 488 Banten 9 518 10 039 2 547 2 686 Jawa Tengah 38 376 39 535 7 942 8 101 DI Yogyakarta 6 568 6 651 2 275 2 311 Jawa Timur 38 376 39 175 7 075 7 220
Bali 2 945 2 982 1 390 1 448 Nusa Tenggara Barat 6 899 7 132 120 117 Nusa Tenggara Timur 11 295 11 350 132 132
Kalimantan Barat 6 315 6 345 1 484 1 710 Kalimantan Tengah 2 692 3 125 11 25 Kalimantan Selatan 6 392 6 389 1 329 1 378 Kalimantan Timur 3 046 3 871 1 420 1 106
Sulawesi Utara 2 391 2 405 547 594 Gorontalo 1 191 1 039 149 97 Sulawesi Tengah 5 002 6 687 160 297 Sulawesi Selatan 5 483 5 597 1 441 1 599 Sulawesi Barat 5 690 7 035 58 57 Sulawesi Tenggara 10 706 10 613 88 133
Maluku 469 519 12 14 Maluku Utara 818 826 11 258 Papua 1 229 1 250 23 24 Papua Barat 968 1 101 47 47
Indonesia 264 783 274 191 62 146 63 691
http
://www.b
ps.g
o.id

P E R T A N I A N
S t a t i s t i k I n d o n e s i a 2 0 1 3256
ProvinsiProvince
Ayam PedagingBroiler
Itik/Itik ManilaDuck/Manila Duck
2011 2012 x 2011 2012 x
(1) (6) (7) (8) (9)
Aceh 6 439 6 890 814 855 Sumatera Utara 47 051 48 227 1 289 1 318 Sumatera Barat 16 441 16 583 657 703 Riau 34 910 36 486 173 199 Kepulauan Riau 6 155 7 579 144 154 Jambi 13 360 13 502 125 226 Sumatera Selatan 31 36 1 1 Kepulauan Bangka Belitung 13 368 13 502 82 83 Bengkulu 2 358 3 022 13 15 Lampung 27 149 27 571 97 107
DKI Jakarta 108 642 109 728 3 315 3 348 Jawa Barat 492 413 565 973 6 417 7 202 Banten 114 568 117 204 4 789 4 972 Jawa Tengah 104 774 107 939 2 651 2 704 DI Yogyakarta 31 295 31 721 467 475 Jawa Timur 159 822 163 093 2 481 2 531
Bali 23 750 24 275 251 261 Nusa Tenggara Barat 15 176 16 721 356 381 Nusa Tenggara Timur 525 528 61 61
Kalimantan Barat 19 284 11 079 251 277 Kalimantan Tengah 4 463 4 680 156 158 Kalimantan Selatan 39 319 36 328 1 516 2 296 Kalimantan Timur 27 943 29 425 175 305
Sulawesi Utara 5 164 5 422 69 74 Gorontalo 218 477 36 36 Sulawesi Tengah 5 952 6 742 80 112 Sulawesi Selatan 11 594 1 096 668 682 Sulawesi Barat 786 818 591 635 Sulawesi Tenggara 948 1 096 204 320
Maluku 125 112 187 203 Maluku Utara 1 021 3 228 2 3 Papua 2 277 2 453 55 56 Papua Barat 588 401 11 12
Indonesia 1 337 909 1 413 937 28 184 30 765
Lanjutan Tabel/Continued Table 5.5.5
Catatan/Note: x Angka sementara/Preliminary figuresSumber/Source: Direktorat Jenderal Peternakan dan Kesehatan Hewan/Directorate General of Livestock Service and Animal Health
http
://www.b
ps.g
o.id

A G R I C U L T U R E
S t a t i s t i c a l Y e a r b o o k o f I n d o n e s i a 2 0 1 3 257
Produksi Telur Unggas dan Susu Sapi Menurut Provinsi (ton), 2011 dan 2012Production of Poultry Eggs and Cow Milk by Province (ton), 2011 and 2012
Tabel –––––– 5.5.6Table
ProvinsiProvince
Ayam KampungNative Chicken
Ayam PetelurLayer
2011 2012 x 2011 2012 x
(1) (2) (3) (4) (5)
Aceh 4 195 2 684 2 419 2 586 Sumatera Utara 9 669 9 777 79 204 80 590 Sumatera Barat 3 752 3 209 60 148 60 264 Riau 971 1 475 1 384 1 089 Kepulauan Riau 1 874 1 986 7 129 8 059 Jambi 2 357 4 862 4 771 3 978 Sumatera Selatan 2 919 9 523 48 726 49 778 Kepulauan Bangka Belitung 3 983 5 463 593 497 Bengkulu 510 1 177 582 605 Lampung 9 064 8 064 44 878 52 891
DKI Jakarta – – – – Jawa Barat 16 801 21 330 115 787 118 945 Banten 5 997 7 051 57 626 58 951 Jawa Tengah 34 264 37 077 179 974 185 391 DI Yogyakarta 1 840 1 945 26 111 26 851 Jawa Timur 16 621 19 076 235 832 244 379
Bali 3 373 3 216 36 606 37 759 Nusa Tenggara Barat 1 915 2 798 1 268 1 235 Nusa Tenggara Timur 4 287 6 725 1 385 1 385
Kalimantan Barat 3 058 3 759 15 613 17 995 Kalimantan Tengah 1 595 1 852 120 260 Kalimantan Selatan 11 162 9 099 20 286 20 887 Kalimantan Timur 2 659 2 659 8 032 12 164
Sulawesi Utara 1 722 1 798 7 838 8 517 Gorontalo 9 942 616 1 565 1 025 Sulawesi Tengah 2 249 2 472 5 297 5 881 Sulawesi Selatan 6 990 11 391 50 003 52 074 Sulawesi Barat 1 495 4 168 607 604 Sulawesi Tenggara 4 501 6 288 1 369 1 405
Maluku 797 984 348 371 Maluku Utara 320 11 024 10 838 1 253 Papua 1 025 1 067 1 013 1 102 Papua Barat 308 653 494 495
Indonesia 172 215 205 268 1 027 846 1 059 266
http
://www.b
ps.g
o.id

P E R T A N I A N
S t a t i s t i k I n d o n e s i a 2 0 1 3258
Lanjutan Tabel / Continued Table 5.5.6
ProvinsiProvince
Itik/Itik ManilaDuck/Manila Duck
Sapi PerahMilk Cow
2011 2012 x 2011 2012 x
(1) (6) (7) (8) (9)
Aceh 9 258 9 712 33 33 Sumatera Utara 12 319 12 594 1 850 644 Sumatera Barat 6 302 6 167 741 842 Riau 1 305 1 504 164 275 Kepulauan Riau 944 975 – – Jambi 3 376 3 741 – – Sumatera Selatan 4 736 5 082 62 126 Kepulauan Bangka Belitung 482 180 185 199 Bengkulu 329 352 356 405 Lampung 3 017 3 027 162 170
DKI Jakarta 134 133 5 345 5 787 Jawa Barat 63 523 70 447 302 603 326 115 Banten 15 007 19 485 1 1 Jawa Tengah 33 664 35 465 104 141 106 224 DI Yogyakarta 4 426 4 479 3 167 3 260 Jawa Timur 26 580 27 470 551 977 570 082
Bali 4 752 4 883 175 132 Nusa Tenggara Barat 3 119 3 337 28 28 Nusa Tenggara Timur 1 521 1 521 – –
Kalimantan Barat 2 199 2 423 110 347 Kalimantan Tengah 1 370 1 383 – – Kalimantan Selatan 24 642 25 467 168 249 Kalimantan Timur 861 1 156 – –
Sulawesi Utara 704 736 – – Gorontalo 311 312 32 24 Sulawesi Tengah 2 390 3 085 – – Sulawesi Selatan 17 262 18 810 3 363 2 898 Sulawesi Barat 5 174 5 556 20 72 Sulawesi Tenggara 2 296 2 799 – –
Maluku 1 440 1 571 – – Maluku Utara 2 098 1 673 – – Papua 559 582 11 17 Papua Barat 98 108 – –
Indonesia 256 198 276 215 974 694 1 017 930
Catatan/Note: x Angka sementara/Preliminary figuresSumber/Source: Direktorat Jenderal Peternakan dan Kesehatan Hewan/Directorate General of Livestock Service and Animal Health
http
://www.b
ps.g
o.id

A G R I C U L T U R E
S t a t i s t i c a l Y e a r b o o k o f I n d o n e s i a 2 0 1 3 259
Jumlah Rumah Tangga Perikanan Tangkap Menurut Provinsi dan Subsektor, 2010 dan 2011Number of Fish Capture Households by Province and Fishery Subsector, 2010 and 2011
Tabel –––––– 5.6.1Table
5.6 PERIKANAN FISHERY
ProvinsiProvince
Perikanan LautMarine Fisheries
Perairan UmumInland Water
JumlahTotal
2010 2011 2010 2011 2010 2011
(1) (2) (3) (4) (5) (6) (7)
Aceh 16 407 17 151 2 096 3 167 18 503 20 318Sumatera Utara 31 872 33 331 10 063 12 173 41 935 45 504Sumatera Barat 9 276 9 574 10 713 9 116 19 989 18 690Riau 13 946 13 933 10 355 11 397 24 301 25 330Kepulauan Riau 25 859 25 667 – – 25 859 25 667Jambi 2 417 2 629 8 679 8 525 11 096 11 154Sumatera Selatan 7 205 7 073 50 025 51 388 57 230 58 461Kepulauan Bangka Belitung 16 933 17 526 – – 16 933 17 526Bengkulu 7 757 8 185 4 039 4 487 11 796 12 672Lampung 8 773 7 673 6 459 7 418 15 232 15 091
DKI Jakarta 4 178 3 322 – – 4 178 3 322Jawa Barat 19 950 19 610 37 111 26 486 57 061 46 096Banten 6 425 5 851 797 648 7 222 6 499Jawa Tengah 21 761 21 971 33 733 35 299 55 494 57 270DI Yogyakarta 1 021 1 128 2 523 2 340 3 544 3 468Jawa Timur 57 018 59 654 25 441 27 065 82 459 86 719
Bali 16 771 15 954 5 400 4 848 22 171 20 802Nusa Tenggara Barat 21 165 20 559 3 405 3 427 24 570 23 986Nusa Tenggara Timur 23 813 15 441 – – 23 813 15 441
Kalimantan Barat 9 861 12 017 5 260 5 659 15 121 17 676Kalimantan Tengah 6 841 6 407 19 529 19 801 26 370 26 208Kalimantan Selatan 9 294 9 260 35 212 37 316 44 506 46 576Kalimantan Timur 24 490 27 704 16 123 24 497 40 613 52 201
Sulawesi Utara 19 250 18 824 2 333 2 299 21 583 21 123Gorontalo 7 596 7 779 722 709 8 318 8 488Sulawesi Tengah 33 343 40 922 603 133 33 946 41 055Sulawesi Selatan 32 276 32 717 5 693 9 405 37 969 42 122Sulawesi Barat 12 702 14 178 – – 12 702 14 178Sulawesi Tenggara 26 056 26 054 2 476 2 504 28 532 28 558
Maluku 37 041 44 543 122 24 37 163 44 567Maluku Utara 3 070 2 905 – – 3 070 2 905Papua 28 603 32 208 14 289 14 149 42 892 46 357Papua Barat 14 686 13 451 648 648 15 334 14 099
Indonesia 577 656 595 201 313 849 324 928 891 505 920 129
Sumber/Source: Direktorat Jenderal Perikanan Tangkap/Directorate General of Capture Fisheries
http
://www.b
ps.g
o.id
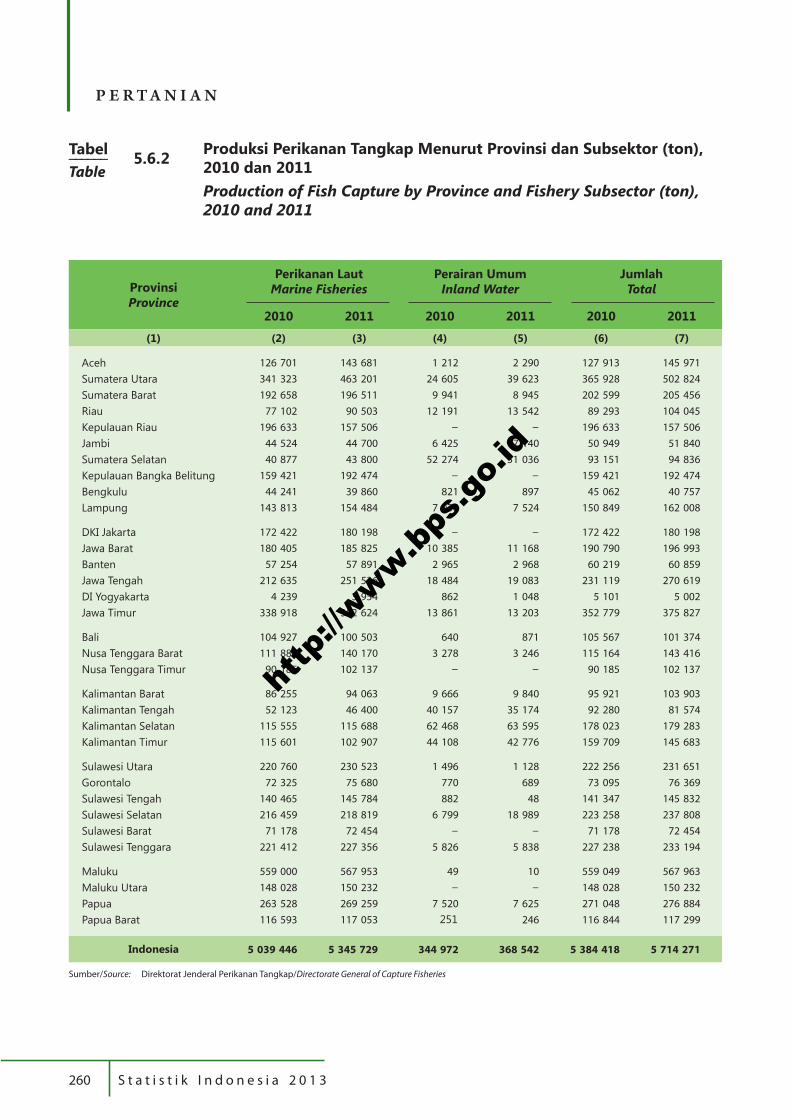
P E R T A N I A N
S t a t i s t i k I n d o n e s i a 2 0 1 3260
Sumber/Source: Direktorat Jenderal Perikanan Tangkap/Directorate General of Capture Fisheries
Produksi Perikanan Tangkap Menurut Provinsi dan Subsektor (ton), 2010 dan 2011Production of Fish Capture by Province and Fishery Subsector (ton), 2010 and 2011
Tabel –––––– 5.6.2Table
ProvinsiProvince
Perikanan LautMarine Fisheries
Perairan UmumInland Water
JumlahTotal
2010 2011 2010 2011 2010 2011
(1) (2) (3) (4) (5) (6) (7)
Aceh 126 701 143 681 1 212 2 290 127 913 145 971Sumatera Utara 341 323 463 201 24 605 39 623 365 928 502 824Sumatera Barat 192 658 196 511 9 941 8 945 202 599 205 456Riau 77 102 90 503 12 191 13 542 89 293 104 045Kepulauan Riau 196 633 157 506 – – 196 633 157 506Jambi 44 524 44 700 6 425 7 140 50 949 51 840Sumatera Selatan 40 877 43 800 52 274 51 036 93 151 94 836Kepulauan Bangka Belitung 159 421 192 474 – – 159 421 192 474Bengkulu 44 241 39 860 821 897 45 062 40 757Lampung 143 813 154 484 7 036 7 524 150 849 162 008
DKI Jakarta 172 422 180 198 – – 172 422 180 198Jawa Barat 180 405 185 825 10 385 11 168 190 790 196 993Banten 57 254 57 891 2 965 2 968 60 219 60 859Jawa Tengah 212 635 251 536 18 484 19 083 231 119 270 619DI Yogyakarta 4 239 3 954 862 1 048 5 101 5 002Jawa Timur 338 918 362 624 13 861 13 203 352 779 375 827
Bali 104 927 100 503 640 871 105 567 101 374Nusa Tenggara Barat 111 886 140 170 3 278 3 246 115 164 143 416Nusa Tenggara Timur 90 185 102 137 – – 90 185 102 137
Kalimantan Barat 86 255 94 063 9 666 9 840 95 921 103 903Kalimantan Tengah 52 123 46 400 40 157 35 174 92 280 81 574Kalimantan Selatan 115 555 115 688 62 468 63 595 178 023 179 283Kalimantan Timur 115 601 102 907 44 108 42 776 159 709 145 683
Sulawesi Utara 220 760 230 523 1 496 1 128 222 256 231 651Gorontalo 72 325 75 680 770 689 73 095 76 369Sulawesi Tengah 140 465 145 784 882 48 141 347 145 832Sulawesi Selatan 216 459 218 819 6 799 18 989 223 258 237 808Sulawesi Barat 71 178 72 454 – – 71 178 72 454Sulawesi Tenggara 221 412 227 356 5 826 5 838 227 238 233 194
Maluku 559 000 567 953 49 10 559 049 567 963Maluku Utara 148 028 150 232 – – 148 028 150 232Papua 263 528 269 259 7 520 7 625 271 048 276 884Papua Barat 116 593 117 053 251 246 116 844 117 299
Indonesia 5 039 446 5 345 729 344 972 368 542 5 384 418 5 714 271
http
://www.b
ps.g
o.id

A G R I C U L T U R E
S t a t i s t i c a l Y e a r b o o k o f I n d o n e s i a 2 0 1 3 261
Jumlah Perahu/Kapal Menurut Provinsi dan Jenis Perahu/Kapal, 2010 dan 2011Number of Fishing Boats by Province and Type of Boat, 2010 and 2011
Tabel –––––– 5.6.3Table
ProvinsiProvince
Perikanan LautMarine Fisheries
Perahu Tanpa MotorNonpowered Boat
Perahu Motor TempelOutboard Motorboat
Kapal MotorInboard Motorboat
2010 2011 2010 2011 2010 2011
(1) (2) (3) (4) (5) (6) (7)
Aceh 2 334 2 376 3 907 4 971 8 708 8 450Sumatera Utara 8 634 8 701 8 551 8 657 17 292 18 667Sumatera Barat 3 098 2 329 3 867 4 471 1 764 1 898Riau 5 966 5 766 598 702 5 220 5 302Kepulauan Riau 9 860 9 860 9 100 9 100 8 340 8 231Jambi 51 20 97 97 2 306 2 532Sumatera Selatan 1 849 1 861 306 309 4 970 4 827Kepulauan Bangka Belitung 2 044 1 840 3 254 3 694 10 332 11 196Bengkulu 1 076 1 317 1 274 1 656 781 636Lampung 2 144 1 011 3 907 3 952 3 303 3 350
DKI Jakarta – – – – 5 710 5 292Jawa Barat 445 91 15 439 11 591 2 702 5 627Banten 367 365 2 307 2 304 3 974 4 035Jawa Tengah 207 69 19 331 19 514 4 024 3 982DI Yogyakarta – – 423 405 53 49Jawa Timur 6 272 7 813 37 553 27 195 13 782 25 031
Bali 3 124 2 073 11 923 12 440 810 657Nusa Tenggara Barat 5 831 3 862 12 221 11 392 3 308 4 302Nusa Tenggara Timur 8 514 6 760 3 297 2 407 5 623 3 307
Kalimantan Barat 4 252 5 138 3 322 3 862 5 560 6 307Kalimantan Tengah 1 192 1 077 1 005 1 193 4 253 3 984Kalimantan Selatan 749 512 120 114 8 596 8 563Kalimantan Timur 2 813 3 281 6 319 5 644 17 036 19 813
Sulawesi Utara 6 251 7 201 14 222 13 612 788 900Gorontalo 1 711 1 679 6 484 6 545 225 231Sulawesi Tengah 19 245 19 785 10 578 17 049 3 298 3 146Sulawesi Selatan 5 765 4 734 16 342 15 861 12 873 13 286Sulawesi Barat 2 682 2 817 4 128 3 446 2 753 2 813Sulawesi Tenggara 4 991 4 956 15 111 15 280 3 146 3 057
Maluku 33 963 37 102 6 180 7 982 1 757 2 308Maluku Utara 984 918 827 793 872 1 241Papua 20 314 20 217 5 298 5 565 1 368 1 248Papua Barat 6 179 5 407 4 042 3 983 1 060 853
Indonesia 172 907 170 938 231 333 225 786 166 587 185 121
http
://www.b
ps.g
o.id

P E R T A N I A N
S t a t i s t i k I n d o n e s i a 2 0 1 3262
Lanjutan Tabel/Continued Table 5.6.3
ProvinsiProvince
Perikanan Perairan UmumInland Water Fisheries
Perahu Tanpa MotorNonpowered Boat
Perahu Motor TempelOutboard Motorboat
Kapal MotorInboard Motorboat
2010 2011 2010 2011 2010 2011
(1) (8) (9) (10) (11) (12) (13)
Aceh 508 640 42 42 – –Sumatera Utara 2 497 3 938 1 108 1 470 48 –Sumatera Barat 3 441 2 685 81 237 - –Riau 6 922 9 378 1 197 1 823 185 423Kepulauan Riau – – – – – –Jambi 5 900 6 204 158 108 – –Sumatera Selatan 37 155 38 383 – – – –Kepulauan Bangka Belitung – – – – – –Bengkulu 313 965 – 9 – –Lampung 3 516 4 310 231 462 34 22
DKI Jakarta – – – – – –Jawa Barat 5 228 5 595 541 760 – –Banten 78 160 112 112 – –Jawa Tengah 4 028 8 940 2 016 1 167 – –DI Yogyakarta – – – – – –Jawa Timur 5 076 2 625 1 010 290 – –
Bali 406 376 – – – –Nusa Tenggara Barat 744 796 45 25 – –Nusa Tenggara Timur – – – – – –
Kalimantan Barat 4 650 6 515 1 512 2 208 – –Kalimantan Tengah 14 220 18 184 5 504 5 676 6 –Kalimantan Selatan 22 771 28 325 3 599 2 351 906 1 366Kalimantan Timur 4 546 26 080 12 457 20 890 12 12
Sulawesi Utara 1 133 1 526 393 393 – –Gorontalo 823 825 11 7 – –Sulawesi Tengah 321 66 59 – – –Sulawesi Selatan 1 515 5 631 1 373 2 750 – –Sulawesi Barat – – – – – –Sulawesi Tenggara 1 164 1 425 211 221 25 28
Maluku 51 17 – – – –Maluku Utara – – – – – –Papua 11 189 11 282 – – – –Papua Barat 357 471 114 114 – –
Indonesia 138 552 185 342 31 774 41 115 1 216 1 851
Sumber/Source: Direktorat Jenderal Perikanan Tangkap/Directorate General of Capture Fisheries
http
://www.b
ps.g
o.id

A G R I C U L T U R E
S t a t i s t i c a l Y e a r b o o k o f I n d o n e s i a 2 0 1 3 263
Jumlah Rumah Tangga Perikanan Budidaya Menurut Provinsi dan Jenis Budidaya, 2010 dan 2011Number of Aquaculture Households by Province and Type of Culture, 2010 and 2011
Tabel –––––– 5.6.4Table
ProvinsiProvince
Budidaya LautMarine Culture
TambakBrackish Water Pond
KolamFresh Water Pond
2010 2011 2010 2011 2010 2011
(1) (2) (3) (4) (5) (6) (7)
Aceh 297 533 22 757 23 314 13 921 14 632Sumatera Utara 1 548 1 572 2 470 2 471 13 506 13 650Sumatera Barat 118 110 69 69 67 533 65 942Riau 8 2 618 495 120 366 17 944Kepulauan Riau 7 008 7 011 157 105 148 1 423Jambi – – 775 758 10 268 11 462Sumatera Selatan 55 – 23 625 11 934 39 921 17 837Kepulauan Bangka Belitung 182 159 65 28 2 409 1 423Bengkulu – 30 144 157 6 810 10 296Lampung 922 1 248 21 244 23 072 24 199 33 776
DKI Jakarta 2 376 2 032 258 307 797 913Jawa Barat 1 171 1 096 29 798 23 434 278 996 284 689Banten 1 398 2 400 2 051 2 049 11 974 14 204Jawa Tengah 465 506 26 584 26 380 132 994 155 911DI Yogyakarta – – 29 56 49 487 49 060Jawa Timur 8 528 10 690 24 699 25 718 64 141 68 130
Bali 4 947 4 006 119 159 4 567 5 682Nusa Tenggara Barat 8 944 12 131 4 891 6 296 7 504 9 499Nusa Tenggara Timur 27 632 28 217 1 797 1 902 2 761 2 761
Kalimantan Barat 728 400 1 676 2 988 12 094 14 501Kalimantan Tengah 55 25 1 371 1 309 5 662 8 587Kalimantan Selatan 193 193 3 228 3 304 4 737 4 633Kalimantan Timur 45 391 3 612 21 108 27 746 5 673 9 349
Sulawesi Utara 2 089 2 215 235 217 4 910 7 006Gorontalo 2 599 2 542 789 944 903 1 507Sulawesi Tengah 13 058 13 485 5 163 4 211 4 931 4 946Sulawesi Selatan 30 057 14 312 45 304 47 059 6 362 6 828Sulawesi Barat 598 1 841 4 126 4 163 775 1 839Sulawesi Tenggara 26 748 27 722 11 060 12 554 2 824 2 834
Maluku 10 323 17 797 33 24 102 81Maluku Utara 3 681 2 962 70 204 468 472Papua 668 2 324 149 166 4 219 4 509Papua Barat 1 511 2 008 117 202 1 100 2 444
Indonesia 203 298 163 181 256 579 253 795 907 062 848 770
http
://www.b
ps.g
o.id

P E R T A N I A N
S t a t i s t i k I n d o n e s i a 2 0 1 3264
Lanjutan Tabel/Continued Table 5.6.4
ProvinsiProvince
KerambaCage
Jaring ApungFloating Cage Net
SawahPaddy Field
JumlahTotal
2010 2011 2010 2011 2010 2011 2010 2011
(1) (8) (9) (10) (11) (12) (13) (14) (15)
Aceh 264 117 740 222 7 329 6 950 45 308 45 768Sumatera Utara 166 147 1 923 1 866 14 277 12 520 33 890 32 226Sumatera Barat 7 130 1 656 4 910 3 959 2 200 6 588 81 960 78 324Riau 7 438 5 787 47 1 113 – – 128 477 25 341Kepulauan Riau – – – – – – 7 313 8 539Jambi 246 266 6 944 3 973 84 95 18 317 16 554Sumatera Selatan 9 352 9 620 88 3 754 31 399 10 568 104 440 53 713Kepulauan Bangka Belitung – – 11 27 – – 2 667 1 637Bengkulu 53 23 11 19 1 033 2 650 8 051 13 175Lampung 1 567 2 381 602 1 089 2 609 2 288 51 143 63 854
DKI Jakarta – – – – – – 3 431 3 252Jawa Barat 1 693 1 723 3 977 6 129 74 632 75 127 390 267 392 198Banten 513 513 161 146 8 041 7 991 24 138 27 303Jawa Tengah 1 303 1 269 965 968 7 826 8 255 170 137 193 289DI Yogyakarta 219 91 48 20 5 649 5 619 55 432 54 846Jawa Timur 1 215 1 126 1 905 3 468 30 128 36 849 130 616 145 981
Bali – – 149 291 3 401 3 742 13 183 13 880Nusa Tenggara Barat 1 576 1 986 222 104 2 493 3 025 25 630 33 041Nusa Tenggara Timur – – – – 723 710 32 913 33 590
Kalimantan Barat 4 553 8 363 1 815 2 324 – – 20 866 28 576Kalimantan Tengah 7 258 8 368 224 190 45 2 14 615 18 481Kalimantan Selatan 3 480 3 957 365 451 202 188 12 205 12 726Kalimantan Timur 16 280 17 981 42 – 74 94 88 568 58 782
Sulawesi Utara 141 193 643 330 2 517 3 997 10 535 13 958Gorontalo 131 156 688 782 36 39 5 146 5 970Sulawesi Tengah 254 277 – – 17 19 23 423 22 938Sulawesi Selatan 115 138 – – 10 156 11 039 91 994 79 376Sulawesi Barat – – 4 7 3 357 14 052 8 860 21 902Sulawesi Tenggara – – – – – – 40 632 43 110
Maluku – – – – – – 10 458 17 902Maluku Utara 26 71 206 – – – 4 451 3 709Papua 913 166 – – – – 5 949 7 165Papua Barat 25 – 15 – 166 27 2 934 4 681
Indonesia 65 911 66 375 26 705 31 232 208 394 212 434 1 667 949 1 575 787
Sumber/Source: Direktorat Jenderal Perikanan Budidaya/Directorate General of Aquaculture
http
://www.b
ps.g
o.id

A G R I C U L T U R E
S t a t i s t i c a l Y e a r b o o k o f I n d o n e s i a 2 0 1 3 265
Produksi Perikanan Budidaya Menurut Provinsi dan Jenis Budidaya (ton), 2010 dan 2011Production of Aquaculture by Province and Type of Culture (ton), 2010 and 2011
Tabel –––––– 5.6.5Table
ProvinsiProvince
Budidaya LautMarine Culture
TambakBrackish Water Pond
KolamFresh Water Pond
2010 2011 2010 2011 2010 2011
(1) (2) (3) (4) (5) (6) (7)
Aceh 42 164 31 041 23 405 14 238 9 224Sumatera Utara 1 888 3 566 32 785 32 830 29 512 41 181Sumatera Barat 13 79 12 12 57 653 85 934Riau 11 3 2 371 2 120 29 447 37 973Kepulauan Riau 16 477 4 682 14 13 327 2 563Jambi – – 2 097 1 852 17 456 20 212Sumatera Selatan 392 – 65 133 70 730 100 160 140 731Kepulauan Bangka Belitung 746 4 585 503 535 1 200 1 352Bengkulu – 248 897 1 125 13 820 23 673Lampung 9 448 10 696 53 248 54 666 32 378 50 453
DKI Jakarta 35 281 26 726 1 030 1 800 14 055 5 617Jawa Barat 14 707 7 934 170 684 179 980 247 369 295 715Banten 15 024 16 708 56 309 59 345 12 217 12 864Jawa Tengah 4 809 5 737 83 878 115 786 66 964 94 566DI Yogyakarta – – 268 499 38 772 43 795Jawa Timur 389 430 412 798 158 927 177 682 65 869 115 086
Bali 99 883 106 667 2 649 2 232 2 626 6 602Nusa Tenggara Barat 163 287 278 107 40 544 67 999 3 927 33 016Nusa Tenggara Timur 347 828 377 203 1 027 1 195 809 966
Kalimantan Barat 197 20 12 889 10 089 4 509 7 215Kalimantan Tengah 300 149 4 031 5 224 8 706 12 505Kalimantan Selatan 1 502 2 303 15 378 20 101 31 329 27 045Kalimantan Timur 55 995 83 216 53 517 51 164 2 060 2 214
Sulawesi Utara 48 546 103 544 606 428 6 976 33 039Gorontalo 64 077 89 190 4 081 3 212 652 1 025Sulawesi Tengah 716 496 734 635 23 214 42 057 4 294 4 394Sulawesi Selatan 815 777 1 024 310 534 456 600 241 4 886 6 273Sulawesi Barat 13 211 21 553 16 018 17 928 426 608Sulawesi Tenggara 353 431 588 745 46 962 54 921 3 730 4 169
Maluku 275 193 610 712 527 1 741 34 52Maluku Utara 49 878 65 093 127 85 1 351 1 930Papua 224 176 628 950 1 263 2 798Papua Barat 20 613 26 280 189 1 164 796 2 335
Indonesia 3 514 702 4 605 827 1 416 038 1 602 748 819 809 1 127 127
http
://www.b
ps.g
o.id
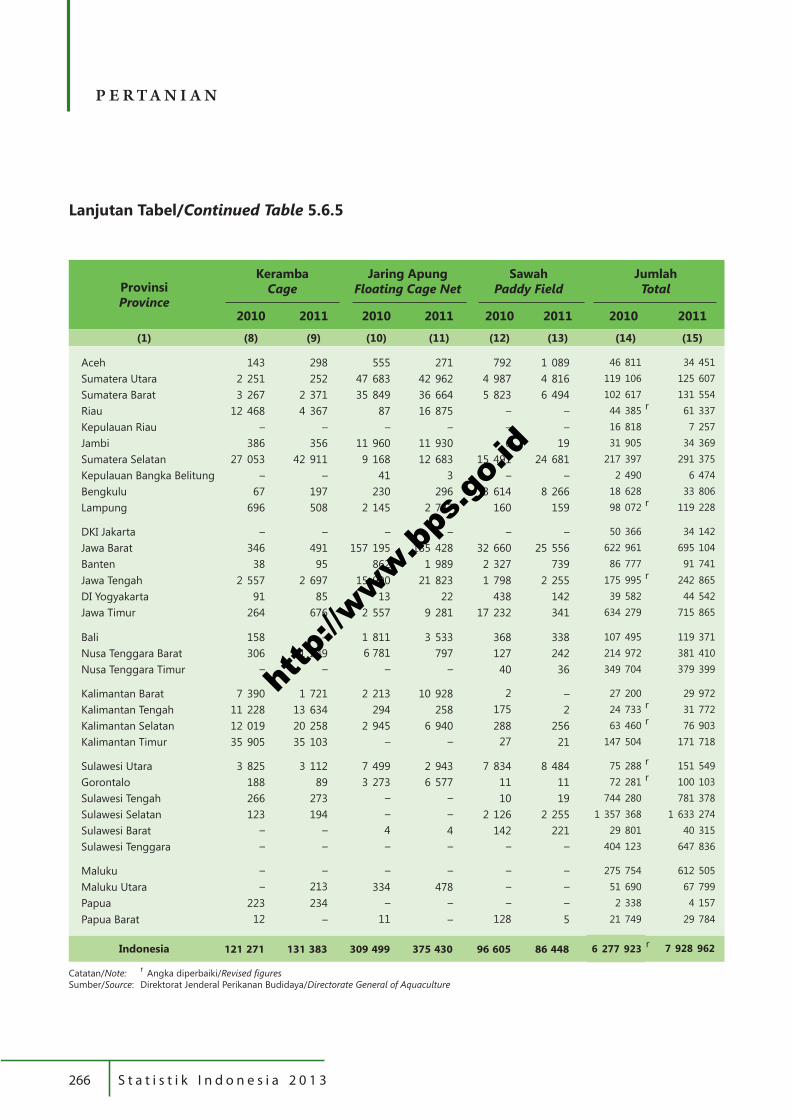
P E R T A N I A N
S t a t i s t i k I n d o n e s i a 2 0 1 3266
Lanjutan Tabel/Continued Table 5.6.5
ProvinsiProvince
KerambaCage
Jaring ApungFloating Cage Net
SawahPaddy Field
JumlahTotal
2010 2011 2010 2011 2010 2011 2010 2011
(1) (8) (9) (10) (11) (12) (13) (14) (15)
Aceh 143 298 555 271 792 1 089 46 811 34 451
Sumatera Utara 2 251 252 47 683 42 962 4 987 4 816 119 106 125 607Sumatera Barat 3 267 2 371 35 849 36 664 5 823 6 494 102 617 131 554
Riau 12 468 4 367 87 16 875 – – 44 385 r 61 337
Kepulauan Riau – – – – – – 16 818 7 257Jambi 386 356 11 960 11 930 6 19 31 905 34 369
Sumatera Selatan 27 053 42 911 9 168 12 683 15 491 24 681 217 397 291 375Kepulauan Bangka Belitung – – 41 3 – – 2 490 6 474
Bengkulu 67 197 230 296 3 614 8 266 18 628 33 806Lampung 696 508 2 145 2 747 160 159 98 072 r 119 228
DKI Jakarta – – – – – – 50 366 34 142
Jawa Barat 346 491 157 195 185 428 32 660 25 556 622 961 695 104Banten 38 95 862 1 989 2 327 739 86 777 91 741
Jawa Tengah 2 557 2 697 15 990 21 823 1 798 2 255 175 995 r 242 865
DI Yogyakarta 91 85 13 22 438 142 39 582 44 542Jawa Timur 264 676 2 557 9 281 17 232 341 634 279 715 865
Bali 158 – 1 811 3 533 368 338 107 495 119 371
Nusa Tenggara Barat 306 1 249 6 781 797 127 242 214 972 381 410Nusa Tenggara Timur – – – – 40 36 349 704 379 399
Kalimantan Barat 7 390 1 721 2 213 10 928 2 – 27 200 29 972
Kalimantan Tengah 11 228 13 634 294 258 175 2 24 733 r 31 772Kalimantan Selatan 12 019 20 258 2 945 6 940 288 256 63 460 r 76 903
Kalimantan Timur 35 905 35 103 – – 27 21 147 504 171 718
Sulawesi Utara 3 825 3 112 7 499 2 943 7 834 8 484 75 288 r 151 549Gorontalo 188 89 3 273 6 577 11 11 72 281 r 100 103
Sulawesi Tengah 266 273 – – 10 19 744 280 781 378Sulawesi Selatan 123 194 – – 2 126 2 255 1 357 368 1 633 274
Sulawesi Barat – – 4 4 142 221 29 801 40 315
Sulawesi Tenggara – – – – – – 404 123 647 836
Maluku – – – – – – 275 754 612 505
Maluku Utara – 213 334 478 – – 51 690 67 799Papua 223 234 – – – – 2 338 4 157
Papua Barat 12 – 11 – 128 5 21 749 29 784
Indonesia 121 271 131 383 309 499 375 430 96 605 86 448 6 277 923 r 7 928 962
Catatan/Note: r Angka diperbaiki/Revised figures Sumber/Source: Direktorat Jenderal Perikanan Budidaya/Directorate General of Aquaculture
http
://www.b
ps.g
o.id

A G R I C U L T U R E
S t a t i s t i c a l Y e a r b o o k o f I n d o n e s i a 2 0 1 3 267
Luas Area Usaha Budidaya Perikanan Menurut Provinsi dan Jenis Budidaya (ha), 2010 dan 2011Aquaculture Areas by Province and Type of Culture (ha), 2010 and 2011
Tabel –––––– 5.6.6Table
ProvinsiProvince
Budidaya LautMarine Culture
TambakBrackish Water Pond
KolamFresh Water Pond
2010 2011 2010 2011 2010 2011
(1) (2) (3) (4) (5) (6) (7)
Aceh 1 1 51 519 49 271 3 706 3 490Sumatera Utara 13 13 4 547 4 791 8 497 6 419Sumatera Barat 16 3 17 17 10 464 10 520Riau 0 0 1 624 964 5 222 5 373Kepulauan Riau 2 107 2 213 48 48 189 3 117Jambi – – 1 499 1 487 1 542 1 706Sumatera Selatan 3 – 33 151 29 836 12 933 13 964Kepulauan Bangka Belitung 98 179 142 214 146 186Bengkulu – 75 339 348 4 017 5 373Lampung 1 212 1 289 35 158 37 963 8 682 13 590
DKI Jakarta 65 61 487 487 96 93Jawa Barat 24 46 64 133 65 326 30 597 20 547Banten 520 459 9 119 8 710 1 244 1 426Jawa Tengah 55 55 38 815 39 025 3 520 3 261DI Yogyakarta – – 13 14 781 960Jawa Timur 1 138 1 535 60 649 59 577 20 281 3 399
Bali 742 780 290 532 937 796Nusa Tenggara Barat 13 056 15 661 6 987 7 154 2 277 3 377Nusa Tenggara Timur 6 160 6 481 1 238 1 249 175 161
Kalimantan Barat 1 0 18 839 18 839 5 231 5 276Kalimantan Tengah 25 10 3 415 4 780 790 989Kalimantan Selatan 123 123 13 724 14 758 550 479Kalimantan Timur 4 909 6 503 175 345 249 176 4 839 2 299
Sulawesi Utara 956 1 352 202 190 4 893 7 587Gorontalo 989 941 3 511 4 535 390 201Sulawesi Tengah 15 345 18 698 9 280 9 299 1 693 2 152Sulawesi Selatan 26 453 36 283 105 859 107 312 5 136 5 894Sulawesi Barat 840 1 459 11 765 11 790 407 889Sulawesi Tenggara 24 667 26 748 22 226 20 551 1 659 1 317
Maluku 16 256 46 464 8 190 275 32 21Maluku Utara 1 522 1 514 37 34 – 205Papua 194 30 606 589 5 449 1 313Papua Barat 159 316 84 80 204 –
Indonesia 117 649 169 292 682 857 749 220 146 577 126 382
http
://www.b
ps.g
o.id
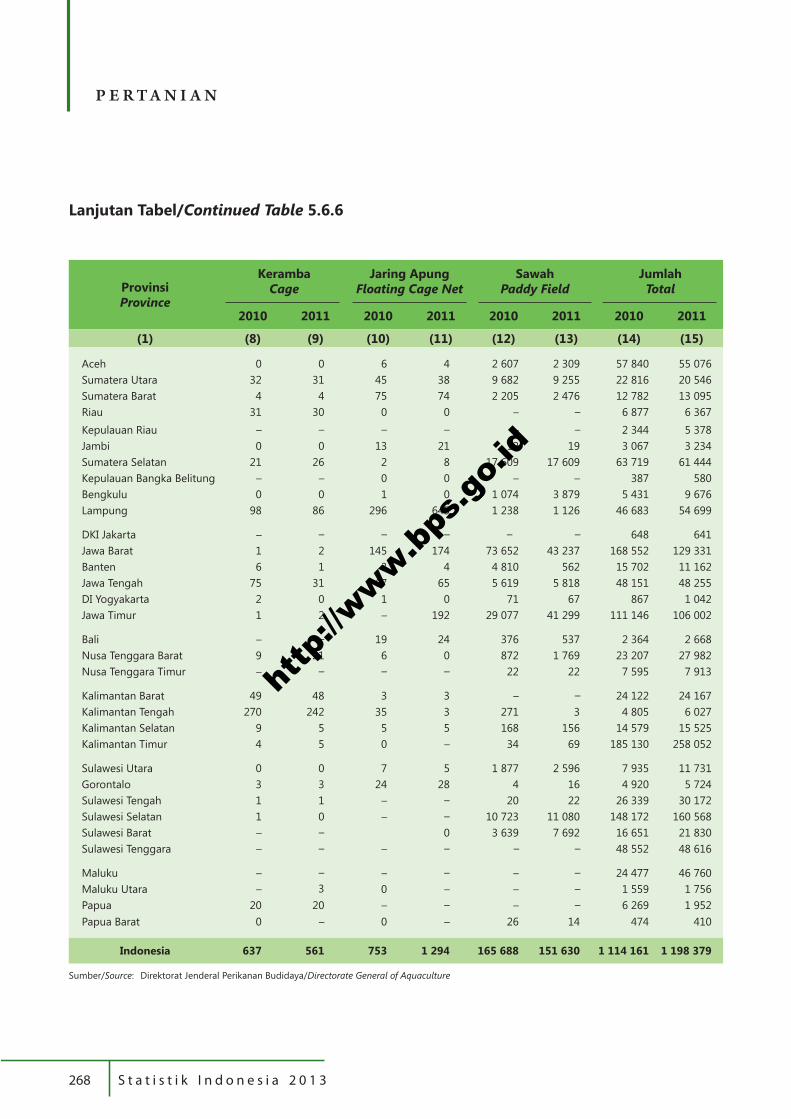
P E R T A N I A N
S t a t i s t i k I n d o n e s i a 2 0 1 3268
Lanjutan Tabel/Continued Table 5.6.6
ProvinsiProvince
KerambaCage
Jaring ApungFloating Cage Net
SawahPaddy Field
JumlahTotal
2010 2011 2010 2011 2010 2011 2010 2011
(1) (8) (9) (10) (11) (12) (13) (14) (15)
Aceh 0 0 6 4 2 607 2 309 57 840 55 076Sumatera Utara 32 31 45 38 9 682 9 255 22 816 20 546Sumatera Barat 4 4 75 74 2 205 2 476 12 782 13 095Riau 31 30 0 0 – – 6 877 6 367Kepulauan Riau – – – – – – 2 344 5 378Jambi 0 0 13 21 12 19 3 067 3 234Sumatera Selatan 21 26 2 8 17 609 17 609 63 719 61 444Kepulauan Bangka Belitung – – 0 0 – – 387 580Bengkulu 0 0 1 0 1 074 3 879 5 431 9 676Lampung 98 86 296 645 1 238 1 126 46 683 54 699
DKI Jakarta – – – – – – 648 641Jawa Barat 1 2 145 174 73 652 43 237 168 552 129 331Banten 6 1 3 4 4 810 562 15 702 11 162Jawa Tengah 75 31 67 65 5 619 5 818 48 151 48 255DI Yogyakarta 2 0 1 0 71 67 867 1 042Jawa Timur 1 2 – 192 29 077 41 299 111 146 106 002
Bali – – 19 24 376 537 2 364 2 668Nusa Tenggara Barat 9 21 6 0 872 1 769 23 207 27 982Nusa Tenggara Timur – – – – 22 22 7 595 7 913
Kalimantan Barat 49 48 3 3 – – 24 122 24 167Kalimantan Tengah 270 242 35 3 271 3 4 805 6 027Kalimantan Selatan 9 5 5 5 168 156 14 579 15 525Kalimantan Timur 4 5 0 – 34 69 185 130 258 052
Sulawesi Utara 0 0 7 5 1 877 2 596 7 935 11 731Gorontalo 3 3 24 28 4 16 4 920 5 724Sulawesi Tengah 1 1 – – 20 22 26 339 30 172Sulawesi Selatan 1 0 – – 10 723 11 080 148 172 160 568Sulawesi Barat – – 0 3 639 7 692 16 651 21 830Sulawesi Tenggara – – – – – – 48 552 48 616
Maluku – – – – – – 24 477 46 760Maluku Utara – 3 0 – – – 1 559 1 756Papua 20 20 – – – – 6 269 1 952Papua Barat 0 – 0 – 26 14 474 410
Indonesia 637 561 753 1 294 165 688 151 630 1 114 161 1 198 379
Sumber/Source: Direktorat Jenderal Perikanan Budidaya/Directorate General of Aquaculture
http
://www.b
ps.g
o.id

A G R I C U L T U R E
S t a t i s t i c a l Y e a r b o o k o f I n d o n e s i a 2 0 1 3 269
Produksi Perikanan Menurut Subsektor (ribu ton), 2006–2011Fish Production by Subsector (thousand tons), 2006–2011
Tabel –––––– 5.6.7Table
SubsektorSubsector 2006 2007 2008 2009 2010 2011
(1) (2) (3) (4) (5) (6) (7)
Perikanan BudidayaAquaculture
Budidaya LautMarine Culture
1 366 1 509 1 966 2 820 3 515 4 606
TambakBrackish Water Pond
630 934 960 907 1 416 1 603
KolamFresh Water Pond
382 410 479 554 820 1 127
KarambaCage
56 64 76 102 121 131
Jaring ApungFloating Cage Net
143 191 263 239 309 375
SawahPaddy Field
106 85 112 87 97 86
Sub JumlahSub Total
2 683 3 193 3 855 4 709 6 278 7 929
Perikanan TangkapFish Capture
Perikanan LautMarine Fisheries
4 512 4 734 4 702 4 812 5 039 5 346
Perairan UmumOpen Water
294 310 494 296 345 369
Sub JumlahSub Total
4 806 5 044 5 196 5 108 5 384 5 714
Jumlah/Total 7 489 8 237 9 051 r 9 817 11 662 13 643
Sumber/Source: Direktorat Jenderal Perikanan Tangkap dan Direktorat Jenderal Perikanan Budidaya/Directorate General of Capture Fisheries and Directorate General of Aquaculture
Catatan/Note: r Angka diperbaiki/Revised figures
http
://www.b
ps.g
o.id

http
://www.b
ps.g
o.id

6PERTAMBANGAN DAN ENERGI
Mining and Energyhttp
://www.b
ps.g
o.id

http
://www.b
ps.g
o.id
M I N I N G A N D E N E R G Y
S t a t i s t i c a l Y e a r b o o k o f I n d o n e s i a 2 0 1 3 273
PENJELASAN TEKNIS
1. Pertambangan adalah suatu kegiatan pengambilan endapan bahan galian berharga dan bernilai ekonomis dari dalam kulit bumi, di bawah permukaan bumi, dan di bawah permukaan air.
2. Aviation Gasoline (Avgas) adalah bahan bakar minyak berkadar oktan tinggi untuk pesawat bermesin torak, mempunyai titik beku yang rendah (maksimum -60°C).
3. Aviation Turbine (Avtur) adalah bahan bakar khusus untuk turbin/pesawat terbang, jenis khusus minyak tanah dengan proses penyulingan dari 150°C–250°C.
4. Bensin adalah jenis bahan bakar minyak. Diperguna-kan di mesin pembakaran bagian dalam kecuali mesin pesawat terbang, di pasaran tersedia dalam bentuk Premium, Pertamax, dan Pertamax Plus.
5. Minyak bakar adalah produk bahan bakar minyak dari hasil pengilangan urutan terakhir, merupakan jenis residu, lebih kental daripada minyak diesel dan mempunyai titik tuang yang lebih tinggi daripada minyak diesel.
6. Naphta adalah sulingan minyak bumi ringan dengan titik didih akhir tidak melebihi 220 derajat Celcius.
7. Low sulfur waxy residue (LSWR) adalah residu berlilin dengan kadar belerang rendah yang diperoleh dari penyulingan atmosferik minyak bumi.
8. Minyak bumi adalah campuran hidrokarbon dalam bentuk cair diperoleh dari lapisan kulit bumi.
9. Gas bumi adalah semua jenis gas hidrokarbon yang dihasilkan dari sumur penambangan yang terdiri dari komponen utama berupa metana, etana, propana, butana, pentana dan hexana, ditambang dari dalam bumi, baik diperoleh langsung atau bersamaan dengan crude oil.
TECHNICAL NOTES
1. Mining is an activity of taking valued quarrying material from within the earth layer, under earth surface, and under water level.
2. Aviation Gasoline (Avgas) is a high octane gasoline for reciprocating engines aircraft. It is very stabel and has low freezing point (maximum -60°C).
3. Aviation Turbine (Avtur) fuel is a special fuel for turbine/jet aircraf, a special kerosene produced in the distillation process range of 150°C–250°C.
4. Gasoline is light hydrocarbon oil used for internal combustion engine, except for ion engine, available in the market as Premium, Pertamax, and Pertamax Plus.
5. Fuel oil is a lowest order refinery product, either as a heavy distillate or a residue. It is more viscous and has a higher flash point than diesel fuel.
6. Naphta is a petroleum distillation fraction with boiling point of less than 220 degree celcius.
7. Low sulfur waxy residue (LSWR) is a cracked low sulphur fuel oil/waxed residue obtained from petroleum distillation.
8. Crude oil is a mixture of hydrocarbon accuring in liquid phase in subsurface reservoir and remained liquid under atmospheric pressure.
9. Natural gas is all kind of hydrocarbon gas produced from wells, mixture of hydrocarbons gas and vapour occuring naturally, which main components are methane, ethane, propane, butane, pentane and hexane, mined from underground occumulation either directly or as associated gas in oil mining.
http
://www.b
ps.g
o.id

P E R T A M B A N G A N D A N E N E R G I
S t a t i s t i k I n d o n e s i a 2 0 1 3274
10. Perusahaan listrik adalah perusahaan yang mempunyai aktivitas kegiatan pembangkitan, transmisi, dan distribusi tenaga listrik.
11. Perusahaan gas adalah perusahaan yang mempunyai aktivitas dalam penyaluran gas cair melalui suatu sistem pipa saluran kepada rumah tangga, perusahaan industri, atau pengguna komersial lainnya.
12. Perusahaan air bersih adalah perusahaan yang mempunyai aktivitas dalam penampungan, penjernihan, dan penyaluran air bersih kepada rumah tangga, perusahaan industri, atau pengguna komersial lainnya.
13. Jumlah listrik/gas/air bersih yang terjual adalah banyaknya listrik/gas/air bersih yang disalurkan kepada para pelanggan.
14. Biaya input adalah pengeluaran yang digunakan untuk pembelian bahan bakar dan pelumas tenaga listrik, alat-alat tulis, onderdil, ongkos pemeliharaan dan perbaikan kecil alat produksi, sewa gedung dan mesin serta jasa lainnya.
15. Nilai output adalah nilai tenaga listrik/gas/air bersih yang dijual atau didistribusikan kepada para pelanggan dan ditambah dengan pendapatan atau penerimaan dari kegiatan jasa perusahaan.
10. Electricity company is a company that has activities for electricity production, transmission and electricity distribution.
11. Gas company is a company that has activities for distribution of liquid gas for household consumption, industrial usage, and other commercial users.
12. Water supply company is a company with several activities such as the collection and purification of water and the distribution of cleaned water to households, industries, and other commercial users.
13. Sold electricity/gas/cleaned water is total electricity/gas/cleaned water distributed to customers.
14. Input values include expenditures for fuel and lubricant, electricity stationaries, spareparts, maintenance costs of machineries and vehicles, building and machineries rental costs, and costs of other services.
15. Output cover electricity/gas/cleaned water sold and distributed to customers added by income from other services.
http
://www.b
ps.g
o.id
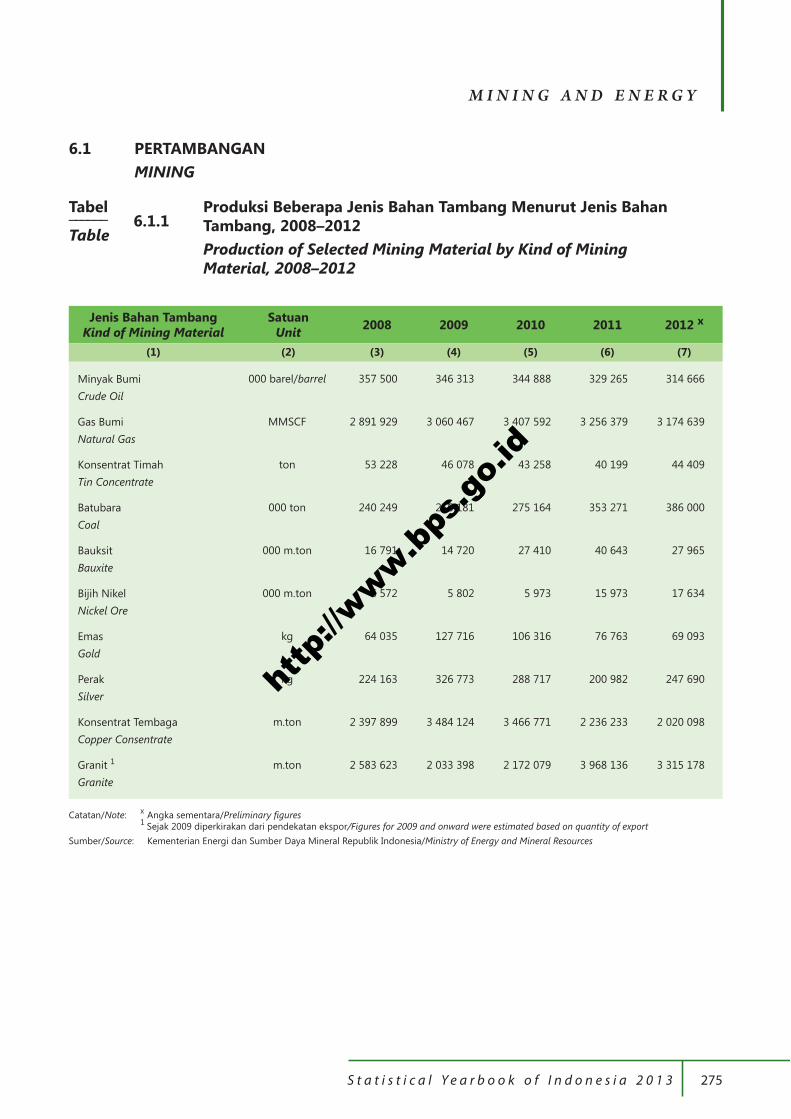
M I N I N G A N D E N E R G Y
S t a t i s t i c a l Y e a r b o o k o f I n d o n e s i a 2 0 1 3 275
Jenis Bahan Tambang Kind of Mining Material
Satuan Unit 2008 2009 2010 2011 2012 x
(1) (2) (3) (4) (5) (6) (7)
Minyak Bumi 000 barel/barrel 357 500 346 313 344 888 329 265 314 666Crude Oil
Gas Bumi MMSCF 2 891 929 3 060 467 3 407 592 3 256 379 3 174 639Natural Gas
Konsentrat Timah ton 53 228 46 078 43 258 40 199 44 409Tin Concentrate
Batubara 000 ton 240 249 256 181 275 164 353 271 386 000Coal
Bauksit 000 m.ton 16 791 14 720 27 410 40 643 27 965Bauxite
Bijih Nikel 000 m.ton 6 572 5 802 5 973 15 973 17 634Nickel Ore
Emas kg 64 035 127 716 106 316 76 763 69 093Gold
Perak kg 224 163 326 773 288 717 200 982 247 690Silver
Konsentrat Tembaga m.ton 2 397 899 3 484 124 3 466 771 2 236 233 2 020 098Copper Consentrate
Granit 1 m.ton 2 583 623 2 033 398 2 172 079 3 968 136 3 315 178Granite
Catatan/Note: x Angka sementara/Preliminary figures 1 Sejak 2009 diperkirakan dari pendekatan ekspor/Figures for 2009 and onward were estimated based on quantity of exportSumber/Source: Kementerian Energi dan Sumber Daya Mineral Republik Indonesia/Ministry of Energy and Mineral Resources
Produksi Beberapa Jenis Bahan Tambang Menurut Jenis Bahan Tambang, 2008–2012Production of Selected Mining Material by Kind of Mining Material, 2008–2012
Tabel –––––– 6.1.1Table
6.1 PERTAMBANGAN MINING
http
://www.b
ps.g
o.id

P E R T A M B A N G A N D A N E N E R G I
S t a t i s t i k I n d o n e s i a 2 0 1 3276
Jenis Hasil KilangKind of Refinery Product 2008 2009 2010 2011 2012 x
(1) (2) (3) (4) (5) (6)
Bahan Bakar Minyak/Oil Fuels
Avgas 23 948 208 6 667 1 231 725
Avtur 11 228 877 16 761 646 15 710 422 17 060 980 16 385 136
Bensin/Gasoline 72 404 185 74 738 421 70 803 943 67 641 902 70 740 633
Minyak Tanah/Kerosene 48 030 891 29 272 624 18 984 666 14 378 121 11 429 481
Minyak Solar/ADO 92 812 351 110 814 865 107 351 110 119 596 393 114 649 014
Minyak Diesel/Diesel Oil 2 036 150 1 277 832 1 376 588 1 351 542 1 409 031
Minyak Bakar/Fuel Oil 23 083 618 18 373 745 21 514 781 20 276 344 17 165 373
Bukan Bahan Bakar Minyak/Non-oil Fuels
Lube Base Oil 3 067 489 2 772 199 2 026 821 3 064 817 2 722 661
Asphalt 2 394 944 3 178 425 1 156 570 1 965 235 1 666 161
Ready Wax 7 953 87 934 0 0 0
Naphta 28 270 308 22 291 767 22 321 303 28 612 864 27 667 218
LSWR 30 033 027 31 940 427 29 522 489 24 020 877 26 420 012
Catatan/Note: x Angka sementara/Preliminary figuresSumber/Source: Kementerian Energi dan Sumber Daya Mineral Republik Indonesia/Ministry of Energy and Mineral Resources
Produksi Beberapa Hasil Kilang Minyak dan Gas Menurut Jenis Hasil Kilang (barel), 2008–2012Production of Selected Refined Oil and Gas by Kind of Refinery Product (barrels), 2008–2012
Tabel –––––– 6.1.2Table
http
://www.b
ps.g
o.id

M I N I N G A N D E N E R G Y
S t a t i s t i c a l Y e a r b o o k o f I n d o n e s i a 2 0 1 3 277
Jenis Bahan Bakar Minyak Kind of Oil Fuel 2007 2008 2009 2010 2011
(1) (2) (3) (4) (5) (6)
Avgas 2 054 2 003 1 687 2 231 2 316
Avtur 2 143 001 2 635 670 2 760 678 3 527 382 3 562 126
Bensin/Gasoline 16 616 343 19 226 083 21 335 314 23 929 379 26 447 230
Minyak Tanah/Kerosene 9 099 893 7 901 595 4 779 818 2 845 486 2 984 939
Minyak Solar/Gas Oil 24 780 885 26 999 434 26 691 227 27 653 973 26 391 275
Minyak Diesel/Diesel Oil 675 008 180 997 145 192 167 733 133 589
Minyak Bakar/Fuel Oil 3 933 074 4 969 526 4 480 563 4 316 705 3 904 580
Sumber/Source: Kementerian Energi dan Sumber Daya Mineral Republik Indonesia/Ministry of Energy and Mineral Resources
Pemasaran Bahan Bakar Minyak Dalam Negeri Menurut Jenis Bahan Bakar Minyak (kilo liter), 2007–2011Domestic Sales of Oil Fuels by Kind of Oil Fuel (kilo litre), 2007–2011
Tabel –––––– 6.1.3Table
http
://www.b
ps.g
o.id

P E R T A M B A N G A N D A N E N E R G I
S t a t i s t i k I n d o n e s i a 2 0 1 3278
Wilayah Operasi PLNPLN Operational Region
Daya Terpasang Installed
Capacity (MW)
Produksi Listrik 1
Produced Electricity 1
(000 MWh)
Listrik Terjual Sold Electricity
(000 MWh)
(1) (2) (3) (4)Wilayah Aceh/Region of Aceh 141,78 865,77 1 755,07Wilayah Sumatera Utara/Region of Sumatera Utara 12,64 350,00 7 809,32Wilayah Sumatera Barat/Region of West Sumatera 32,83 317,72 2 649,07
Wilayah Riau/Region of Riau 177,31 1 383,16 3 269,62Wilayah Sumatera Selatan, Jambi, dan Bengkulu/Region of South Sumatera, Jambi, and Bengkulu
42,27 555,91 5 262,26
Wilayah Bangka Belitung/Region of Bangka Belitung 89,46 660,89 664,73Wilayah Lampung/Region of Lampung 4,79 296,58 2 793,36Wilayah Kalimantan Barat/Region of West Kalimantan 222,41 1 816,12 1 603,72Wilayah Kalimantan Selatan dan Kalimantan Tengah/Region of South and Central Kalimantan
389,93 2 859,27 2 440,79
Wilayah Kalimantan Timur/Region of East Kalimantan 325,38 2 596,46 2 334,31
Wilayah Sulawesi Utara, Sulawesi Tengah, dan Gorontalo/Region of North, Central Sulawesi, and Gorontalo
383,38 2 290,41 2 066,37
Wilayah Sulawesi Selatan, Sulawesi Tenggara, dan Sulawesi Barat/Region of South, SouthEast, and West Sulawesi
592,03 4 863,81 4 345,67
Wilayah Maluku dan Maluku Utara/Region of Maluku and North Maluku 179,66 686,05 633,38Wilayah Papua/Region of Papua 132,97 1 025,12 947,33Distribusi Bali/Distribution of Bali 3,84 17,41 3 546,60Wilayah Nusa Tenggara Barat/Region of West Nusa Tenggara 147,29 1 046,74 976,39Wilayah Nusa tenggara Timur/Region of East Nusa Tenggara 151,19 580,28 567,39PT PLN Batam 102,85 1 782,06 1 644,22PT PLN Tarakan 31,22 208,64 168,03Kit Sumbagut/Generation of Nothern Part of Sumatera 2 048,63 10 530,92 –Kit Sumbagsel/Generation of Southern Part of Sumatera 1 902,13 9 863,28 –P3B Sumatera/Sumatera Transformation and Control Centre – 3 826,45 –Distribusi Jawa Timur/Jawa Timur Distribution 9,18 68,93 26 910,19
Distribusi Jawa Tengah dan Yogyakarta/Jawa Tengah Distribution 0,70 5,40 18 644,17Distribusi Jawa Barat dan Banten/Jawa Barat Distribution 0,40 36,75 44 790,10Distr. Jakarta Raya dan Tangerang/Jakarta Raya and Tangerang Distr. – 10,98 38 168,76PT. Indonesia Power 8 995,59 49 176,11 –Pembangkitan Tenaga Listrik Jawa-Bali (PT. PJB)/PT. Java-Bali GENCO 9 375,58 32 033,48 –P3B Jawa Bali/Java Bali Transformation and Control Centre – 35 372,39 –Pembangkitan Muara Tawar/Generation of Muara Tawar 858,00 4 034,77 –Pembangkitan PLTGU Cilegon/Generation of Cilegon 2 118,00 10 223,08 –Pembangkitan Tanjung Jati B/Generation of Tanjung Jati B 2 840,00 14 834,36 –Pembangkitan Lontar/Generation of Lontar 660,00 2 618,26 –Pembangkitan Indramayu/Generation of Indramayu 930,00 3 480,05 –
Jumlah/Total 32 901,44 200 317,57 173 990,75
Catatan/Note: x Angka sementara/Preliminary figures 1 Listrik yang dibangkitkan sendiri dan dibeli dari luar PLN/Own generated electricity and purchased by PLN from other companies
Daya Terpasang, Produksi, dan Listrik Terjual PT. PLN (Persero) Menurut Wilayah Operasi, 2012 x Installed Capacity, Produced Electricity, and Sold Electricity by State Electricity Company by Operational Region, 2012 x
Tabel –––––– 6.2.1Table
6.2 LISTRIK, GAS, DAN AIR MINUM ELECTRICITY, GAS, AND WATER SUPPLY
http
://www.b
ps.g
o.id

M I N I N G A N D E N E R G Y
S t a t i s t i c a l Y e a r b o o k o f I n d o n e s i a 2 0 1 3 279
Wilayah Operasi PLNPLN Operational Region 2008 2009 2010 2011 2012 x
(1) (2) (3) (4) (5) (6)
Wilayah Aceh/Region of Aceh 152,49 155,20 150,91 144,26 141,78Wilayah Sumatera Utara/Region of Sumatera Utara 0,70 15,66 28,30 16,58 12,64Wilayah Sumatera Barat/Region of West Sumatera 44,71 34,40 31,19 33,45 32,83Wilayah Riau/Region of Riau 164,08 167,53 172,78 162,87 177,31Wilayah Sumatera Selatan, Jambi, dan Bengkulu/Region of South Sumatera, Jambi, and Bengkulu
90,59 54,20 42,50 41,94 42,27
Wilayah Bangka Belitung/Region of Bangka Belitung 101,13 101,13 157,00 91,78 89,46Wilayah Lampung/Region of Lampung 8,03 8,03 4,08 4,30 4,79Wilayah Kalimantan Barat/Region of West Kalimantan 293,55 293,75 365,02 230,51 222,41Wilayah Kalimantan Selatan dan Kalimantan Tengah/Region of South and Central Kalimantan
393,84 394,27 406,95 384,87 389,93
Wilayah Kalimantan Timur/Region of East Kalimantan 414,43 461,23 610,94 336,28 325,38Wilayah Sulawesi Utara, Sulawesi Tengah dan Gorontalo/Region of North, Central Sulawesi, and Gorontalo
389,47 358,03 550,56 380,99 383,38
Wilayah Sulawesi Selatan, Sulawesi Tenggara, dan Sulawesi Barat/Region of South, SouthEast, and West Sulawesi
517,93 517,93 474,44 456,75 592,03
Wilayah Maluku dan Maluku Utara/Region of Maluku and North Maluku
181,66 182,21 198,42 196,69 179,66
Wilayah Papua/Region of Papua 167,76 170,71 270,19 147,31 132,97Distribusi Bali/Distribution of Bali 4,02 3,69 3,69 3,84 3,84Wilayah Nusa Tenggara Barat/Region of West Nusa Tenggara 139,78 139,58 142,11 146,00 147,29Wilayah Nusa tenggara Timur/Region of East Nusa Tenggara 124,76 112,09 57,60 138,95 151,19PT PLN Batam 111,35 132,32 125,95 100,33 102,85PT PLN Tarakan 31,22 38,22 31,22 31,22 31,22Kit Sumbagut/Generation of Nothern Part of Sumatera 1 868,95 1 903,05 2 000,88 1 940,29 2 048,63Kit Sumbagsel/Generation of Southern Part of Sumatera 1 859,20 1 859,20 2 012,96 1 765,34 1 902,13Distribusi Jawa Timur/Jawa Timur Distribution 14,71 14,71 13,28 10,68 9,18Distribusi Jawa Tengah dan Yogyakarta/Jawa Tengah Distribution 0,70 0,70 0,70 0,70 0,70Distribusi Jawa Barat dan Banten/Jawa Barat Distribution 0,93 0,93 0,42 0,20 0,40PT. Indonesia Power 8 992,79 8 992,79 8 947,75 8 995,59 8 995,59Pembangkitan Tenaga Listrik Jawa-Bali (PT. PJB)/PT. Java-Bali GENCO
6 507,14 6 507,14 6 477,14 6 160,44 9 375,58
Pembangkitan Muara Tawar/Generation of Muara Tawar 858,00 858,00 858,00 858,00 858,00Pembangkitan PLTGU Cilegon/Generation of Cilegon 740,00 740,00 740,00 2 118,00 2 118,00Pembangkitan Tanjung Jati B/Generation of Tanjung Jati B 1 420,00 1 420,00 1 420,00 2 840,00 2 840,00Pembangkitan Lontar/Generation of Lontar – – 600,00 600,00 660,00Pembangkitan Indramayu/Generation of Indramayu – – – 930,00 930,00
Jumlah/Total 25 593,92 25 636,70 26 894,98 29 268,16 32 901,44
Daya Terpasang PT. PLN (Persero) Menurut Wilayah Operasi (MW), 2008–2012Installed Capacity by State Electricity Company (PT. PLN) by Operational Region (MW), 2008–2012
Tabel –––––– 6.2.2Table
Catatan/Note: x Angka sementara/Preliminary figures
http
://www.b
ps.g
o.id

P E R T A M B A N G A N D A N E N E R G I
S t a t i s t i k I n d o n e s i a 2 0 1 3280
Wilayah Operasi PLNPLN Operational Region 2008 2009 2010 2011 2012 x
(1) (2) (3) (4) (5) (6)
Wilayah Aceh/Region of Aceh 286,75 322,65 530,40 792,74 865,77Wilayah Sumatera Utara/Region of Sumatera Utara 16,55 87,56 173,86 320,48 350,00Wilayah Sumatera Barat/Region of West Sumatera 77,86 78,34 165,15 290,92 317,72Wilayah Riau/Region of Riau 754,60 792,11 930,14 1 266,49 1 383,16Wilayah Sumatera Selatan, Jambi dan Bengkulu/Region of South Sumatera, Jambi and Bengkulu
344,85 372,92 451,62 509,02 555,91
Wilayah Bangka Belitung/Region of Bangka Belitung 414,21 454,18 495,36 605,14 660,89Wilayah Lampung/Region of Lampung 7,88 2,69 41,68 271,56 296,58Wilayah Kalimantan Barat/Region of West Kalimantan 1 234,65 1 332,00 1 478,23 1 662,93 1 816,12Wilayah Kalimantan Selatan dan Kalimantan Tengah/Region of South and Central Kalimantan
1 939,65 2 125,96 2 295,35 2 618,09 2 859,27
Wilayah Kalimantan Timur/Region of East Kalimantan 1 731,65 1 942,15 2 198,09 2 377,45 2 596,46Wilayah Sulawesi Utara, Sulawesi Tengah dan Gorontalo/Region of North, Central Sulawesi, and Gorontalo
1 475,39 1 642,21 1 805,46 2 097,22 2 290,41
Wilayah Sulawesi Selatan, Sulawesi Tenggara, dan Sulawesi Barat/Region of South, SouthEast, and West Sulawesi
3 370,49 3 584,99 4 016,21 4 453,55 4 863,81
Wilayah Maluku dan Maluku Utara/Region of Maluku and North Maluku
459,97 476,50 542,98 628,18 686,05
Wilayah Papua/Region of Papua 679,17 742,84 854,25 938,65 1 025,12Distribusi Bali/Distribution of Bali 8,83 13,08 14,03 15,94 17,41Wilayah Nusa Tenggara Barat/Region of West Nusa Tenggara 711,92 790,15 852,24 958,45 1 046,74Wilayah Nusa tenggara Timur/Region of East Nusa Tenggara 371,34 422,40 474,16 531,33 580,28PT PLN Batam 1 332,46 1 397,17 1 556,94 1 631,74 1 782,06PT PLN Tarakan 167,72 178,14 189,23 191,04 208,64Kit Sumbagut/Generation of Nothern Part of Sumatera 8 787,47 9 237,96 9 719,08 9 642,64 10 530,92Kit Sumbagsel/Generation of Southern Part of Sumatera 7 173,35 7 945,59 9 130,38 9 031,32 9 863,28P3B Sumatera/Sumatera Transformation and Control Centre 1 964,89 2 603,29 2 030,77 3 503,69 3 826,45Distribusi Jawa Timur/Jawa Timur Distribution 22,47 21,08 20,28 63,12 68,93Distr. Jawa Tengah dan Yogyakarta/Jawa Tengah Distr. 25,45 12,93 15,54 4,94 5,40Distribusi Jawa Barat dan Banten/Jawa Barat Distribution 49,92 71,77 95,86 33,65 36,75Distribusi Jakarta Raya dan Tangerang/Jakarta Raya and Tangerang Distribution
– 0,40 1,60 10,05 10,98
PT. Indonesia Power 44 283,43 42 793,02 47 532,56 45 028,14 49 176,11Pembangkitan Tenaga Listrik Jawa-Bali (PT. PJB)/PT. Java-Bali GENCO
30 282,01 30 852,12 29 841,20 29 331,48 32 033,48
P3B Jawa Bali/Java Bali Transformation and Control Centre 26 508,06 30 213,08 31 785,91 32 388,75 35 372,39Pembangkitan Muara Tawar/Generation of Muara Tawar 1 921,65 3 929,73 3 163,86 3 694,44 4 034,77Pembangkitan PLTGU Cilegon/Generation of Cilegon 3 793,67 3 997,92 5 184,98 9 360,77 10 223,08Pembangkitan Tanjung Jati B/Generation of Tanjung Jati B 9 238,18 8 900,35 10 102,89 13 583,09 14 834,36Pembangkitan Lontar/Generation of Lontar – – 2 095,94 2 397,41 2 618,26Pembangkitan Indramayu/Generation of Indramayu – – – 3 186,51 3 480,05
Jumlah/Total 149 436,49 157 337,28 169 786,23 183 420,92 200 317,57
Catatan/Note: x Angka sementara/Preliminary figures 1 Listrik yang dibangkitkan sendiri dan dibeli dari luar PLN/Own generated electricity and purchased by PLN from other companies
Produksi Listrik 1 PT. PLN (Persero) Menurut Wilayah Operasi (ribu MWh), 2008–2012Electricity Produced 1 by State Electricity Company (PT. PLN) by Operational Region (thousand MWh), 2008–2012
Tabel –––––– 6.2.3Table
http
://www.b
ps.g
o.id

M I N I N G A N D E N E R G Y
S t a t i s t i c a l Y e a r b o o k o f I n d o n e s i a 2 0 1 3 281
Wilayah Operasi PLNPLN Operational Region 2008 2009 2010 2011 2012 x
(1) (2) (3) (4) (5) (6)
Wilayah Aceh/Region of Aceh 1 149,70 1 276,45 1 494,94 1 579,77 1 755,07Wilayah Sumatera Utara/Region of Sumatera Utara 5 757,85 6 096,90 6 636,45 7 194,04 7 809,32Wilayah Sumatera Barat/Region of West Sumatera 1 940,01 2 006,52 2 187,29 2 403,09 2 649,07Wilayah Riau/Region of Riau 2 028,83 2 183,43 2 509,89 2 844,55 3 269,62Wilayah Sumatera Selatan, Jambi dan Bengkulu/Region of South Sumatera, Jambi and Bengkulu
3 291,63 3 637,06 4 154,92 4 506,14 5 262,26
Wilayah Bangka Belitung/Region of Bangka Belitung 366,19 398,76 436,76 535,61 664,73Wilayah Lampung/Region of Lampung 1 902,30 2 024,03 2 259,45 2 425,94 2 793,36Wilayah Kalimantan Barat/Region of West Kalimantan 1 069,81 1 155,65 1 288,97 1 434,71 1 603,72Wilayah Kalimantan Selatan dan Kalimantan Tengah/Region of South and Central Kalimantan
1 623,98 1 768,88 1 902,01 2 117,09 2 440,79
Wilayah Kalimantan Timur/Region of East Kalimantan 1 546,51 1 720,96 1 939,97 2 099,60 2 334,31Wilayah Sulawesi Utara, Sulawesi Tengah dan Gorontalo/Region of North, Central Sulawesi, and Gorontalo
1 273,71 1 420,11 1 571,29 1 797,86 2 066,37
Wilayah Sulawesi Selatan, Sulawesi Tenggara, dan Sulawesi Barat/Region of South, SouthEast, and West Sulawesi
2 944,02 3 167,40 3 505,50 3 839,02 4 345,67
Wilayah Maluku dan Maluku Utara/Region of Maluku and North Maluku
402,57 422,95 462,60 541,36 633,38
Wilayah Papua/Region of Papua 593,34 661,44 745,45 827,88 947,33Distribusi Bali/Distribution of Bali 2 551,10 2 788,65 3 090,93 3 223,95 3 546,60Wilayah Nusa Tenggara Barat/Region of West Nusa Tenggara 621,78 688,91 745,15 837,16 976,39Wilayah Nusa tenggara Timur/Region of East Nusa Tenggara 338,56 382,71 429,37 486,91 567,39PT PLN Batam 1 234,62 1 296,41 1 452,92 1 526,89 1 644,22PT PLN Tarakan 159,05 165,71 176,91 177,62 168,03Distribusi Jawa Timur/Jawa Timur Distribution 20 334,16 21 058,18 22 469,54 24 018,69 26 910,19Distribusi Jawa Tengah dan Yogyakarta/Jawa Tengah Distribution 14 232,49 15 084,19 16 202,94 17 185,65 18 644,17Distribusi Jawa Barat dan Banten/Jawa Barat Distribution 34 050,98 34 789,07 38 671,25 41 327,76 44 790,10Distribusi Jakarta Raya dan Tangerang/Jakarta Raya and Tangerang Distribution
29 605,66 30 387,62 32 965,99 35 061,38 38 168,76
Jumlah/Total 129 018,85 134 581,99 147 300,49 157 992,67 173 990,75
Listrik Terjual PT. PLN (Persero) Menurut Wilayah Operasi(ribu MWh), 2008–2012Sold Electricity by State Electricity Company (PT. PLN) by Operational Region (thousand MWh), 2008–2012
Tabel –––––– 6.2.4Table
Catatan/Note: x Angka sementara/Preliminary figures
http
://www.b
ps.g
o.id

P E R T A M B A N G A N D A N E N E R G I
S t a t i s t i k I n d o n e s i a 2 0 1 3282
[Diolah dari Hasil Survei Tahunan Perusahaan Listrik, BPS/Based on Electricity Company Survey, BPS‒Statistics Indonesia]
RincianDescription
SatuanUnit 2008 2009 2010 2011 2012 x
(1) (2) (3) (4) (5) (6) (7)
Jumlah Tenaga KerjaNumber of Employee
OrangPerson
42 715 42 096 43 638 44 343 43 739
Daya TerpasangInstalled Capacity
MW 25 574 25 637 32 889 r 35 295 37 701
Produksi ListrikProduced Electricity
000 MWh 148 058 156 797 175 976 184 173 211 846
Tenaga Listrik yang TerjualSold Electricity
000 MWh 129 018 134 582 149 807 158 694 165 474
Biaya InputInput
000 000 Rupiah/Rupiahs
132 293 754 106 791 597 123 585 525 182 498 874 193 144 760
Nilai OutputGross Output
000 000Rupiah/Rupiahs
86 425 893 90 938 497 107 448 424 116 491 318 124 695 830
Catatan/Note: r Angka diperbaiki/Revised figures x Angka sementara/Preliminary figures Mulai 2010 mencakup seluruh perusahaan listrik baik PLN maupun Non PLN/From 2010 included all electricity company not only PLN but
also non-PLN
Indikator Penting Perusahaan Listrik, 2008–2012Selected Indicators of Electricity Company, 2008–2012
Tabel –––––– 6.2.5Table
http
://www.b
ps.g
o.id

M I N I N G A N D E N E R G Y
S t a t i s t i c a l Y e a r b o o k o f I n d o n e s i a 2 0 1 3 283
[Diolah dari Hasil Survei Tahunan Perusahaan Gas, BPS/Based on Gas Company Survey, BPS‒Statistics Indonesia]
RincianDescription
SatuanUnit 2008 2009 2010 2011 2012 x
(1) (2) (3) (4) (5) (6) (7)
Jumlah Unit UsahaNumber of Establishments
Unit UsahaEstablishments
13 13 15 20 26
Jumlah Tenaga KerjaNumber of Employees
OrangPerson
1 350 1 333 2 062 r 2 092 2 296
Pengeluaran Tenaga KerjaLabor Costs
000 000 Rupiah/Rupiahs
257 510 316 251 534 731 r 556 909 579 087
Gas Kota yang DidistribusikanVolume of Distributed Pipe Gas
000 m3 5 922 130 8 094 955 15 788 888 r 15 922 823 16 056 786
Biaya InputInput Costs
000 000 Rupiah/Rupiahs
8 683 809 10 906 515 16 930 418 r 17 516 044 18 101 670
Nilai OutputGross Output
000 000 Rupiah/Rupiahs
12 793 849 18 024 279 37 063 171 r 38 076 960 39 090 749
Catatan/Note: r Angka diperbaiki/Revised figures x Angka sementara/Preliminary figures Mulai 2010 mencakup seluruh perusahaan gas baik PGN maupun non PGN/From 2010 included all gas company not only PGN but also
non-PGN
Indikator Penting Perusahaan Gas, 2008–2012Selected Indicators of Gas Company, 2008–2012
Tabel –––––– 6.2.6Table
http
://www.b
ps.g
o.id
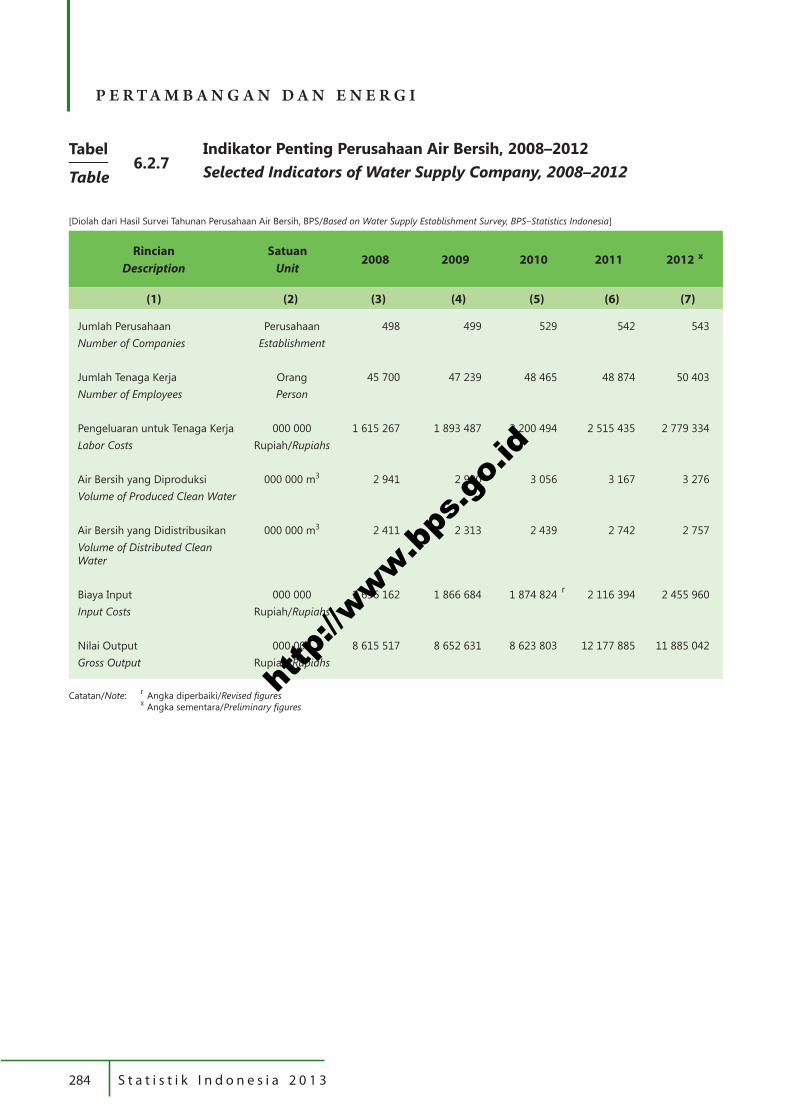
P E R T A M B A N G A N D A N E N E R G I
S t a t i s t i k I n d o n e s i a 2 0 1 3284
[Diolah dari Hasil Survei Tahunan Perusahaan Air Bersih, BPS/Based on Water Supply Establishment Survey, BPS‒Statistics Indonesia]
RincianDescription
SatuanUnit
2008 2009 2010 2011 2012 x
(1) (2) (3) (4) (5) (6) (7)
Jumlah Perusahaan Perusahaan 498 499 529 542 543Number of Companies Establishment
Jumlah Tenaga Kerja Orang 45 700 47 239 48 465 48 874 50 403Number of Employees Person
Pengeluaran untuk Tenaga Kerja 000 000 1 615 267 1 893 487 2 200 494 2 515 435 2 779 334Labor Costs Rupiah/Rupiahs
Air Bersih yang Diproduksi 000 000 m3 2 941 2 900 3 056 3 167 3 276Volume of Produced Clean Water
Air Bersih yang Didistribusikan 000 000 m3 2 411 2 313 2 439 2 742 2 757Volume of Distributed Clean Water
Biaya Input 000 000 1 696 162 1 866 684 1 874 824 r 2 116 394 2 455 960Input Costs Rupiah/Rupiahs
Nilai Output 000 000 8 615 517 8 652 631 8 623 803 12 177 885 11 885 042Gross Output Rupiah/Rupiahs
Catatan/Note: r Angka diperbaiki/Revised figures x Angka sementara/Preliminary figures
Indikator Penting Perusahaan Air Bersih, 2008–2012Selected Indicators of Water Supply Company, 2008–2012
Tabel –––––– 6.2.7Table
http
://www.b
ps.g
o.id

7INDUSTRI MANUFAKTURManufacturing Industry
http
://www.b
ps.g
o.id

http
://www.b
ps.g
o.id

M A N U F A C T U R I N G I N D U S T R Y
S t a t i s t i c a l Y e a r b o o k o f I n d o n e s i a 2 0 1 3 287
PENJELASAN TEKNIS
1. Pengumpulan data industri besar dan sedang dilakukan melalui Survei Industri Besar dan Sedang yang dilaksanakan setiap tahun secara lengkap (sensus) sejak tahun 1975. Survei Industri Besar dan Sedang mencakup semua perusahaan industri yang mempunyai tenaga kerja 20 orang atau lebih dengan menggunakan kuesioner II A.
2. Klasifikasi industri yang digunakan dalam survei ini berdasar kepada Klasifikasi Baku Lapangan Usaha Indonesia (KBLI). KBLI adalah klasifikasi lapangan usaha yang berdasar kepada International Standard Industrial Classification of All Economic Activities (ISIC) revisi 3 yang telah disesuaikan dengan kondisi Indonesia.
3. Industri manufaktur adalah suatu kegiatan ekonomi yang melakukan kegiatan mengubah suatu barang dasar secara mekanis, kimia, atau dengan tangan sehingga menjadi barang jadi/setengah jadi, dan atau barang yang kurang nilainya menjadi barang yang lebih tinggi nilainya, dan sifatnya lebih dekat kepada pemakai akhir. Termasuk dalam kegiatan ini adalah jasa industri dan pekerjaan perakitan.
4. Jasa industri adalah kegiatan industri yang melayani keperluan pihak lain. Pada kegiatan ini bahan baku disediakan oleh pihak lain sedangkan pihak pengolah hanya melakukan pengolahannya dengan mendapat imbalan sebagai balas jasa (upah maklon).
5. Perusahaan atau usaha industri adalah suatu unit (kesatuan) usaha yang melakukan kegiatan ekonomi, bertujuan menghasilkan barang atau jasa, terletak pada suatu bangunan atau lokasi tertentu, dan mempunyai catatan administrasi tersendiri mengenai produksi dan struktur biaya serta ada seorang atau lebih yang bertanggung jawab atas usaha tersebut.
6. Industri manufaktur dikelompokkan ke dalam 4 golongan berdasarkan banyaknya pekerja, yaitu: industri besar (100 orang pekerja atau lebih), industri sedang/menengah (20–99 orang pekerja), industri kecil (5–19 orang pekerja), dan industri mikro (1–4 orang pekerja).
TECHNICAL NOTES
1. Data collection of large and medium scale manufacturing is conducted through The Large and Medium Manufacturing Establishment Survey that has been done annually for all industries (census) since 1975. Large and Medium Manufacturing Establishment Survey covers all manufactures/industries with 20 workers or more by questionaire II A.
2. The industrial clasification adopted in this survey refers to the Klasifikasi Baku Lapangan Usaha Indonesia (KBLI). KBLI is classification of economic activities based on the International Standard Industrial Classification of All Economic Activities (ISIC rev 3) that has been modified according to the local condition in Indonesia.
3. Manufacturing industry is defined as an economic activity processing basic goods mechanically, chemicals or manually into final or intermediate goods. It is also defined as processing of lower value goods into higher value goods as final or intermediate products. The activities also include services for manufacturing and assembling.
4. Services for manufacturing is defined as a manufac-turing activity which serving other manufacturing establishments. In this case, raw materials are supplied by others while the workers are paid as a compensation for processing raw materials.
5. A manufacturing establishment is defined as a production unit engaged in economic activity, producing goods or services, located in a building or in a certain location, keeping a business record concerning the production and cost structure, and having a person or more that are responsible to those activities.
6. Manufacturing industries are categorized into four groups, based on the number of employees: large scale manufacturing (100 employees or more), medium scale manufacturing (20–99 employees), small scale manufacturing (5–19 employees), and micro industry (1–4 employees).
http
://www.b
ps.g
o.id
I N D U S T R I M A N U F A K T U R
S t a t i s t i k I n d o n e s i a 2 0 1 3288
7. Input atau biaya antara adalah biaya yang dikeluarkan dalam proses industri yang berupa bahan baku, bahan bakar, barang lainnya diluar bahan baku/bahan penolong, jasa industri, sewa gedung, dan biaya jasa nonindustri.
8. Output adalah nilai keluaran yang dihasilkan dari proses kegiatan industri yang berupa barang yang dihasilkan, tenaga listrik yang dijual, jasa industri, keuntungan jual beli, pertambahan stok barang setengah jadi, dan penerimaan lain.
9. Nilai tambah adalah besarnya output dikurangi besarnya nilai input (antara).
10. Pengeluaran untuk tenaga kerja adalah merupakan imbalan atas jasa-jasa yang telah dikorbankan oleh pekerja untuk pihak lain yang meliputi upah/gaji, upah lembur, hadiah, bonus dan sejenisnya, iuran dana pensiun, tunjangan sosial, tunjangan kecelakaan, dan lainnya.
11. Modal tetap adalah modal kerja yang dapat digunakan lebih dari satu tahun.
12. Pajak tidak langsung adalah pajak yang langsung dibayarkan oleh perusahaan, termasuk PPn.
13. Bahan baku adalah bahan-bahan yang digunakan untuk proses produksi dalam membentuk suatu barang produksi.
14. Barang yang dihasilkan adalah barang yang dihasilkan dalam proses produksi.
15. Mulai tahun 2010, indeks produksi industri besar dan sedang/menengah menggunakan kerangka sampel tahun 2009. Sesuai dengan kerangka sampel maka indeks hanya dapat disajikan dalam 2 digit ISIC Revisi 3
16. Metodologi penarikan sampel menggunakan “Cut off Point “ dan “Probability Proportional to Size” (PPS).
17. Formula/penghitungan indeks produksi bulanan mengikuti langkah-langkah sebagai berikut:
7. Input or intermediate cost is defined as cost of raw materials and supporting materials, fuel, other materials, electricity, industrial services, building rent, and nonindustrial services, etc.
8. Output is defined as total value of all processed goods which include production, electricity sold, industrial services, profits, change in stocks and other incomes.
9. Value added is defined as substraction from output to input.
10. Labor cost is defined as compensation for workers in the form of money and goods. Labor cost covers wage and salary, overtime pay, bonus in cash and goods, pension funds, social allowance, accident allowance, etc.
11. Fixed asset is working capital that can be used for more than one year.
12. Indirect tax is tax paid by establishment including value added taxes (PPn).
13. Raw material is materials used in the production process of production goods.
14. Outcome product is goods related in the production process.
15. Since 2010, the industrial production indices of large and medium manufacturing have been calculated based on the 2009 sampling frame. Using this sampling frame, the indices can be calculated only in 2 digits of ISIC 3rd Revision.
16. The methodology of the sample selection was based on “Cut off Point” and “Probability Proportional to Size” (PPS).
17. Formula/steps in computing of quantity production indices are as follows:
http
://www.b
ps.g
o.id
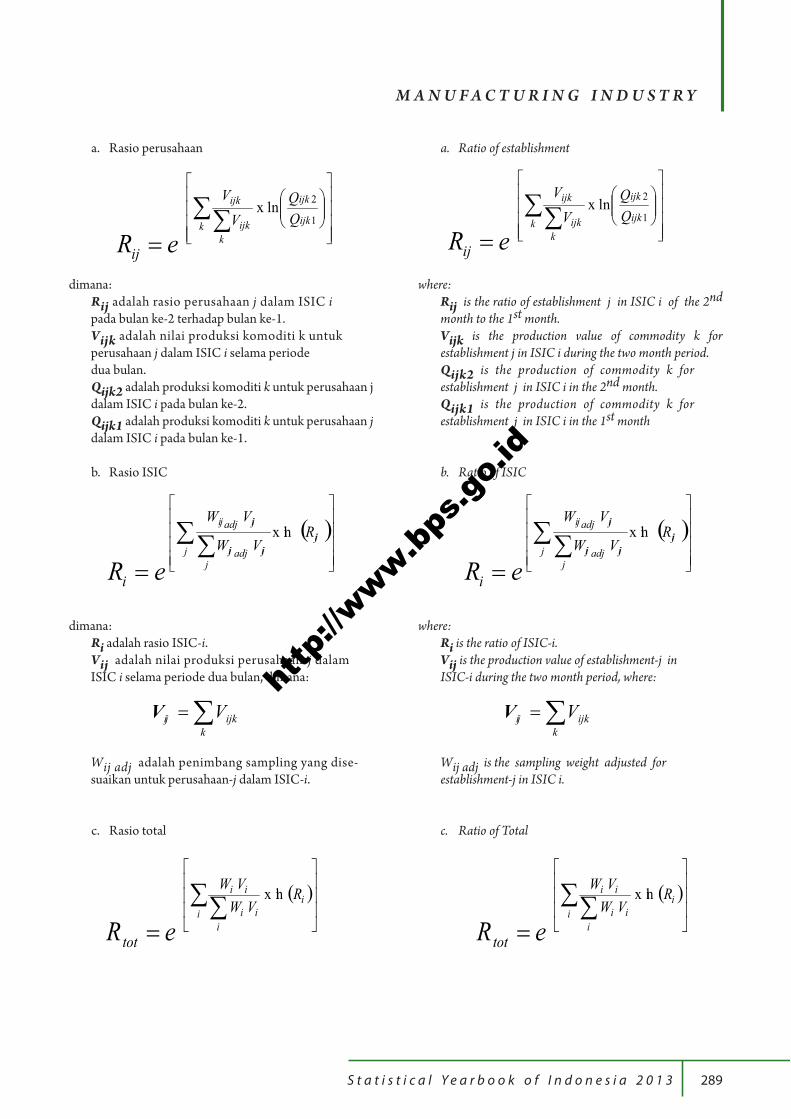
M A N U F A C T U R I N G I N D U S T R Y
S t a t i s t i c a l Y e a r b o o k o f I n d o n e s i a 2 0 1 3 289
a. Rasio perusahaan
dimana: Rij adalah rasio perusahaan j dalam ISIC i
pada bulan ke-2 terhadap bulan ke-1. Vijk adalah nilai produksi komoditi k untuk
perusahaan j dalam ISIC i selama periode dua bulan.
Qijk2 adalah produksi komoditi k untuk perusahaan j dalam ISIC i pada bulan ke-2.
Qijk1 adalah produksi komoditi k untuk perusahaan j dalam ISIC i pada bulan ke-1.
b. Rasio ISIC
dimana: Ri adalah rasio ISIC-i. Vij adalah nilai produksi perusahaan-j dalam
ISIC i selama periode dua bulan, dimana:
Wij adj adalah penimbang sampling yang dise- suaikan untuk perusahaan-j dalam ISIC-i.
c. Rasio total
a. Ratio of establishment
where: Rij is the ratio of establishment j in ISIC i of the 2nd
month to the 1st month. Vijk is the production value of commodity k for
establishment j in ISIC i during the two month period. Qijk2 is the production of commodity k for
establishment j in ISIC i in the 2nd month. Qijk1 is the production of commodity k for
establishment j in ISIC i in the 1st month
b. Ratio of ISIC
where: Ri is the ratio of ISIC-i. Vij is the production value of establishment-j in ISIC-i during the two month period, where:
Wij adj is the sampling weight adjusted for establishment-j in ISIC i.
c. Ratio of Total
⎥⎥⎥⎥
⎦
⎤
⎢⎢⎢⎢
⎣
⎡
⎟⎟⎠
⎞⎜⎜⎝
⎛∑∑=
k ijk
ijk
kijk
ijk
VV
ij eR1
2lnx
⎥⎥⎥⎥
⎦
⎤
⎢⎢⎢⎢
⎣
⎡
⎟⎟⎠
⎞⎜⎜⎝
⎛∑∑=
k ijk
ijk
kijk
ijk
VV
ij eR1
2lnx
( )⎥⎥⎥⎥
⎦
⎤
⎢⎢⎢⎢
⎣
⎡
∑∑=
jij
jijadjij
ijadjijR
VW
VW
i eRlnx ( )
⎥⎥⎥⎥
⎦
⎤
⎢⎢⎢⎢
⎣
⎡
∑∑=
jij
jijadjij
ijadjijR
VW
VW
i eRlnx
∑=k
ijkij VV ∑=k
ijkij VV
( )⎥⎥⎥
⎦
⎤
⎢⎢⎢
⎣
⎡
∑∑=
ii
iii
ii RVW
VW
tot eRlnx ( )
⎥⎥⎥
⎦
⎤
⎢⎢⎢
⎣
⎡
∑∑=
ii
iii
ii RVW
VW
tot eRlnx
http
://www.b
ps.g
o.id
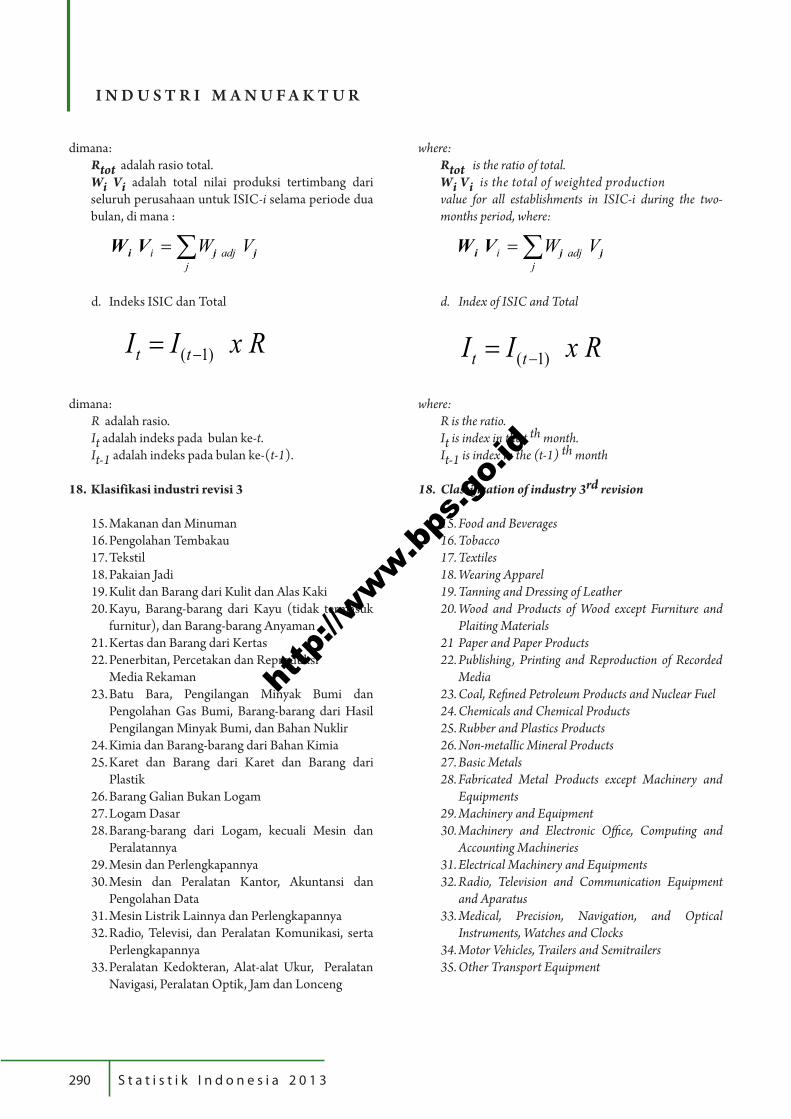
I N D U S T R I M A N U F A K T U R
S t a t i s t i k I n d o n e s i a 2 0 1 3290
dimana: Rtot adalah rasio total. Wi Vi adalah total nilai produksi tertimbang dari
seluruh perusahaan untuk ISIC-i selama periode dua bulan, di mana :
d. Indeks ISIC dan Total
dimana: R adalah rasio. It adalah indeks pada bulan ke-t. It-1 adalah indeks pada bulan ke-(t-1).
18. Klasifikasi industri revisi 3
15. Makanan dan Minuman16. Pengolahan Tembakau17. Tekstil18. Pakaian Jadi19. Kulit dan Barang dari Kulit dan Alas Kaki20. Kayu, Barang-barang dari Kayu (tidak termasuk
furnitur), dan Barang-barang Anyaman21. Kertas dan Barang dari Kertas22. Penerbitan, Percetakan dan Reproduksi Media Rekaman23. Batu Bara, Pengilangan Minyak Bumi dan
Pengolahan Gas Bumi, Barang-barang dari Hasil Pengilangan Minyak Bumi, dan Bahan Nuklir
24. Kimia dan Barang-barang dari Bahan Kimia25. Karet dan Barang dari Karet dan Barang dari
Plastik26. Barang Galian Bukan Logam27. Logam Dasar28. Barang-barang dari Logam, kecuali Mesin dan
Peralatannya29. Mesin dan Perlengkapannya30. Mesin dan Peralatan Kantor, Akuntansi dan
Pengolahan Data31. Mesin Listrik Lainnya dan Perlengkapannya32. Radio, Televisi, dan Peralatan Komunikasi, serta
Perlengkapannya33. Peralatan Kedokteran, Alat-alat Ukur, Peralatan
Navigasi, Peralatan Optik, Jam dan Lonceng
where: Rtot is the ratio of total. Wi Vi is the total of weighted production
value for all establishments in ISIC-i during the two-months period, where:
d. Index of ISIC and Total
where: R is the ratio. It is index in the t th month. It-1 is index in the (t-1) th month
18. Classification of industry 3rd revision
15. Food and Beverages16. Tobacco17. Textiles18. Wearing Apparel19. Tanning and Dressing of Leather20. Wood and Products of Wood except Furniture and
Plaiting Materials21 Paper and Paper Products22. Publishing, Printing and Reproduction of Recorded
Media23. Coal, Refined Petroleum Products and Nuclear Fuel24. Chemicals and Chemical Products25. Rubber and Plastics Products26. Non-metallic Mineral Products27. Basic Metals28. Fabricated Metal Products except Machinery and
Equipments29. Machinery and Equipment30. Machinery and Electronic Office, Computing and
Accounting Machineries31. Electrical Machinery and Equipments32. Radio, Television and Communication Equipment
and Aparatus33. Medical, Precision, Navigation, and Optical
Instruments, Watches and Clocks34. Motor Vehicles, Trailers and Semitrailers35. Other Transport Equipment
RxII tt )1( −= RxII tt )1( −=
∑=j
ijadjiji VWVWi ∑=j
ijadjiji VWVWi
http
://www.b
ps.g
o.id
M A N U F A C T U R I N G I N D U S T R Y
S t a t i s t i c a l Y e a r b o o k o f I n d o n e s i a 2 0 1 3 291
34. Kendaraan Bermotor35. Alat Angkutan, selain Kendaraan Bermotor Roda
Empat atau Lebih36. Furnitur dan Pengolahan Lainnya37. Daur Ulang
19. Klasifikasi industri revisi 4
10. Makanan 11. Minuman12. Pengolahan Tembakau 13. Tekstil14. Pakaian Jadi15. Kulit, Barang dari Kulit dan Alas Kaki16. Kayu, Barang dari Kayu dan Gabus (Tidak
Termasuk Furnitur) dan Barang Anyaman dari Bambu, Rotan dan Sejenisnya
17. Kertas dan Barang dari Kertas 18. Pencetakan dan Reproduksi Media Rekaman19. Produk dari Batu Bara dan Pengilangan Minyak
Bumi20. Bahan Kimia dan Barang dari Bahan Kimia21. Farmasi, Produk Obat Kimia dan Obat
Tradisional22. Karet, Barang dari Karet dan Plastik23. Barang Galian Bukan Logam 24. Logam Dasar25. Barang Logam, Bukan Mesin dan Peralatannya26. Komputer, Barang Elektronik dan Optik27. Peralatan Listrik28. Mesin dan Perlengkapan Ytdl29. Kendaraan Bermotor, Trailer dan Semi Trailer30. Alat Angkutan Lainnya31. Furnitur32. Pengolahan Lainnya33. Jasa Reparasi dan Pemasangan Mesin dan
Peralatan
20. Pengumpulan data Industri Mikro dan Kecil (IMK) dilaksanakan pada tahun 1991, 1993, 1994, dan 1995 melalui Survei Industri Kecil dan Kerajinan Rumah tangga (IKKR). Data IMK tahun 1996 dikumpulkan melalui Sensus Ekonomi (SE96) dan sejak tahun 1998 data IMK dikumpulkan melalui Survei Usaha Terintegrasi (SUSI). Sedangkan data IMK tahun 2006 dikumpulkan melalui Sensus Ekonomi (SE06-SS). Data tahun 2007 dan 2008 merupakan angka estimasi, karena tidak ada pengumpulan data. Mulai tahun 2009 data dikumpulkan melalui Survei IMK.
36. Furniture and Other Manufacturing37. Recycling
19. Classification of industry 4th revision
10. Food11. Beverages12. Tobacco Products13. Textiles14. Wearing Apparels15. Leather and Related Products and Footwear16. Wood and of Products of Wood and Cork, Except
Furniture manufacture of Articles of Straw and Plaiting Materials, Bamboo, Rattan and Kinds
17. Paper and Paper Products18. Printing and Reproduction of Recorded Media19. Coke and Refined Petroleum Products20. Chemicals and Chemical Products21. Pharmaceuticals, Medicinal Chemical and Botanical
Products22. Rubber and Plastic Products23. Other Non Metallic Mineral Products 24. Basic Metals25. Fabricated Metal Products, Excepts Machinery and
Equipment26. Computers, Electronic and Optical Products27. Electrical Equipment28. Machinery and Equipment N.E.C29. Motor Vehicles, Trailers and Semi Trailers30. Other Transport Equipment31. Furniture32. Other Manufacturing33. Repair and Installation of Machinery and
Equipment
20. The data collection of micro and small scale industries was conducted through the Small Scale and Household/Cottage Industry Survey in 1991, 1993, 1994, and 1995. The 1996 data was collected through the 1996 Economic Census and since 1998 the data were collected through Integrated Establishment Survey. While the 2006 micro and small scale industries data were collected through the Cencus Sample of the 2006 Economic Census. The 2007 and 2008 were estimated figures, because there were no data collection. Since 2009 the data were collected through the Micro and Small scale Industry Survey.
http
://www.b
ps.g
o.id
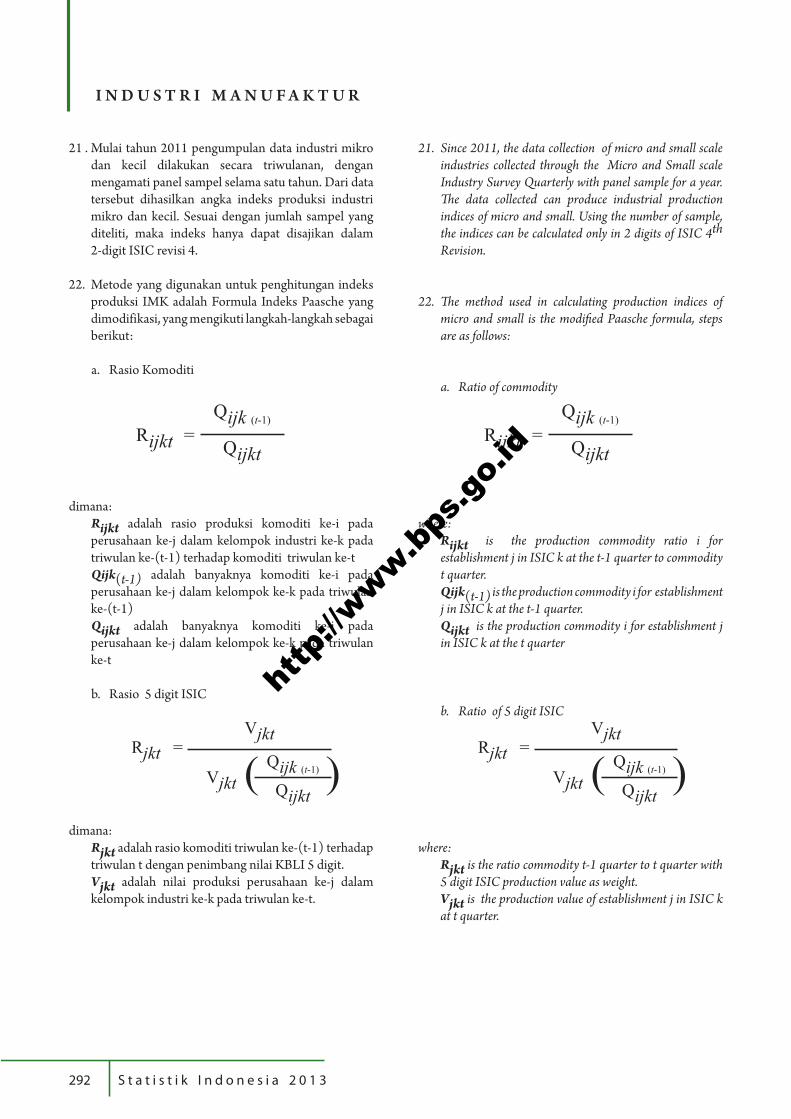
I N D U S T R I M A N U F A K T U R
S t a t i s t i k I n d o n e s i a 2 0 1 3292
21 . Mulai tahun 2011 pengumpulan data industri mikro dan kecil dilakukan secara triwulanan, dengan mengamati panel sampel selama satu tahun. Dari data tersebut dihasilkan angka indeks produksi industri mikro dan kecil. Sesuai dengan jumlah sampel yang diteliti, maka indeks hanya dapat disajikan dalam 2-digit ISIC revisi 4.
22. Metode yang digunakan untuk penghitungan indeks produksi IMK adalah Formula Indeks Paasche yang dimodifikasi, yang mengikuti langkah-langkah sebagai berikut:
a. Rasio Komoditi
dimana: Rijkt adalah rasio produksi komoditi ke-i pada
perusahaan ke-j dalam kelompok industri ke-k pada triwulan ke-(t-1) terhadap komoditi triwulan ke-t
Qijk(t-1) adalah banyaknya komoditi ke-i pada perusahaan ke-j dalam kelompok ke-k pada triwulan ke-(t-1)
Qijkt adalah banyaknya komoditi ke-i pada perusahaan ke-j dalam kelompok ke-k pada triwulan ke-t
b. Rasio 5 digit ISIC
dimana: Rjkt adalah rasio komoditi triwulan ke-(t-1) terhadap
triwulan t dengan penimbang nilai KBLI 5 digit. Vjkt adalah nilai produksi perusahaan ke-j dalam
kelompok industri ke-k pada triwulan ke-t.
21. Since 2011, the data collection of micro and small scale industries collected through the Micro and Small scale Industry Survey Quarterly with panel sample for a year. The data collected can produce industrial production indices of micro and small. Using the number of sample, the indices can be calculated only in 2 digits of ISIC 4th Revision.
22. The method used in calculating production indices of micro and small is the modified Paasche formula, steps are as follows:
a. Ratio of commodity
where: Rijkt is the production commodity ratio i for
establishment j in ISIC k at the t-1 quarter to commodity t quarter.
Qijk(t-1) is the production commodity i for establishment j in ISIC k at the t-1 quarter.
Qijkt is the production commodity i for establishment j in ISIC k at the t quarter
b. Ratio of 5 digit ISIC
where: Rjkt is the ratio commodity t-1 quarter to t quarter with
5 digit ISIC production value as weight. Vjkt is the production value of establishment j in ISIC k
at t quarter.
Rijkt =Qijk (t-1)
QijktRijkt =
Qijk (t-1)
Qijkt
Rjkt =Vjkt
VjktQijk (t-1)
Qijkt( (
Rjkt =Vjkt
VjktQijk (t-1)
Qijkt( (
http
://www.b
ps.g
o.id

M A N U F A C T U R I N G I N D U S T R Y
S t a t i s t i c a l Y e a r b o o k o f I n d o n e s i a 2 0 1 3 293
c. Ratio of 2 digit ISIC and Total
where: Rkt is the ratio of 2 digit ISIC and total with value added
as weight. Wkt is the weight for ISIC k in t quarter.
d. Index of ISIC and Total
where: It is index of ISIC and total. I(t-1) is index in the t-1 quarter. R is the ratio of 2 digit ISIC or ratio of total.
c. Rasio KBLI 2 digit dan Total
dimana: Rkt adalah rasio KBLI 2 digit dan rasio total dengan
menggunakan penimbang nilai tambah. Wkt adalah penimbang nilai tambah pada kelompok
industri ke-k pada triwulan ke-t.
d. Indeks KBLI dan Indeks Total
dimana: It adalah indeks KBLI dan total. I(t-1) adalah indeks pada triwulan ke t-1. R adalah ratio KBLI 2 digit atau rasio total
Rkt =WktVjkt
WktVjktQijk (t-1)
Qijkt( (
Rkt =WktVjkt
WktVjktQijk (t-1)
Qijkt( (
It = I(t-1) x R x 100 It = I(t-1) x R x 100
http
://www.b
ps.g
o.id
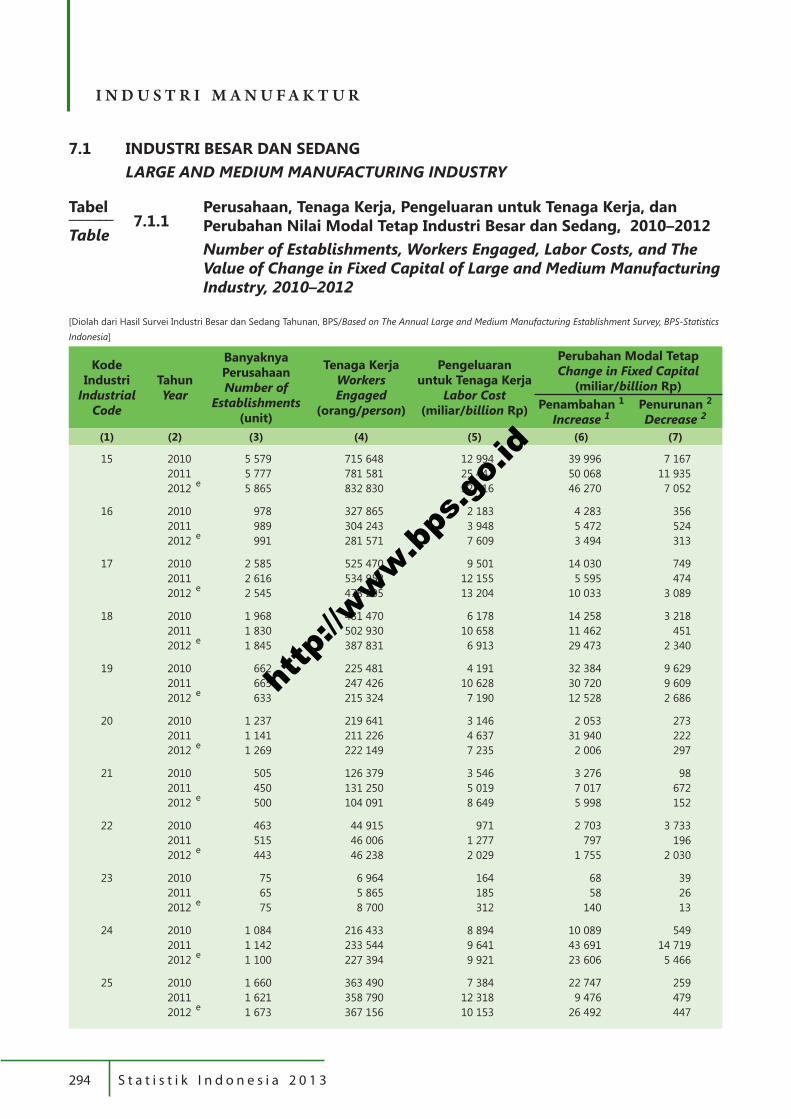
I N D U S T R I M A N U F A K T U R
S t a t i s t i k I n d o n e s i a 2 0 1 3294
Perusahaan, Tenaga Kerja, Pengeluaran untuk Tenaga Kerja, dan Perubahan Nilai Modal Tetap Industri Besar dan Sedang, 2010–2012Number of Establishments, Workers Engaged, Labor Costs, and The Value of Change in Fixed Capital of Large and Medium Manufacturing Industry, 2010–2012
7.1 INDUSTRI BESAR DAN SEDANG LARGE AND MEDIUM MANUFACTURING INDUSTRY
Tabel ––––––
7.1.1Table
[Diolah dari Hasil Survei Industri Besar dan Sedang Tahunan, BPS/Based on The Annual Large and Medium Manufacturing Establishment Survey, BPS-Statistics Indonesia]
Kode Industri
Industrial Code
TahunYear
Banyaknya Perusahaan Number of
Establishments (unit)
Tenaga Kerja Workers Engaged
(orang/person)
Pengeluaranuntuk Tenaga Kerja
Labor Cost(miliar/billion Rp)
Perubahan Modal Tetap Change in Fixed Capital
(miliar/billion Rp)Penambahan 1
Increase 1Penurunan 2Decrease 2
(1) (2) (3) (4) (5) (6) (7)
15 2010 5 579 715 648 12 994 39 996 7 1672011 5 777 781 581 25 442 50 068 11 9352012 e 5 865 832 830 32 416 46 270 7 052
16 2010 978 327 865 2 183 4 283 3562011 989 304 243 3 948 5 472 5242012 e 991 281 571 7 609 3 494 313
17 2010 2 585 525 470 9 501 14 030 7492011 2 616 534 952 12 155 5 595 4742012 e 2 545 478 205 13 204 10 033 3 089
18 2010 1 968 481 470 6 178 14 258 3 2182011 1 830 502 930 10 658 11 462 4512012 e 1 845 387 831 6 913 29 473 2 340
19 2010 662 225 481 4 191 32 384 9 6292011 665 247 426 10 628 30 720 9 6092012 e 633 215 324 7 190 12 528 2 686
20 2010 1 237 219 641 3 146 2 053 2732011 1 141 211 226 4 637 31 940 2222012 e 1 269 222 149 7 235 2 006 297
21 2010 505 126 379 3 546 3 276 982011 450 131 250 5 019 7 017 6722012 e 500 104 091 8 649 5 998 152
22 2010 463 44 915 971 2 703 3 7332011 515 46 006 1 277 797 1962012 e 443 46 238 2 029 1 755 2 030
23 2010 75 6 964 164 68 392011 65 5 865 185 58 262012 e 75 8 700 312 140 13
24 2010 1 084 216 433 8 894 10 089 5492011 1 142 233 544 9 641 43 691 14 7192012 e 1 100 227 394 9 921 23 606 5 466
25 2010 1 660 363 490 7 384 22 747 2592011 1 621 358 790 12 318 9 476 4792012 e 1 673 367 156 10 153 26 492 447
http
://www.b
ps.g
o.id

M A N U F A C T U R I N G I N D U S T R Y
S t a t i s t i c a l Y e a r b o o k o f I n d o n e s i a 2 0 1 3 295
Lanjutan Tabel/Continued Table 7.1.1
Catatan/Note: e Angka perkiraan/Estimated figures r Angka diperbaiki/Revised figures 1 Mencakup pembelian barang baru dan bekas/Including new purchase and second hand purchase 2 Penjualan barang bekas/Sale used item
Kode Industri
Industrial Code
TahunYear
Banyaknya Perusahaan Number of
Establishments (unit)
Tenaga Kerja Workers Engaged
(orang/person)
Pengeluaranuntuk Tenaga Kerja
Labor Cost(miliar/billion Rp)
Perubahan Modal Tetap Change in Fixed Capital
(miliar/billion Rp)
Penambahan 1
Increase 1Penurunan 2Decrease 2
(1) (2) (3) (4) (5) (6) (7)
26 2010 1 616 171 313 5 832 4 764 2062011 1 606 174 811 6 100 141 489 109 2352012 e 1 537 169 248 7 786 4 414 594
27 2010 256 64 643 3 801 6 469 342011 266 64 657 3 519 8 148 4192012 e 261 63 320 6 956 5 082 229
28 2010 898 142 885 3 512 19 575 1 8002011 957 153 140 5 910 23 854 1 6082012 e 877 136 218 4 950 8 713 636
29 2010 402 74 751 2 444 1 623 1942011 382 66 059 2 697 888 3082012 e 409 90 907 3 854 4 883 345
30 2010 10 2 908 116 5 02011 11 5 474 283 23 02012 e 9 1 137 113 2 0
31 2010 245 80 611 2 217 186 512 2 6722011 236 89 979 4 347 8 837 1352012 e 242 67 082 3 549 34 827 895
32 2010 220 134 414 2 264 3 640 5512011 241 151 203 4 815 175 673 5722012 e 221 130 768 4 568 1 806 352
33 2010 68 20 805 419 603 642011 66 16 915 445 166 1232012 e 68 20 682 809 360 129
34 2010 278 92 999 3 340 3 584 5262011 303 111 384 6 112 7 682 4502012 e 282 78 427 3 915 3 550 832
35 2010 326 97 376 2 266 2 450 702011 331 101 970 3 771 3 481 3392012 e 333 87 429 6 456 5 902 567
36 2010 2 191 362 437 4 925 26 487 3 1192011 2 160 335 964 7 214 6 733 572012 e 2 079 318 268 11 921 6 836 635
Jumlah Total
2010 r 23 306 4 498 898 90 288 401 599 35 3062011 23 370 4 629 369 141 121 573 270 152 5532012 e 23 257 4 334 975 160 508 238 170 29 099
http
://www.b
ps.g
o.id

I N D U S T R I M A N U F A K T U R
S t a t i s t i k I n d o n e s i a 2 0 1 3296
Nilai Tambah Industri Besar dan Sedang (miliar rupiah), 2010–2012Value Added of Large and Medium Manufacturing Industry (billion rupiahs), 2010–2012
Tabel ––––––
7.1.2Table
[Diolah dari Hasil Survei Industri Besar dan Sedang Tahunan, BPS/Based on The Annual Large and Medium Manufacturing Establishment Survey, BPS-Statistics Indonesia]
Kode Industri
Industrial Code
TahunYear
Nilai Output Value of
Gross Output
Biaya Input Input Cost
Nilai Tambah (Harga Pasar)Value Added
(Market Price)
Pajak Tidak Langsung Indirect Taxes
Nilai Tambah (Biaya Faktor
Produksi)Value Added (Production Factor Cost)
(1) (2) (3) (4) (5) (6) (7)
15 2010 468 833 302 601 166 232 2 780 163 4522011 658 497 460 035 198 462 5 193 193 2692012 e 706 886 477 947 228 939 5 218 223 721
16 2010 112 860 50 483 62 377 23 705 38 6722011 121 284 54 115 67 169 25 342 41 8272012 e 131 822 48 586 83 236 25 724 57 512
17 2010 117 985 76 792 41 193 561 40 6322011 161 089 110 926 50 163 713 49 4502012 e 159 482 97 654 61 828 704 61 124
18 2010 60 151 30 587 29 564 191 29 3732011 57 298 28 017 29 281 2 805 26 4762012 e 71 904 34 928 36 976 2 578 34 398
19 2010 32 376 17 617 14 759 122 14 6372011 50 096 27 517 22 579 153 22 4262012 e 43 244 26 504 16 740 148 16 592
20 2010 37 443 22 714 14 729 237 14 4922011 39 566 23 731 15 835 288 15 5472012 e 39 434 24 582 14 852 370 14 482
21 2010 114 388 68 554 45 834 416 45 4182011 130 165 69 996 60 169 546 59 6232012 e 149 752 82 104 67 648 545 67 103
22 2010 13 806 5 055 8 751 120 8 6312011 24 064 15 734 8 330 141 8 1892012 e 41 774 29 897 11 877 137 11 740
23 2010 7 168 4 445 2 723 9 2 7142011 5 063 3 114 1 949 45 1 9042012 e 5 390 4 032 1 358 45 1 313
24 2010 311 806 191 880 119 926 2 073 117 8532011 359 715 219 599 140 116 2 444 137 6722012 e 383 743 192 823 190 920 2 428 188 492
25 2010 251 502 200 517 50 985 2 001 48 9842011 284 834 230 237 54 597 5 487 49 1102012 e 277 201 204 871 72 330 5 496 66 834
http
://www.b
ps.g
o.id

M A N U F A C T U R I N G I N D U S T R Y
S t a t i s t i c a l Y e a r b o o k o f I n d o n e s i a 2 0 1 3 297
Lanjutan Tabel/Continued Table 7.1.2
Catatan/Note: e Angka perkiraan/Estimated figures r Angka diperbaiki/Revised figures
Kode Industri
Industrial Code
TahunYear
Nilai Output Value of Gross
Output
Biaya Input Input Cost
Nilai Tambah (Harga Pasar)Value Added
(Market Price)
Pajak Tidak Langsung Indirect Taxes
Nilai Tambah (Biaya Faktor Produksi)
Value Added (Production Factor
Cost)(1) (2) (3) (4) (5) (6) (7)
26 2010 52 751 19 206 33 545 730 32 8152011 65 051 28 055 36 996 719 36 2772012 e 67 968 26 777 41 191 712 40 479
27 2010 136 122 105 115 31 007 356 30 6512011 90 784 52 583 38 201 818 37 3832012 e 153 706 101 621 52 085 823 51 262
28 2010 68 545 41 170 27 375 284 27 0912011 79 466 48 885 30 581 625 29 9562012 e 78 555 46 805 31 750 624 31 126
29 2010 61 258 15 982 45 276 443 44 8332011 37 462 13 642 23 820 1 113 22 7072012 e 55 644 16 293 39 351 1 114 38 237
30 2010 351 2 349 4 3452011 2 022 1 340 682 3 6792012 e 540 273 267 3 264
31 2010 56 098 33 035 23 063 247 22 8162011 60 091 31 011 29 080 860 28 2202012 e 94 330 40 284 54 046 860 53 186
32 2010 50 151 29 589 20 562 561 20 0012011 53 785 30 693 23 092 350 22 7422012 e 58 650 35 196 23 454 366 23 088
33 2010 3 873 1 471 2 402 35 2 3672011 2 583 1 416 1 167 62 1 1052012 e 3 810 1 496 2 314 62 2 252
34 2010 125 027 39 169 85 858 1 800 84 0582011 201 155 97 417 103 738 1 748 101 9902012 e 197 107 78 051 119 056 1 793 117 263
35 2010 86 990 39 482 47 508 377 47 1312011 88 603 26 829 61 774 1 950 59 8242012 e 99 395 40 077 59 318 1 949 57 369
36 2010 38 467 19 605 18 862 476 18 3862011 45 376 24 967 20 409 413 19 9962012 e 53 410 29 234 24 176 408 23 768
Jumlah 2010 r 2 207 951 1 315 071 892 880 37 528 855 352Total 2011 2 618 048 1 599 859 1 018 189 51 818 966 371
2012 e 2 873 747 1 640 035 1 233 712 52 107 1 181 605
http
://www.b
ps.g
o.id

I N D U S T R I M A N U F A K T U R
S t a t i s t i k I n d o n e s i a 2 0 1 3298
Biaya Input Industri Besar dan Sedang (miliar rupiah), 2010–2012Input Costs of Large and Medium Manufacturing Industry (billion rupiahs), 2010–2012
Tabel ––––––
7.1.3Table
[Diolah dari Hasil Survei Industri Besar dan Sedang Tahunan, BPS/Based on The Annual Large and Medium Manufacturing Establishment Survey, BPS-Statistics Indonesia]
Kode Industri
Industrial Code
TahunYear
Bahan Baku Raw
Materials
Bahan Bakar, Tenaga Listrik, dan Gas/Fuel,
Electricity, and Gas
Sewa Gedung, Mesin, dan
Alat-alat/Rent of Buildings, Machinery,
and Equipment
Pengeluaran Lainnya Other
Expenses
JumlahTotal
(1) (2) (3) (4) (5) (6) (7)
15 2010 274 220 10 914 1 795 15 672 302 6012011 422 468 17 162 2 466 17 939 460 0352012 e 429 651 24 281 2 516 21 499 477 947
16 2010 47 052 847 314 2 270 50 4832011 50 605 1 145 31 2 334 54 1152012 e 44 207 1 523 84 2 772 48 586
17 2010 62 996 8 519 277 5 000 76 7922011 92 863 12 166 363 5 534 110 9262012 e 78 429 11 692 436 7 097 97 654
18 2010 20 781 3 470 1 008 5 328 30 5872011 19 560 3 033 645 4 779 28 0172012 e 25 722 3 282 639 5 285 34 928
19 2010 15 271 1 073 160 1 113 17 6172011 23 471 1 815 142 2 089 27 5172012 e 20 796 3 400 178 2 130 26 504
20 2010 20 025 1 467 102 1 120 22 7142011 20 486 1 974 142 1 129 23 7312012 e 21 429 1 805 103 1 245 24 582
21 2010 59 106 5 967 110 3 371 68 5542011 58 391 7 277 146 4 182 69 9962012 e 68 499 10 025 230 3 350 82 104
22 2010 4 326 324 48 357 5 0552011 12 157 1 693 278 1 606 15 7342012 e 24 914 2 225 336 2 422 29 897
23 2010 3 499 173 13 760 4 4452011 2 492 348 18 256 3 1142012 e 3 250 163 16 603 4 032
24 2010 172 714 7 980 947 10 239 191 8802011 198 014 9 515 1 506 10 564 219 5992012 e 164 660 8 557 1 186 18 420 192 823
25 2010 188 405 7 007 547 4 558 200 5172011 218 165 7 727 401 3 944 230 2372012 e 178 237 9 729 407 16 498 204 871
http
://www.b
ps.g
o.id

M A N U F A C T U R I N G I N D U S T R Y
S t a t i s t i c a l Y e a r b o o k o f I n d o n e s i a 2 0 1 3 299
Lanjutan Tabel/Continued Table 7.1.3
Catatan/Note: e Angka perkiraan/Estimated figures r Angka diperbaiki/Revised figures
Kode Industri
Industrial Code
TahunYear
Bahan Baku Raw
Materials
Bahan Bakar, Tenaga
Listrik, dan Gas/Fuel, Electricity, and Gas
Sewa Gedung, Mesin, dan
Alat-alat/Rent of Buildings, Machinery,
and Equipment
Pengeluaran Lainnya Other
Expenses
JumlahTotal
(1) (2) (3) (4) (5) (6) (7)
26 2010 12 363 4 597 133 2 113 19 2062011 17 619 7 008 211 3 217 28 0552012 e 15 642 7 844 262 3 029 26 777
27 2010 93 652 8 193 217 3 053 105 1152011 44 094 7 501 141 847 52 5832012 e 89 245 8 093 165 4 118 101 621
28 2010 35 136 3 803 435 1 796 41 1702011 38 581 7 753 362 2 189 48 8852012 e 39 197 4 495 335 2 778 46 805
29 2010 12 622 1 225 200 1 935 15 9822011 10 486 1 156 102 1 898 13 6422012 e 12 959 1 273 183 1 878 16 293
30 2010 1 0 0 1 22011 1 320 10 6 4 1 3402012 e 189 42 33 9 273
31 2010 24 761 6 190 481 1 603 33 0352011 22 357 6 691 135 1 828 31 0112012 e 29 545 8 523 207 2 009 40 284
32 2010 24 181 2 229 341 2 838 29 5892011 22 163 3 720 1 309 3 501 30 6932012 e 29 509 2 837 709 2 141 35 196
33 2010 1 102 109 17 243 1 4712011 1 164 96 26 130 1 4162012 e 1 164 90 18 224 1 496
34 2010 35 945 1 367 162 1 695 39 1692011 84 360 5 486 565 7 006 97 4172012 e 63 440 7 655 557 6 399 78 051
35 2010 35 136 2 203 256 1 887 39 4822011 19 377 1 944 267 5 241 26 8292012 e 34 881 2 755 350 2 091 40 077
36 2010 16 595 1 135 138 1 737 19 6052011 20 658 1 719 273 2 317 24 9672012 e 24 453 2 012 306 2 463 29 234
Jumlah 2010 r 1 159 889 78 792 7 701 68 689 1 315 071Total 2011 1 400 851 106 939 9 535 82 534 1 599 859
2012 e 1 400 018 122 301 9 256 108 460 1 640 035
http
://www.b
ps.g
o.id
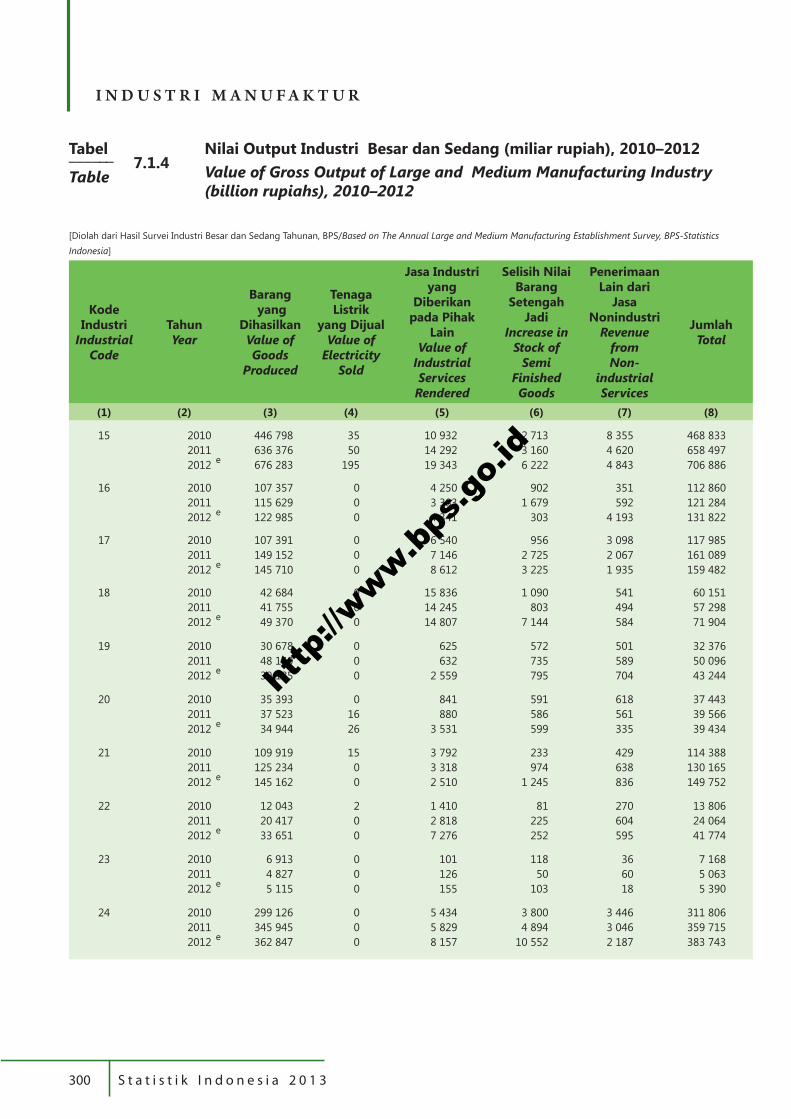
I N D U S T R I M A N U F A K T U R
S t a t i s t i k I n d o n e s i a 2 0 1 3300
Nilai Output Industri Besar dan Sedang (miliar rupiah), 2010–2012Value of Gross Output of Large and Medium Manufacturing Industry (billion rupiahs), 2010–2012
Tabel ––––––
7.1.4Table
[Diolah dari Hasil Survei Industri Besar dan Sedang Tahunan, BPS/Based on The Annual Large and Medium Manufacturing Establishment Survey, BPS-Statistics Indonesia]
Kode Industri
Industrial Code
TahunYear
Barang yang
DihasilkanValue of Goods
Produced
Tenaga Listrik
yang Dijual Value of
Electricity Sold
Jasa Industriyang
Diberikanpada Pihak
LainValue of
Industrial Services
Rendered
Selisih Nilai Barang
Setengah Jadi
Increase in Stock of
Semi Finished Goods
Penerimaan Lain dari
Jasa Nonindustri
Revenue from Non-
industrial Services
JumlahTotal
(1) (2) (3) (4) (5) (6) (7) (8)
15 2010 446 798 35 10 932 2 713 8 355 468 8332011 636 376 50 14 292 3 160 4 620 658 4972012 e 676 283 195 19 343 6 222 4 843 706 886
16 2010 107 357 0 4 250 902 351 112 8602011 115 629 0 3 383 1 679 592 121 2842012 e 122 985 0 4 341 303 4 193 131 822
17 2010 107 391 0 6 540 956 3 098 117 9852011 149 152 0 7 146 2 725 2 067 161 0892012 e 145 710 0 8 612 3 225 1 935 159 482
18 2010 42 684 0 15 836 1 090 541 60 1512011 41 755 0 14 245 803 494 57 2982012 e 49 370 0 14 807 7 144 584 71 904
19 2010 30 678 0 625 572 501 32 3762011 48 140 0 632 735 589 50 0962012 e 39 185 0 2 559 795 704 43 244
20 2010 35 393 0 841 591 618 37 4432011 37 523 16 880 586 561 39 5662012 e 34 944 26 3 531 599 335 39 434
21 2010 109 919 15 3 792 233 429 114 3882011 125 234 0 3 318 974 638 130 1652012 e 145 162 0 2 510 1 245 836 149 752
22 2010 12 043 2 1 410 81 270 13 8062011 20 417 0 2 818 225 604 24 0642012 e 33 651 0 7 276 252 595 41 774
23 2010 6 913 0 101 118 36 7 1682011 4 827 0 126 50 60 5 0632012 e 5 115 0 155 103 18 5 390
24 2010 299 126 0 5 434 3 800 3 446 311 8062011 345 945 0 5 829 4 894 3 046 359 7152012 e 362 847 0 8 157 10 552 2 187 383 743
http
://www.b
ps.g
o.id

M A N U F A C T U R I N G I N D U S T R Y
S t a t i s t i c a l Y e a r b o o k o f I n d o n e s i a 2 0 1 3 301
Lanjutan Tabel/Continued Table 7.1.4
Kode Industri
Industrial Code
TahunYear
Barang yang
DihasilkanValue of Goods
Produced
Tenaga Listrik
yang Dijual Value of
Electricity Sold
Jasa Industriyang
Diberikanpada Pihak
LainValue of
Industrial Services
Rendered
Selisih Nilai Barang
Setengah Jadi
Increase in Stock of
Semi Finished Goods
Penerimaan Lain dari
Jasa Nonindustri
Revenue from Non-
industrial Services
JumlahTotal
(1) (2) (3) (4) (5) (6) (7) (8)
25 2010 239 196 0 6 607 2 623 3 076 251 5022011 273 996 0 6 243 3 046 1 550 284 8342012 e 261 699 0 7 598 4 612 3 291 277 201
26 2010 49 383 0 2 186 709 473 52 7512011 60 391 0 3 519 640 501 65 0512012 e 63 814 0 3 095 798 261 67 968
27 2010 128 443 3 4 160 2 258 1 258 136 1222011 75 987 0 3 216 2 772 8 807 90 7842012 e 142 350 0 6 470 857 4 029 153 706
28 2010 58 397 2 8 032 778 1 336 68 5452011 68 894 5 7 284 1 734 1 550 79 4662012 e 67 640 0 8 928 1 159 827 78 555
29 2010 57 166 0 2 915 869 308 61 2582011 30 963 0 5 006 1 105 388 37 4622012 e 51 520 0 3 277 676 171 55 644
30 2010 2 0 319 -23 53 3512011 1 515 0 441 -4 71 2 0222012 e 135 0 375 -30 60 540
31 2010 44 517 0 11 512 -184 253 56 0982011 44 868 153 12 570 2 290 209 60 0912012 e 82 931 0 9 680 1 291 428 94 330
32 2010 37 968 26 11 189 368 600 50 1512011 38 854 0 13 542 795 594 53 7852012 e 49 863 88 7 936 382 380 58 650
33 2010 3 595 0 82 136 60 3 8732011 1 957 0 254 32 341 2 5832012 e 3 571 0 167 52 20 3 810
34 2010 120 393 0 4 186 241 207 125 0272011 191 086 0 8 191 1 338 541 201 1552012 e 186 296 0 8 376 1 914 521 197 107
http
://www.b
ps.g
o.id

I N D U S T R I M A N U F A K T U R
S t a t i s t i k I n d o n e s i a 2 0 1 3302
Lanjutan Tabel/Continued Table 7.1.4
Catatan/Note: e Angka perkiraan/Estimated figures r Angka diperbaiki/Revised figures
Kode Industri
Industrial Code
TahunYear
Barang yang
DihasilkanValue of Goods
Produced
Tenaga Listrik
yang Dijual Value of
Electricity Sold
Jasa Industriyang
Diberikanpada Pihak
LainValue of
Industrial Services
Rendered
Selisih Nilai Barang
Setengah Jadi
Increase in Stock of
Semi Finished Goods
Penerimaan Lain dari
Jasa Nonindustri
Revenue from Non-
industrial Services
JumlahTotal
(1) (2) (3) (4) (5) (6) (7) (8)
35 2010 80 876 0 5 626 75 413 86 9902011 79 715 0 7 740 545 602 88 6032012 e 93 878 0 4 700 465 353 99 395
36 2010 35 722 0 1 087 919 739 38 4672011 41 492 0 1 779 1 723 382 45 3762012 e 49 838 0 2 364 783 425 53 410
JumlahTotal
2010 2 053 960 r 83 107 662 r 19 825 26 421 r 2 207 951 r
2011 2 434 716 224 122 454 31 847 28 807 2 618 0482012 e 2 668 787 309 134 257 43 399 26 996 2 873 747
http
://www.b
ps.g
o.id

M A N U F A C T U R I N G I N D U S T R Y
S t a t i s t i c a l Y e a r b o o k o f I n d o n e s i a 2 0 1 3 303
Indeks Produksi Triwulanan Industri Besar dan Sedang (2010=100), 2011 dan 2012Quarterly Production Indices of Large and Medium Manufacturing Industry (2010=100), 2011 and 2012
Tabel ––––––
7.1.5Table
[Diolah dari Hasil Survei Industri Besar dan Sedang Bulanan, BPS/Based on Large and Medium Manufacturing Establishment Monthly Survey, BPS-Statistics Indonesia]
Kode Industri
IndustrialCode
2011Rata-Rata Tahunan
Annual Average 2011
Triwulan/Quarter
I II III IV
(1) (2) (3) (4) (5) (6)
10 103,97 107,09 107,71 108,37 106,78
11 104,42 107,95 116,81 109,05 109,56
12 92,63 97,21 102,92 104,86 99,41
13 93,04 92,82 89,86 93,42 92,29
14 114,34 115,87 110,38 112,09 113,17
15 128,83 132,16 126,82 126,05 128,46
16 71,84 70,13 65,51 63,49 67,74
17 100,47 102,22 99,33 106,03 102,01
18 110,74 116,56 116,54 124,24 117,02
20 104,45 106,91 103,55 105,61 105,13
21 108,41 r 114,15 r 130,01 r 138,00 r 122,64 r
22 95,18 106,22 r 101,69 r 102,93 r 101,51 r
23 111,72 114,58 115,89 112,72 113,73
24 107,86 105,69 r 108,08 r 114,62 r 109,06 r
25 114,53 117,17 124,67 118,60 118,74
26 92,60 100,42 97,17 96,66 96,71
27 108,81 125,58 120,36 115,34 117,52
28 126,41 143,90 137,27 123,87 132,86
29 117,91 113,92 132,24 121,63 r 121,43 r
30 81,99 75,80 76,42 79,46 78,42
31 107,71 109,06 112,94 110,35 110,02
32 75,87 94,05 79,18 83,61 83,18
33 91,24 91,48 90,62 91,24 91,15
Jumlah/Total 101,86 105,02 105,56 103,94 104,10
http
://www.b
ps.g
o.id
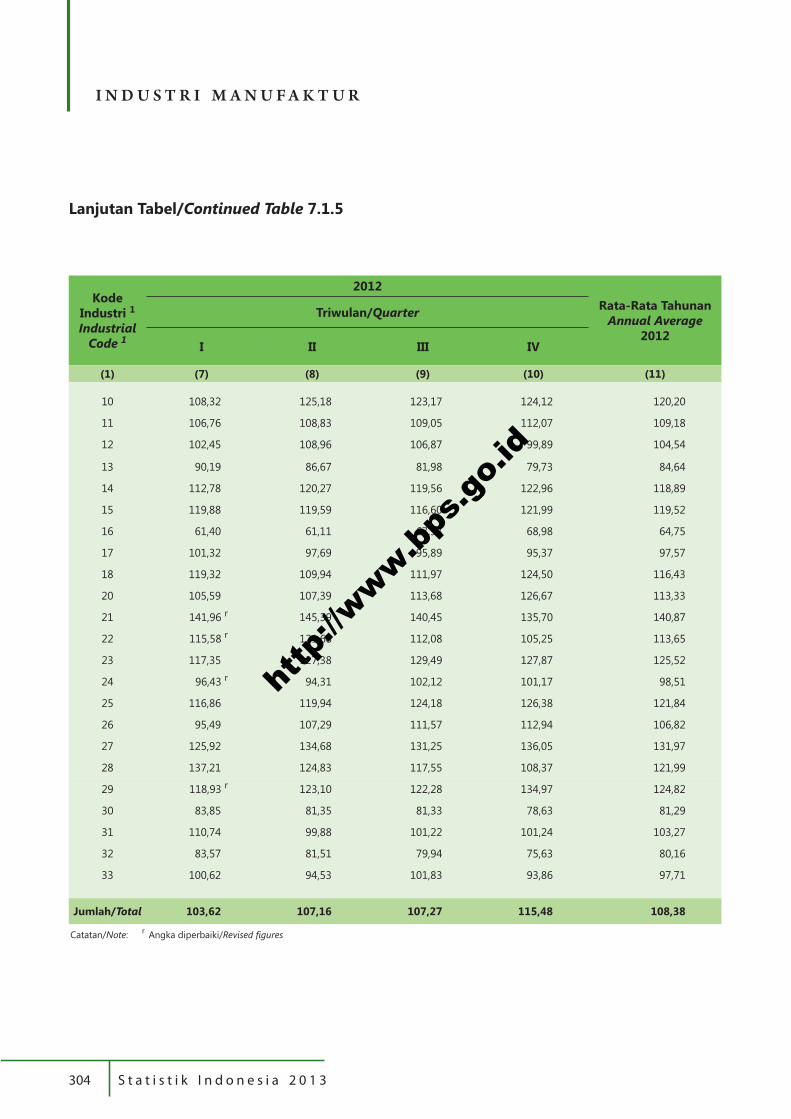
I N D U S T R I M A N U F A K T U R
S t a t i s t i k I n d o n e s i a 2 0 1 3304
Lanjutan Tabel/Continued Table 7.1.5
Kode Industri 1Industrial
Code 1
2012Rata-Rata Tahunan
Annual Average 2012
Triwulan/Quarter
I II III IV
(1) (7) (8) (9) (10) (11)
10 108,32 125,18 123,17 124,12 120,20
11 106,76 108,83 109,05 112,07 109,18
12 102,45 108,96 106,87 99,89 104,54
13 90,19 86,67 81,98 79,73 84,64
14 112,78 120,27 119,56 122,96 118,89
15 119,88 119,59 116,60 121,99 119,52
16 61,40 61,11 67,53 68,98 64,75
17 101,32 97,69 95,89 95,37 97,57
18 119,32 109,94 111,97 124,50 116,43
20 105,59 107,39 113,68 126,67 113,33
21 141,96 r 145,39 140,45 135,70 140,87
22 115,58 r 121,68 112,08 105,25 113,65
23 117,35 127,38 129,49 127,87 125,52
24 96,43 r 94,31 102,12 101,17 98,51
25 116,86 119,94 124,18 126,38 121,84
26 95,49 107,29 111,57 112,94 106,82
27 125,92 134,68 131,25 136,05 131,97
28 137,21 124,83 117,55 108,37 121,99
29 118,93 r 123,10 122,28 134,97 124,82
30 83,85 81,35 81,33 78,63 81,29
31 110,74 99,88 101,22 101,24 103,27
32 83,57 81,51 79,94 75,63 80,16
33 100,62 94,53 101,83 93,86 97,71
Jumlah/Total 103,62 107,16 107,27 115,48 108,38
Catatan/Note: r Angka diperbaiki/Revised figures
http
://www.b
ps.g
o.id

M A N U F A C T U R I N G I N D U S T R Y
S t a t i s t i c a l Y e a r b o o k o f I n d o n e s i a 2 0 1 3 305
Banyaknya Perusahaan, Tenaga Kerja, dan Pengeluaran untuk Tenaga Kerja Perusahaan Industri Mikro dan Kecil (juta rupiah), 2010–2012Number of Establishments, Workers Engaged, and Labor Cost of Micro and Small Manufacturing Industry (million rupiahs), 2010–2012
7.2 INDUSTRI MIKRO DAN KECIL MICRO AND SMALL MANUFACTURING INDUSTRY
Tabel ––––––
7.2.1Table
[Diolah dari Hasil Survei Industri Mikro dan Kecil/Based on Micro and Small Manufacturing Industry Survey]
Kode IndustriIndustrial
Code
TahunYear
Banyaknya UsahaNumber of Establishments
Tenaga KerjaWorkers Engaged
Pengeluaran untuk Tenaga Kerja Labor Cost
Mikro/Micro Kecil/Small Mikro/Micro Kecil/Small Mikro/Micro Kecil/Small
(1) (2) (3) (4) (5) (6) (7) (8)
10 2010 881 590 48 320 1 806 362 346 619 1 796 584 1 846 0762011 872 869 118 403 1 784 878 921 858 344 438 1 333 4072012 871 898 70 712 1 924 048 585 029 5 784 175 5 466 095
11 2010 29 848 547 50 403 4 668 76 000 33 2272011 32 516 1 408 52 682 10 210 17 257 13 8372012 51 069 2 605 92 304 23 833 142 289 222 044
12 2010 22 804 30 365 70 544 291 204 17 070 282 2352011 54 258 452 73 898 2 860 4 309 1 0242012 32 535 856 46 698 11 099 69 528 281 031
13 2010 221 054 13 603 295 572 133 310 144 624 681 7972011 226 017 17 117 295 434 155 793 43 274 271 6522012 192 149 15 008 273 094 140 781 722 010 1 911 992
14 2010 244 810 31 738 395 669 262 291 1 299 409 2 376 6032011 202 809 101 629 319 281 883 791 201 875 1 756 5042012 347 887 107 141 637 057 1 001 722 3 034 527 8 998 682
15 2010 26 647 6 263 66 466 48 029 376 409 479 9732011 17 690 18 959 38 115 176 799 44 989 392 3122012 37 514 16 417 93 345 130 101 781 461 1 758 812
16 2010 623 761 15 345 1 082 591 102 679 1 222 482 838 8642011 697 970 39 442 1 231 003 306 128 337 395 551 5662012 554 992 29 850 943 325 210 737 4 036 505 2 376 963
17 2010 6 780 488 12 329 4 598 22 626 30 9612011 6 628 886 11 146 9 007 3 110 15 3532012 9 487 1 400 21 110 11 056 52 561 128 763
18 2010 19 675 4 630 47 565 39 748 196 623 385 7662011 19 058 8 629 43 736 69 569 49 137 172 8382012 34 320 17 596 87 961 136 683 753 229 1 926 839
20 2010 18 223 945 37 489 6 109 82 286 22 0032011 23 678 1 810 44 304 13 899 12 034 24 5842012 16 002 164 27 593 1 929 58 726 31 490
21 2010 4 974 69 9 040 425 6 799 1 7622011 3 862 39 6 780 234 4 546 2372012 10 909 1 22 935 6 23 638 4
22 2010 12 346 1 440 22 269 12 310 41 624 106 0302011 14 457 1 472 24 515 16 695 9 616 37 4732012 23 300 2 813 45 925 31 515 61 881 483 574
http
://www.b
ps.g
o.id
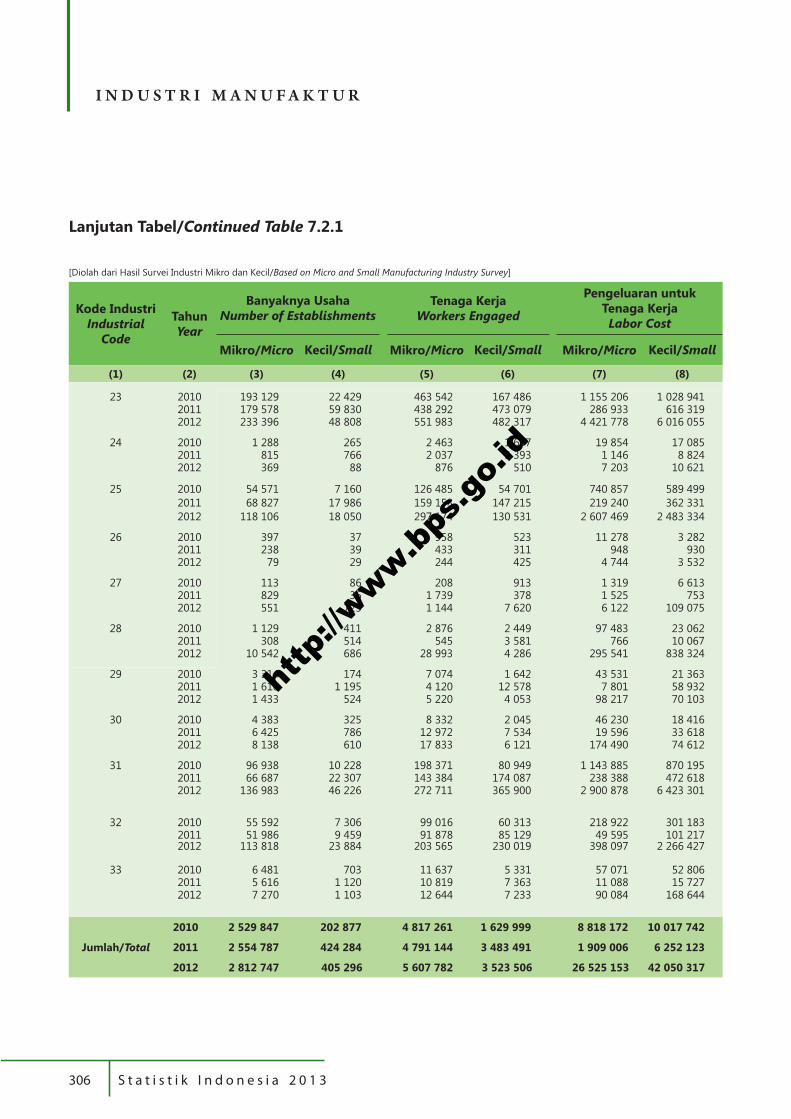
I N D U S T R I M A N U F A K T U R
S t a t i s t i k I n d o n e s i a 2 0 1 3306
[Diolah dari Hasil Survei Industri Mikro dan Kecil/Based on Micro and Small Manufacturing Industry Survey]
Kode IndustriIndustrial
Code
TahunYear
Banyaknya UsahaNumber of Establishments
Tenaga KerjaWorkers Engaged
Pengeluaran untuk Tenaga Kerja Labor Cost
Mikro/Micro Kecil/Small Mikro/Micro Kecil/Small Mikro/Micro Kecil/Small
(1) (2) (3) (4) (5) (6) (7) (8)
23 2010 193 129 22 429 463 542 167 486 1 155 206 1 028 9412011 179 578 59 830 438 292 473 079 286 933 616 3192012 233 396 48 808 551 983 482 317 4 421 778 6 016 055
24 2010 1 288 265 2 463 1 657 19 854 17 0852011 815 766 2 037 5 393 1 146 8 8242012 369 88 876 510 7 203 10 621
25 2010 54 571 7 160 126 485 54 701 740 857 589 4992011 68 827 17 986 159 153 147 215 219 240 362 3312012 118 106 18 050 297 174 130 531 2 607 469 2 483 334
26 2010 397 37 958 523 11 278 3 2822011 238 39 433 311 948 9302012 79 29 244 425 4 744 3 532
27 2010 113 86 208 913 1 319 6 6132011 829 36 1 739 378 1 525 7532012 551 725 1 144 7 620 6 122 109 075
28 2010 1 129 411 2 876 2 449 97 483 23 0622011 308 514 545 3 581 766 10 0672012 10 542 686 28 993 4 286 295 541 838 324
29 2010 3 314 174 7 074 1 642 43 531 21 3632011 1 610 1 195 4 120 12 578 7 801 58 9322012 1 433 524 5 220 4 053 98 217 70 103
30 2010 4 383 325 8 332 2 045 46 230 18 4162011 6 425 786 12 972 7 534 19 596 33 6182012 8 138 610 17 833 6 121 174 490 74 612
31 2010 96 938 10 228 198 371 80 949 1 143 885 870 1952011 66 687 22 307 143 384 174 087 238 388 472 6182012 136 983 46 226 272 711 365 900 2 900 878 6 423 301
32 2010 55 592 7 306 99 016 60 313 218 922 301 1832011 51 986 9 459 91 878 85 129 49 595 101 2172012 113 818 23 884 203 565 230 019 398 097 2 266 427
33 2010 6 481 703 11 637 5 331 57 071 52 8062011 5 616 1 120 10 819 7 363 11 088 15 7272012 7 270 1 103 12 644 7 233 90 084 168 644
Jumlah/Total
2010 2 529 847 202 877 4 817 261 1 629 999 8 818 172 10 017 742
2011 2 554 787 424 284 4 791 144 3 483 491 1 909 006 6 252 123
2012 2 812 747 405 296 5 607 782 3 523 506 26 525 153 42 050 317
Lanjutan Tabel/Continued Table 7.2.1
http
://www.b
ps.g
o.id
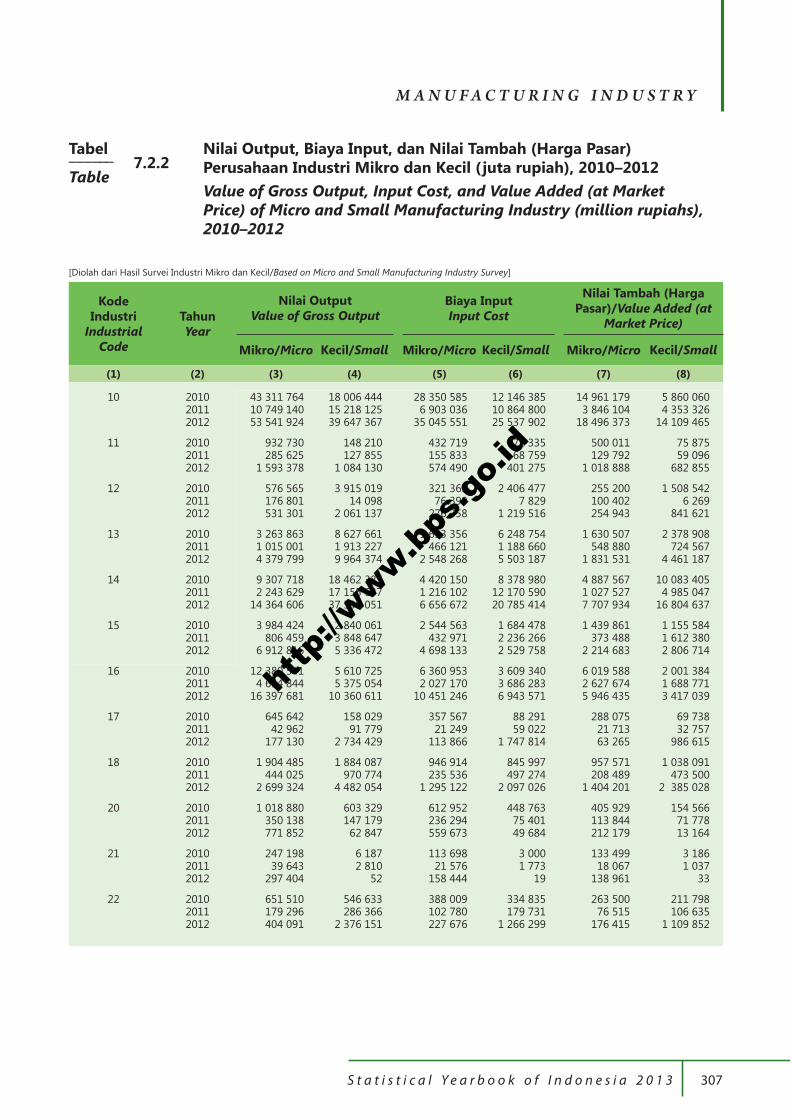
M A N U F A C T U R I N G I N D U S T R Y
S t a t i s t i c a l Y e a r b o o k o f I n d o n e s i a 2 0 1 3 307
Nilai Output, Biaya Input, dan Nilai Tambah (Harga Pasar) Perusahaan Industri Mikro dan Kecil (juta rupiah), 2010–2012Value of Gross Output, Input Cost, and Value Added (at Market Price) of Micro and Small Manufacturing Industry (million rupiahs), 2010–2012
Tabel ––––––
7.2.2Table
[Diolah dari Hasil Survei Industri Mikro dan Kecil/Based on Micro and Small Manufacturing Industry Survey]
Kode Industri
IndustrialCode
TahunYear
Nilai OutputValue of Gross Output
Biaya InputInput Cost
Nilai Tambah (Harga Pasar)/Value Added (at
Market Price)
Mikro/Micro Kecil/Small Mikro/Micro Kecil/Small Mikro/Micro Kecil/Small
(1) (2) (3) (4) (5) (6) (7) (8)
10 2010 43 311 764 18 006 444 28 350 585 12 146 385 14 961 179 5 860 0602011 10 749 140 15 218 125 6 903 036 10 864 800 3 846 104 4 353 3262012 53 541 924 39 647 367 35 045 551 25 537 902 18 496 373 14 109 465
11 2010 932 730 148 210 432 719 72 335 500 011 75 8752011 285 625 127 855 155 833 68 759 129 792 59 0962012 1 593 378 1 084 130 574 490 401 275 1 018 888 682 855
12 2010 576 565 3 915 019 321 365 2 406 477 255 200 1 508 5422011 176 801 14 098 76 399 7 829 100 402 6 2692012 531 301 2 061 137 276 358 1 219 516 254 943 841 621
13 2010 3 263 863 8 627 661 1 633 356 6 248 754 1 630 507 2 378 9082011 1 015 001 1 913 227 466 121 1 188 660 548 880 724 5672012 4 379 799 9 964 374 2 548 268 5 503 187 1 831 531 4 461 187
14 2010 9 307 718 18 462 385 4 420 150 8 378 980 4 887 567 10 083 4052011 2 243 629 17 155 637 1 216 102 12 170 590 1 027 527 4 985 0472012 14 364 606 37 590 051 6 656 672 20 785 414 7 707 934 16 804 637
15 2010 3 984 424 2 840 061 2 544 563 1 684 478 1 439 861 1 155 5842011 806 459 3 848 647 432 971 2 236 266 373 488 1 612 3802012 6 912 816 5 336 472 4 698 133 2 529 758 2 214 683 2 806 714
16 2010 12 380 541 5 610 725 6 360 953 3 609 340 6 019 588 2 001 3842011 4 654 844 5 375 054 2 027 170 3 686 283 2 627 674 1 688 7712012 16 397 681 10 360 611 10 451 246 6 943 571 5 946 435 3 417 039
17 2010 645 642 158 029 357 567 88 291 288 075 69 7382011 42 962 91 779 21 249 59 022 21 713 32 7572012 177 130 2 734 429 113 866 1 747 814 63 265 986 615
18 2010 1 904 485 1 884 087 946 914 845 997 957 571 1 038 0912011 444 025 970 774 235 536 497 274 208 489 473 5002012 2 699 324 4 482 054 1 295 122 2 097 026 1 404 201 2 385 028
20 2010 1 018 880 603 329 612 952 448 763 405 929 154 5662011 350 138 147 179 236 294 75 401 113 844 71 7782012 771 852 62 847 559 673 49 684 212 179 13 164
21 2010 247 198 6 187 113 698 3 000 133 499 3 1862011 39 643 2 810 21 576 1 773 18 067 1 0372012 297 404 52 158 444 19 138 961 33
22 2010 651 510 546 633 388 009 334 835 263 500 211 7982011 179 296 286 366 102 780 179 731 76 515 106 6352012 404 091 2 376 151 227 676 1 266 299 176 415 1 109 852
http
://www.b
ps.g
o.id
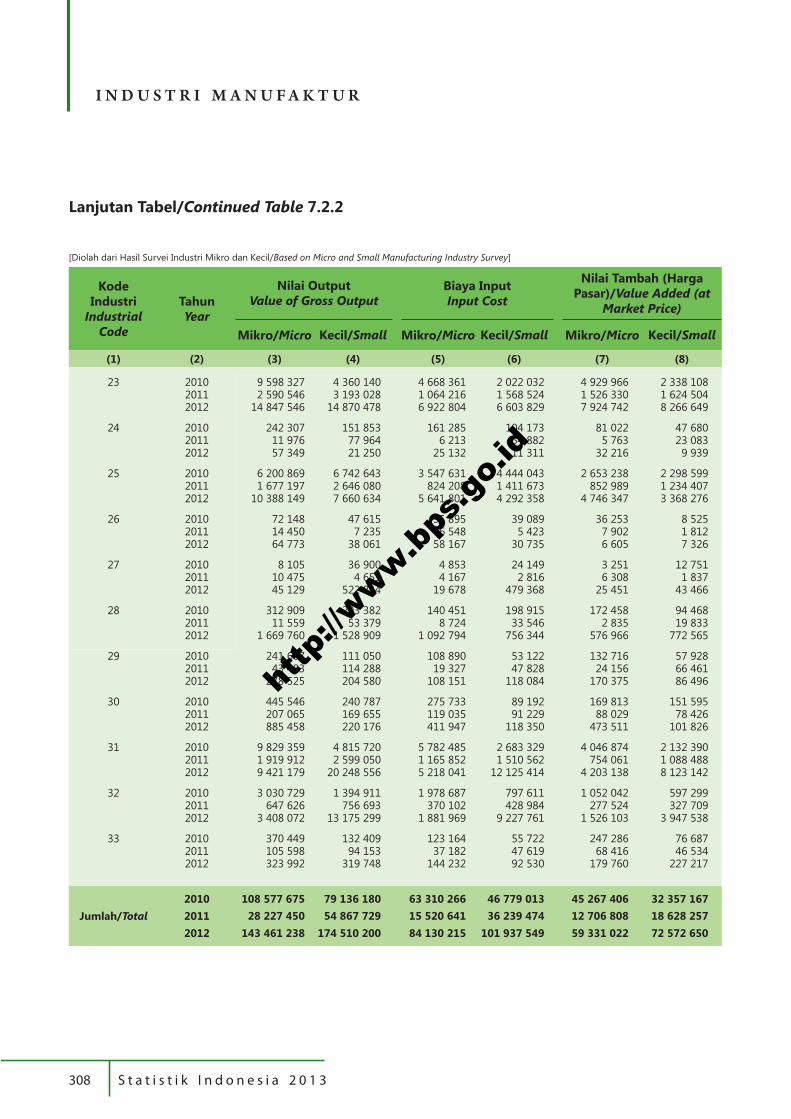
I N D U S T R I M A N U F A K T U R
S t a t i s t i k I n d o n e s i a 2 0 1 3308
Lanjutan Tabel/Continued Table 7.2.2
[Diolah dari Hasil Survei Industri Mikro dan Kecil/Based on Micro and Small Manufacturing Industry Survey]
Kode Industri
IndustrialCode
TahunYear
Nilai OutputValue of Gross Output
Biaya InputInput Cost
Nilai Tambah (Harga Pasar)/Value Added (at
Market Price)
Mikro/Micro Kecil/Small Mikro/Micro Kecil/Small Mikro/Micro Kecil/Small
(1) (2) (3) (4) (5) (6) (7) (8)
23 2010 9 598 327 4 360 140 4 668 361 2 022 032 4 929 966 2 338 1082011 2 590 546 3 193 028 1 064 216 1 568 524 1 526 330 1 624 5042012 14 847 546 14 870 478 6 922 804 6 603 829 7 924 742 8 266 649
24 2010 242 307 151 853 161 285 104 173 81 022 47 6802011 11 976 77 964 6 213 54 882 5 763 23 0832012 57 349 21 250 25 132 11 311 32 216 9 939
25 2010 6 200 869 6 742 643 3 547 631 4 444 043 2 653 238 2 298 5992011 1 677 197 2 646 080 824 208 1 411 673 852 989 1 234 4072012 10 388 149 7 660 634 5 641 801 4 292 358 4 746 347 3 368 276
26 2010 72 148 47 615 35 895 39 089 36 253 8 5252011 14 450 7 235 6 548 5 423 7 902 1 8122012 64 773 38 061 58 167 30 735 6 605 7 326
27 2010 8 105 36 900 4 853 24 149 3 251 12 7512011 10 475 4 653 4 167 2 816 6 308 1 8372012 45 129 522 834 19 678 479 368 25 451 43 466
28 2010 312 909 293 382 140 451 198 915 172 458 94 4682011 11 559 53 379 8 724 33 546 2 835 19 8332012 1 669 760 1 528 909 1 092 794 756 344 576 966 772 565
29 2010 241 607 111 050 108 890 53 122 132 716 57 9282011 43 483 114 288 19 327 47 828 24 156 66 4612012 278 525 204 580 108 151 118 084 170 375 86 496
30 2010 445 546 240 787 275 733 89 192 169 813 151 5952011 207 065 169 655 119 035 91 229 88 029 78 4262012 885 458 220 176 411 947 118 350 473 511 101 826
31 2010 9 829 359 4 815 720 5 782 485 2 683 329 4 046 874 2 132 3902011 1 919 912 2 599 050 1 165 852 1 510 562 754 061 1 088 4882012 9 421 179 20 248 556 5 218 041 12 125 414 4 203 138 8 123 142
32 2010 3 030 729 1 394 911 1 978 687 797 611 1 052 042 597 2992011 647 626 756 693 370 102 428 984 277 524 327 7092012 3 408 072 13 175 299 1 881 969 9 227 761 1 526 103 3 947 538
33 2010 370 449 132 409 123 164 55 722 247 286 76 6872011 105 598 94 153 37 182 47 619 68 416 46 5342012 323 992 319 748 144 232 92 530 179 760 227 217
Jumlah/Total2010 108 577 675 79 136 180 63 310 266 46 779 013 45 267 406 32 357 1672011 28 227 450 54 867 729 15 520 641 36 239 474 12 706 808 18 628 2572012 143 461 238 174 510 200 84 130 215 101 937 549 59 331 022 72 572 650
http
://www.b
ps.g
o.id
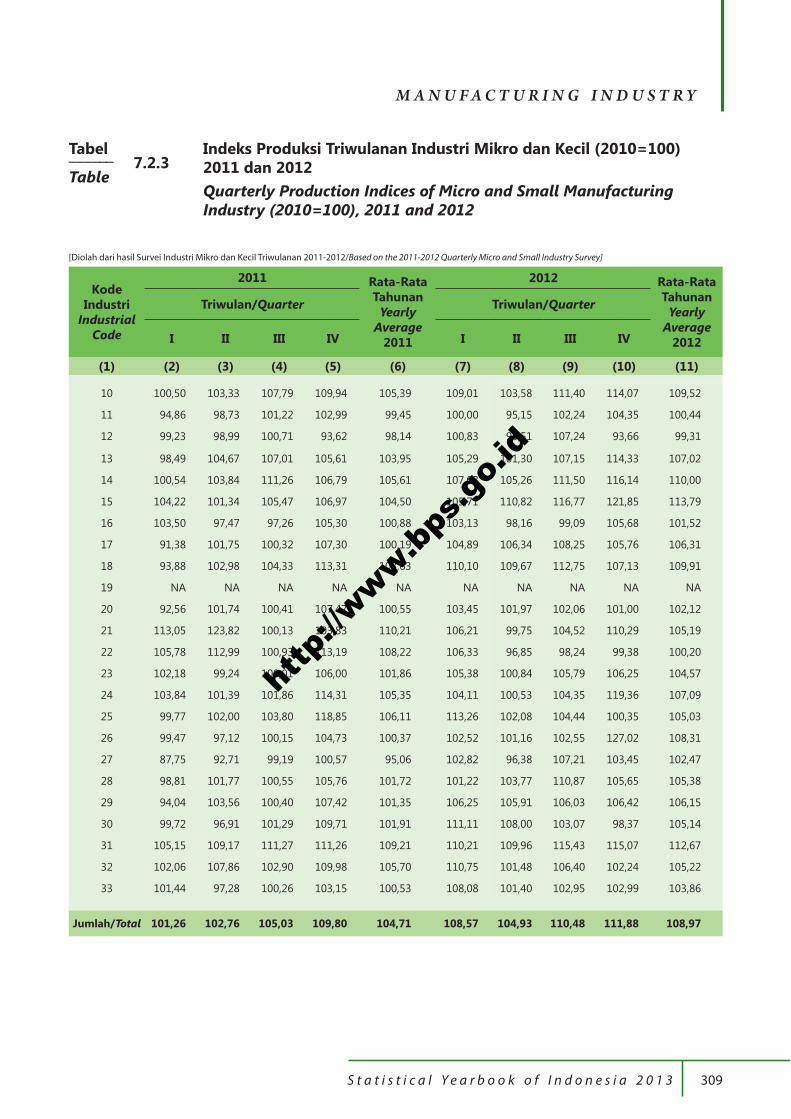
M A N U F A C T U R I N G I N D U S T R Y
S t a t i s t i c a l Y e a r b o o k o f I n d o n e s i a 2 0 1 3 309
Indeks Produksi Triwulanan Industri Mikro dan Kecil (2010=100) 2011 dan 2012Quarterly Production Indices of Micro and Small Manufacturing Industry (2010=100), 2011 and 2012
Tabel ––––––
7.2.3Table
[Diolah dari hasil Survei Industri Mikro dan Kecil Triwulanan 2011-2012/Based on the 2011-2012 Quarterly Micro and Small Industry Survey]
Kode Industri
IndustrialCode
2011 Rata-Rata Tahunan
Yearly Average
2011
2012 Rata-Rata Tahunan
Yearly Average
2012
Triwulan/Quarter Triwulan/Quarter
I II III IV I II III IV
(1) (2) (3) (4) (5) (6) (7) (8) (9) (10) (11)
10 100,50 103,33 107,79 109,94 105,39 109,01 103,58 111,40 114,07 109,52
11 94,86 98,73 101,22 102,99 99,45 100,00 95,15 102,24 104,35 100,44
12 99,23 98,99 100,71 93,62 98,14 100,83 95,51 107,24 93,66 99,31
13 98,49 104,67 107,01 105,61 103,95 105,29 101,30 107,15 114,33 107,02
14 100,54 103,84 111,26 106,79 105,61 107,08 105,26 111,50 116,14 110,00
15 104,22 101,34 105,47 106,97 104,50 105,71 110,82 116,77 121,85 113,79
16 103,50 97,47 97,26 105,30 100,88 103,13 98,16 99,09 105,68 101,52
17 91,38 101,75 100,32 107,30 100,19 104,89 106,34 108,25 105,76 106,31
18 93,88 102,98 104,33 113,31 103,63 110,10 109,67 112,75 107,13 109,91
19 NA NA NA NA NA NA NA NA NA NA
20 92,56 101,74 100,41 107,47 100,55 103,45 101,97 102,06 101,00 102,12
21 113,05 123,82 100,13 103,83 110,21 106,21 99,75 104,52 110,29 105,19
22 105,78 112,99 100,93 113,19 108,22 106,33 96,85 98,24 99,38 100,20
23 102,18 99,24 100,01 106,00 101,86 105,38 100,84 105,79 106,25 104,57
24 103,84 101,39 101,86 114,31 105,35 104,11 100,53 104,35 119,36 107,09
25 99,77 102,00 103,80 118,85 106,11 113,26 102,08 104,44 100,35 105,03
26 99,47 97,12 100,15 104,73 100,37 102,52 101,16 102,55 127,02 108,31
27 87,75 92,71 99,19 100,57 95,06 102,82 96,38 107,21 103,45 102,47
28 98,81 101,77 100,55 105,76 101,72 101,22 103,77 110,87 105,65 105,38
29 94,04 103,56 100,40 107,42 101,35 106,25 105,91 106,03 106,42 106,15
30 99,72 96,91 101,29 109,71 101,91 111,11 108,00 103,07 98,37 105,14
31 105,15 109,17 111,27 111,26 109,21 110,21 109,96 115,43 115,07 112,67
32 102,06 107,86 102,90 109,98 105,70 110,75 101,48 106,40 102,24 105,22
33 101,44 97,28 100,26 103,15 100,53 108,08 101,40 102,95 102,99 103,86
Jumlah/Total 101,26 102,76 105,03 109,80 104,71 108,57 104,93 110,48 111,88 108,97
http
://www.b
ps.g
o.id

http
://www.b
ps.g
o.id

8KONSTRUKSIConstruction
http
://www.b
ps.g
o.id

http
://www.b
ps.g
o.id

C O N S T R U C T I O N
S t a t i s t i c a l Y e a r b o o k o f I n d o n e s i a 2 0 1 3 313
PENJELASAN TEKNIS
Data yang disajikan pada publikasi Statistik Indonesia mulai tahun 2011 adalah data runtun benchmark. Untuk lebih jelasnya dapat dilihat pada publikasi Benchmark Indeks Konstruksi Tahun 1990–2011 dan publikasi Benchmark Statistik Konstruksi Tahun 1990–2011.
Adapun peubah yang dibuat benchmark pada data runtun nominal dan indeks adalah:a. Jumlah pekerja tetap konstruksib. Jumlah hari orang pekerja harian konstruksic. Jumlah balas jasa dan upah pekerja konstruksid. Nilai konstruksi yang diselessaikane. Nilai pengeluaran bahan/material yang digunakan
konstruksi
1. Konstruksi adalah suatu kegiatan yang hasil akhirnya berupa bangunan/konstruksi yang menyatu dengan lahan tempat kedudukannya. Hasil kegiatan konstruksi antara lain: gedung, jalan, jembatan, rel dan jembatan kereta api, terowongan, bangunan air dan drainase, bangunan sanitasi, bandara, jaringan listrik dan komunikasi, dan lain-lain.
2. Perusahaan adalah suatu badan yang melakukan kegiatan ekonomi, bertujuan menghasilkan barang/jasa, terletak di suatu bangunan fisik pada lokasi tertentu, dan mempunyai catatan administrasi tersendiri. Badan perusahan konstruksi dapat berbentuk PT, PT (Persero), dan Perusahaan Umum.
3. Jenis golongan perusahaan merupakan garis pokok
penggolongan kegiatan sektor konstruksi. Ada 4 (empat) jenis golongan perusahaan, yaitu:
a. Perorangan: batas nilai satu pekerjaan 0–50 juta rupiah
b. Kecil (K): batas nilai satu pekerjaan 0–1 miliar rupiah
c. Menengah (M): batas nilai satu pekerjaan 1 miliar rupiah–10 miliar rupiah
d. Besar (B): batas nilai satu pekerjaan di atas 1 miliar rupiah sampai dengan tak terbatas
4. Pekerja adalah semua orang yang pada saat pencacahan bekerja di perusahaan, baik pekerja teknik maupun pekerja nonteknik.
TECHNICAL NOTES
Data presented in the Statistical Yearbook of Indonesia from 2011 is the benchmark data series. More details can be viewed on the Benchmark of Construction Indices 1990–2011 and Benchmark of Construction Statistics 1990–2011.
The benchmark variable for the nominal and indices data series are:a. Number of construction permanent workersb. Number of man-days of construction daily workersc. Compensation and wages of construction workersd. Value of construction completede. Value of construction material used
1. Construction is an activity to build buildings construction integrated with their location. The results of construction activities include building construction, road, bridge, railway and rail bridge, tunnel subway, viaduct and drainage, sanitary construction, airport, electricity and communication, etc.
2. Establishment is an economic activity unit to provide goods or services located in a physical building, processing cost structure and production record. The type of legal entity of construction establishment could be Limited Company, Limited Partnership, State Owned Company (local and national), and General Company.
3. Establishment type of group is the main line of construction’s sector activities classification.There are 4 kinds of group :a. Individual: value range of one project 0–Rp50
millionb. Small (K): value range of one project 0–Rp1 billion
c. Medium (M): value range of one project Rp1 billion–Rp10 billion
d. Big (B): value range of one project above Rp1 billion up to unlimited
4. Worker is a person who works in an establishment at the time of enumeration, which includes technical worker and non-technical worker.
http
://www.b
ps.g
o.id
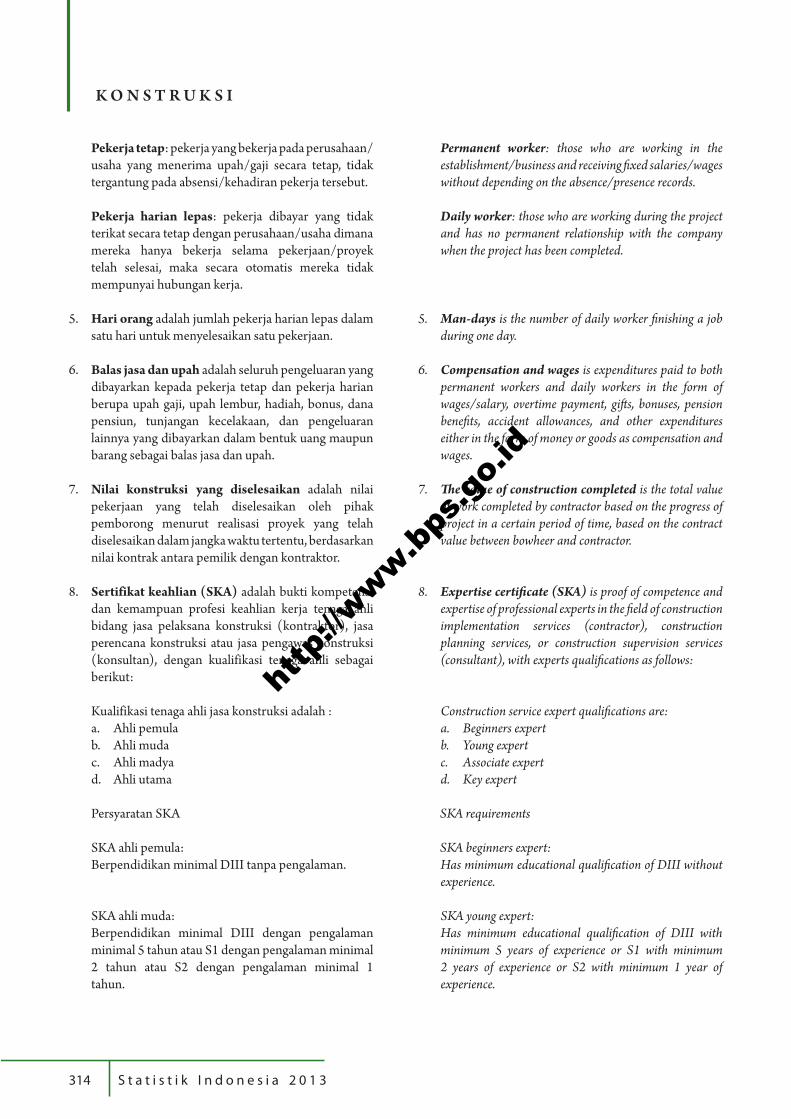
K O N S T R U K S I
S t a t i s t i k I n d o n e s i a 2 0 1 3314
Pekerja tetap: pekerja yang bekerja pada perusahaan/usaha yang menerima upah/gaji secara tetap, tidak tergantung pada absensi/kehadiran pekerja tersebut.
Pekerja harian lepas: pekerja dibayar yang tidak terikat secara tetap dengan perusahaan/usaha dimana mereka hanya bekerja selama pekerjaan/proyek telah selesai, maka secara otomatis mereka tidak mempunyai hubungan kerja.
5. Hari orang adalah jumlah pekerja harian lepas dalam satu hari untuk menyelesaikan satu pekerjaan.
6. Balas jasa dan upah adalah seluruh pengeluaran yang dibayarkan kepada pekerja tetap dan pekerja harian berupa upah gaji, upah lembur, hadiah, bonus, dana pensiun, tunjangan kecelakaan, dan pengeluaran lainnya yang dibayarkan dalam bentuk uang maupun barang sebagai balas jasa dan upah.
7. Nilai konstruksi yang diselesaikan adalah nilai pekerjaan yang telah diselesaikan oleh pihak pemborong menurut realisasi proyek yang telah diselesaikan dalam jangka waktu tertentu, berdasarkan nilai kontrak antara pemilik dengan kontraktor.
8. Sertifikat keahlian (SKA) adalah bukti kompetensi dan kemampuan profesi keahlian kerja tenaga ahli bidang jasa pelaksana konstruksi (kontraktor), jasa perencana konstruksi atau jasa pengawas konstruksi (konsultan), dengan kualifikasi tenaga ahli sebagai berikut:
Kualifikasi tenaga ahli jasa konstruksi adalah :a. Ahli pemulab. Ahli mudac. Ahli madyad. Ahli utama
Persyaratan SKA
SKA ahli pemula: Berpendidikan minimal DIII tanpa pengalaman.
SKA ahli muda: Berpendidikan minimal DIII dengan pengalaman
minimal 5 tahun atau S1 dengan pengalaman minimal 2 tahun atau S2 dengan pengalaman minimal 1 tahun.
Permanent worker: those who are working in the establishment/business and receiving fixed salaries/wages without depending on the absence/presence records.
Daily worker: those who are working during the project and has no permanent relationship with the company when the project has been completed.
5. Man-days is the number of daily worker finishing a job during one day.
6. Compensation and wages is expenditures paid to both permanent workers and daily workers in the form of wages/salary, overtime payment, gifts, bonuses, pension benefits, accident allowances, and other expenditures either in the form of money or goods as compensation and wages.
7. The value of construction completed is the total value of work completed by contractor based on the progress of project in a certain period of time, based on the contract value between bowheer and contractor.
8. Expertise certificate (SKA) is proof of competence and expertise of professional experts in the field of construction implementation services (contractor), construction planning services, or construction supervision services (consultant), with experts qualifications as follows:
Construction service expert qualifications are:a. Beginners expertb. Young expertc. Associate expertd. Key expert
SKA requirements
SKA beginners expert: Has minimum educational qualification of DIII without
experience.
SKA young expert:Has minimum educational qualification of DIII with minimum 5 years of experience or S1 with minimum 2 years of experience or S2 with minimum 1 year of experience.
http
://www.b
ps.g
o.id

C O N S T R U C T I O N
S t a t i s t i c a l Y e a r b o o k o f I n d o n e s i a 2 0 1 3 315
SKA ahli madya: Berpendidikan minimal S1 dengan pengalaman
minimal 7 tahun atau S2 dengan pengalaman minimal 2 tahun.
SKA ahli utama: Berpendidikan minimal S1 dengan pengalaman
minimal 12 tahun atau S2 dengan pengalaman minimal 5 tahun.
9. Sertifikat keterampilan (SKT) adalah bukti kompentensi dan kemampuan profesi keterampilan kerja bidang jasa pelaksana konstruksi (kontraktor) yang harus dimiliki tenaga kerja/ahli perusahaan untuk dapat ditetapkan sebagai penanggung jawab teknik (PJT) dalam permohonan sertifikasi dan registrasi jasa pelaksana konstruksi.
Kualifikasi tenaga terampil jasa pelaksana konstruksi adalah:a. SKT-pemulab. SKT tingkat IIIc. SKT tingkat IId. SKT tingkat I
SKT pemula: Berpendidikan minimal SLTA/STM tanpa
pengalaman.
SKT tingkat III: Berpendidikan minimal DIII tanpa pengalaman atau
SLTA/STM dengan pengalaman minimal 2 tahun.
SKT tingkat II: Berpendidikan minimal DIII dengan pengalaman
minimal 1 tahun atau SLTA/STM dengan pengalaman minimal 3 tahun.
SKT tingkat I: Berpendidikan minimal S1 tanpa pengalaman, DIII
dengan pengalaman minimal 2 tahun, atau SLTA/STM dengan pengalaman minimal 5 tahun.
10. Rumah siap huni (RSH) adalah rumah yang siap untuk digunakan sebagai tempat tinggal.
SKA associate expert:Has minimum educational qualification of S1 with minimum 7 years of experience or S2 with minimum 2 years of experience.
SKA beginners expert:Has minimum educational qualification of S1 with minimum 12 years of experience or S2 with minimum 5 years of experience.
9. Skills certificate (SKT) is proof of competence and professional skill in the field of construction implementation services (contractor) which is required for skilled employee designation as a techniqal responsible person (TRP) in the certification and registration of construction implementation services application.
Skilled employee construction implementation services qualifications are:a. Skill certificate (SKT)-beginner b. Skill certificate (SKT) 3rd grade c. Skill certificate (SKT) 2nd grade d. Skill certificate (SKT) 1st grade
SKT beginner: Has minimum educational background of SLTA/STM
without experience.
Skill certificate (SKT) 3rd grade: Has minimum educational background of DIII or SLTA/
STM with minimum 2 years of experience.
Skill certificate (SKT) 2nd grade: Has minimum educational background of DIII with
minimum 1 year of experience or SLTA/STM with minimum 3 years of experience.
Skill certificate (SKT) 1st grade: Has minimum educational background of SI without
experience, DIII with minimum 2 years of experience, or SLTA/STM with minimum 5 years of experience.
10. Ready to occupy house is a house that is ready to use as a place of resident.
http
://www.b
ps.g
o.id

K O N S T R U K S I
S t a t i s t i k I n d o n e s i a 2 0 1 3316
11. Rumah sederhana (RS) adalah rumah tidak bersusun dengan luas lantai bangunan tidak lebih dari 70 m2 yang dibangun di atas tanah dengan kapling 54 m2
sampai dengan 200 m2 dan biaya pembangunan per m2 tertinggi untuk pembangunan rumah dinas tipe C yang berlaku.
12. Rumah sangat sederhana (RSS), rumah sehat (RsH), dan generik terdiri dari rumah tipe RSS 21 dan RSS 36 yang diperuntukkan bagi kelompok masyarakat yang berpenghasilan rendah atau PNS terutama golongan I dan II.
13. Golongan pokok KBLI 2009 yang termasuk dalam kegiatan kategori konstruksi ini terdiri dari:a. 41-Konstruksi gedung mencakup konstruksi
gedung tempat tinggal, perkantoran, gedung industri, gedung perbelanjaan, gedung kesehatan, gedung pendidikan, penginapan, gedung tempat hiburan, dan konstruksi gedung lainnya.
b. 42-Konstruksi bangunan sipil mencakup pembangunan jalan, jembatan dan landasan, jalan dan jembatan kereta api, terowongan, bangunan pengairan, pengolahan, penyaluran dan penampungan barang minyak dan gas, bangunan pengolahan, penyaluran dan penampungan barang minyak dan gas, bangunan dermaga, dan bangunan sipil lainnya serta konstruksi bangunan elektrikal dan komunikasi mencakup bangunan elektrikal, konstruksi telekomunikasi sarana bantu navigasi laut dan rambu sungai, konstruksi telekomunikasi navigasi udara, konstruksi sinyal dan telekomunikasi kereta api, konstruksi sentral telekomunikasi, konstruksi elektrikal dan telekomunikasi lainnya.
c. 43-Konstruksi khusus mencakup pemasangan pondasi dan pilar, pemasangan perancah (steiger), pemasangan atap (roof covering), pemasangan bangunan konstruksi (prefab) dan pemasangan kerangka baja, pengerukan, instalasi sistem kelistrikan, air (pipa), instalasi konstruksi lainnya, penyelesaian konstruksi bangunan dan konstruksi khusus lainnya. Kegiatan konstruksi yang ber-hubungan langsung dengan pemurnian minyak dan gas bumi dimasukkan dalam kategori pertambangan dan penggalian, namun demikian pembangunan gedung, jalan, dan sejenisnya dilokasi penambangan tetap dimasukkan dalam kategori Konstruksi. Kegiatan teknik arsitektur
11. Simple house is a non multistoried house with floor are not more than 70 m2 that built on land of 54 m2 to 200 m2 and the valid highest construction building expense per m2 for official house with category C.
12. Very simple house (VSH), healthy house, and generic house consist of houses with VSH 21 and VSH 36 types allocated for low income group or civil servant especially in rank I and II.
13. Division of KBLI 2009 in activities of construction
section consist of :a. 41-Building construction includes building con-
struction for residential sites, office, industrial build-ings, shopping centres, health infrastructures, educa-tion infrastructures, accommodations, entertainment buildings, and other building constructions.
b. 42-Civil construction includes the construction of road, bridge and base, railway and rail bridge, tunnel subway, watering building, processing , distribution and reception for the oil and gas, processing building, quay building, and other civil buildings, and communication and electrical building construction includes electrical building, telecommunication construction of equipment for sea navigation and river’s sign, telecommunication construction of air navigation, signal construction and train telecommunication, central telecommu-nication construction, and other electrical and telecommunication constructions.
c. 43-Specific construction includes the fitting of foundation and pillar, steiger fitting, roof covering, prefab fitting, fitting of steel framework, dredging, electrical, plumbing and other construction installation activities, building completion and finishing and other specific construction. The construction activities that are directly connected to oil and gas cleaning were classified into mining and excavation, but building construction, road, and similar type in the location of mining is still classified into construction category. The architecture-related activities and the construction of project management building, roads and similar type is classified into other establishment services category.
http
://www.b
ps.g
o.id

C O N S T R U C T I O N
S t a t i s t i c a l Y e a r b o o k o f I n d o n e s i a 2 0 1 3 317
juga manajemen proyek pembangunan gedung, jalan dan sejenisnya dimasukkan dalam kategori jasa perusahaan lainnya.
14. Formula Penghitungan Indeks Formula penghitungan indeks konstruksi triwulanan
mengikuti langkah-langkah sebagai berikut :
Rasio konstruksia. adalah perhitungan rasio pekerja tetap, hari orang, balas jasa dan upah, serta nilai konstruksi yang diselesaikan triwulanan menggunakan formula sebagai berikut:
dimana:Rt = rasio pekerja tetap, hari orang, balas jasa
dan upah, nilai konstruksi pada triwulan ke tVti = jumlah pekerja tetap, hari orang, balas jasa
dan upah, nilai konstruksi pada perusahaan ke i triwulan ke t
V(t-1)i = jumlah pekerja tetap, hari orang, balas jasa dan upah, nilai konstruksi pada perusahaan ke i triwulan ke (t-1)
Indeks konstruksib.
It = I(t-1) x Rt
dimana:Rt = Rasio pada triwulan ke tIt = Indeks pada triwulan ke tI(t-1) = Indeks pada triwulan ke (t-1)
Indeks tahun dasar 2010c.
Indeks tahun dasar 2010 merupakan indeks triwulan t dibagi dengan rata-rata indeks pada tahun dasar 2010 dan dikalikan dengan 100 persen.
14. Index Calculation Formula
Formula in computing of quarter construction indices are as follows :
The quarterly construction ratioa. forpermanent workers, daily workers, compensation and wages, as well as value of construction completed are calculated by using formula is as follows:
where:Rt = ratio of permanent workers, man-days,
compensation and wages, construction value in the tth quarter.
Vti = number of permanent workers, man-days, compensation and wages, construction value at ith company in the tth quarter
V(t-1)i = number of permanent workers, man-days, compensation and wages, construction value at ith company in (t-1)th quarter
Construction Indexb.
It = I(t-1) x Rt
where:Rt = Ratio at tth quarterIt = Index at tth quarterI(t-1) = Index at (t-1)th quarter
Index base year 2010c.
Index base year 2010 is indices at quarter t divided by average index base year 2010 and multiply by 100 percent.
∑
∑
=−
==n
iit
n
iti
t
V
VR
1)1(
1
∑
∑
=−
==n
iit
n
iti
t
V
VR
1)1(
1
http
://www.b
ps.g
o.id
K O N S T R U K S I
S t a t i s t i k I n d o n e s i a 2 0 1 3318
It
Idt = _______ x 100avg(Id)
dimana:Idt = Indeks tahun dasar periode tIt = Indeks pada triwulan periode tavg(Id) = Rata-rata indeks tahun dasar 2010
Indeks tahunan d. dihitung berdasarkan rata-rata indeks selama empat triwulan pada tahun yang bersangkutan.
It Idt = _______ x 100
avg(Id)
where:Idt = Base year index at period tIt = Index at quarter period tavg(Id) = Average index at base year 2010
Annual index d. are calculated by averaging the four quarter indices of the concerned year.
http
://www.b
ps.g
o.id

C O N S T R U C T I O N
S t a t i s t i c a l Y e a r b o o k o f I n d o n e s i a 2 0 1 3 319
Ringkasan Statistik Konstruksi, 2011 dan 2012Summary of Construction Statistics, 2011 dan 2012
Tabel –––––– 8.1Table
Catatan/Note: e Angka perkiraan/Estimated figures
[Diolah dari Survei Perusahaan Konstruksi Tahunan, BPS/Based on Annual Construction Establishment Survey, BPS-Statistics Indonesia]
RingkasanSummary
SatuanUnit
Tahun/Year
2011 2012 e
(1) (2) (3) (4)
1. Jumlah Perusahaan KonstruksiNumber of Construction Establishments
perusahaanestablishment 134 004 130 615
2. Jumlah Pekerja Tetap KonstruksiNumber of Construction Permanent Workers
orangperson 505 724 532 090
3. Jumlah Hari Orang Pekerja Harian KonstruksiNumber of Man-Days of Construction Daily Workers
ributhousand 534 939 761 611 387 058
4. Balas Jasa dan Upah Pekerja KonstruksiThe Compensation and Wages of Construction Workers
juta rupiahmillion rupiah 66 986 174 78 526 857
5. Pendapatan BrutoGross Output
juta rupiahmillion rupiah 435 543 546 509 589 801
a. Nilai Konstruksi yang DiselesaikanThe Value of Construction Completed
juta rupiahmillion rupiah
376 123 350 439 931 460
b. Pendapatan Lain Income From Other Activity
juta rupiahmillion rupiah
59 420 196 69 658 341
6. Pengeluaran BrutoGross Expenditure
juta rupiahmillion rupiah
255 707 040 319 559 884
a. Nilai Pengeluaran Bahan Bangunan Material yang DigunakanThe expenses of construction material used
juta rupiahmillion rupiahs
139 823 913 189 867 888
b. Bahan Bakar dan Listrik Fuel and electricity
juta rupiahmillion rupiah
6 992 816 8 132 821
c. Biaya Bahan dan Jasa Lain Cost of other materials and services
juta rupiahmillion rupiah
108 890 311 121 559 175
http
://www.b
ps.g
o.id
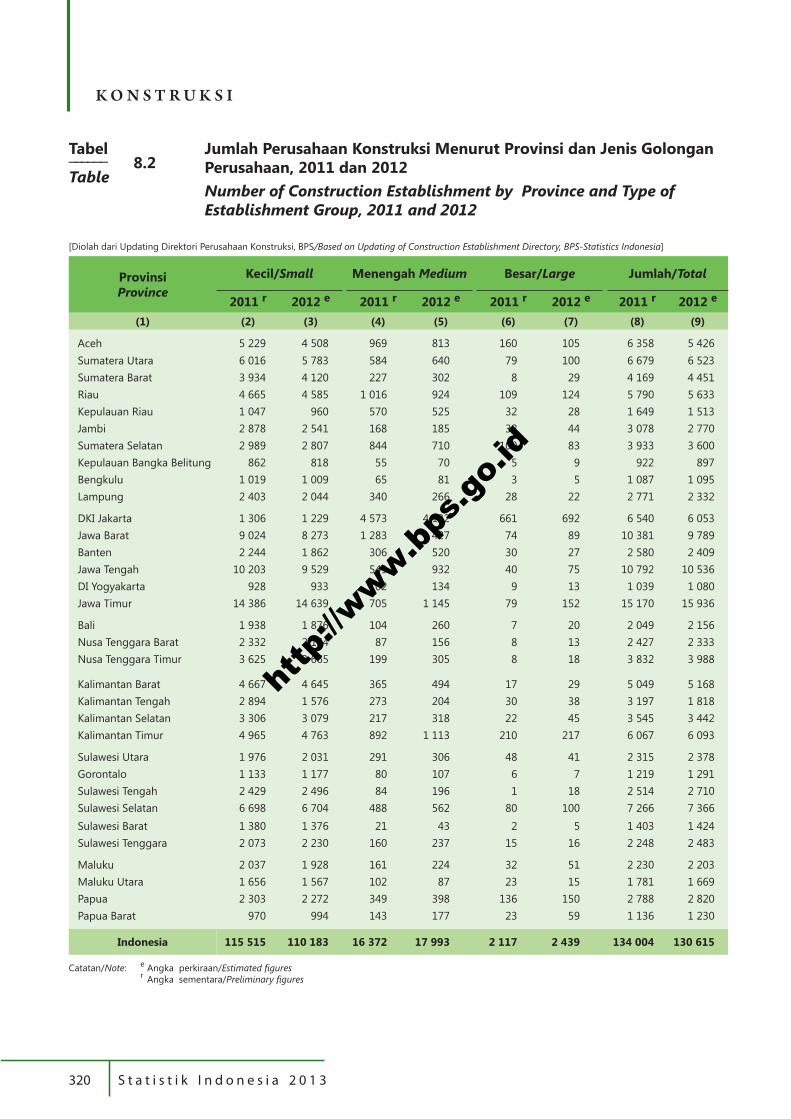
K O N S T R U K S I
S t a t i s t i k I n d o n e s i a 2 0 1 3320
Jumlah Perusahaan Konstruksi Menurut Provinsi dan Jenis Golongan Perusahaan, 2011 dan 2012Number of Construction Establishment by Province and Type of Establishment Group, 2011 and 2012
[Diolah dari Updating Direktori Perusahaan Konstruksi, BPS/Based on Updating of Construction Establishment Directory, BPS-Statistics Indonesia]
ProvinsiProvince
Kecil/Small Menengah Medium Besar/Large Jumlah/Total
2011 r 2012 e 2011 r 2012 e 2011 r 2012 e 2011 r 2012 e
(1) (2) (3) (4) (5) (6) (7) (8) (9)
Aceh 5 229 4 508 969 813 160 105 6 358 5 426Sumatera Utara 6 016 5 783 584 640 79 100 6 679 6 523Sumatera Barat 3 934 4 120 227 302 8 29 4 169 4 451Riau 4 665 4 585 1 016 924 109 124 5 790 5 633Kepulauan Riau 1 047 960 570 525 32 28 1 649 1 513Jambi 2 878 2 541 168 185 32 44 3 078 2 770Sumatera Selatan 2 989 2 807 844 710 100 83 3 933 3 600Kepulauan Bangka Belitung 862 818 55 70 5 9 922 897Bengkulu 1 019 1 009 65 81 3 5 1 087 1 095Lampung 2 403 2 044 340 266 28 22 2 771 2 332
DKI Jakarta 1 306 1 229 4 573 4 132 661 692 6 540 6 053Jawa Barat 9 024 8 273 1 283 1 427 74 89 10 381 9 789Banten 2 244 1 862 306 520 30 27 2 580 2 409Jawa Tengah 10 203 9 529 549 932 40 75 10 792 10 536DI Yogyakarta 928 933 102 134 9 13 1 039 1 080Jawa Timur 14 386 14 639 705 1 145 79 152 15 170 15 936
Bali 1 938 1 876 104 260 7 20 2 049 2 156Nusa Tenggara Barat 2 332 2 164 87 156 8 13 2 427 2 333Nusa Tenggara Timur 3 625 3 665 199 305 8 18 3 832 3 988
Kalimantan Barat 4 667 4 645 365 494 17 29 5 049 5 168Kalimantan Tengah 2 894 1 576 273 204 30 38 3 197 1 818Kalimantan Selatan 3 306 3 079 217 318 22 45 3 545 3 442Kalimantan Timur 4 965 4 763 892 1 113 210 217 6 067 6 093
Sulawesi Utara 1 976 2 031 291 306 48 41 2 315 2 378Gorontalo 1 133 1 177 80 107 6 7 1 219 1 291Sulawesi Tengah 2 429 2 496 84 196 1 18 2 514 2 710Sulawesi Selatan 6 698 6 704 488 562 80 100 7 266 7 366
Sulawesi Barat 1 380 1 376 21 43 2 5 1 403 1 424Sulawesi Tenggara 2 073 2 230 160 237 15 16 2 248 2 483
Maluku 2 037 1 928 161 224 32 51 2 230 2 203Maluku Utara 1 656 1 567 102 87 23 15 1 781 1 669Papua 2 303 2 272 349 398 136 150 2 788 2 820Papua Barat 970 994 143 177 23 59 1 136 1 230
Indonesia 115 515 110 183 16 372 17 993 2 117 2 439 134 004 130 615
Tabel –––––– 8.2Table
Catatan/Note: e Angka perkiraan/Estimated figures r Angka sementara/Preliminary figures
http
://www.b
ps.g
o.id

C O N S T R U C T I O N
S t a t i s t i c a l Y e a r b o o k o f I n d o n e s i a 2 0 1 3 321
Jumlah Pekerja Tetap di Perusahaan Konstruksi Menurut Provinsi (orang), 2011 dan 2012Number of Permanent Workers at Construction Establishment by Province (person), 2011 and 2012
[Diolah dari Survei Perusahaan Konstruksi Tahunan, BPS/Based on Annual Construction Establishment Survey, BPS-Statistics Indonesia]
ProvinsiProvince 2011 2012e
(1) (2) (3)
Aceh 14 922 15 683Sumatera Utara 23 665 24 283Sumatera Barat 10 896 11 247Riau 14 148 15 291Kepulauan Riau 9 492 9 890Jambi 8 753 9 021Sumatera Selatan 16 554 17 511Kepulauan Bangka Belitung 2 609 2 658Bengkulu 3 479 3 572Lampung 7 813 7 976
DKI Jakarta 102 622 111 670Jawa Barat 42 756 45 124Banten 9 613 9 851Jawa Tengah 39 272 42 140DI Yogyakarta 9 280 9 525Jawa Timur 55 744 57 118
Bali 5 436 5 650Nusa Tenggara Barat 7 015 7 377Nusa Tenggara Timur 6 736 7 011
Kalimantan Barat 12 595 13 273Kalimantan Tengah 10 301 10 559Kalimantan Selatan 8 797 9 001Kalimantan Timur 14 782 15 752
Sulawesi Utara 7 490 7 573Gorontalo 5 203 5 411Sulawesi Tengah 7 265 7 411Sulawesi Selatan 12 053 12 485Sulawesi Barat 3 819 3 871Sulawesi Tenggara 6 793 7 153
Maluku 4 598 4 795Maluku Utara 5 302 5 450Papua 10 758 11 079Papua Barat 5 166 5 679
Indonesia 505 724 532 090
Tabel –––––– 8.3Table
Catatan/Note: e Angka perkiraan/Estimated figures
http
://www.b
ps.g
o.id

K O N S T R U K S I
S t a t i s t i k I n d o n e s i a 2 0 1 3322
Jumlah Profesi Tenaga Ahli di Perusahaan Konstruksi Menurut Provinsi dan Kualifikasi (orang), 2012 x
Number of Expert Profession Workers at Construction Establishment by Province and Qualification (person), 2012 x
ProvinsiProvince
PemulaBeginner
MudaSemi
Qualified
MadyaQualified
UtamaVery
Qualified
JumlahTotal
(1) (2) (3) (4) (5) (6)
Aceh 71 3 056 686 40 3 853Sumatera Utara 60 3 393 1 397 171 5 021Sumatera Barat 41 1 808 632 40 2 521Riau 178 2 437 890 81 3 586Jambi 38 545 178 10 771Sumatera Selatan 28 877 263 12 1 180Bengkulu 114 2 279 980 68 3 441Lampung 1 237 73 4 315Kepulauan Bangka Belitung 18 424 100 5 547Kepulauan Riau 57 1 675 525 41 2 298
DKI Jakarta 94 7 929 4 798 1 155 13 976Jawa Barat 109 10 448 4 902 1 039 16 498Jawa Tengah 24 2 415 1 161 264 3 864DI Yogyakarta 515 8 785 2 418 262 11 980Jawa Timur 55 1 641 687 90 2 473Banten 558 8 323 3 478 423 12 782
Bali 182 1 468 570 72 2 292Nusa Tenggara Barat 19 1 100 240 10 1 369Nusa Tenggara Timur 71 1 584 271 6 1 932
Kalimantan Barat 28 1 968 718 53 2 767Kalimantan Tengah 341 1 285 309 5 1 940Kalimantan Selatan 72 1 605 538 21 2 236Kalimantan Timur 338 3 588 1 272 92 5 290
Sulawesi Utara 20 1 340 399 20 1 779Gorontalo 19 305 64 – 388Sulawesi Tengah 42 1 061 250 19 1 372Sulawesi Selatan 221 3 565 1 448 109 5 343Sulawesi Barat 2 126 19 – 147Sulawesi Tenggara 50 667 95 – 812
Maluku 47 751 257 18 1 073Maluku Utara 106 536 168 1 811Papua 43 1 865 612 26 2 546Papua Barat 7 718 209 5 939
Indonesia 3 569 79 804 30 607 4 162 118 142
Tabel –––––– 8.4Table
Catatan/Note: x Angka sementara/Preliminary figuresSumber/Source: Lembaga Pengembangan Jasa Konstruksi Nasional/National Construction Services Development Board
http
://www.b
ps.g
o.id
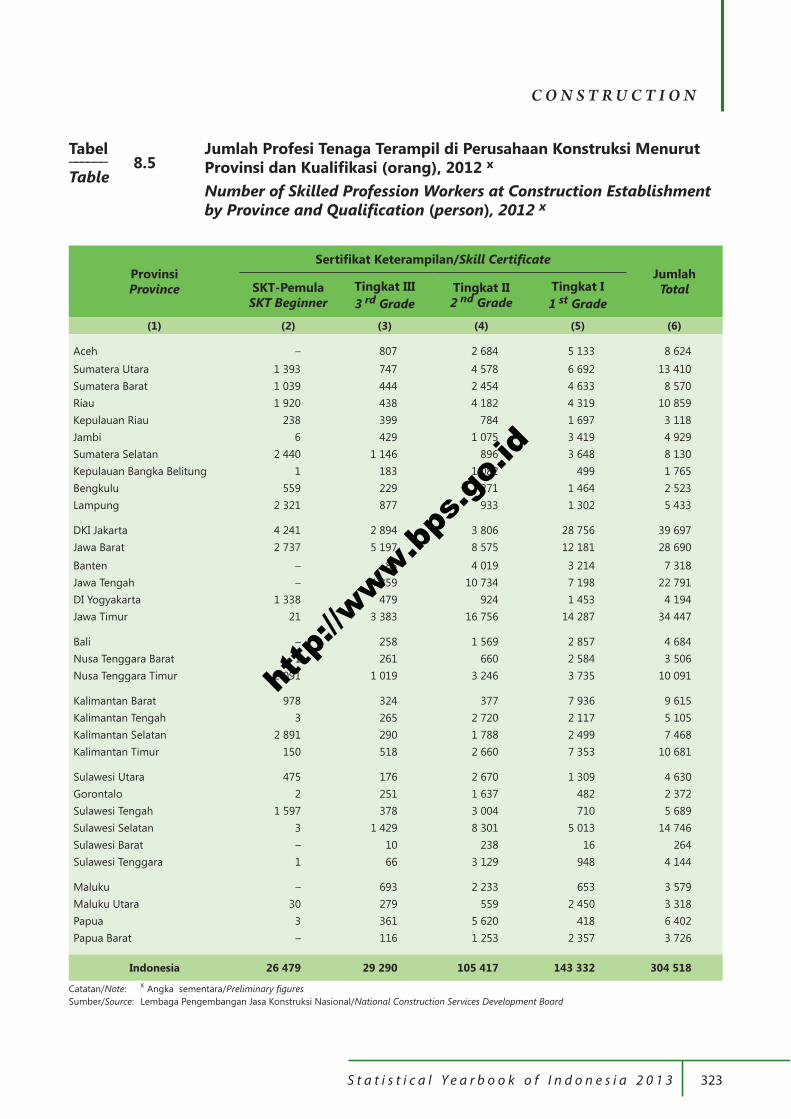
C O N S T R U C T I O N
S t a t i s t i c a l Y e a r b o o k o f I n d o n e s i a 2 0 1 3 323
Jumlah Profesi Tenaga Terampil di Perusahaan Konstruksi Menurut Provinsi dan Kualifikasi (orang), 2012 x
Number of Skilled Profession Workers at Construction Establishment by Province and Qualification (person), 2012 x
ProvinsiProvince
Sertifikat Keterampilan/Skill CertificateJumlahTotalSKT-Pemula
SKT BeginnerTingkat III3 rd Grade
Tingkat II2 nd Grade
Tingkat I1 st Grade
(1) (2) (3) (4) (5) (6)
Aceh – 807 2 684 5 133 8 624
Sumatera Utara 1 393 747 4 578 6 692 13 410Sumatera Barat 1 039 444 2 454 4 633 8 570Riau 1 920 438 4 182 4 319 10 859Kepulauan Riau 238 399 784 1 697 3 118Jambi 6 429 1 075 3 419 4 929Sumatera Selatan 2 440 1 146 896 3 648 8 130Kepulauan Bangka Belitung 1 183 1 082 499 1 765Bengkulu 559 229 271 1 464 2 523Lampung 2 321 877 933 1 302 5 433
DKI Jakarta 4 241 2 894 3 806 28 756 39 697Jawa Barat 2 737 5 197 8 575 12 181 28 690
Banten – 85 4 019 3 214 7 318Jawa Tengah – 4 859 10 734 7 198 22 791DI Yogyakarta 1 338 479 924 1 453 4 194Jawa Timur 21 3 383 16 756 14 287 34 447
Bali – 258 1 569 2 857 4 684Nusa Tenggara Barat 1 261 660 2 584 3 506Nusa Tenggara Timur 2 091 1 019 3 246 3 735 10 091
Kalimantan Barat 978 324 377 7 936 9 615Kalimantan Tengah 3 265 2 720 2 117 5 105Kalimantan Selatan 2 891 290 1 788 2 499 7 468Kalimantan Timur 150 518 2 660 7 353 10 681
Sulawesi Utara 475 176 2 670 1 309 4 630Gorontalo 2 251 1 637 482 2 372Sulawesi Tengah 1 597 378 3 004 710 5 689Sulawesi Selatan 3 1 429 8 301 5 013 14 746Sulawesi Barat – 10 238 16 264Sulawesi Tenggara 1 66 3 129 948 4 144
Maluku – 693 2 233 653 3 579Maluku Utara 30 279 559 2 450 3 318Papua 3 361 5 620 418 6 402Papua Barat – 116 1 253 2 357 3 726
Indonesia 26 479 29 290 105 417 143 332 304 518
Tabel –––––– 8.5Table
Catatan/Note: x Angka sementara/Preliminary figuresSumber/Source: Lembaga Pengembangan Jasa Konstruksi Nasional/National Construction Services Development Board
http
://www.b
ps.g
o.id

K O N S T R U K S I
S t a t i s t i k I n d o n e s i a 2 0 1 3324
Jumlah Hari Orang Pekerja Harian Lepas di Perusahaan Konstruksi Menurut Provinsi (ribu), 2011 dan 2012Number of Man-Days of Daily Workers at Construction Establishmet by Province (thousand), 2011 and 2012
[Diolah dari Survei Perusahaan Konstruksi Tahunan, BPS/Based on Annual Construction Establishment Survey, BPS-Statistics Indonesia]
ProvinsiProvince 2011 2012 e
(1) (2) (3)
Aceh 11 891 348 13 356 815Sumatera Utara 32 765 607 37 796 796Sumatera Barat 11 411 452 12 770 036Riau 21 193 630 25 200 471Kepulauan Riau 8 777 241 9 623 803Jambi 4 369 608 4 733 372Sumatera Selatan 16 734 758 20 061 629Kepulauan Bangka Belitung 2 326 415 2 459 479Bengkulu 1 599 297 1 744 420Lampung 5 821 963 6 565 166
DKI Jakarta 115 199 802 134 745 853Jawa Barat 51 770 597 59 468 098Banten 16 953 078 18 824 781Jawa Tengah 52 059 016 60 229 709DI Yogyakarta 7 157 899 7 810 255Jawa Timur 54 458 101 60 409 754
Bali 6 488 476 7 524 815Nusa Tenggara Barat 6 423 068 6 879 690Nusa Tenggara Timur 4 371 877 4 764 998
Kalimantan Barat 8 837 405 9 499 918Kalimantan Tengah 6 996 187 7 780 806Kalimantan Selatan 8 415 211 9 339 217Kalimantan Timur 30 188 803 34 822 089
Sulawesi Utara 4 269 968 4 570 397Gorontalo 2 581 436 2 826 713Sulawesi Tengah 4 435 498 4 753 950Sulawesi Selatan 10 685 604 12 407 965
Sulawesi Barat 1 629 213 1 718 615Sulawesi Tenggara 3 744 714 4 005 647
Maluku 2 842 644 3 142 963Maluku Utara 1 505 531 1 581 036Papua 9 840 781 11 033 005Papua Barat 7 193 533 8 934 798
Indonesia 534 939 761 611 387 058
Tabel –––––– 8.6Table
Catatan/Note: e Angka perkiraan/Estimated figures
http
://www.b
ps.g
o.id

C O N S T R U C T I O N
S t a t i s t i c a l Y e a r b o o k o f I n d o n e s i a 2 0 1 3 325
Jumlah Balas Jasa Pekerja Tetap dan Upah Pekerja Harian Menurut Provinsi (juta rupiah), 2011 dan 2012Number of Compensation of Permanent Workers and Wages of Daily Workers by Province (million rupiah), 2011 and 2012
[Diolah dari Survei Perusahaan Konstruksi Tahunan, BPS/Based on Annual Construction Establishment Survey, BPS-Statistics Indonesia]
ProvinsiProvince 2011 2012 e
(1) (2) (3)
Aceh 1 450 462 1 660 227Sumatera Utara 3 167 090 3 805 070Sumatera Barat 1 097 677 1 296 699Riau 2 107 520 2 617 178Kepulauan Riau 996 335 1 164 570Jambi 504 447 566 196Sumatera Selatan 1 739 651 2 163 557Kepulauan Bangka Belitung 282 558 316 429Bengkulu 195 980 221 097Lampung 701 432 822 998
DKI Jakarta 19 239 974 22 326 788Jawa Barat 6 809 923 8 128 005Banten 1 749 202 2 044 033Jawa Tengah 5 946 517 6 826 142DI Yogyakarta 673 397 769 739Jawa Timur 7 010 793 8 069 513
Bali 609 288 732 690Nusa Tenggara Barat 552 113 618 168Nusa Tenggara Timur 383 523 438 908
Kalimantan Barat 949 896 1 073 196Kalimantan Tengah 745 267 852 421Kalimantan Selatan 960 753 1 118 802Kalimantan Timur 3 466 814 4 238 918
Sulawesi Utara 458 423 506 688Gorontalo 431 413 487 088Sulawesi Tengah 1 242 846 1 500 131Sulawesi Selatan 361 382 419 165
Sulawesi Barat 247 891 288 148Sulawesi Tenggara 178 936 196 290
Maluku 290 246 335 789Maluku Utara 177 462 192 299Papua 872 031 1 142 867Papua Barat 1 384 932 1 587 044
Indonesia 66 986 174 78 526 857
Tabel –––––– 8.7Table
Catatan/Note: e Angka perkiraan/Estimated figures
http
://www.b
ps.g
o.id
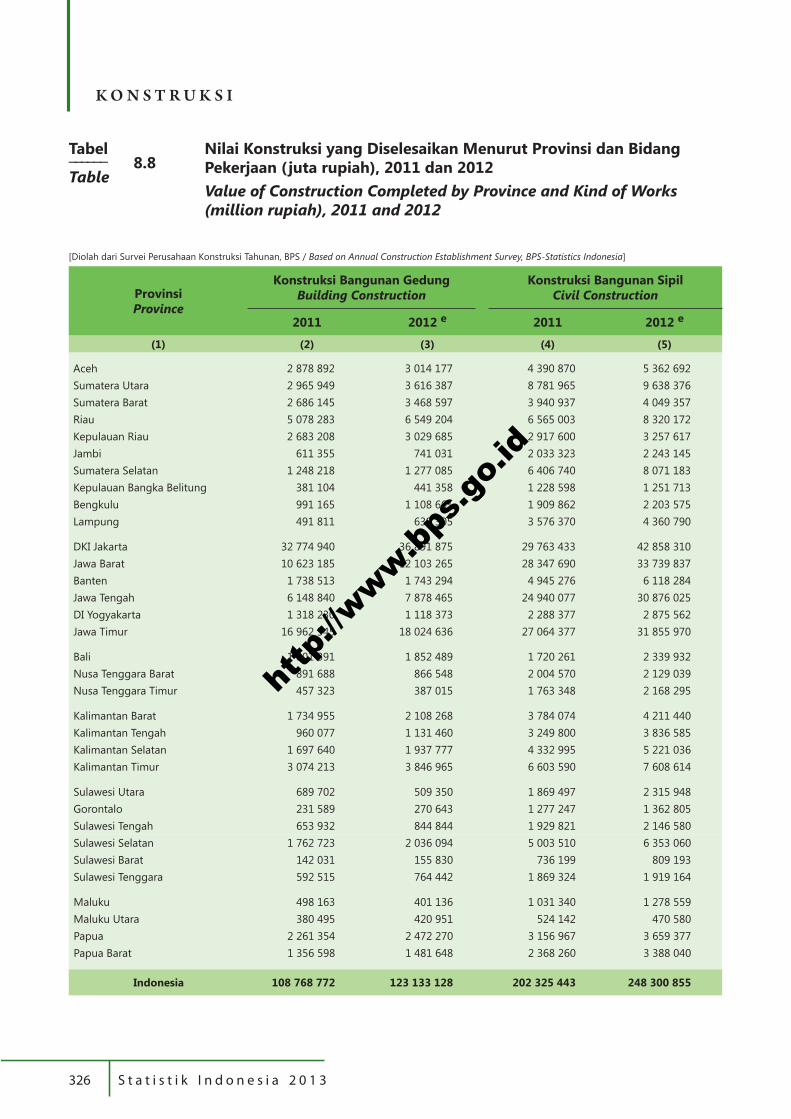
K O N S T R U K S I
S t a t i s t i k I n d o n e s i a 2 0 1 3326
Nilai Konstruksi yang Diselesaikan Menurut Provinsi dan Bidang Pekerjaan (juta rupiah), 2011 dan 2012Value of Construction Completed by Province and Kind of Works (million rupiah), 2011 and 2012
[Diolah dari Survei Perusahaan Konstruksi Tahunan, BPS / Based on Annual Construction Establishment Survey, BPS-Statistics Indonesia]
ProvinsiProvince
Konstruksi Bangunan GedungBuilding Construction
Konstruksi Bangunan SipilCivil Construction
2011 2012 e 2011 2012 e
(1) (2) (3) (4) (5)
Aceh 2 878 892 3 014 177 4 390 870 5 362 692Sumatera Utara 2 965 949 3 616 387 8 781 965 9 638 376Sumatera Barat 2 686 145 3 468 597 3 940 937 4 049 357Riau 5 078 283 6 549 204 6 565 003 8 320 172Kepulauan Riau 2 683 208 3 029 685 2 917 600 3 257 617Jambi 611 355 741 031 2 033 323 2 243 145Sumatera Selatan 1 248 218 1 277 085 6 406 740 8 071 183Kepulauan Bangka Belitung 381 104 441 358 1 228 598 1 251 713Bengkulu 991 165 1 108 661 1 909 862 2 203 575Lampung 491 811 639 305 3 576 370 4 360 790
DKI Jakarta 32 774 940 36 891 875 29 763 433 42 858 310Jawa Barat 10 623 185 12 103 265 28 347 690 33 739 837Banten 1 738 513 1 743 294 4 945 276 6 118 284Jawa Tengah 6 148 840 7 878 465 24 940 077 30 876 025DI Yogyakarta 1 318 230 1 118 373 2 288 377 2 875 562Jawa Timur 16 962 545 18 024 636 27 064 377 31 855 970
Bali 1 801 391 1 852 489 1 720 261 2 339 932Nusa Tenggara Barat 891 688 866 548 2 004 570 2 129 039Nusa Tenggara Timur 457 323 387 015 1 763 348 2 168 295
Kalimantan Barat 1 734 955 2 108 268 3 784 074 4 211 440Kalimantan Tengah 960 077 1 131 460 3 249 800 3 836 585Kalimantan Selatan 1 697 640 1 937 777 4 332 995 5 221 036Kalimantan Timur 3 074 213 3 846 965 6 603 590 7 608 614
Sulawesi Utara 689 702 509 350 1 869 497 2 315 948Gorontalo 231 589 270 643 1 277 247 1 362 805Sulawesi Tengah 653 932 844 844 1 929 821 2 146 580Sulawesi Selatan 1 762 723 2 036 094 5 003 510 6 353 060Sulawesi Barat 142 031 155 830 736 199 809 193Sulawesi Tenggara 592 515 764 442 1 869 324 1 919 164
Maluku 498 163 401 136 1 031 340 1 278 559Maluku Utara 380 495 420 951 524 142 470 580Papua 2 261 354 2 472 270 3 156 967 3 659 377Papua Barat 1 356 598 1 481 648 2 368 260 3 388 040
Indonesia 108 768 772 123 133 128 202 325 443 248 300 855
Tabel –––––– 8.8Table
http
://www.b
ps.g
o.id

C O N S T R U C T I O N
S t a t i s t i c a l Y e a r b o o k o f I n d o n e s i a 2 0 1 3 327
ProvinsiProvince
Konstruksi Khusus Especialized Construction
JumlahTotal
2011 2012 e 2011 2012
e
(1) (6) (7) (8) (9)
Aceh 425 391 460 654 7 695 153 8 837 523Sumatera Utara 3 260 352 4 500 248 15 008 266 17 755 011Sumatera Barat 749 175 881 495 7 376 257 8 399 449Riau 2 125 454 1 788 347 13 768 740 16 657 723Kepulauan Riau 652 318 796 440 6 253 126 7 083 742Jambi 323 077 310 712 2 967 755 3 294 888Sumatera Selatan 818 076 975 166 8 473 034 10 323 434Kepulauan Bangka Belitung 268 036 332 984 1 877 738 2 026 055Bengkulu 234 580 225 130 3 135 607 3 537 366Lampung 477 173 204 640 4 545 354 5 204 735
DKI Jakarta 28 900 622 29 089 090 91 438 995 108 839 275Jawa Barat 3 333 931 4 146 084 42 304 806 49 989 186Banten 1 733 185 1 877 582 8 416 974 9 739 160Jawa Tengah 7 042 541 5 726 109 38 131 458 44 480 599DI Yogyakarta 859 095 1 007 153 4 465 702 5 001 088Jawa Timur 5 584 954 7 257 925 49 611 876 57 138 531
Bali 530 257 608 495 4 051 909 4 800 916Nusa Tenggara Barat 911 642 1 125 667 3 807 900 4 121 254Nusa Tenggara Timur 285 563 256 710 2 506 234 2 812 020
Kalimantan Barat 823 388 790 941 6 342 417 7 110 649Kalimantan Tengah 401 247 287 420 4 611 124 5 255 465Kalimantan Selatan 724 115 541 478 6 754 750 7 700 291Kalimantan Timur 1 460 406 1 781 397 11 138 209 13 236 976
Sulawesi Utara 385 684 488 432 2 944 883 3 313 730
Gorontalo 149 714 211 346 1 658 550 1 844 794Sulawesi Tengah 187 998 200 373 2 771 751 3 191 797Sulawesi Selatan 995 786 922 690 7 762 019 9 311 844Sulawesi Barat 53 868 45 820 932 098 1 010 843Sulawesi Tenggara 162 742 193 958 2 624 581 2 877 564
Maluku 194 028 249 540 1 723 531 1 929 235Maluku Utara 272 326 371 545 1 176 963 1 263 076Papua 486 454 701 382 5 904 775 6 833 029Papua Barat 215 957 140 524 3 940 815 5 010 212
Indonesia 65 029 135 68 497 477 376 123 350 439 931 460
Catatan/Note: e Angka perkiraan/Estimated figures
Lanjutan Tabel/Continued Table 8.8
http
://www.b
ps.g
o.id

K O N S T R U K S I
S t a t i s t i k I n d o n e s i a 2 0 1 3328
Indeks Pekerja Tetap, Hari Orang, Balas Jasa dan Upah, serta Nilai Konstruksi yang Diselesaikan (2010=100), 2000 –2012Indices of Permanent Workers, Man-Days, Compensation and Wages, and Value of Construction Completed (2010=100), 2000–2012
(Diolah dari Survei Perusahaan Konstruksi Triwulanan BPS/Based on Quarterly Construction Establishment Survey, BPS-Statistics Indonesia)
Tahun dan Triwulan Year and Quarter
Pekerja Tetap Permanent Workers
Hari Orang Man-Days
Balas Jasa dan Upah Compensation and
Wages
Nilai Konstruksi Construction Value
(1) (2) (3) (4) (5)
2000 51,19 18,79 15,37 15,24
2001 54,68 21,59 18,12 17,89
2002 57,66 24,27 20,86 20,55
2003 60,57 27,67 24,29 23,93
2004 63,30 31,69 28,39 27,88
2005 70,68 39,50 35,85 34,93
2006 76,95 47,53 44,11 43,25
2007 82,56 57,10 53,94 53,11
2008 88,29 69,16 66,19 65,60
2009 94,44 83,86 81,74 81,53
2010 100,00 100,00 100,00 100,00
Triwulan/Quarter I 97,86 94,51 90,86 91,45
Triwulan/Quarter II 99,55 95,57 94,38 94,48
Triwulan/Quarter III 100,67 101,14 102,36 102,41
Triwulan/Quarter IV 101,92 108,78 112,40 111,65
2011 103,53 114,27 124,46 118,60
Triwulan/Quarter I 100,11 106,12 112,45 108,28
Triwulan/Quarter II 102,06 110,89 120,12 114,64
Triwulan/Quarter III 103,86 115,68 126,76 120,71
Triwulan/Quarter IV 108,08 124,38 138,51 130,78
2012 108,93 130,60 145,91 138,89
Triwulan/Quarter I 106,38 122,15 136,04 128,77
Triwulan/Quarter II 108,55 128,05 142,98 135,82
Triwulan/Quarter III 109,75 133,28 148,76 141,86
Triwulan/Quarter IV x 111,02 138,90 155,85 149,12
Tabel –––––– 8.9Table
Catatan/Note: x Angka sementara/Preliminary figuresSumber/Source: Benchmark Indeks Konstruksi dan Indikator Kontruksi/Benchmark of Construction Indices and Construction Indicator
http
://www.b
ps.g
o.id

C O N S T R U C T I O N
S t a t i s t i c a l Y e a r b o o k o f I n d o n e s i a 2 0 1 3 329
(Diolah dari Survei Perusahaan Konstruksi Triwulanan BPS / Based on Quarterly Construction Establishment Survey, BPS-Statistics Indonesia)
ProvinsiProvince
Pekerja Tetap Permanent Workers
Hari Orang Man-Days
Balas Jasa dan Upah Compensation and
Wages
Nilai Konstruksi Construction Value
2011 2012 x 2011 2012 x 2011 2012 x 2011 2012 x
(1) (2) (3) (4) (5) (6) (7) (8) (9)
Aceh 104,71 110,05 112,09 125,90 120,45 137,87 113,44 130,28Sumatera Utara 103,49 106,20 119,04 137,31 131,41 157,88 121,74 144,02Sumatera Barat 103,00 106,33 113,88 127,44 118,98 140,55 118,19 134,58Riau 103,23 111,57 118,81 141,27 127,73 158,62 121,73 147,27Kepulauan Riau 104,06 108,43 111,90 122,69 118,79 138,85 114,04 129,19Jambi 102,40 105,53 104,17 112,85 112,32 126,07 108,87 120,87Sumatera Selatan 104,71 110,76 128,99 154,64 145,67 181,17 131,57 160,30Kepulauan Bangka Belitung 101,59 103,51 105,24 111,26 116,32 130,26 108,22 116,77Bengkulu 102,33 105,05 107,23 116,96 116,39 131,31 110,48 124,63Lampung 103,49 105,65 111,10 125,28 119,12 139,76 114,52 131,14
DKI Jakarta 103,25 112,35 117,29 137,19 126,07 146,30 120,94 143,95Jawa Barat 102,83 108,52 111,37 127,93 123,83 147,80 115,18 136,10Banten 101,76 104,28 109,93 122,07 115,73 135,23 114,15 132,08Jawa Tengah 104,55 112,19 110,56 127,91 117,03 134,34 114,02 133,00DI Yogyakarta 104,22 106,97 108,61 118,51 116,06 132,66 111,12 124,45Jawa Timur 102,14 104,66 112,63 124,94 129,14 148,64 116,31 133,96
Bali 103,74 107,82 109,42 126,89 126,74 152,40 111,53 132,14Nusa Tenggara Barat 93,50 98,32 92,79 99,39 115,69 129,53 98,41 106,51Nusa Tenggara Timur 102,80 106,99 107,11 116,75 117,03 134,34 109,58 122,96
Kalimantan Barat 105,50 111,18 110,20 118,46 118,22 133,57 114,76 128,66Kalimantan Tengah 104,09 106,69 111,43 123,93 124,04 141,87 114,34 130,32Kalimantan Selatan 104,18 106,60 114,30 126,85 119,75 139,45 117,43 133,87Kalimantan Timur 105,67 112,61 120,45 138,94 128,21 156,76 123,87 147,21
Sulawesi Utara 100,52 101,63 104,81 112,19 117,87 130,28 109,07 122,73Gorontalo 102,82 106,93 109,57 119,98 118,79 138,08 111,74 124,29Sulawesi Tengah 102,53 104,59 110,30 118,22 121,01 136,63 115,45 132,95Sulawesi Selatan 107,40 111,25 117,43 136,35 127,54 153,95 121,12 145,30Sulawesi Barat 101,85 103,26 105,28 111,06 111,63 122,46 111,19 120,59Sulawesi Tenggara 101,93 107,34 109,17 116,78 118,45 137,39 115,15 126,25
Maluku 103,26 107,68 115,58 127,79 120,91 139,89 117,97 132,05Maluku Utara 104,26 107,17 107,78 113,18 115,29 124,93 111,23 119,37Papua 104,97 108,10 111,42 124,92 125,79 144,14 116,55 134,87Papua Barat 108,32 119,08 119,11 147,94 124,88 163,66 122,07 155,20
Indonesia 103,53 108,93 114,27 130,60 124,46 145,91 118,60 138,89
Indeks Pekerja Tetap, Hari Orang, Balas Jasa dan Upah, serta Nilai Konstruksi yang Diselesaikan Menurut Provinsi (2010=100), 2011 dan 2012Indices of Permanent Workers, Man-Days, Compensation and Wages, and Value of Construction Completed by Province (2010=100), 2011 and 2012
Tabel –––––– 8.10Table
Catatan/Note: x Angka sementara/Preliminary figuresSumber/Source: Benchmark Indeks Konstruksi dan Indikator Kontruksi/Benchmark of Construction Indices and Construction Indicator
http
://www.b
ps.g
o.id

K O N S T R U K S I
S t a t i s t i k I n d o n e s i a 2 0 1 3330
Catatan/Note: 1 Nilai merupakan harga estimasi/The values are estimated pricesSumber/Source: Perum Perumnas/National Housing and Urban Development Corporation
Volume, Nilai, dan Rata-Rata Harga per Unit Pembangunan Rumah oleh Perum Perumnas, 2012Volume, Value, and Average Price per Unit of Housing Development by Perum Perumnas, 2012
Regional ProvinsiProvince
VolumeVolume
(Unit/Unit)
Nilai 1/Value 1
(000 000 Rp)
Rata-rata Harga/Unit Average Price/Unit
(000 000 Rp)
(1) (2) (3) (4) (5)
1 Aceh 104 7 501 721 Sumatera Utara 281 18 700 671 Sumatera Barat 53 3 172 601 Riau 75 4 805 641 Kepulauan Riau 187 11 962 642 Jambi 51 4 543 892 Sumatera Selatan 560 60 111 1072 Kepulauan Bangka Belitung – – –2 Bengkulu 121 9 298 772 Lampung 653 50 553 77
3 DKI Jakarta 1 044 270 247 2593/4 Jawa Barat 1 061 156 429 1473/4 Banten 32 7 813 2445 Jawa Tengah 892 82 051 925 DI Yogyakarta 163 12 975 806 Jawa Timur 1 790 137 394 77
6 Bali 43 2 466 576 Nusa Tenggara Barat 288 19 788 696 Nusa Tenggara Timur – – –
2 Kalimantan Barat 1 283 54 163 422 Kalimantan Tengah 298 21 829 735 Kalimantan Selatan 299 22 173 745 Kalimantan Timur 308 22 131 72
7 Sulawesi Utara 361 15 010 427 Gorontalo 20 1 506 757 Sulawesi Tengah 54 3 231 607 Sulawesi Selatan 425 53 012 1257 Sulawesi Barat – – –7 Sulawesi Tenggara 56 6 499 116
7 Maluku 23 1 982 867 Maluku Utara – – –7 Papua 30 3 924 1317 Papua Barat – – –
Indonesia 10 555 1 065 271 101
Tabel –––––– 8.11Table
http
://www.b
ps.g
o.id

C O N S T R U C T I O N
S t a t i s t i c a l Y e a r b o o k o f I n d o n e s i a 2 0 1 3 331
Catatan/Note: 1 Mencakup rumah sederhana sehat, rumah sederhana, rumah inti, rumah toko, rumah susun sewa, dan rumah susun sederhana milik Including healthy simple houses, simple houses, core houses, shophouses, rental flats, and maizonette house
Sumber/Source: Perum Perumnas/National Housing and Urban Development Corporation
Banyaknya Stok Akhir Rumah 1 yang Dibangun oleh Perum Perumnas (unit), 2012Number of Housing Final Stock 1 Developed by Perum Perumnas (unit), 2012
Regional ProvinsiProvince
Stok AwalEarly Stock
PembangunanDevelopment
PersediaanInventory
PenjualanSale
Stok AkhirFinal Stock
(1) (2) (3) (4) (5) (6) (7)
1 Aceh 12 104 116 47 691 Sumatera Utara 1 363 281 1 644 674 9701 Sumatera Barat 12 53 65 65 -1 Riau 109 75 184 132 521 Kepulauan Riau 94 187 281 253 282 Jambi 34 51 85 25 602 Sumatera Selatan 139 560 699 568 1312 Kepulauan Bangka Belitung – – – – –2 Bengkulu 212 121 333 189 1442 Lampung 40 653 693 630 63
3 DKI Jakarta 1 582 1 044 2 626 485 2 1413/4 Jawa Barat 710 1 061 1 771 1 270 5013/4 Banten 61 32 93 42 51
5 Jawa Tengah 553 892 1 445 772 6735 DI Yogyakarta 45 163 208 177 316 Jawa Timur 1 769 1 790 3 559 1 634 1 925
6 Bali – 43 43 43 –6 Nusa Tenggara Barat 418 288 706 253 4536 Nusa Tenggara Timur – – – – –
2 Kalimantan Barat 71 1 283 1 354 1 263 912 Kalimantan Tengah 12 298 310 226 845 Kalimantan Selatan – 299 299 299 –5 Kalimantan Timur 228 308 536 318 218
7 Sulawesi Utara 70 361 431 431 –7 Gorontalo 3 20 23 20 37 Sulawesi Tengah 95 54 149 93 567 Sulawesi Selatan 364 425 789 609 1807 Sulawesi Barat – – – – –7 Sulawesi Tenggara 9 56 65 65 –
7 Maluku 18 23 41 25 167 Maluku Utara – – – – –7 Papua 54 30 84 41 437 Papua Barat – – – – –
Indonesia 8 077 10 555 18 632 10 649 7 983
Tabel –––––– 8.12Table
http
://www.b
ps.g
o.id

K O N S T R U K S I
S t a t i s t i k I n d o n e s i a 2 0 1 3332
Rencana dan Realisasi Pembangunan Rumah Siap Huni (RSH) oleh Perum Perumnas (unit), 2012Planning and Realization of The Development of Ready to Occupy Houses Developed by Perum Perumnas (unit), 2012
ProvinsiProvince
Rencana/Planning Realisasi/Realization1
RSS +RSH
RS>27/Apartemen
JumlahTotal
RSS +RSH
RS>27/Apartemen
JumlahTotal
(1) (2) (3) (4) (5) (6) (7)
Aceh 100 4 104 100 4 104Sumatera Utara 427 21 448 258 23 281Sumatera Barat 65 – 65 53 – 53Riau 85 – 85 75 – 75Kepulauan Riau 272 18 290 184 3 187Jambi – 58 58 – 51 51Sumatera Selatan 200 408 608 185 375 560Kepulauan Bangka Belitung – – – – – –Bengkulu 295 60 355 113 8 121Lampung – 635 635 25 628 653
DKI Jakarta – 1 641 1 641 – 1 044 1 044Jawa Barat 1 063 832 1 895 299 762 1 061Banten – 32 32 – 32 32
Jawa Tengah 596 514 1 110 442 450 892DI Yogyakarta 140 – 140 163 – 163Jawa Timur 433 1 494 1 927 465 1 325 1 790
Bali 76 – 76 43 – 43Nusa Tenggara Barat 380 49 429 259 29 288Nusa Tenggara Timur – – – – – –
Kalimantan Barat 62 1 260 1 322 17 1 266 1 283Kalimantan Tengah 351 65 416 288 10 298Kalimantan Selatan 148 21 169 32 267 299Kalimantan Timur 400 – 400 308 – 308
Sulawesi Utara 69 98 167 322 39 361Gorontalo 12 – 12 20 – 20Sulawesi Tengah 54 10 64 54 – 54Sulawesi Selatan 301 244 545 235 190 425Sulawesi Barat – – – – – –Sulawesi Tenggara 57 46 103 29 27 56
Maluku 66 53 119 – 23 23Maluku Utara – – – – – –Papua – 73 73 – 30 30Papua Barat – – – – – –
Indonesia 5 652 7 636 13 288 3 969 6 586 10 555
Catatan/Note: 1 Realisasi pembangunan rumah disesuaikan dengan permintaan daerah Realization of houses development depend on regional demandSumber/Source: Perum Perumnas/National Housing and Urban Development Corporation
Tabel –––––– 8.13Table
http
://www.b
ps.g
o.id

9HOTEL DAN PARIWISATA
Hotel and Tourismhttp
://www.b
ps.g
o.id

http
://www.b
ps.g
o.id

H O T E L A N D T O U R I S M
S t a t i s t i c a l Y e a r b o o k o f I n d o n e s i a 2 0 1 3 335
PENJELASAN TEKNIS
1. Konsep dan definisi pariwisata mengikuti rekomendasi World Tourism Organization (WTO) dan International Union of Office Travel Organization (IUOTO).
2. Wisatawan mancanegara (wisman) ialah setiap pengunjung yang mengunjungi suatu negara di luar tempat tinggalnya, didorong oleh satu atau beberapa keperluan tanpa bermaksud memperoleh penghasilan di tempat yang dikunjungi dan lamanya kunjungan tersebut tidak lebih dari satu tahun (12 bulan).
Definisi ini mencakup 2 (dua) kategori wisatawan mancanegara, yaitu :
a. Wisatawan (turis) ialah setiap pengunjung seperti definisi di atas yang tinggal paling sedikit 24 jam, akan tetapi tidak lebih dari 1 (satu) tahun di tempat yang dikunjungi, dengan maksud antara lain: berlibur, rekreasi, olah raga, bisnis, menghadiri pertemuan, studi, dan kunjungan dengan alasan kesehatan.
b. Excursionist ialah setiap pengunjung seperti definisi di atas yang tinggal kurang dari 24 jam di tempat yang dikunjungi (termasuk “Cruise passengers”). Cruise Passengers ialah setiap pengunjung yang tiba di suatu negara di mana mereka tidak menginap di akomodasi yang tersedia di negara tersebut, misalnya dengan kapal laut.
3. Rata-rata Lama Tinggal adalah rata-rata waktu tinggal wisatawan mancanegara di Indonesia untuk satu kali kunjungan.
4. Penerimaan negara dari wisatawan mancanegara
adalah hasil kali antara rata-rata pengeluaran wisman per kunjungan dengan jumlah kunjungan wisman.
5. Akomodasi ialah suatu usaha yang menggunakan suatu bangunan atau sebagian bangunan yang disediakan secara khusus, dan setiap orang dapat menginap, makan serta memperoleh pelayanan dan fasilitas lainnya dengan pembayaran. Akomodasi dibedakan antara hotel dan akomodasi lainnya. Ciri khusus dari hotel adalah mempunyai restoran yang berada di bawah manajemen hotel tersebut.
TECHNICAL NOTES
1. The concept and definition of tourism refers to the recommendations of the World Tourism Organization (WTO) and International Union of Office Travel Organizations (IUOTO).
2. A foreign visitor is any person visiting a country other than his usual place of residence for any reason other than for earning income in the country visited, and the length of stay is no more than one year (12 months).
This definition covers two categories of foreign visitors, namely :
a. “Tourist” is any visitor staying for at least 24 hours, but no more than one year, in the country visited, with the intention of visiting , and for any of these purposes:- Pleasure, recreation and sports,- Business, visiting friends and relatives, missions,
attending meetings, conferences, visit for health reasons and study.
b. “Excursionist” is any visitor staying less than 24 hours in the country visited including, “Cruise Passengers”, i.e. visitors arriving in a country without staying in any accommodation available in the visited country.
3. Average Length of Stay is the average stay duration of foreign visitor in Indonesia for one trip.
4. Revenue from foreign visitor is the number of foreign visitors in Indonesia multiplied by the average expenditure per visit.
5. An accommodation is an establishment using a building or a part of a building, prepared commercially for any person to stay, eat and obtain service as well as other facilities. Accommodation is segregated into hotel and other accommodations. The special characteristic of hotel is having a restaurant under hotel management.
http
://www.b
ps.g
o.id

H O T E L D A N P A R I W I S A T A
S t a t i s t i k I n d o n e s i a 2 0 1 3336
6. Hotel berbintang yaitu hotel yang telah memenuhi persyaratan yang telah ditentukan seperti persyaratan fisik, bentuk pelayanan yang diberikan, kualifikasi tenaga kerja, jumlah kamar dan lainnya. Hotel tidak berbintang yaitu hotel yang tidak memenuhi persyaratan yang telah ditentukan.
7. Tingkat penghunian kamar hotel adalah persentase banyaknya malam kamar yang dihuni terhadap banyaknya malam kamar yang tersedia.
8. Rata-rata lamanya tamu menginap adalah hasil bagi antara banyaknya malam tempat tidur yang terpakai dengan banyaknya tamu yang menginap di hotel dan akomodasi lainnya.
6. A classified hotel is an accommodation which meets specified standards regarding physical requirements, services provided, manpower qualifications, number of rooms available, etc. A non-classified hotel is an accommodation which has not met the requirements previously mentioned.
7. Room occupancy rate is the number of room-nights occupied divided by the number of room-nights available, multiplied by 100 percent.
8. Average length of stay is the number of bed-nights used divided by the number of guests staying at the accommodation.
http
://www.b
ps.g
o.id

H O T E L A N D T O U R I S M
S t a t i s t i c a l Y e a r b o o k o f I n d o n e s i a 2 0 1 3 337
Wisatawan Mancanegara yang Datang ke Indonesia Menurut Pintu Masuk, 2008–2012Arrivals of International Visitor to Indonesia by Port of Entry, 2008–2012
Tabel –––––– 9.1Table
[Diolah dari Dokumen Imigrasi, Ditjen Imigrasi/Based on Immigration Documents, Directorate General of Immigration]
Pintu MasukPort of Entry 2008 2009 2010 2011 2012
(1) (2) (3) (4) (5) (6)
Soekarno-Hatta 1 464 717 1 390 440 1 823 636 1 933 022 2 053 850
Ngurah Rai 2 081 786 2 384 819 2 546 023 2 788 706 2 902 125
Polonia 130 211 148 193 162 410 192 650 205 845
Batam 1 061 390 951 384 1 007 446 1 161 581 1 219 608
Manado 21 795 29 715 20 220 20 074 19 111
Juanda 156 726 158 076 168 888 185 815 197 776
Entikong 19 989 21 190 23 436 25 254 25 897
Adi Sumarmo 19 022 16 489 22 350 23 830 21 612
Minangkabau 40 911 51 002 27 482 30 585 32 768
Mataram 14 368 13 908 17 288 17 938 17 032
Makassar 5 818 20 222 16 211 14 295 13 881
Pekanbaru 18 002 18 996 15 278 21 982 21 387
Balikpapan 11 345 9 985 10 824 15 607 16 828
Tanjung Priok 67 886 59 212 63 859 65 171 66 168
Tanjung Pinang 123 505 102 487 97 954 106 180 103 785
Pintu lainnya/Other port of entry 997 026 947 612 979 639 1 047 041 1 126 789
Jumlah/Total 6 234 497 6 323 730 7 002 944 7 649 731 8 044 462
http
://www.b
ps.g
o.id

H O T E L D A N P A R I W I S A T A
S t a t i s t i k I n d o n e s i a 2 0 1 3338
Wisatawan Mancanegara yang Datang ke Indonesia Menurut Kebangsaan, 2008–2012Arrivals of International Visitor to Indonesia by Nationality, 2008–2012
Tabel ––––––
9.2Table
[Diolah dari Dokumen Imigrasi, Ditjen Imigrasi/Based on Immigration Documents, Directorate General of Immigration]
KebangsaanNationality 2008 2009 2010 2011 2012 x
(1) (2) (3) (4) (5) (6)
Asia Pasifik/Asia Pacific 4 888 203 4 917 083 5 527 342 6 050 406 6 362 611Brunei Darussalam 10 536 13 668 35 874 38 679 40 675Malaysia 1 009 722 1 041 053 1 171 737 1 173 351 1 233 897Filipina/Philippines 195 675 196 429 171 181 210 029 220 867Singapura/Singapore 1 197 267 1 138 071 1 206 360 1 324 839 1 393 202Thailand 66 012 93 381 111 645 115 036 120 972Vietnam 19 710 20 785 24 929 31 106 32 711Hongkong 58 260 63 801 73 658 84 985 89 370India 155 391 156 545 159 373 181 791 191 172Jepang/Japan 559 888 488 320 416 151 423 113 444 946Korea/Korea, Republic of 331 409 260 314 296 060 320 596 337 139Pakistan 7 273 5 880 5 772 6 598 6 938Bangladesh 6 155 6 347 5 557 6 394 6 724Srilanka 6 774 6 715 6 195 7 019 7 381Taiwan 218 146 204 794 214 192 228 922 240 735Cina/China 354 641 444 598 511 188 594 997 625 699Australia 418 899 571 541 769 585 933 376 981 539Selandia Baru/New Zealand 36 291 37 704 45 335 52 458 55 165Asia Pasifik Lainnya/Rest of Asia Pasific 236 154 167 137 302 550 317 117 333 480
Amerika/America 249 968 237 670 255 465 293 306 308 441Amerika Serikat/USA 174 547 165 098 177 677 203 205 213 691Kanada/Canada 45 408 43 948 48 349 57 129 60 077Amerika Lainnya/Rest of America 30 013 28 624 29 439 32 972 34 673
Eropa/Europe 989 854 1 028 405 1 048 543 1 110 871 1 168 193Austria 16 855 17 399 16 889 17 374 18 271Belgia/Belgium 22 854 25 781 24 493 24 579 25 847Denmark 18 434 20 062 17 565 19 950 20 979Perancis/France 129 446 165 656 160 913 171 736 180 598Jerman/Germany 142 767 133 032 144 411 149 110 156 804Italia/Italy 40 006 38 028 39 211 42 256 44 436Belanda/Netherlands 141 202 154 932 158 957 163 268 171 693Spanyol/Spain 30 278 28 200 30 574 30 657 32 239Portugal 11 368 11 331 11 629 13 661 14 366Swedia/Sweden 21 806 22 166 24 603 26 504 27 872Norwegia/Norway 16 468 16 261 16 226 17 803 18 722Finlandia/Finland 9 819 15 591 11 566 13 137 13 815Swiss/Switzerland 34 024 39 510 35 334 38 704 40 701Inggris/United Kingdom 184 604 183 262 192 335 201 221 211 604Rusia/Russia 74 483 77 018 83 836 96 438 101 414Eropa Lainnya/Rest of Europe 95 440 80 176 80 001 84 473 88 832
Lainnya (Timur Tengah dan Afrika) 106 472 140 572 171 594 195 148 205 218Others (Middle East and Africa)
Jumlah/Total 6 234 497 6 323 730 7 002 944 7 649 731 8 044 462
Catatan/Note: x Angka sementara/Preliminary figures
http
://www.b
ps.g
o.id
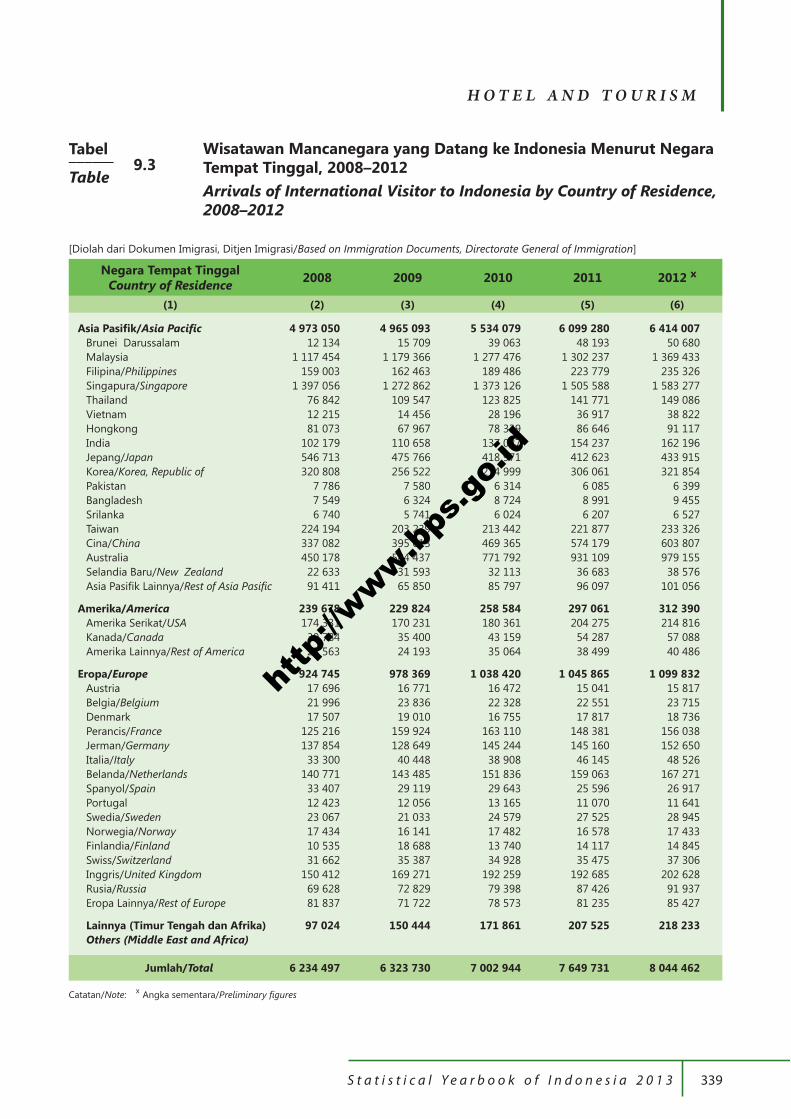
H O T E L A N D T O U R I S M
S t a t i s t i c a l Y e a r b o o k o f I n d o n e s i a 2 0 1 3 339
Wisatawan Mancanegara yang Datang ke Indonesia Menurut Negara Tempat Tinggal, 2008–2012Arrivals of International Visitor to Indonesia by Country of Residence, 2008–2012
Tabel –––––– 9.3 Table
[Diolah dari Dokumen Imigrasi, Ditjen Imigrasi/Based on Immigration Documents, Directorate General of Immigration]
Negara Tempat TinggalCountry of Residence 2008 2009 2010 2011 2012 x
(1) (2) (3) (4) (5) (6)
Asia Pasifik/Asia Pacific 4 973 050 4 965 093 5 534 079 6 099 280 6 414 007Brunei Darussalam 12 134 15 709 39 063 48 193 50 680Malaysia 1 117 454 1 179 366 1 277 476 1 302 237 1 369 433Filipina/Philippines 159 003 162 463 189 486 223 779 235 326Singapura/Singapore 1 397 056 1 272 862 1 373 126 1 505 588 1 583 277Thailand 76 842 109 547 123 825 141 771 149 086Vietnam 12 215 14 456 28 196 36 917 38 822Hongkong 81 073 67 967 78 339 86 646 91 117India 102 179 110 658 137 027 154 237 162 196Jepang/Japan 546 713 475 766 418 971 412 623 433 915Korea/Korea, Republic of 320 808 256 522 274 999 306 061 321 854Pakistan 7 786 7 580 6 314 6 085 6 399Bangladesh 7 549 6 324 8 724 8 991 9 455Srilanka 6 740 5 741 6 024 6 207 6 527Taiwan 224 194 203 239 213 442 221 877 233 326Cina/China 337 082 395 013 469 365 574 179 603 807Australia 450 178 584 437 771 792 931 109 979 155Selandia Baru/New Zealand 22 633 31 593 32 113 36 683 38 576Asia Pasifik Lainnya/Rest of Asia Pasific 91 411 65 850 85 797 96 097 101 056
Amerika/America 239 678 229 824 258 584 297 061 312 390Amerika Serikat/USA 174 331 170 231 180 361 204 275 214 816Kanada/Canada 39 784 35 400 43 159 54 287 57 088Amerika Lainnya/Rest of America 25 563 24 193 35 064 38 499 40 486
Eropa/Europe 924 745 978 369 1 038 420 1 045 865 1 099 832Austria 17 696 16 771 16 472 15 041 15 817Belgia/Belgium 21 996 23 836 22 328 22 551 23 715Denmark 17 507 19 010 16 755 17 817 18 736Perancis/France 125 216 159 924 163 110 148 381 156 038Jerman/Germany 137 854 128 649 145 244 145 160 152 650Italia/Italy 33 300 40 448 38 908 46 145 48 526Belanda/Netherlands 140 771 143 485 151 836 159 063 167 271Spanyol/Spain 33 407 29 119 29 643 25 596 26 917Portugal 12 423 12 056 13 165 11 070 11 641Swedia/Sweden 23 067 21 033 24 579 27 525 28 945Norwegia/Norway 17 434 16 141 17 482 16 578 17 433Finlandia/Finland 10 535 18 688 13 740 14 117 14 845Swiss/Switzerland 31 662 35 387 34 928 35 475 37 306Inggris/United Kingdom 150 412 169 271 192 259 192 685 202 628Rusia/Russia 69 628 72 829 79 398 87 426 91 937Eropa Lainnya/Rest of Europe 81 837 71 722 78 573 81 235 85 427
Lainnya (Timur Tengah dan Afrika) 97 024 150 444 171 861 207 525 218 233Others (Middle East and Africa)
Jumlah/Total 6 234 497 6 323 730 7 002 944 7 649 731 8 044 462
Catatan/Note: x Angka sementara/Preliminary figures
http
://www.b
ps.g
o.id
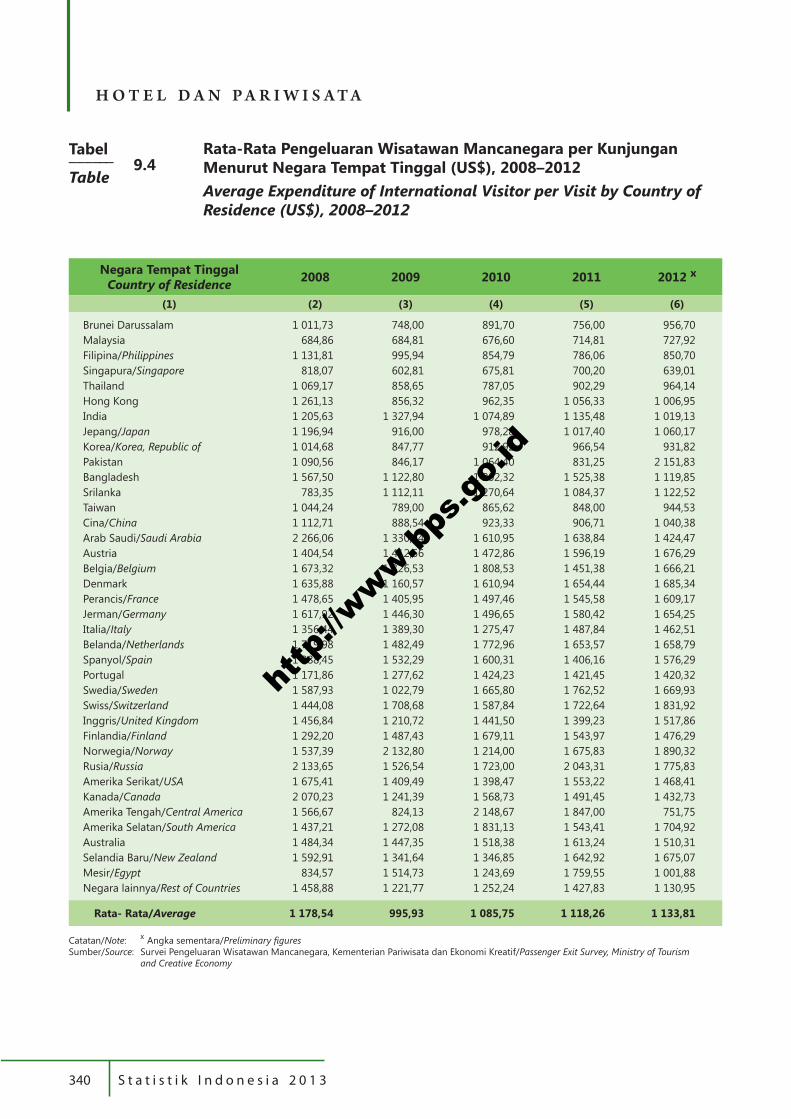
H O T E L D A N P A R I W I S A T A
S t a t i s t i k I n d o n e s i a 2 0 1 3340
Rata-Rata Pengeluaran Wisatawan Mancanegara per Kunjungan Menurut Negara Tempat Tinggal (US$), 2008–2012Average Expenditure of International Visitor per Visit by Country of Residence (US$), 2008–2012
Negara Tempat TinggalCountry of Residence 2008 2009 2010 2011 2012 x
(1) (2) (3) (4) (5) (6)
Brunei Darussalam 1 011,73 748,00 891,70 756,00 956,70Malaysia 684,86 684,81 676,60 714,81 727,92Filipina/Philippines 1 131,81 995,94 854,79 786,06 850,70Singapura/Singapore 818,07 602,81 675,81 700,20 639,01Thailand 1 069,17 858,65 787,05 902,29 964,14Hong Kong 1 261,13 856,32 962,35 1 056,33 1 006,95India 1 205,63 1 327,94 1 074,89 1 135,48 1 019,13Jepang/Japan 1 196,94 916,00 978,28 1 017,40 1 060,17Korea/Korea, Republic of 1 014,68 847,77 912,92 966,54 931,82Pakistan 1 090,56 846,17 1 064,40 831,25 2 151,83Bangladesh 1 567,50 1 122,80 1 202,32 1 525,38 1 119,85Srilanka 783,35 1 112,11 1 270,64 1 084,37 1 122,52Taiwan 1 044,24 789,00 865,62 848,00 944,53Cina/China 1 112,71 888,54 923,33 906,71 1 040,38Arab Saudi/Saudi Arabia 2 266,06 1 330,14 1 610,95 1 638,84 1 424,47Austria 1 404,54 1 412,56 1 472,86 1 596,19 1 676,29Belgia/Belgium 1 673,32 1 326,53 1 808,53 1 451,38 1 666,21Denmark 1 635,88 1 160,57 1 610,94 1 654,44 1 685,34Perancis/France 1 478,65 1 405,95 1 497,46 1 545,58 1 609,17Jerman/Germany 1 617,92 1 446,30 1 496,65 1 580,42 1 654,25Italia/Italy 1 356,44 1 389,30 1 275,47 1 487,84 1 462,51Belanda/Netherlands 1 719,98 1 482,49 1 772,96 1 653,57 1 658,79Spanyol/Spain 1 388,45 1 532,29 1 600,31 1 406,16 1 576,29Portugal 1 171,86 1 277,62 1 424,23 1 421,45 1 420,32Swedia/Sweden 1 587,93 1 022,79 1 665,80 1 762,52 1 669,93Swiss/Switzerland 1 444,08 1 708,68 1 587,84 1 722,64 1 831,92Inggris/United Kingdom 1 456,84 1 210,72 1 441,50 1 399,23 1 517,86Finlandia/Finland 1 292,20 1 487,43 1 679,11 1 543,97 1 476,29Norwegia/Norway 1 537,39 2 132,80 1 214,00 1 675,83 1 890,32Rusia/Russia 2 133,65 1 526,54 1 723,00 2 043,31 1 775,83Amerika Serikat/USA 1 675,41 1 409,49 1 398,47 1 553,22 1 468,41Kanada/Canada 2 070,23 1 241,39 1 568,73 1 491,45 1 432,73Amerika Tengah/Central America 1 566,67 824,13 2 148,67 1 847,00 751,75Amerika Selatan/South America 1 437,21 1 272,08 1 831,13 1 543,41 1 704,92Australia 1 484,34 1 447,35 1 518,38 1 613,24 1 510,31Selandia Baru/New Zealand 1 592,91 1 341,64 1 346,85 1 642,92 1 675,07Mesir/Egypt 834,57 1 514,73 1 243,69 1 759,55 1 001,88Negara lainnya/Rest of Countries 1 458,88 1 221,77 1 252,24 1 427,83 1 130,95
Rata- Rata/Average 1 178,54 995,93 1 085,75 1 118,26 1 133,81
Catatan/Note: x Angka sementara/Preliminary figures Sumber/Source: Survei Pengeluaran Wisatawan Mancanegara, Kementerian Pariwisata dan Ekonomi Kreatif/Passenger Exit Survey, Ministry of Tourism
and Creative Economy
Tabel –––––– 9.4 Table
http
://www.b
ps.g
o.id

H O T E L A N D T O U R I S M
S t a t i s t i c a l Y e a r b o o k o f I n d o n e s i a 2 0 1 3 341
Rata-Rata Lama Tinggal Wisatawan Mancanegara Menurut Negara Tempat Tinggal (hari), 2008–2012Average Length of Stay of International Visitor by Country of Residence (day), 2008–2012
Negara Tempat TinggalCountry of Residence 2008 2009 2010 2011 2012 x
(1) (2) (3) (4) (5) (6)
Brunei Darussalam 6,73 6,38 5,23 5,15 5,43Malaysia 5,20 5,28 5,03 5,23 5,26Filipina/Philippines 9,29 7,92 7,09 6,11 6,38Singapura/Singapore 5,01 4,51 4,67 4,44 4,27Thailand 8,76 5,77 5,78 6,25 6,32Hong Kong 6,96 5,90 5,85 5,92 5,59India 10,32 8,89 8,68 7,90 7,18Jepang/Japan 7,44 6,50 6,14 6,37 6,43Korea/Korea, Republic of 6,48 5,49 5,93 5,93 5,57Pakistan 8,94 7,50 11,69 4,68 7,94Bangladesh 8,52 11,05 11,42 9,08 6,82Srilanka 7,65 6,44 11,20 5,63 7,52Taiwan 6,73 5,79 5,84 5,63 6,12Cina/China 7,49 6,21 5,98 6,01 6,31Arab Saudi/Saudi Arabia 9,82 10,31 9,37 9,14 8,69Austria 11,32 12,58 12,16 13,03 11,36Belgia/Belgium 14,97 12,60 13,68 10,74 12,33Denmark 14,63 12,51 13,24 15,20 13,49Perancis/France 12,89 11,85 12,59 13,30 12,06Jerman/Germany 12,95 12,93 12,58 13,55 12,59Italia/Italy 10,90 10,95 10,69 11,62 10,18Belanda/Netherlands 16,24 14,10 15,52 13,97 14,59Spanyol/Spain 10,11 12,65 12,18 10,32 11,30Portugal 10,57 9,69 12,63 10,77 10,25Swedia/Sweden 13,78 10,21 18,68 14,33 15,14Swiss/Switzerland 11,51 13,78 14,91 13,83 12,68Inggris/United Kingdom 11,64 10,75 11,76 10,26 11,37Finlandia/Finland 12,96 19,21 12,20 13,15 13,17Norwegia/Norway 11,44 11,80 11,06 13,38 11,61Rusia/Russia 12,79 9,84 11,38 13,26 12,00Amerika Serikat/USA 14,01 11,11 10,55 10,98 10,41Kanada/Canada 16,79 12,13 11,89 11,08 11,36Amerika Tengah/Central America 11,67 7,63 11,50 10,00 6,00Amerika Selatan/South America 11,29 8,95 15,88 11,59 11,68Australia 10,79 10,22 10,56 9,47 9,26Selandia Baru/New Zealand 10,19 10,06 10,16 10,97 11,20Mesir/Egypt 4,57 8,27 6,38 9,64 12,75Negara lainnya/Rest of Countries 10,50 9,29 9,37 10,77 8,06
Rata-Rata/Average 8,58 7,69 8,04 7,84 7,70
Catatan/Note: x Angka sementara/Preliminary figures Sumber/Source: Survei Pengeluaran Wisatawan Mancanegara, Kementerian Pariwisata dan Ekonomi Kreatif/Passenger Exit Survey, Ministry of Tourism
and Creative Economy
Tabel –––––– 9.5 Table
http
://www.b
ps.g
o.id

H O T E L D A N P A R I W I S A T A
S t a t i s t i k I n d o n e s i a 2 0 1 3342
Catatan/Note: x Angka sementara/Preliminary figures Sumber/Source: Survei Pengeluaran Wisatawan Mancanegara, Kementerian Pariwisata dan Ekonomi Kreatif/Passenger Exit Survey, Ministry of Tourism
and Creative Economy
Penerimaan dari Wisatawan Mancanegara Menurut Negara Tempat Tinggal (juta US$), 2008–2012Revenue from International Visitor by Country of Residence (million US$), 2008–2012
Negara Tempat TinggalCountry of Residence 2008 2009 2010 2011 2012 x
(1) (2) (3) (4) (5) (6)
Brunei Darussalam 12,27 11,75 34,83 36,43 48,49Malaysia 765,30 807,64 864,34 930,85 996,84Filipina/Philippines 180,00 161,80 161,97 175,90 200,19Singapura/Singapore 1 142,89 767,29 927,97 1 054,21 1 011,73Thailand 82,16 94,06 97,46 127,92 143,74Hong Kong 102,24 58,20 75,39 91,53 91,75India 123,19 146,95 147,29 175,13 165,30Jepang/Japan 654,38 435,80 409,87 419,80 460,02Korea/Korea, Republic of 325,52 217,47 251,05 295,82 299,91Pakistan 8,49 6,41 6,72 5,06 13,77Bangladesh 11,83 7,10 10,49 13,71 10,59Srilanka 5,28 6,38 7,65 6,73 7,33Taiwan 234,11 160,36 184,76 188,15 220,38Cina/China 375,08 350,98 433,38 520,61 628,19Arab Saudi/Saudi Arabia 107,59 122,42 170,03 211,06 193,40Austria 24,85 23,69 24,26 24,01 26,51Belgia/Belgium 36,81 31,62 40,38 32,73 39,51Denmark 28,64 22,06 26,99 29,48 31,58Perancis/France 185,15 224,85 244,25 229,33 251,09Jerman/Germany 223,04 186,07 217,38 229,41 252,52Italia/Italy 45,19 56,19 49,63 68,66 70,97Belanda/Netherlands 242,12 212,72 269,20 263,02 277,47Spanyol/Spain 46,38 44,62 47,44 35,99 42,43Portugal 14,56 15,40 18,75 15,74 16,53Swedia/Sweden 36,63 21,51 40,94 48,51 48,34Swiss/witzerland 45,72 60,47 55,46 61,11 68,34Inggris/United Kingdom 219,13 204,94 277,14 269,61 307,56Finlandia/Finland 13,61 27,80 23,07 21,80 21,92Norwegia/Norway 26,80 34,43 21,22 27,78 32,95Rusia/Russia 148,56 111,18 136,80 178,64 163,26Amerika Serikat/USA 292,08 239,94 252,23 317,28 315,44Kanada/Canada 82,36 43,95 67,70 80,97 81,79Amerika Tengah /Central America 18,98 4,88 3,20 4,28 2,01Amerika Selatan/South America 19,33 23,24 42,64 41,00 47,66Australia 668,22 845,88 1 171,87 1 502,10 1 478,83Selandia Baru/New Zealand 36,05 42,39 43,25 60,27 64,62Mesir/Egypt 2,29 4,59 4,02 5,18 3,08Negara lainnya/Rest of Countries 760,78 461,00 742,39 754,56 984,85
Jumlah/Total 7 347,60 6 297,99 7 603,45 8 554,39 9 120,89
Tabel –––––– 9.6 Table
http
://www.b
ps.g
o.id

H O T E L A N D T O U R I S M
S t a t i s t i c a l Y e a r b o o k o f I n d o n e s i a 2 0 1 3 343
Jumlah Akomodasi, Kamar, dan Tempat Tidur yang Tersedia pada Hotel Bintang Menurut Provinsi, 2008–2012Number of Accommodations, Rooms, and Beds Available in Classified Hotel by Province, 2008–2012
[Diolah dari Hasil Survei Hotel Tahunan (VHTL), BPS/Based on Hotels Survey, BPS-Statistics Indonesia]
ProvinsiProvince
2008 2009 2010
Akomodasi Accom-
modations
KamarRooms
Tempat TidurBeds
Akomodasi Accom-
modations
KamarRooms
Tempat TidurBeds
Akomodasi Accom-
modations
KamarRooms
Tempat TidurBeds
(1) (2) (3) (4) (5) (6) (7) (8) (9) (10)
Aceh 16 774 1 292 14 993 1 666 16 1 144 1 894Sumatera Utara 62 5 256 9 413 69 5 998 10 480 70 6 292 10 638Sumatera Barat 24 1 641 2 767 31 1 892 3 478 28 1 442 2 898Riau 26 2 507 3 712 31 2 765 4 202 33 3 016 4 471Kepulauan Riau 39 3 887 5 323 52 6 263 9 064 49 5 992 8 989Jambi 12 743 1 103 12 822 1 155 18 1 160 1 570Sumatera Selatan 33 2 298 3 271 32 2 095 2 867 31 2 065 2 735Kepulauan Bangka Belitung
11 361 558 11 397 596 13 470 752
Bengkulu 4 167 281 4 170 270 5 177 301Lampung 8 513 730 8 489 708 8 550 907
DKI Jakarta 139 24 987 34 940 153 26 179 37 046 160 27 685 38 485Jawa Barat 161 13 303 22 273 165 13 719 22 998 174 14 201 23 285Banten 37 2 641 4 248 37 2 775 4 184 39 2 765 4 208Jawa Tengah 108 6 725 11 676 114 7 002 12 256 119 7 031 12 432DI Yogyakarta 34 3 471 5 443 34 3 434 5 466 34 3 491 5 481Jawa Timur 79 7 672 11 811 84 8 589 13 228 84 8 598 13 301
Bali 150 20 240 33 178 149 18 684 29 346 170 21 133 32 892Nusa Tenggara Barat
32 2 222 3 424 33 1 951 3 014 32 1 925 2 984
Nusa Tenggara Timur
8 323 566 13 532 885 13 616 1 017
Kalimantan Barat 11 1 069 1 581 12 1 250 1 844 14 1 514 2 156Kalimantan Tengah 2 118 194 4 209 329 5 317 452Kalimantan Selatan 23 1 470 2 189 26 1 608 2 452 26 1 551 2 410Kalimantan Timur 36 3 480 4 891 32 3 628 5 164 32 3 739 5 668
Sulawesi Utara 17 1 190 1 843 27 1 984 3 144 28 1 920 3 032Gorontalo 1 54 79 1 54 77 1 54 77Sulawesi Tengah 1 55 93 2 136 196 3 218 304Sulawesi Selatan 50 2 979 4 545 50 3 100 4 618 63 3 668 5 499Sulawesi Barat – – – – – – – – –Sulawesi Tenggara 1 30 54 2 105 166 1 32 56
Maluku 15 529 799 14 510 758 13 571 890Maluku Utara 1 44 44 2 239 370 3 287 441Papua 14 731 1 093 13 710 1 080 12 601 895Papua Barat 11 523 787 6 367 531 9 564 828
Indonesia 1 166 112 003 174 201 1 237 118 649 183 638 1 306 124 789 191 948
Tabel –––––– 9.7 Table
http
://www.b
ps.g
o.id

H O T E L D A N P A R I W I S A T A
S t a t i s t i k I n d o n e s i a 2 0 1 3344
ProvinsiProvince
2011 2012
Akomodasi Accom-
modations
KamarRooms
Tempat TidurBeds
Akomodasi Accom-
modations
KamarRooms
Tempat TidurBeds
(1) (11) (12) (13) (14) (15) (16)
Aceh 18 1 218 1 971 22 1 340 2 246Sumatera Utara 76 6 786 11 531 83 7 535 12 803Sumatera Barat 36 1 740 3 247 45 2 550 4 328Riau 36 3 248 4 883 41 3 670 5 347Kepulauan Riau 69 8 808 12 355 70 9 215 13 703Jambi 20 1 260 1 795 20 1 236 1 719Sumatera Selatan 35 2 393 3 231 46 3 395 4 873Kepulauan Bangka Belitung 18 874 1 320 23 1 223 1 771Bengkulu 5 202 330 5 250 387Lampung 13 1 066 1 791 9 786 1 248
DKI Jakarta 162 28 783 39 727 175 30 135 41 744Jawa Barat 199 16 732 27 380 208 18 643 30 942Banten 46 3 428 5 131 42 3 514 5 510Jawa Tengah 131 8 736 14 339 139 9 756 15 803DI Yogyakarta 42 3 966 6 497 52 4 869 7 832Jawa Timur 90 9 311 14 496 98 10 039 16 248
Bali 199 22 794 33 911 218 24 215 36 837Nusa Tenggara Barat 36 2 031 3 219 43 2 583 4 118Nusa Tenggara Timur 16 754 1 214 15 864 1 381
Kalimantan Barat 18 1 794 2 504 25 2 178 3 151Kalimantan Tengah 7 478 667 9 550 756Kalimantan Selatan 32 2 010 3 147 35 2 143 3 397Kalimantan Timur 43 4 987 7 330 43 4 822 7 408
Sulawesi Utara 26 1 907 2 910 28 2 180 3 224Gorontalo 1 54 77 1 54 77Sulawesi Tengah 3 227 343 3 201 327Sulawesi Selatan 58 3 657 5 462 57 3 683 5 516Sulawesi Barat 1 131 208 6 369 486Sulawesi Tenggara 8 495 786 10 564 817
Maluku 19 953 1 392 19 958 1 290Maluku Utara 3 299 458 3 283 400Papua 13 707 1 031 19 1 232 1 789Papua Barat 10 652 950 11 705 1 007
Indonesia 1 489 142 481 215 633 1 623 155 740 238 485
Lanjutan Tabel/Continued Table 9.7
http
://www.b
ps.g
o.id
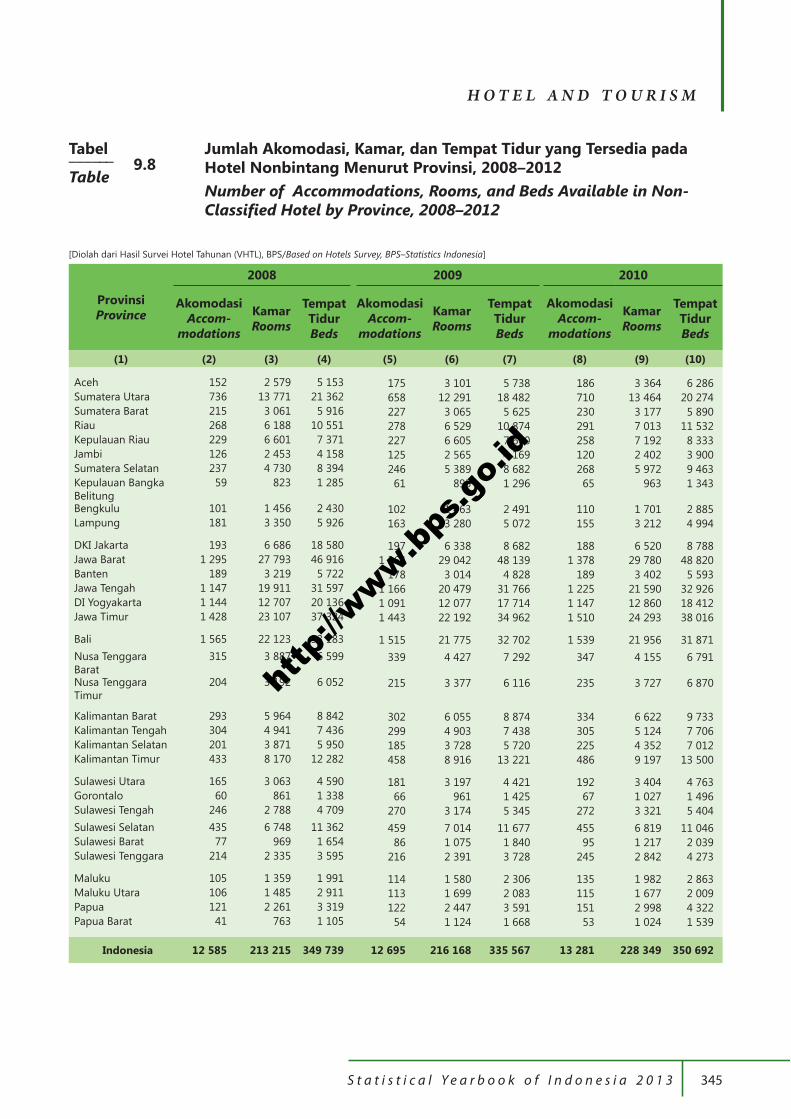
H O T E L A N D T O U R I S M
S t a t i s t i c a l Y e a r b o o k o f I n d o n e s i a 2 0 1 3 345
Jumlah Akomodasi, Kamar, dan Tempat Tidur yang Tersedia pada Hotel Nonbintang Menurut Provinsi, 2008–2012Number of Accommodations, Rooms, and Beds Available in Non- Classified Hotel by Province, 2008–2012
[Diolah dari Hasil Survei Hotel Tahunan (VHTL), BPS/Based on Hotels Survey, BPS–Statistics Indonesia]
ProvinsiProvince
2008 2009 2010
Akomodasi Accom-
modations
KamarRooms
Tempat TidurBeds
Akomodasi Accom-
modations
KamarRooms
Tempat TidurBeds
Akomodasi Accom-
modations
KamarRooms
Tempat TidurBeds
(1) (2) (3) (4) (5) (6) (7) (8) (9) (10)
Aceh 152 2 579 5 153 175 3 101 5 738 186 3 364 6 286Sumatera Utara 736 13 771 21 362 658 12 291 18 482 710 13 464 20 274Sumatera Barat 215 3 061 5 916 227 3 065 5 625 230 3 177 5 890Riau 268 6 188 10 551 278 6 529 10 874 291 7 013 11 532Kepulauan Riau 229 6 601 7 371 227 6 605 7 600 258 7 192 8 333Jambi 126 2 453 4 158 125 2 565 4 169 120 2 402 3 900Sumatera Selatan 237 4 730 8 394 246 5 389 8 682 268 5 972 9 463Kepulauan Bangka Belitung
59 823 1 285 61 895 1 296 65 963 1 343
Bengkulu 101 1 456 2 430 102 1 463 2 491 110 1 701 2 885Lampung 181 3 350 5 926 163 3 280 5 072 155 3 212 4 994
DKI Jakarta 193 6 686 18 580 197 6 338 8 682 188 6 520 8 788Jawa Barat 1 295 27 793 46 916 1 364 29 042 48 139 1 378 29 780 48 820Banten 189 3 219 5 722 178 3 014 4 828 189 3 402 5 593Jawa Tengah 1 147 19 911 31 597 1 166 20 479 31 766 1 225 21 590 32 926DI Yogyakarta 1 144 12 707 20 136 1 091 12 077 17 714 1 147 12 860 18 412Jawa Timur 1 428 23 107 37 324 1 443 22 192 34 962 1 510 24 293 38 016
Bali 1 565 22 123 33 183 1 515 21 775 32 702 1 539 21 956 31 871Nusa Tenggara Barat
315 3 887 6 599 339 4 427 7 292 347 4 155 6 791
Nusa Tenggara Timur
204 3 192 6 052 215 3 377 6 116 235 3 727 6 870
Kalimantan Barat 293 5 964 8 842 302 6 055 8 874 334 6 622 9 733Kalimantan Tengah 304 4 941 7 436 299 4 903 7 438 305 5 124 7 706Kalimantan Selatan 201 3 871 5 950 185 3 728 5 720 225 4 352 7 012Kalimantan Timur 433 8 170 12 282 458 8 916 13 221 486 9 197 13 500
Sulawesi Utara 165 3 063 4 590 181 3 197 4 421 192 3 404 4 763Gorontalo 60 861 1 338 66 961 1 425 67 1 027 1 496Sulawesi Tengah 246 2 788 4 709 270 3 174 5 345 272 3 321 5 404Sulawesi Selatan 435 6 748 11 362 459 7 014 11 677 455 6 819 11 046Sulawesi Barat 77 969 1 654 86 1 075 1 840 95 1 217 2 039Sulawesi Tenggara 214 2 335 3 595 216 2 391 3 728 245 2 842 4 273
Maluku 105 1 359 1 991 114 1 580 2 306 135 1 982 2 863Maluku Utara 106 1 485 2 911 113 1 699 2 083 115 1 677 2 009Papua 121 2 261 3 319 122 2 447 3 591 151 2 998 4 322Papua Barat 41 763 1 105 54 1 124 1 668 53 1 024 1 539
Indonesia 12 585 213 215 349 739 12 695 216 168 335 567 13 281 228 349 350 692
Tabel –––––– 9.8 Table
http
://www.b
ps.g
o.id

H O T E L D A N P A R I W I S A T A
S t a t i s t i k I n d o n e s i a 2 0 1 3346
ProvinsiProvince
2011 2012
Akomodasi Accom-
modations
KamarRooms
Tempat TidurBeds
Akomodasi Accom-
modations
KamarRooms
Tempat TidurBeds
(1) (11) (12) (13) (14) (15) (16)
Aceh 190 3 549 6 410 214 4 092 7 504Sumatera Utara 715 13 426 20 056 705 13 052 19 775Sumatera Barat 236 3 413 6 229 229 3 538 6 305Riau 290 7 158 11 775 307 7 210 11 539Kepulauan Riau 283 7 677 9 114 286 7 809 9 278Jambi 125 2 671 4 391 131 2 713 4 451Sumatera Selatan 276 6 376 10 029 253 5 787 9 097Kepulauan Bangka Belitung 72 1 108 1 494 79 1 196 1 592Bengkulu 123 1 952 3 062 118 2 044 3 203Lampung 156 3 220 5 073 161 3 401 5 504
DKI Jakarta 203 7 531 10 575 208 7 981 10 841Jawa Barat 1 377 29 458 46 814 1 442 31 721 51 661Banten 200 3 505 5 767 217 4 262 7 147Jawa Tengah 1 237 22 002 36 418 1 302 23 378 38 289DI Yogyakarta 1 016 12 165 17 845 1 083 13 112 20 702Jawa Timur 1 743 27 101 42 017 1 825 28 752 46 503
Bali 1 630 23 569 34 125 1 696 24 322 36 281Nusa Tenggara Barat 370 4 333 7 022 412 5 073 8 077Nusa Tenggara Timur 253 4 014 7 422 248 4 031 7 145
Kalimantan Barat 339 6 731 9 966 343 6 554 9 544Kalimantan Tengah 299 5 085 7 747 295 4 952 7 468Kalimantan Selatan 227 4 544 7 893 232 4 419 7 568Kalimantan Timur 497 9 584 14 005 494 9 830 14 288
Sulawesi Utara 198 3 495 5 049 197 3 361 4 693Gorontalo 75 1 137 1 672 81 1 316 1 811Sulawesi Tengah 311 3 723 6 053 350 4 206 7 201Sulawesi Selatan 490 7 582 12 069 491 7 354 11 685Sulawesi Barat 102 1 404 2 310 110 1 413 2 284Sulawesi Tenggara 259 2 931 4 382 293 3 475 4 811
Maluku 164 2 411 3 498 170 2 664 3 566Maluku Utara 121 1 750 2 050 168 2 414 2 942Papua 147 2 991 4 226 151 3 072 4 337Papua Barat 70 1 380 2 016 84 1 534 2 177
Indonesia 13 794 238 976 368 574 14 375 250 038 389 269
Lanjutan Tabel/Continued Table 9.8
http
://www.b
ps.g
o.id
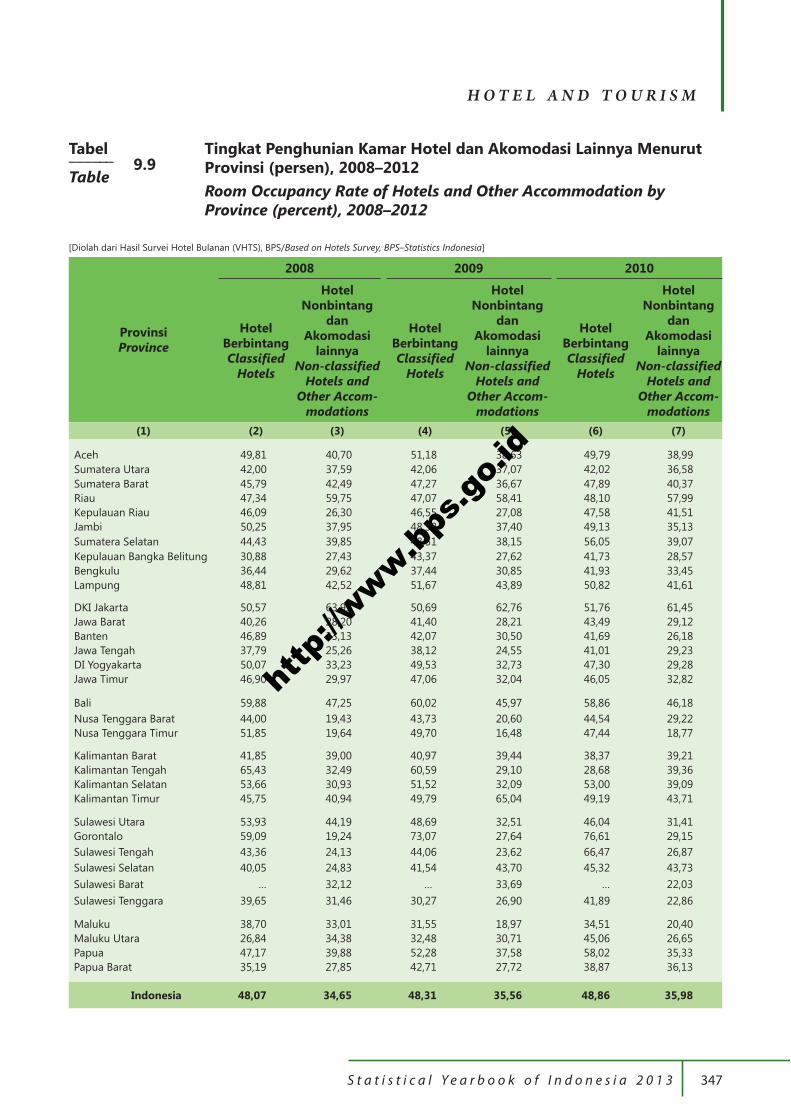
H O T E L A N D T O U R I S M
S t a t i s t i c a l Y e a r b o o k o f I n d o n e s i a 2 0 1 3 347
Tingkat Penghunian Kamar Hotel dan Akomodasi Lainnya Menurut Provinsi (persen), 2008–2012Room Occupancy Rate of Hotels and Other Accommodation by Province (percent), 2008–2012
[Diolah dari Hasil Survei Hotel Bulanan (VHTS), BPS/Based on Hotels Survey, BPS–Statistics Indonesia]
ProvinsiProvince
2008 2009 2010
Hotel Berbintang Classified
Hotels
Hotel Nonbintang
dan Akomodasi
lainnyaNon-classified
Hotels and Other Accom-
modations
Hotel Berbintang Classified
Hotels
Hotel Nonbintang
dan Akomodasi
lainnyaNon-classified
Hotels and Other Accom-
modations
Hotel Berbintang Classified
Hotels
Hotel Nonbintang
dan Akomodasi
lainnyaNon-classified
Hotels and Other Accom-
modations(1) (2) (3) (4) (5) (6) (7)
Aceh 49,81 40,70 51,18 38,63 49,79 38,99Sumatera Utara 42,00 37,59 42,06 37,07 42,02 36,58Sumatera Barat 45,79 42,49 47,27 36,67 47,89 40,37Riau 47,34 59,75 47,07 58,41 48,10 57,99Kepulauan Riau 46,09 26,30 46,55 27,08 47,58 41,51Jambi 50,25 37,95 48,38 37,40 49,13 35,13Sumatera Selatan 44,43 39,85 48,51 38,15 56,05 39,07Kepulauan Bangka Belitung 30,88 27,43 43,37 27,62 41,73 28,57Bengkulu 36,44 29,62 37,44 30,85 41,93 33,45Lampung 48,81 42,52 51,67 43,89 50,82 41,61
DKI Jakarta 50,57 63,93 50,69 62,76 51,76 61,45Jawa Barat 40,26 28,20 41,40 28,21 43,49 29,12Banten 46,89 33,13 42,07 30,50 41,69 26,18Jawa Tengah 37,79 25,26 38,12 24,55 41,01 29,23DI Yogyakarta 50,07 33,23 49,53 32,73 47,30 29,28Jawa Timur 46,90 29,97 47,06 32,04 46,05 32,82
Bali 59,88 47,25 60,02 45,97 58,86 46,18Nusa Tenggara Barat 44,00 19,43 43,73 20,60 44,54 29,22Nusa Tenggara Timur 51,85 19,64 49,70 16,48 47,44 18,77
Kalimantan Barat 41,85 39,00 40,97 39,44 38,37 39,21Kalimantan Tengah 65,43 32,49 60,59 29,10 28,68 39,36Kalimantan Selatan 53,66 30,93 51,52 32,09 53,00 39,09Kalimantan Timur 45,75 40,94 49,79 65,04 49,19 43,71
Sulawesi Utara 53,93 44,19 48,69 32,51 46,04 31,41Gorontalo 59,09 19,24 73,07 27,64 76,61 29,15Sulawesi Tengah 43,36 24,13 44,06 23,62 66,47 26,87Sulawesi Selatan 40,05 24,83 41,54 43,70 45,32 43,73Sulawesi Barat … 32,12 … 33,69 … 22,03Sulawesi Tenggara 39,65 31,46 30,27 26,90 41,89 22,86
Maluku 38,70 33,01 31,55 18,97 34,51 20,40Maluku Utara 26,84 34,38 32,48 30,71 45,06 26,65Papua 47,17 39,88 52,28 37,58 58,02 35,33Papua Barat 35,19 27,85 42,71 27,72 38,87 36,13
Indonesia 48,07 34,65 48,31 35,56 48,86 35,98
Tabel –––––– 9.9 Table
http
://www.b
ps.g
o.id
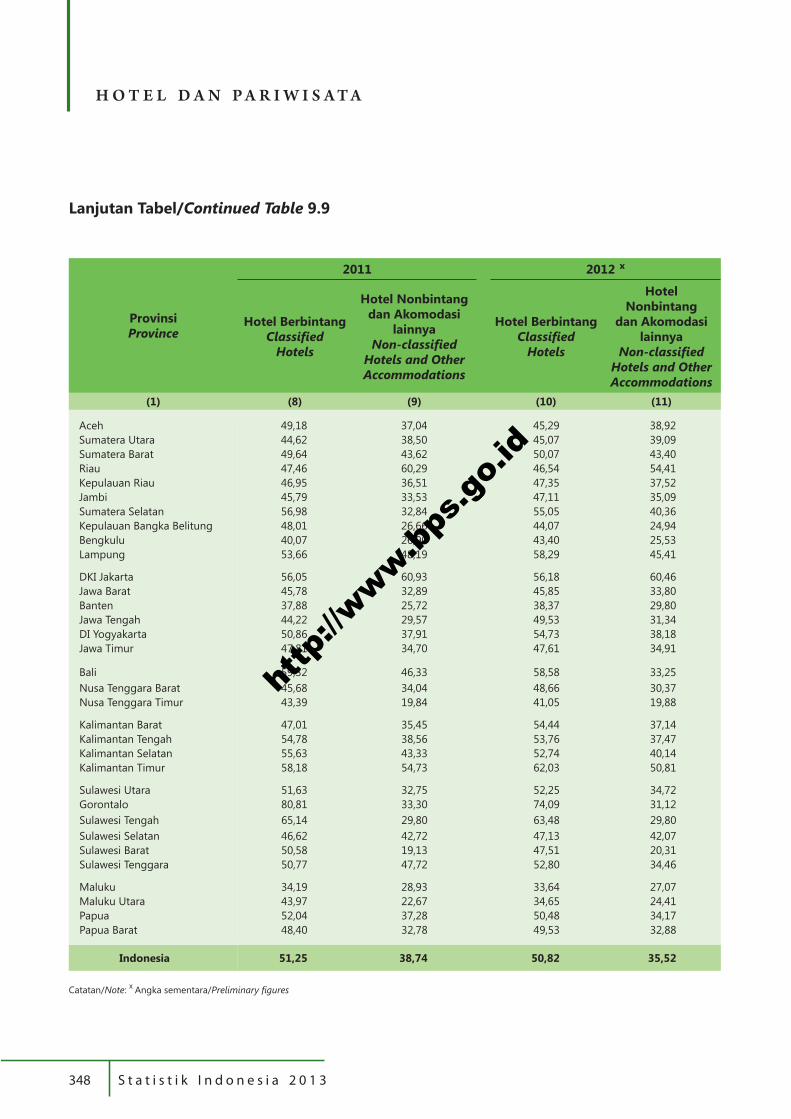
H O T E L D A N P A R I W I S A T A
S t a t i s t i k I n d o n e s i a 2 0 1 3348
ProvinsiProvince
2011 2012 x
Hotel Berbintang Classified
Hotels
Hotel Nonbintang dan Akomodasi
lainnyaNon-classified
Hotels and Other Accommodations
Hotel Berbintang Classified
Hotels
Hotel Nonbintang
dan Akomodasi lainnya
Non-classified Hotels and Other Accommodations
(1) (8) (9) (10) (11)
Aceh 49,18 37,04 45,29 38,92Sumatera Utara 44,62 38,50 45,07 39,09Sumatera Barat 49,64 43,62 50,07 43,40Riau 47,46 60,29 46,54 54,41Kepulauan Riau 46,95 36,51 47,35 37,52Jambi 45,79 33,53 47,11 35,09Sumatera Selatan 56,98 32,84 55,05 40,36Kepulauan Bangka Belitung 48,01 26,66 44,07 24,94Bengkulu 40,07 26,90 43,40 25,53Lampung 53,66 48,19 58,29 45,41
DKI Jakarta 56,05 60,93 56,18 60,46Jawa Barat 45,78 32,89 45,85 33,80Banten 37,88 25,72 38,37 29,80Jawa Tengah 44,22 29,57 49,53 31,34DI Yogyakarta 50,86 37,91 54,73 38,18Jawa Timur 47,81 34,70 47,61 34,91
Bali 59,32 46,33 58,58 33,25Nusa Tenggara Barat 45,68 34,04 48,66 30,37Nusa Tenggara Timur 43,39 19,84 41,05 19,88
Kalimantan Barat 47,01 35,45 54,44 37,14Kalimantan Tengah 54,78 38,56 53,76 37,47Kalimantan Selatan 55,63 43,33 52,74 40,14Kalimantan Timur 58,18 54,73 62,03 50,81
Sulawesi Utara 51,63 32,75 52,25 34,72Gorontalo 80,81 33,30 74,09 31,12Sulawesi Tengah 65,14 29,80 63,48 29,80Sulawesi Selatan 46,62 42,72 47,13 42,07Sulawesi Barat 50,58 19,13 47,51 20,31Sulawesi Tenggara 50,77 47,72 52,80 34,46
Maluku 34,19 28,93 33,64 27,07Maluku Utara 43,97 22,67 34,65 24,41Papua 52,04 37,28 50,48 34,17Papua Barat 48,40 32,78 49,53 32,88
Indonesia 51,25 38,74 50,82 35,52
Lanjutan Tabel/Continued Table 9.9
Catatan/Note: x Angka sementara/Preliminary figures
http
://www.b
ps.g
o.id

H O T E L A N D T O U R I S M
S t a t i s t i c a l Y e a r b o o k o f I n d o n e s i a 2 0 1 3 349
[Diolah dari Hasil Survei Hotel Bulanan (VHTS), BPS/Based on Hotels Survey, BPS-Statistics Indonesia]
ProvinsiProvince
2008 2009 2010
Tamu Asing
Foreign Visitor
TamuIndonesiaDomestic
Visitor
JumlahTotal
Tamu Asing
Foreign Visitor
TamuIndonesiaDomestic
Visitor
JumlahTotal
Tamu Asing
Foreign Visitor
TamuIndonesiaDomestic
Visitor
JumlahTotal
(1) (2) (3) (4) (5) (6) (7) (8) (9) (10)
Aceh 4,69 2,07 2,22 4,01 2,14 2,21 3,54 1,88 1,95Sumatera Utara 1,79 1,39 1,44 1,80 1,46 1,51 1,89 1,43 1,49Sumatera Barat 2,81 1,42 1,54 2,13 1,42 1,48 2,07 1,45 1,47Riau 3,60 1,59 1,64 3,54 1,61 1,67 2,98 1,58 1,62Kepulauan Riau 1,77 1,80 1,78 1,71 1,57 1,65 1,58 1,61 1,59Jambi 6,24 1,83 1,93 3,13 1,80 1,82 2,20 1,53 1,54Sumatera Selatan 3,99 1,46 1,55 4,10 1,56 1,60 2,74 1,53 1,55Kepulauan Bangka Belitung
2,77 1,74 1,74 2,25 1,65 1,65 2,79 1,72 1,73
Bengkulu 2,08 2,11 2,11 3,84 1,77 1,79 4,11 1,57 1,58Lampung 2,15 1,65 1,66 3,55 1,70 1,77 3,61 1,67 1,71
DKI Jakarta 3,14 1,93 2,13 2,96 1,84 2,01 2,60 1,92 2,05Jawa Barat 2,35 1,62 1,66 2,79 1,62 1,69 2,96 1,56 1,63Banten 1,51 1,32 1,35 2,13 1,54 1,60 2,15 1,45 1,52Jawa Tengah 1,76 1,43 1,45 1,78 1,45 1,47 2,05 1,48 1,50DI Yogyakarta 2,34 1,64 1,74 2,13 1,75 1,81 2,20 1,63 1,71Jawa Timur 2,06 1,51 1,57 1,84 1,55 1,59 1,73 1,51 1,54
Bali 3,60 3,58 3,60 3,18 3,40 3,23 3,12 3,25 3,15Nusa Tenggara Barat 3,78 2,60 2,87 3,69 2,37 2,68 3,57 2,33 2,63Nusa Tenggara Timur 3,57 2,11 2,21 2,17 2,03 2,05 2,59 2,23 2,27
Kalimantan Barat 2,96 1,72 1,80 3,19 1,76 1,85 4,14 1,55 1,67Kalimantan Tengah 3,26 1,74 1,76 3,03 1,82 1,83 1,28 1,69 1,69Kalimantan Selatan 2,14 1,69 1,71 2,18 1,62 1,63 1,96 1,67 1,68Kalimantan Timur 3,11 1,82 1,92 4,74 1,83 2,05 3,95 2,02 2,16
Sulawesi Utara 4,23 2,09 2,20 4,65 2,10 2,27 4,91 1,98 2,13Gorontalo 2,68 1,89 1,92 3,89 2,12 2,18 2,40 2,15 2,16Sulawesi Tengah 16,83 1,56 2,20 1,67 1,66 1,66 1,41 1,45 1,45Sulawesi Selatan 3,20 2,19 2,25 2,44 1,85 1,89 2,38 1,99 2,01Sulawesi Barat … … … … … … … … …Sulawesi Tenggara 2,15 1,63 1,64 1,54 1,73 1,72 1,44 1,79 1,79
Maluku 3,13 2,32 2,37 2,31 1,91 1,93 3,90 2,90 2,96Maluku Utara 3,58 2,38 2,41 2,59 1,89 1,89 3,29 1,89 1,89Papua 4,06 1,86 1,97 3,44 2,42 2,52 3,29 2,95 2,98Papua Barat 5,19 2,29 2,44 3,69 2,56 2,62 2,97 2,37 2,41
Indonesia 2,95 1,77 2,03 2,70 1,74 1,95 2,64 1,74 1,93
Rata-Rata Lama Menginap Tamu Pada Hotel Bintang Menurut Provinsi (hari), 2008–2012 Average Length of Stay in Classified Hotel by Province (day), 2008–2012
Tabel –––––– 9.10 Table
http
://www.b
ps.g
o.id

H O T E L D A N P A R I W I S A T A
S t a t i s t i k I n d o n e s i a 2 0 1 3350
Lanjutan Tabel/Continued Table 9.10
ProvinsiProvince
2011 2012x
Tamu AsingForeign Visitor
TamuIndonesiaDomestic
Visitor
JumlahTotal
Tamu AsingForeign Visitor
TamuIndonesiaDomestic
Visitor
JumlahTotal
(1) (11) (12) (13) (14) (15) (16)
Aceh 4,02 1,86 1,93 2,87 1,89 1,91Sumatera Utara 2,40 1,68 1,77 1,85 1,52 1,57Sumatera Barat 1,87 1,45 1,47 1,75 1,39 1,41Riau 3,88 1,73 1,78 3,46 1,79 1,83Kepulauan Riau 1,65 1,67 1,66 1,80 1,61 1,71Jambi 2,85 1,58 1,59 2,05 1,70 1,71Sumatera Selatan 4,99 1,76 1,83 4,32 1,74 1,78Kepulauan Bangka Belitung 4,52 2,07 2,09 2,76 1,93 1,94Bengkulu 4,52 2,01 2,03 7,06 1,81 1,86Lampung 3,43 1,65 1,70 2,09 1,61 1,65
DKI Jakarta 3,15 1,82 2,02 2,65 1,79 1,92Jawa Barat 2,80 1,52 1,58 2,54 1,59 1,64Banten 1,37 1,29 1,30 1,26 1,22 1,22Jawa Tengah 2,02 1,60 1,61 2,31 1,58 1,61DI Yogyakarta 2,15 1,71 1,77 2,15 1,72 1,77Jawa Timur 2,59 1,76 1,84 2,29 1,78 1,83
Bali 3,16 3,25 3,19 3,36 2,27 2,92Nusa Tenggara Barat 3,59 2,07 2,41 3,30 2,49 2,68Nusa Tenggara Timur 2,63 2,42 2,46 5,56 2,44 2,82
Kalimantan Barat 5,83 1,96 2,17 3,78 1,81 1,90Kalimantan Tengah 2,48 1,94 1,96 2,60 1,75 1,76Kalimantan Selatan 3,23 1,82 1,86 2,50 1,83 1,84Kalimantan Timur 6,46 2,25 2,46 4,65 2,31 2,40
Sulawesi Utara 4,95 1,89 2,00 4,62 2,16 2,30Gorontalo 2,78 2,11 2,14 1,97 2,07 2,07Sulawesi Tengah 1,50 1,48 1,48 1,75 1,57 1,58Sulawesi Selatan 2,92 1,80 1,87 2,61 1,85 1,89Sulawesi Barat 2,70 1,98 1,98 1,63 2,01 2,01Sulawesi Tenggara 4,21 1,84 1,90 2,39 2,19 2,19
Maluku 2,87 2,50 2,52 3,46 2,33 2,36Maluku Utara 2,14 2,17 2,17 1,95 1,68 1,68Papua 3,34 2,63 2,67 3,76 3,09 3,16Papua Barat 7,26 2,43 2,71 3,17 2,25 2,27
Indonesia 2,82 1,79 1,99 2,67 1,74 1,90
Catatan/Note: x Angka sementara/Preliminary figures
http
://www.b
ps.g
o.id

H O T E L A N D T O U R I S M
S t a t i s t i c a l Y e a r b o o k o f I n d o n e s i a 2 0 1 3 351
[Diolah dari Hasil Survei Hotel Bulanan (VHTS), BPS/Based on Hotels Survey, BPS-Statistics Indonesia]
ProvinsiProvince
2008 2009 2010
Tamu Asing
Foreign Visitor
TamuIndonesiaDomestic
Visitor
JumlahTotal
Tamu Asing
Foreign Visitor
TamuIndonesiaDomestic
Visitor
JumlahTotal
Tamu Asing
Foreign Visitor
TamuIndonesiaDomestic
Visitor
JumlahTotal
(1) (2) (3) (4) (5) (6) (7) (8) (9) (10)
Aceh 2,68 2,17 2,17 3,03 1,90 1,91 2,71 1,81 1,81Sumatera Utara 1,71 1,34 1,35 1,94 1,31 1,32 2,38 1,33 1,34Sumatera Barat 3,38 1,55 1,57 2,46 1,45 1,48 2,19 1,58 1,59Riau 4,26 1,55 1,55 4,74 1,59 1,59 2,75 2,14 2,14Kepulauan Riau 1,87 1,82 1,83 1,67 1,95 1,91 1,90 2,44 2,41Jambi 6,25 1,78 1,79 3,90 1,67 1,67 5,72 1,64 1,65Sumatera Selatan 6,42 1,69 1,70 2,64 1,48 1,48 2,19 1,52 1,53Kepulauan Bangka Belitung 4,50 2,07 2,07 1,78 2,24 2,24 2,44 1,99 1,99Bengkulu 2,10 1,64 1,64 2,88 1,79 1,79 1,80 1,67 1,67Lampung 2,44 1,32 1,32 1,98 1,41 1,41 1,51 1,56 1,56
DKI Jakarta 3,67 1,39 1,42 2,98 1,36 1,38 3,40 1,38 1,40Jawa Barat 2,72 1,29 1,30 2,39 1,20 1,21 2,00 1,16 1,18Banten 1,20 1,12 1,12 1,62 1,22 1,22 1,42 1,11 1,11Jawa Tengah 1,48 1,10 1,10 1,29 1,16 1,16 1,12 1,16 1,16DI Yogyakarta 2,47 1,29 1,29 2,69 1,28 1,29 2,14 1,14 1,15Jawa Timur 1,44 1,32 1,32 1,27 1,29 1,29 1,37 1,25 1,26
Bali 3,98 3,16 3,58 2,96 2,55 2,72 3,01 2,74 2,89Nusa Tenggara Barat 2,79 1,87 2,00 3,00 1,80 2,16 3,47 2,36 2,43Nusa Tenggara Timur 2,05 2,59 2,57 1,30 1,65 1,61 2,01 1,94 1,95
Kalimantan Barat 1,18 1,47 1,47 2,68 1,59 1,61 2,76 1,52 1,54Kalimantan Tengah 1,55 2,01 2,01 2,55 2,11 2,11 3,23 1,84 1,84Kalimantan Selatan 2,83 1,69 1,70 4,02 1,94 1,94 2,60 2,01 2,01Kalimantan Timur 5,20 1,91 1,92 4,20 2,28 2,34 7,70 2,07 2,08
Sulawesi Utara 4,26 1,93 2,01 3,22 1,94 2,01 2,76 1,80 1,86Gorontalo 2,65 1,50 1,50 1,66 2,16 2,16 2,01 3,13 3,13Sulawesi Tengah 5,03 1,85 1,87 1,44 1,53 1,53 1,10 1,46 1,45Sulawesi Selatan 2,02 1,38 1,39 1,70 2,47 2,47 1,73 2,17 2,16Sulawesi Barat 1,78 1,55 1,55 1,44 2,02 2,02 2,00 1,56 1,56Sulawesi Tenggara 1,62 1,53 1,53 1,44 1,32 1,32 1,99 1,63 1,63
Maluku 2,23 2,55 2,54 1,96 1,67 1,68 2,13 1,90 1,90Maluku Utara 2,35 1,82 1,82 3,10 2,11 2,11 1,47 1,93 1,93Papua 2,86 2,97 2,97 3,67 2,35 2,36 3,35 2,18 2,20Papua Barat 2,41 2,76 2,76 3,32 2,30 2,31 4,25 2,66 2,71
Indonesia 3,58 1,49 1,60 2,78 1,50 1,56 2,83 1,52 1,60
Rata-Rata Lama Menginap Tamu Pada Hotel Nonbintang dan Akomodasi Lainnya Menurut Provinsi (hari), 2008–2012 Average Length of Stay in Non-Classified Hotel and Other Accommodation by Province (day), 2008–2012
Tabel –––––– 9.11 Table
http
://www.b
ps.g
o.id
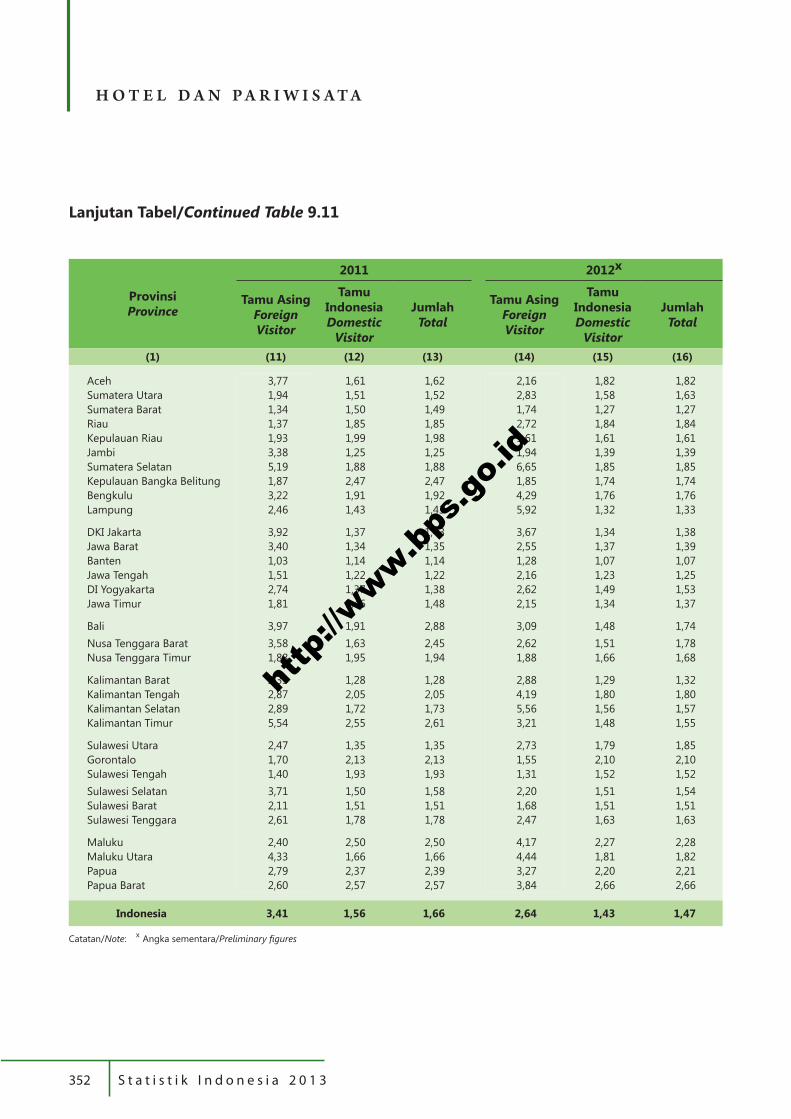
H O T E L D A N P A R I W I S A T A
S t a t i s t i k I n d o n e s i a 2 0 1 3352
Lanjutan Tabel/Continued Table 9.11
ProvinsiProvince
2011 2012x
Tamu AsingForeign Visitor
TamuIndonesiaDomestic
Visitor
JumlahTotal
Tamu AsingForeign Visitor
TamuIndonesiaDomestic
Visitor
JumlahTotal
(1) (11) (12) (13) (14) (15) (16)
Aceh 3,77 1,61 1,62 2,16 1,82 1,82Sumatera Utara 1,94 1,51 1,52 2,83 1,58 1,63Sumatera Barat 1,34 1,50 1,49 1,74 1,27 1,27Riau 1,37 1,85 1,85 2,72 1,84 1,84Kepulauan Riau 1,93 1,99 1,98 1,61 1,61 1,61Jambi 3,38 1,25 1,25 1,94 1,39 1,39Sumatera Selatan 5,19 1,88 1,88 6,65 1,85 1,85Kepulauan Bangka Belitung 1,87 2,47 2,47 1,85 1,74 1,74Bengkulu 3,22 1,91 1,92 4,29 1,76 1,76Lampung 2,46 1,43 1,43 5,92 1,32 1,33
DKI Jakarta 3,92 1,37 1,43 3,67 1,34 1,38Jawa Barat 3,40 1,34 1,35 2,55 1,37 1,39Banten 1,03 1,14 1,14 1,28 1,07 1,07Jawa Tengah 1,51 1,22 1,22 2,16 1,23 1,25DI Yogyakarta 2,74 1,37 1,38 2,62 1,49 1,53Jawa Timur 1,81 1,46 1,48 2,15 1,34 1,37
Bali 3,97 1,91 2,88 3,09 1,48 1,74Nusa Tenggara Barat 3,58 1,63 2,45 2,62 1,51 1,78Nusa Tenggara Timur 1,88 1,95 1,94 1,88 1,66 1,68
Kalimantan Barat 2,33 1,28 1,28 2,88 1,29 1,32Kalimantan Tengah 2,87 2,05 2,05 4,19 1,80 1,80Kalimantan Selatan 2,89 1,72 1,73 5,56 1,56 1,57Kalimantan Timur 5,54 2,55 2,61 3,21 1,48 1,55
Sulawesi Utara 2,47 1,35 1,35 2,73 1,79 1,85Gorontalo 1,70 2,13 2,13 1,55 2,10 2,10Sulawesi Tengah 1,40 1,93 1,93 1,31 1,52 1,52Sulawesi Selatan 3,71 1,50 1,58 2,20 1,51 1,54Sulawesi Barat 2,11 1,51 1,51 1,68 1,51 1,51Sulawesi Tenggara 2,61 1,78 1,78 2,47 1,63 1,63
Maluku 2,40 2,50 2,50 4,17 2,27 2,28Maluku Utara 4,33 1,66 1,66 4,44 1,81 1,82Papua 2,79 2,37 2,39 3,27 2,20 2,21Papua Barat 2,60 2,57 2,57 3,84 2,66 2,66
Indonesia 3,41 1,56 1,66 2,64 1,43 1,47
Catatan/Note: x Angka sementara/Preliminary figures
http
://www.b
ps.g
o.id

10TRANSPORTASI DAN KOMUNIKASI
Transportation and Communication
http
://www.b
ps.g
o.id

http
://www.b
ps.g
o.id

T R A N S P O R T A T I O N A N D C O M M U N I C A T I O N
S t a t i s t i c a l Y e a r b o o k o f I n d o n e s i a 2 0 1 3 355
PENJELASAN TEKNIS
1. Data transportasi dan komunikasi meliputi: a. Panjang Jalan b. Angkutan Darat c. Angkutan Laut d. Angkutan Udara e. Pos dan Telekomunikasi
2. Kendaraan bermotor adalah setiap kendaraan yang digerakkan oleh peralatan teknik yang ada pada kendaraan tersebut, biasanya digunakan untuk angkutan orang atau barang di atas jalan raya selain kendaraan yang berjalan di atas rel. Kendaraan bermotor yang dicatat adalah semua jenis kendaraan kecuali kendaraan bermotor TNI/Polri dan Korps Diplomatik.
3. Mobil penumpang adalah setiap kendaraan bermotor yang dilengkapi dengan tempat duduk untuk sebanyak-banyaknya delapan orang, tidak termasuk tempat duduk untuk pengemudi, baik dilengkapi atau tidak dilengkapi bagasi.
4. Mobil bis adalah setiap kendaraan bermotor yang dilengkapi dengan tempat duduk untuk lebih dari delapan orang, tidak termasuk tempat duduk untuk pengemudi, baik dilengkapi atau tidak dilengkapi bagasi.
5. Mobil truk adalah setiap kendaraan bermotor yang digunakan untuk angkutan barang, selain mobil penumpang, mobil bis dan kendaraan bermotor roda dua.
6. Data panjang jalan negara dan jalan provinsi bersumber dari Kementerian Pekerjaan Umum. Sedangkan jalan kabupaten/kota bersumber dari Dinas Pekerjaan Umum Kabupaten/Kota, diolah dari daftar PJ-II/5.
7. Kereta api adalah kendaraan dengan tenaga gerak (listrik, diesel atau tenaga uap) yang berjalan sendiri maupun dirangkaikan dengan kendaraan lain, yang akan atau sedang bergerak diatas rel, terdiri dari kereta penumpang dan kereta barang.
8. Kilometer penumpang adalah jumlah kilometer dari semua penumpang yang berangkat. Besaran ini
TECHNICAL NOTES
1. Data on transportations and communications cover:
a. Length of Road b. Land Transportation c. Sea Transportation d. Air Transportation e. Pos and Telecommunication 2. Motor vehicles are any kind of vehicles motorized by
machine set up in those vehicles. They are usually used for transporting peoples and goods on roads except vehicles moving along a railway line. The data cover all kinds of motor vehicles except those belong to Indonesia Army Force Indonesian State Police and Diplomatic Corps.
3. Passengers cars are any motor vehicles with no more than eight seats, excluding seat for driver. It can be with or without hoot.
4. Buses are passengers cars having seats for more than eight passengers, excluding seat for driver. It can be with or without hoot.
5. Trucks are any motor vehicles used to transport goods excluding passenger cars, buses, and motorcycles.
6. Data on the length of state and provincial roads were taken from the Ministry of Public Works, while the regency/city roads data were taken from Regency Public Works Offices, based on PJ-II/5 questionnaire.
7. Train is a coach or a number of coaches joined together, moving along a railway line. It can be passenger train or baggage train.
8. Passenger kilometer is total kilometers of all departing passenger. This measurement is the sum of distance
http
://www.b
ps.g
o.id
T R A N S P O R T A S I D A N K O M U N I K A S I
S t a t i s t i k I n d o n e s i a 2 0 1 3356
merupakan penjumlahan jarak asal tujuan masing-masing penumpang.
9. Rata-rata jarak perjalanan per penumpang adalah rata-rata yang ditempuh oleh setiap penumpang, atau jumlah kilometer penumpang dibagi dengan jumlah penumpang berangkat.
10. Kilometer ton adalah jumlah kilometer semua ton yang diangkut. Besaran ini merupakan hasil penjumlahan jarak asal tujuan masing-masing barang dalam ton.
11. Rata-rata jarak angkut barang adalah rata-rata jarak yang ditempuh oleh setiap ton barang atau jumlah kilometer ton dibagi dengan ton dimuat.
12. Kunjungan kapal adalah kapal yang datang di pelabuhan baik untuk berlabuh di perairan maupun bersandar di dermaga.
13. Gross Ton (GT) adalah volume ruangan kapal dalam m3, kecuali terowongan, lubang poros baling-baling, tempat jangkar, dan alas ganda.
14. Sertifikat Operator Pesawat Udara adalah tanda bukti terpenuhinya standar dan prosedur dalam pengoperasian pesawat udara oleh perusahaan angkutan udara niaga.
15. Sertifikat Pengoperasian Pesawat Udara adalah tanda bukti terpenuhinya standar dan prosedur dalam pengoperasian pesawat udara untuk kegiatan angkutan udara bukan niaga.
16. Sumber data transportasi berasal dari masing-masing instansi terkait, dikumpulkan oleh Badan Pusat Statistik (BPS) setiap bulan/tahun.
17. Kantor Pos adalah pemberi pelayanan pengiriman barang, uang, dsb, dari suatu tempat ke tempat yang lain. Pengguna pelayanan biasanya diharuskan menempel perangko yang cukup pada sampul surat, kartu pos, pos wesel, warkat pos, paket dsb. Rumah pos berfungsi sama seperti kantor pos dan kantor pos pembantu, bedanya rumah pos biasanya terletak di daerah terpencil.
between the place of origin and the place of destination taken by all passengers.
9. Mean distance of journey per passenger is mean distance taken by each passenger or total of passenger-kilometer divided by the number of departing passengers.
10. Ton-kilometer is total kilometer of all cargoes carried. This is the sum of distance from area of origin to area of destination for each ton of cargoes.
11. Mean distance of cargoes loaded is mean distance of each ton of cargoes loaded or total ton-kilometer divided by total ton of cargoes loaded.
12. Ship call is a ship arriving at a port either for docking or berthing.
13. Gross Ton (GT) is total volume of all room in a ship, excluding the volume of tunnel, the axle of propellers, the anchor, and the chain locker.
14. Aircraft Operator Certificate (AOC) is proof of compliance to the standards and procedures in aircraft operations by the commercial air transport companies.
15. Operating Certificate (OC) is proof of compliance to the standards and procedures in aircraft operations for non commercial air transport activities.
16. Data on transportations are compiled by the BPS-Statistics Indonesia (BPS). These data are obtained from relevant institutions.
17. Post office is an establishment dealing with the delivery of goods, letters, money, etc. from one place to another place. Service users usually put postage stamps on the envelope and postcard or are charged with amount of money in obtaining services such as money order, aerogramme, package post, etc. A mailing house has the same function as post office and auxiliary post office. It is usually located in remote areas.
http
://www.b
ps.g
o.id
T R A N S P O R T A T I O N A N D C O M M U N I C A T I O N
S t a t i s t i c a l Y e a r b o o k o f I n d o n e s i a 2 0 1 3 357
18. Telekomunikasi adalah setiap pemancaran, pengiriman dan atau penerimaan dari setiap informasi dalam bentuk tanda-tanda, isyarat, tulisan, gambar, suara dan bunyi melalui sistem kawat, optik, radio atau sistem elektromagnetik lainnya.
19. Jaringan telekomunikasi adalah rangkaian perangkat telekomunikasi dan kelengkapannya yang digunakan dalam bertelekomunikasi.
20. Telepon tetap kabel dalam SUSENAS disebut telepon rumah adalah jaringan telekomunikasi menggunakan perangkat telepon tetap dengan kabel yang secara umum diatur oleh standar-standar teknis dengan menggunakan suatu nomor telepon, dikenal pula sebagai Public Switched Telephone Network (PSTN). Pada umumnya dimanfaatkan untuk telepon rumah dan jaringan internet, memiliki kemampuan menghantarkan sinyal dengan kuat dan jelas dengan biaya yang relatif lebih murah.
21. Telepon Bergerak Seluler adalah perangkat telekomunikasi elektronik yang mempunyai kemampuan dasar yang sama dengan telepon tetap kabel, namun dapat dibawa ke mana-mana (portable, mobile) dan tidak perlu disambungkan dengan jaringan telekomunikasi kabel. Selain berfungsi sebagai telepon, telepon selular modern biasanya mendukung layanan tambahan seperti Short Messages Services (SMS), Multimedia Messages Service (MMS), e-mail dan akses Internet, aplikasi bisnis dan permainan, serta fotografi. Saat ini, Indonesia mempunyai dua sistem jaringan telepon bergerak seluler yaitu GSM (Global System for Mobile Telecommunications) dan CDMA.
22. Internet adalah sebuah jaringan komputer publik di seluruh dunia. Internet menyediakan akses ke sejumlah layanan komunikasi termasuk World Wide Web dan membawa email, berita, hiburan dan file data.
18. Telecommunication includes every transmitting, delivering and or receiving from every information of marking, signal, article, picture, sound and voice through strand of wire system, optic, radio or other electromagnetic system.
19. Telecommunication network is peripheral network of telecommunication and its equipment used in the means of telecommunication.
20. Fixed line telephone based on SUSENAS called home phone is a telecommunication network using fixed line telephone device which is generally regulated by technical standards, using a phone number, also known as the Public Switched Telephone Network (PSTN). Generally used for home phone and Internet networks, has the ability to deliver a strong and clear signal with a relatively low cost.
21. Cellular Mobile phone is an electronic telecommunication device which has the same basic capabilities with fixed cables, but can be taken anywhere (portable, mobile) and does not need to be connected to the wired telecommunications networks. In addition to functioning as a telephone, modern mobile phone typically supports additional services such as Short Messages Services (SMS), Multimedia Messages Service (MMS), e-mail and access to the Internet, business applications and games, as well as photography. Currently, Indonesia has two cellular mobile telephone network system that are GSM (Global System for Mobile Telecommunications) and CDMA.
22. The Internet is a worldwide public computer network. It provides access to a number of communication services including the World Wide Web and carries e-mail, news, entertainment and data files.
http
://www.b
ps.g
o.id

T R A N S P O R T A S I D A N K O M U N I K A S I
S t a t i s t i k I n d o n e s i a 2 0 1 3358
Tabel ––––––
10.1.1Table
Panjang Jalan Menurut Provinsi dan Tingkat Kewenangan Pemerintahan (km), 2010–2012 1
Length of Roads by Province and Level of Government Authority (km), 2010–2012 1
ProvinsiProvince
Akhir TahunEnd of Year
Negara 2State
ProvinsiProvincial
Kabupaten/KotaRegency
JumlahTotal
(1) (2) (3) (4) (5) (6)
Aceh 2010 1 803 1 702 17 585 21 0902011 1 803 1 702 18 952 22 4572012 1 803 1 702 18 952 x 22 457
Sumatera Utara 2010 2 250 2 752 29 538 34 5402011 2 250 2 752 31 047 36 0492012 2 250 2 752 31 616 x 36 618
Sumatera Barat 2010 1 213 1 154 18 396 20 7632011 1 213 1 154 19 667 22 0342012 1 213 1 154 20 220 x 22 587
Riau 2010 1 134 1 872 20 500 23 5062011 1 134 1 872 20 708 23 7142012 1 134 1 872 21 536 x 24 542
Kepulauan Riau 2010 334 512 3 554 4 4002011 334 512 3 668 4 5142012 334 512 3 985 x 4 831
Jambi 2010 936 1 025 9 761 11 7222011 936 1 025 10 475 12 4362012 936 1 025 10 475 x 12 436
Sumatera Selatan 2010 1 444 1 748 13 423 16 6152011 1 444 1 748 13 170 16 3622012 1 444 1 748 13 236 x 16 428
Kepulauan Bangka Belitung 2010 510 551 3 656 4 7172011 510 551 3 855 4 9162012 510 551 3 855 x 4 916
Bengkulu 2010 784 1 563 5 153 7 5002011 784 1 563 5 419 7 7662012 784 1 563 5 469 x 7 816
Lampung 2010 1 160 2 368 14 992 18 5202011 1 160 2 368 16 013 19 5412012 1 160 2 368 16 013 x 19 541
DKI Jakarta 2010 143 6 600 – 6 7432011 143 6 951 – 7 0942012 143 6 951x – 7 094
10.1 TRANSPORTASI TRANSPORTATION
http
://www.b
ps.g
o.id

T R A N S P O R T A T I O N A N D C O M M U N I C A T I O N
S t a t i s t i c a l Y e a r b o o k o f I n d o n e s i a 2 0 1 3 359
ProvinsiProvince
Akhir TahunEnd of Year
Negara 2State
ProvinsiProvincial
Kabupaten/KotaRegency
JumlahTotal
(1) (2) (3) (4) (5) (6)
Jawa Barat 2010 1 351 2 199 21 944 25 4942011 1 351 2 199 21 950 25 5002012 1 351 2 199 22 590 x 26 140
Banten 2010 476 889 5 091 6 4562011 476 889 5 091 6 4562012 476 889 5 143 x 6 508
Jawa Tengah 2010 1 391 2 540 25 272 29 2032011 1 391 2 540 25 179 29 1102012 1 391 2 540 25 179 x 29 110
DI Yogyakarta 2010 223 690 3 840 4 7532011 223 690 3 679 4 5922012 223 690 3 679 x 4 592
Jawa Timur 2010 2 027 2 001 40 016 44 0442011 2 027 2 001 41 561 45 5892012 2 027 2 001 41 561 x 45 589
Bali 2010 535 883 5 982 7 4002011 535 883 6 112 7 5302012 535 883 6 130 x 7 548
Nusa Tenggara Barat 2010 632 1 843 5 585 8 0602011 632 1 843 5 614 8 0892012 632 1 843 5 505 x 7 980
Nusa Tenggara Timur 2010 1 407 1 737 16 320 19 4642011 1 407 1 737 16 320 19 4642012 1 407 1 737 16 990 x 20 134
Kalimantan Barat 2010 1 665 1 656 11 686 15 0072011 1 665 1 656 11 417 14 7382012 1 665 1 656 11 699 x 15 020
Kalimantan Tengah 2010 1 715 1 708 10 342 13 7652011 1 715 1 708 10 342 13 7652012 1 715 1 708 10 625 x 14 048
Kalimantan Selatan 2010 866 812 9 265 10 9432011 866 812 9 666 11 3442012 866 812 10 001 x 11 679
Kalimantan Timur 2010 2 118 1 554 10 557 14 2292011 2 118 1 554 11 095 14 7672012 2 118 1 554 11 282 x 14 954
Sulawesi Utara 2010 1 319 941 5 301 7 5612011 1 319 941 5 759 8 0192012 1 319 941 6 311 x 8 571
Lanjutan Tabel/Continued Table 10.1.1
http
://www.b
ps.g
o.id

T R A N S P O R T A S I D A N K O M U N I K A S I
S t a t i s t i k I n d o n e s i a 2 0 1 3360
Lanjutan Tabel/Continued Table 10.1.1
ProvinsiProvince
Akhir TahunEnd of Year
Negara 2State
ProvinsiProvincial
Kabupaten/KotaRegency
JumlahTotal
(1) (2) (3) (4) (5) (6)
Gorontalo 2010 607 408 3 449 4 4642011 607 408 3 584 4 5992012 607 408 3 588 x 4 603
Sulawesi Tengah 2010 2 182 2 037 14 565 18 7842011 2 182 2 037 14 168 18 3872012 2 182 2 037 14 168 x 18 387
Sulawesi Selatan 2010 1 723 1 260 29 570 32 5532011 1 723 1 260 29 570 32 5532012 1 723 1 260 29 710 x 32 693
Sulawesi Barat 2010 572 441 5 806 6 8192011 572 441 5 806 6 8192012 572 441 5 787 x 6 800
Sulawesi Tenggara 2010 1 397 1 187 8 729 11 3132011 1 397 1 187 9 106 11 6902012 1 397 1 187 9 680 x 12 264
Maluku 2010 1 067 1 612 4 537 7 2162011 1 067 1 612 4 539 7 2182012 1 067 1 612 4 974 x 7 653
Maluku Utara 2010 512 1 867 2 969 5 3482011 512 1 867 2 969 5 3482012 512 1 867 4 035 x 6 414
Papua 2010 2 111 1 873 12 340 16 3242011 2 111 1 873 12 165 16 1492012 2 111 1 873 12 165 x 16 149
Papua Barat 2010 963 1 306 5 729 7 9982011 963 1 306 5 729 7 9982012 963 1 306 5 813 x 8 082
Indonesia 2010 38 570 53 291 395 453 487 314
2011 38 570 53 642 404 395 496 607
2012 38 570 53 642x
411 972x
504 184
Catatan/Note: x Angka Sementara/Preliminary figures 1 Data tidak termasuk panjang jalan tol sepanjang 757,47 km/Excluding toll road 757.47 km 2 Berdasarkan SK Menteri Pekerjaan Umum No. 630/KPTS/M/2009/Based on Public Work Ministerial Decree No. 630/KPTS/M/2009
Sumber/Source: Kementerian Pekerjaan Umum/Ministry of Public Works Dinas Pekerjaan Umum Provinsi/Kabupaten/Kota/Provincial/Regency Public Work Offices
http
://www.b
ps.g
o.id
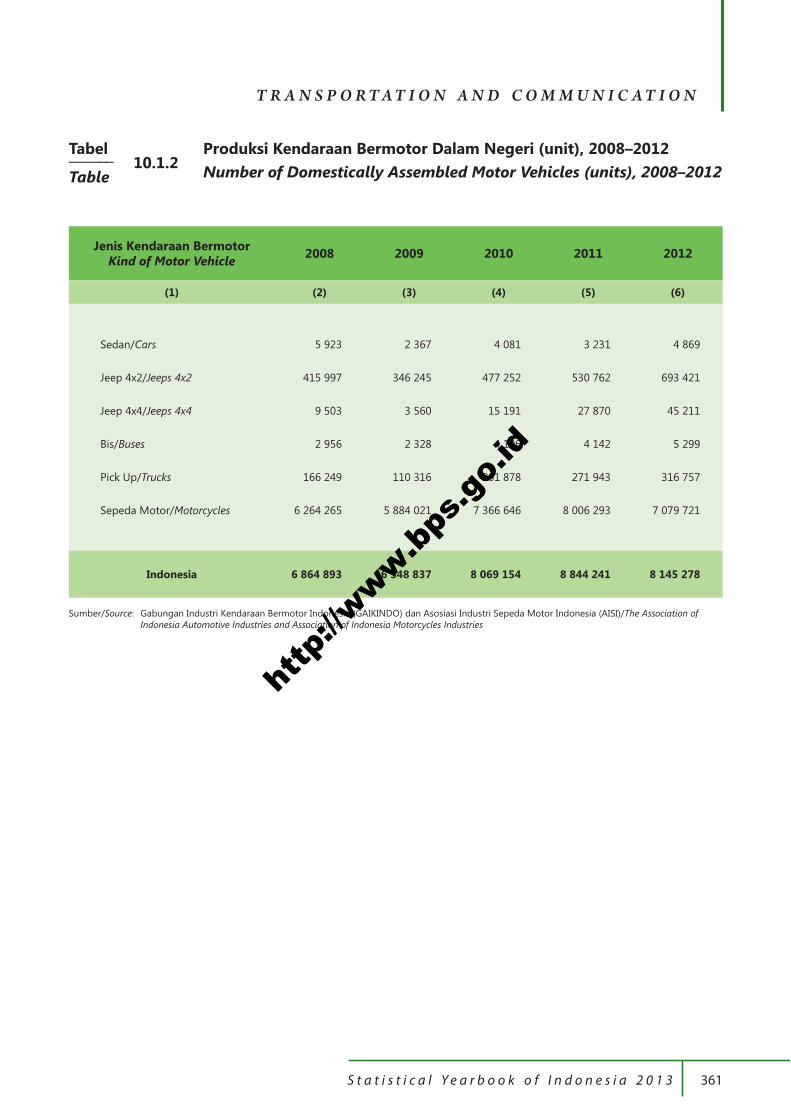
T R A N S P O R T A T I O N A N D C O M M U N I C A T I O N
S t a t i s t i c a l Y e a r b o o k o f I n d o n e s i a 2 0 1 3 361
Produksi Kendaraan Bermotor Dalam Negeri (unit), 2008–2012Number of Domestically Assembled Motor Vehicles (units), 2008–2012
Sumber/Source: Gabungan Industri Kendaraan Bermotor Indonesia (GAIKINDO) dan Asosiasi Industri Sepeda Motor Indonesia (AISI)/The Association of Indonesia Automotive Industries and Association of Indonesia Motorcycles Industries
Jenis Kendaraan BermotorKind of Motor Vehicle 2008 2009 2010 2011 2012
(1) (2) (3) (4) (5) (6)
Sedan/Cars 5 923 2 367 4 081 3 231 4 869
Jeep 4x2/Jeeps 4x2 415 997 346 245 477 252 530 762 693 421
Jeep 4x4/Jeeps 4x4 9 503 3 560 15 191 27 870 45 211
Bis/Buses 2 956 2 328 4 106 4 142 5 299
Pick Up/Trucks 166 249 110 316 201 878 271 943 316 757
Sepeda Motor/Motorcycles 6 264 265 5 884 021 7 366 646 8 006 293 7 079 721
Indonesia 6 864 893 6 348 837 8 069 154 8 844 241 8 145 278
Tabel ––––––
10.1.2Table
http
://www.b
ps.g
o.id

T R A N S P O R T A S I D A N K O M U N I K A S I
S t a t i s t i k I n d o n e s i a 2 0 1 3362
Jumlah Kendaraan Bermotor Menurut Provinsi dan Jenis Kendaraan (unit), 2010–2012Number of Registered Motor Vehicles by Province and Type of Motor Vehicle (units), 2010–2012
Tabel ––––––
10.1.3Table
ProvinsiProvince
Akhir TahunEnd of Year
Mobil PenumpangPassenger
Cars
BusBuses
TrukTrucks
Sepeda Motor
Motorcycles
JumlahTotal
(1) (2) (3) (4) (5) (6) (7)
Aceh 2010 96 534 62 553 90 013 1 701 788 1 950 8882011 100 684 62 668 95 235 1 924 863 2 183 4502012 x 116 389 62 866 99 230 2 146 078 2 424 563
Sumatera Utara 2010 325 137 29 978 205 124 3 476 263 4 036 5022011 356 053 30 033 217 104 3 924 007 4 527 1972012 x 431 887 34 697 261 891 4 604 250 5 332 725
Sumatera Barat 2010 118 899 84 657 129 613 1 107 291 1 440 4602011 132 839 84 813 137 132 1 303 390 1 658 1742012 x 148 576 84 946 145 854 1 421 136 1 800 512
Riau 2010 443 871 63 869 143 554 1 260 789 1 912 083
2011 471 921 63 987 151 882 1 426 057 2 113 8472012 x 514 523 64 589 161 332 1 592 736 2 333 180
Kepulauan Riau 2010 123 180 13 119 28 348 588 804 753 451
2011 130 964 13 143 29 992 678 632 852 7312012 x 142 701 13 288 32 433 769 162 957 584
Jambi 2010 93 663 54 832 218 746 2 215 437 2 582 678
2011 106 275 55 087 232 007 2 638 048 3 031 4172012 x 121 401 55 604 237 582 3 005 953 3 420 540
Sumatera Selatan 2010 423 698 72 077 107 245 2 532 721 3 135 7412011 450 473 72 210 113 466 2 864 717 3 500 8662012 x 490 117 74 470 122 349 3 106 088 3 793 024
Kepulauan Bangka Belitung 2010 21 522 21 062 25 449 455 171 523 2042011 22 882 21 101 26 925 514 836 585 7442012 x 37 920 21 190 31 217 589 347 679 674
Bengkulu 2010 31 934 9 473 42 800 612 758 696 965
2011 33 952 9 490 43 875 716 554 803 8712012 x 39 131 9 511 48 423 775 972 873 037
Lampung 2010 93 758 24 919 81 678 1 309 868 1 510 223
2011 106 207 24 965 86 416 1 481 569 1 699 1572012 x 121 129 25 230 106 258 1 723 338 1 975 955
DKI Jakarta 2010 2 296 055 519 738 701 328 7 257 352 10 774 4732011 2 502 501 520 695 742 013 8 208 665 11 973 8742012 x 2 770 282 526 151 777 394 9 209 718 13 283 545
http
://www.b
ps.g
o.id

T R A N S P O R T A T I O N A N D C O M M U N I C A T I O N
S t a t i s t i c a l Y e a r b o o k o f I n d o n e s i a 2 0 1 3 363
Lanjutan Tabel/Continued Table 10.1.3
ProvinsiProvince
Akhir TahunEnd of Year
Mobil PenumpangPassenger
Cars
BusBuses
TrukTrucks
Sepeda Motor
Motorcycles
JumlahTotal
(1) (2) (3) (4) (5) (6) (7)
Jawa Barat 2010 630 196 177 578 469 412 3 828 549 5 105 7352011 670 021 177 905 496 643 4 664 414 6 008 9832012 x 736 533 178 626 525 838 5 430 724 6 871 721
Banten 2010 85 291 24 582 70 610 700 672 881 155
2011 93 289 24 627 74 706 792 518 985 1402012 x 101 112 24 880 78 895 916 283 1 121 170
Jawa Tengah 2010 527 417 72 495 416 901 8 290 689 9 307 502
2011 560 747 72 628 441 086 9 139 555 10 214 0162012 x 627 952 73 324 470 060 9 975 576 11 146 912
DI Yogyakarta 2010 248 448 43 515 115 282 2 557 660 2 964 905
2011 264 148 43 595 121 970 2 892 925 3 322 6382012 x 287 743 43 808 126 097 3 019 613 3 477 261
Jawa Timur 2010 1 012 074 58 445 427 872 9 069 993 10 568 384
2011 1 076 031 58 553 452 693 9 650 891 11 238 1682012 x 1 159 707 59 843 484 017 10 521 739 12 225 306
Bali 2010 523 350 31 629 221 074 2 395 771 3 171 824
2011 556 423 31 687 233 899 2 709 815 3 531 8242012 x 576 965 32 047 242 928 2 907 550 3 759 490
Nusa Tenggara Barat 2010 105 777 66 312 61 050 1 160 677 1 393 816
2011 112 462 66 434 64 592 1 312 822 1 556 3102012 x 118 260 66 554 67 755 1 396 897 1 649 466
Nusa Tenggara Timur 2010 137 865 52 747 49 769 668 516 908 897
2011 146 577 52 844 52 656 756 147 1 008 2242012 x 147 783 52 914 54 287 809 494 1 064 478
Kalimantan Barat 2010 286 827 56 216 121 215 1 037 648 1 501 906
2011 304 953 56 319 128 247 1 173 666 1 663 1852012 310 941 56 396 134 168 1 366 520 1 868 025
Kalimantan Tengah 2010 184 830 66 372 71 321 523 946 846 469
2011 196 510 66 494 75 458 592 626 931 0882012 x 202 091 66 609 82 413 721 031 1 072 144
Kalimantan Selatan 2010 155 611 91 620 151 550 1 143 986 1 542 767
2011 165 445 91 789 160 342 1 293 943 1 711 5192012 x 181 179 92 055 171 274 1 476 514 1 921 022
Kalimantan Timur 2010 199 249 54 642 235 556 1 375 734 1 865 181
2011 211 840 54 743 249 221 1 586 353 2 102 1572012 x 228 116 55 148 262 812 1 759 746 2 305 822
http
://www.b
ps.g
o.id

T R A N S P O R T A S I D A N K O M U N I K A S I
S t a t i s t i k I n d o n e s i a 2 0 1 3364
Lanjutan Tabel/Continued Table 10.1.3
Catatan/Note: x Angka sementara/Preliminary figures 1 Termasuk Sulawesi Barat/Including Sulawesi Barat 2 Termasuk Papua Barat/Including Papua Barat
Sumber/Source: Kepolisian Republik Indonesia/Indonesia State Police
ProvinsiProvince
Akhir TahunEnd of Year
Mobil PenumpangPassenger
Cars
BusBuses
TrukTrucks
Sepeda Motor
Motorcycles
JumlahTotal
(1) (2) (3) (4) (5) (6) (7)
Sulawesi Utara 2010 73 725 94 062 41 442 733 948 943 1772011 78 384 94 235 43 349 830 156 1 046 1242012 x 85 138 94 295 47 293 872 295 1 099 021
Gorontalo 2010 66 296 71 039 5 613 140 016 282 964
2011 70 486 71 170 5 939 158 370 305 9652012 x 75 316 71 212 11 181 210 851 368 560
Sulawesi Tengah 2010 141 996 47 135 111 758 1 461 948 1 762 837
2011 150 969 47 222 118 241 1 653 584 1 970 0162012 x 156 287 47 265 120 896 1 725 833 2 050 281
Sulawesi Selatan 1 2010 280 662 140 468 267 636 1 784 875 2 473 641
2011 298 398 140 727 283 162 2 057 474 2 779 7612012 x 315 280 140 932 295 631 2 297 145 3 048 988
Sulawesi Tenggara 2010 19 420 98 910 38 410 842 443 999 183
2011 24 128 99 092 40 638 952 873 1 116 7312012 x 28 212 99 120 43 134 1 006 092 1 176 558
Maluku 2010 33 083 10 241 17 368 401 032 461 724
2011 35 174 10 260 18 376 453 600 517 4102012 x 36 727 10 299 19 449 477 761 544 236
Maluku Utara 2010 763 2 989 647 35 357 39 756
2011 1 274 2 995 942 37 408 42 6192012 x 1 931 3 022 1 583 54 671 61 207
Papua 2 2010 109 910 32 835 19 405 406 486 568 636
2011 116 856 32 895 20 531 448 863 619 1452012 x 120 930 32 930 22 387 491 070 667 317
Indonesia 2010 8 891 041 2 250 109 4 687 789 61 078 188 76 907 127
2011 9 548 866 2 254 406 4 958 738 68 839 341 85 601 351
2012x
10 432 259 2 273 821 5 286 061 76 381 183 94 373 324
http
://www.b
ps.g
o.id

T R A N S P O R T A T I O N A N D C O M M U N I C A T I O N
S t a t i s t i c a l Y e a r b o o k o f I n d o n e s i a 2 0 1 3 365
Produksi Angkutan Kereta Api Penumpang, 2008–2012Production of Passenger Railways Transportation, 2008–2012
Sumber/Source: PT Kereta Api (Persero)/Indonesian State Railways Company
RincianDescription
SatuanUnit 2008 2009 2010 2011 2012
(1) (2) (3) (4) (5) (6) (7)
Jawa
Penumpang berangkat/Passenger embarked
000 000 orang/person 190,1 202,8 198,2 194,0 197,8
Kilometer penumpang/Pax-km 000 000 17 041 18 861 19 363 18 033 16 315
Rata-rata jarak perjalanan per penumpang/Average length of journey per passenger
km 90 93 98 93 82
Sumatera
Penumpang berangkat/Passenger embarked
000 000 orang/person 3,9 4,2 5,2 5,3 4,4
Kilometer penumpang/Pax-km 000 000 896 918 977 991 839
Rata-rata jarak perjalanan per penumpang/Average length of journey per passenger
km 230 219 188 187 191
Jumlah/Total
Penumpang berangkat/Passenger embarked
000 000 orang/person 194,0 207,0 203,4 199,3 202,2
Kilometer penumpang/Pax-km 000 000 17 937 19 779 20 340 19 024 17 154
Rata-rata jarak perjalanan per penumpang/Average length of journey per passenger
km 92 96 100 95 85
Tabel ––––––
10.1.4Table
http
://www.b
ps.g
o.id

T R A N S P O R T A S I D A N K O M U N I K A S I
S t a t i s t i k I n d o n e s i a 2 0 1 3366
Produksi Angkutan Kereta Api Barang, 2008–2012Production of Freight Railways Transportation, 2008–2012
Sumber/Source: PT Kereta Api (Persero)/Indonesian State Railways Company
RincianDescription
SatuanUnit 2008 2009 2010 2011 2012
(1) (2) (3) (4) (5) (6) (7)
Jawa
Banyaknya ton dimuat Ton Loaded
000 3 963 3 975 3 860 4 588 6 479
Kilometer ton Ton-km
000 000 884 1 200 2 003 1 979 1 821
Rata-rata jarak angkutan tiap tonAverage distance of freight transported
km 223 302 519 431 281
Sumatera
Banyaknya ton dimuat Ton Loaded
000 15 480 14 948 15 254 15 850 17 140
Kilometer ton Ton-km
000 000 4 399 4 509 4 556 4 664 5 130
Rata-rata jarak angkutan tiap ton Average distance of freight transported
km 284 302 299 294 299
Jumlah/Total
Banyaknya ton dimuat Ton Loaded
000 19 443 18 923 19 114 20 438 23 619
Kilometer ton Ton-km
000 000 5 283 5 709 6 559 6 643 6 951
Rata-rata jarak angkutan tiap tonAverage distance of freight transported
km 272 302 343 325 294
Tabel ––––––
10.1.5Table
http
://www.b
ps.g
o.id
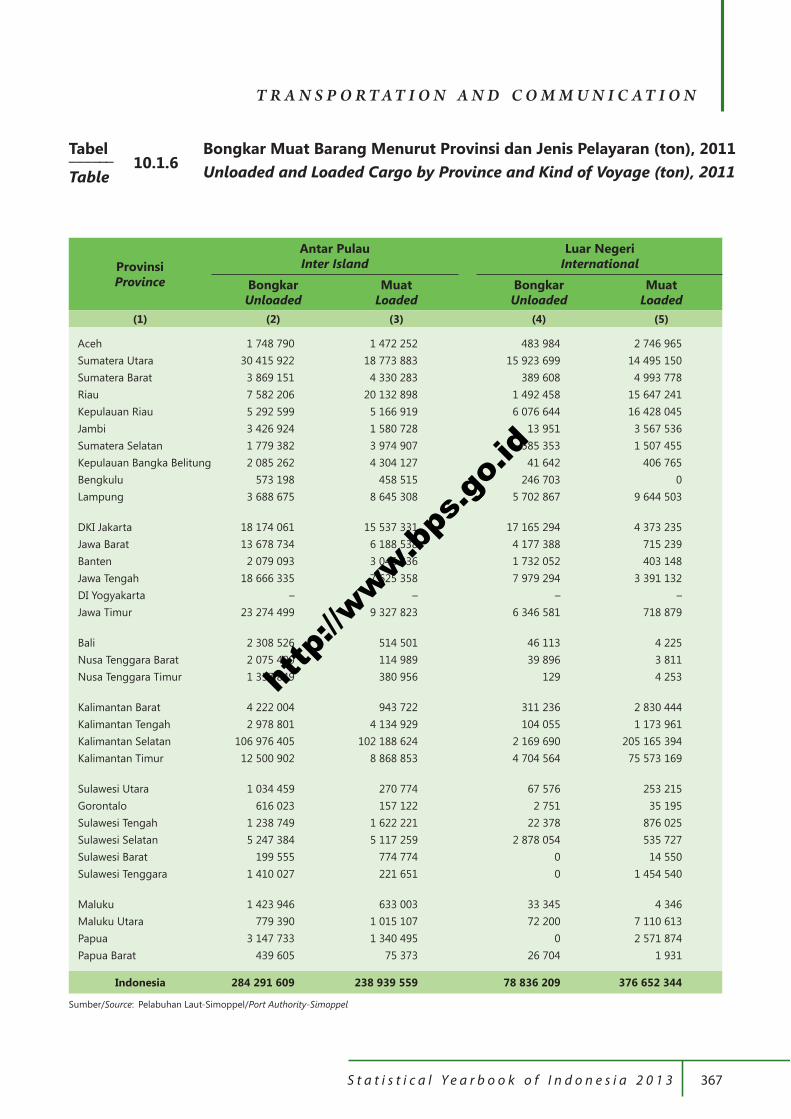
T R A N S P O R T A T I O N A N D C O M M U N I C A T I O N
S t a t i s t i c a l Y e a r b o o k o f I n d o n e s i a 2 0 1 3 367
Tabel ––––––
10.1.6Table
Bongkar Muat Barang Menurut Provinsi dan Jenis Pelayaran (ton), 2011Unloaded and Loaded Cargo by Province and Kind of Voyage (ton), 2011
Sumber/Source: Pelabuhan Laut-Simoppel/Port Authority-Simoppel
Antar PulauInter Island
Luar NegeriInternationalProvinsi
Province BongkarUnloaded
MuatLoaded
BongkarUnloaded
MuatLoaded
(1) (2) (3) (4) (5)
Aceh 1 748 790 1 472 252 483 984 2 746 965Sumatera Utara 30 415 922 18 773 883 15 923 699 14 495 150Sumatera Barat 3 869 151 4 330 283 389 608 4 993 778Riau 7 582 206 20 132 898 1 492 458 15 647 241Kepulauan Riau 5 292 599 5 166 919 6 076 644 16 428 045Jambi 3 426 924 1 580 728 13 951 3 567 536Sumatera Selatan 1 779 382 3 974 907 585 353 1 507 455Kepulauan Bangka Belitung 2 085 262 4 304 127 41 642 406 765Bengkulu 573 198 458 515 246 703 0Lampung 3 688 675 8 645 308 5 702 867 9 644 503
DKI Jakarta 18 174 061 15 537 331 17 165 294 4 373 235Jawa Barat 13 678 734 6 188 538 4 177 388 715 239Banten 2 079 093 3 046 336 1 732 052 403 148Jawa Tengah 18 666 335 7 625 358 7 979 294 3 391 132DI Yogyakarta – – – –Jawa Timur 23 274 499 9 327 823 6 346 581 718 879
Bali 2 308 526 514 501 46 113 4 225Nusa Tenggara Barat 2 075 420 114 989 39 896 3 811Nusa Tenggara Timur 1 357 849 380 956 129 4 253
Kalimantan Barat 4 222 004 943 722 311 236 2 830 444Kalimantan Tengah 2 978 801 4 134 929 104 055 1 173 961Kalimantan Selatan 106 976 405 102 188 624 2 169 690 205 165 394Kalimantan Timur 12 500 902 8 868 853 4 704 564 75 573 169
Sulawesi Utara 1 034 459 270 774 67 576 253 215Gorontalo 616 023 157 122 2 751 35 195Sulawesi Tengah 1 238 749 1 622 221 22 378 876 025Sulawesi Selatan 5 247 384 5 117 259 2 878 054 535 727Sulawesi Barat 199 555 774 774 0 14 550Sulawesi Tenggara 1 410 027 221 651 0 1 454 540
Maluku 1 423 946 633 003 33 345 4 346Maluku Utara 779 390 1 015 107 72 200 7 110 613Papua 3 147 733 1 340 495 0 2 571 874Papua Barat 439 605 75 373 26 704 1 931
Indonesia 284 291 609 238 939 559 78 836 209 376 652 344
http
://www.b
ps.g
o.id

T R A N S P O R T A S I D A N K O M U N I K A S I
S t a t i s t i k I n d o n e s i a 2 0 1 3368
Banyaknya Kunjungan Kapal Pelayaran Dalam Negeri dan Luar Negeri Menurut Provinsi, 2011Number of Ship Calls of Domestic and International Voyage by Province, 2011
ProvinsiProvince
UnitUnits
Gross Ton(GT)
(1) (2) (3)
Aceh 4 883 7 915 282Sumatera Utara 24 760 23 056 837Sumatera Barat 5 223 10 424 498Riau 50 202 44 108 359Kepulauan Riau 171 193 119 579 774Jambi 10 089 8 998 742Sumatera Selatan 2 875 6 884 587Kepulauan Bangka Belitung 11 259 7 303 240Bengkulu 1 149 1 442 033Lampung 6 307 23 078 211
DKI Jakarta 23 592 114 657 424Jawa Barat 20 524 57 449 896Banten 5 862 12 330 571Jawa Tengah 17 709 48 006 958DI Yogyakarta – –Jawa Timur 41 445 91 148 335
Bali 24 172 9 501 364Nusa Tenggara Barat 6 032 5 749 667Nusa Tenggara Timur 21 117 10 998 801
Kalimantan Barat 6 841 8 092 416Kalimantan Tengah 11 972 8 774 143Kalimantan Selatan 100 462 264 649 357Kalimantan Timur 44 800 174 835 910
Sulawesi Utara 10 167 16 694 599Gorontalo 1 585 1 176 522Sulawesi Tengah 8 156 18 395 052Sulawesi Selatan 23 073 33 836 627Sulawesi Barat 3 507 1 193 215Sulawesi Tenggara 14 229 31 499 092
Maluku 15 439 15 120 220Maluku Utara 16 311 11 557 792Papua 5 641 14 542 298Papua Barat 2 747 12 586 002
Indonesia 713 323 1 215 587 824
Sumber/Source: Pelabuhan Laut-Simoppel/Port Authority-Simoppel
Tabel ––––––
10.1.7Table
http
://www.b
ps.g
o.id

T R A N S P O R T A T I O N A N D C O M M U N I C A T I O N
S t a t i s t i c a l Y e a r b o o k o f I n d o n e s i a 2 0 1 3 369
Jumlah Pesawat Terbang Menurut Sertifikasi Operator Angkutan Udara, 2008–2012Number of Civil Aircraft Registered by Air Operator Certificate (AOC) and Operating Certificate (OC), 2008–2012
Catatan/Note: x Angka sementara/Preliminary figures
Sumber/Source: Direktorat Jendral Perhubungan Udara–Kementerian Perhubungan/Directorate General of Civil Aviation–Ministry of Transportation
Jenis SertifikasiKind of Certificate 2008 2009 2010 2011 2012 x
(1) (2) (3) (4) (5) (6)
AOC 121 351 381 432 426 478
AOC 135 209 192 225 253 276
OC 91 142 164 182 186 196
Jumlah/Total 702 737 839 865 950
Tabel ––––––
10.1.8Table
http
://www.b
ps.g
o.id

T R A N S P O R T A S I D A N K O M U N I K A S I
S t a t i s t i k I n d o n e s i a 2 0 1 3370
Produksi Angkutan Udara Niaga Berjadwal Domestik, 2008–2012Commercial Airlines Production of Scheduled Domestic Flight, 2008–2012
Catatan/Note: x Angka sementara/Preliminary figures
Sumber/Source: Direktorat Jendral Perhubungan Udara–Kementerian Perhubungan/Directorate General of Civil Aviation–Ministry of Transportation
RincianDescription
SatuanUnit 2008 2009 2010 2011 2012 x
(1) (2) (3) (4) (5) (6) (7)
Km pesawat/Aircraft-km 000 268 512 431 103 356 089 409 073 555 711
Keberangkatan pesawat Aircraft departure
kali/times 341 119 390 554 417 717 504 519 614 572
Jam terbang pesawat Aircraft flying hours
jam/hour 477 556 753 425 639 620 686 784 851 068
Penumpang diangkut Passenger carried
orang/person 37 405 437 43 808 033 51 775 656 60 197 306 71 418 695
Km-penumpang terpakai Passenger-km performed
000 44 867 710 75 424 446 59 435 878 58 455 009 69 235 093
Km-tempat duduk tersedia Available seat-km
000 55 590 897 91 984 954 72 719 097 68 578 455 85 700 666
Tingkat penggunaan tempat duduk Passenger load factor
% 80,71 82,00 81,73 85,24 80,79
Barang diangkut/Freight carried ton 338 236 350 222 749 203 483 736 571 546
Ton-km terpakai/Ton-km performed
000 3 957 186 16 454 212 11 591 519 5 243 193 11 836 645
Ton-km tersedia/Available ton-km 000 9 426 679 37 069 550 25 319 476 15 243 235 36 828 580
Tingkat kepadatan muatan Weight load factor
% 41,98 44,39 45,78 34,40 32,14
Tabel ––––––
10.1.9Table
http
://www.b
ps.g
o.id

T R A N S P O R T A T I O N A N D C O M M U N I C A T I O N
S t a t i s t i c a l Y e a r b o o k o f I n d o n e s i a 2 0 1 3 371
Produksi Angkutan Udara Niaga Berjadwal Internasional, 2008–2012Commercial Airlines Production of Scheduled International Flight, 2008–2012
Catatan/Note: x Angka sementara/Preliminary figures
Sumber/Source: Direktorat Jendral Perhubungan Udara-Kementerian Perhubungan/Directorate General of Civil Aviation-Ministry of Transportation
RincianDescription
SatuanUnit 2008 2009 2010 2011 2012 x
(1) (2) (3) (4) (5) (6) (7)
Km pesawat/Aircraft-km 000 67 046 80 638 101 682 126 876 138 721
Keberangkatan pesawat Aircraft departure
kali/times 37 152 42 870 50 793 61 755 69 946
Jam terbang pesawat Aircraft flying hours
jam/hour 98 013 123 981 151 519 184 312 209 107
Penumpang diangkut Passenger carried
orang/person 4 102 210 5 004 056 6 614 937 8 152 133 9 938 291
Km-penumpang terpakai Passenger-km performed
000 10 714 927 12 749 933 16 369 348 22 897 654 23 264 346
Km-tempat duduk tersedia available seat-km
000 14 546 351 17 831 399 22 686 349 31 186 691 31 423 555
Tingkat penggunaan tempat duduk Passenger load factor
% 73,66 71,50 72,16 73,42 74,03
Barang diangkut/Freight carried ton 42 460 46 485 79 549 72 163 90 692
Ton-km terpakai/Ton-km performed
000 1 201 096 4 071 524 6 370 881 4 776 524 12 028 236
Ton-km tersedia/Available ton-km 000 2 044 701 11 707 748 21 268 684 10 788 625 34 539 295
Tingkat kepadatan muatan Weight load factor
% 58,74 34,78 29,95 44,27 34,82
Tabel ––––––
10.1.10Table
http
://www.b
ps.g
o.id

T R A N S P O R T A S I D A N K O M U N I K A S I
S t a t i s t i k I n d o n e s i a 2 0 1 3372
Lalu Lintas Penumpang dan Barang Angkutan Udara Penerbangan Dalam Negeri di Lima Bandar Udara Utama, 2007–2012Domestic Aircraft Passenger and Freight Traffic in Five Main Airports, 2007–2012
Catatan/Note: r Angka diperbaiki/Revised figures x Angka sementara/Preliminary figures
Sumber/Source: Laporan dari PT. Angkasa Pura I dan II/Report from PT. Angkasa Pura I and II
Bandar UdaraAirport
SatuanUnit 2007 2008 2009 2010 2011 r 2012 x
(1) (2) (3) (4) (5) (6) (7) (8)
Polonia-Medan
Penumpang/Passenger 000 orang/person 2 058 1 955 2 073 2 521 2 867 3 196
Barang/Freight ton 10 809 11 385 12 096 13 681 16 168 16 868
Soekarno Hatta-Jakarta
Penumpang/Passenger 000 orang/person 11 898 11 890 13 314 15 469 17 545 19 794
Barang/Freight ton 133 663 152 303 146 134 167 053 227 829 219 309
Juanda-Surabaya
Penumpang/Passenger 000 orang/person 3 571 3 540 4 306 5 235 6 399 6 731
Barang/Freight ton 23 441 22 425 27 276 34 324 42 159 51 980
Ngurah Rai-Denpasar
Penumpang/Passenger 000 orang/person 1 942 2 053 2 252 2 686 3 243 3 760
Barang/Freight ton 5 144 6 362 6 433 7 458 7 948 7 828
Hasanuddin-Makassar
Penumpang/Passenger 000 orang/person 1 590 1 576 1 777 2 313 4 448 3 010
Barang/Freight ton 27 375 22 522 21 815 19 465 18 574 21 656
Tabel ––––––
10.1.11Table
http
://www.b
ps.g
o.id

T R A N S P O R T A T I O N A N D C O M M U N I C A T I O N
S t a t i s t i c a l Y e a r b o o k o f I n d o n e s i a 2 0 1 3 373
Lalu Lintas Penumpang dan Barang Angkutan Udara Penerbangan Luar Negeri di Lima Bandar Udara Utama, 2007–2012International Aircraft Passenger and Freight Traffic in Five Main Airports, 2007–2012
Catatan/Note: r Angka diperbaiki/Revised figures x Angka sementara/Preliminary figures
Sumber/Source: Laporan dari PT. Angkasa Pura I dan II/Report from PT. Angkasa Pura I and II
Bandar UdaraAirport
SatuanUnit 2007 2008 2009 2010 2011 r 2012 x
(1) (2) (3) (4) (5) (6) (7) (8)
Polonia-Medan
Penumpang/Passenger 000 orang/person 451 471 462 562 704 770
Barang/Freight ton 1 888 3 353 2 308 1 395 3 429 3 154
Soekarno Hatta-Jakarta
Penumpang/Passenger 000 orang/person 3 375 3 583 3 828 4 760 5 400 5 904
Barang/Freight ton 106 132 118 379 110 467 128 080 135 261 146 117
Juanda-Surabaya
Penumpang/Passenger 000 orang/person 464 462 502 561 686 749
Barang/Freight ton 7 455 7 790 8 150 9 316 8 470 9 452
Ngurah Rai-Denpasar
Penumpang/Passenger 000 orang/person 1 804 2 110 2 469 2 830 3 087 3 235
Barang/Freight ton 26 784 27 195 28 839 29 720 24 459 23 458
Hasanuddin-Makassar
Penumpang/Passenger 000 orang/person 14 23 21 27 55 52
Barang/Freight ton 0 55 129 521 828 920
Tabel ––––––
10.1.12Table
http
://www.b
ps.g
o.id

T R A N S P O R T A S I D A N K O M U N I K A S I
S t a t i s t i k I n d o n e s i a 2 0 1 3374
Lalu Lintas Angkutan Udara Penerbangan Dalam Negeri, 2008–2012Domestic Aircraft Traffic, 2008–2012
Catatan/Note: x Angka sementara/Preliminary figuresSumber/Source: Laporan dari Bandar Udara-Dokumen III/1 Report from Airport Authority-III/1 Document
RincianDescription
SatuanUnit 2008 2009 2010 2011 2012 x
(1) (2) (3) (4) (5) (6) (7)
Pesawat Terbang/Aircraft unit
Berangkat/Departures 424 118 509 305 576 200 671 953 663 366
Datang/Arrivals 430 961 513 132 574 423 671 377 666 038
Penumpang/Passenger orang/person
Berangkat/Departures 36 144 036 41 691 068 48 872 363 59 275 637 64 102 504
Datang/Arrivals 36 388 502 42 565 099 50 519 023 59 035 279 68 416 181
Transit 2 736 811 4 809 422 5 682 813 8 216 516 7 491 578
Barang/Cargo ton
Muat/Loaded 300 170 288 651 375 760 463 507 507 341
Bongkar/Unloaded 331 517 311 428 348 476 450 218 439 249
Bagasi/Baggage ton
Muat/Loaded 352 245 396 552 461 884 453 556 495 073
Bongkar/Unloaded 357 494 395 810 440 300 404 607 408 025
Pos Paket/Parcels ton
Muat/Loaded 16 640 11 335 10 883 9 809 8 920
Bongkar/Unloaded 19 398 10 639 10 533 9 871 8 254
Tabel ––––––
10.1.13Table
http
://www.b
ps.g
o.id

T R A N S P O R T A T I O N A N D C O M M U N I C A T I O N
S t a t i s t i c a l Y e a r b o o k o f I n d o n e s i a 2 0 1 3 375
Lalu Lintas Angkutan Udara Penerbangan Luar Negeri, 2008–2012International Aircraft Traffic, 2008–2012
Catatan/Note: x Angka sementara/Preliminary figuresSumber/Source: Laporan dari Bandar Udara-Dokumen III/1 Report from Airport Authority-III/1 Document
RincianDescription
SatuanUnit 2008 2009 2010 2011 2012 x
(1) (2) (3) (4) (5) (6) (7)
Pesawat Terbang/Aircraft unit
Berangkat/Departures 56 255 62 266 70 201 79 231 84 669
Datang/Arrivals 55 786 61 680 70 011 79 332 84 781
Penumpang/Passenger orang/person
Berangkat /Departures 7 298 373 8 016 229 9 465 611 10 745 007 11 680 571
Datang/Arrivals 7 303 343 8 068 039 9 559 458 10 829 905 11 751 921
Transit 137 241 229 027 219 789 165 509 62 593
Barang/Cargo ton
Muat/Loaded 169 181 157 904 178 895 178 797 192 486
Bongkar/Unloaded 150 814 133 043 165 554 162 040 193 430
Bagasi/Baggage ton
Muat/Loaded 90 730 96 713 113 968 97 307 117 429
Bongkar/Unloaded 116 091 122 337 139 954 113 106 86 026
Pos Paket/Parcels ton
Muat/Loaded 1 297 1 259 1 070 501 953
Bongkar/Unloaded 1 947 1 974 2 360 1 197 2 829
Tabel ––––––
10.1.14Table
http
://www.b
ps.g
o.id
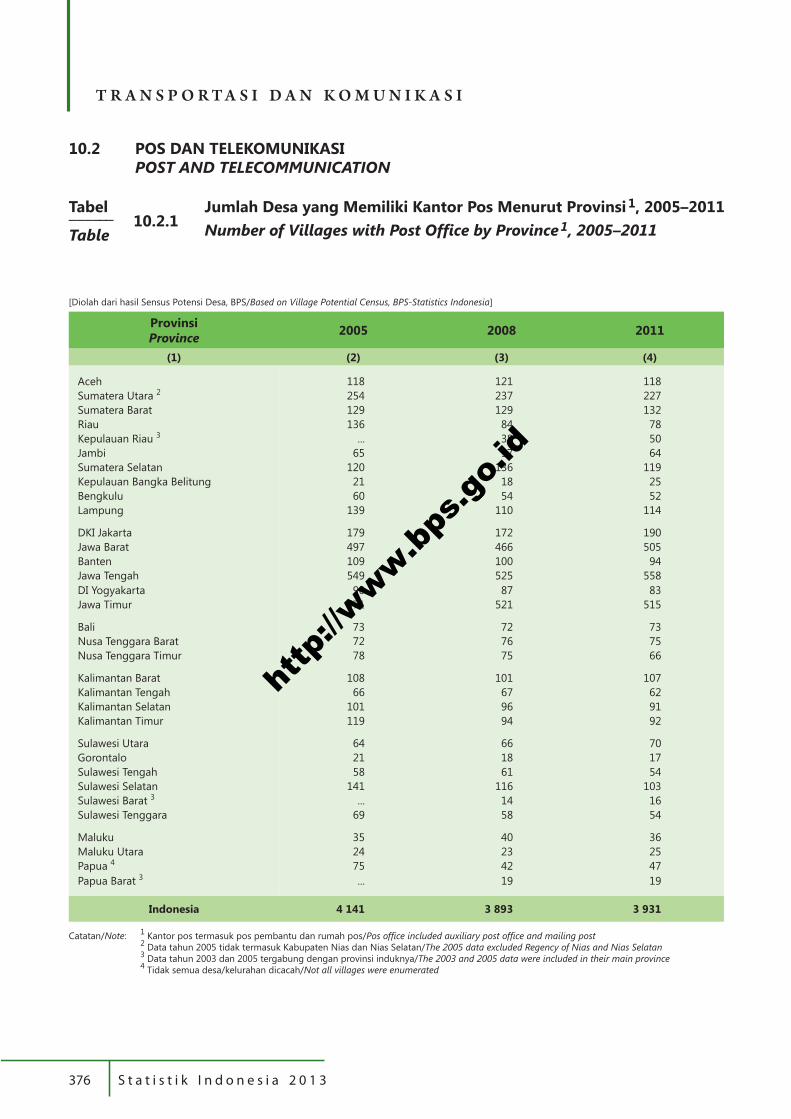
T R A N S P O R T A S I D A N K O M U N I K A S I
S t a t i s t i k I n d o n e s i a 2 0 1 3376
Jumlah Desa yang Memiliki Kantor Pos Menurut Provinsi 1, 2005–2011Number of Villages with Post Office by Province 1, 2005–2011
10.2 POS DAN TELEKOMUNIKASI POST AND TELECOMMUNICATION
[Diolah dari hasil Sensus Potensi Desa, BPS/Based on Village Potential Census, BPS-Statistics Indonesia]
ProvinsiProvince 2005 2008 2011
(1) (2) (3) (4)
Aceh 118 121 118Sumatera Utara 2 254 237 227Sumatera Barat 129 129 132Riau 136 84 78Kepulauan Riau 3 ... 38 50Jambi 65 57 64Sumatera Selatan 120 136 119Kepulauan Bangka Belitung 21 18 25Bengkulu 60 54 52Lampung 139 110 114
DKI Jakarta 179 172 190Jawa Barat 497 466 505Banten 109 100 94Jawa Tengah 549 525 558DI Yogyakarta 90 87 83Jawa Timur 571 521 515
Bali 73 72 73Nusa Tenggara Barat 72 76 75Nusa Tenggara Timur 78 75 66
Kalimantan Barat 108 101 107Kalimantan Tengah 66 67 62Kalimantan Selatan 101 96 91Kalimantan Timur 119 94 92
Sulawesi Utara 64 66 70Gorontalo 21 18 17Sulawesi Tengah 58 61 54Sulawesi Selatan 141 116 103Sulawesi Barat 3 ... 14 16Sulawesi Tenggara 69 58 54
Maluku 35 40 36Maluku Utara 24 23 25Papua 4 75 42 47Papua Barat 3 ... 19 19
Indonesia 4 141 3 893 3 931
Catatan/Note: 1 Kantor pos termasuk pos pembantu dan rumah pos/Pos office included auxiliary post office and mailing post 2 Data tahun 2005 tidak termasuk Kabupaten Nias dan Nias Selatan/The 2005 data excluded Regency of Nias and Nias Selatan 3 Data tahun 2003 dan 2005 tergabung dengan provinsi induknya/The 2003 and 2005 data were included in their main province 4 Tidak semua desa/kelurahan dicacah/Not all villages were enumerated
Tabel ––––––
10.2.1Table
http
://www.b
ps.g
o.id

T R A N S P O R T A T I O N A N D C O M M U N I C A T I O N
S t a t i s t i c a l Y e a r b o o k o f I n d o n e s i a 2 0 1 3 377
Persentase Rumah Tangga yang Memiliki/Menguasai Telepon Tetap Kabel Menurut Provinsi, 2008–2011Percentage of Households with Fixed Line Telephone by Province, 2008–2011
ProvinsiProvince 2008 2009 2010 2011
(1) (2) (3) (4) (5)
Aceh 5,15 4,54 4,60 3,29Sumatera Utara 10,36 9,54 7,62 5,74Sumatera Barat 12,79 10,36 8,15 7,38Riau 9,57 8,72 6,04 5,39Kepulauan Riau 13,26 10,05 13,02 10,41Jambi 8,11 5,54 5,91 4,52Sumatera Selatan 9,15 8,26 8,64 7,05Kepulauan Bangka Belitung 8,41 6,80 6,01 4,12Bengkulu 7,01 6,75 5,67 6,16Lampung 6,92 6,34 5,46 4,14
DKI Jakarta 35,42 32,68 27,35 26,69Jawa Barat 13,46 12,24 11,64 8,77Banten 16,80 12,17 14,25 11,38Jawa Tengah 7,74 6,98 6,86 6,05DI Yogyakarta 10,76 13,05 10,17 10,17Jawa Timur 12,55 10,76 8,54 7,49
Bali 16,17 14,42 15,64 13,52Nusa Tenggara Barat 4,06 4,07 3,32 3,13Nusa Tenggara Timur 4,59 3,72 4,06 3,75
Kalimantan Barat 7,46 6,27 7,42 5,17Kalimantan Tengah 6,77 7,65 6,36 4,36Kalimantan Selatan 8,93 8,35 6,10 5,98Kalimantan Timur 19,25 15,38 13,44 10,81
Sulawesi Utara 13,19 10,22 9,21 8,04Gorontalo 6,75 7,19 3,57 3,45Sulawesi Tengah 5,56 4,35 5,05 3,78Sulawesi Selatan 11,62 11,56 10,62 7,75Sulawesi Barat 6,24 4,08 3,41 2,85Sulawesi Tenggara 5,49 5,14 4,56 3,34
Maluku 6,40 6,52 6,58 3,91Maluku Utara 6,56 4,95 3,11 3,32Papua 6,13 4,98 4,28 2,91Papua Barat 7,40 7,90 8,35 3,63
Indonesia 11,67 10,36 9,46 7,85
Tabel ––––––
10.2.2Table
(Diolah dari Hasil Survei Sosial Ekonomi Nasional, BPS/Based on National Socio Economic Survey, BPS-Statistics Indonesia)
http
://www.b
ps.g
o.id
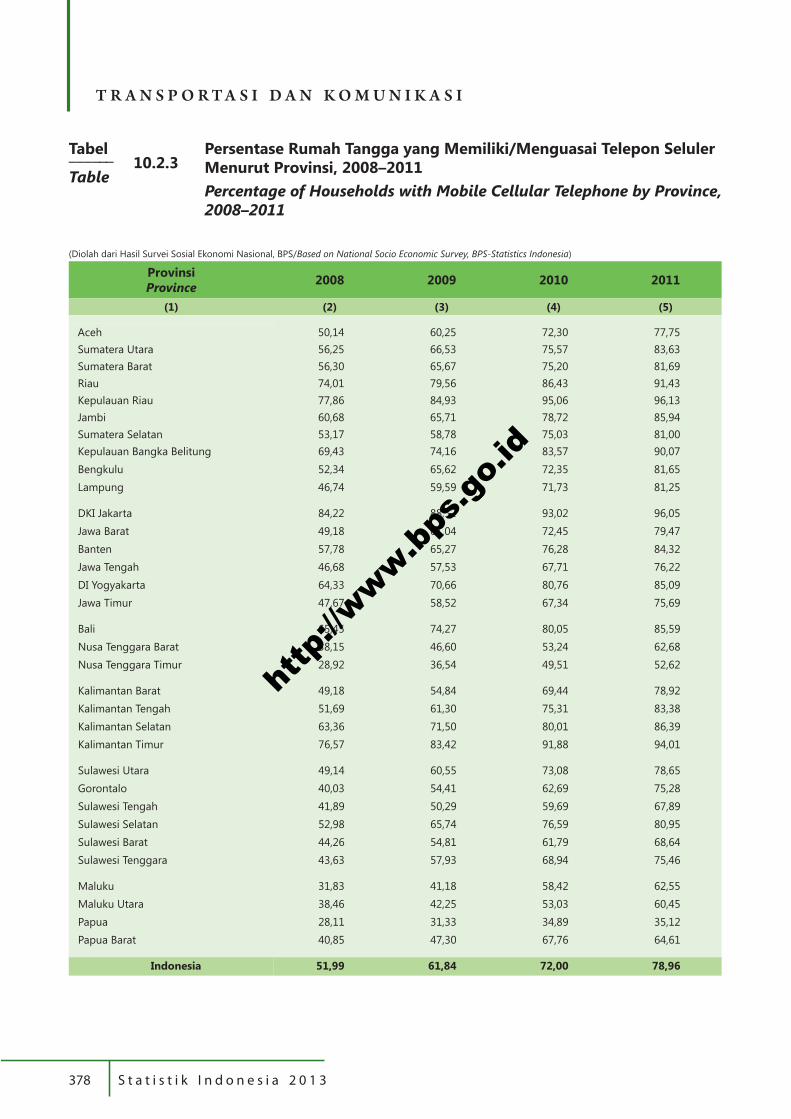
T R A N S P O R T A S I D A N K O M U N I K A S I
S t a t i s t i k I n d o n e s i a 2 0 1 3378
Persentase Rumah Tangga yang Memiliki/Menguasai Telepon Seluler Menurut Provinsi, 2008–2011Percentage of Households with Mobile Cellular Telephone by Province, 2008–2011
Tabel ––––––
10.2.3Table
ProvinsiProvince 2008 2009 2010 2011
(1) (2) (3) (4) (5)
Aceh 50,14 60,25 72,30 77,75Sumatera Utara 56,25 66,53 75,57 83,63Sumatera Barat 56,30 65,67 75,20 81,69Riau 74,01 79,56 86,43 91,43Kepulauan Riau 77,86 84,93 95,06 96,13Jambi 60,68 65,71 78,72 85,94Sumatera Selatan 53,17 58,78 75,03 81,00Kepulauan Bangka Belitung 69,43 74,16 83,57 90,07Bengkulu 52,34 65,62 72,35 81,65Lampung 46,74 59,59 71,73 81,25
DKI Jakarta 84,22 88,52 93,02 96,05Jawa Barat 49,18 61,04 72,45 79,47Banten 57,78 65,27 76,28 84,32Jawa Tengah 46,68 57,53 67,71 76,22DI Yogyakarta 64,33 70,66 80,76 85,09Jawa Timur 47,67 58,52 67,34 75,69
Bali 65,45 74,27 80,05 85,59Nusa Tenggara Barat 38,15 46,60 53,24 62,68Nusa Tenggara Timur 28,92 36,54 49,51 52,62
Kalimantan Barat 49,18 54,84 69,44 78,92Kalimantan Tengah 51,69 61,30 75,31 83,38Kalimantan Selatan 63,36 71,50 80,01 86,39Kalimantan Timur 76,57 83,42 91,88 94,01
Sulawesi Utara 49,14 60,55 73,08 78,65Gorontalo 40,03 54,41 62,69 75,28Sulawesi Tengah 41,89 50,29 59,69 67,89Sulawesi Selatan 52,98 65,74 76,59 80,95Sulawesi Barat 44,26 54,81 61,79 68,64Sulawesi Tenggara 43,63 57,93 68,94 75,46
Maluku 31,83 41,18 58,42 62,55Maluku Utara 38,46 42,25 53,03 60,45Papua 28,11 31,33 34,89 35,12Papua Barat 40,85 47,30 67,76 64,61
Indonesia 51,99 61,84 72,00 78,96
(Diolah dari Hasil Survei Sosial Ekonomi Nasional, BPS/Based on National Socio Economic Survey, BPS-Statistics Indonesia)
http
://www.b
ps.g
o.id
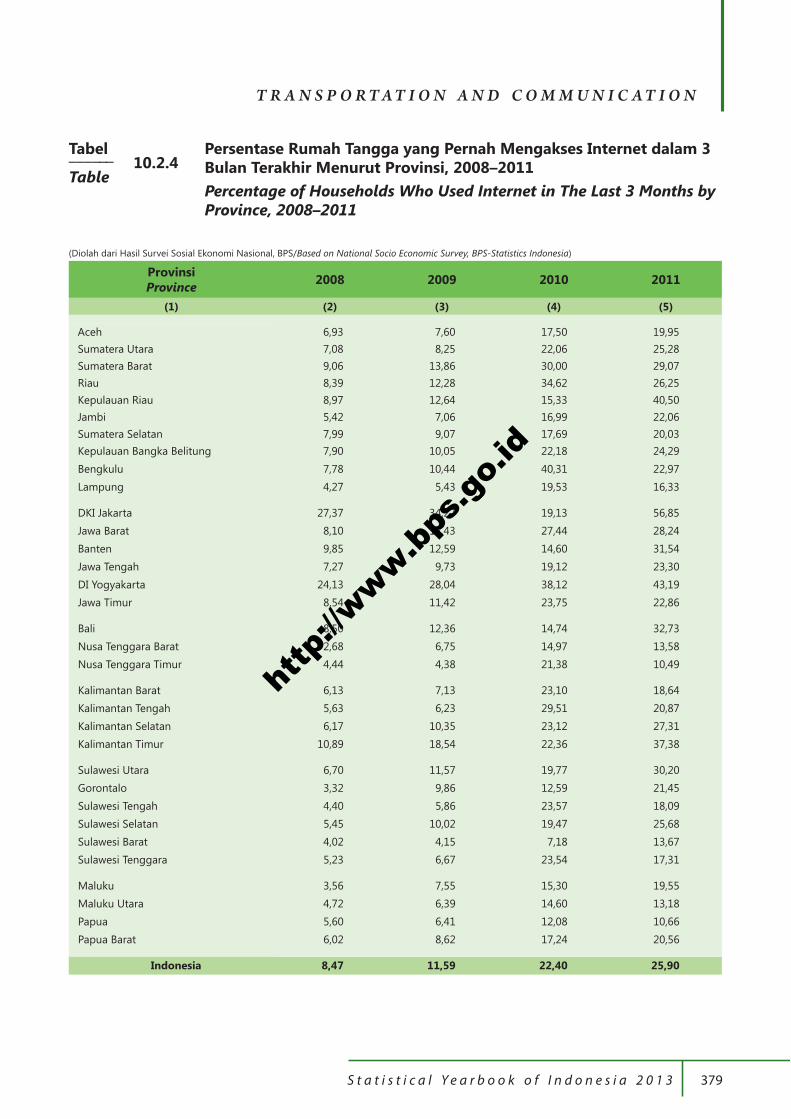
T R A N S P O R T A T I O N A N D C O M M U N I C A T I O N
S t a t i s t i c a l Y e a r b o o k o f I n d o n e s i a 2 0 1 3 379
Persentase Rumah Tangga yang Pernah Mengakses Internet dalam 3 Bulan Terakhir Menurut Provinsi, 2008–2011Percentage of Households Who Used Internet in The Last 3 Months by Province, 2008–2011
ProvinsiProvince 2008 2009 2010 2011
(1) (2) (3) (4) (5)
Aceh 6,93 7,60 17,50 19,95Sumatera Utara 7,08 8,25 22,06 25,28Sumatera Barat 9,06 13,86 30,00 29,07Riau 8,39 12,28 34,62 26,25Kepulauan Riau 8,97 12,64 15,33 40,50Jambi 5,42 7,06 16,99 22,06Sumatera Selatan 7,99 9,07 17,69 20,03Kepulauan Bangka Belitung 7,90 10,05 22,18 24,29Bengkulu 7,78 10,44 40,31 22,97Lampung 4,27 5,43 19,53 16,33
DKI Jakarta 27,37 34,27 19,13 56,85Jawa Barat 8,10 12,43 27,44 28,24Banten 9,85 12,59 14,60 31,54Jawa Tengah 7,27 9,73 19,12 23,30DI Yogyakarta 24,13 28,04 38,12 43,19Jawa Timur 8,54 11,42 23,75 22,86
Bali 8,50 12,36 14,74 32,73Nusa Tenggara Barat 2,68 6,75 14,97 13,58Nusa Tenggara Timur 4,44 4,38 21,38 10,49
Kalimantan Barat 6,13 7,13 23,10 18,64Kalimantan Tengah 5,63 6,23 29,51 20,87Kalimantan Selatan 6,17 10,35 23,12 27,31Kalimantan Timur 10,89 18,54 22,36 37,38
Sulawesi Utara 6,70 11,57 19,77 30,20Gorontalo 3,32 9,86 12,59 21,45Sulawesi Tengah 4,40 5,86 23,57 18,09Sulawesi Selatan 5,45 10,02 19,47 25,68Sulawesi Barat 4,02 4,15 7,18 13,67Sulawesi Tenggara 5,23 6,67 23,54 17,31
Maluku 3,56 7,55 15,30 19,55Maluku Utara 4,72 6,39 14,60 13,18Papua 5,60 6,41 12,08 10,66Papua Barat 6,02 8,62 17,24 20,56
Indonesia 8,47 11,59 22,40 25,90
Tabel ––––––
10.2.4Table
(Diolah dari Hasil Survei Sosial Ekonomi Nasional, BPS/Based on National Socio Economic Survey, BPS-Statistics Indonesia)
http
://www.b
ps.g
o.id

T R A N S P O R T A S I D A N K O M U N I K A S I
S t a t i s t i k I n d o n e s i a 2 0 1 3380
Rata-Rata Banyaknya Anggota Rumah Tangga yang Pernah Mengakses Internet dari Rumah Tangga yang Pernah Mengakses Internet dalam 3 Bulan Terakhir Menurut Provinsi dan Jenis Kelamin, 2010–2011Average Number of Household Members Who Used Internet from Households Who Used Internet in The Last 3 Months by Province and Sex, 2010–2011
Tabel ––––––
10.2.5Table
ProvinsiProvince
Jenis Kelamin/Sex Laki-laki+ Perempuan
Male+FemaleLaki-laki
MalePerempuan
Female
2010 2011 2010 2011 2010 2011
(1) (2) (3) (4) (5) (6) (7)
Aceh 1,27 1,29 1,25 1,27 1,59 1,62Sumatera Utara 1,30 1,33 1,27 1,28 1,66 1,70Sumatera Barat 1,32 1,31 1,29 1,29 1,69 1,66Riau 1,32 1,36 1,35 1,32 1,70 1,78Kepulauan Riau 1,28 1,24 1,25 1,27 1,68 1,72Jambi 1,24 1,26 1,24 1,19 1,56 1,57Sumatera Selatan 1,38 1,31 1,32 1,29 1,78 1,68Kepulauan Bangka Belitung 1,23 1,23 1,18 1,20 1,52 1,54Bengkulu 1,24 1,24 1,26 1,20 1,61 1,53Lampung 1,26 1,25 1,23 1,22 1,56 1,56
DKI Jakarta 1,38 1,39 1,35 1,34 1,90 1,94Jawa Barat 1,30 1,28 1,30 1,22 1,69 1,63Banten 1,37 1,34 1,28 1,28 1,78 1,76Jawa Tengah 1,21 1,21 1,19 1,18 1,47 1,46DI Yogyakarta 1,20 1,27 1,21 1,22 1,47 1,59Jawa Timur 1,19 1,22 1,15 1,18 1,43 1,49
Bali 1,26 1,25 1,22 1,23 1,60 1,58Nusa Tenggara Barat 1,24 1,20 1,18 1,24 1,49 1,51Nusa Tenggara Timur 1,28 1,25 1,26 1,33 1,59 1,61
Kalimantan Barat 1,34 1,30 1,34 1,28 1,72 1,67Kalimantan Tengah 1,25 1,24 1,23 1,21 1,57 1,60Kalimantan Selatan 1,28 1,26 1,18 1,22 1,56 1,62Kalimantan Timur 1,32 1,33 1,26 1,26 1,71 1,78
Sulawesi Utara 1,26 1,28 1,24 1,26 1,62 1,68Gorontalo 1,25 1,26 1,22 1,25 1,57 1,61Sulawesi Tengah 1,33 1,32 1,27 1,28 1,68 1,70Sulawesi Selatan 1,42 1,34 1,36 1,35 1,83 1,76Sulawesi Barat 1,31 1,38 1,30 1,30 1,61 1,66Sulawesi Tenggara 1,34 1,35 1,29 1,28 1,73 1,71
Maluku 1,33 1,27 1,32 1,30 1,73 1,68Maluku Utara 1,26 1,29 1,29 1,22 1,67 1,62Papua 1,27 1,35 1,18 1,25 1,57 1,74Papua Barat 1,31 1,31 1,19 1,25 1,65 1,71
Indonesia 1,28 1,28 1,26 1,24 1,63 1,63
(Diolah dari Hasil Survei Sosial Ekonomi Nasional, BPS/Based on National Socio Economic Survey, BPS-Statistics Indonesia)
http
://www.b
ps.g
o.id
11PERBANKAN, INVESTASI, UTANG LUAR NEGERI,
ASURANSI, DAN KOPERASIBanking, Investment,
External Debt, Insurance, and Cooperative
http
://www.b
ps.g
o.id

http
://www.b
ps.g
o.id

BANKING, INVESTMENT, EXTERNAL DEBT, INSURANCE, AND COOPERATIVE
S t a t i s t i c a l Y e a r b o o k o f I n d o n e s i a 2 0 1 3 383
PENJELASAN TEKNIS
1. Data statistik perbankan bersumber dari Bank Indonesia.
2. Kantor bank terdiri dari Kantor Cabang (KC), Kantor Cabang Pembantu (KCP), dan kantor di bawah KCP.
3. Uang beredar dalam arti sempit (M1) adalah kewajiban sistem moneter yang terdiri atas uang kartal dan uang giral.
4. Uang beredar dalam arti luas (M2) atau likuiditas perekonomian adalah kewajiban sistem moneter yang terdiri atas M1, uang kuasi, dan surat berharga selain saham.
5. Uang kartal terdiri atas uang kertas dan uang logam yang berlaku, tidak termasuk uang kas pada Kantor Perbendaharaan dan Kas Negara (KPKN) dan bank umum.
6. Uang giral terdiri atas rekening giro, kiriman uang, simpanan berjangka, dan tabungan dalam rupiah yang sudah jatuh waktu, yang seluruhnya merupakan simpanan penduduk dalam rupiah pada sistem moneter.
7. Uang kuasi terdiri atas simpanan berjangka dan tabungan penduduk pada bank umum, baik dalam rupiah maupun valuta asing.
8. Data statistik penanaman modal yang disetujui pemerintah terdiri dari Penanaman Modal Asing (PMA) dan Penanaman Modal Dalam Negeri (PMDN), bersumber dari Badan Koordinasi Penanaman Modal (BKPM). Data mengenai realisasi investasi penanaman modal tidak termasuk sektor minyak, asuransi, dan perbankan. Data telah memperhatikan perubahan investasi yang beralih status dan juga pengurangan investasi yang dicabut izin usahanya.
9. Utang Luar Negeri adalah posisi utang yang menimbulkan kewajiban membayar kembali pokok dan/atau bunga utang kepada pihak luar negeri atau bukan penduduk baik dalam valuta asing maupun rupiah, dan tidak termasuk kontinjen. Termasuk dalam pengertian utang luar negeri adalah surat berharga yang diterbitkan di dalam negeri yang
TECHNICAL NOTES
1. Banking statistics are obtained from the Bank Indonesia.
2. Bank offices consist of branch office (KC), sub branch office (KCP), and offices under KCP.
3. The “ broad money (M1)” in specific term is liabilities of the monetary system consisting of currency and demand deposits.
4. The “broad money (M2)” in a broader term or “domestic liquidity” is liabilities of the monetary system consisting M1, quasi money, and securities other than shares.
5. Currency consists of legal bank notes and coins excluding cash in the government treasury offices and commercial banks.
6. Demand deposit comprises current accounts, transfer, matured time, and savings deposits in rupiah, held by residents in the monetary system.
7. Quasi money consists of time and savings deposits in rupiah and foreign currency held by residents in commercial banks.
8. Statistics of foreign and domestic investments approved by government are obtained from the Investment Coordinating Board (BKPM). Realization of investment data exclude those investments in petroleum production, insurance, and banking sectors. Changes in investment status and those whose license was taken off have been taken into account.
9. External Debt is the outstanding amount that require payment(s) of interest and/or principal by the debtor at some point(s) in the future to the foreign state or non residents of an economy in terms of foreign exchange or rupiah, and not included contingent. This definition includes securities issued on the domestic market that incur repayment obligations towards non-residents.
http
://www.b
ps.g
o.id
PERBANKAN, INVESTASI, UTANG LUAR NEGERI, ASURANSI, DAN KOPERASI
S t a t i s t i k I n d o n e s i a 2 0 1 3384
menimbulkan kewajiban membayar kembali kepada pihak luar negeri atau bukan penduduk.
10. Utang Luar Negeri Pemerintah adalah utang luar negeri yang dimiliki pemerintah.
11. Utang Luar Negeri Bank Sentral adalah utang luar negeri yang dimiliki oleh Bank Indonesia dalam rangka mendukung neraca pembayaran.
12. Utang Luar Negeri Swasta adalah utang luar negeri yang dimiliki oleh penduduk berdasarkan perjanjian pinjaman atau perjanjian lainnya, termasuk kas dan simpanan, dan kewajiban lainnya terhadap bukan penduduk.
13. Pinjaman Bilateral adalah pinjaman luar negeri yang berasal dari pemerintah suatu negara melalui suatu lembaga keuangan dan/atau lembaga non-keuangan yang ditunjuk oleh pemerintah negara yang bersangkutan untuk melaksanakan pemberian pinjaman.
14. Pinjaman Multilateral adalah pinjaman luar negeri pemerintah yang berasal dari lembaga multilateral.
15. Pinjaman Official Development Assistence (ODA) atau Concessional Loan adalah pinjaman luar negeri yang berasal dari suatu negara atau lembaga multilateral, yang ditujukan untuk pembangunan ekonomi atau untuk peningkatan kesejahteraan sosial bagi negara penerima dan memiliki komponen hibah. Pinjaman oleh lembaga ekspor kredit yang bertujuan untuk meningkatkan ekspor tidak termasuk dalam pengertian ODA.
16. Surat Berharga Domestik yang Dimiliki Bukan Penduduk adalah surat berharga yang diterbitkan di dalam negeri baik oleh pemerintah, bank sentral atau perusahaan yang berdomisili di dalam negeri, yang dimiliki bukan penduduk.
17. Cadangan Devisa adalah cadangan devisa negara
yang dikuasai oleh Bank Indonesia dan tercatat pada sisi aktiva neraca Bank Indonesia, yang antara lain berupa emas, uang kertas asing, dan tagihan dalam bentuk giro, deposito berjangka, wesel, surat berharga luar negeri, dan lainnya dalam valuta asing kepada pihak luar negeri yang dapat dipergunakan sebagai alat pembayaran luar negeri.
10. Government External Debt is external debt owned by the government.
11. Central Bank External Debt is external debt owned by Bank Indonesia used to strengthen the balance of payments.
12. Private External Debt is foreign debt held by residents based on loan agreement or other agreements, including currency and deposits, and other liabilities to non-residents.
13. Bilateral Loans are foreign loans extended by a national government through a financial institution and/or non-financial institution appointed by that national government to manage the loan.
14. Multilateral Loans are government external loans from multilateral institutions.
15. ODA or Concessional Loans are external loans originated from a country or a multilateral institution, aimed at economic development or to increase social welfare of recipient country and has a grant component. Lending by export credit agencies which aimed to increase exports are not included in the definition of ODA.
16. Domestic Securities Owned by Non-Resident is securities issued on the domestic market by the government, central bank or Indonesian domiciled companies that owned by non-resident.
17. International Reserves are the international reserves managed by Bank Indonesia and are recorded in the assets accounts of the Bank Indonesia balance sheet such as gold, foreign banknotes, and demand deposit claims, time deposits, notes, foreign securities, and similar foreign currency claims on foreign parties that may be used as instruments for international payments.
http
://www.b
ps.g
o.id

BANKING, INVESTMENT, EXTERNAL DEBT, INSURANCE, AND COOPERATIVE
S t a t i s t i c a l Y e a r b o o k o f I n d o n e s i a 2 0 1 3 385
18. Data perusahaan asuransi bersumber dari Kementerian Keuangan. Jenis asuransi terdiri dari:
a. Asuransi Jiwa b. Asuransi Kerugian c. Reasuransi d. Penyelenggara program asuransi sosial dan
Jamsostek e. Penyelenggara asuransi untuk PNS dan TNI-
Polri
19. Data perkoperasian bersumber dari Kementerian Negara Koperasi dan UKM. Data koperasi yang disajikan meliputi:
a. Jumlah usaha koperasi b. Volume usaha koperasi c. Sisa hasil usaha
20. Koperasi adalah badan usaha yang beranggotakan orang seorang atau badan hukum koperasi dengan melandaskan kegiatannya berdasarkan prinsip koperasi sekaligus sebagai gerakan ekonomi rakyat yang berdasar atas asas kekeluargaan.
21. Sisa hasil usaha koperasi merupakan pendapatan koperasi yang diperoleh dalam satu tahun buku dikurangi dengan biaya, penyusutan, dan kewajiban lainnya termasuk pajak dalam tahun buku yang bersangkutan.
18. Data for insurances are generated from the Ministry of Finance. Types of insurance are:
a. Life insurance b. Non life insurance c. Reinsurance d. Company which runs social insurance program and
Worker Social Insurance e. Company which runs insurance program for
Civil servant and Army Forces-Police
19. Data for cooperatives are generated from State Ministry for Cooperatives and Small and Medium Enterprises. Types of cooperatives data include :
a. Number of cooperatives b. Asset scale of cooperative c. Net profit
20. Cooperative is an establishment that its members are people or establisments with legal status of cooperative and its activities based on people economic movement.
21. Net profit of cooperative is gross income in one year minus expenses, depreciation, and other liabilities including taxes in current year.
http
://www.b
ps.g
o.id

PERBANKAN, INVESTASI, UTANG LUAR NEGERI, ASURANSI, DAN KOPERASI
S t a t i s t i k I n d o n e s i a 2 0 1 3386
Bank dan Kantor Bank, 2008–2012Banks and Bank Offices, 2008–2012
11.1 PERBANKAN BANKING
Catatan/Note: r Angka diperbaiki/Revised figures 1 Tidak termasuk Gerai Muamalat/Not including Muamalat Outlets Sumber/Source: Bank Indonesia
Tabel ––––––
11.1.1Table
Rincian/Description 2008 2009 2010 2011 2012
(1) (2) (3) (4) (5) (6) Bank-Bank Umum/Commercial Banks Bank Persero/State Banks
Jumlah bank/Number of banks 5 4 4 4 4Jumlah kantor bank/Number of offices 3 134 3 854 4 189 r 4 362 5 363
Bank Pemerintah Daerah/Regional Government Banks
Jumlah bank/Number of banks 26 26 26 26 26Jumlah kantor bank/Number of offices 1 310 1 358 1 413 1 472 1 712
Bank Swasta Nasional/Private National Banks
Jumlah bank/Number of banks 63 59 57 r 56 56Jumlah kantor bank/Number of offices 5 490 6 446 6 526 r 7 108 r 7 361
Bank Umum Syariah/Sharia Commercial Banks
Jumlah bank/Number of banks 5 6 11 11 11Jumlah kantor bank 1/Number of offices 1 581 711 1 215 1 390 r 1 734
Bank Asing dan Campuran/Foreign and Joint Banks
Jumlah bank/Number of banks 25 26 24 r 23 23Jumlah kantor bank/Number of offices 353 468 494 r 465 r 455
Jumlah/TotalBank/Banks 124 121 122 120 120
Kantor bank/Bank offices 10 868 12 837 13 837 14 797 16 625
http
://www.b
ps.g
o.id
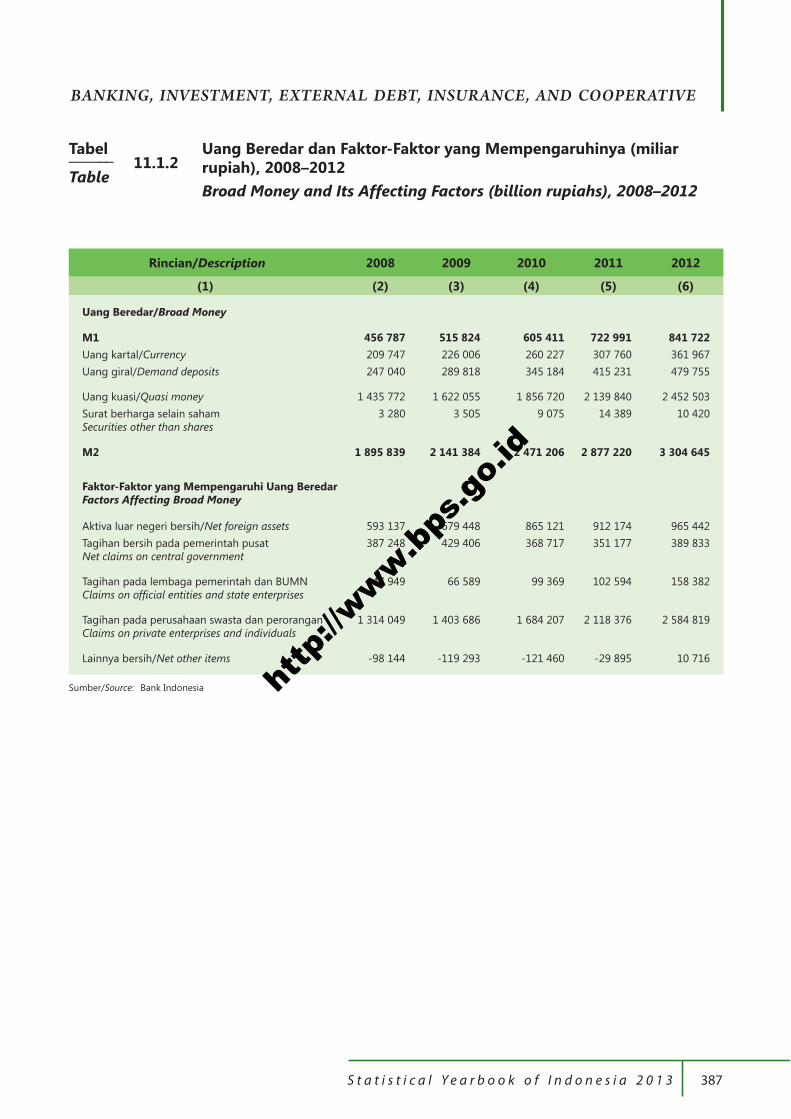
BANKING, INVESTMENT, EXTERNAL DEBT, INSURANCE, AND COOPERATIVE
S t a t i s t i c a l Y e a r b o o k o f I n d o n e s i a 2 0 1 3 387
Uang Beredar dan Faktor-Faktor yang Mempengaruhinya (miliar rupiah), 2008–2012Broad Money and Its Affecting Factors (billion rupiahs), 2008–2012
Sumber/Source: Bank Indonesia
Tabel ––––––
11.1.2Table
Rincian/Description 2008 2009 2010 2011 2012
(1) (2) (3) (4) (5) (6)
Uang Beredar/Broad Money M1 456 787 515 824 605 411 722 991 841 722Uang kartal/Currency 209 747 226 006 260 227 307 760 361 967Uang giral/Demand deposits 247 040 289 818 345 184 415 231 479 755
Uang kuasi/Quasi money 1 435 772 1 622 055 1 856 720 2 139 840 2 452 503Surat berharga selain sahamSecurities other than shares
3 280 3 505 9 075 14 389 10 420
M2 1 895 839 2 141 384 2 471 206 2 877 220 3 304 645
Faktor-Faktor yang Mempengaruhi Uang BeredarFactors Affecting Broad Money
Aktiva luar negeri bersih/Net foreign assets 593 137 679 448 865 121 912 174 965 442Tagihan bersih pada pemerintah pusatNet claims on central government
387 248 429 406 368 717 351 177 389 833
Tagihan pada lembaga pemerintah dan BUMNClaims on official entities and state enterprises
47 949 66 589 99 369 102 594 158 382
Tagihan pada perusahaan swasta dan peroranganClaims on private enterprises and individuals
1 314 049 1 403 686 1 684 207 2 118 376 2 584 819
Lainnya bersih/Net other items -98 144 -119 293 -121 460 -29 895 10 716
http
://www.b
ps.g
o.id
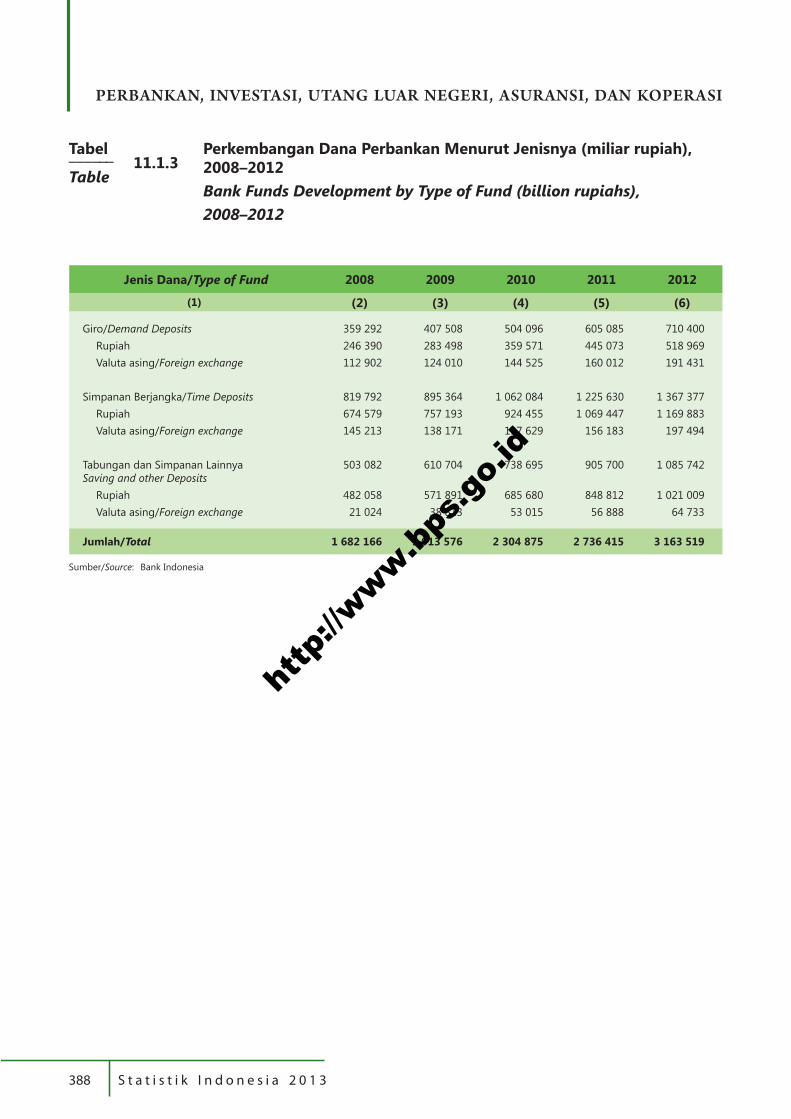
PERBANKAN, INVESTASI, UTANG LUAR NEGERI, ASURANSI, DAN KOPERASI
S t a t i s t i k I n d o n e s i a 2 0 1 3388
Perkembangan Dana Perbankan Menurut Jenisnya (miliar rupiah), 2008–2012Bank Funds Development by Type of Fund (billion rupiahs), 2008–2012
Jenis Dana/Type of Fund 2008 2009 2010 2011 2012
(1) (2) (3) (4) (5) (6) Giro/Demand Deposits 359 292 407 508 504 096 605 085 710 400
Rupiah 246 390 283 498 359 571 445 073 518 969Valuta asing/Foreign exchange 112 902 124 010 144 525 160 012 191 431
Simpanan Berjangka/Time Deposits 819 792 895 364 1 062 084 1 225 630 1 367 377Rupiah 674 579 757 193 924 455 1 069 447 1 169 883Valuta asing/Foreign exchange 145 213 138 171 137 629 156 183 197 494
Tabungan dan Simpanan Lainnya Saving and other Deposits
503 082 610 704 738 695 905 700 1 085 742
Rupiah 482 058 571 891 685 680 848 812 1 021 009Valuta asing/Foreign exchange 21 024 38 813 53 015 56 888 64 733
Jumlah/Total 1 682 166 1 913 576 2 304 875 2 736 415 3 163 519
Sumber/Source: Bank Indonesia
Tabel ––––––
11.1.3Table
http
://www.b
ps.g
o.id
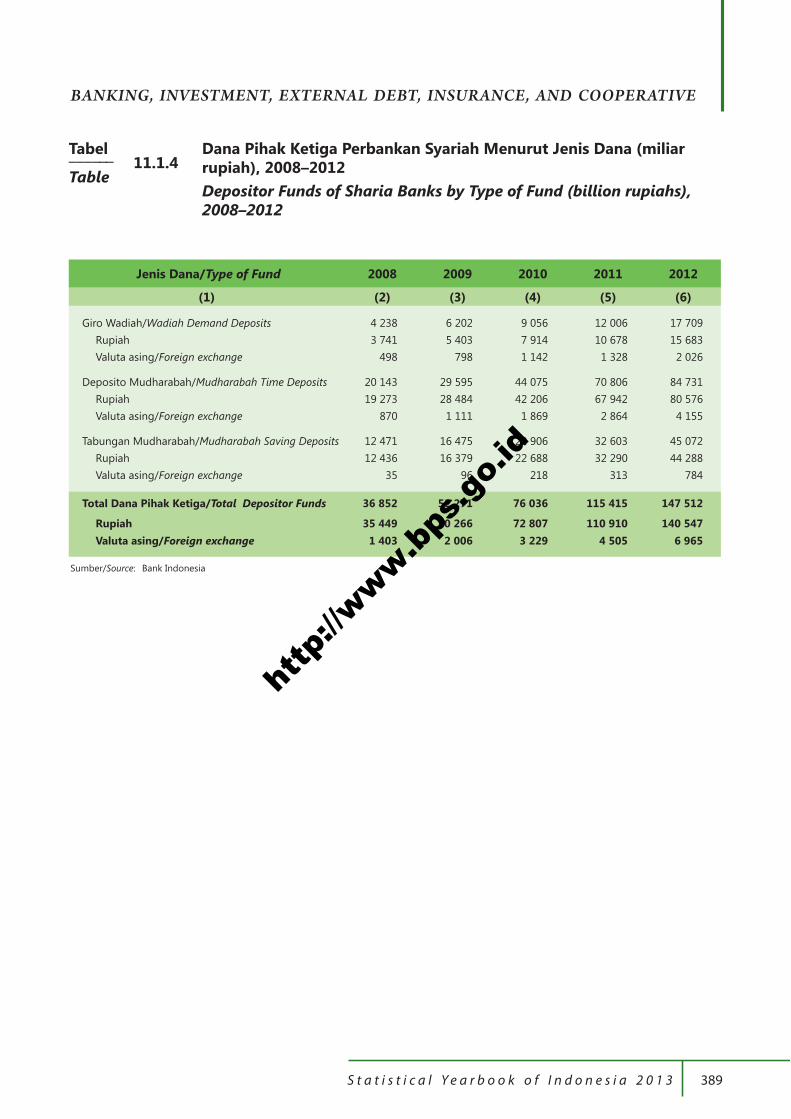
BANKING, INVESTMENT, EXTERNAL DEBT, INSURANCE, AND COOPERATIVE
S t a t i s t i c a l Y e a r b o o k o f I n d o n e s i a 2 0 1 3 389
Dana Pihak Ketiga Perbankan Syariah Menurut Jenis Dana (miliar rupiah), 2008–2012Depositor Funds of Sharia Banks by Type of Fund (billion rupiahs), 2008–2012
Jenis Dana/Type of Fund 2008 2009 2010 2011 2012
(1) (2) (3) (4) (5) (6)
Giro Wadiah/Wadiah Demand Deposits 4 238 6 202 9 056 12 006 17 709Rupiah 3 741 5 403 7 914 10 678 15 683Valuta asing/Foreign exchange 498 798 1 142 1 328 2 026
Deposito Mudharabah/Mudharabah Time Deposits 20 143 29 595 44 075 70 806 84 731
Rupiah 19 273 28 484 42 206 67 942 80 576Valuta asing/Foreign exchange 870 1 111 1 869 2 864 4 155
Tabungan Mudharabah/Mudharabah Saving Deposits 12 471 16 475 22 906 32 603 45 072
Rupiah 12 436 16 379 22 688 32 290 44 288Valuta asing/Foreign exchange 35 96 218 313 784
Total Dana Pihak Ketiga/Total Depositor Funds 36 852 52 271 76 036 115 415 147 512
Rupiah 35 449 50 266 72 807 110 910 140 547Valuta asing/Foreign exchange 1 403 2 006 3 229 4 505 6 965
Sumber/Source: Bank Indonesia
Tabel ––––––
11.1.4Table
http
://www.b
ps.g
o.id

PERBANKAN, INVESTASI, UTANG LUAR NEGERI, ASURANSI, DAN KOPERASI
S t a t i s t i k I n d o n e s i a 2 0 1 3390
Posisi Simpanan Masyarakat (Rupiah dan Valuta Asing) pada Bank Umum Menurut Kelompok Bank (milliar rupiah), 2008–2012Outstanding of Private Deposits of Commercial Banks (Rupiah and Foreign Exchange) by Group of Bank (billion rupiahs), 2008–2012
Sumber/Source: Bank Indonesia
Tabel ––––––
11.1.5Table
Kelompok Bank/Group of Bank 2008 2009 2010 2011 2012
(1) (2) (3) (4) (5) (6)
Bank Persero/State Banks 592 672 715 488 857 086 980 121 1 127 318Rupiah 520 367 622 525 759 929 874 161 987 391Valuta asing/Foreign exchange 72 305 92 963 97 157 105 960 139 927
Bank Swasta NasionalPrivate National Banks
729 754 825 000 1 034 366 1 258 874 1 459 770
Rupiah 627 047 713 972 895 453 1 105 351 1 278 172Valuta asing/Foreign exchange 102 707 111 028 138 913 153 523 181 598
Bank Umum Syariah (BUS)Sharia Commercial Banks
36 852 52 271 76 036 115 415 147 512
Rupiah 35 449 50 266 72 807 110 910 140 547Valuta asing/Foreign exchange 1 403 2 005 3 229 4 505 6 965
Bank Pemerintah DaerahRegional Government Banks
137 955 147 326 177 610 228 183 270 306
Rupiah 137 727 146 512 176 686 227 030 269 341Valuta asing/Foreign exchange 228 814 924 1 153 965
Bank Asing dan CampuranForeign and Joint Banks
200 547 200 235 204 730 231 207 261 833
Rupiah 96 650 104 047 106 556 118 761 130 664Valuta asing/Foreign exchange 103 897 96 188 98 174 112 446 131 169
Jumlah/Total 1 697 780 1 940 320 2 349 828 2 813 800 3 266 739Rupiah 1 417 240 1 637 322 2 011 431 2 436 213 2 806 115Valuta asing/Foreign exchange 280 540 302 998 338 397 377 587 460 624
http
://www.b
ps.g
o.id
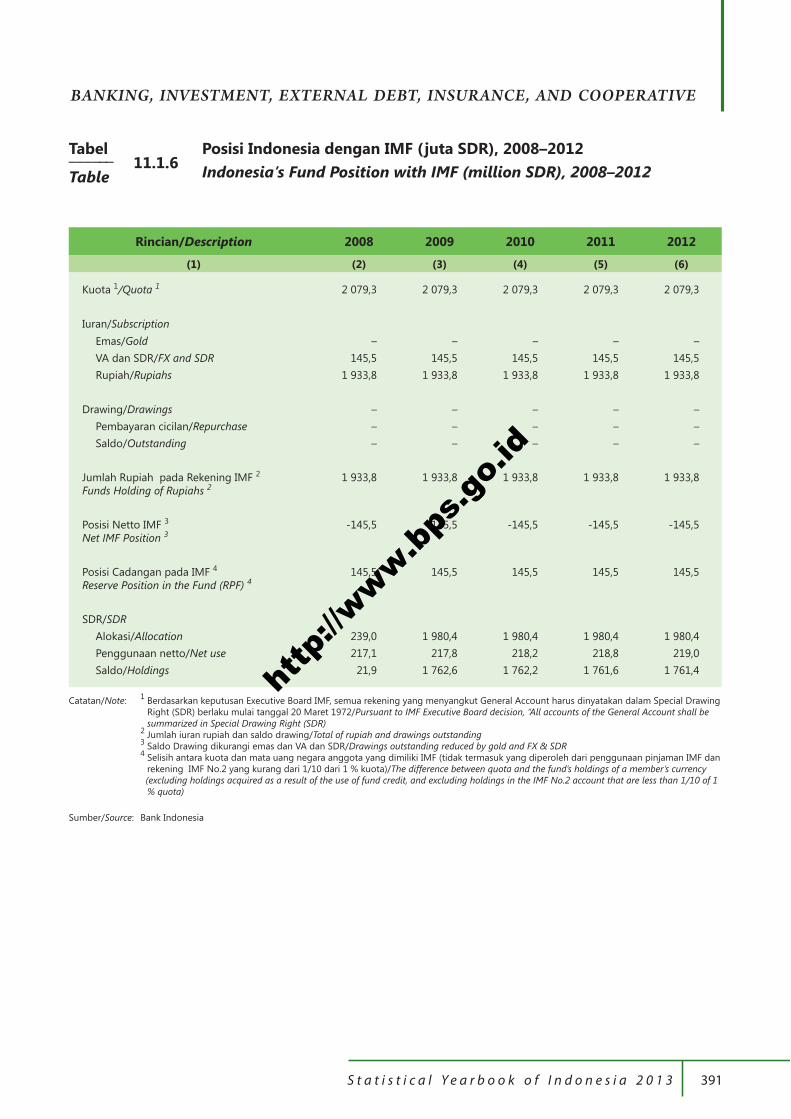
BANKING, INVESTMENT, EXTERNAL DEBT, INSURANCE, AND COOPERATIVE
S t a t i s t i c a l Y e a r b o o k o f I n d o n e s i a 2 0 1 3 391
Posisi Indonesia dengan IMF (juta SDR), 2008–2012Indonesia’s Fund Position with IMF (million SDR), 2008–2012
Rincian/Description 2008 2009 2010 2011 2012
(1) (2) (3) (4) (5) (6)
Kuota 1/Quota 1 2 079,3 2 079,3 2 079,3 2 079,3 2 079,3
Iuran/SubscriptionEmas/Gold – – – – –VA dan SDR/FX and SDR 145,5 145,5 145,5 145,5 145,5Rupiah/Rupiahs 1 933,8 1 933,8 1 933,8 1 933,8 1 933,8
Drawing/Drawings – – – – –Pembayaran cicilan/Repurchase – – – – –Saldo/Outstanding – – – – –
Jumlah Rupiah pada Rekening IMF 2
Funds Holding of Rupiahs 2 1 933,8 1 933,8 1 933,8 1 933,8 1 933,8
Posisi Netto IMF 3
Net IMF Position 3-145,5 -145,5 -145,5 -145,5 -145,5
Posisi Cadangan pada IMF 4
Reserve Position in the Fund (RPF) 4145,5 145,5 145,5 145,5 145,5
SDR/SDRAlokasi/Allocation 239,0 1 980,4 1 980,4 1 980,4 1 980,4Penggunaan netto/Net use 217,1 217,8 218,2 218,8 219,0Saldo/Holdings 21,9 1 762,6 1 762,2 1 761,6 1 761,4
Catatan/Note: 1 Berdasarkan keputusan Executive Board IMF, semua rekening yang menyangkut General Account harus dinyatakan dalam Special Drawing Right (SDR) berlaku mulai tanggal 20 Maret 1972/Pursuant to IMF Executive Board decision, “All accounts of the General Account shall be summarized in Special Drawing Right (SDR) 2 Jumlah iuran rupiah dan saldo drawing/Total of rupiah and drawings outstanding 3 Saldo Drawing dikurangi emas dan VA dan SDR/Drawings outstanding reduced by gold and FX & SDR 4 Selisih antara kuota dan mata uang negara anggota yang dimiliki IMF (tidak termasuk yang diperoleh dari penggunaan pinjaman IMF dan rekening IMF No.2 yang kurang dari 1/10 dari 1 % kuota)/The difference between quota and the fund’s holdings of a member’s currency (excluding holdings acquired as a result of the use of fund credit, and excluding holdings in the IMF No.2 account that are less than 1/10 of 1 % quota)
Sumber/Source: Bank Indonesia
Tabel ––––––
11.1.6Table
http
://www.b
ps.g
o.id

PERBANKAN, INVESTASI, UTANG LUAR NEGERI, ASURANSI, DAN KOPERASI
S t a t i s t i k I n d o n e s i a 2 0 1 3392
Posisi Pinjaman Rupiah dan Valuta Asing yang Diberikan Bank Umum dan BPR Menurut Kelompok Bank (miliar rupiah), 2008–2012Outstanding of Loans in Rupiahs and Foreign Exchange of Commercial and Rural Banks by Group of Bank (billion rupiahs), 2008–2012
Sumber/Source: Bank Indonesia
Tabel ––––––
11.1.7Table
Kelompok Bank/Group of Bank 2008 2009 2010 2011 2012
(1) (2) (3) (4) (5) (6)
Bank Persero/State Commercial Banks 458 021 533 945 630 148 761 373 942 253Dalam rupiah/In rupiahs 393 341 484 188 567 122 682 908 845 332Dalam valuta asing/In foreign currency 64 680 49 757 63 026 78 465 96 921
Bank Swasta NasionalPrivate National Banks
544 916 593 400 775 323 1 001 042 1 217 835
Dalam rupiah/In rupiahs 473 266 526 492 687 039 877 499 1 081 765Dalam valuta asing/In foreign currency 71 650 66 908 88 284 123 543 136 070
Bank Pemerintah DaerahRegional Government Banks
96 316 120 701 143 067 175 489 218 435
Dalam rupiah/In rupiahs 95 680 120 191 142 533 174 460 217 147Dalam valuta asing/In foreign currency 636 510 534 1 029 1 288
Bank Asing dan CampuranForeign Bank and Joint Banks
189 207 170 748 201 368 244 699 309 969
Dalam rupiah/In rupiahs 83 071 87 192 92 470 101 405 133 517Dalam valuta asing/In foreign currency 106 136 83 556 108 898 143 294 176 452
Bank Perkreditan Rakyat/Rural Banks 25 413 28 014 33 695 41 082 49 562Dalam rupiah/In rupiahs 25 413 28 014 33 695 41 082 49 562Dalam valuta asing/In foreign currency – – – – –
Jumlah/Total 1 313 873 1 446 808 1 783 601 2 223 685 2 738 054 Dalam rupiah/In rupiahs 1 070 771 1 246 077 1 522 859 1 877 354 2 327 323Dalam valuta asing/In foreign currency 243 102 200 731 260 742 346 331 410 731
http
://www.b
ps.g
o.id

BANKING, INVESTMENT, EXTERNAL DEBT, INSURANCE, AND COOPERATIVE
S t a t i s t i c a l Y e a r b o o k o f I n d o n e s i a 2 0 1 3 393
Posisi Kredit Perbankan 1 dalam Rupiah dan Valuta Asing Menurut Sektor Ekonomi (miliar rupiah), 2008–2012Value of Bank 1 Credits in Rupiahs and Foreign Exchange by Economic Sector (billion rupiahs), 2008–2012
Catatan/Note: r Angka diperbaiki/Revised Figures 1 Bank Umum dan Bank Perkreditan Rakyat/Commercial and Rural BanksSumber/Source: Bank Indonesia
Tabel ––––––
11.1.8Table
Sektor Ekonomi/Economic Sector 2008 2009 2010 2011 2012
(1) (2) (3) (4) (5) (6)
Pertanian/Agriculture 67 828 77 394 92 525 116 210 150 399Dalam rupiah/In rupiahs 55 493 68 183 76 537 98 141 133 141Dalam valuta asing/In foreign exchange 12 335 9 211 15 988 18 069 17 258
Perindustrian/Manufacturing 269 578 246 188 274 330 343 002 444 149
Dalam rupiah/In rupiahs 159 912 167 011 184 610 235 571 301 983Dalam valuta asing/In foreign exchange 109 666 79 177 89 720 107 431 142 166
Pertambangan/Mining 30 541 41 559 60 495 85 532 101 669
Dalam rupiah/In rupiahs 4 386 11 462 13 102 17 837 24 658Dalam valuta asing/In foreign exchange 26 155 30 097 47 393 67 695 77 011
Perdagangan/Trade 259 953 301 883 346 226 414 509 554 802Dalam rupiah/In rupiahs 232 756 280 626 316 611 383 286 507 787Dalam valuta asing/In foreign exchange 27 197 21 257 29 615 31 223 47 015
Jasa-Jasa/Services 306 141 329 302 459 113 579 143 665 425Dalam rupiah/In rupiahs 238 970 272 121 385 507 463 783 548 866Dalam valuta asing/In foreign exchange 67 171 57 181 73 606 115 360 116 559
Lainnya/Others 379 832 450 482 550 912 r 685 289 r 821 610Dalam rupiah/In rupiahs 379 254 446 674 546 492 r 678 737 r 810 890Dalam valuta asing/In foreign exchange 578 3 808 4 420 r 6 552 r 10 720
Jumlah/Total 1 313 873 1 446 808 1 783 601 r 2 223 685 r 2 738 054Dalam rupiah/In rupiahs 1 070 771 1 246 077 1 522 859 r 1 877 355 r 2 327 325Dalam valuta asing/In foreign exchange 243 102 200 731 260 742 r 346 330 r 410 729
http
://www.b
ps.g
o.id

PERBANKAN, INVESTASI, UTANG LUAR NEGERI, ASURANSI, DAN KOPERASI
S t a t i s t i k I n d o n e s i a 2 0 1 3394
Pemberian Kredit oleh Lembaga-Lembaga Keuangan Lainnya (miliar rupiah), 2008–2012Credits Granted by Other Financial Institutions (billion rupiahs), 2008–2012
Rincian/Description 2008 2009 2010 2011 2012
(1) (2) (3) (4) (5) (6)
Badan Kredit Desa Village and Rural Credit Institutions
Jumlah Badan Kredit Desa yang Aktif 1
Number of Active Credit Banks 14 219 4 171 4 009 3 615 3 615
Posisi pemberian kredit/Credits outstanding 255,5 284,8 311,9 319,3 353,9
Diberikan/Extended credits 784,9 838,0 1 057,0 1 064,1 1 009,0
Dibayar kembali/Repaid credits 764,4 808,7 1 029,9 1 056,7 974,4
Pegadaian Negara/Government PawnshopJumlah Rumah Gadai/Number of Pawnshops 684 690 869 869 870
Posisi pemberian kredit/Credits outstanding 8 090,3 12 865,3 15 021,6 23 576,3 26 387Diberikan/Extended credits 30 515,3 43 525,8 54 760,7 81 737,9 81 737,9Dibayar kembali/Repaid credits 27 551,6 39 175,8 51 120,0 73 183,2 73 183,2
Catatan/Note: 1 Dalam unit/In unitsSumber/Source: Bank Rakyat Indonesia dan Pegadaian Negara/Bank Rakyat Indonesia and Government Pawnshop
Tabel ––––––
11.1.9Table
http
://www.b
ps.g
o.id
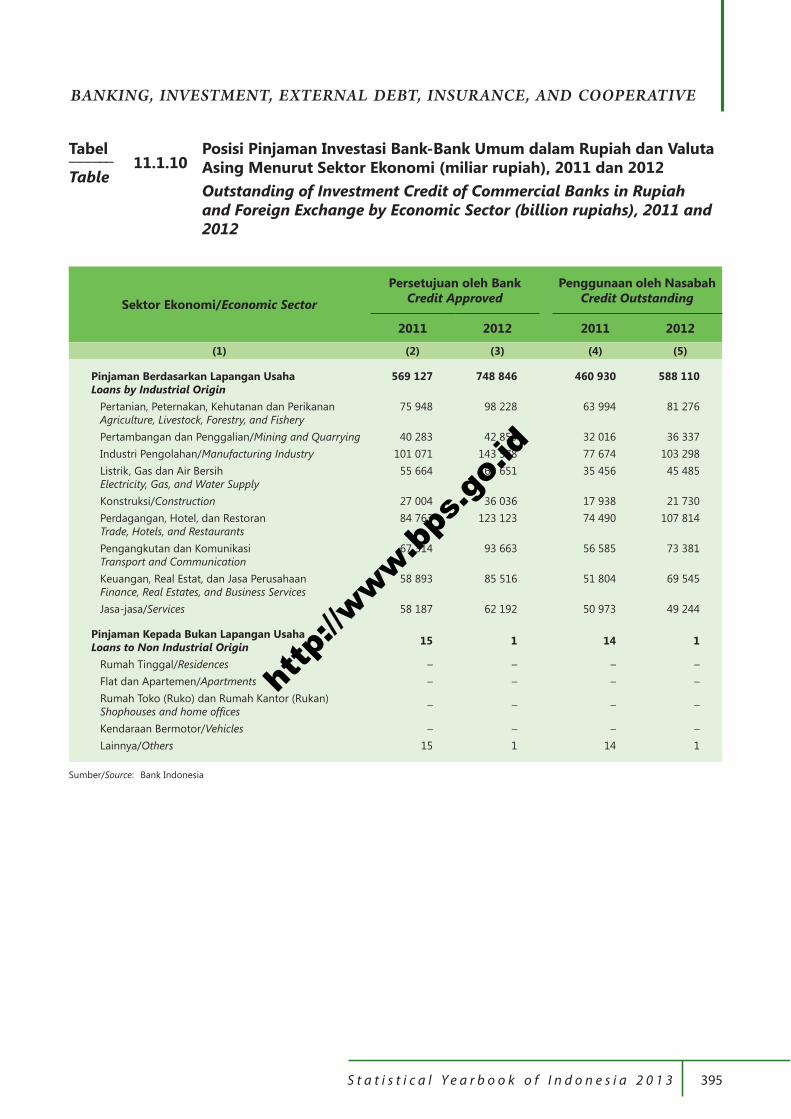
BANKING, INVESTMENT, EXTERNAL DEBT, INSURANCE, AND COOPERATIVE
S t a t i s t i c a l Y e a r b o o k o f I n d o n e s i a 2 0 1 3 395
Posisi Pinjaman Investasi Bank-Bank Umum dalam Rupiah dan Valuta Asing Menurut Sektor Ekonomi (miliar rupiah), 2011 dan 2012Outstanding of Investment Credit of Commercial Banks in Rupiah and Foreign Exchange by Economic Sector (billion rupiahs), 2011 and 2012
Sumber/Source: Bank Indonesia
Tabel ––––––
11.1.10Table
Sektor Ekonomi/Economic Sector
Persetujuan oleh BankCredit Approved
Penggunaan oleh Nasabah Credit Outstanding
2011 2012 2011 2012
(1) (2) (3) (4) (5)
Pinjaman Berdasarkan Lapangan UsahaLoans by Industrial Origin
569 127 748 846 460 930 588 110
Pertanian, Peternakan, Kehutanan dan PerikananAgriculture, Livestock, Forestry, and Fishery
75 948 98 228 63 994 81 276
Pertambangan dan Penggalian/Mining and Quarrying 40 283 42 859 32 016 36 337Industri Pengolahan/Manufacturing Industry 101 071 143 578 77 674 103 298Listrik, Gas dan Air BersihElectricity, Gas, and Water Supply
55 664 63 651 35 456 45 485
Konstruksi/Construction 27 004 36 036 17 938 21 730Perdagangan, Hotel, dan RestoranTrade, Hotels, and Restaurants
84 763 123 123 74 490 107 814
Pengangkutan dan KomunikasiTransport and Communication
67 314 93 663 56 585 73 381
Keuangan, Real Estat, dan Jasa PerusahaanFinance, Real Estates, and Business Services
58 893 85 516 51 804 69 545
Jasa-jasa/Services 58 187 62 192 50 973 49 244
Pinjaman Kepada Bukan Lapangan UsahaLoans to Non Industrial Origin 15 1 14 1
Rumah Tinggal/Residences – – – –Flat dan Apartemen/Apartments – – – –Rumah Toko (Ruko) dan Rumah Kantor (Rukan)Shophouses and home offices – – – –
Kendaraan Bermotor/Vehicles – – – –Lainnya/Others 15 1 14 1
http
://www.b
ps.g
o.id
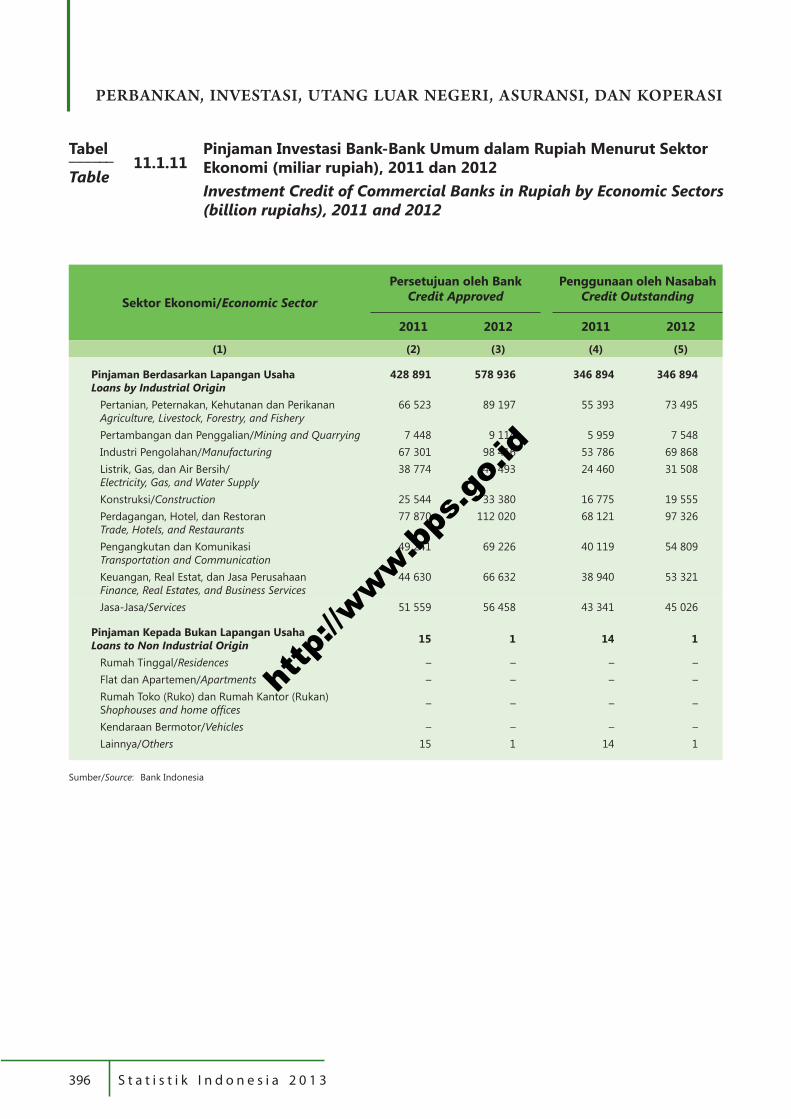
PERBANKAN, INVESTASI, UTANG LUAR NEGERI, ASURANSI, DAN KOPERASI
S t a t i s t i k I n d o n e s i a 2 0 1 3396
Pinjaman Investasi Bank-Bank Umum dalam Rupiah Menurut Sektor Ekonomi (miliar rupiah), 2011 dan 2012Investment Credit of Commercial Banks in Rupiah by Economic Sectors (billion rupiahs), 2011 and 2012
Sumber/Source: Bank Indonesia
Tabel ––––––
11.1.11Table
Sektor Ekonomi/Economic Sector
Persetujuan oleh BankCredit Approved
Penggunaan oleh Nasabah Credit Outstanding
2011 2012 2011 2012
(1) (2) (3) (4) (5)
Pinjaman Berdasarkan Lapangan UsahaLoans by Industrial Origin
428 891 578 936 346 894 346 894
Pertanian, Peternakan, Kehutanan dan PerikananAgriculture, Livestock, Forestry, and Fishery
66 523 89 197 55 393 73 495
Pertambangan dan Penggalian/Mining and Quarrying 7 448 9 114 5 959 7 548Industri Pengolahan/Manufacturing 67 301 98 416 53 786 69 868Listrik, Gas, dan Air Bersih/Electricity, Gas, and Water Supply
38 774 44 493 24 460 31 508
Konstruksi/Construction 25 544 33 380 16 775 19 555Perdagangan, Hotel, dan RestoranTrade, Hotels, and Restaurants
77 870 112 020 68 121 97 326
Pengangkutan dan KomunikasiTransportation and Communication
49 241 69 226 40 119 54 809
Keuangan, Real Estat, dan Jasa PerusahaanFinance, Real Estates, and Business Services
44 630 66 632 38 940 53 321
Jasa-Jasa/Services 51 559 56 458 43 341 45 026
Pinjaman Kepada Bukan Lapangan UsahaLoans to Non Industrial Origin 15 1 14 1
Rumah Tinggal/Residences – – – –Flat dan Apartemen/Apartments – – – –Rumah Toko (Ruko) dan Rumah Kantor (Rukan)Shophouses and home offices – – – –
Kendaraan Bermotor/Vehicles – – – –Lainnya/Others 15 1 14 1
http
://www.b
ps.g
o.id
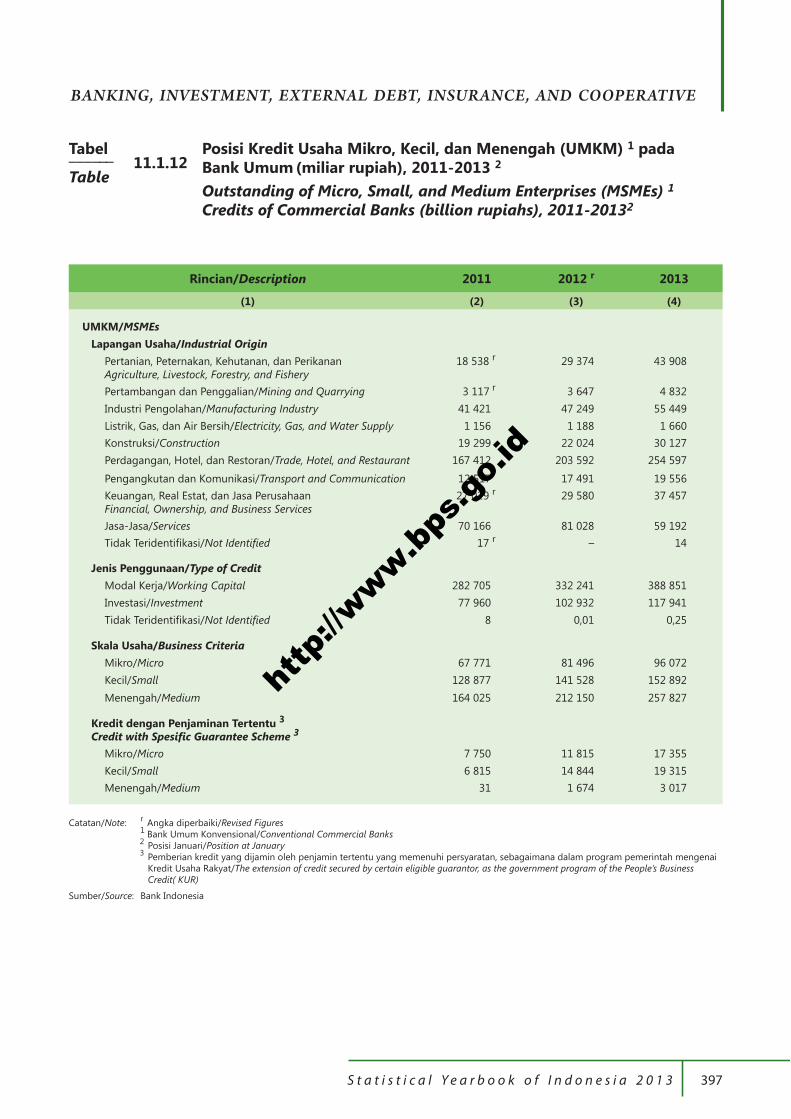
BANKING, INVESTMENT, EXTERNAL DEBT, INSURANCE, AND COOPERATIVE
S t a t i s t i c a l Y e a r b o o k o f I n d o n e s i a 2 0 1 3 397
Posisi Kredit Usaha Mikro, Kecil, dan Menengah (UMKM) 1 pada Bank Umum (miliar rupiah), 2011-2013 2
Outstanding of Micro, Small, and Medium Enterprises (MSMEs) 1 Credits of Commercial Banks (billion rupiahs), 2011-20132
Catatan/Note: r Angka diperbaiki/Revised Figures 1 Bank Umum Konvensional/Conventional Commercial Banks
2 Posisi Januari/Position at January3 Pemberian kredit yang dijamin oleh penjamin tertentu yang memenuhi persyaratan, sebagaimana dalam program pemerintah mengenai
Kredit Usaha Rakyat/The extension of credit secured by certain eligible guarantor, as the government program of the People’s Business Credit( KUR)
Sumber/Source: Bank Indonesia
Tabel ––––––
11.1.12Table
Rincian/Description 2011 2012 r 2013
(1) (2) (3) (4)
UMKM/MSMEsLapangan Usaha/Industrial Origin
Pertanian, Peternakan, Kehutanan, dan PerikananAgriculture, Livestock, Forestry, and Fishery
18 538 r 29 374 43 908
Pertambangan dan Penggalian/Mining and Quarrying 3 117 r 3 647 4 832Industri Pengolahan/Manufacturing Industry 41 421 47 249 55 449Listrik, Gas, dan Air Bersih/Electricity, Gas, and Water Supply 1 156 1 188 1 660Konstruksi/Construction 19 299 22 024 30 127Perdagangan, Hotel, dan Restoran/Trade, Hotel, and Restaurant 167 412 203 592 254 597
Pengangkutan dan Komunikasi/Transport and Communication 12 517 17 491 19 556Keuangan, Real Estat, dan Jasa PerusahaanFinancial, Ownership, and Business Services
27 029 r 29 580 37 457
Jasa-Jasa/Services 70 166 81 028 59 192Tidak Teridentifikasi/Not Identified 17 r – 14
Jenis Penggunaan/Type of Credit
Modal Kerja/Working Capital 282 705 332 241 388 851Investasi/Investment 77 960 102 932 117 941Tidak Teridentifikasi/Not Identified 8 0,01 0,25
Skala Usaha/Business Criteria
Mikro/Micro 67 771 81 496 96 072Kecil/Small 128 877 141 528 152 892Menengah/Medium 164 025 212 150 257 827
Kredit dengan Penjaminan Tertentu 3Credit with Spesific Guarantee Scheme 3
Mikro/Micro 7 750 11 815 17 355Kecil/Small 6 815 14 844 19 315Menengah/Medium 31 1 674 3 017
http
://www.b
ps.g
o.id

PERBANKAN, INVESTASI, UTANG LUAR NEGERI, ASURANSI, DAN KOPERASI
S t a t i s t i k I n d o n e s i a 2 0 1 3398
Posisi Simpanan Berjangka Rupiah pada Bank Umum dan BPR Menurut Golongan Pemilik (miliar rupiah), 2010-2012Outstanding Time Deposits in Rupiah of Commercial and Rural Banks by Ownership (billion rupiahs), 2010-2012
Catatan/Note: r Angka diperbaiki/Revised figures
Sumber/Source: Bank Indonesia
Tabel ––––––
11.1.13Table
Rincian/Description 2010 2011 2012
(1) (2) (3) (4)
Lembaga keuangan lainnya/Other financial corporation: 116 971 143 400 166 433BUMN atau pemerintah campuran/Public owned 54 257 59 148 69 241
Perusahaan asuransi/Insurace companies 44 930 44 016 52 724Lembaga pembiayaan/Finance companies 2 062 1 067 1 248Perusahaan reksadana dan sekuritas/Mutual funds and securities
847 1 171 2 514
Lainnya/Others 6 418 12 894 12 755Swasta/Private owned 62 714 84 252 97 192
Perusahaan asuransi/Insurace companies 19 404 28 147 32 099Lembaga pembiayaan dan modal ventura/Finance companies and venture capital
3 006 3 158 5 437
Dana pensiun/Pension funds 22 656 25 180 28 123Perusahaan reksadana dan sekuritas/Mutual funds and securities
12 884 18 139 18 462
Lainnya/Others 4 764 9 628 13 071Pemerintah daerah/State and local governments 16 509 20 575 24 185
Provinsi/Provinces 8 138 8 706 7 260Kotamadya/kabupaten/Municipalities 8 371 11 869 16 925
Badan usaha bukan keuangan milik negara/Non-Financial Enterprise Owned by Government/State
38 526 26 029 28 758
BUMN/Government Enterprises 36 937 22 748 25 530BUMD/State Enterprises 1 589 3 281 3 228
Badan usaha bukan keuangan milik swasta/Non-Financial Enterprise Owned by Private
194 337 237 979 260 674
Sektor swasta lainnya/Other private sectors 558 112 641 463 689 833Yayasan, badan sosial, organisasi kemasyarakatan/Social foundations
25 084 25 396 28 393
Koperasi/Cooperatives 1 147 870 951Perseorangan/Individuals 529 295 r 603 031 648 504Lainnya/Others 2 585 r 12 166 11 985
Jumlah/Total 924 455 1 069 446 1 169 883
http
://www.b
ps.g
o.id

BANKING, INVESTMENT, EXTERNAL DEBT, INSURANCE, AND COOPERATIVE
S t a t i s t i c a l Y e a r b o o k o f I n d o n e s i a 2 0 1 3 399
Posisi Tabungan pada Bank Umum Menurut Jenis Tabungan 1 (miliar rupiah), 2008–2012 Outstanding Saving Deposits of Commercial Banks by Type of Deposit 1 (billion rupiahs), 2008–2012
Jenis Tabungan/Type of Deposit 2008 2009 2010 2011 2012
(1) (2) (3) (4) (5) (6)
Tabungan yang Penarikannya dapat Dilakukan Sewaktu-Waktu/Savings Deposits that can be Withdrawn at Any Time
Jumlah rekening/Number of accounts (000) 71 544 75 518 89 193 94 876 108 421Posisi/Outstanding 480 636 580 423 679 750 819 242 969 089
Tabungan Berjangka/Savings DepositsJumlah rekening/Number of accounts (000) 1 785 2 376 2 549 3 223 3 848Posisi/Outstanding 13 386 17 695 23 277 31 902 42 082
Tabungan Lainnya/Other Savings DepositsJumlah rekening/Number of accounts (000) 527 497 1 097 2 172 2 381Posisi/Outstanding 1 958 12 585 25 874 42 555 60 314
Jumlah/TotalJumlah rekening/Number of accounts (000) 73 857 78 391 92 838 100 271 114 650Posisi/Outstanding 495 980 610 703 728 902 893 699 1 071 485
Catatan/Note: 1 Posisi Tabungan dalam Rupiah dan Valuta Asing, tidak termasuk tabungan milik pemerintah pusat dan bukan penduduk/Outstanding saving deposits in rupiah and foreign currency, not included central government and non resident depositsSumber/Source: Bank Indonesia
Tabel ––––––
11.1.14Table
http
://www.b
ps.g
o.id
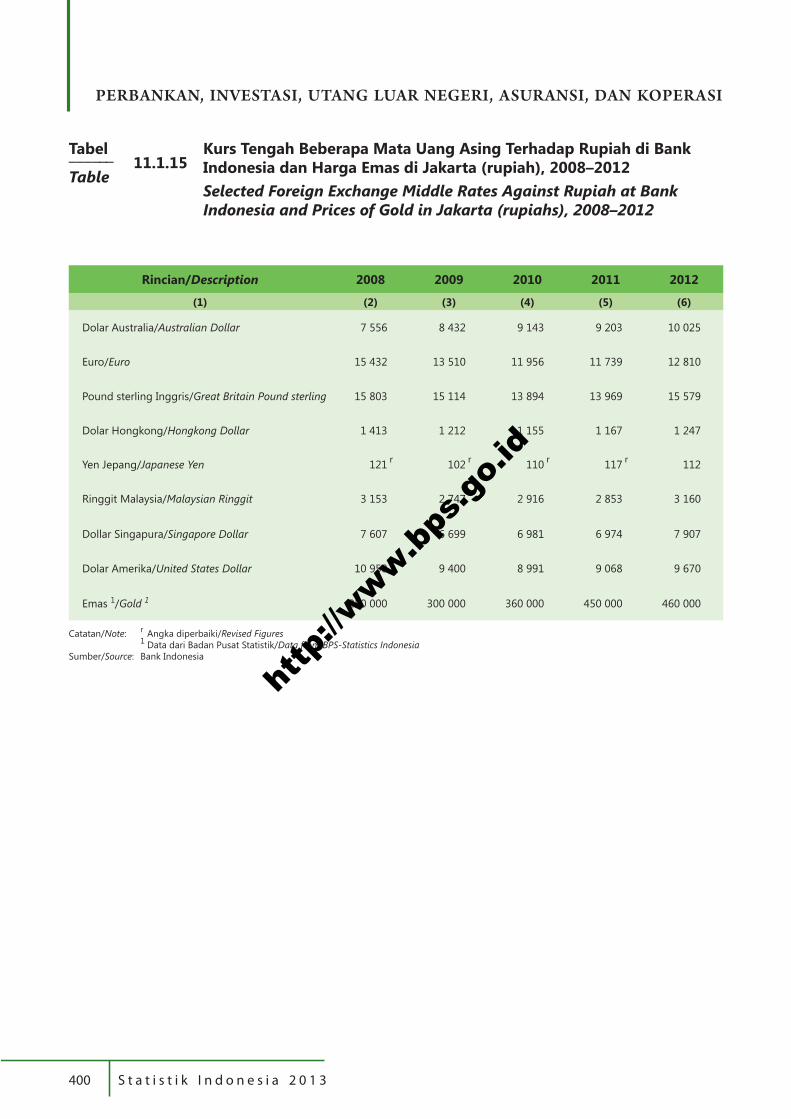
PERBANKAN, INVESTASI, UTANG LUAR NEGERI, ASURANSI, DAN KOPERASI
S t a t i s t i k I n d o n e s i a 2 0 1 3400
Kurs Tengah Beberapa Mata Uang Asing Terhadap Rupiah di BankIndonesia dan Harga Emas di Jakarta (rupiah), 2008–2012Selected Foreign Exchange Middle Rates Against Rupiah at Bank Indonesia and Prices of Gold in Jakarta (rupiahs), 2008–2012
Rincian/Description 2008 2009 2010 2011 2012
(1) (2) (3) (4) (5) (6)
Dolar Australia/Australian Dollar 7 556 8 432 9 143 9 203 10 025
Euro/Euro 15 432 13 510 11 956 11 739 12 810
Pound sterling Inggris/Great Britain Pound sterling 15 803 15 114 13 894 13 969 15 579
Dolar Hongkong/Hongkong Dollar 1 413 1 212 1 155 1 167 1 247
Yen Jepang/Japanese Yen 121 r 102 r 110 r 117 r 112
Ringgit Malaysia/Malaysian Ringgit 3 153 2 747 2 916 2 853 3 160
Dollar Singapura/Singapore Dollar 7 607 6 699 6 981 6 974 7 907
Dolar Amerika/United States Dollar 10 950 9 400 8 991 9 068 9 670
Emas 1/Gold 1 250 000 300 000 360 000 450 000 460 000 Catatan/Note: r Angka diperbaiki/Revised Figures 1 Data dari Badan Pusat Statistik/Data from BPS-Statistics IndonesiaSumber/Source: Bank Indonesia
Tabel ––––––
11.1.15Table
http
://www.b
ps.g
o.id
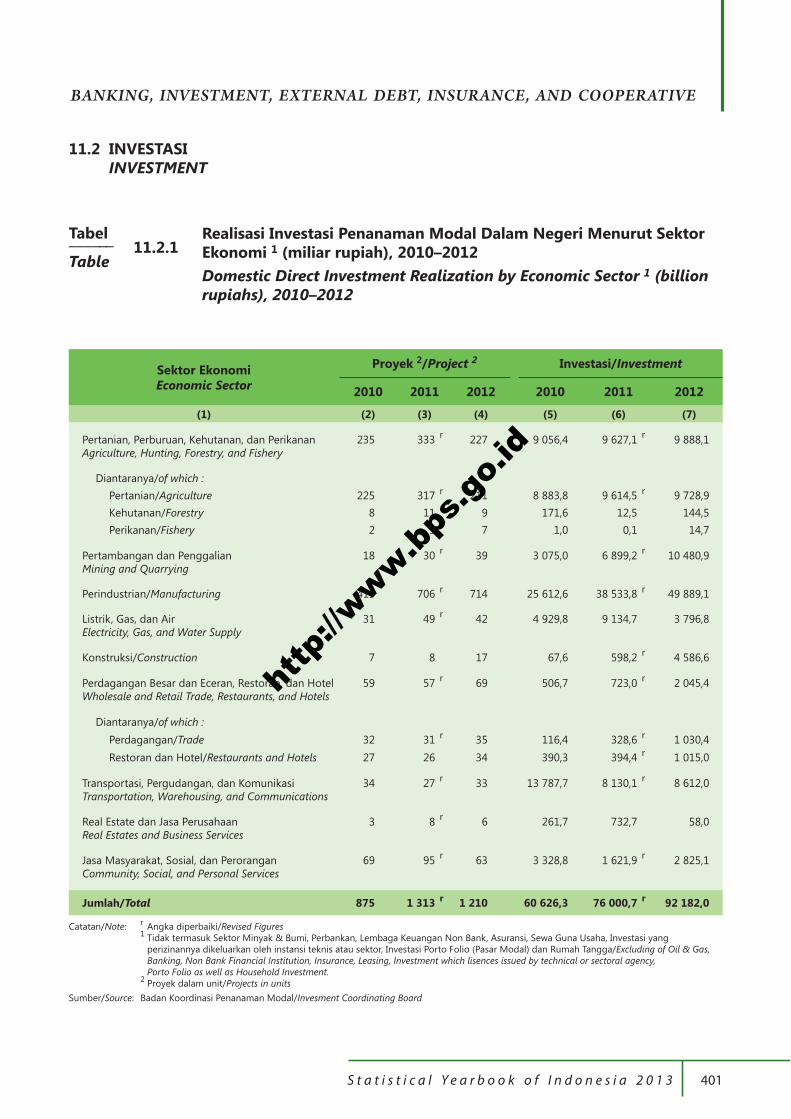
BANKING, INVESTMENT, EXTERNAL DEBT, INSURANCE, AND COOPERATIVE
S t a t i s t i c a l Y e a r b o o k o f I n d o n e s i a 2 0 1 3 401
Realisasi Investasi Penanaman Modal Dalam Negeri Menurut Sektor Ekonomi 1 (miliar rupiah), 2010–2012Domestic Direct Investment Realization by Economic Sector 1 (billion rupiahs), 2010–2012
11.2 INVESTASI INVESTMENT
Sektor EkonomiEconomic Sector
Proyek 2/Project 2 Investasi/Investment
2010 2011 2012 2010 2011 2012
(1) (2) (3) (4) (5) (6) (7)
Pertanian, Perburuan, Kehutanan, dan PerikananAgriculture, Hunting, Forestry, and Fishery
235 333 r 227 9 056,4 9 627,1 r 9 888,1
Diantaranya/of which :
Pertanian/Agriculture 225 317 r 211 8 883,8 9 614,5 r 9 728,9Kehutanan/Forestry 8 11 9 171,6 12,5 144,5Perikanan/Fishery 2 5 7 1,0 0,1 14,7
Pertambangan dan PenggalianMining and Quarrying
18 30 r 39 3 075,0 6 899,2 r 10 480,9
Perindustrian/Manufacturing 419 706 r 714 25 612,6 38 533,8 r 49 889,1
Listrik, Gas, dan AirElectricity, Gas, and Water Supply
31 49 r 42 4 929,8 9 134,7 3 796,8
Konstruksi/Construction 7 8 17 67,6 598,2 r 4 586,6
Perdagangan Besar dan Eceran, Restoran, dan HotelWholesale and Retail Trade, Restaurants, and Hotels
59 57 r 69 506,7 723,0 r 2 045,4
Diantaranya/of which :
Perdagangan/Trade 32 31 r 35 116,4 328,6 r 1 030,4Restoran dan Hotel/Restaurants and Hotels 27 26 34 390,3 394,4 r 1 015,0
Transportasi, Pergudangan, dan KomunikasiTransportation, Warehousing, and Communications
34 27 r 33 13 787,7 8 130,1 r 8 612,0
Real Estate dan Jasa PerusahaanReal Estates and Business Services
3 8 r 6 261,7 732,7 58,0
Jasa Masyarakat, Sosial, dan PeroranganCommunity, Social, and Personal Services
69 95 r 63 3 328,8 1 621,9 r 2 825,1
Jumlah/Total 875 1 313 r 1 210 60 626,3 76 000,7 r 92 182,0
Catatan/Note: r Angka diperbaiki/Revised Figures 1 Tidak termasuk Sektor Minyak & Bumi, Perbankan, Lembaga Keuangan Non Bank, Asuransi, Sewa Guna Usaha, Investasi yang perizinannya dikeluarkan oleh instansi teknis atau sektor, Investasi Porto Folio (Pasar Modal) dan Rumah Tangga/Excluding of Oil & Gas, Banking, Non Bank Financial Institution, Insurance, Leasing, Investment which lisences issued by technical or sectoral agency, Porto Folio as well as Household Investment. 2 Proyek dalam unit/Projects in unitsSumber/Source: Badan Koordinasi Penanaman Modal/Invesment Coordinating Board
Tabel ––––––
11.2.1Table
http
://www.b
ps.g
o.id

PERBANKAN, INVESTASI, UTANG LUAR NEGERI, ASURANSI, DAN KOPERASI
S t a t i s t i k I n d o n e s i a 2 0 1 3402
Realisasi Investasi Penanaman Modal Dalam Negeri Menurut Provinsi 1 (miliar rupiah), 2010–2012Domestic Direct Investment Realization by Province 1 (billion rupiahs), 2010–2012
ProvinsiProvince
Proyek 2/Project 2 Investasi/Investment
2010 2011 2012 2010 2011 2012
(1) (2) (3) (4) (5) (6) (7) Aceh 5 16 r 11 40,9 259,4 60,2Sumatera Utara 41 79 r 8 662,7 1 673,0 2 550,3Sumatera Barat 11 24 r 22 73,8 1 026,2 r 885,3Riau 52 56 51 1 037,1 7 462,6 5 450,3Kepulauan Riau 28 50 r 33 166,9 1 370,4 r 43,5Jambi 17 30 24 223,3 2 134,9 r 1 445,7Sumatera Selatan 29 48 r 32 1 738,4 1 068,9 2 930,6Kepulauan Bangka Belitung 5 7 4 0,4 514,4 533,5Bengkulu 2 2 1 8,5 – 52,6Lampung 32 58 r 48 272,3 824,4 r 304,2
DKI Jakarta 86 84 r 72 4 598,5 9 256,4 8 540,1Jawa Barat 103 170 r 125 15 799,8 11 194,3 11 384,0Banten 76 83 r 66 5 852,5 4 298,6 5 117,5Jawa Tengah 40 100 r 78 795,4 2 737,8 r 5 797,1DI Yogyakarta 3 7 r 6 10,0 1,6 334,0Jawa Timur 89 157 r 289 8 084,1 9 687,5 21 520,3
Bali 19 18 r 15 313,4 313,4 r 3 108,0Nusa Tenggara Barat 16 11 r 11 1 805,8 42,3 45,4Nusa Tenggara Timur 4 3 3 0,1 1,0 14,4
Kalimantan Barat 43 56 r 53 1 171,7 1 404,0 2 811,0Kalimantan Tengah 34 55 r 46 3 507,7 3 376,0 4 529,6Kalimantan Selatan 26 39 r 40 2 015,0 2 118,3 r 3 509,8Kalimantan Timur 46 48 r 44 7 881,3 6 569,1 5 889,3
Sulawesi Utara 13 11 8 95,8 331,6 678,5Gorontalo 3 3 r 2 16,7 11,8 164,9Sulawesi Tengah 7 12 r 2 153,6 2 620,2 602,8Sulawesi Selatan 23 42 r 34 3 212,3 3 986,3 r 2 318,9Sulawesi Barat 7 6 r 7 840,0 218,6 r 228,6Sulawesi Tenggara 5 8 r 6 19,2 59,0 r 907,3
Maluku 1 2 r 2 – 0,1 3,4Maluku Utara 1 2 r 2 – 13,5 320,5Papua 7 21 r 7 178,0 1 378,9 r 54,7Papua Barat 1 5 r 5 51,3 47,2 r 45,8
Indonesia 875 1 313 r 1 210 60 626,3 76 000,7 r 92 182,0
Catatan/Note: r Angka diperbaiki/Revised Figures 1 Tidak termasuk Sektor Minyak & Bumi, Perbankan, Lembaga Keuangan Non Bank, Asuransi, Sewa Guna Usaha, Investasi yang perizinannya dikeluarkan oleh instansi teknis atau sektor, Investasi Porto Folio (Pasar Modal) dan Rumah Tangga/Excluding of Oil & Gas, Banking, Non Bank Financial Institution, Insurance, Leasing, Investment which lisences issued by technical or sectoral agency, Porto Folio as well as Household Investment. 2 Proyek dalam unit/Projects in unitsSumber/Source: Badan Koordinasi Penanaman Modal/Invesment Coordinating Board
Tabel ––––––
11.2.2Table
http
://www.b
ps.g
o.id
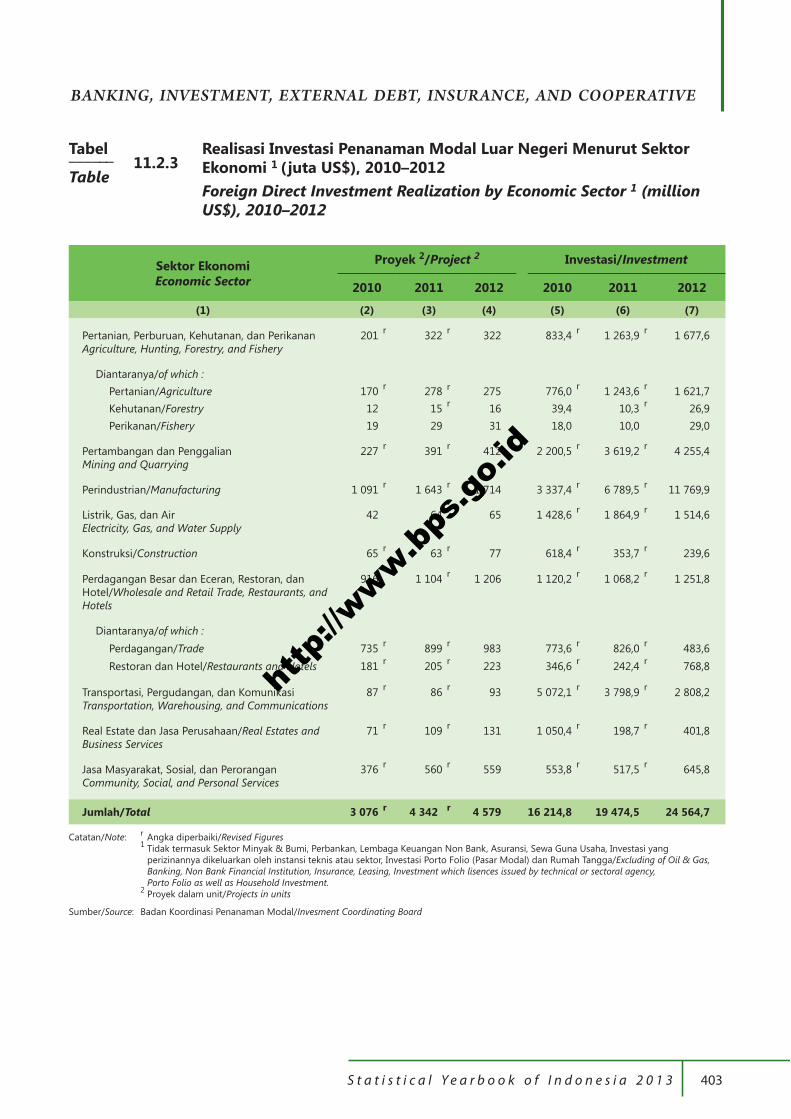
BANKING, INVESTMENT, EXTERNAL DEBT, INSURANCE, AND COOPERATIVE
S t a t i s t i c a l Y e a r b o o k o f I n d o n e s i a 2 0 1 3 403
Realisasi Investasi Penanaman Modal Luar Negeri Menurut Sektor Ekonomi 1 ( juta US$), 2010–2012Foreign Direct Investment Realization by Economic Sector 1 (million US$), 2010–2012
Sektor EkonomiEconomic Sector
Proyek 2/Project 2 Investasi/Investment
2010 2011 2012 2010 2011 2012
(1) (2) (3) (4) (5) (6) (7)
Pertanian, Perburuan, Kehutanan, dan PerikananAgriculture, Hunting, Forestry, and Fishery
201 r 322 r 322 833,4 r 1 263,9 r 1 677,6
Diantaranya/of which :
Pertanian/Agriculture 170 r 278 r 275 776,0 r 1 243,6 r 1 621,7Kehutanan/Forestry 12 15 r 16 39,4 10,3 r 26,9Perikanan/Fishery 19 29 31 18,0 10,0 29,0
Pertambangan dan PenggalianMining and Quarrying
227 r 391 r 412 2 200,5 r 3 619,2 r 4 255,4
Perindustrian/Manufacturing 1 091 r 1 643 r 1 714 3 337,4 r 6 789,5 r 11 769,9
Listrik, Gas, dan AirElectricity, Gas, and Water Supply
42 64 r 65 1 428,6 r 1 864,9 r 1 514,6
Konstruksi/Construction 65 r 63 r 77 618,4 r 353,7 r 239,6
Perdagangan Besar dan Eceran, Restoran, dan Hotel/Wholesale and Retail Trade, Restaurants, and Hotels
916 1 104 r 1 206 1 120,2 r 1 068,2 r 1 251,8
Diantaranya/of which :
Perdagangan/Trade 735 r 899 r 983 773,6 r 826,0 r 483,6Restoran dan Hotel/Restaurants and Hotels 181 r 205 r 223 346,6 r 242,4 r 768,8
Transportasi, Pergudangan, dan KomunikasiTransportation, Warehousing, and Communications
87 r 86 r 93 5 072,1 r 3 798,9 r 2 808,2
Real Estate dan Jasa Perusahaan/Real Estates and Business Services
71 r 109 r 131 1 050,4 r 198,7 r 401,8
Jasa Masyarakat, Sosial, dan PeroranganCommunity, Social, and Personal Services
376 r 560 r 559 553,8 r 517,5 r 645,8
Jumlah/Total 3 076 r 4 342 r 4 579 16 214,8 19 474,5 24 564,7
Catatan/Note: r Angka diperbaiki/Revised Figures 1 Tidak termasuk Sektor Minyak & Bumi, Perbankan, Lembaga Keuangan Non Bank, Asuransi, Sewa Guna Usaha, Investasi yang perizinannya dikeluarkan oleh instansi teknis atau sektor, Investasi Porto Folio (Pasar Modal) dan Rumah Tangga/Excluding of Oil & Gas, Banking, Non Bank Financial Institution, Insurance, Leasing, Investment which lisences issued by technical or sectoral agency, Porto Folio as well as Household Investment. 2 Proyek dalam unit/Projects in units
Sumber/Source: Badan Koordinasi Penanaman Modal/Invesment Coordinating Board
Tabel ––––––
11.2.3Table
http
://www.b
ps.g
o.id
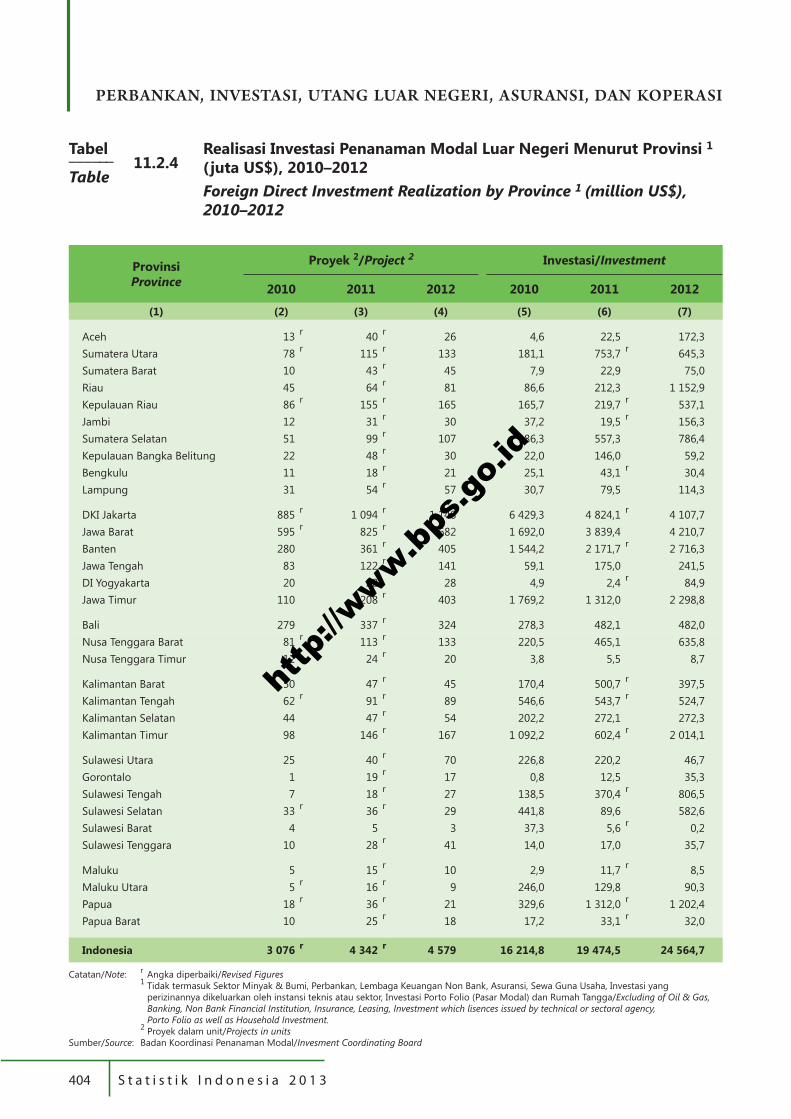
PERBANKAN, INVESTASI, UTANG LUAR NEGERI, ASURANSI, DAN KOPERASI
S t a t i s t i k I n d o n e s i a 2 0 1 3404
Realisasi Investasi Penanaman Modal Luar Negeri Menurut Provinsi 1
( juta US$), 2010–2012Foreign Direct Investment Realization by Province 1 (million US$), 2010–2012
ProvinsiProvince
Proyek 2/Project 2 Investasi/Investment
2010 2011 2012 2010 2011 2012
(1) (2) (3) (4) (5) (6) (7) Aceh 13 r 40 r 26 4,6 22,5 172,3Sumatera Utara 78 r 115 r 133 181,1 753,7 r 645,3Sumatera Barat 10 43 r 45 7,9 22,9 75,0Riau 45 64 r 81 86,6 212,3 1 152,9Kepulauan Riau 86 r 155 r 165 165,7 219,7 r 537,1Jambi 12 31 r 30 37,2 19,5 r 156,3Sumatera Selatan 51 99 r 107 186,3 557,3 786,4Kepulauan Bangka Belitung 22 48 r 30 22,0 146,0 59,2Bengkulu 11 18 r 21 25,1 43,1 r 30,4Lampung 31 54 r 57 30,7 79,5 114,3
DKI Jakarta 885 r 1 094 r 1 148 6 429,3 4 824,1 r 4 107,7Jawa Barat 595 r 825 r 682 1 692,0 3 839,4 4 210,7Banten 280 361 r 405 1 544,2 2 171,7 r 2 716,3Jawa Tengah 83 122 r 141 59,1 175,0 241,5DI Yogyakarta 20 22 28 4,9 2,4 r 84,9Jawa Timur 110 208 r 403 1 769,2 1 312,0 2 298,8
Bali 279 337 r 324 278,3 482,1 482,0Nusa Tenggara Barat 81 r 113 r 133 220,5 465,1 635,8Nusa Tenggara Timur 12 24 r 20 3,8 5,5 8,7
Kalimantan Barat 50 47 r 45 170,4 500,7 r 397,5Kalimantan Tengah 62 r 91 r 89 546,6 543,7 r 524,7Kalimantan Selatan 44 47 r 54 202,2 272,1 272,3Kalimantan Timur 98 146 r 167 1 092,2 602,4 r 2 014,1
Sulawesi Utara 25 40 r 70 226,8 220,2 46,7Gorontalo 1 19 r 17 0,8 12,5 35,3Sulawesi Tengah 7 18 r 27 138,5 370,4 r 806,5Sulawesi Selatan 33 r 36 r 29 441,8 89,6 582,6Sulawesi Barat 4 5 3 37,3 5,6 r 0,2Sulawesi Tenggara 10 28 r 41 14,0 17,0 35,7
Maluku 5 15 r 10 2,9 11,7 r 8,5Maluku Utara 5 r 16 r 9 246,0 129,8 90,3Papua 18 r 36 r 21 329,6 1 312,0 r 1 202,4Papua Barat 10 25 r 18 17,2 33,1 r 32,0
Indonesia 3 076 r 4 342 r 4 579 16 214,8 19 474,5 24 564,7
Catatan/Note: r Angka diperbaiki/Revised Figures 1 Tidak termasuk Sektor Minyak & Bumi, Perbankan, Lembaga Keuangan Non Bank, Asuransi, Sewa Guna Usaha, Investasi yang perizinannya dikeluarkan oleh instansi teknis atau sektor, Investasi Porto Folio (Pasar Modal) dan Rumah Tangga/Excluding of Oil & Gas, Banking, Non Bank Financial Institution, Insurance, Leasing, Investment which lisences issued by technical or sectoral agency, Porto Folio as well as Household Investment. 2 Proyek dalam unit/Projects in unitsSumber/Source: Badan Koordinasi Penanaman Modal/Invesment Coordinating Board
Tabel ––––––
11.2.4Table
http
://www.b
ps.g
o.id
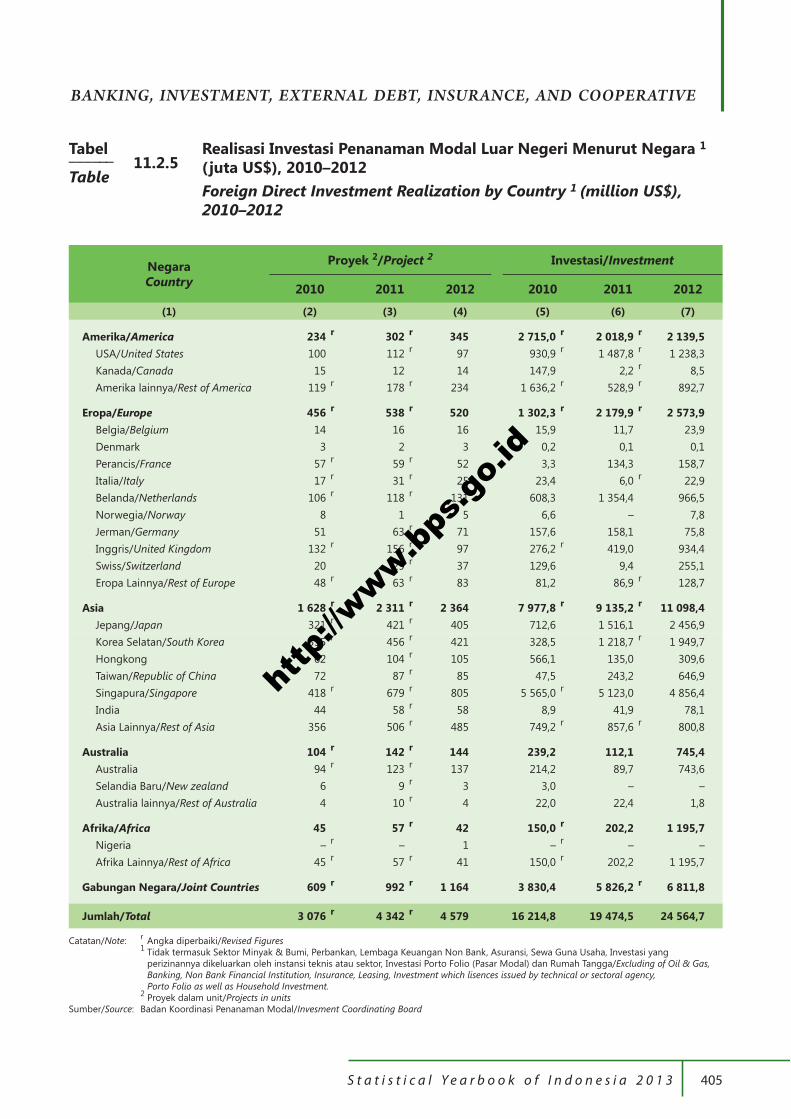
BANKING, INVESTMENT, EXTERNAL DEBT, INSURANCE, AND COOPERATIVE
S t a t i s t i c a l Y e a r b o o k o f I n d o n e s i a 2 0 1 3 405
Realisasi Investasi Penanaman Modal Luar Negeri Menurut Negara 1
( juta US$), 2010–2012Foreign Direct Investment Realization by Country 1 (million US$), 2010–2012
NegaraCountry
Proyek 2/Project 2 Investasi/Investment
2010 2011 2012 2010 2011 2012
(1) (2) (3) (4) (5) (6) (7) Amerika/America 234 r 302 r 345 2 715,0 r 2 018,9 r 2 139,5
USA/United States 100 112 r 97 930,9 r 1 487,8 r 1 238,3Kanada/Canada 15 12 14 147,9 2,2 r 8,5Amerika lainnya/Rest of America 119 r 178 r 234 1 636,2 r 528,9 r 892,7
Eropa/Europe 456 r 538 r 520 1 302,3 r 2 179,9 r 2 573,9
Belgia/Belgium 14 16 16 15,9 11,7 23,9Denmark 3 2 3 0,2 0,1 0,1Perancis/France 57 r 59 r 52 3,3 134,3 158,7Italia/Italy 17 r 31 r 25 23,4 6,0 r 22,9Belanda/Netherlands 106 r 118 r 131 608,3 1 354,4 966,5Norwegia/Norway 8 1 5 6,6 – 7,8Jerman/Germany 51 63 r 71 157,6 158,1 75,8Inggris/United Kingdom 132 r 156 r 97 276,2 r 419,0 934,4Swiss/Switzerland 20 29 r 37 129,6 9,4 255,1Eropa Lainnya/Rest of Europe 48 r 63 r 83 81,2 86,9 r 128,7
Asia 1 628 r 2 311 r 2 364 7 977,8 r 9 135,2 r 11 098,4
Jepang/Japan 321 r 421 r 405 712,6 1 516,1 2 456,9Korea Selatan/South Korea 355 r 456 r 421 328,5 1 218,7 r 1 949,7Hongkong 62 104 r 105 566,1 135,0 309,6Taiwan/Republic of China 72 87 r 85 47,5 243,2 646,9Singapura/Singapore 418 r 679 r 805 5 565,0 r 5 123,0 4 856,4India 44 58 r 58 8,9 41,9 78,1Asia Lainnya/Rest of Asia 356 506 r 485 749,2 r 857,6 r 800,8
Australia 104 r 142 r 144 239,2 112,1 745,4Australia 94 r 123 r 137 214,2 89,7 743,6Selandia Baru/New zealand 6 9 r 3 3,0 – –Australia lainnya/Rest of Australia 4 10 r 4 22,0 22,4 1,8
Afrika/Africa 45 57 r 42 150,0 r 202,2 1 195,7
Nigeria – r – 1 – r – –Afrika Lainnya/Rest of Africa 45 r 57 r 41 150,0 r 202,2 1 195,7
Gabungan Negara/Joint Countries 609 r 992 r 1 164 3 830,4 5 826,2 r 6 811,8
Jumlah/Total 3 076 r 4 342 r 4 579 16 214,8 19 474,5 24 564,7
Catatan/Note: r Angka diperbaiki/Revised Figures 1 Tidak termasuk Sektor Minyak & Bumi, Perbankan, Lembaga Keuangan Non Bank, Asuransi, Sewa Guna Usaha, Investasi yang perizinannya dikeluarkan oleh instansi teknis atau sektor, Investasi Porto Folio (Pasar Modal) dan Rumah Tangga/Excluding of Oil & Gas, Banking, Non Bank Financial Institution, Insurance, Leasing, Investment which lisences issued by technical or sectoral agency, Porto Folio as well as Household Investment. 2 Proyek dalam unit/Projects in unitsSumber/Source: Badan Koordinasi Penanaman Modal/Invesment Coordinating Board
Tabel ––––––
11.2.5Table
http
://www.b
ps.g
o.id
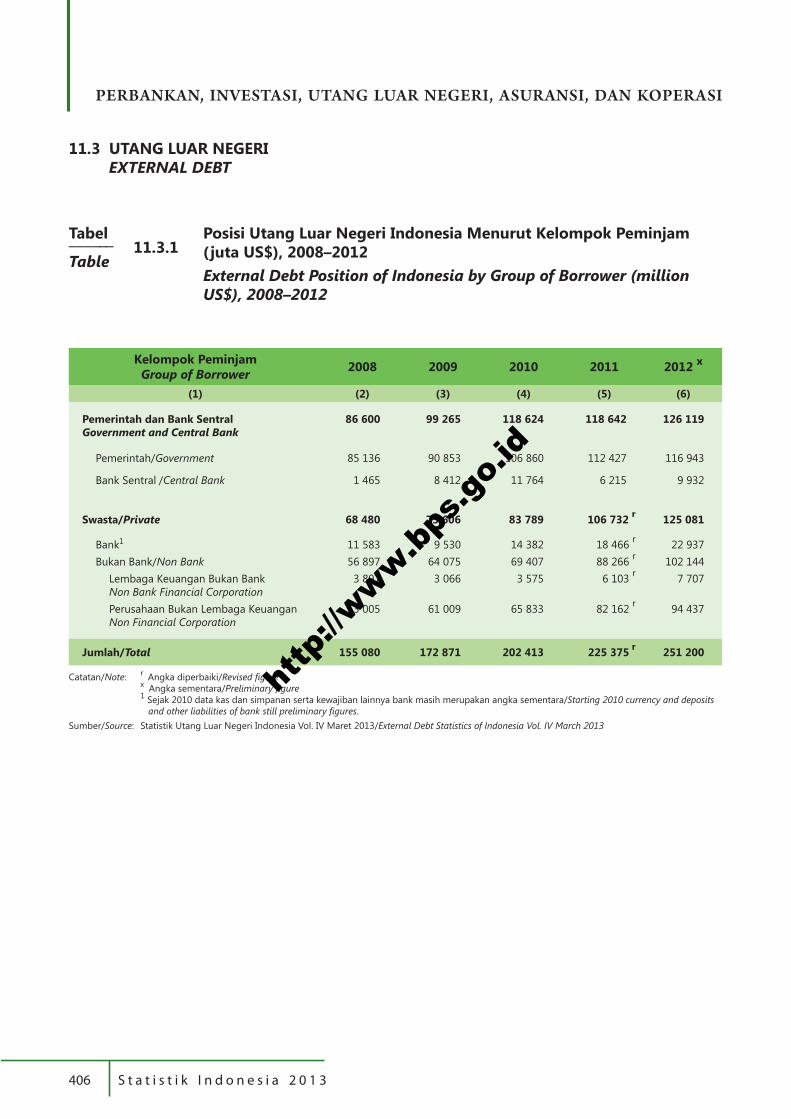
PERBANKAN, INVESTASI, UTANG LUAR NEGERI, ASURANSI, DAN KOPERASI
S t a t i s t i k I n d o n e s i a 2 0 1 3406
11.3 UTANG LUAR NEGERI EXTERNAL DEBT
Posisi Utang Luar Negeri Indonesia Menurut Kelompok Peminjam (juta US$), 2008–2012External Debt Position of Indonesia by Group of Borrower (million US$), 2008–2012
Catatan/Note: r Angka diperbaiki/Revised figure x Angka sementara/Preliminary figure 1 Sejak 2010 data kas dan simpanan serta kewajiban lainnya bank masih merupakan angka sementara/Starting 2010 currency and deposits and other liabilities of bank still preliminary figures.Sumber/Source: Statistik Utang Luar Negeri Indonesia Vol. IV Maret 2013/External Debt Statistics of Indonesia Vol. IV March 2013
Kelompok PeminjamGroup of Borrower 2008 2009 2010 2011 2012 x
(1) (2) (3) (4) (5) (6)
Pemerintah dan Bank SentralGovernment and Central Bank
86 600 99 265 118 624 118 642 126 119
Pemerintah/Government 85 136 90 853 106 860 112 427 116 943
Bank Sentral /Central Bank 1 465 8 412 11 764 6 215 9 932
Swasta/Private 68 480 73 606 83 789 106 732 r 125 081
Bank1 11 583 9 530 14 382 18 466 r 22 937Bukan Bank/Non Bank 56 897 64 075 69 407 88 266 r 102 144
Lembaga Keuangan Bukan BankNon Bank Financial Corporation
3 891 3 066 3 575 6 103 r 7 707
Perusahaan Bukan Lembaga KeuanganNon Financial Corporation
53 005 61 009 65 833 82 162 r 94 437
Jumlah/Total 155 080 172 871 202 413 225 375 r 251 200
Tabel ––––––
11.3.1Table
http
://www.b
ps.g
o.id

BANKING, INVESTMENT, EXTERNAL DEBT, INSURANCE, AND COOPERATIVE
S t a t i s t i c a l Y e a r b o o k o f I n d o n e s i a 2 0 1 3 407
Posisi Utang Luar Negeri Indonesia Menurut Kreditor (juta US$), 2008–2012External Debt Position of Indonesia by Creditor (million US$), 2008–2012
Kreditor/Creditor 2008 2009 2010 2011 2012 x
(1) (2) (3) (4) (5) (6)
Negara Pemberi Pinjaman/Creditor’s Country 117 792 125 993 135 261 160 505 r 177 260Amerika Serikat/USA 16 834 20 247 21 422 26 812 r 33 966Australia 1 324 1 430 1 398 1 609 r 1 461Austria 1 602 1 534 1 279 1 136 r 1 045Belanda/Netherland 13 365 15 781 15 372 13 509 r 13 409Belgia/Belgium 409 464 621 746 r 965Cina/China 1 167 1 569 2 488 3 701 r 5 034Hongkong 3 424 3 312 2 060 2 802 r 3 918Inggris/United Kingdom 2 460 3 218 3 096 2 931 r 3 207Jepang/Japan 37 825 35 780 41 638 44 998 r 41 813Jerman/Germany 4 631 4 072 3 604 3 658 r 3 584Korea Selatan/South Korea 1 605 1 485 1 624 1 855 r 3 100Perancis/France 2 821 3 183 3 056 2 747 r 3 115Singapura/Singapore 20 016 22 338 24 724 38 497 r 41 582Spanyol/Spain 553 533 500 469 446Swiss/Switzerland 844 983 968 1 133 r 1 240Amerika Lainnya/Other America 2 116 2 351 2 078 2 697 r 3 421Eropa Lainnya/Other Europe 950 1 098 2 422 3 298 r 4 541Asia Lainnya/Other Asia 2 369 2 571 2 989 4 014 r 4 721Afrika/Africa 1 040 556 642 666 r 766 Oceania 45 52 43 46 52Sindikasi Negara-NegaraCountries-Syndication
2 391 3 436 3 236 3 182 5 874
Organisasi InternationalInternational Organization
20 676 24 970 26 667 27 033 27 413
ADB 11 206 11 233 11 636 11 436 10 985IBRD 6 964 7 871 9 052 9 606 10 423IDA 2 001 2 231 2 315 2 274 2 208IBD 256 315 405 465 522IFAD 78 77 81 119 130IMF – 3 093 3 050 3 031 3 053NIB 77 64 51 33 32EIB 94 86 77 68 59Organisasi Internasional LainnyaOther International Organizations
– – 0 0 0
Lainnya1/Others1 16 612 21 907 40 485 37 837 46 527
Jumlah/Total 155 080 172 871 202 413 225 375 r 251 200
Catatan/Note: r Angka diperbaiki/Revised figure x Angka sementara/Preliminary figure 1 Sejak 2010 data kas dan simpanan serta kewajiban lainnya bank masih merupakan angka sementara/Starting 2010 currency and deposits and other liabilities of bank still preliminary figures.Sumber/Source: Statistik Utang Luar Negeri Indonesia Vol. IV Maret 2013/External Debt Statistics of Indonesia Vol. IV March 2013
Tabel ––––––
11.3.2Table
http
://www.b
ps.g
o.id

PERBANKAN, INVESTASI, UTANG LUAR NEGERI, ASURANSI, DAN KOPERASI
S t a t i s t i k I n d o n e s i a 2 0 1 3408
Posisi Utang Luar Negeri Pemerintah dan Bank Sentral Menurut Kategori Kreditor dan Persyaratan Kredit (juta US$), 2008–2012External Debt Position of Government and Bank Central by Creditor Category and Credit Term Outstanding (million US$), 2008–2012
Uraian/Item 2008 2009 2010 2011 2012 x
(1) (2) (3) (4) (5) (6)
Pemerintah/Government 85 136 90 853 106 860 112 427 116 187Kreditor Pemerintah dan Lembaga InternasionalOfficial Creditor
64 564 62 798 65 017 65 000 60 786
Bilateral 44 227 41 269 41 888 41 636 37 034ODA 31 080 29 242 31 885 32 294 28 446Non-ODA 13 147 12 027 10 003 9 342 8 588
Multilateral 20 337 21 529 23 129 23 363 23 752Concessional 6 056 8 630 5 300 5 898 6 673Non-Concessional 14 281 12 899 17 829 17 466 17 079
Kreditor Swasta/Private Creditor 20 572 28 055 41 843 47 427 55 401Bank Komersial/Commercial Banks 2 037 2 153 3 019 2 768 2 515Pemasok/Supplier’s 88 70 63 55 42Pemegang Obligasi/Bonds Holders 10 446 14 343 16 989 20 028 24 869Surat Berharga Negara Domestik yang Dimiliki Bukan Penduduk/Domestic Government Securities Owned by Non-Resident
8 001 11 489 21 772 24 576 27 975
Bank Sentral/Central Bank 1 465 8 412 11 764 6 215 9 932
Kreditor Pemerintah dan Lembaga InternasionalOfficial Creditor
4 3 097 3 054 3 034 3 053
Bilateral 4 4 4 3 –Multilateral – 3 093 3 050 3 031 3 053
Kreditor Swasta/Private Creditor 1 450 5 306 6 685 1 350 396Bank Komersial/Commercial Banks 678 606 576 490 354Pemegang Obligasi/Bonds Holders – – – – –Surat Berharga Negara Domestik yang Dimiliki Bukan Penduduk1/Domestic Government Securities Owned by Non-Resident1
772 4 700 6 109 860 42
Kas dan Simpanan/Currency and Deposits 10 7 4 28 6Kewajiban Lain/Other Liabilities 1 1 2 021 1 803 6 477
Jumlah/Total 86 600 99 265 118 624 118 642 126 119
Catatan/Note: x Angka sementara/Preliminary figure 1 Sertifikat Bank Indonesia yang dimiliki bukan penduduk/Bank Indonesia Certificates owned by non-residentSumber/Source: Statistik Utang Luar Negeri Indonesia Vol. IV Maret 2013/External Debt Statistics of Indonesia Vol. IV March 2013
Tabel ––––––
11.3.3Table
http
://www.b
ps.g
o.id
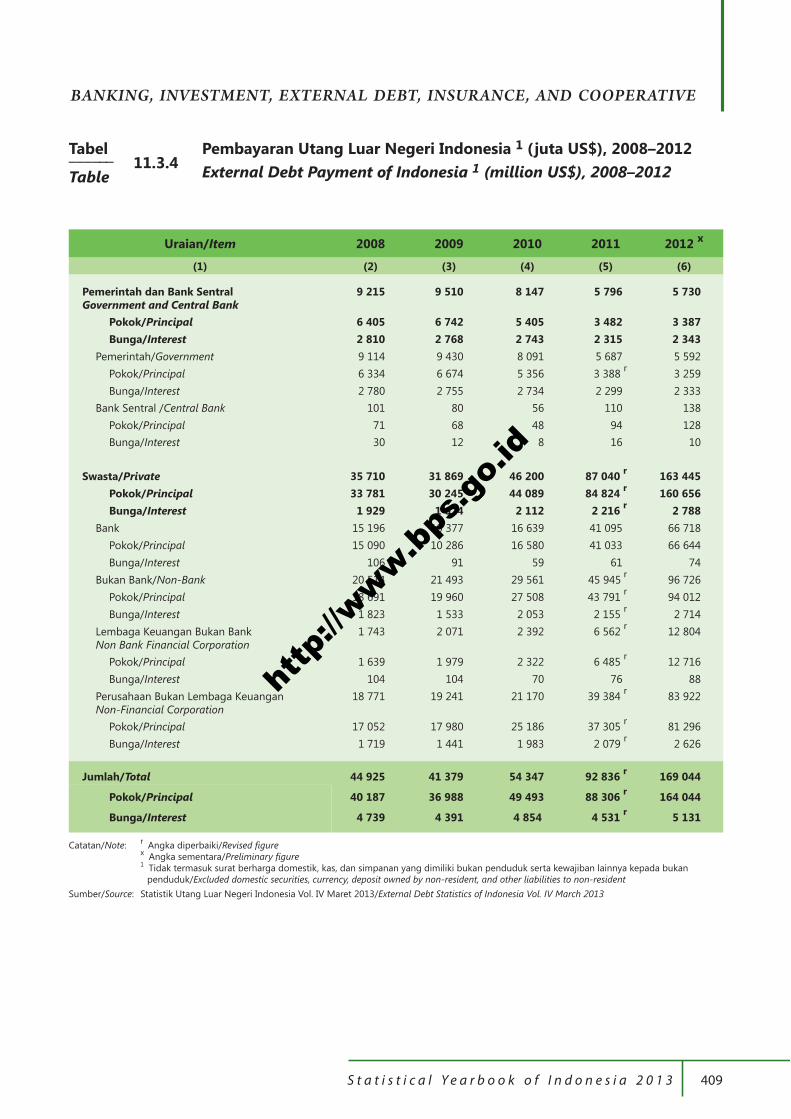
BANKING, INVESTMENT, EXTERNAL DEBT, INSURANCE, AND COOPERATIVE
S t a t i s t i c a l Y e a r b o o k o f I n d o n e s i a 2 0 1 3 409
Pembayaran Utang Luar Negeri Indonesia 1 (juta US$), 2008–2012External Debt Payment of Indonesia 1 (million US$), 2008–2012
Uraian/Item 2008 2009 2010 2011 2012 x
(1) (2) (3) (4) (5) (6)
Pemerintah dan Bank SentralGovernment and Central Bank
9 215 9 510 8 147 5 796 5 730
Pokok/Principal 6 405 6 742 5 405 3 482 3 387Bunga/Interest 2 810 2 768 2 743 2 315 2 343
Pemerintah/Government 9 114 9 430 8 091 5 687 5 592Pokok/Principal 6 334 6 674 5 356 3 388 r 3 259Bunga/Interest 2 780 2 755 2 734 2 299 2 333
Bank Sentral /Central Bank 101 80 56 110 138Pokok/Principal 71 68 48 94 128Bunga/Interest 30 12 8 16 10
Swasta/Private 35 710 31 869 46 200 87 040 r 163 445Pokok/Principal 33 781 30 245 44 089 84 824 r 160 656Bunga/Interest 1 929 1 624 2 112 2 216 r 2 788
Bank 15 196 10 377 16 639 41 095 66 718Pokok/Principal 15 090 10 286 16 580 41 033 66 644Bunga/Interest 106 91 59 61 74
Bukan Bank/Non-Bank 20 514 21 493 29 561 45 945 r 96 726Pokok/Principal 18 691 19 960 27 508 43 791 r 94 012Bunga/Interest 1 823 1 533 2 053 2 155 r 2 714
Lembaga Keuangan Bukan BankNon Bank Financial Corporation
1 743 2 071 2 392 6 562 r 12 804
Pokok/Principal 1 639 1 979 2 322 6 485 r 12 716Bunga/Interest 104 104 70 76 88
Perusahaan Bukan Lembaga KeuanganNon-Financial Corporation
18 771 19 241 21 170 39 384 r 83 922
Pokok/Principal 17 052 17 980 25 186 37 305 r 81 296Bunga/Interest 1 719 1 441 1 983 2 079 r 2 626
Jumlah/Total 44 925 41 379 54 347 92 836 r 169 044
Pokok/Principal 40 187 36 988 49 493 88 306 r 164 044
Bunga/Interest 4 739 4 391 4 854 4 531 r 5 131
Catatan/Note: r Angka diperbaiki/Revised figure x Angka sementara/Preliminary figure 1 Tidak termasuk surat berharga domestik, kas, dan simpanan yang dimiliki bukan penduduk serta kewajiban lainnya kepada bukan penduduk/Excluded domestic securities, currency, deposit owned by non-resident, and other liabilities to non-residentSumber/Source: Statistik Utang Luar Negeri Indonesia Vol. IV Maret 2013/External Debt Statistics of Indonesia Vol. IV March 2013
Tabel ––––––
11.3.4Table
http
://www.b
ps.g
o.id

PERBANKAN, INVESTASI, UTANG LUAR NEGERI, ASURANSI, DAN KOPERASI
S t a t i s t i k I n d o n e s i a 2 0 1 3410
Posisi Cadangan Devisa (juta US$), 2008–2012Official Reserve Assets Position (million US$), 2008–2012
Catatan/Note: r Angka diperbaiki/Revised figure Sumber/Source: Bank Indonesia (SEKI Februari 2013)/Bank Indonesia (SEKI February 2013)
Uraian/Item 2008 2009 2010 2011 2012
(1) (2) (3) (4) (5) (6)
Cadangan dalam Valuta AsingForeign Currency Reserve
49 164 60 369 89 751 103 380 105 343
Surat Berharga/Securities 45 476 57 100 82 979 90 795 83 299
Uang Kertas Asing (UKA) dan SimpananCurrency and Deposits
3 687 3 269 6 772 12 585 22 044
Reserve Position in the Fund (RPF) 225 227 224 223 224Special Drawing Rights (SDRs) 34 2 753 2 714 2 696 2 715Emas Moneter/Monetary Gold 2 041 2 552 3 299 3 593 3 935Tagihan lainnya/Other Reserve Assets 175 203 219 231 r 564
Jumlah/Total 51 639 66 105 96 207 110 123 r 112 781
Tabel ––––––
11.3.5Table
http
://www.b
ps.g
o.id
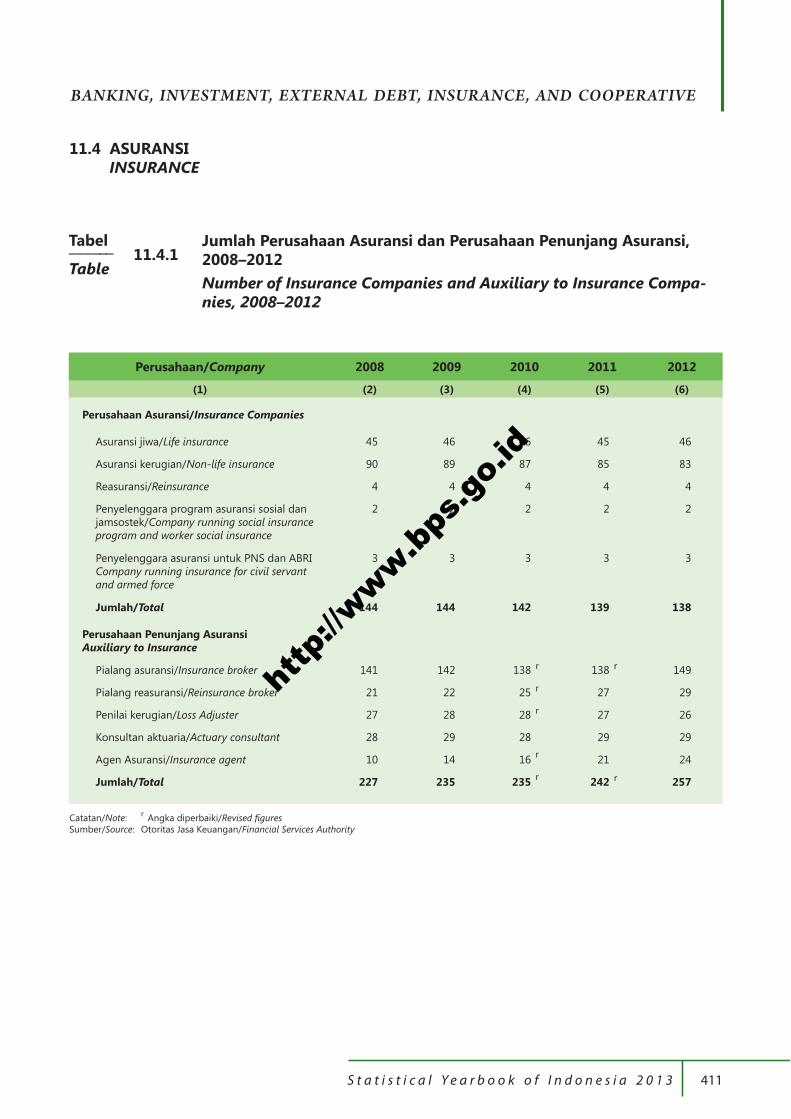
BANKING, INVESTMENT, EXTERNAL DEBT, INSURANCE, AND COOPERATIVE
S t a t i s t i c a l Y e a r b o o k o f I n d o n e s i a 2 0 1 3 411
Jumlah Perusahaan Asuransi dan Perusahaan Penunjang Asuransi, 2008–2012Number of Insurance Companies and Auxiliary to Insurance Compa-nies, 2008–2012
11.4 ASURANSI INSURANCE
Catatan/Note: r Angka diperbaiki/Revised figuresSumber/Source: Otoritas Jasa Keuangan/Financial Services Authority
Tabel ––––––
11.4.1Table
Perusahaan/Company 2008 2009 2010 2011 2012
(1) (2) (3) (4) (5) (6)
Perusahaan Asuransi/Insurance Companies
Asuransi jiwa/Life insurance 45 46 46 45 46
Asuransi kerugian/Non-life insurance 90 89 87 85 83
Reasuransi/Reinsurance 4 4 4 4 4
Penyelenggara program asuransi sosial dan jamsostek/Company running social insurance program and worker social insurance
2 2 2 2 2
Penyelenggara asuransi untuk PNS dan ABRICompany running insurance for civil servant and armed force
3 3 3 3 3
Jumlah/Total 144 144 142 139 138
Perusahaan Penunjang AsuransiAuxiliary to Insurance
Pialang asuransi/Insurance broker 141 142 138 r 138 r 149
Pialang reasuransi/Reinsurance broker 21 22 25 r 27 29
Penilai kerugian/Loss Adjuster 27 28 28 r 27 26
Konsultan aktuaria/Actuary consultant 28 29 28 29 29
Agen Asuransi/Insurance agent 10 14 16 r 21 24
Jumlah/Total 227 235 235 r 242 r 257
http
://www.b
ps.g
o.id
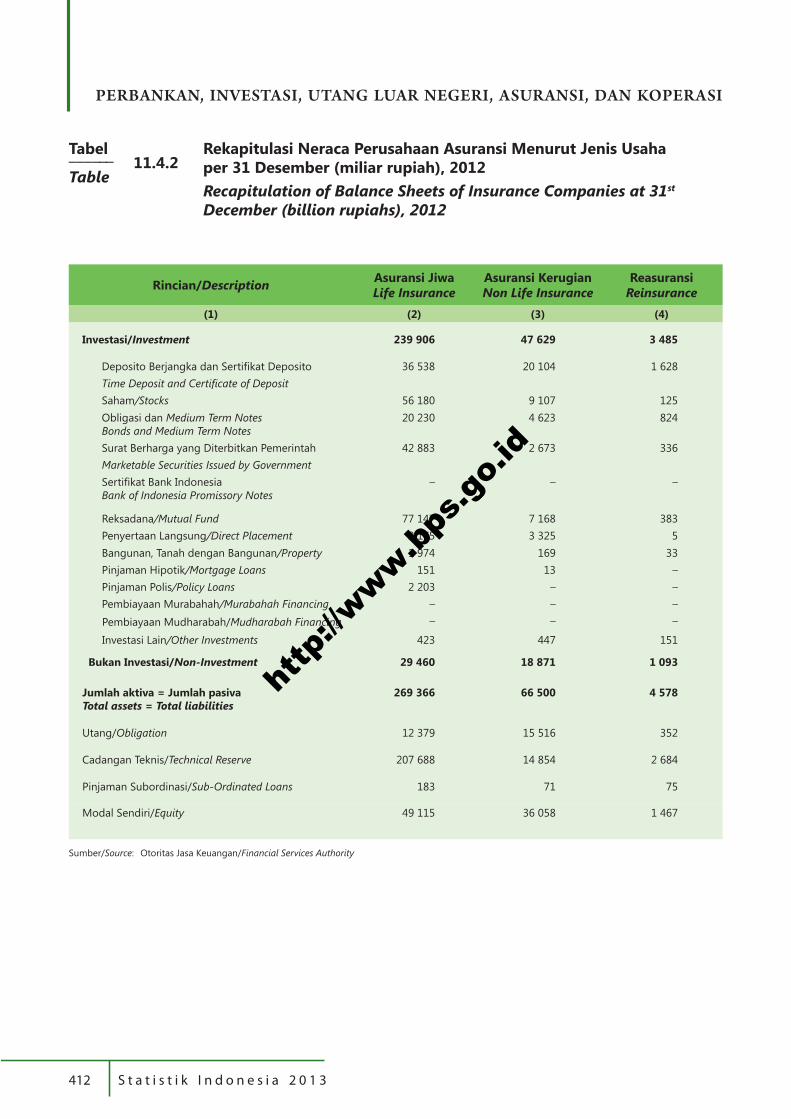
PERBANKAN, INVESTASI, UTANG LUAR NEGERI, ASURANSI, DAN KOPERASI
S t a t i s t i k I n d o n e s i a 2 0 1 3412
Rekapitulasi Neraca Perusahaan Asuransi Menurut Jenis Usaha per 31 Desember (miliar rupiah), 2012Recapitulation of Balance Sheets of Insurance Companies at 31st December (billion rupiahs), 2012
Sumber/Source: Otoritas Jasa Keuangan/Financial Services Authority
Tabel ––––––
11.4.2Table
Rincian/Description Asuransi JiwaLife Insurance
Asuransi KerugianNon Life Insurance
ReasuransiReinsurance
(1) (2) (3) (4)
Investasi/Investment 239 906 47 629 3 485
Deposito Berjangka dan Sertifikat Deposito 36 538 20 104 1 628 Time Deposit and Certificate of Deposit Saham/Stocks 56 180 9 107 125 Obligasi dan Medium Term Notes Bonds and Medium Term Notes
20 230 4 623 824
Surat Berharga yang Diterbitkan Pemerintah 42 883 2 673 336 Marketable Securities Issued by Government Sertifikat Bank Indonesia Bank of Indonesia Promissory Notes
– – –
Reksadana/Mutual Fund 77 147 7 168 383 Penyertaan Langsung/Direct Placement 2 175 3 325 5 Bangunan, Tanah dengan Bangunan/Property 1 974 169 33 Pinjaman Hipotik/Mortgage Loans 151 13 – Pinjaman Polis/Policy Loans 2 203 – – Pembiayaan Murabahah/Murabahah Financing – – –
Pembiayaan Mudharabah/Mudharabah Financing – – –
Investasi Lain/Other Investments 423 447 151
Bukan Investasi/Non-Investment 29 460 18 871 1 093 Jumlah aktiva = Jumlah pasivaTotal assets = Total liabilities
269 366 66 500 4 578
Utang/Obligation 12 379 15 516 352
Cadangan Teknis/Technical Reserve 207 688 14 854 2 684
Pinjaman Subordinasi/Sub-Ordinated Loans 183 71 75
Modal Sendiri/Equity 49 115 36 058 1 467
http
://www.b
ps.g
o.id

BANKING, INVESTMENT, EXTERNAL DEBT, INSURANCE, AND COOPERATIVE
S t a t i s t i c a l Y e a r b o o k o f I n d o n e s i a 2 0 1 3 413
Rekapitulasi Neraca Perusahaan Penyelenggara Program Asuransi untuk PNS, TNI-Polri, Sosial, dan Jamsostek Per 31 Desember (miliar rupiah), 2012Recapitulation of Balance Sheets Insurance Companies Running Insurance for Civil Servant, Armed Force, Social Insurance Program, and Worker Social Insurance at 31st December (billion rupiahs), 2012
Rincian/DescriptionPNS dan TNI-Polri
Insurance for Civil Servant and Armed Force
Asuransi Sosial dan Jamsostek
Social Insurance Program and Worker Social Insurance
(1) (2) (3)
Investasi/Investment 66 407 139 710
Deposito Berjangka dan Sertifikat DepositoTime Deposit and Certificate of Deposit
10 475 42 049
Saham/Stock 5 681 28 591 Obligasi dan Medium Term Notes/Obligation and MTN 17 261 28 878 Surat Berharga Yang Diterbitkan PemerintahMarketable Securities Issued by Government
24 559 27 670
Reksadana/Mutual Fund 6 757 11 680 Penyertaan Langsung/Direct Placement 1 045 471 Bangunan, Tanah dengan Bangunan/Property 10 370 Investasi Lain/Other Investment 620 –
Bukan Investasi/Non-investment 18 446 4 420
Jumlah aktiva=Jumlah pasivaTotal assets=Total liabilities
84 853 144 131
Utang/Obligation 1 263 121 050
Cadangan Teknis/Technical Reserve 66 036 11 037
Hak Minoritas/Minority Interest – –
Modal Sendiri/Equity 17 554 12 043
Sumber/Source: Otoritas Jasa Keuangan/Financial Services Authority
Tabel ––––––
11.4.3Table
http
://www.b
ps.g
o.id
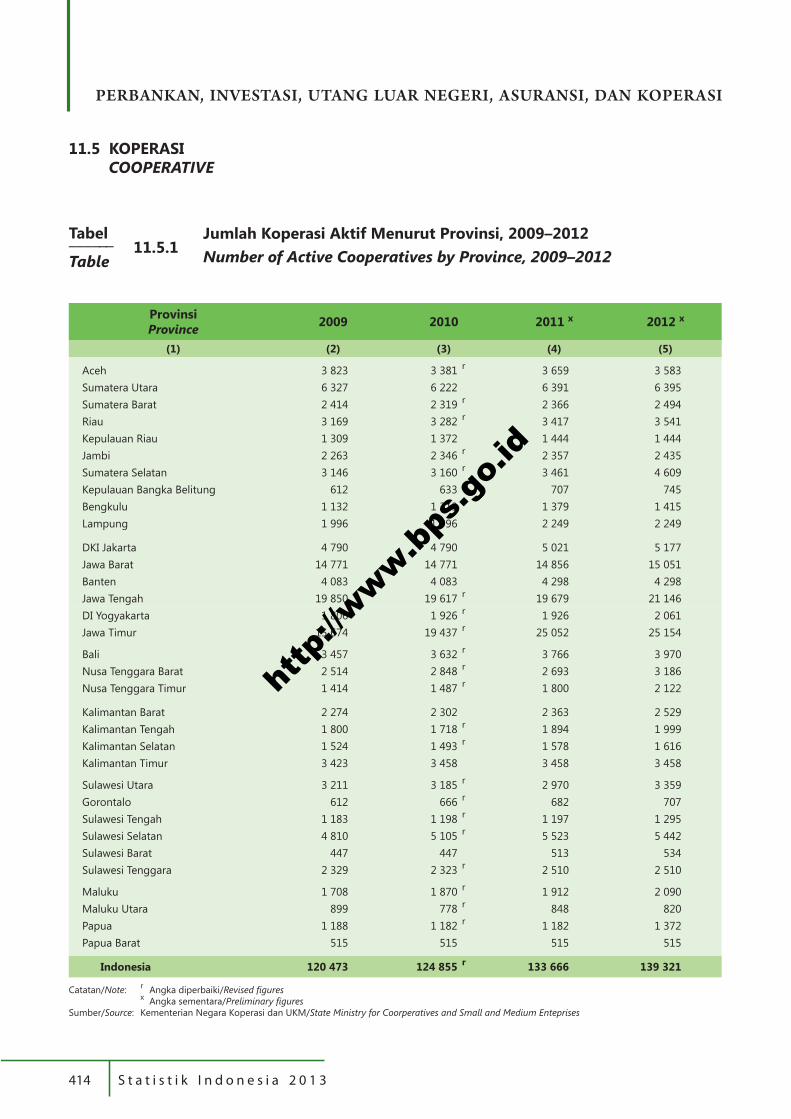
PERBANKAN, INVESTASI, UTANG LUAR NEGERI, ASURANSI, DAN KOPERASI
S t a t i s t i k I n d o n e s i a 2 0 1 3414
Jumlah Koperasi Aktif Menurut Provinsi, 2009–2012Number of Active Cooperatives by Province, 2009–2012
11.5 KOPERASI COOPERATIVE
ProvinsiProvince 2009 2010 2011 x 2012 x
(1) (2) (3) (4) (5)
Aceh 3 823 3 381 r 3 659 3 583Sumatera Utara 6 327 6 222 6 391 6 395Sumatera Barat 2 414 2 319 r 2 366 2 494Riau 3 169 3 282 r 3 417 3 541Kepulauan Riau 1 309 1 372 1 444 1 444Jambi 2 263 2 346 r 2 357 2 435Sumatera Selatan 3 146 3 160 r 3 461 4 609Kepulauan Bangka Belitung 612 633 r 707 745Bengkulu 1 132 1 313 r 1 379 1 415Lampung 1 996 1 996 2 249 2 249
DKI Jakarta 4 790 4 790 5 021 5 177Jawa Barat 14 771 14 771 14 856 15 051Banten 4 083 4 083 4 298 4 298Jawa Tengah 19 850 19 617 r 19 679 21 146DI Yogyakarta 1 806 1 926 r 1 926 2 061Jawa Timur 15 674 19 437 r 25 052 25 154
Bali 3 457 3 632 r 3 766 3 970Nusa Tenggara Barat 2 514 2 848 r 2 693 3 186Nusa Tenggara Timur 1 414 1 487 r 1 800 2 122
Kalimantan Barat 2 274 2 302 2 363 2 529Kalimantan Tengah 1 800 1 718 r 1 894 1 999Kalimantan Selatan 1 524 1 493 r 1 578 1 616Kalimantan Timur 3 423 3 458 3 458 3 458
Sulawesi Utara 3 211 3 185 r 2 970 3 359Gorontalo 612 666 r 682 707Sulawesi Tengah 1 183 1 198 r 1 197 1 295Sulawesi Selatan 4 810 5 105 r 5 523 5 442Sulawesi Barat 447 447 513 534Sulawesi Tenggara 2 329 2 323 r 2 510 2 510
Maluku 1 708 1 870 r 1 912 2 090Maluku Utara 899 778 r 848 820Papua 1 188 1 182 r 1 182 1 372Papua Barat 515 515 515 515
Indonesia 120 473 124 855 r 133 666 139 321
Catatan/Note: r Angka diperbaiki/Revised figures x Angka sementara/Preliminary figuresSumber/Source: Kementerian Negara Koperasi dan UKM/State Ministry for Coorperatives and Small and Medium Enteprises
Tabel ––––––
11.5.1Table
http
://www.b
ps.g
o.id

BANKING, INVESTMENT, EXTERNAL DEBT, INSURANCE, AND COOPERATIVE
S t a t i s t i c a l Y e a r b o o k o f I n d o n e s i a 2 0 1 3 415
Volume Usaha Koperasi Menurut Provinsi (juta rupiah), 2009–2012Asset Scale of Cooperatives by Province (million rupiahs), 2009–2012
ProvinsiProvince 2009 2010 2011 x 2012 x
(1) (2) (3) (4) (5) Aceh 711 562 611 010 r 825 858 601 510Sumatera Utara 4 042 304 3 509 932 3 636 481 3 636 481Sumatera Barat 2 178 431 2 653 902 r 3 064 507 3 593 274Riau 1 496 202 1 886 977 r 2 333 364 2 061 761Kepulauan Riau 116 191 69 222 89 071 89 071Jambi 944 179 1 024 407 r 921 349 1 741 171Sumatera Selatan 2 538 341 2 414 546 r 2 586 985 2 586 985Kepulauan Bangka Belitung 515 736 611 211 r 777 613 1 354 020Bengkulu 491 712 1 339 569 r 1 122 303 373 622Lampung 1 464 919 1 352 811 3 553 294 3 553 294
DKI Jakarta 5 174 718 5 174 718 5 713 738 7 226 889Jawa Barat 10 381 550 10 381 550 10 663 795 12 624 746Banten 2 541 333 2 541 333 1 971 563 1 971 563Jawa Tengah 11 844 339 12 346 631 r 16 163 571 27 351 789DI Yogyakarta 1 696 044 2 376 468 r 2 296 146 2 304 127Jawa Timur 21 497 790 11 458 626 r 23 836 096 26 290 748
Bali 4 028 556 6 589 945 r 3 513 793 4 623 284Nusa Tenggara Barat 1 011 069 1 329 638 r 403 439 1 365 540Nusa Tenggara Timur 517 501 378 259 r 1 281 596 1 231 677
Kalimantan Barat 2 211 036 2 681 164 2 444 829 6 022 911Kalimantan Tengah 239 689 380 901 r 400 597 775 492Kalimantan Selatan 669 615 494 925 r 1 671 335 1 259 893Kalimantan Timur 1 515 154 1 515 154 1 515 154 1 515 154
Sulawesi Utara 991 153 1 039 470 r 146 673 318 284Gorontalo 224 051 271 242 r 272 451 273 962Sulawesi Tengah 216 965 204 819 r 520 203 532 413Sulawesi Selatan 1 425 195 1 266 625 r 2 597 867 3 187 970Sulawesi Barat 57 883 57 883 60 615 60 615Sulawesi Tenggara 296 933 297 173 r 108 406 108 406
Maluku 195 852 165 708 r 36 266 76 576Maluku Utara 174 920 129 131 r 266 312 256 468Papua 634 750 214 218 r 214 218 160 080Papua Barat 52 914 52 914 52 914 52 914
Indonesia 82 098 587 76 822 082 r 95 062 402 119 182 690
Catatan/Note: r Angka diperbaiki/Revised figures x Angka sementara/Preliminary figuresSumber/Source: Kementerian Negara Koperasi dan UKM/State Ministry for Coorperatives and Small and Medium Enteprises
Tabel ––––––
11.5.2Table
http
://www.b
ps.g
o.id

PERBANKAN, INVESTASI, UTANG LUAR NEGERI, ASURANSI, DAN KOPERASI
S t a t i s t i k I n d o n e s i a 2 0 1 3416
Sisa Hasil Usaha (SHU) Koperasi Menurut Provinsi (juta rupiah), 2009–2012Net Profit of Cooperatives by Province (million rupiahs), 2009–2012
ProvinsiProvince 2009 2010 2011 x 2012 x
(1) (2) (3) (4) (5) Aceh 52 788 33 988 r 73 299 41 242Sumatera Utara 300 202 266 587 302 035 302 035Sumatera Barat 154 484 125 023 r 129 545 159 499Riau 95 192 95 570 r 152 460 119 791Kepulauan Riau 15 991 10 993 13 011 13 011Jambi 41 498 44 509 r 41 666 54 217Sumatera Selatan 112 283 106 154 r 117 053 117 053Kepulauan Bangka Belitung 26 355 27 920 r 34 563 121 862Bengkulu 69 617 71 210 r 70 616 61 033Lampung 74 564 72 511 287 649 287 649
DKI Jakarta 451 582 451 582 528 999 662 551Jawa Barat 971 373 971 373 1 076 372 993 250Banten 183 712 183 712 148 249 148 249Jawa Tengah 708 096 1 003 128 r 278 835 361 262DI Yogyakarta 42 368 66 375 r 92 750 92 863Jawa Timur 1 038 011 1 137 739 r 1 711 148 2 114 755
Bali 200 479 249 269 r 491 833 134 621Nusa Tenggara Barat 35 532 38 660 r 18 864 55 176Nusa Tenggara Timur 52 786 20 505 r 130 093 123 168
Kalimantan Barat 79 635 85 001 99 422 110 697Kalimantan Tengah 20 226 30 070 r 30 628 43 723Kalimantan Selatan 35 040 50 323 r 184 007 144 203Kalimantan Timur 86 485 86 002 86 002 86 002
Sulawesi Utara 26 302 14 867 r 5 742 8 064Gorontalo 15 462 18 265 r 18 348 17 898Sulawesi Tengah 12 389 13 850 r 16 928 29 232Sulawesi Selatan 274 204 235 611 r 131 997 192 523Sulawesi Barat 6 322 6 322 1 326 1 326Sulawesi Tenggara 40 463 40 464 r 8 145 8 145
Maluku 21 842 21 445 r 3 839 12 262Maluku Utara 19 766 10 662 r 18 582 17 831Papua 31 790 25 499 r 25 500 19 758Papua Barat 6 975 6 975 6 975 6 975
Indonesia 5 303 814 5 622 164 r 6 336 481 6 661 926
Catatan/Note: r Angka diperbaiki/Revised figures x Angka sementara/Preliminary figuresSumber/Source: Kementerian Negara Koperasi dan UKM/State Ministry for Coorperatives and Small and Medium Enteprises
Tabel ––––––
11.5.3Table
http
://www.b
ps.g
o.id

12HARGA-HARGAPrices
http
://www.b
ps.g
o.id

http
://www.b
ps.g
o.id

P R I C E S
S t a t i s t i c a l Y e a r b o o k o f I n d o n e s i a 2 0 1 3 419
PENJELASAN TEKNIS
1. Data harga yang disajikan meliputi:a. Harga eceran beras di beberapa kotab. Harga eceran nasional beberapa jenis barangc. Indeks Harga Konsumen (IHK) dan laju inflasid. Indeks Harga Perdagangan Besar (IHPB)e. Indeks harga yang diterima dan dibayar Petanif. Harga GKG (Gabah Kering Giling) dan GKP
(Gabah Kering Panen) di tingkat petani dan penggilingan
2. Rata-rata harga eceran beras diolah dari survei mingguan Badan Pusat Statistik di beberapa kota. Karena beragamnya kualitas beras di masing-masing kota, maka harga yang disajikan adalah rata-rata harga beras tertimbang.
3. Rata-rata harga eceran nasional beberapa jenis barang diolah dari hasil survei mingguan Badan Pusat Statistik terbatas hanya 11 komoditas.
4. Indeks Harga Konsumen (IHK) merupakan indikator inflasi di Indonesia. Sejak Juni 2008, IHK dihitung berdasarkan Survei Biaya Hidup (SBH) di 66 kota tahun 2007 yang mencakup sekitar 284–441 komoditas.
5. IHK mencakup 7 kelompok, yaitu: bahan makanan; makanan jadi, minuman, rokok, dan tembakau; perumahan, air, listrik, gas, dan bahan bakar; sandang; kesehatan; pendidikan, rekreasi, dan olahraga; transpor, komunikasi, dan jasa keuangan.
6. Metode yang digunakan dalam penghitungan Indeks Harga Konsumen (IHK), Indeks Harga Perdesaan (IHP), dan Indeks Harga Perdagangan Besar (IHPB) adalah Formula Laspeyres yang telah dimodifikasi, yaitu:
TECHNICAL NOTES
1. Price statistics covers:a. Retail prices of rice in several citiesb. National retail prices of several commoditiesc. Consumer Price Index (CPI) and inflation ratesd. Wholesale Price Index (WPI)e. Indices of prices received and paid by farmersf. Dried Unhusked Grain’s price and Dried Harvested
Grain’s price at the farmer level and the huller level.
2. The average retail price of rice is compiled through the weekly price survey conducted by the BPS-Statistics Indonesia in several cities. Due to different qualities of rice in each city, the weighted average price of rice is used.
3. The average retail prices of several commodities are compiled from the weekly price survey conducted by the BPS-Statistics Indonesia, for the purpose of this publication, are limited to 11 commodities.
4. The Consumer Price Index (CPI) is the indicator of inflation in Indonesia. Since June 2008, the CPI has been developed from the 2007 Cost of Living Survey (CLS) of 66 cities which is covering 284–441 commodities.
5. Commodities of CPI consist of 7 groups as follows: foodstuff; prepare food, beverages, and tobacco products; housing, water, electricity, gas, and fuel; clothing; health; education, recreation, and sports; transportation, communication, and financial services.
6. The method used in calculating Consumer Price Indices (CPI), Rural Price Indices (RPI), and Wholesale Price Indices (WPI) is the modified Laspeyres formula as follow:
In =Σ Pn Pn-1.Q0
x 100Pn-1
Σ P0Q0
In =Σ Pn Pn-1.Q0
x 100Pn-1
Σ P0Q0
http
://www.b
ps.g
o.id
H A R G A - H A R G A
S t a t i s t i k I n d o n e s i a 2 0 1 3420
where: In = Monthly index Pn = Price in month n Pn-1 = Price in month (n-1) Po = Price in the base year Qo = Quantity in the base year
7. a. The percentage change of the monthly CPI (inflation rate) is obtained from:
where : In = Consumer Price Index for month n In-1= Consumer Price Index for month n-1 Inflation if the value > 0 Deflation if the value < 0
b. The percentage change of the yearly CPI is calculated by using the point-to-point method, but before April 1998 the monthly cumulative method is used.
8. The Wholesale Price Index (WPI) is calculated based on wholesale price survey which is conducted in 33 capital cities of provinces and several regencies/cities in Indonesia. The regencies/cities are purposively selected in each province, based on the number of commodities numbers which available in the regencies/cities that are included in the basket of commodities. The respondents of the survey are industrial companies (producers), exporters, importers, and wholesalers. The respondents are also selected purposively. Total respondent of wholesale price survey in Indonesia is 8,629.
Since Januari 2009, the calculation of WPI has used the year 2005 as the base year (2005=100) covering 315 commodities. Before this period it used the base year of 2000 (2000=100). The grouping of commodities in WPI is based on Indonesian Standard Industrial Classification (ISIC). The WPI is presented in general index and group of commodities, namely:
dimana : In = Indeks bulanan Pn = Harga pada bulan ke-n Pn-1 = Harga pada bulan ke-(n-1) Po = Harga pada tahun dasar Qo = Kuantitas pada tahun dasar 7. a. Persentase (%) perubahan IHK (laju inflasi/
deflasi) bulanan diperoleh dari:
dimana : In = Indeks Harga Konsumen bulan n In-1 = Indeks Harga Konsumen bulan n-1 Inflasi jika nilainya > 0 Deflasi jika nilainya < 0
b. Persentase perubahan IHK dalam satu tahun dihitung dengan menggunakan metode point to point, tetapi sebelum April 1998 menggunakan metode kumulatif bulanan.
8. Indeks Harga Perdagangan Besar (IHPB) dihitung berdasarkan survei harga perdagangan besar yang dilakukan di 33 ibukota provinsi dan beberapa kabupaten/kota di Indonesia. Pemilihan kabupaten/kota dilakukan oleh masing-masing provinsi secara purposive, berdasarkan banyaknya komoditas yang ada di kabupaten/kota tersebut yang tercakup dalam paket komoditas. Responden survei adalah perusahaan industri (produsen), eksportir, importir dan pedagang besar. Pemilihan responden juga dilakukan secara purposive. Total responden survei HPB di Indonesia adalah 8.629.
Sejak Januari 2009 penghitungan IHPB menggunakan tahun dasar 2005 (2005=100) yang mencakup 315 jenis komoditas, sedangkan periode sebelumnya menggunakan tahun dasar 2000 (2000=100). Pengelompokan komoditas dalam IHPB didasarkan pada Klasifikasi Baku Lapangan Usaha Indonesia (KBLI). IHPB disajikan dalam bentuk indeks umum dan berdasarkan pengelompokan barang, yaitu:
In – In-1x 100
In-1
In – In-1x 100
In-1
http
://www.b
ps.g
o.id

P R I C E S
S t a t i s t i c a l Y e a r b o o k o f I n d o n e s i a 2 0 1 3 421
- Kelompok penawaran barang yang meliputi sektor pertanian, pertambangan dan penggalian, industri, impor, dan ekspor.
- Kelompok penggunaan barang.- Kelompok barang dalam tahapan proses produksi.- Kelompok bahan-bahan bangunan/konstruksi.
9. Nilai Tukar Petani (NTP) adalah perbandingan antara indeks harga yang diterima (It) dan dibayar (Ib) petani. NTP merupakan salah satu indikator yang berguna untuk mengukur tingkat kesejahteraan petani karena mengukur kemampuan tukar produk (komoditas) yang dihasilkan/dijual petani dibandingkan dengan produk yang dibutuhkan petani, baik untuk proses produksi (usaha) maupun untuk konsumsi rumah tangga petani. Jika NTP lebih besar dari 100 maka dapat diartikan kemampuan daya beli petani periode tersebut relatif lebih baik dibandingkan dengan periode tahun dasar, sebaliknya jika NTP lebih kecil atau di bawah 100 berarti terjadi penurunan daya beli petani.
10. Pengumpulan data harga produsen pertanian dilakukan melalui wawancara langsung kepada petani dengan Daftar HD-1 sampai dengan HD-6, sedangkan pengumpulan data harga eceran pedesaan (konsumen) dilakukan melalui wawancara dengan para pedagang di pasar kecamatan yang terpilih sebagai sampel dengan Daftar HKD-1, HKD-2.1, dan HKD-2.2. Semua kegiatan pencacahan harga-harga dilakukan oleh Koordinator Statistik Kecamatan (KSK).
11. Klasifikasi indeks NTP dirinci ke dalam dua bagian, yaitu indeks harga yang diterima petani (It) dan indeks harga yang dibayar petani (Ib). It mencakup indeks Subsektor Tanaman Pangan (padi dan palawija), indeks Subsektor Tanaman Holtikultura (sayur-sayuran dan buah-buahan), indeks Subsektor Tanaman Perkebunan Rakyat, indeks Subsektor Peternakan, dan indeks Subsektor Perikanan. Di lain pihak Ib pun dibagi ke dalam dua kelompok, yaitu indeks kelompok konsumsi rumah tangga (KRT), yang terdiri dari indeks kelompok bahan makanan; makanan jadi; perumahan; sandang; kesehatan; pendidikan; rekreasi, dan olahraga; transportasi dan komunikasi; dan indeks kelompok biaya produksi dan penambahan barang modal (BPPBM). Metode perhitungan It dan Ib menggunakan formula Laspeyres yang telah dimodifikasi.
- Group of component of supply consisting of agriculture, mining and quarrrying, industry, import, and export.
- Group of end use of commodities.- Group of commodities used in the production process.- Group of construction materials.
9. Farmers’ Term of Trade (FTT) is an indicator to determine the welfare level of farmers. It measures the exchange value of products produced or sold by farmers compared to the products needed by farmers for production process and consumption. If FTT is above 100, it means the purchasing power parity of farmers in a period of time is better than that in the base year. Meanwhile, if FTT is less than 100, it means that the purchasing power parity of farmers decreases.
10. The collection of producer price at farm gate data is conducted through a direct interview with the farmers using HD-1 until HD-6 questionnaire. While the collection of rural consumer retail price data is conducted by interviewing traders in the selected markets using HKD-1, HKD-2.1, and HKD-2.2 questionnaire. The collection of price data is conducted by the Statistics Coordinator at Subdistrict level.
11. FTT indices can be classified into two parts, that are indices of prices received by farmers (It) and indices of prices paid by farmers (Ib). Indices of prices received by farmers consist of food crops indices (paddy and secondary crops), holticulture crops indices (vegetables and fruits), smallholders estate crops indices, animal husbandry indices, and fishery indices. While indices of prices paid by farmers is consist of household consumption indices ( food stuff; prepared food; housing; clothing; health; education, recreation, and sport; transportation and communication) and indices of production cost and capital formation. The method used in calculating It and Ib is the modified Laspeyres formula.
http
://www.b
ps.g
o.id
H A R G A - H A R G A
S t a t i s t i k I n d o n e s i a 2 0 1 3422
12. Beberapa definisi operasional dalam rangka penyusunan data harga gabah di Subdirektorat Statistik Harga Produsen antara lain sebagai berikut:a. Petani
Orang yang mengusahakan/mengelola usaha pertanian, perkebunan, peternakan, kehutanan, perburuan, dan perikanan, baik sebagai petani pemilik ataupun petani penggarap.
b. Gabah
Bulir buah hasil tanaman padi (Oryza Sativa Linaeus) yang telah dilepaskan dari tangkainya dengan cara dirontokkan.
c. Harga di Tingkat Petani
Harga yang disepakati pada waktu terjadinya transaksi antara petani dengan pedagang pengumpul/tengkulak/pihak penggilingan yang ditemukan pada hari dilaksanakannya observasi dengan kualitas apa adanya sebelum dikenakan ongkos angkut pasca panen.
d. Biaya ke Penggilingan Keseluruhan biaya pasca panen siap jual dari tempat transaksi di tingkat petani ke lokasi unit penggilingan terdekat. Besarnya biaya ke penggilingan adalah penjumlahan dari ongkos angkut (termasuk biaya bongkar/muat dan sewa kendaraan) ditambah ongkos lainnya (retribusi, konsumsi, dsb).
e. Harga di Tingkat Penggilingan Harga di tingkat petani ditambah dengan besarnya biaya ke penggilingan terdekat.
f. Harga Pembelian Pemerintah (HPP) Harga minimal yang harus dibayarkan pihak penggilingan kepada petani sesuai dengan kualitas gabah sebagaimana yang telah ditetapkan Pemerintah. Penetapan harga dilakukan secara kolektif antara Kementerian Pertanian, Menko Bidang Perekonomian, dan Bulog.
g. Gabah Kering Giling (GKG) Gabah yang mengandung kadar air maksimum sebesar 14,0 persen dan hampa/kotoran maksimum 3,0 persen.
12. Several operational definitions in preparing to paddy price data in Sub-Directorate of Producer Price Statistics as follows:a. Farmer
People who manage the business of agriculture, plantation, animal husbandry, forestry, hunting, and fishing either as owner or farmer sharecropper.
b. Unhusked Rice/Paddy Grain or paddy’s granules (Oryza Sativa Linaeus).
c. Price at Farmer Level The price agreed at the time of transaction among farmers, brokers, and other buyers is found in observation on original quality. The transportation cost is not included.
d. Cost to Huller Location The total cost of transaction from farmer to the nearest huller location. It refers to total amount of transportation cost (loading, unloading, and rental charges) and other cost (retribution, consumption, etc).
e. Price at Huller Level The total of price at farmer level and cost to huller location.
f. Government Purchasing Price (HPP)The minimum price to be paid to farmers based on the grain quality as determined by government. Pricing is determined collectively by Ministry of Agricluture, Ministry of Coordinating Economic Affair, and Bulog.
g. Dried Unhusked GrainGrains containing a maximum water and hollow/dirt content of 14.0 percent and 3.0 percent respectively.
http
://www.b
ps.g
o.id

P R I C E S
S t a t i s t i c a l Y e a r b o o k o f I n d o n e s i a 2 0 1 3 423
h. Gabah Kering Panen (GKP)Gabah yang mengandung kadar air maksimum sebesar 25,0 persen dan hampa/kotoran maksimum 10,0 persen.
i. Gabah Kualitas RendahGabah yang mengandung kadar air lebih dari 25,0 persen dan hampa/kotoran lebih dari 10,0 persen.
j. Kadar Air (KA)Jumlah kandungan air dalam butir gabah yang dinyatakan dalam persentase dari berat basah.
k. Kadar Hampa/Kotoran Jumlah kandungan butir hampa dan kotoran dalam butir gabah yang dinyatakan dalam persentase.
l. Butir Hampa Butir gabah yang tidak berkembang secara sempurna akibat serangan hama, penyakit, atau sebab lain sehingga tidak berisi butir beras meskipun kedua tungkup sekamnya tertutup ataupun terbuka. Butir gabah setengah hampa tergolong dalam butir hampa.
m. Kotoran Segala benda asing yang tidak tergolong bagian dari gabah, misalnya debu, butiran tanah, butiran pasir, batu kerikil, potongan kayu, potongan logam, tangkai padi, biji-bijian lain, bangkai serangga, dan lain sebagainya. Termasuk dalam kategori kotoran adalah butiran gabah yang telah terkelupas (beras pecah kulit) dan gabah patah.
n. Indeks Kedalaman Harga Gabah di Bawah HPPUkuran rata-rata kesenjangan harga gabah hasil observasi terhadap garis HPP, dimana semakin tinggi nilai indeks berarti semakin jauh terhadap HPP.
o. Indeks Keparahan Harga Gabah di Bawah HPPGambaran distribusi harga transaksi yang berada di bawah HPP, dimana semakin tinggi nilai indeks berarti semakin lebar kesenjangan harga terhadap HPP.
h. Dried Harvested Grain
Grains containing a maximum water and hollow/dirt content of 25.0 percent and 10.0 percent respectively.
i. Low-Quality GrainGrains containing more than 25.0 percent water and more than 10.0 percent hollow/dirt.
j. Water ContentThe amount of grain moisture content which is expressed as a percentage of wet weight.
k. Hollow/Dirt ContentThe amount of empty grain and waste grain content which is expressed as a percentage.
l. Empty GrainGrains grow not entirely caused by pest, diseases, or other reasons that do not contain grains of rice husk although both of peel are closed or opened.
m. Waste GrainAny foreign object is not considered as part of the grain, such as dust, ground grain, sand, gravel, pieces of wood, metal pieces, rice straw, other grain, dead bugs, and so on. Included in the category of waste grain pellets that have peeled (skin broken rice) and grain fractured.
n. Depth Index of Paddy Price Under HPP Measurement of gap average of paddy price to HPP line, where the higher index value indicates the larger gap from HPP.
o. Severity Index of Paddy Price Under HPPDescription of the transaction price distribution under HPP, where the higher index value indicates the wider disparity of HPP.
http
://www.b
ps.g
o.id
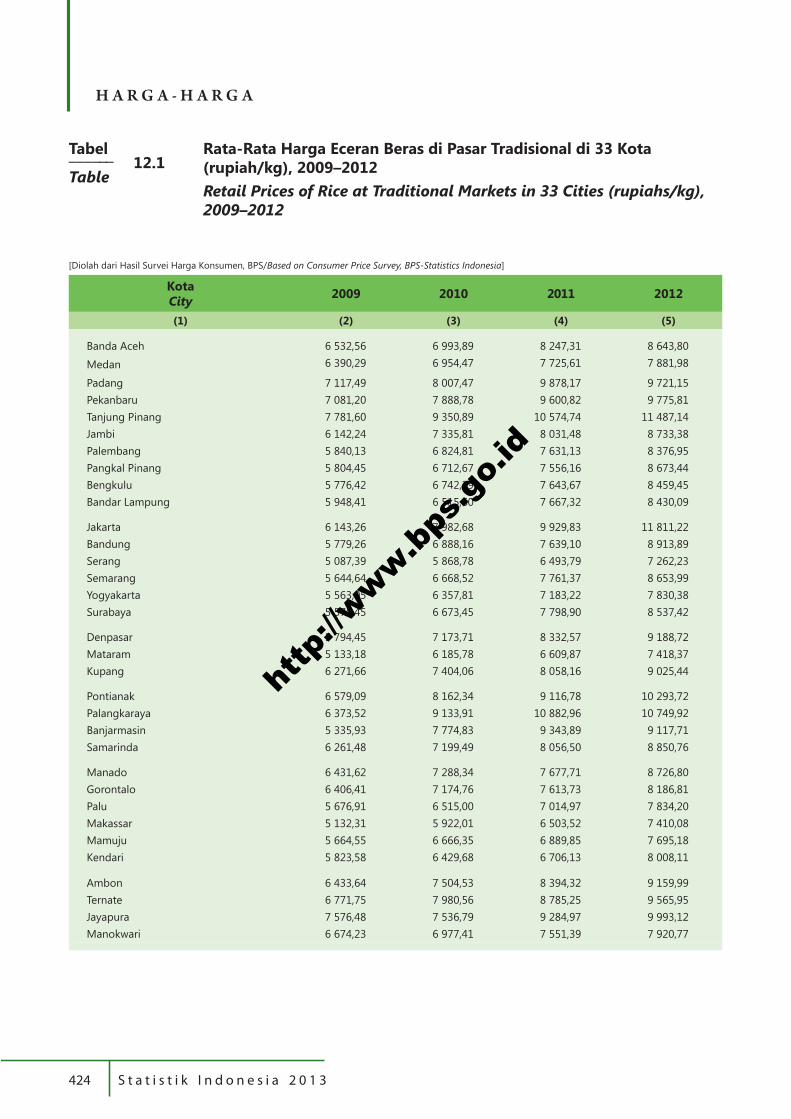
H A R G A - H A R G A
S t a t i s t i k I n d o n e s i a 2 0 1 3424
[Diolah dari Hasil Survei Harga Konsumen, BPS/Based on Consumer Price Survey, BPS-Statistics Indonesia]
KotaCity 2009 2010 2011 2012
(1) (2) (3) (4) (5)
Banda Aceh 6 532,56 6 993,89 8 247,31 8 643,80
Medan 6 390,29 6 954,47 7 725,61 7 881,98
Padang 7 117,49 8 007,47 9 878,17 9 721,15Pekanbaru 7 081,20 7 888,78 9 600,82 9 775,81Tanjung Pinang 7 781,60 9 350,89 10 574,74 11 487,14Jambi 6 142,24 7 335,81 8 031,48 8 733,38Palembang 5 840,13 6 824,81 7 631,13 8 376,95Pangkal Pinang 5 804,45 6 712,67 7 556,16 8 673,44Bengkulu 5 776,42 6 742,39 7 643,67 8 459,45Bandar Lampung 5 948,41 6 515,60 7 667,32 8 430,09
Jakarta 6 143,26 7 982,68 9 929,83 11 811,22Bandung 5 779,26 6 888,16 7 639,10 8 913,89Serang 5 087,39 5 868,78 6 493,79 7 262,23Semarang 5 644,64 6 668,52 7 761,37 8 653,99Yogyakarta 5 563,05 6 357,81 7 183,22 7 830,38Surabaya 5 578,45 6 673,45 7 798,90 8 537,42
Denpasar 5 794,45 7 173,71 8 332,57 9 188,72Mataram 5 133,18 6 185,78 6 609,87 7 418,37Kupang 6 271,66 7 404,06 8 058,16 9 025,44
Pontianak 6 579,09 8 162,34 9 116,78 10 293,72Palangkaraya 6 373,52 9 133,91 10 882,96 10 749,92Banjarmasin 5 335,93 7 774,83 9 343,89 9 117,71Samarinda 6 261,48 7 199,49 8 056,50 8 850,76
Manado 6 431,62 7 288,34 7 677,71 8 726,80Gorontalo 6 406,41 7 174,76 7 613,73 8 186,81Palu 5 676,91 6 515,00 7 014,97 7 834,20Makassar 5 132,31 5 922,01 6 503,52 7 410,08Mamuju 5 664,55 6 666,35 6 889,85 7 695,18Kendari 5 823,58 6 429,68 6 706,13 8 008,11
Ambon 6 433,64 7 504,53 8 394,32 9 159,99Ternate 6 771,75 7 980,56 8 785,25 9 565,95Jayapura 7 576,48 7 536,79 9 284,97 9 993,12Manokwari 6 674,23 6 977,41 7 551,39 7 920,77
Rata-Rata Harga Eceran Beras di Pasar Tradisional di 33 Kota (rupiah/kg), 2009–2012Retail Prices of Rice at Traditional Markets in 33 Cities (rupiahs/kg), 2009–2012
Tabel ––––––
12.1Table
http
://www.b
ps.g
o.id
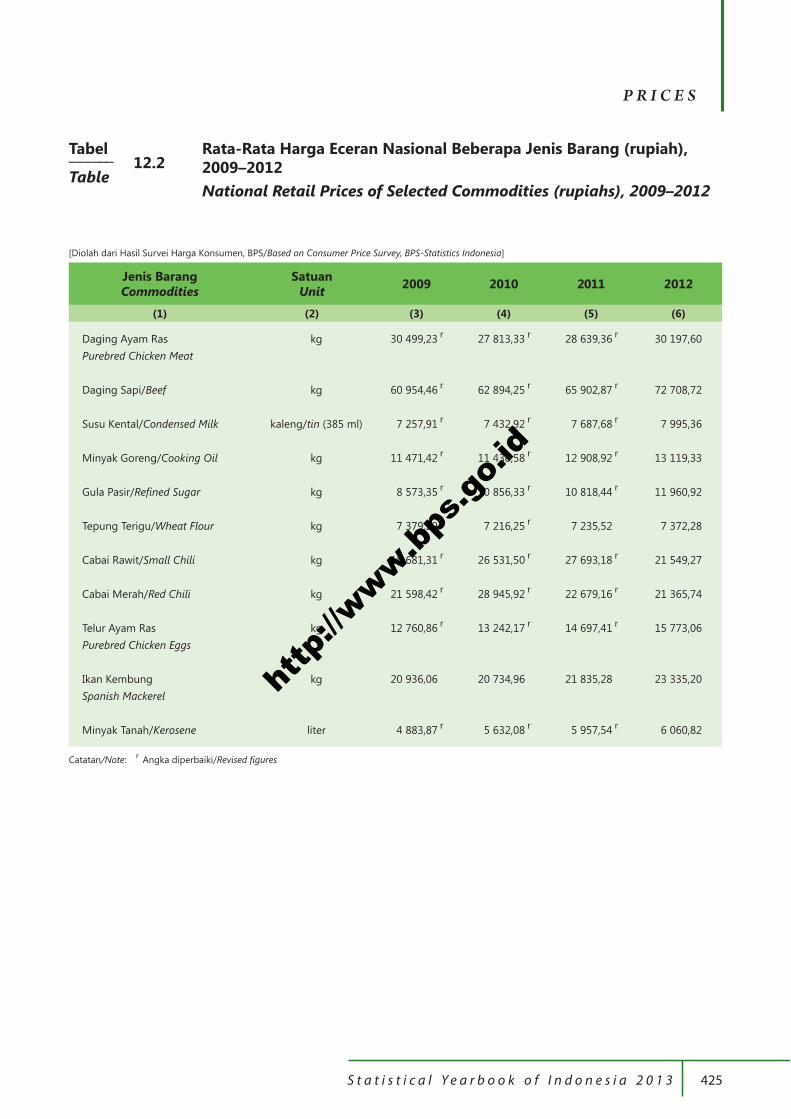
P R I C E S
S t a t i s t i c a l Y e a r b o o k o f I n d o n e s i a 2 0 1 3 425
Rata-Rata Harga Eceran Nasional Beberapa Jenis Barang (rupiah), 2009–2012National Retail Prices of Selected Commodities (rupiahs), 2009–2012
[Diolah dari Hasil Survei Harga Konsumen, BPS/Based on Consumer Price Survey, BPS-Statistics Indonesia]
Jenis BarangCommodities
SatuanUnit 2009 2010 2011 2012
(1) (2) (3) (4) (5) (6)
Daging Ayam Ras kg 30 499,23 r 27 813,33 r 28 639,36 r 30 197,60Purebred Chicken Meat
Daging Sapi/Beef kg 60 954,46 r 62 894,25 r 65 902,87 r 72 708,72
Susu Kental/Condensed Milk kaleng/tin (385 ml) 7 257,91 r 7 432,92 r 7 687,68 r 7 995,36
Minyak Goreng/Cooking Oil kg 11 471,42 r 11 438,58 r 12 908,92 r 13 119,33
Gula Pasir/Refined Sugar kg 8 573,35 r 10 856,33 r 10 818,44 r 11 960,92
Tepung Terigu/Wheat Flour kg 7 379,29 r 7 216,25 r 7 235,52 7 372,28
Cabai Rawit/Small Chili kg 18 681,31 r 26 531,50 r 27 693,18 r 21 549,27
Cabai Merah/Red Chili kg 21 598,42 r 28 945,92 r 22 679,16 r 21 365,74
Telur Ayam Ras kg 12 760,86 r 13 242,17 r 14 697,41 r 15 773,06Purebred Chicken Eggs
Ikan Kembung kg 20 936,06 20 734,96 21 835,28 23 335,20Spanish Mackerel
Minyak Tanah/Kerosene liter 4 883,87 r 5 632,08 r 5 957,54 r 6 060,82
Catatan/Note: r Angka diperbaiki/Revised figures
Tabel ––––––
12.2Table
http
://www.b
ps.g
o.id

H A R G A - H A R G A
S t a t i s t i k I n d o n e s i a 2 0 1 3426
Indeks Harga Konsumen Gabungan 66 Kota (2007=100), 2009–2012Composite Consumer Price Indices of 66 Cities (2007=100), 2009–2012
[Diolah dari Hasil Survei Harga Konsumen, BPS/Based on Consumer Price Survey, BPS-Statistics Indonesia]
Kelompok dan SubkelompokGroups dan Subgroups 2009 2010 2011 2012
(1) (2) (3) (4) (5)
Indeks Umum/General Index 115,06 120,97 127,45 132,90
I Bahan Makanan/Foodstuff 125,13 136,92 148,62 157,32
A Padi-padian, Umbi-umbian, dan Hasilnya 114,12 134,06 153,83 170,83Cereals, Cassava, and Their Products
B Daging dan Hasil-hasilnya 129,09 136,71 142,20 152,06Meat and Its Products
C Ikan Segar/Fresh Fish 131,87 132,64 143,41 152,23D Ikan Diawetkan/Preserved Fish 132,41 135,69 147,30 156,03E Telur, Susu, dan Hasil-hasilnya 124,24 126,86 133,49 140,18
Eggs, Milk, and Their ProductsF Sayur-sayuran/Vegetables 128,65 144,23 156,48 165,79G Kacang-kacangan/Beans and Nuts 154,97 158,95 170,28 183,29H Buah-buahan/Fruits 125,74 136,98 149,10 159,02I Bumbu-bumbuan/Spices 125,24 164,31 165,72 150,69J Lemak dan Minyak/Fats and Oils 122,25 122,26 138,06 140,82K Bahan Makanan Lainnya 112,31 116,15 123,26 131,76
Other Food Items
II Makanan Jadi, Minuman, Rokok, dan Tembakau 119,82 129,25 135,84 143,41Prepared Food, Beverages, and Tobacco Products
A Makanan Jadi/Prepared Food 121,45 129,97 136,21 142,04B Minuman yang Tidak Beralkohol 117,91 129,74 133,26 140,90
Non-alcoholic BeveragesC Tembakau dan Minuman Beralkohol 116,87 126,59 136,95 149,63
Tobacco and Alcoholic Beverages
III Perumahan, Air, Listrik, Gas, dan Bahan Bakar 113,97 117,34 122,24 126,35Housing, Water, Electricity, Gas, and Fuel
A Biaya Tempat Tinggal/Cost for Housing 112,40 115,38 120,44 125,65B Bahan Bakar, Penerangan, dan Air 122,87 128,38 134,16 136,23
Fuel, Electricity, and WaterC Perlengkapan Rumah Tangga/Household Equipment 108,68 111,10 113,84 116,32D Penyelenggaraan Rumah Tangga 112,28 114,22 118,35 122,68
Household Operation
IV Sandang/Clothing 115,93 121,22 131,36 139,21
A Sandang Laki-laki/Clothing for Men 108,48 113,34 118,46 124,07B Sandang Wanita/Clothing for Women 106,25 109,09 111,85 115,78C Sandang Anak-anak/Clothing for Children 106,85 110,65 114,38 119,58D Barang Pribadi dan Sandang Lain/Personal Items 138,17 148,00 174,62 191,24
Tabel ––––––
12.3Table
http
://www.b
ps.g
o.id
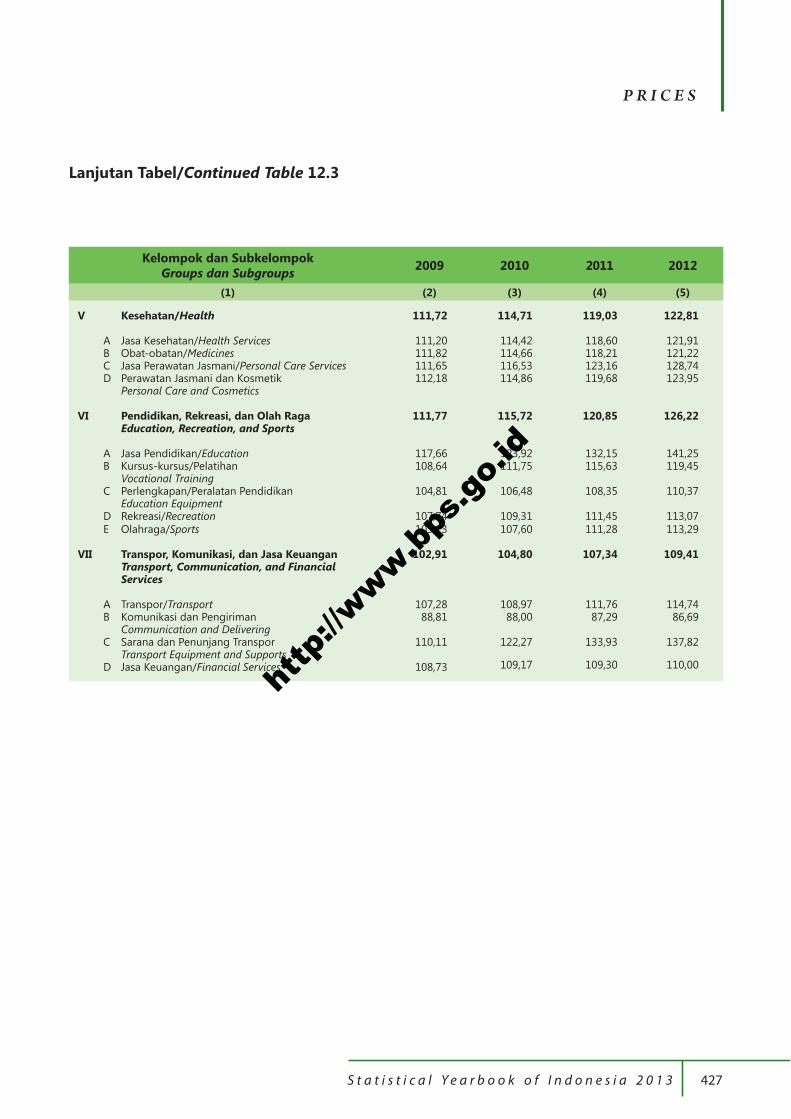
P R I C E S
S t a t i s t i c a l Y e a r b o o k o f I n d o n e s i a 2 0 1 3 427
Kelompok dan SubkelompokGroups dan Subgroups 2009 2010 2011 2012
(1) (2) (3) (4) (5)
V Kesehatan/Health 111,72 114,71 119,03 122,81
A Jasa Kesehatan/Health Services 111,20 114,42 118,60 121,91B Obat-obatan/Medicines 111,82 114,66 118,21 121,22C Jasa Perawatan Jasmani/Personal Care Services 111,65 116,53 123,16 128,74D Perawatan Jasmani dan Kosmetik 112,18 114,86 119,68 123,95
Personal Care and Cosmetics
VI Pendidikan, Rekreasi, dan Olah Raga 111,77 115,72 120,85 126,22Education, Recreation, and Sports
A Jasa Pendidikan/Education 117,66 123,92 132,15 141,25B Kursus-kursus/Pelatihan 108,64 111,75 115,63 119,45
Vocational TrainingC Perlengkapan/Peralatan Pendidikan 104,81 106,48 108,35 110,37
Education Equipment D Rekreasi/Recreation 107,74 109,31 111,45 113,07E Olahraga/Sports 105,13 107,60 111,28 113,29
VII Transpor, Komunikasi, dan Jasa Keuangan 102,91 104,80 107,34 109,41Transport, Communication, and Financial Services
A Transpor/Transport 107,28 108,97 111,76 114,74B Komunikasi dan Pengiriman 88,81 88,00 87,29 86,69
Communication and DeliveringC Sarana dan Penunjang Transpor 110,11 122,27 133,93 137,82
Transport Equipment and SupportsD Jasa Keuangan/Financial Services 108,73 109,17 109,30 110,00
Lanjutan Tabel/Continued Table 12.3
http
://www.b
ps.g
o.id

H A R G A - H A R G A
S t a t i s t i k I n d o n e s i a 2 0 1 3428
Indeks Harga Konsumen di 66 Kota (2007=100), 2011 dan 2012Consumer Price Indices in 66 Cities (2007=100), 2011 and 2012
[Diolah dari Hasil Survei Harga Konsumen, BPS/Based on Consumer Price Survey, BPS-Statistics Indonesia]
KotaCity
UmumGeneral
Bahan MakananFoodstuff
Makan Jadi, Minuman, Rokok, dan Tembakau
Prepared Food, Beverages, and Tobacco
Products
Perumahan, Air, Listrik, Gas, dan Bahan Bakar
Housing, Water, Electricity, Gas, and Fuel
2011 2012 2011 2012 2011 2012 2011 2012
(1) (2) (3) (4) (5) (6) (7) (8) (9)
Banda Aceh 124,90 127,19 139,43 139,98 126,37 130,42 117,59 119,62Lhokseumawe 130,52 134,79 146,79 152,65 129,92 134,11 127,45 130,49Sibolga 133,12 139,49 148,37 156,98 140,70 147,92 125,88 133,50Pematang Siantar 130,18 137,18 151,07 158,68 142,13 152,78 114,77 118,54Medan 127,85 132,93 141,75 144,86 132,61 138,25 125,27 129,23Padang Sidempuan 128,81 134,56 145,56 148,81 121,36 133,90 125,45 131,89Padang 131,19 136,87 155,29 158,61 140,43 150,83 119,84 123,10Pekanbaru 126,21 131,80 145,04 149,93 135,00 144,27 119,20 123,88Dumai 131,26 135,55 153,71 155,66 140,47 147,06 118,58 123,81Batam 123,12 126,45 136,06 142,13 131,60 134,80 118,28 119,88Tanjung Pinang 128,27 132,19 147,89 153,53 138,34 143,51 114,66 118,02Jambi 130,71 136,62 149,22 151,68 149,50 161,23 118,70 127,33Palembang 127,16 131,41 149,72 155,88 130,39 136,33 124,21 127,61Pangkal Pinang 137,80 145,99 146,57 155,69 159,08 169,17 130,73 139,21Bengkulu 133,48 139,14 158,62 163,59 142,93 151,81 132,97 136,71Bandar Lampung 138,63 144,28 151,74 159,04 163,30 172,52 138,19 141,71Jakarta 125,33 130,55 148,48 160,31 138,57 146,36 121,87 124,65Bogor 128,15 132,28 151,40 157,42 129,75 135,11 119,80 122,51Sukabumi 126,95 132,99 140,72 151,03 134,08 139,86 128,38 133,35Bandung 121,47 126,67 138,03 148,63 127,16 134,89 114,46 117,87Cirebon 131,24 136,52 145,19 155,45 135,15 138,68 123,46 125,38Bekasi 125,61 130,72 149,01 156,37 128,33 132,47 112,14 117,59Depok 126,18 131,18 155,75 166,11 142,74 154,01 116,10 119,03Tasikmalaya 128,90 134,96 145,48 161,18 131,62 135,47 134,52 139,32Serang 130,97 136,65 144,87 153,86 134,46 140,66 134,95 139,64Tangerang 128,17 133,59 149,81 156,93 136,20 145,59 122,81 125,71Cilegon 126,81 131,54 136,23 143,75 137,44 141,92 128,18 131,35Purwokerto 125,99 131,29 141,37 150,27 128,39 134,70 124,63 129,51Surakarta 118,86 122,84 140,36 146,03 116,48 122,22 119,81 122,58Semarang 125,94 131,63 140,75 150,79 133,93 141,00 125,49 129,45Tegal 128,40 132,49 142,69 149,56 144,93 148,82 119,10 120,71Yogyakarta 127,78 132,74 150,48 158,75 132,67 140,45 126,83 130,63Jember 128,09 132,87 152,71 157,53 136,48 145,39 124,23 130,60Sumenep 123,76 130,57 143,51 157,63 126,01 130,86 118,71 122,84Kediri 125,68 131,71 141,56 149,78 132,06 141,36 123,61 128,54Malang 127,09 132,53 150,92 160,28 134,90 141,26 117,16 119,55
Tabel ––––––
12.4Table
http
://www.b
ps.g
o.id

P R I C E S
S t a t i s t i c a l Y e a r b o o k o f I n d o n e s i a 2 0 1 3 429
KotaCity
SandangClothing
KesehatanHealth
Pendidikan, Rekreasi, dan Olah Raga
Education, Recreation, and Sports
Transpor, Komunikasi, dan Jasa Keuangan
Transport, Communication, and
Financial Services
2011 2012 2011 2012 2011 2012 2011 2012
(1) (10) (11) (12) (13) (14) (15) (16) (17)
Banda Aceh 155,88 164,95 143,90 145,43 114,46 116,62 96,82 97,46Lhokseumawe 134,01 140,18 115,34 117,49 123,74 129,26 97,44 98,63Sibolga 147,75 155,35 112,43 114,16 119,46 122,71 105,05 106,09Pematang Siantar 121,15 128,78 119,18 127,75 136,27 147,89 102,48 105,80Medan 139,63 154,68 119,00 122,52 126,76 131,35 107,28 113,16Padang Sidempuan 147,44 160,15 107,83 109,67 125,19 130,70 108,25 106,79Padang 121,73 136,52 119,12 124,68 117,89 127,22 112,90 115,74Pekanbaru 136,72 143,37 116,25 123,22 124,94 134,12 101,40 103,27Dumai 127,92 137,91 111,76 114,60 118,74 126,40 115,29 116,45Batam 150,51 154,14 118,90 121,42 121,83 129,28 101,63 103,19Tanjung Pinang 128,38 131,97 114,28 118,17 117,89 121,69 112,26 113,00Jambi 127,76 134,01 120,25 122,27 121,02 130,17 107,16 109,27Palembang 141,57 148,28 116,84 120,33 116,10 119,40 102,23 103,57Pangkal Pinang 134,12 142,89 131,02 140,52 147,64 163,28 108,15 108,91Bengkulu 137,21 147,46 119,51 124,52 123,46 135,37 102,42 104,74Bandar Lampung 137,09 143,04 124,57 128,97 132,91 143,20 102,52 103,91Jakarta 131,91 140,01 116,54 119,33 114,32 116,87 107,47 109,81Bogor 115,97 118,82 120,60 123,36 127,04 135,24 107,12 107,86Sukabumi 127,07 134,63 116,05 121,38 109,61 115,18 103,36 104,07Bandung 115,25 116,02 125,61 127,97 124,33 130,31 107,17 107,92Cirebon 135,16 140,00 138,31 144,57 159,34 184,45 107,69 108,14Bekasi 135,37 149,38 125,31 133,63 113,24 116,39 113,90 114,99Depok 120,51 125,61 111,23 112,72 116,02 116,65 105,24 105,30Tasikmalaya 121,44 126,62 114,01 118,30 115,88 119,31 105,10 105,81Serang 143,84 155,22 122,42 125,15 121,55 123,99 104,15 105,72Tangerang 134,76 142,59 126,41 134,25 122,81 132,07 106,89 108,19Cilegon 118,03 124,67 111,78 113,64 109,54 120,02 110,78 111,17Purwokerto 116,07 118,93 130,10 130,79 117,62 121,96 105,99 107,52Surakarta 109,51 114,28 112,45 115,02 108,42 111,99 102,78 104,70Semarang 132,97 137,54 114,52 117,20 115,91 121,08 105,68 108,54Tegal 133,31 141,08 110,15 112,19 125,70 130,86 102,14 105,36Yogyakarta 131,24 139,59 119,54 122,10 120,49 122,47 109,29 111,32Jember 125,71 131,24 115,37 116,95 117,96 121,47 106,15 107,13Sumenep 131,88 142,84 113,13 119,21 119,35 124,32 101,22 101,64Kediri 130,21 138,07 117,94 122,58 134,10 141,35 104,24 106,01Malang 131,14 138,04 117,67 119,66 127,12 135,72 107,08 109,99
Lanjutan Tabel/Continued Table 12.4
http
://www.b
ps.g
o.id
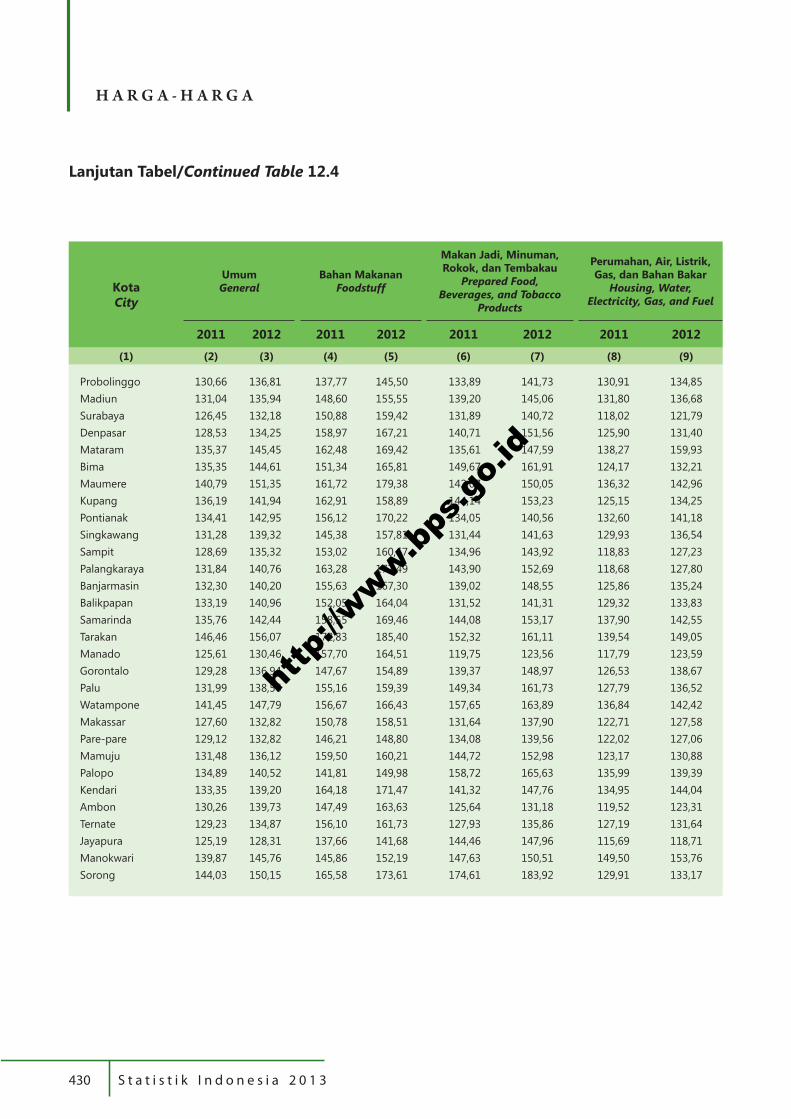
H A R G A - H A R G A
S t a t i s t i k I n d o n e s i a 2 0 1 3430
KotaCity
UmumGeneral
Bahan MakananFoodstuff
Makan Jadi, Minuman, Rokok, dan Tembakau
Prepared Food, Beverages, and Tobacco
Products
Perumahan, Air, Listrik, Gas, dan Bahan Bakar
Housing, Water, Electricity, Gas, and Fuel
2011 2012 2011 2012 2011 2012 2011 2012
(1) (2) (3) (4) (5) (6) (7) (8) (9)
Probolinggo 130,66 136,81 137,77 145,50 133,89 141,73 130,91 134,85Madiun 131,04 135,94 148,60 155,55 139,20 145,06 131,80 136,68Surabaya 126,45 132,18 150,88 159,42 131,89 140,72 118,02 121,79Denpasar 128,53 134,25 158,97 167,21 140,71 151,56 125,90 131,40Mataram 135,37 145,45 162,48 169,42 135,61 147,59 138,27 159,93Bima 135,35 144,61 151,34 165,81 149,67 161,91 124,17 132,21Maumere 140,79 151,35 161,72 179,38 142,07 150,05 136,32 142,96Kupang 136,19 141,94 162,91 158,89 144,14 153,23 125,15 134,25Pontianak 134,41 142,95 156,12 170,22 134,05 140,56 132,60 141,18Singkawang 131,28 139,32 145,38 157,81 131,44 141,63 129,93 136,54Sampit 128,69 135,32 153,02 160,67 134,96 143,92 118,83 127,23Palangkaraya 131,84 140,76 163,28 177,49 143,90 152,69 118,68 127,80Banjarmasin 132,30 140,20 155,63 167,30 139,02 148,55 125,86 135,24Balikpapan 133,19 140,96 152,05 164,04 131,52 141,31 129,32 133,83Samarinda 135,76 142,44 158,55 169,46 144,08 153,17 137,90 142,55Tarakan 146,46 156,07 172,83 185,40 152,32 161,11 139,54 149,05Manado 125,61 130,46 157,70 164,51 119,75 123,56 117,79 123,59Gorontalo 129,28 136,94 147,67 154,89 139,37 148,97 126,53 138,67Palu 131,99 138,56 155,16 159,39 149,34 161,73 127,79 136,52Watampone 141,45 147,79 156,67 166,43 157,65 163,89 136,84 142,42Makassar 127,60 132,82 150,78 158,51 131,64 137,90 122,71 127,58Pare-pare 129,12 132,82 146,21 148,80 134,08 139,56 122,02 127,06Mamuju 131,48 136,12 159,50 160,21 144,72 152,98 123,17 130,88Palopo 134,89 140,52 141,81 149,98 158,72 165,63 135,99 139,39Kendari 133,35 139,20 164,18 171,47 141,32 147,76 134,95 144,04Ambon 130,26 139,73 147,49 163,63 125,64 131,18 119,52 123,31Ternate 129,23 134,87 156,10 161,73 127,93 135,86 127,19 131,64Jayapura 125,19 128,31 137,66 141,68 144,46 147,96 115,69 118,71Manokwari 139,87 145,76 145,86 152,19 147,63 150,51 149,50 153,76Sorong 144,03 150,15 165,58 173,61 174,61 183,92 129,91 133,17
Lanjutan Tabel/Continued Table 12.4
http
://www.b
ps.g
o.id
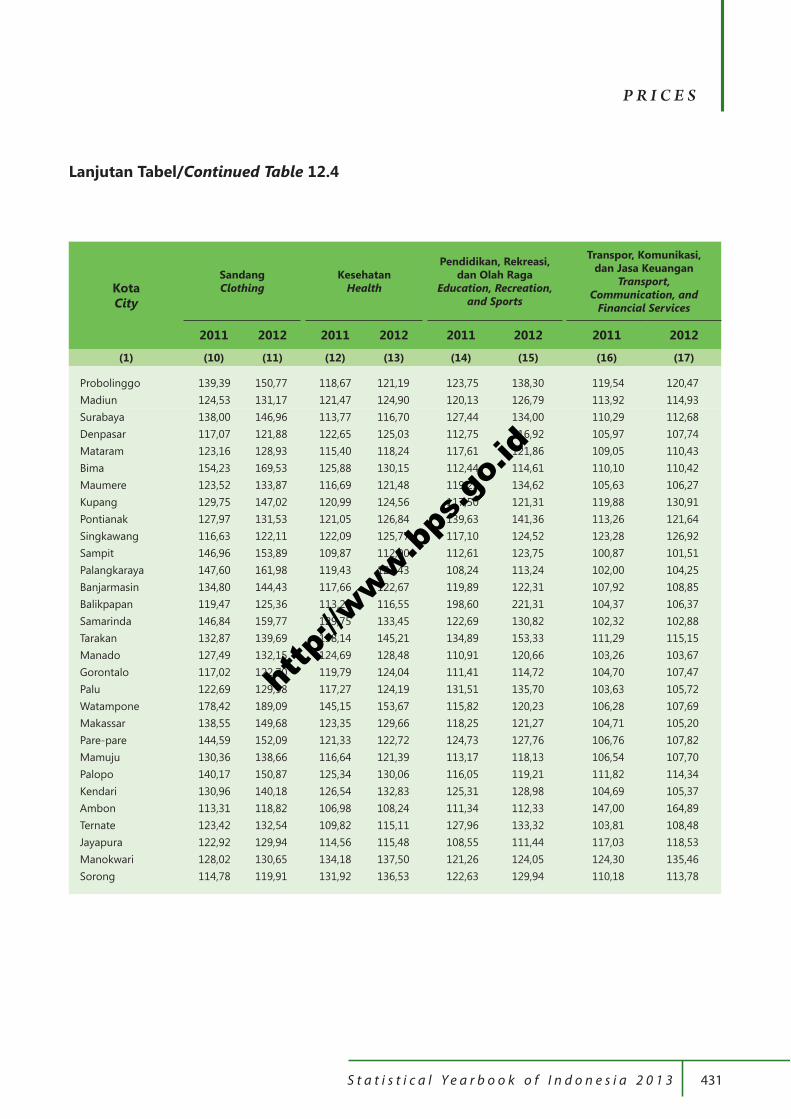
P R I C E S
S t a t i s t i c a l Y e a r b o o k o f I n d o n e s i a 2 0 1 3 431
KotaCity
SandangClothing
KesehatanHealth
Pendidikan, Rekreasi, dan Olah Raga
Education, Recreation, and Sports
Transpor, Komunikasi, dan Jasa Keuangan
Transport, Communication, and
Financial Services
2011 2012 2011 2012 2011 2012 2011 2012
(1) (10) (11) (12) (13) (14) (15) (16) (17)
Probolinggo 139,39 150,77 118,67 121,19 123,75 138,30 119,54 120,47Madiun 124,53 131,17 121,47 124,90 120,13 126,79 113,92 114,93Surabaya 138,00 146,96 113,77 116,70 127,44 134,00 110,29 112,68Denpasar 117,07 121,88 122,65 125,03 112,75 116,92 105,97 107,74Mataram 123,16 128,93 115,40 118,24 117,61 121,86 109,05 110,43Bima 154,23 169,53 125,88 130,15 112,44 114,61 110,10 110,42Maumere 123,52 133,87 116,69 121,48 119,23 134,62 105,63 106,27Kupang 129,75 147,02 120,99 124,56 117,50 121,31 119,88 130,91Pontianak 127,97 131,53 121,05 126,84 139,63 141,36 113,26 121,64Singkawang 116,63 122,11 122,09 125,77 117,10 124,52 123,28 126,92Sampit 146,96 153,89 109,87 112,90 112,61 123,75 100,87 101,51Palangkaraya 147,60 161,98 119,43 127,43 108,24 113,24 102,00 104,25Banjarmasin 134,80 144,43 117,66 122,67 119,89 122,31 107,92 108,85Balikpapan 119,47 125,36 113,28 116,55 198,60 221,31 104,37 106,37Samarinda 146,84 159,77 129,75 133,45 122,69 130,82 102,32 102,88Tarakan 132,87 139,69 138,14 145,21 134,89 153,33 111,29 115,15Manado 127,49 132,15 124,69 128,48 110,91 120,66 103,26 103,67Gorontalo 117,02 122,70 119,79 124,04 111,41 114,72 104,70 107,47Palu 122,69 129,98 117,27 124,19 131,51 135,70 103,63 105,72Watampone 178,42 189,09 145,15 153,67 115,82 120,23 106,28 107,69Makassar 138,55 149,68 123,35 129,66 118,25 121,27 104,71 105,20Pare-pare 144,59 152,09 121,33 122,72 124,73 127,76 106,76 107,82Mamuju 130,36 138,66 116,64 121,39 113,17 118,13 106,54 107,70Palopo 140,17 150,87 125,34 130,06 116,05 119,21 111,82 114,34Kendari 130,96 140,18 126,54 132,83 125,31 128,98 104,69 105,37Ambon 113,31 118,82 106,98 108,24 111,34 112,33 147,00 164,89Ternate 123,42 132,54 109,82 115,11 127,96 133,32 103,81 108,48Jayapura 122,92 129,94 114,56 115,48 108,55 111,44 117,03 118,53Manokwari 128,02 130,65 134,18 137,50 121,26 124,05 124,30 135,46Sorong 114,78 119,91 131,92 136,53 122,63 129,94 110,18 113,78
Lanjutan Tabel/Continued Table 12.4
http
://www.b
ps.g
o.id

H A R G A - H A R G A
S t a t i s t i k I n d o n e s i a 2 0 1 3432
Laju Inflasi Gabungan 66 Kota (2007=100), 2009–2012Composite Inflation Rate of 66 Cities (2007=100), 2009–2012
[Diolah dari Hasil Survei Harga Konsumen, BPS/Based on Consumer Price Survey, BPS-Statistics Indonesia]
KelompokGroup 2009 2010 2011 2012
(1) (2) (3) (4) (5)
Umum/General 2,78 6,96 3,79 4,30
I. Bahan Makanan/Foodstuff 3,88 15,64 3,64 5,68
II. Makanan Jadi, Minuman, Rokok, dan Tembakau Prepared Food, Beverages, and Tobacco Products
7,81 6,96 4,51 6,11
III. Perumahan, Air, Listrik, Gas, dan Bahan Bakar Housing, Water, Electricity, Gas, and Fuel
1,83 4,08 3,47 3,35
IV. Sandang/Clothing 6,00 6,51 7,57 4,67
V. Kesehatan/Health 3,89 2,19 4,26 2,91
VI. Pendidikan, Rekreasi, dan Olahraga Education, Recreation, and Sports
3,89 3,29 5,16 4,21
VII. Transpor, Komunikasi, dan Jasa Keuangan Transport, Communication, and Financial Services
-3,67 2,69 1,92 2,20
Tabel ––––––
12.5Table
http
://www.b
ps.g
o.id
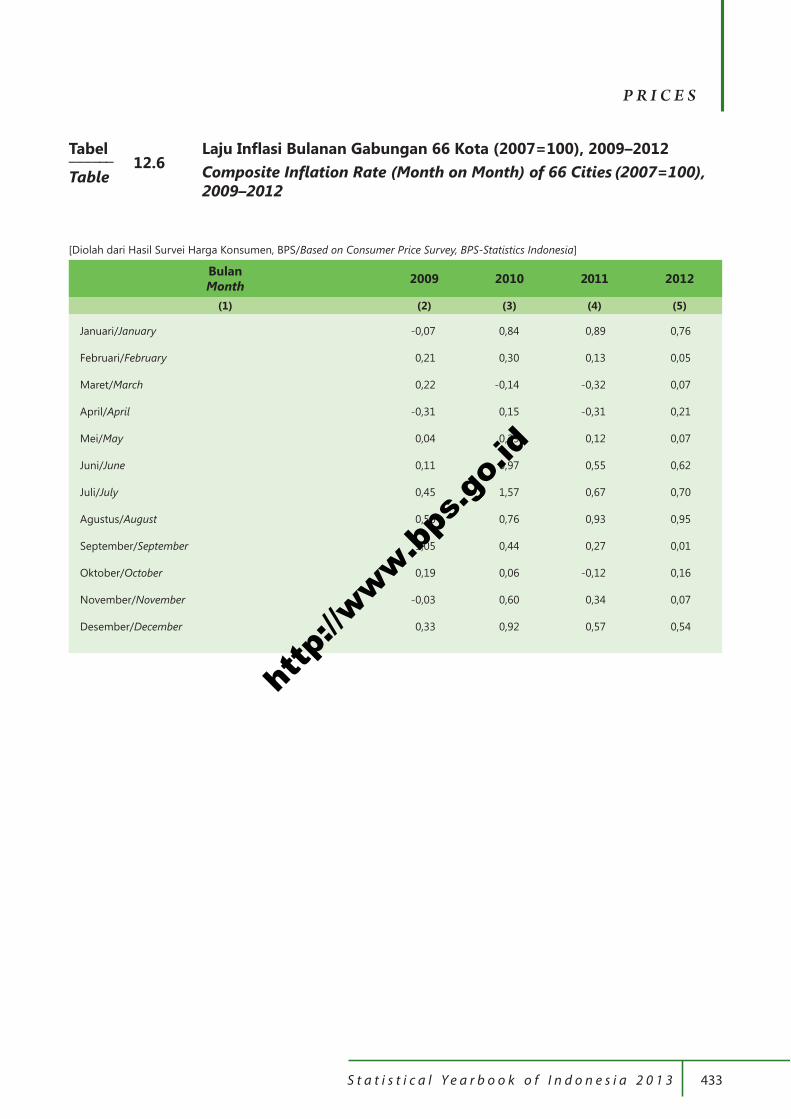
P R I C E S
S t a t i s t i c a l Y e a r b o o k o f I n d o n e s i a 2 0 1 3 433
Laju Inflasi Bulanan Gabungan 66 Kota (2007=100), 2009–2012Composite Inflation Rate (Month on Month) of 66 Cities (2007=100), 2009–2012
[Diolah dari Hasil Survei Harga Konsumen, BPS/Based on Consumer Price Survey, BPS-Statistics Indonesia]
BulanMonth 2009 2010 2011 2012
(1) (2) (3) (4) (5)
Januari/January -0,07 0,84 0,89 0,76
Februari/February 0,21 0,30 0,13 0,05
Maret/March 0,22 -0,14 -0,32 0,07
April/April -0,31 0,15 -0,31 0,21
Mei/May 0,04 0,29 0,12 0,07
Juni/June 0,11 0,97 0,55 0,62
Juli/July 0,45 1,57 0,67 0,70
Agustus/August 0,56 0,76 0,93 0,95
September/September 1,05 0,44 0,27 0,01
Oktober/October 0,19 0,06 -0,12 0,16
November/November -0,03 0,60 0,34 0,07
Desember/December 0,33 0,92 0,57 0,54
Tabel ––––––
12.6Table
http
://www.b
ps.g
o.id

H A R G A - H A R G A
S t a t i s t i k I n d o n e s i a 2 0 1 3434
Laju Inflasi Tahun Kalender Gabungan 66 Kota (2007=100), 2009–2012Composite Inflation Rate of Calender Year of 66 Cities (2007=100), 2009–2012
[Diolah dari Hasil Survei Harga Konsumen, BPS/Based on Consumer Price Survey, BPS-Statistics Indonesia]
BulanMonth 2009 2010 2011 2012
(1) (2) (3) (4) (5)
Januari/January -0,07 0,84 0,89 0,76
Februari/February 0,14 1,14 1,03 0,81
Maret/March 0,36 0,99 0,70 0,88
April/April 0,05 1,15 0,39 1,09
Mei/May 0,10 1,44 0,51 1,15
Juni/June 0,21 2,42 1,06 1,79
Juli/July 0,66 4,02 1,74 2,50
Agustus/August 1,22 4,82 2,69 3,48
September/September 2,28 5,28 2,97 3,49
Oktober/October 2,48 5,35 2,85 3,66
November/November 2,45 5,98 3,20 3,73
Desember/December 2,78 6,96 3,79 4,30
Tabel ––––––
12.7Table
http
://www.b
ps.g
o.id

P R I C E S
S t a t i s t i c a l Y e a r b o o k o f I n d o n e s i a 2 0 1 3 435
Laju Inflasi Tahun ke Tahun Gabungan 66 Kota (2007=100), 2009–2012Composite Inflation Rate of Year on Year of 66 Cities (2007=100), 2009–2012
[Diolah dari Hasil Survei Harga Konsumen, BPS/Based on Consumer Price Survey, BPS-Statistics Indonesia]
BulanMonth 2009 2010 2011 2012
(1) (2) (3) (4) (5)
Januari/January 9,17 3,72 7,02 3,65
Februari/February 8,60 3,81 6,84 3,56
Maret/March 7,92 3,43 6,65 3,97
April/April 7,31 3,91 6,16 4,50
Mei/May 6,04 4,16 5,98 4,45
Juni/June 3,65 5,05 5,54 4,53
Juli/July 2,71 6,22 4,61 4,56
Agustus/August 2,75 6,44 4,79 4,58
September/September 2,83 5,80 4,61 4,31
Oktober/October 2,57 5,67 4,42 4,61
November/November 2,41 6,33 4,15 4,32
Desember/December 2,78 6,96 3,79 4,30
Tabel ––––––
12.8Table
http
://www.b
ps.g
o.id

H A R G A - H A R G A
S t a t i s t i k I n d o n e s i a 2 0 1 3436
Harga Perdagangan Besar Beberapa Hasil Pertanian dan Bahan Ekspor Utama di Jakarta (rupiah per kuintal), 2007–2012Wholesale Prices of Several Farm Crops and Major Export Commodities in Jakarta (rupiahs per quintal), 2007–2012
[Diolah dari Hasil Survei Harga Perdagangan Besar, BPS/Based on Wholesale Price Survey, BPS-Statistics Indonesia]
Jenis Barang/Commodity 2007 2008 2009 2010 2011 2012
(1) (2) (3) (4) (5) (6) (7)
Hasil Pertanian/Farm Crops
Beras/Rice–IR No I 539 798 552 760 546 643 677 188 724 479 873 750
Jagung kuning /Yellow maize 361 667 400 000 400 000 400 000 438 542 450 000
Kacang kedelai/Soybeans 440 833 704 583 620 833 600 000 644 792 650 000
Kacang hijau/Mung beans 761 250 791 667 976 250 1 390 625 1 455 208 1 100 000
Kacang tanah/Peanuts 1 124 444 1 208 125 1 209 375 1 328 125 1 527 083 1 544 792
Ketela pohon/Cassava 90 063 101 500 120 250 121 438 149 792 201 708
Ketela rambat/Sweet potatoes 121 854 182 208 156 375 249 250 220 729 272 792
Kentang/Potatoes 302 104 384 771 493 958 460 833 523 229 412 896
Bahan Ekspor UtamaMajor Export Commodities
Minyak sereh/Citronella oil 6 358 333 10 139 070 8 275 000 9 841 667 13 875 000 14 591 667
Minyak pala/Nutmeg oil 26 625 000 – 48 333 333 40 000 000 57 833 333 80 458 333
Minyak daun cengkeh/Clove oil 4 125 000 – 5 450 000 9 050 000 12 708 333 9 041 667
Lada putih/White pepper 3 614 658 4 170 833 3 764 167 4 681 883 7 267 417 8 096 200
Lada hitam/Black pepper 2 382 350 2 745 833 2 283 333 2 895 733 4 483 783 5 196 242
Tapioka “Tani”/Tapioca “Tani” 610 000 625 958 641 333 740 000 820 000 962 500
Kopra/Copra 403 333 578 042 371 250 518 542 747 917 527 708
Tabel ––––––
12.9Table
http
://www.b
ps.g
o.id
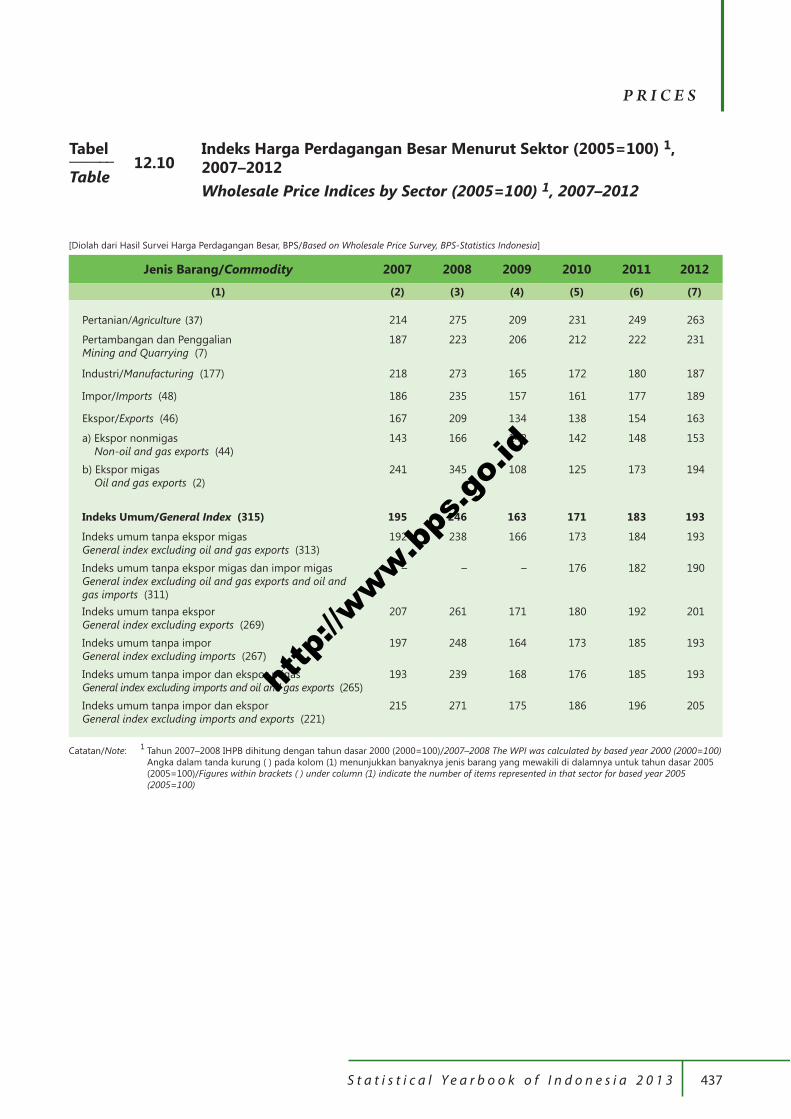
P R I C E S
S t a t i s t i c a l Y e a r b o o k o f I n d o n e s i a 2 0 1 3 437
Indeks Harga Perdagangan Besar Menurut Sektor (2005=100) 1, 2007–2012Wholesale Price Indices by Sector (2005=100) 1, 2007–2012
[Diolah dari Hasil Survei Harga Perdagangan Besar, BPS/Based on Wholesale Price Survey, BPS-Statistics Indonesia]
Jenis Barang/Commodity 2007 2008 2009 2010 2011 2012
(1) (2) (3) (4) (5) (6) (7)
Pertanian/Agriculture (37) 214 275 209 231 249 263
Pertambangan dan PenggalianMining and Quarrying (7)
187 223 206 212 222 231
Industri/Manufacturing (177) 218 273 165 172 180 187
Impor/Imports (48) 186 235 157 161 177 189
Ekspor/Exports (46) 167 209 134 138 154 163
a) Ekspor nonmigas Non-oil and gas exports (44)
143 166 142 142 148 153
b) Ekspor migas Oil and gas exports (2)
241 345 108 125 173 194
Indeks Umum/General Index (315) 195 246 163 171 183 193
Indeks umum tanpa ekspor migasGeneral index excluding oil and gas exports (313)
192 238 166 173 184 193
Indeks umum tanpa ekspor migas dan impor migasGeneral index excluding oil and gas exports and oil and gas imports (311)
– – – 176 182 190
Indeks umum tanpa eksporGeneral index excluding exports (269)
207 261 171 180 192 201
Indeks umum tanpa imporGeneral index excluding imports (267)
197 248 164 173 185 193
Indeks umum tanpa impor dan ekspor migasGeneral index excluding imports and oil and gas exports (265)
193 239 168 176 185 193
Indeks umum tanpa impor dan eksporGeneral index excluding imports and exports (221)
215 271 175 186 196 205
Catatan/Note: 1 Tahun 2007–2008 IHPB dihitung dengan tahun dasar 2000 (2000=100)/2007–2008 The WPI was calculated by based year 2000 (2000=100) Angka dalam tanda kurung ( ) pada kolom (1) menunjukkan banyaknya jenis barang yang mewakili di dalamnya untuk tahun dasar 2005 (2005=100)/Figures within brackets ( ) under column (1) indicate the number of items represented in that sector for based year 2005 (2005=100)
Tabel ––––––
12.10Table
http
://www.b
ps.g
o.id
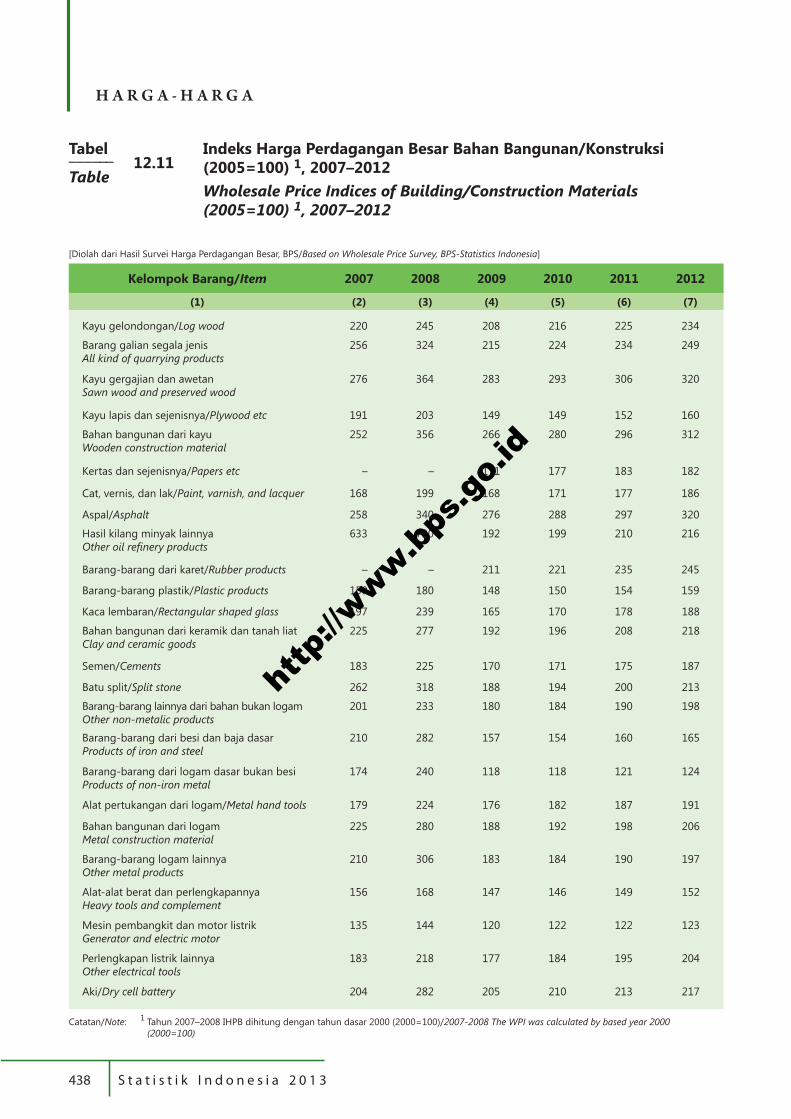
H A R G A - H A R G A
S t a t i s t i k I n d o n e s i a 2 0 1 3438
Indeks Harga Perdagangan Besar Bahan Bangunan/Konstruksi (2005=100) 1, 2007–2012Wholesale Price Indices of Building/Construction Materials (2005=100) 1, 2007–2012
[Diolah dari Hasil Survei Harga Perdagangan Besar, BPS/Based on Wholesale Price Survey, BPS-Statistics Indonesia]
Kelompok Barang/Item 2007 2008 2009 2010 2011 2012
(1) (2) (3) (4) (5) (6) (7)
Kayu gelondongan/Log wood 220 245 208 216 225 234
Barang galian segala jenisAll kind of quarrying products
256 324 215 224 234 249
Kayu gergajian dan awetanSawn wood and preserved wood
276 364 283 293 306 320
Kayu lapis dan sejenisnya/Plywood etc 191 203 149 149 152 160
Bahan bangunan dari kayuWooden construction material
252 356 266 280 296 312
Kertas dan sejenisnya/Papers etc – – 171 177 183 182
Cat, vernis, dan lak/Paint, varnish, and lacquer 168 199 168 171 177 186
Aspal/Asphalt 258 340 276 288 297 320
Hasil kilang minyak lainnyaOther oil refinery products
633 730 192 199 210 216
Barang-barang dari karet/Rubber products – – 211 221 235 245
Barang-barang plastik/Plastic products 150 180 148 150 154 159
Kaca lembaran/Rectangular shaped glass 197 239 165 170 178 188
Bahan bangunan dari keramik dan tanah liatClay and ceramic goods
225 277 192 196 208 218
Semen/Cements 183 225 170 171 175 187
Batu split/Split stone 262 318 188 194 200 213
Barang-barang lainnya dari bahan bukan logamOther non-metalic products
201 233 180 184 190 198
Barang-barang dari besi dan baja dasarProducts of iron and steel
210 282 157 154 160 165
Barang-barang dari logam dasar bukan besiProducts of non-iron metal
174 240 118 118 121 124
Alat pertukangan dari logam/Metal hand tools 179 224 176 182 187 191
Bahan bangunan dari logamMetal construction material
225 280 188 192 198 206
Barang-barang logam lainnyaOther metal products
210 306 183 184 190 197
Alat-alat berat dan perlengkapannyaHeavy tools and complement
156 168 147 146 149 152
Mesin pembangkit dan motor listrikGenerator and electric motor
135 144 120 122 122 123
Perlengkapan listrik lainnyaOther electrical tools
183 218 177 184 195 204
Aki/Dry cell battery 204 282 205 210 213 217
Catatan/Note: 1 Tahun 2007–2008 IHPB dihitung dengan tahun dasar 2000 (2000=100)/2007-2008 The WPI was calculated by based year 2000 (2000=100)
Tabel ––––––
12.11Table
http
://www.b
ps.g
o.id
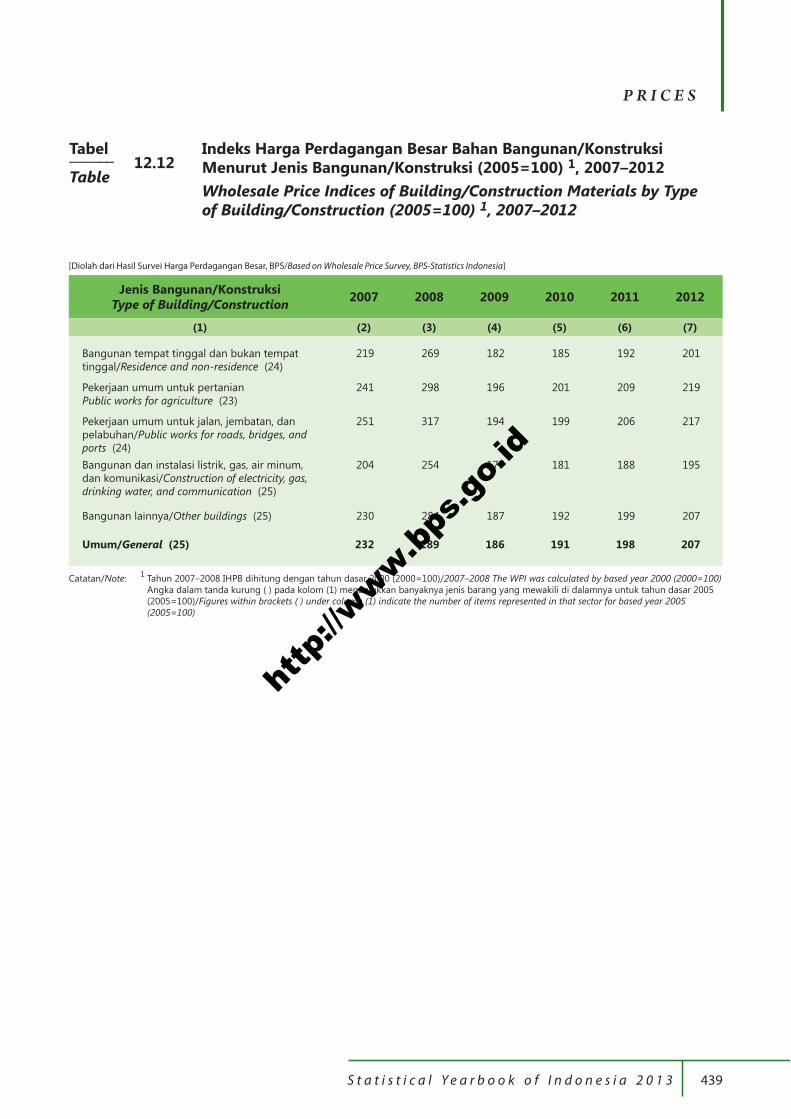
P R I C E S
S t a t i s t i c a l Y e a r b o o k o f I n d o n e s i a 2 0 1 3 439
Indeks Harga Perdagangan Besar Bahan Bangunan/Konstruksi Menurut Jenis Bangunan/Konstruksi (2005=100) 1, 2007–2012Wholesale Price Indices of Building/Construction Materials by Type of Building/Construction (2005=100) 1, 2007–2012
[Diolah dari Hasil Survei Harga Perdagangan Besar, BPS/Based on Wholesale Price Survey, BPS-Statistics Indonesia]
Jenis Bangunan/KonstruksiType of Building/Construction 2007 2008 2009 2010 2011 2012
(1) (2) (3) (4) (5) (6) (7)
Bangunan tempat tinggal dan bukan tempat tinggal/Residence and non-residence (24)
219 269 182 185 192 201
Pekerjaan umum untuk pertanianPublic works for agriculture (23)
241 298 196 201 209 219
Pekerjaan umum untuk jalan, jembatan, dan pelabuhan/Public works for roads, bridges, and ports (24)
251 317 194 199 206 217
Bangunan dan instalasi listrik, gas, air minum, dan komunikasi/Construction of electricity, gas, drinking water, and communication (25)
204 254 177 181 188 195
Bangunan lainnya/Other buildings (25) 230 284 187 192 199 207
Umum/General (25) 232 289 186 191 198 207
Catatan/Note: 1 Tahun 2007–2008 IHPB dihitung dengan tahun dasar 2000 (2000=100)/2007–2008 The WPI was calculated by based year 2000 (2000=100) Angka dalam tanda kurung ( ) pada kolom (1) menunjukkan banyaknya jenis barang yang mewakili di dalamnya untuk tahun dasar 2005 (2005=100)/Figures within brackets ( ) under column (1) indicate the number of items represented in that sector for based year 2005 (2005=100)
Tabel ––––––
12.12Table
http
://www.b
ps.g
o.id

H A R G A - H A R G A
S t a t i s t i k I n d o n e s i a 2 0 1 3440
Indeks Harga Perdagangan Besar Menurut Kelompok Penggunaan Barang dan Sektor (2005=100) 1, 2007–2012Wholesale Price Indices by End Use of Commodities and Sectors (2005=100) 1, 2007–2012
[Diolah dari Hasil Survei Harga Perdagangan Besar, BPS/Based on Wholesale Price Survey, BPS-Statistics Indonesia]
Kelompok dan SektorGroup and Sector 2007 2008 2009 2010 2011 2012
(1) (2) (3) (4) (5) (6) (7)
A. Suplai Domestik/Domestic Supply
Bahan Baku Produksi/Producer's Materials 202 257 170 179 191 199
Lokal/Local – – 186 186 196 204
Pertanian/Agriculture 220 275 198 222 238 249
Pertambangan dan penggalianMining and quarrying
187 223 206 212 221 231
Industri/Manufacturing 233 297 167 174 182 189
Impor/Imports 190 243 153 157 174 186
Barang Konsumsi/Consumer's Goods 186 230 176 187 200 211
Lokal/Local – – 178 190 202 214
Pertanian/Agriculture 204 274 226 247 265 286
Pertambangan dan penggalianMining and quarrying
184 272 257 277 307 320
Industri/Manufacturing 201 246 165 174 184 193
Impor/Imports 183 219 158 164 183 198
Barang Modal/Capital Goods 137 159 152 153 157 159
Lokal/Local – – 135 137 137 137
Pertanian/Agriculture 196 255 200 214 223 240
Pertambangan dan penggalianMining and quarrying
– – – – – –
Industri/Manufacturing 154 179 135 136 137 136
Impor/Imports 155 183 176 176 184 190
B. Ekspor/Exports
Bahan Baku Produksi/Producer’s Materials 179 230 133 138 158 168
Barang Konsumsi/Consumer’s Goods 142 164 138 138 142 148
Barang Modal/Capital Goods 117 133 131 125 127 133
Catatan/Note: 1 Tahun 2007–2008 IHPB dihitung dengan tahun dasar 2000 (2000=100)/2007–2008 The WPI was calculated by based year 2000 (2000=100)
Tabel ––––––
12.13Table
http
://www.b
ps.g
o.id
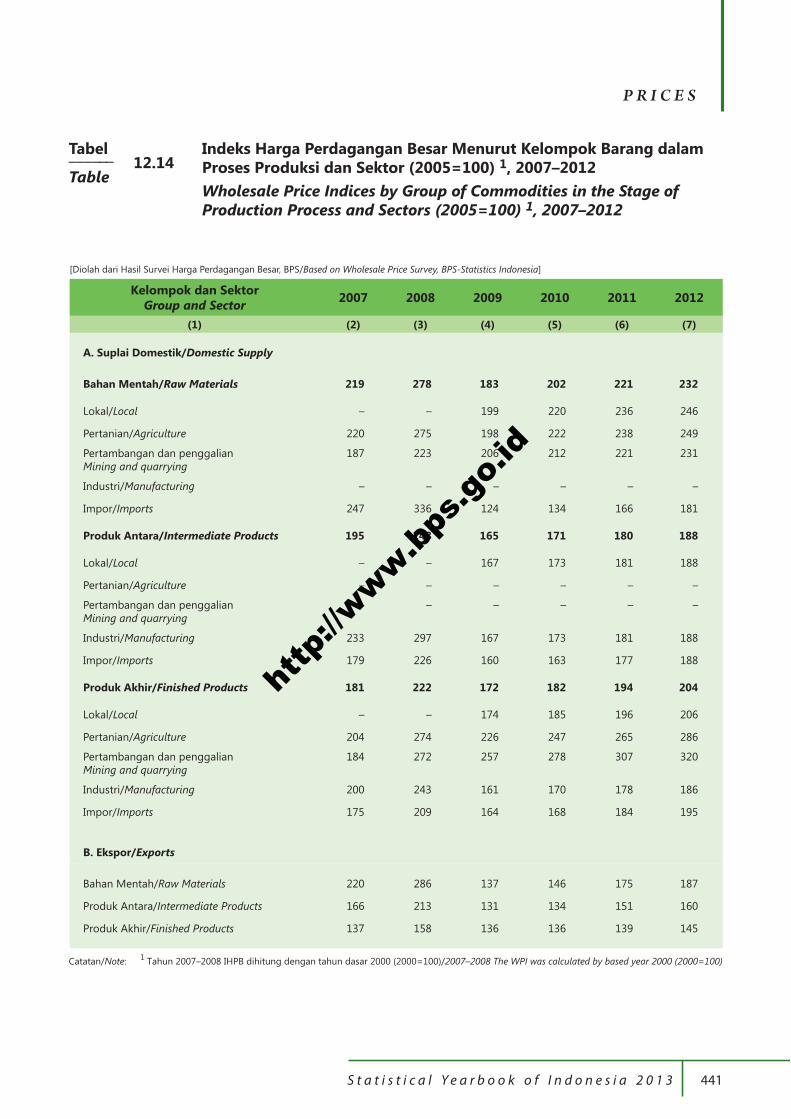
P R I C E S
S t a t i s t i c a l Y e a r b o o k o f I n d o n e s i a 2 0 1 3 441
Indeks Harga Perdagangan Besar Menurut Kelompok Barang dalam Proses Produksi dan Sektor (2005=100) 1, 2007–2012 Wholesale Price Indices by Group of Commodities in the Stage of Production Process and Sectors (2005=100) 1, 2007–2012
[Diolah dari Hasil Survei Harga Perdagangan Besar, BPS/Based on Wholesale Price Survey, BPS-Statistics Indonesia]
Kelompok dan SektorGroup and Sector 2007 2008 2009 2010 2011 2012
(1) (2) (3) (4) (5) (6) (7)
A. Suplai Domestik/Domestic Supply
Bahan Mentah/Raw Materials 219 278 183 202 221 232
Lokal/Local – – 199 220 236 246
Pertanian/Agriculture 220 275 198 222 238 249
Pertambangan dan penggalianMining and quarrying
187 223 206 212 221 231
Industri/Manufacturing – – – – – –
Impor/Imports 247 336 124 134 166 181
Produk Antara/Intermediate Products 195 248 165 171 180 188
Lokal/Local – – 167 173 181 188
Pertanian/Agriculture – – – – – –
Pertambangan dan penggalianMining and quarrying
– – – – – –
Industri/Manufacturing 233 297 167 173 181 188
Impor/Imports 179 226 160 163 177 188
Produk Akhir/Finished Products 181 222 172 182 194 204
Lokal/Local – – 174 185 196 206
Pertanian/Agriculture 204 274 226 247 265 286
Pertambangan dan penggalianMining and quarrying
184 272 257 278 307 320
Industri/Manufacturing 200 243 161 170 178 186
Impor/Imports 175 209 164 168 184 195
B. Ekspor/Exports
Bahan Mentah/Raw Materials 220 286 137 146 175 187
Produk Antara/Intermediate Products 166 213 131 134 151 160
Produk Akhir/Finished Products 137 158 136 136 139 145
Catatan/Note: 1 Tahun 2007–2008 IHPB dihitung dengan tahun dasar 2000 (2000=100)/2007–2008 The WPI was calculated by based year 2000 (2000=100)
Tabel ––––––
12.14Table
http
://www.b
ps.g
o.id

H A R G A - H A R G A
S t a t i s t i k I n d o n e s i a 2 0 1 3442
Indeks Harga yang Diterima Petani (It), Indeks Harga yang Dibayar Petani (Ib), dan Nilai Tukar Petani (NTP) Menurut Periode Bulan (2007=100), 2011 dan 2012Prices Received by Farmers Indices (It), Prices Paid by Farmers Indices (Ib), and Farmers’ Terms of Trade (NTP) by Month (2007=100), dbsjk 2011 and 2012
Tabel ––––––
12.15Table
[Diolah dari Hasil Survei Harga Perdesaan, BPS/Based on Rural Price Survey, BPS-Statistics Indonesia]
BulanMonth It
Indeks Harga yang Dibayar PetaniPrices Paid by Farmers Indices
NTP
Ib
Indeks Konsumsi Rumah Tangga
Household Consumption Index
Indeks Biaya Produksi dan Penambahan Barang
ModalCost of Production and
Capital Formation Index
(1) (2) (3) (4) (5) (6)
Rata-Rata/Average 2011 138,90 132,81 135,62 124,47 104,58
Januari/January 135,72 131,76 134,64 123,07 103,01Februari/February 136,36 131,96 134,83 123,36 103,33Maret/March 136,34 131,95 134,75 123,59 103,32April/April 136,53 131,40 133,95 123,87 103,91Mei/May 137,38 131,46 133,96 124,17 104,50Juni/June 138,25 131,92 134,50 124,35 104,79Juli/July 139,09 132,63 135,34 124,61 104,87Agustus/August 140,27 133,45 136,34 124,86 105,11September/September 140,71 133,80 136,74 125,06 105,17Oktober/October 141,37 133,99 136,91 125,29 105,51November/November 142,05 134,47 137,47 125,56 105,64Desember/December 142,67 134,91 137,97 125,82 105,75
Rata-Rata/Average 2012 145,75 138,49 142,05 128,00 105,24
Januari/January 143,57 135,78 138,99 126,27 105,73Februari/February 143,31 136,36 139,63 126,69 105,10Maret/March 143,00 136,61 139,83 127,14 104,68April/April 143,45 137,00 140,25 127,46 104,71Mei/May 143,93 137,38 140,69 127,69 104,77Juni/June 144,82 138,08 141,54 127,91 104,88Juli/July 145,86 138,97 142,63 128,15 104,96Agustus/August 147,26 139,90 143,77 128,44 105,26September/September 147,58 140,00 143,85 128,64 105,41Oktober/October 148,29 140,22 144,05 128,88 105,76November/November 148,57 140,52 144,37 129,22 105,72Desember/December 149,34 141,06 144,98 129,52 105,87
http
://www.b
ps.g
o.id

P R I C E S
S t a t i s t i c a l Y e a r b o o k o f I n d o n e s i a 2 0 1 3 443
Indeks Harga yang Diterima Petani (It), Indeks Harga yang Dibayar Petani (Ib), dan Nilai Tukar Petani (NTP) Menurut Provinsi (2007=100), 2011 dan 2012Prices Received by Farmers Indices (It), Prices Paid by Farmers Indices (Ib), and Farmers’ Terms of Trade (NTP) by Province (2007=100), 2011 and 2012
[Diolah dari Hasil Survei Harga Perdesaan, BPS/Based on Rural Price Survey, BPS-Statistics Indonesia]
ProvinsiProvince
It
Indeks Harga yang Dibayar PetaniPrices Paid by Farmers Indices
Ib Indeks Konsumsi Rumah TanggaHousehold Consumption Index
2011 2012 2011 2012 2011 2012(1) (2) (3) (4) (5) (6) (7)
Aceh 133,38 137,16 127,88 131,71 130,33 135,15Sumatera Utara 138,20 141,49 133,64 139,12 134,91 140,79Sumatera Barat 141,05 144,54 132,75 137,63 135,42 141,01Riau 131,69 134,76 125,34 129,25 124,14 128,79Kepulauan Riau 126,31 131,66 122,54 125,81 126,79 131,05Jambi 124,32 124,01 129,17 134,57 130,35 136,53Sumatera Selatan 139,49 144,95 127,24 131,61 129,74 134,86Kepulauan Bangka Belitung 117,57 121,70 118,55 122,73 121,29 126,58Bengkulu 144,39 148,83 140,23 145,32 144,97 150,85Lampung 154,72 164,82 127,35 131,41 128,11 132,69
Jawa Barat 144,18 156,01 137,42 143,20 140,88 147,26Banten 139,74 149,24 133,33 137,61 133,98 138,63Jawa Tengah 136,91 144,72 130,58 137,38 132,32 139,74DI Yogyakarta 146,00 153,06 126,83 131,43 127,69 132,87Jawa Timur 139,26 147,28 136,99 144,15 139,69 147,67
Bali 137,99 145,28 129,54 134,17 131,69 137,04Nusa Tenggara Barat 128,41 131,60 133,56 138,00 138,79 143,97Nusa Tenggara Timur 138,98 144,90 135,98 142,33 140,10 147,64
Kalimantan Barat 133,35 137,91 129,94 136,65 134,01 142,05Kalimantan Tengah 133,78 136,42 132,35 137,46 136,70 142,67Kalimantan Selatan 141,48 145,14 130,51 134,58 133,60 138,41Kalimantan Timur 125,34 129,43 126,93 132,02 130,55 136,75
Sulawesi Utara 133,90 136,66 129,73 134,70 134,01 140,09Gorontalo 130,33 132,78 125,23 129,76 128,57 134,27Sulawesi Tengah 132,59 135,89 134,12 138,96 138,70 144,61Sulawesi Selatan 142,42 148,52 132,99 137,45 138,13 143,24Sulawesi Barat 137,59 140,67 131,91 134,73 135,47 138,97Sulawesi Tenggara 138,56 141,24 128,75 132,68 134,25 139,23
Maluku 140,69 145,53 134,23 138,99 142,13 148,31Maluku Utara 132,20 135,26 130,80 134,37 133,16 137,57Papua 129,95 135,48 128,27 131,93 132,58 137,19Papua Barat 130,71 132,89 126,96 130,78 133,12 137,99
Indonesia 138,90 145,75 132,81 138,49 135,62 142,05
Tabel ––––––
12.16Table
http
://www.b
ps.g
o.id

H A R G A - H A R G A
S t a t i s t i k I n d o n e s i a 2 0 1 3444
ProvinsiProvince
Indeks Harga yang Dibayar PetaniPrices Paid by Farmers Indices
NTPIndeks Biaya Produksi dan Penambahan Barang Modal
Cost of Production andCapital Formation Index
2011 2012 2011 2012(1) (8) (9) (10) (11)
Aceh 123,42 125,22 104,30 104,13Sumatera Utara 130,56 135,01 103,42 101,71Sumatera Barat 124,55 127,24 106,25 105,02Riau 128,73 130,48 105,07 104,26Kepulauan Riau 112,61 113,45 103,07 104,65Jambi 125,76 128,80 96,25 92,15Sumatera Selatan 120,21 122,16 109,63 110,13Kepulauan Bangka Belitung 113,17 114,56 99,17 99,17Bengkulu 126,00 128,86 102,97 102,41Lampung 127,22 129,66 121,49 125,42
Jawa Barat 127,72 132,28 104,92 108,94Banten 131,18 134,39 104,81 108,45Jawa Tengah 125,18 130,25 104,84 105,35DI Yogyakarta 123,82 126,67 115,12 116,46Jawa Timur 127,96 132,72 101,66 102,17
Bali 122,71 125,44 106,52 108,28Nusa Tenggara Barat 118,06 120,42 96,14 95,36Nusa Tenggara Timur 122,64 125,03 102,21 101,80
Kalimantan Barat 117,58 120,26 102,63 100,92Kalimantan Tengah 118,84 120,99 101,08 99,24Kalimantan Selatan 121,45 123,12 108,40 107,84Kalimantan Timur 116,53 118,20 98,74 98,04
Sulawesi Utara 117,07 118,81 103,22 101,46Gorontalo 114,61 115,78 104,07 102,33Sulawesi Tengah 120,44 122,07 98,86 97,79Sulawesi Selatan 117,80 120,49 107,09 108,05Sulawesi Barat 121,80 123,04 104,31 104,41Sulawesi Tenggara 112,22 113,12 107,62 106,45
Maluku 113,25 114,10 104,81 104,70Maluku Utara 126,08 126,96 101,07 100,66Papua 116,14 116,73 101,31 102,69Papua Barat 107,47 108,20 102,95 101,62
Indonesia 124,47 128,00 104,58 105,24
Lanjutan Tabel/Continued Table 12.16
http
://www.b
ps.g
o.id

P R I C E S
S t a t i s t i c a l Y e a r b o o k o f I n d o n e s i a 2 0 1 3 445
Indeks Harga yang Diterima Petani (It), Indeks Harga yang Dibayar Petani (Ib), dan Nilai Tukar Petani Subsektor Tanaman Pangan (NTPP) di Indonesia (2007=100), 2011 dan 2012Prices Received by Farmers Indices (It), Prices Paid by Farmers Indices (Ib), and Farmers’ Terms of Trade of Food Crops Subsector (NTPP) in Indonesia (2007=100), 2011 and 2012
[Diolah dari Hasil Survei Harga Perdesaan , BPS/Based on Rural Price Survey, BPS-Statistics Indonesia]
ProvinsiProvince
Indeks Harga yang Diterima PetaniPrices Received by Farmers Indices
It PadiPaddy
PalawijaSecondary Crops
2011 2012 2011 2012 2011 2012(1) (2) (3) (4) (5) (6) (7)
Aceh 140,61 150,72 138,34 149,43 149,77 155,90Sumatera Utara 135,34 142,45 131,84 138,04 146,21 156,12Sumatera Barat 131,80 133,21 132,61 134,46 128,90 128,74Riau 139,80 145,41 138,39 142,63 148,38 162,38Kepulauan Riau 83,01 89,89 103,75 105,86 81,79 88,95Jambi 124,13 122,07 117,25 114,81 150,96 150,37Sumatera Selatan 155,17 165,31 153,51 163,45 161,59 172,53Kepulauan Bangka Belitung 105,71 108,72 107,32 106,61 104,83 109,88Bengkulu 150,97 158,55 167,86 176,41 134,18 140,81Lampung 167,97 179,77 136,52 146,87 193,68 206,67
Jawa Barat 139,61 154,72 138,70 153,58 144,33 160,62Banten 140,97 153,47 140,67 152,66 143,15 159,51Jawa Tengah 134,83 144,44 127,68 137,37 151,45 160,87DI Yogyakarta 146,54 153,51 145,27 156,54 147,18 151,97Jawa Timur 139,79 149,29 143,27 155,36 135,83 142,36
Bali 124,86 128,83 113,44 114,22 151,53 162,97Nusa Tenggara Barat 123,91 127,38 116,26 118,57 137,68 143,23Nusa Tenggara Timur 137,06 143,35 129,64 136,09 139,62 145,85
Kalimantan Barat 125,20 133,30 122,46 130,96 131,82 138,96Kalimantan Tengah 141,59 144,59 144,53 147,47 127,94 131,17Kalimantan Selatan 142,19 146,58 141,92 146,71 143,54 145,91Kalimantan Timur 114,32 120,14 106,32 111,11 147,32 157,37
Sulawesi Utara 134,31 138,15 127,93 129,30 145,80 154,05Gorontalo 117,92 120,25 133,68 133,43 110,17 113,78Sulawesi Tengah 115,26 119,33 101,11 106,32 168,77 168,49Sulawesi Selatan 146,85 155,35 134,35 142,47 176,08 185,48Sulawesi Barat 118,01 120,24 112,51 115,37 141,14 140,69Sulawesi Tenggara 114,92 116,97 130,15 135,98 103,70 102,97
Maluku 129,03 131,83 98,25 100,73 144,31 147,27Maluku Utara 125,51 128,27 106,22 106,14 131,62 135,27Papua 128,80 135,24 134,41 134,31 126,21 135,68Papua Barat 115,92 116,95 96,77 96,96 123,25 124,59
Indonesia 138,37 147,41 134,58 144,00 146,23 155,15
Tabel ––––––
12.17Table
http
://www.b
ps.g
o.id

H A R G A - H A R G A
S t a t i s t i k I n d o n e s i a 2 0 1 3446
ProvinsiProvince
Indeks Harga yang Dibayar PetaniPrices Paid by Farmers Indices
NTPPIb
Indeks Konsumsi
Rumah TanggaHousehold
Consumption Index
Indeks Biaya Produksi dan Penambahan
Barang ModalCost of Production
and Capital Formation Index
2011 2012 2011 2012 2011 2012 2011 2012(1) (8) (9) (10) (11) (12) (13) (14) (15)
Aceh 130,20 134,77 130,79 135,68 127,43 130,48 108,00 111,83Sumatera Utara 136,03 142,03 136,06 142,11 135,88 141,71 99,50 100,29Sumatera Barat 134,74 139,82 135,96 141,38 129,31 132,90 97,82 95,27Riau 124,05 128,01 125,18 129,56 118,77 120,71 112,69 113,60Kepulauan Riau 124,97 128,62 126,58 130,84 117,85 118,81 66,42 69,88Jambi 129,68 135,63 130,13 136,41 127,80 132,37 95,72 90,00Sumatera Selatan 128,11 132,64 128,91 133,87 124,47 127,07 121,12 124,63Kepulauan Bangka Belitung 124,95 129,70 123,45 128,79 132,04 134,00 84,60 83,82Bengkulu 144,01 149,66 145,55 151,42 137,54 142,23 104,83 105,94Lampung 128,50 132,86 127,90 132,46 131,88 135,12 130,71 135,31
Jawa Barat 139,18 145,41 140,78 147,04 131,96 138,06 100,31 106,40Banten 134,30 138,73 134,33 138,90 134,18 138,01 104,96 110,62Jawa Tengah 131,05 138,23 132,52 139,93 125,78 132,14 102,88 104,49DI Yogyakarta 127,08 131,89 127,58 132,63 124,60 128,21 115,31 116,40Jawa Timur 138,19 145,86 140,16 148,13 129,98 136,39 101,16 102,35
Bali 129,74 134,96 130,15 135,44 128,04 132,93 96,23 95,46Nusa Tenggara Barat 135,84 140,60 138,95 143,97 123,80 127,51 91,22 90,60Nusa Tenggara Timur 138,54 145,02 140,78 148,03 130,50 134,26 98,94 98,84
Kalimantan Barat 130,70 137,66 133,24 140,95 121,79 126,14 95,79 96,83Kalimantan Tengah 133,09 138,64 135,88 142,24 122,80 125,36 106,38 104,29Kalimantan Selatan 132,70 136,88 134,39 139,10 126,11 128,21 107,15 107,09Kalimantan Timur 129,29 134,74 130,84 137,03 122,79 125,09 88,42 89,17
Sulawesi Utara 130,63 135,58 133,00 138,46 121,17 124,06 102,82 101,89Gorontalo 126,31 131,06 129,81 135,42 112,61 114,00 93,36 91,76Sulawesi Tengah 138,11 143,27 140,41 146,22 129,32 131,95 83,45 83,29Sulawesi Selatan 135,10 139,80 138,84 143,81 119,97 123,62 108,70 111,13Sulawesi Barat 132,38 135,31 136,26 139,58 116,48 117,79 89,15 88,86Sulawesi Tenggara 132,41 136,13 136,47 140,83 115,62 116,67 86,79 85,93
Maluku 141,83 146,88 147,16 153,12 116,74 117,53 90,98 89,76Maluku Utara 133,51 137,36 133,90 138,53 131,78 132,21 94,01 93,38Papua 131,01 135,15 133,79 138,71 118,89 119,64 98,32 100,07Papua Barat 133,23 137,80 139,28 144,60 105,77 106,95 87,01 84,87
Indonesia 134,56 140,78 136,20 142,72 127,99 133,01 102,83 104,71
Lanjutan Tabel/Continued Table 12.17
http
://www.b
ps.g
o.id

P R I C E S
S t a t i s t i c a l Y e a r b o o k o f I n d o n e s i a 2 0 1 3 447
Indeks Harga yang Diterima Petani (It), Indeks Harga yang Dibayar Petani (Ib), dan Nilai Tukar Petani Subsektor Hortikultura (NTPH) di Indonesia (2007=100), 2011 dan 2012Prices Received by Farmers Indices (It), Prices Paid by Farmers Indices (Ib), and Farmers’ Terms of Trade of Horticulture Subsector (NTPH) in Indonesia (2007=100), 2011 and 2012
[Diolah dari Hasil Survei Harga Perdesaan, BPS/Based on Rural Price Survey, BPS-Statistics Indonesia]
ProvinsiProvince
Indeks Harga yang Diterima PetaniPrices Received by Farmers Indices
It Sayur-SayuranVegetables
Buah-BuahanFriuts
2011 2012 2011 2012 2011 2012(1) (2) (3) (4) (5) (6) (7)
Aceh 132,53 133,41 123,50 123,86 144,66 146,24Sumatera Utara 149,60 152,26 128,06 137,45 158,00 158,03Sumatera Barat 140,83 144,89 129,29 134,49 162,32 164,27Riau 141,96 149,51 142,84 153,49 141,16 145,88Kepulauan Riau 154,62 164,90 158,63 170,81 126,25 123,14Jambi 121,03 119,32 123,69 119,39 117,80 119,23Sumatera Selatan 146,80 147,70 146,64 155,02 146,85 145,67Kepulauan Bangka Belitung 112,27 112,21 150,76 149,30 86,65 87,53Bengkulu 166,43 168,20 174,84 176,22 118,67 122,68Lampung 139,29 148,52 137,85 147,28 139,67 148,84
Jawa Barat 154,26 166,96 152,43 168,11 156,37 165,62Banten 144,48 152,13 136,73 148,82 149,44 154,25Jawa Tengah 131,56 137,13 132,65 136,16 130,65 137,94DI Yogyakarta 160,67 171,76 164,00 173,05 159,27 171,21Jawa Timur 152,93 159,53 161,01 172,00 148,83 153,22
Bali 183,15 200,20 146,39 143,97 188,99 209,14Nusa Tenggara Barat 131,16 131,35 151,12 146,95 112,58 116,81Nusa Tenggara Timur 134,18 135,67 154,52 149,34 126,37 130,42
Kalimantan Barat 135,39 144,53 139,28 146,57 133,37 143,46Kalimantan Tengah 142,90 143,49 145,46 141,66 140,20 145,43Kalimantan Selatan 168,78 174,35 200,93 204,20 160,77 166,90Kalimantan Timur 143,01 142,54 149,79 147,58 134,67 136,35
Sulawesi Utara 130,87 135,18 127,43 131,88 146,61 150,28Gorontalo 142,70 143,40 145,41 146,07 104,49 105,77Sulawesi Tengah 147,50 145,76 149,79 149,45 144,24 140,50Sulawesi Selatan 138,70 145,02 142,74 146,57 136,45 144,16Sulawesi Barat 111,92 115,42 150,46 149,56 106,19 110,34Sulawesi Tenggara 158,59 164,08 158,91 166,94 158,36 161,97
Maluku 158,19 166,57 195,31 205,33 129,82 136,93Maluku Utara 123,52 129,31 173,83 176,65 115,42 121,69Papua 166,91 175,38 172,55 184,85 158,17 160,74Papua Barat 133,66 137,69 153,39 158,60 112,48 115,25
Indonesia 145,12 151,46 147,43 154,35 143,67 149,44
Tabel ––––––
12.18Table
http
://www.b
ps.g
o.id
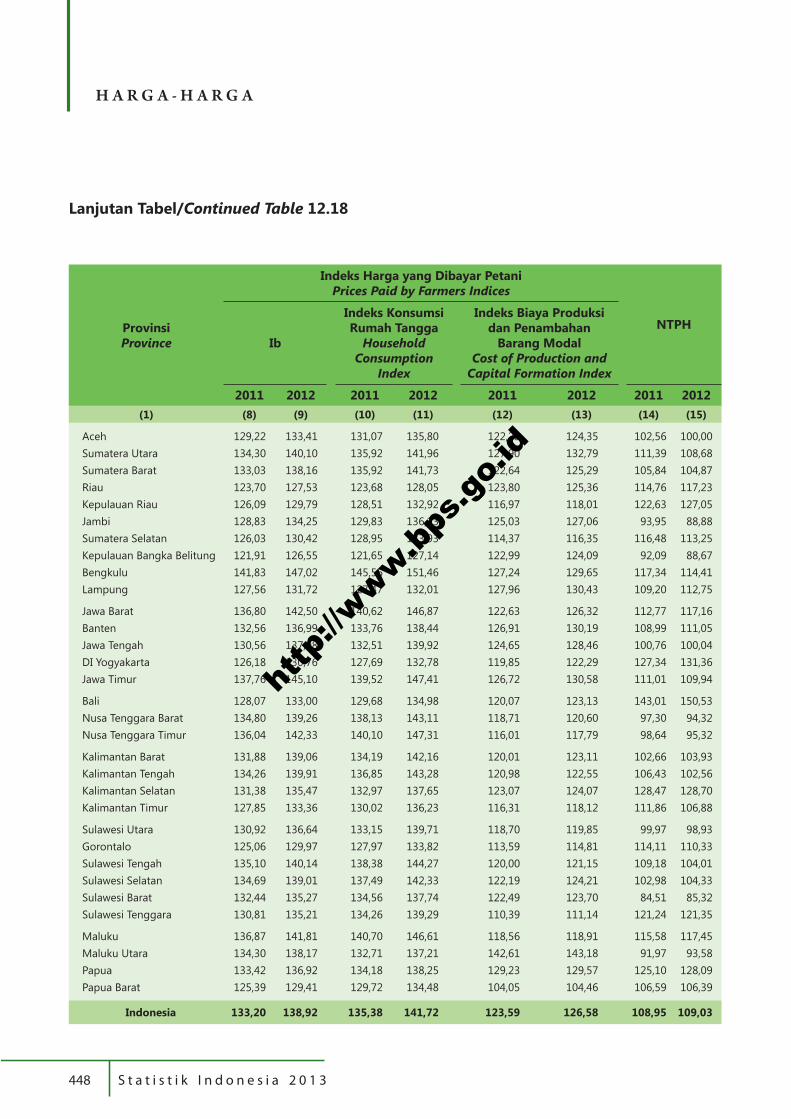
H A R G A - H A R G A
S t a t i s t i k I n d o n e s i a 2 0 1 3448
ProvinsiProvince
Indeks Harga yang Dibayar PetaniPrices Paid by Farmers Indices
NTPHIb
Indeks Konsumsi Rumah Tangga
Household Consumption
Index
Indeks Biaya Produksi dan Penambahan
Barang ModalCost of Production and
Capital Formation Index
2011 2012 2011 2012 2011 2012 2011 2012(1) (8) (9) (10) (11) (12) (13) (14) (15)
Aceh 129,22 133,41 131,07 135,80 122,23 124,35 102,56 100,00Sumatera Utara 134,30 140,10 135,92 141,96 127,90 132,79 111,39 108,68Sumatera Barat 133,03 138,16 135,92 141,73 122,64 125,29 105,84 104,87Riau 123,70 127,53 123,68 128,05 123,80 125,36 114,76 117,23Kepulauan Riau 126,09 129,79 128,51 132,92 116,97 118,01 122,63 127,05Jambi 128,83 134,25 129,83 136,13 125,03 127,06 93,95 88,88Sumatera Selatan 126,03 130,42 128,95 133,93 114,37 116,35 116,48 113,25Kepulauan Bangka Belitung 121,91 126,55 121,65 127,14 122,99 124,09 92,09 88,67Bengkulu 141,83 147,02 145,56 151,46 127,24 129,65 117,34 114,41Lampung 127,56 131,72 127,47 132,01 127,96 130,43 109,20 112,75
Jawa Barat 136,80 142,50 140,62 146,87 122,63 126,32 112,77 117,16Banten 132,56 136,99 133,76 138,44 126,91 130,19 108,99 111,05Jawa Tengah 130,56 137,08 132,51 139,92 124,65 128,46 100,76 100,04DI Yogyakarta 126,18 130,76 127,69 132,78 119,85 122,29 127,34 131,36Jawa Timur 137,76 145,10 139,52 147,41 126,72 130,58 111,01 109,94
Bali 128,07 133,00 129,68 134,98 120,07 123,13 143,01 150,53Nusa Tenggara Barat 134,80 139,26 138,13 143,11 118,71 120,60 97,30 94,32Nusa Tenggara Timur 136,04 142,33 140,10 147,31 116,01 117,79 98,64 95,32
Kalimantan Barat 131,88 139,06 134,19 142,16 120,01 123,11 102,66 103,93Kalimantan Tengah 134,26 139,91 136,85 143,28 120,98 122,55 106,43 102,56Kalimantan Selatan 131,38 135,47 132,97 137,65 123,07 124,07 128,47 128,70Kalimantan Timur 127,85 133,36 130,02 136,23 116,31 118,12 111,86 106,88
Sulawesi Utara 130,92 136,64 133,15 139,71 118,70 119,85 99,97 98,93Gorontalo 125,06 129,97 127,97 133,82 113,59 114,81 114,11 110,33Sulawesi Tengah 135,10 140,14 138,38 144,27 120,00 121,15 109,18 104,01Sulawesi Selatan 134,69 139,01 137,49 142,33 122,19 124,21 102,98 104,33Sulawesi Barat 132,44 135,27 134,56 137,74 122,49 123,70 84,51 85,32Sulawesi Tenggara 130,81 135,21 134,26 139,29 110,39 111,14 121,24 121,35
Maluku 136,87 141,81 140,70 146,61 118,56 118,91 115,58 117,45Maluku Utara 134,30 138,17 132,71 137,21 142,61 143,18 91,97 93,58Papua 133,42 136,92 134,18 138,25 129,23 129,57 125,10 128,09Papua Barat 125,39 129,41 129,72 134,48 104,05 104,46 106,59 106,39
Indonesia 133,20 138,92 135,38 141,72 123,59 126,58 108,95 109,03
Lanjutan Tabel/Continued Table 12.18
http
://www.b
ps.g
o.id
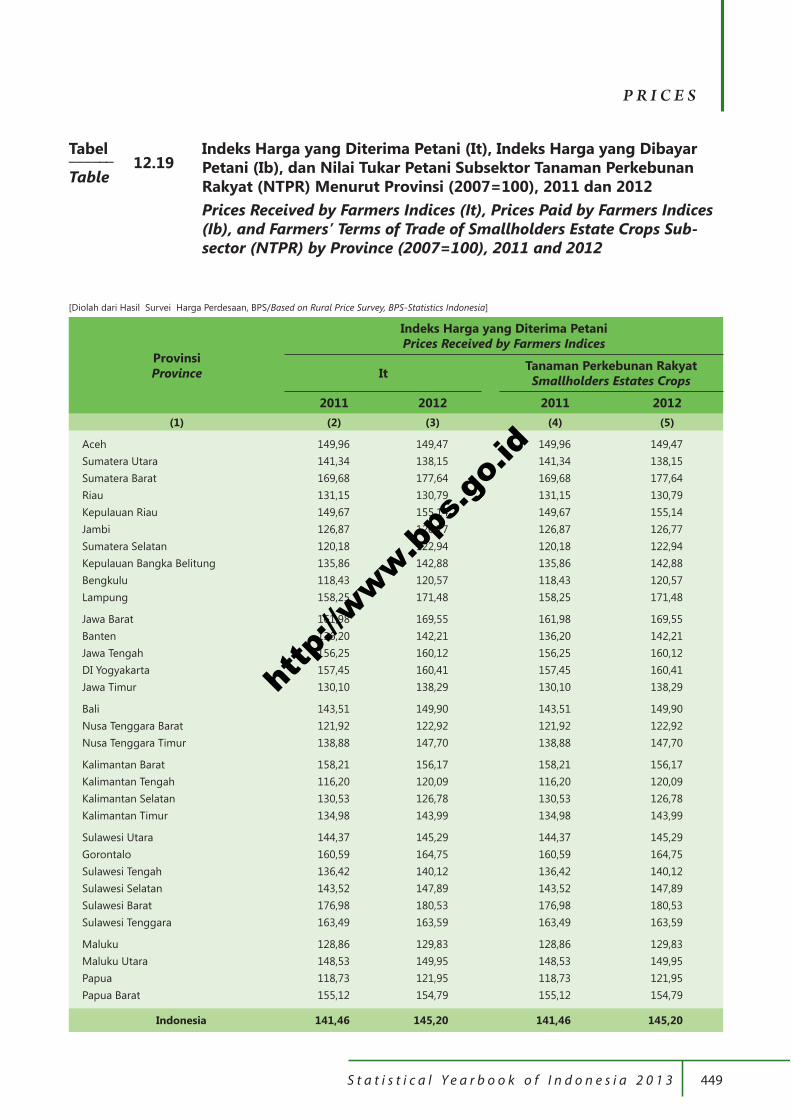
P R I C E S
S t a t i s t i c a l Y e a r b o o k o f I n d o n e s i a 2 0 1 3 449
Indeks Harga yang Diterima Petani (It), Indeks Harga yang Dibayar Petani (Ib), dan Nilai Tukar Petani Subsektor Tanaman Perkebunan Rakyat (NTPR) Menurut Provinsi (2007=100), 2011 dan 2012Prices Received by Farmers Indices (It), Prices Paid by Farmers Indices (Ib), and Farmers’ Terms of Trade of Smallholders Estate Crops Sub-sector (NTPR) by Province (2007=100), 2011 and 2012
[Diolah dari Hasil Survei Harga Perdesaan, BPS/Based on Rural Price Survey, BPS-Statistics Indonesia]
ProvinsiProvince
Indeks Harga yang Diterima PetaniPrices Received by Farmers Indices
It Tanaman Perkebunan RakyatSmallholders Estates Crops
2011 2012 2011 2012(1) (2) (3) (4) (5)
Aceh 149,96 149,47 149,96 149,47Sumatera Utara 141,34 138,15 141,34 138,15Sumatera Barat 169,68 177,64 169,68 177,64Riau 131,15 130,79 131,15 130,79Kepulauan Riau 149,67 155,14 149,67 155,14Jambi 126,87 126,77 126,87 126,77Sumatera Selatan 120,18 122,94 120,18 122,94Kepulauan Bangka Belitung 135,86 142,88 135,86 142,88Bengkulu 118,43 120,57 118,43 120,57Lampung 158,25 171,48 158,25 171,48
Jawa Barat 161,98 169,55 161,98 169,55Banten 136,20 142,21 136,20 142,21Jawa Tengah 156,25 160,12 156,25 160,12DI Yogyakarta 157,45 160,41 157,45 160,41Jawa Timur 130,10 138,29 130,10 138,29
Bali 143,51 149,90 143,51 149,90Nusa Tenggara Barat 121,92 122,92 121,92 122,92Nusa Tenggara Timur 138,88 147,70 138,88 147,70
Kalimantan Barat 158,21 156,17 158,21 156,17Kalimantan Tengah 116,20 120,09 116,20 120,09Kalimantan Selatan 130,53 126,78 130,53 126,78Kalimantan Timur 134,98 143,99 134,98 143,99
Sulawesi Utara 144,37 145,29 144,37 145,29Gorontalo 160,59 164,75 160,59 164,75Sulawesi Tengah 136,42 140,12 136,42 140,12Sulawesi Selatan 143,52 147,89 143,52 147,89Sulawesi Barat 176,98 180,53 176,98 180,53Sulawesi Tenggara 163,49 163,59 163,49 163,59
Maluku 128,86 129,83 128,86 129,83Maluku Utara 148,53 149,95 148,53 149,95Papua 118,73 121,95 118,73 121,95Papua Barat 155,12 154,79 155,12 154,79
Indonesia 141,46 145,20 141,46 145,20
Tabel ––––––
12.19Table
http
://www.b
ps.g
o.id

H A R G A - H A R G A
S t a t i s t i k I n d o n e s i a 2 0 1 3450
ProvinsiProvince
Indeks Harga yang Dibayar PetaniPrices Paid by Farmers Indices
NTPRIb
Indeks Konsumsi Rumah Tangga
Household Consumption
Index
Indeks Biaya Produksi dan Penambahan
Barang ModalCost of Production and
Capital Formation Index
2011 2012 2011 2012 2011 2012 2011 2012(1) (6) (7) (8) (9) (10) (11) (12) (13)
Aceh 130,97 134,90 129,24 133,45 137,87 140,69 114,49 110,80Sumatera Utara 132,72 137,94 133,38 139,06 130,07 133,45 106,49 100,15Sumatera Barat 131,52 136,59 135,04 141,08 117,74 118,96 129,01 130,06Riau 126,65 130,94 123,68 128,39 138,88 141,43 103,56 99,89Kepulauan Riau 125,57 129,09 128,32 132,40 115,33 116,75 119,19 120,18
Jambi 130,14 135,53 131,06 137,05 126,61 129,66 97,49 93,54Sumatera Selatan 128,68 133,11 130,55 135,81 121,91 123,34 93,40 92,36Kepulauan Bangka Belitung 119,45 123,70 121,88 126,80 110,98 112,83 113,74 115,51Bengkulu 139,80 144,94 146,51 152,54 114,79 116,59 84,71 83,19Lampung 130,46 134,59 130,80 135,53 129,17 130,96 121,30 127,41
Jawa Barat 138,87 144,50 142,77 149,15 124,80 127,68 116,64 117,34Banten 132,28 136,23 133,50 138,06 128,05 129,90 102,97 104,39Jawa Tengah 129,37 135,51 132,32 139,52 119,97 122,67 120,77 118,16DI Yogyakarta 126,74 131,39 130,15 135,88 115,33 116,40 124,23 122,08Jawa Timur 135,98 143,13 140,07 148,30 122,18 125,72 95,68 96,61
Bali 128,56 133,12 134,10 139,69 108,85 109,75 111,63 112,61Nusa Tenggara Barat 131,19 134,61 137,10 141,39 110,99 111,46 92,94 91,32Nusa Tenggara Timur 139,12 145,93 142,46 150,75 125,05 125,65 99,83 101,22
Kalimantan Barat 130,45 137,08 135,63 144,06 113,65 114,43 121,28 113,92Kalimantan Tengah 132,17 136,66 138,68 143,99 113,42 115,52 87,92 87,87Kalimantan Selatan 129,07 133,58 132,97 138,30 118,44 120,70 101,13 94,91Kalimantan Timur 126,11 131,15 131,62 138,03 111,87 113,40 107,04 109,79
Sulawesi Utara 129,77 134,50 134,50 140,10 114,40 116,32 111,25 108,03Gorontalo 122,70 126,86 127,14 132,59 111,23 112,05 130,88 129,87Sulawesi Tengah 134,95 140,05 138,79 144,68 118,82 120,58 101,09 100,04Sulawesi Selatan 133,00 137,58 138,03 143,20 116,68 119,34 107,91 107,49
Sulawesi Barat 135,45 138,03 135,17 138,68 135,94 136,91 130,66 130,79Sulawesi Tenggara 128,64 133,04 132,98 138,22 112,67 113,96 127,09 122,97
Maluku 128,28 133,11 136,61 143,29 110,02 110,77 100,45 97,54Maluku Utara 129,59 133,28 132,98 137,68 119,96 120,77 114,61 112,51Papua 127,55 130,28 135,37 138,92 108,11 108,79 93,09 93,61Papua Barat 124,84 128,50 131,46 136,34 110,34 111,33 124,25 120,45
Indonesia 131,85 137,11 134,95 141,10 121,51 123,68 107,29 105,90
Lanjutan Tabel/Continued Table 12.19
http
://www.b
ps.g
o.id

P R I C E S
S t a t i s t i c a l Y e a r b o o k o f I n d o n e s i a 2 0 1 3 451
Indeks Harga yang Diterima Petani (It), Indeks Harga yang Dibayar Petani (Ib), dan Nilai Tukar Petani Subsektor Peternakan (NTPT) Menurut Provinsi (2007=100), 2011 dan 2012Prices Received by Farmers Indices (It), Prices Paid by Farmers Indices (Ib), and Farmers’ Terms of Trade of Animal Husbandry Subsector (NTPT) by Province (2007=100), 2011 and 2012
[Diolah dari Hasil Sensus Harga Perdesaan, BPS/Based on Rural Price Survey, BPS-Statistics Indonesia]
ProvinsiProvince
Indeks Harga yang Diterima PetaniPrices Received by Farmers Indices
ItTernak Besar
Large Livestock
Ternak KecilSmall
Livestock
UnggasPoultry
Hasil TernakLivestock Product
2011 2012 2011 2012 2011 2012 2011 2012 2011 2012(1) (2) (3) (4) (5) (6) (7) (8) (9) (10) (11)
Aceh 123,56 127,21 113,73 116,90 154,40 160,24 141,71 146,57 134,88 137,62Sumatera Utara 132,77 137,94 123,00 127,49 137,44 143,42 145,08 149,60 168,58 174,68Sumatera Barat 125,52 128,68 124,62 128,62 132,07 138,59 120,61 122,37 154,70 157,71Riau 132,83 136,13 129,89 133,65 175,99 181,32 121,74 123,79 149,31 150,12Kepulauan Riau 107,00 109,26 101,81 105,42 105,46 107,88 108,22 109,98 117,97 120,48Jambi 124,22 128,90 120,04 126,06 120,94 124,50 133,56 135,17 139,20 143,85Sumatera Selatan 128,03 131,74 107,02 111,01 158,06 166,40 141,73 142,97 144,98 149,17Kepulauan Bangka Belitung 107,51 110,97 115,08 119,28 84,62 85,93 117,57 120,94 108,20 114,79Bengkulu 143,30 146,52 137,00 139,68 160,44 166,99 150,23 152,33 159,63 164,48Lampung 127,50 130,16 123,90 125,62 152,08 155,36 117,45 121,24 129,37 133,54
Jawa Barat 132,73 138,50 128,78 133,47 123,09 129,05 146,72 153,23 125,27 130,66Banten 131,95 135,35 118,25 122,36 135,93 139,13 154,69 156,04 147,08 151,12Jawa Tengah 140,13 146,61 134,93 141,67 161,83 168,87 129,48 133,88 148,78 157,53DI Yogyakarta 132,78 138,60 109,70 115,24 123,75 129,29 155,09 160,07 152,45 159,35Jawa Timur 132,40 138,88 131,20 138,94 141,23 150,51 131,51 136,65 139,20 144,97
Bali 119,01 124,17 100,20 105,51 138,34 144,48 131,41 135,89 150,99 156,08Nusa Tenggara Barat 147,62 151,38 151,06 155,58 119,11 120,63 154,27 156,81 154,49 159,60Nusa Tenggara Timur 144,92 150,39 123,04 128,82 180,39 185,43 146,20 151,34 119,50 123,64
Kalimantan Barat 104,79 105,80 99,45 99,81 97,25 98,84 141,52 142,23 114,49 116,44Kalimantan Tengah 117,33 119,32 104,86 106,46 115,65 115,03 121,35 124,18 145,61 151,53Kalimantan Selatan 128,09 133,07 118,49 122,82 129,68 133,66 135,08 138,65 139,68 147,69Kalimantan Timur 141,64 145,68 110,63 113,60 129,01 129,48 157,66 163,88 163,49 167,25
Sulawesi Utara 131,73 135,09 120,76 124,68 151,83 154,72 118,02 121,49 118,49 120,11Gorontalo 117,63 118,97 111,21 112,78 93,52 94,15 144,57 145,17 128,10 133,06Sulawesi Tengah 128,24 131,58 127,04 130,62 130,08 132,41 134,61 138,25 113,38 119,46Sulawesi Selatan 125,80 129,26 117,37 121,72 143,24 146,88 128,68 130,42 156,29 159,37Sulawesi Barat 145,42 149,54 114,37 118,28 166,81 172,22 186,38 186,54 153,95 156,65Sulawesi Tenggara 116,74 118,46 114,25 115,59 113,55 119,88 153,85 158,29 140,70 143,20
Maluku 110,89 113,88 111,07 114,85 107,66 109,36 109,50 111,47 119,18 123,32Maluku Utara 113,56 115,40 105,39 106,41 109,03 111,15 133,68 137,89 140,65 143,02Papua 119,97 124,69 101,42 103,09 138,88 146,52 120,36 126,19 130,90 135,73Papua Barat 136,76 139,34 115,05 117,08 153,19 156,61 155,69 156,89 117,10 119,48
Indonesia 131,60 136,65 124,33 129,62 143,04 149,25 135,45 139,63 140,03 145,37
Tabel ––––––
12.20Table
http
://www.b
ps.g
o.id

H A R G A - H A R G A
S t a t i s t i k I n d o n e s i a 2 0 1 3452
ProvinsiProvince
Indeks Harga yang Dibayar PetaniPrices Paid by Farmers Indices
NTPTIb
Indeks Konsumsi Rumah Tangga
Household Consumption Index
Indeks Biaya Produksi dan Penambahan Barang
ModalCost of Production and
Capital Formation Index
2011 2012 2011 2012 2011 2012 2011 2012
(1) (12) (13) (14) (15) (16) (17) (18) (19)
Aceh 125,38 128,21 128,50 132,97 121,09 121,65 98,55 99,21Sumatera Utara 127,24 131,21 132,40 137,99 120,14 121,87 104,35 105,13Sumatera Barat 125,02 128,30 133,95 139,16 112,71 113,31 100,39 100,29Riau 131,45 134,63 126,24 130,93 138,65 139,74 101,05 101,11Kepulauan Riau 118,28 121,14 125,36 129,60 106,02 106,52 90,47 90,19
Jambi 125,79 129,83 129,68 136,10 120,41 121,16 98,75 99,28Sumatera Selatan 122,00 125,67 131,75 137,31 108,51 109,56 104,95 104,83Kepulauan Bangka Belitung 112,93 116,02 119,29 124,43 104,07 104,32 95,20 95,65Bengkulu 130,62 134,14 139,64 145,09 118,13 118,98 109,70 109,23Lampung 120,39 123,28 126,61 130,85 110,57 111,32 105,90 105,58
Jawa Barat 135,80 140,95 140,83 147,53 125,84 127,91 97,74 98,27Banten 129,44 133,15 132,47 137,35 123,64 125,13 101,94 101,65Jawa Tengah 129,64 135,65 131,46 139,03 125,70 128,34 108,09 108,08DI Yogyakarta 128,45 132,56 127,36 132,90 130,58 131,91 103,37 104,55Jawa Timur 135,65 141,61 138,29 146,26 130,23 132,03 97,60 98,07
Bali 131,11 134,90 132,86 138,05 128,00 129,30 90,77 92,04Nusa Tenggara Barat 129,06 132,56 139,06 144,06 109,26 109,79 114,38 114,20Nusa Tenggara Timur 125,75 131,38 136,06 143,85 102,95 103,81 115,24 114,47
Kalimantan Barat 125,76 131,30 133,73 141,92 109,92 110,21 83,32 80,58Kalimantan Tengah 129,31 133,01 136,99 141,61 113,22 115,00 90,74 89,70Kalimantan Selatan 124,36 127,72 133,86 138,77 106,49 106,92 103,00 104,19Kalimantan Timur 121,65 125,47 129,19 134,47 106,17 106,99 116,43 116,11
Sulawesi Utara 129,22 134,44 135,45 142,97 116,56 117,10 101,94 100,49Gorontalo 126,04 130,22 128,91 134,62 120,18 121,26 93,33 91,36Sulawesi Tengah 131,36 135,09 138,20 143,67 117,79 118,05 97,63 97,41Sulawesi Selatan 128,93 133,10 137,28 142,93 112,09 113,30 97,57 97,12Sulawesi Barat 130,33 132,90 134,50 138,13 123,56 124,42 111,58 112,52Sulawesi Tenggara 127,36 130,86 132,71 137,93 118,58 119,26 91,66 90,52
Maluku 130,05 134,97 142,93 150,19 103,40 103,48 85,26 84,38Maluku Utara 121,01 123,95 131,51 135,88 101,40 101,65 93,84 93,11Papua 121,64 125,08 129,35 134,25 106,47 107,03 98,62 99,68Papua Barat 120,95 123,91 127,80 132,19 108,52 108,91 113,07 112,45
Indonesia 130,02 134,85 134,58 141,15 121,29 122,77 101,22 101,33
Lanjutan Tabel/Continued Table 12.20
http
://www.b
ps.g
o.id

P R I C E S
S t a t i s t i c a l Y e a r b o o k o f I n d o n e s i a 2 0 1 3 453
Indeks Harga yang Diterima Petani (It), Indeks Harga yang Dibayar Petani (Ib), dan Nilai Tukar Petani Subsektor Perikanan (NTN) Menurut Provinsi (2007=100), 2011 dan 2012Prices Received by Farmers Indices (It), Prices Paid by Farmers Indices (Ib), and Farmers’ Terms of Trade of Fishery Subsector (NTN) by Province (2007=100), 2011 and 2012
[Diolah dari Hasil Survei Harga Perdesaan, BPS/Based on Rural Price Survey, BPS-Statistics Indonesia]
ProvinsiProvince
Indeks Harga yang Diterima PetaniPrices Received by Farmers Indices
It PenangkapanCapture
BudidayaAquaculture
2011 2012 2011 2012 2011 2012(1) (2) (3) (4) (5) (6) (7)
Aceh 127,22 128,46 124,72 126,30 130,89 131,63Sumatera Utara 126,00 129,83 125,14 129,34 134,48 134,72Sumatera Barat 145,02 149,42 148,54 153,05 135,09 139,17Riau 112,66 114,45 113,51 115,52 105,26 105,19Kepulauan Riau 127,46 131,19 127,46 131,19 – –Jambi 112,74 117,62 104,04 109,92 129,47 132,42Sumatera Selatan 145,32 149,72 156,70 161,97 116,83 119,04Kepulauan Bangka Belitung 103,27 105,83 103,31 105,87 93,54 96,34Bengkulu 145,62 150,35 134,86 139,75 175,00 179,27Lampung 138,48 142,67 141,93 146,18 113,40 117,19
Jawa Barat 150,54 153,71 147,14 153,93 152,59 153,57Banten 132,16 137,75 131,65 137,44 138,49 141,47Jawa Tengah 143,97 148,42 146,97 151,64 120,03 122,71DI Yogyakarta 135,77 140,82 126,29 129,64 139,15 144,81Jawa Timur 132,39 135,48 136,87 139,42 120,91 125,40
Bali 112,94 113,63 112,66 113,76 113,58 113,33Nusa Tenggara Barat 124,00 129,77 119,58 125,95 143,07 146,23Nusa Tenggara Timur 152,52 160,13 152,46 160,24 154,73 155,74
Kalimantan Barat 133,48 137,27 135,86 139,90 116,52 118,49Kalimantan Tengah 130,38 134,21 127,65 131,50 151,93 155,62Kalimantan Selatan 106,42 110,79 101,21 106,62 118,89 120,75Kalimantan Timur 113,08 115,06 118,47 121,57 106,96 107,69
Sulawesi Utara 123,60 125,61 124,29 126,31 114,87 116,75Gorontalo 132,87 136,04 130,79 134,70 141,55 141,67Sulawesi Tengah 142,39 147,00 155,08 161,21 108,33 108,87Sulawesi Selatan 143,99 147,42 156,77 161,14 135,39 138,19Sulawesi Barat 136,63 138,95 129,46 131,81 142,64 144,93Sulawesi Tenggara 133,53 138,49 134,99 140,30 122,35 124,64
Maluku 161,53 170,51 161,53 170,51 – –Maluku Utara 128,76 132,39 129,11 132,79 113,43 115,02Papua 104,08 105,26 103,67 104,84 122,93 124,69Papua Barat 142,71 145,94 142,71 145,94 – –
Indonesia 136,47 140,25 138,05 142,61 124,65 126,81
Tabel ––––––
12.21Table
http
://www.b
ps.g
o.id

H A R G A - H A R G A
S t a t i s t i k I n d o n e s i a 2 0 1 3454
ProvinsiProvince
Indeks Harga yang Dibayar PetaniPrices Paid by Farmers Indices
NTNIb
Indeks Konsumsi Rumah Tangga
Household Consumption
Index
Indeks Biaya Produksi dan Penambahan Barang
ModalCost of Production and
Capital Formation Index
2011 2012 2011 2012 2011 2012 2011 2012(1) (8) (9) (10) (11) (12) (13) (14) (15)
Aceh 124,48 128,53 133,17 139,16 110,23 111,11 102,21 99,95Sumatera Utara 126,97 130,95 133,58 139,03 115,86 117,35 99,23 99,15Sumatera Barat 130,95 135,36 133,96 139,40 125,74 128,38 110,75 110,39Riau 122,19 125,90 122,82 127,88 120,80 121,48 92,20 90,91Kepulauan Riau 119,16 122,01 125,56 129,91 108,69 109,08 106,96 107,52
Jambi 124,86 129,67 128,50 134,86 117,21 118,73 90,29 90,71Sumatera Selatan 125,63 129,70 128,91 133,93 119,08 121,29 115,68 115,43Kepulauan Bangka Belitung 114,06 117,94 119,75 125,48 104,68 105,51 90,54 89,74Bengkulu 133,29 137,53 143,14 149,03 116,03 117,38 109,25 109,32Lampung 121,80 125,31 126,79 131,85 114,08 115,19 113,69 113,85
Jawa Barat 132,03 136,63 141,10 147,88 119,92 121,61 114,02 112,50Banten 135,37 139,31 134,72 139,66 136,37 138,76 97,63 98,88Jawa Tengah 129,42 135,52 131,52 139,02 125,98 129,76 111,24 109,51DI Yogyakarta 119,40 122,94 128,28 133,90 107,04 107,70 113,71 114,54Jawa Timur 130,39 136,12 139,22 147,15 117,02 119,39 101,53 99,53
Bali 128,96 133,22 136,45 142,45 112,79 113,33 87,58 85,29Nusa Tenggara Barat 129,88 134,77 139,52 146,32 108,85 109,54 95,47 96,29Nusa Tenggara Timur 131,50 137,48 138,13 146,23 116,85 118,14 115,99 116,48
Kalimantan Barat 125,35 131,71 132,93 141,81 110,83 112,36 106,49 104,22Kalimantan Tengah 124,60 129,00 135,05 141,07 107,13 108,82 104,64 104,04Kalimantan Selatan 123,90 127,45 130,73 135,53 109,91 110,89 85,90 86,93Kalimantan Timur 124,71 129,32 130,54 137,08 113,16 113,96 90,67 88,97
Sulawesi Utara 127,71 132,32 134,80 141,28 113,51 114,38 96,78 94,93Gorontalo 124,43 128,67 127,17 133,12 119,10 120,02 106,78 105,73Sulawesi Tengah 128,10 132,45 136,73 143,00 112,75 113,68 111,15 110,99Sulawesi Selatan 127,58 131,37 137,27 142,55 112,91 114,46 112,87 112,22Sulawesi Barat 128,01 131,35 136,42 140,35 111,11 113,25 106,73 105,78Sulawesi Tenggara 124,57 128,16 133,88 139,10 106,94 107,44 107,19 108,05
Maluku 131,64 135,89 142,79 148,60 112,26 113,80 122,70 125,48Maluku Utara 128,97 132,03 133,24 137,03 120,98 122,67 99,84 100,28Papua 123,65 126,86 130,37 134,82 108,87 109,37 84,18 82,98Papua Barat 126,65 130,17 133,56 138,51 112,66 113,31 112,68 112,11
Indonesia 128,45 133,10 135,44 141,84 116,90 118,63 106,24 105,37
Lanjutan Tabel/Continued Table 12.21
http
://www.b
ps.g
o.id

P R I C E S
S t a t i s t i c a l Y e a r b o o k o f I n d o n e s i a 2 0 1 3 455
Indeks Konsumsi Rumah Tangga Wilayah Perdesaan Menurut Provinsi (2007=100), 2011 dan 2012Consumptions Indices of Rural Households by Province (2007=100), 2011 and 2012
[Diolah dari Hasil Survei Harga Perdesaan, BPS/Based on Rural Price, BPS-Statistics Indonesia]
ProvinsiProvince
Bahan MakananFoodstuff
Makan JadiPrepared Food
PerumahanHousing
SandangClothing
2011 2012 2011 2012 2011 2012 2011 2012(1) (2) (3) (4) (5) (6) (7) (8) (9)
Aceh 139,98 145,69 131,03 136,57 118,74 122,24 124,52 129,02Sumatera Utara 139,52 145,64 136,83 143,96 132,82 136,57 137,85 145,80Sumatera Barat 142,00 148,45 137,18 143,31 125,65 132,69 125,22 128,48Riau 129,23 133,79 123,41 129,92 115,04 119,22 131,11 136,14Kepulauan Riau 133,71 139,38 133,19 136,15 122,77 127,91 121,32 124,00Jambi 138,74 145,72 121,22 128,26 127,18 132,53 124,82 132,18Sumatera Selatan 132,07 138,23 127,83 132,62 133,23 138,72 129,86 133,83Kepulauan Bangka Belitung 125,64 131,78 128,00 133,70 115,48 121,39 118,76 124,08Bengkulu 156,33 162,58 137,30 142,72 146,36 153,16 131,36 137,58Lampung 130,47 134,66 129,95 136,80 127,92 133,73 145,63 152,85
Jawa Barat 144,91 150,40 134,72 142,26 152,27 161,62 134,65 141,65Banten 133,03 136,92 132,49 138,89 149,50 153,45 138,29 145,22Jawa Tengah 135,15 142,77 133,30 142,44 138,07 146,90 126,93 133,30DI Yogyakarta 137,18 142,61 132,13 140,19 124,07 129,90 130,62 136,55Jawa Timur 147,93 157,45 136,64 144,65 140,32 149,09 137,95 144,79
Bali 140,07 146,41 133,72 139,01 129,40 136,31 135,48 140,84Nusa Tenggara Barat 149,29 155,78 134,44 139,53 135,72 141,38 122,10 126,82Nusa Tenggara Timur 145,97 155,58 140,94 147,89 138,13 142,55 126,98 133,38
Kalimantan Barat 142,44 152,47 129,72 137,33 132,71 139,20 123,70 130,31Kalimantan Tengah 144,97 150,99 134,01 141,70 126,83 132,81 128,04 133,17Kalimantan Selatan 145,51 151,28 122,57 127,39 121,60 125,17 129,58 134,81Kalimantan Timur 137,53 145,51 135,73 143,25 127,02 130,97 119,51 124,43
Sulawesi Utara 147,68 156,09 133,02 139,58 119,91 124,01 116,91 118,53Gorontalo 134,12 141,31 131,73 137,63 113,67 116,11 128,86 133,40Sulawesi Tengah 147,75 153,42 128,90 137,58 137,03 143,20 134,68 142,57Sulawesi Selatan 151,49 157,80 132,74 138,84 130,91 136,23 130,93 135,41Sulawesi Barat 140,42 142,86 140,73 147,76 130,05 133,12 133,83 139,14Sulawesi Tenggara 140,58 145,53 133,42 140,67 133,44 139,31 140,85 147,20
Maluku 161,32 168,07 133,74 140,67 125,21 131,29 123,11 128,03Maluku Utara 142,99 148,22 120,68 127,07 125,50 128,72 129,97 132,77Papua 139,91 145,06 129,63 135,34 130,13 133,85 115,03 118,81Papua Barat 150,68 157,84 121,48 126,17 122,95 124,96 129,34 133,63
Indonesia 142,06 149,13 133,54 140,86 136,12 143,01 131,87 138,00
Tabel ––––––
12.22Table
http
://www.b
ps.g
o.id

H A R G A - H A R G A
S t a t i s t i k I n d o n e s i a 2 0 1 3456
ProvinsiProvince
KesehatanHealth
Pendidikan, Rekreasi, dan Olah Raga
Education, Recreation, and Sport
Transportasi dan Komunikasi
Transportation and Communication
2011 2012 2011 2012 2011 2012(1) (10) (11) (12) (13) (14) (15)
Aceh 113,66 117,65 109,16 110,54 109,76 111,61Sumatera Utara 127,93 133,23 122,04 126,97 110,88 113,01Sumatera Barat 122,53 125,49 129,28 131,55 121,79 123,71Riau 118,67 122,43 113,81 117,84 110,23 111,63Kepulauan Riau 117,93 121,32 113,86 116,54 108,84 110,43Jambi 115,73 121,85 108,71 110,61 122,87 125,09Sumatera Selatan 125,14 129,25 125,90 127,13 108,77 109,68Kepulauan Bangka Belitung 113,18 117,85 110,54 112,74 101,42 102,31Bengkulu 123,63 127,93 120,27 123,10 111,92 113,38Lampung 124,14 127,36 110,93 111,58 104,75 106,07
Jawa Barat 131,52 136,42 127,58 132,34 115,99 118,15Banten 127,39 134,18 112,44 116,17 135,45 136,30Jawa Tengah 123,04 127,86 123,77 127,92 113,93 116,76DI Yogyakarta 118,93 122,89 118,44 122,66 105,56 106,55Jawa Timur 125,54 130,98 126,12 129,78 112,74 114,37
Bali 119,51 123,66 128,08 130,97 107,10 108,54Nusa Tenggara Barat 121,83 125,06 131,58 134,86 116,46 117,05Nusa Tenggara Timur 127,07 131,69 124,09 127,24 116,78 118,36
Kalimantan Barat 114,35 118,65 114,77 117,07 105,30 107,59Kalimantan Tengah 119,09 124,39 115,08 119,27 112,52 113,77Kalimantan Selatan 116,74 120,83 111,57 112,47 118,03 120,34Kalimantan Timur 116,30 120,44 107,80 109,54 109,26 110,03
Sulawesi Utara 120,32 124,99 113,21 114,99 111,86 112,65Gorontalo 114,16 117,87 109,23 111,70 116,74 119,17Sulawesi Tengah 114,38 118,30 120,63 124,06 125,52 127,87Sulawesi Selatan 125,24 127,65 114,91 115,63 106,94 107,40Sulawesi Barat 124,93 127,78 122,80 126,54 114,92 115,67Sulawesi Tenggara 131,21 135,11 111,03 113,08 105,93 106,97
Maluku 118,59 122,88 111,84 113,04 119,17 121,82Maluku Utara 130,92 132,59 116,33 116,94 127,37 129,05Papua 118,01 121,27 132,33 134,58 114,47 116,52Papua Barat 123,01 125,20 111,93 113,27 104,01 104,47
Indonesia 124,10 128,66 121,75 124,95 113,40 115,18
Lanjutan Tabel/Continued Table 12.22
http
://www.b
ps.g
o.id
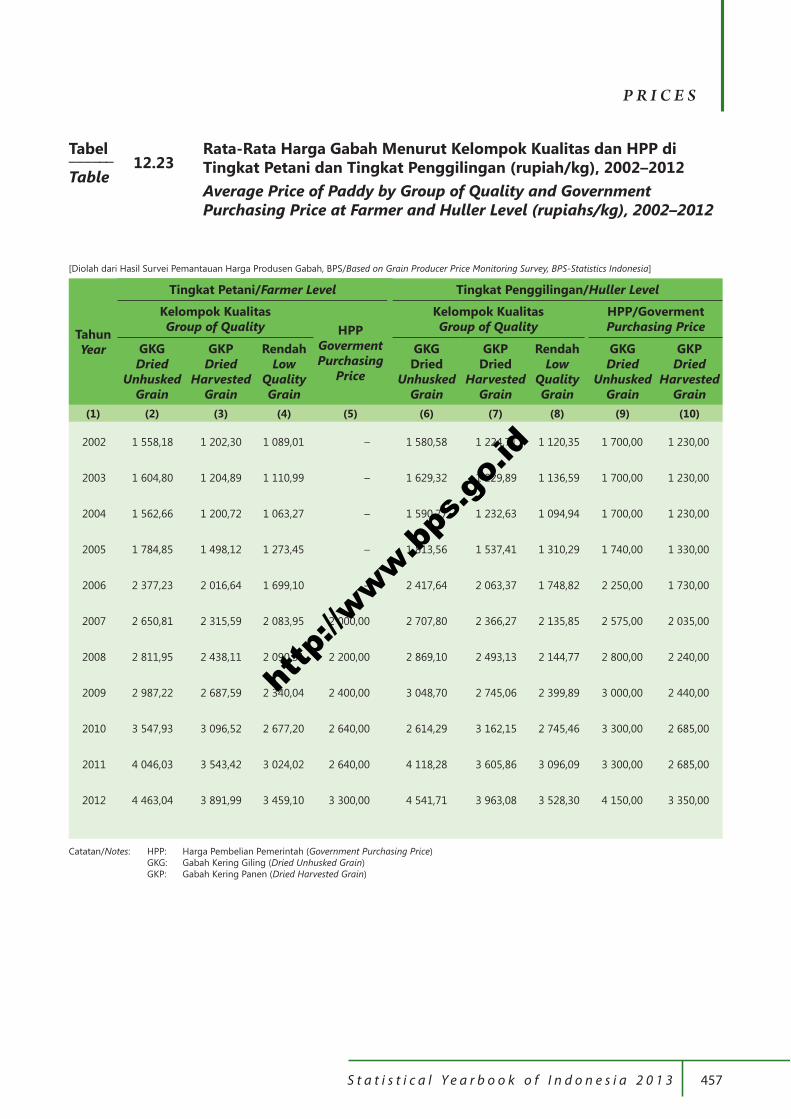
P R I C E S
S t a t i s t i c a l Y e a r b o o k o f I n d o n e s i a 2 0 1 3 457
Rata-Rata Harga Gabah Menurut Kelompok Kualitas dan HPP di Tingkat Petani dan Tingkat Penggilingan (rupiah/kg), 2002–2012Average Price of Paddy by Group of Quality and Government Purchasing Price at Farmer and Huller Level (rupiahs/kg), 2002–2012
[Diolah dari Hasil Survei Pemantauan Harga Produsen Gabah, BPS/Based on Grain Producer Price Monitoring Survey, BPS-Statistics Indonesia]
TahunYear
Tingkat Petani/Farmer Level Tingkat Penggilingan/Huller Level
Kelompok KualitasGroup of Quality HPP
GovermentPurchasing
Price
Kelompok KualitasGroup of Quality
HPP/GovermentPurchasing Price
GKGDried
Unhusked Grain
GKPDried
Harvested Grain
RendahLow
Quality Grain
GKGDried
Unhusked Grain
GKPDried
Harvested Grain
RendahLow
Quality Grain
GKGDried
Unhusked Grain
GKPDried
Harvested Grain
(1) (2) (3) (4) (5) (6) (7) (8) (9) (10)
2002 1 558,18 1 202,30 1 089,01 – 1 580,58 1 224,71 1 120,35 1 700,00 1 230,00
2003 1 604,80 1 204,89 1 110,99 – 1 629,32 1 229,89 1 136,59 1 700,00 1 230,00
2004 1 562,66 1 200,72 1 063,27 – 1 590,77 1 232,63 1 094,94 1 700,00 1 230,00
2005 1 784,85 1 498,12 1 273,45 – 1 813,56 1 537,41 1 310,29 1 740,00 1 330,00
2006 2 377,23 2 016,64 1 699,10 – 2 417,64 2 063,37 1 748,82 2 250,00 1 730,00
2007 2 650,81 2 315,59 2 083,95 2 000,00 2 707,80 2 366,27 2 135,85 2 575,00 2 035,00
2008 2 811,95 2 438,11 2 090,31 2 200,00 2 869,10 2 493,13 2 144,77 2 800,00 2 240,00
2009 2 987,22 2 687,59 2 340,04 2 400,00 3 048,70 2 745,06 2 399,89 3 000,00 2 440,00
2010 3 547,93 3 096,52 2 677,20 2 640,00 2 614,29 3 162,15 2 745,46 3 300,00 2 685,00
2011 4 046,03 3 543,42 3 024,02 2 640,00 4 118,28 3 605,86 3 096,09 3 300,00 2 685,00
2012 4 463,04 3 891,99 3 459,10 3 300,00 4 541,71 3 963,08 3 528,30 4 150,00 3 350,00
Catatan/Notes: HPP: Harga Pembelian Pemerintah (Government Purchasing Price) GKG: Gabah Kering Giling (Dried Unhusked Grain) GKP: Gabah Kering Panen (Dried Harvested Grain)
Tabel ––––––
12.23Table
http
://www.b
ps.g
o.id
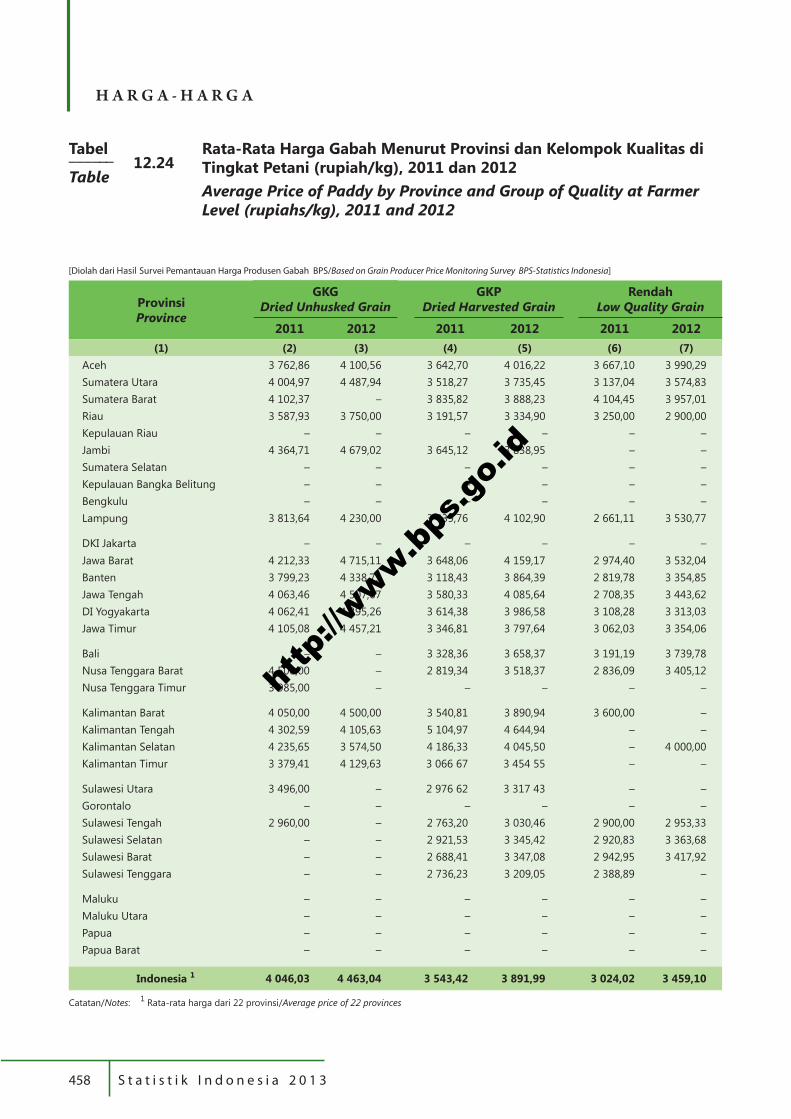
H A R G A - H A R G A
S t a t i s t i k I n d o n e s i a 2 0 1 3458
Rata-Rata Harga Gabah Menurut Provinsi dan Kelompok Kualitas di Tingkat Petani (rupiah/kg), 2011 dan 2012Average Price of Paddy by Province and Group of Quality at Farmer Level (rupiahs/kg), 2011 and 2012
[Diolah dari Hasil Survei Pemantauan Harga Produsen Gabah BPS/Based on Grain Producer Price Monitoring Survey BPS-Statistics Indonesia]
ProvinsiProvince
GKGDried Unhusked Grain
GKPDried Harvested Grain
RendahLow Quality Grain
2011 2012 2011 2012 2011 2012(1) (2) (3) (4) (5) (6) (7)
Aceh 3 762,86 4 100,56 3 642,70 4 016,22 3 667,10 3 990,29Sumatera Utara 4 004,97 4 487,94 3 518,27 3 735,45 3 137,04 3 574,83Sumatera Barat 4 102,37 – 3 835,82 3 888,23 4 104,45 3 957,01Riau 3 587,93 3 750,00 3 191,57 3 334,90 3 250,00 2 900,00Kepulauan Riau – – – – – –Jambi 4 364,71 4 679,02 3 645,12 3 838,95 – –Sumatera Selatan – – – – – –Kepulauan Bangka Belitung – – – – – –Bengkulu – – – – – –Lampung 3 813,64 4 230,00 3 439,76 4 102,90 2 661,11 3 530,77
DKI Jakarta – – – – – –Jawa Barat 4 212,33 4 715,11 3 648,06 4 159,17 2 974,40 3 532,04Banten 3 799,23 4 338,73 3 118,43 3 864,39 2 819,78 3 354,85Jawa Tengah 4 063,46 4 507,67 3 580,33 4 085,64 2 708,35 3 443,62DI Yogyakarta 4 062,41 4 395,26 3 614,38 3 986,58 3 108,28 3 313,03Jawa Timur 4 105,08 4 457,21 3 346,81 3 797,64 3 062,03 3 354,06
Bali – – 3 328,36 3 658,37 3 191,19 3 739,78Nusa Tenggara Barat 4 500,00 – 2 819,34 3 518,37 2 836,09 3 405,12Nusa Tenggara Timur 3 985,00 – – – – –
Kalimantan Barat 4 050,00 4 500,00 3 540,81 3 890,94 3 600,00 –Kalimantan Tengah 4 302,59 4 105,63 5 104,97 4 644,94 – –Kalimantan Selatan 4 235,65 3 574,50 4 186,33 4 045,50 – 4 000,00Kalimantan Timur 3 379,41 4 129,63 3 066 67 3 454 55 – –
Sulawesi Utara 3 496,00 – 2 976 62 3 317 43 – –Gorontalo – – – – – –Sulawesi Tengah 2 960,00 – 2 763,20 3 030,46 2 900,00 2 953,33Sulawesi Selatan – – 2 921,53 3 345,42 2 920,83 3 363,68Sulawesi Barat – – 2 688,41 3 347,08 2 942,95 3 417,92Sulawesi Tenggara – – 2 736,23 3 209,05 2 388,89 –
Maluku – – – – – –Maluku Utara – – – – – –Papua – – – – – –Papua Barat – – – – – –
Indonesia 1 4 046,03 4 463,04 3 543,42 3 891,99 3 024,02 3 459,10
Catatan/Notes: 1 Rata-rata harga dari 22 provinsi/Average price of 22 provinces
Tabel ––––––
12.24Table
http
://www.b
ps.g
o.id

P R I C E S
S t a t i s t i c a l Y e a r b o o k o f I n d o n e s i a 2 0 1 3 459
Rata-Rata Harga Gabah Menurut Provinsi dan Kelompok Kualitas di Tingkat Penggilingan (rupiah/kg), 2011 dan 2012Average Price of Paddy by Province and Group of Quality at Huller Level (rupiahs/kg), 2011 and 2012
[Diolah dari Hasil Survei Pemantauan Harga Produsen Gabah, BPS/Based on Grain Producer Price Monitoring Survey, BPS-Statistics Indonesia]
ProvinsiProvince
GKGDried Unhusked Grain
GKPDried Harvested
Grain
RendahLow Quality Grain
2011 2012 2011 2012 2011 2012(1) (2) (3) (4) (5) (6) (7)
Aceh 3 858,57 4 176,41 3 730,49 4 096,33 3 924,17 4 105,18Sumatera Utara 4 052,58 4 544,25 3 563,80 3 792,29 3 194,24 3 642,62Sumatera Barat 4 204,33 – 3 903,37 3 965,61 4 211,57 4 044,98Riau 3 658,10 3 796,67 3 249,19 3 432,81 3 297,00 3 000,00Kepulauan Riau – – – – – –Jambi 4 414,71 4 729,02 3 688,54 3 888,95 – –Sumatera Selatan – – – – – –Kepulauan Bangka Belitung – – – – – –Bengkulu – – – – – –Lampung 3 863,18 4 275,00 3 524,08 4 185,22 2 750,93 3 583,85
DKI Jakarta – – – – – –Jawa Barat 4 303,57 4 801,15 3 737,23 4 250,29 3 080,51 3 637,80Banten 3 877,76 4 432,40 3 210,97 3 950,20 2 947,80 3 469,63Jawa Tengah 4 123,07 4 570,45 3 623,26 4 128,07 2 748,88 3 487,05DI Yogyakarta 4 094,44 4 428,95 3 658,46 4 030,68 3 151,58 3 360,85Jawa Timur 4 158,42 4 513,61 3 395,92 3 851,31 3 121,96 3 416,40
Bali – – 3 376,93 3 719,81 3 239,98 3 792,54Nusa Tenggara Barat 4 590,00 – 2 860,74 3 568,95 2 901,60 3 459,46Nusa Tenggara Timur 3 985,00 – – – – –
Kalimantan Barat 4 090,00 4 540,00 3 607,07 3 985,00 3 650,00 –Kalimantan Tengah 4 475,86 4 291,25 5 213,04 4 787,19 – –Kalimantan Selatan 4 333,88 3 599,50 4 265,38 4 128,57 – 4 060,60Kalimantan Timur 3 462,35 4 240,74 3 109,72 3 536,36 – –
Sulawesi Utara 3 496,00 – 3 046,64 3 387,44 – –Gorontalo – – – – – –Sulawesi Tengah 3 000,00 – 2 807,80 3 103,68 2 945,00 3 013,33Sulawesi Selatan – – 2 982,25 3 428,33 2 993,47 3 452,72Sulawesi Barat – – 2 741,90 3 401,78 2 999,28 3 476,62Sulawesi Tenggara – – 2 841,42 3 362,07 2 443,33 –
Maluku – – – – – –Maluku Utara – – – – – –Papua – – – – – –Papua Barat – – – – – –
Indonesia 1 4 118,28 4 541,71 3 605,86 3 963,08 3 096,09 3 528,30
Catatan/Notes: 1 Rata-rata harga dari 22 provinsi/Average price of 22 provinces
Tabel ––––––
12.25Table
http
://www.b
ps.g
o.id

H A R G A - H A R G A
S t a t i s t i k I n d o n e s i a 2 0 1 3460
[Diolah dari Hasil Survei Pemantauan Harga Produsen Gabah, BPS/Based on Grain Producer Price Monitoring Survey, BPS-Statistics Indonesia]
BulanMonth
GKPDried Harvested Grain
GKGDried Unhusked GrainTingkat Petani
Farmer LevelTingkat Penggilingan
Huller Level
(1) (2) (3) (4)
Januari/January – – –
Februari/February – – –
Maret/March 0,865 0,766 2,128
April/April 0,746 0,546 0,989
Mei/May 0,118 0,104 0,699
Juni/June 0,384 0,338 0,821
Juli/July 0,252 0,120 0,277
Agustus/August 0,065 0,034 0,013
September/September 0,036 0,018 0,043
Oktober/October 0,035 0,006 0,205
November/November 0,058 0,006 0,070
Desember/December –-0,164 0,112 –
Indeks Kedalaman Harga Gabah yang Berada di Bawah HPP, Januari–Desember 2012Gap Index of Paddy Price Under HPP, January–December 2012
Tabel ––––––
12.26Table
http
://www.b
ps.g
o.id

P R I C E S
S t a t i s t i c a l Y e a r b o o k o f I n d o n e s i a 2 0 1 3 461
[Diolah dari Hasil Survei Pemantauan Harga Produsen Gabah, BPS/Based on Grain Producer Price Monitoring Survey, BPS-Statistics Indonesia]
BulanMonth
GKPDried Harvested Grain
GKGDried Unhusked GrainTingkat Petani
Farmer LevelTingkat Penggilingan
Huller Level
(1) (2) (3) (4)
Januari/January – – –
Februari/February – – –
Maret/March 0,0648 0,0506 0,1856
April/April 0,0562 0,0343 0,0911
Mei/May 0,0049 0,0047 0,0411
Juni/June 0,0342 0,0305 0,0853
Juli/July 0,0175 0,1484 0,0141
Agustus/August 0,0055 0,0032 0,0002
September/September 0,0033 0,0008 0,0005
Oktober/October 0,0032 0,0001 0,0233
November/November 0,0040 0,0001 0,0008
Desember/December 0,0137 0,0072 –
Indeks Keparahan Harga Gabah yang Berada di Bawah HPP, Januari–Desember 2012Severity Index of Paddy Price Under HPP, January–December 2012
Tabel ––––––
12.27Table
http
://www.b
ps.g
o.id

http
://www.b
ps.g
o.id

PENGELUARAN PENDUDUK SERTA
KETERSEDIAAN DAN KONSUMSI MAKANAN
Population Expenditure and Food Availability and
Consumption
13http
://www.b
ps.g
o.id

http
://www.b
ps.g
o.id

POPULATION EXPENDITURE AND FOOD AVAILABILITY AND CONSUMPTION
S t a t i s t i c a l Y e a r b o o k o f I n d o n e s i a 2 0 1 3 465
PENJELASAN TEKNIS
1. Data ketersediaan konsumsi pangan per kapita bersumber dari perhitungan Neraca Bahan Makanan (NBM) Indonesia, hasil kerja sama antara Badan Pusat Statistik (BPS) dan Kementerian Pertanian.
2. Metoda yang dipakai untuk penyusunan NBM berpedoman pada buku rujukan yang diterbitkan oleh organisasi pangan sedunia yaitu Food Agriculture Organization (FAO).
3. Penyediaan pangan dalam negeri adalah produk dalam negeri ditambah dengan perubahan stok dan impor dikurangi dengan ekspor.
4. Ketersediaan pangan untuk dikonsumsi penduduk terlebih dahulu dikurangi dengan bagian produksi yang digunakan untuk bibit, makanan ternak, industri, dan yang tercecer.
5. Ketersediaan pangan per kapita adalah ketersediaan pangan dibagi dengan jumlah penduduk pertengahan tahun. Ketersediaan pangan per kapita bisa dalam bentuk kuantum maupun unsur gizi yaitu kalori, protein, dan lemak.
6. Mulai tahun 2011 Susenas dilaksanakan secara Triwulan, yaitu Triwulan I dilaksanakan bulan Maret, Triwulan II bulan Juni, Triwulan III bulan September dan Triwulan IV dilaksanakan bulan Desember.
7. Data pengeluaran dan konsumsi penduduk menurut kelompok barang diperoleh dari Survei Sosial Ekonomi Nasional (Susenas) BPS Triwulan I-2012, yang mencakup semua provinsi di Indonesia.
8. Pelaksanaan Susenas 2012 mencakup 300.000 rumah tangga sampel yang tersebar di seluruh provinsi di Indonesia, dimana pada setiap triwulan didistribusikan sampel sebanyak 75.000 rumah tangga.
9. Data konsumsi/pengeluaran yang dikumpulkan pada
Susenas Triwulan I-2012 dibagi mejadi dua kelompok yaitu konsumsi makanan dan bukan makanan.
10. Konsumsi/pengeluaran makanan dirinci menjadi 215 komoditi, masing-masing dikumpulkan data kuantitas dan nilainya.
TECHNICAL NOTES
1. Data on the availability of per capita food consumption are from the Indonesian Food Balance Sheet computed by the BPS-Statistics Indonesia (BPS) in collaboration with the Ministry of Agriculture.
2. The FAO method is adopted to compute the Food Balance Sheet.
3. Domestic food availability is defined as domestic production plus changes in stock and imports minus exports.
4. In compiling data on domestic food availability, the share of production for seeds, waste, residuals, animal feeds, and industrial use is first taken into account.
5. Per capita food availability is total food availability divided by number of population in the middle of the year. It is presented in terms of quantity as well as nutrient content such as calories, proteins, and fats.
6. Starting 2011 Susenas implemented in quarterly i.e. The First Quarter of 2011 Susenas held in March, the Second Quarter held in June, the Third Quarter held in September and the Fourth Quarter held in December.
7. Data on consumer expenditure and consumption by commodity group of expenditure are obtained from the 2012 National Socio-Economic Survey (Susenas) First Quarter which covers all provinces in Indonesia.
8. The 2012 Susenas cover 300 000 households sample spread all over Indonesia where each quarter distribute about 75 000 households sample.
9. The data of consumption/expenditure collected in the First Quarter of 2012 Susenas are divided into two groups, namely food and non-food consumption.
10. Consumption/expenditure on food covers 215 commodities, both quantity data and values are collected.
http
://www.b
ps.g
o.id
PENGELUARAN PENDUDUK SERTA KETERSEDIAAN DAN KONSUMSI MAKANAN
S t a t i s t i k I n d o n e s i a 2 0 1 3466
11. Untuk konsumsi bukan makanan pada umumnya yang dikumpulkan hanya data nilainya, kecuali untuk beberapa jenis pengeluaran tertentu, seperti penggunaan listrik, air, gas, dan bahan bakar minyak (BBM) yang juga dikumpulkan kuantitasnya.
11. For consumption of non-food, the data collected in general are only their values, except for certain types of expenditure, such as electricity, water, gas, and fuel, which are also collected for their quantity data.
http
://www.b
ps.g
o.id
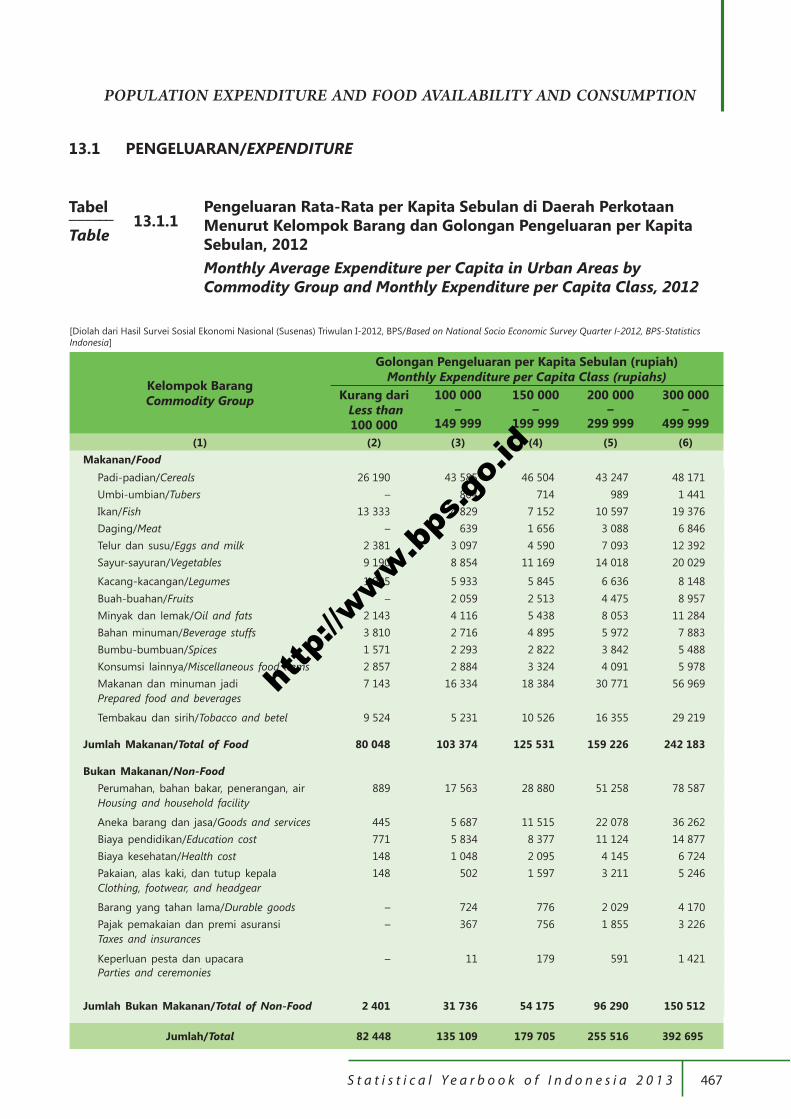
POPULATION EXPENDITURE AND FOOD AVAILABILITY AND CONSUMPTION
S t a t i s t i c a l Y e a r b o o k o f I n d o n e s i a 2 0 1 3 467
Pengeluaran Rata-Rata per Kapita Sebulan di Daerah Perkotaan Menurut Kelompok Barang dan Golongan Pengeluaran per Kapita Sebulan, 2012Monthly Average Expenditure per Capita in Urban Areas by Commodity Group and Monthly Expenditure per Capita Class, 2012
13.1 PENGELUARAN/EXPENDITURE
[Diolah dari Hasil Survei Sosial Ekonomi Nasional (Susenas) Triwulan I-2012, BPS/Based on National Socio Economic Survey Quarter I-2012, BPS-Statistics Indonesia]
Kelompok BarangCommodity Group
Golongan Pengeluaran per Kapita Sebulan (rupiah)Monthly Expenditure per Capita Class (rupiahs)
Kurang dari Less than 100 000
100 000–
149 999
150 000–
199 999
200 000–
299 999
300 000–
499 999(1) (2) (3) (4) (5) (6)
Makanan/FoodPadi-padian/Cereals 26 190 43 585 46 504 43 247 48 171Umbi-umbian/Tubers – 804 714 989 1 441Ikan/Fish 13 333 4 829 7 152 10 597 19 376Daging/Meat – 639 1 656 3 088 6 846Telur dan susu/Eggs and milk 2 381 3 097 4 590 7 093 12 392Sayur-sayuran/Vegetables 9 190 8 854 11 169 14 018 20 029
Kacang-kacangan/Legumes 1 905 5 933 5 845 6 636 8 148Buah-buahan/Fruits – 2 059 2 513 4 475 8 957Minyak dan lemak/Oil and fats 2 143 4 116 5 438 8 053 11 284Bahan minuman/Beverage stuffs 3 810 2 716 4 895 5 972 7 883Bumbu-bumbuan/Spices 1 571 2 293 2 822 3 842 5 488Konsumsi lainnya/Miscellaneous food items 2 857 2 884 3 324 4 091 5 978Makanan dan minuman jadi 7 143 16 334 18 384 30 771 56 969Prepared food and beverages
Tembakau dan sirih/Tobacco and betel 9 524 5 231 10 526 16 355 29 219
Jumlah Makanan/Total of Food 80 048 103 374 125 531 159 226 242 183
Bukan Makanan/Non-FoodPerumahan, bahan bakar, penerangan, air 889 17 563 28 880 51 258 78 587Housing and household facility
Aneka barang dan jasa/Goods and services 445 5 687 11 515 22 078 36 262Biaya pendidikan/Education cost 771 5 834 8 377 11 124 14 877Biaya kesehatan/Health cost 148 1 048 2 095 4 145 6 724Pakaian, alas kaki, dan tutup kepala 148 502 1 597 3 211 5 246Clothing, footwear, and headgear
Barang yang tahan lama/Durable goods – 724 776 2 029 4 170Pajak pemakaian dan premi asuransi – 367 756 1 855 3 226Taxes and insurances
Keperluan pesta dan upacara – 11 179 591 1 421Parties and ceremonies
Jumlah Bukan Makanan/Total of Non-Food 2 401 31 736 54 175 96 290 150 512
Jumlah/Total 82 448 135 109 179 705 255 516 392 695
Tabel ––––––
13.1.1Table
http
://www.b
ps.g
o.id
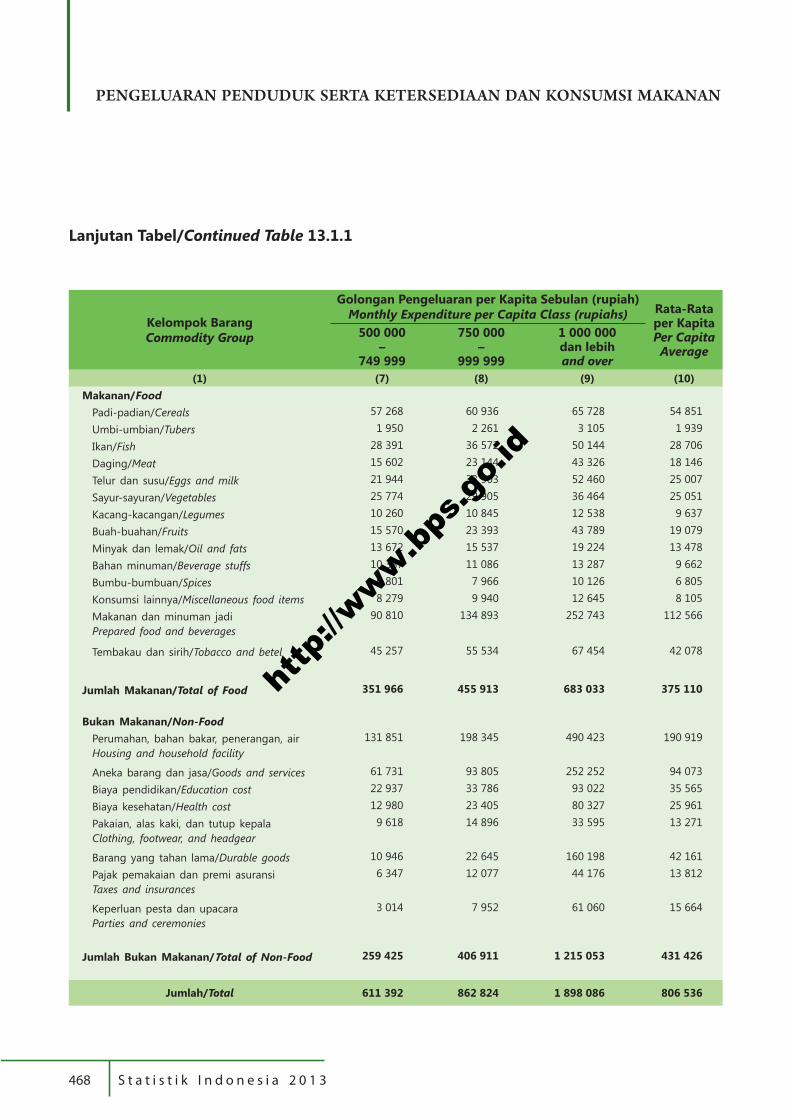
PENGELUARAN PENDUDUK SERTA KETERSEDIAAN DAN KONSUMSI MAKANAN
S t a t i s t i k I n d o n e s i a 2 0 1 3468
Lanjutan Tabel/Continued Table 13.1.1
Kelompok BarangCommodity Group
Golongan Pengeluaran per Kapita Sebulan (rupiah)Monthly Expenditure per Capita Class (rupiahs) Rata-Rata
per KapitaPer CapitaAverage
500 000–
749 999
750 000–
999 999
1 000 000dan lebihand over
(1) (7) (8) (9) (10)Makanan/Food
Padi-padian/Cereals 57 268 60 936 65 728 54 851
Umbi-umbian/Tubers 1 950 2 261 3 105 1 939
Ikan/Fish 28 391 36 572 50 144 28 706
Daging/Meat 15 602 23 144 43 326 18 146
Telur dan susu/Eggs and milk 21 944 33 903 52 460 25 007
Sayur-sayuran/Vegetables 25 774 29 905 36 464 25 051
Kacang-kacangan/Legumes 10 260 10 845 12 538 9 637
Buah-buahan/Fruits 15 570 23 393 43 789 19 079
Minyak dan lemak/Oil and fats 13 672 15 537 19 224 13 478
Bahan minuman/Beverage stuffs 10 387 11 086 13 287 9 662
Bumbu-bumbuan/Spices 6 801 7 966 10 126 6 805
Konsumsi lainnya/Miscellaneous food items 8 279 9 940 12 645 8 105
Makanan dan minuman jadi 90 810 134 893 252 743 112 566Prepared food and beverages
Tembakau dan sirih/Tobacco and betel 45 257 55 534 67 454 42 078
Jumlah Makanan/Total of Food 351 966 455 913 683 033 375 110
Bukan Makanan/Non-FoodPerumahan, bahan bakar, penerangan, air 131 851 198 345 490 423 190 919Housing and household facility
Aneka barang dan jasa/Goods and services 61 731 93 805 252 252 94 073
Biaya pendidikan/Education cost 22 937 33 786 93 022 35 565
Biaya kesehatan/Health cost 12 980 23 405 80 327 25 961
Pakaian, alas kaki, dan tutup kepala 9 618 14 896 33 595 13 271Clothing, footwear, and headgear
Barang yang tahan lama/Durable goods 10 946 22 645 160 198 42 161
Pajak pemakaian dan premi asuransi 6 347 12 077 44 176 13 812Taxes and insurances
Keperluan pesta dan upacara 3 014 7 952 61 060 15 664Parties and ceremonies
Jumlah Bukan Makanan/Total of Non-Food 259 425 406 911 1 215 053 431 426
Jumlah/Total 611 392 862 824 1 898 086 806 536
http
://www.b
ps.g
o.id

POPULATION EXPENDITURE AND FOOD AVAILABILITY AND CONSUMPTION
S t a t i s t i c a l Y e a r b o o k o f I n d o n e s i a 2 0 1 3 469
Pengeluaran Rata-Rata per Kapita Sebulan di Daerah Perdesaan Menurut Kelompok Barang dan Golongan Pengeluaran per Kapita Sebulan, 2012Monthly Average Expenditure per Capita in Rural Areas by Commodity Group and Monthly Expenditure per Capita Class, 2012
[Diolah dari Hasil Survei Sosial Ekonomi Nasional (Susenas) Triwulan I-2012, BPS/Based on National Socio Economic Survey Quarter I-2012, BPS-Statistics Indonesia]
Kelompok BarangCommodity Group
Golongan Pengeluaran per Kapita Sebulan (rupiah)Monthly Expenditure per Capita Class (rupiahs)
Kurang dari Less than 100 000
100 000–
149 999
150 000–
199 999
200 000–
299 999
300 000–
499 999(1) (2) (3) (4) (5) (6)
Makanan/FoodPadi-padian/Cereals 34 056 39 879 46 758 51 329 61 748Umbi-umbian/Tubers 3 002 5 020 2 705 2 890 3 183Ikan/Fish 2 023 7 608 8 982 13 926 22 247Daging/Meat 1 025 490 1 255 2 435 5 804Telur dan susu/Eggs and milk 1 448 1 199 3 416 6 008 11 063Sayur-sayuran/Vegetables 4 803 9 844 12 067 16 749 22 077Kacang-kacangan/Legumes 1 520 2 292 4 107 5 322 7 500Buah-buahan/Fruits 3 254 2 716 3 607 5 731 9 371Minyak dan lemak/Oil and fats 2 990 4 594 5 986 8 721 10 884Bahan minuman/Beverage stuffs 2 286 4 956 6 736 8 476 12 067Bumbu-bumbuan/Spices 1 475 2 172 2 877 4 350 5 932Konsumsi lainnya/Miscellaneous food items 654 1 226 2 461 3 617 5 650Makanan dan minuman jadi 3 234 6 519 12 704 23 577 42 829Prepared food and beverages
Tembakau dan sirih/Tobacco and betel 6 397 7 121 11 574 19 749 33 585
Jumlah Makanan/Total of Food 68 168 95 635 125 234 172 881 253 940
Bukan Makanan/Non-FoodPerumahan, bahan bakar, penerangan, air 9 891 21 886 28 609 38 879 63 781Housing and household facility
Aneka barang dan jasa/Goods and services 5 000 7 790 12 343 18 909 34 780Biaya pendidikan/Education cost 3 328 5 194 6 330 8 317 11 914Biaya kesehatan/Health cost 915 1 553 2 624 3 573 6 724Pakaian, alas kaki, dan tutup kepala 500 1 102 2 125 3 159 6 416Clothing, footwear, and headgear
Barang yang tahan lama/Durable goods 316 399 917 1 771 4 991
Pajak pemakaian dan premi asuransi 228 563 1 083 1 795 3 564Taxes and insurances
Keperluan pesta dan upacara 1 107 897 614 797 1 589Parties and ceremonies
Jumlah Bukan Makanan/Total of Non-Food 21 285 39 384 54 644 77 201 133 759
Jumlah/Total 89 453 135 020 179 878 250 082 387 699
Tabel ––––––
13.1.2Table
http
://www.b
ps.g
o.id

PENGELUARAN PENDUDUK SERTA KETERSEDIAAN DAN KONSUMSI MAKANAN
S t a t i s t i k I n d o n e s i a 2 0 1 3470
Lanjutan Tabel/Continued Table 13.1.2
Kelompok BarangCommodity Group
Golongan Pengeluaran per Kapita Sebulan (rupiah)
Monthly Expenditure per Capita Class (rupiahs) Rata-Rataper KapitaPer CapitaAverage
500 000–
749 999
750 000–
999 999
1 000 000dan lebihand over
(1) (7) (8) (9) (10)Makanan/Food
Padi-padian/Cereals 71 382 76 936 76 875 60 941Umbi-umbian/Tubers 4 189 5 968 6 339 3 625Ikan/Fish 34 997 48 092 56 208 24 511Daging/Meat 13 431 20 567 29 500 8 043Telur dan susu/Eggs and milk 19 267 27 631 40 905 13 088Sayur-sayuran/Vegetables 29 428 36 522 39 566 22 856Kacang-kacangan/Legumes 9 290 10 069 11 310 7 258Buah-buahan/Fruits 17 493 26 561 36 168 11 835Minyak dan lemak/Oil and fats 14 280 16 931 18 350 11 220Bahan minuman/Beverage stuffs 16 064 19 075 20 607 12 197Bumbu-bumbuan/Spices 7 938 9 748 10 839 6 078Konsumsi lainnya/Miscellaneous food items 8 039 10 027 11 875 5 828Makanan dan minuman jadi 69 420 98 102 148 958 48 749Prepared food and beverages
Tembakau dan sirih/Tobacco and betel 53 177 67 666 81 911 36 023
Jumlah Makanan/Total of Food 368 395 473 894 589 412 272 249
Bukan Makanan/Non-FoodPerumahan, bahan bakar, penerangan, air 104 250 153 657 240 577 76 193Housing and household facility
Aneka barang dan jasa/Goods and services 60 958 89 462 165 383 43 550Biaya pendidikan/Education cost 18 345 23 652 41 148 13 879Biaya kesehatan/Health cost 14 371 28 877 99 677 13 265Pakaian, alas kaki, dan tutup kepala 12 574 21 285 37 243 8 835Clothing, footwear, and headgear
Barang yang tahan lama/Durable goods 14 685 36 281 295 581 23 108Pajak pemakaian dan premi asuransi 6 815 11 672 22 067 4 945Taxes and insurances
Keperluan pesta dan upacara 4 376 11 753 55 329 5 332Parties and ceremonies
Jumlah Bukan Makanan/Total of Non-Food 236 374 376 638 957 004 189 107
Jumlah/Total 604 769 850 532 1 546 416 461 356
http
://www.b
ps.g
o.id

POPULATION EXPENDITURE AND FOOD AVAILABILITY AND CONSUMPTION
S t a t i s t i c a l Y e a r b o o k o f I n d o n e s i a 2 0 1 3 471
Pengeluaran Rata-Rata per Kapita Sebulan di Daerah Perkotaan dan Perdesaan Menurut Kelompok Barang dan Golongan Pengeluaran per Kapita Sebulan, 2012Monthly Average Expenditure per Capita in Urban and Rural Areas by Commodity Group and Monthly Expenditure per Capita Class, 2012
[Diolah dari Hasil Survei Sosial Ekonomi Nasional (Susenas) Triwulan I-2012, BPS/Based on National Socio Economic Survey Quarter I-2012, BPS-Statistics Indonesia]
Kelompok BarangCommodity Group
Golongan Pengeluaran per Kapita Sebulan (rupiah)Monthly Expenditure per Capita Class (rupiahs)
Kurang dari Less than 100 000
100 000–
149 999
150 000–
199 999
200 000–
299 999
300 000–
499 999(1) (2) (3) (4) (5) (6)
Makanan/FoodPadi-padian/Cereals 33 641 40 588 46 696 48 695 55 633Umbi-umbian/Tubers 2 844 4 214 2 222 2 271 2 398Ikan/Fish 2 621 7 076 8 539 12 841 20 954Daging/Meat 971 519 1 352 2 648 6 274Telur dan susu/Eggs and milk 1 498 1 562 3 701 6 362 11 662Sayur-sayuran/Vegetables 5 035 9 655 11 849 15 859 21 155Kacang-kacangan/Legumes 1 540 2 988 4 529 5 750 7 792Buah-buahan/Fruits 3 082 2 590 3 342 5 322 9 185Minyak dan lemak/Oil and fats 2 945 4 502 5 853 8 503 11 064Bahan minuman/Beverage stuffs 2 367 4 527 6 289 7 660 10 183Bumbu-bumbuan/Spices 1 480 2 195 2 864 4 185 5 732Konsumsi lainnya/Miscellaneous food items 770 1 543 2 670 3 771 5 798Makanan dan minuman jadi 3 441 8 396 14 081 25 922 49 197Prepared food and beverages
Tembakau dan sirih/Tobacco and betel 6 562 6 760 11 320 18 643 31 618
Jumlah Makanan/Total of Food 68 796 97 115 125 306 168 430 248 645
Bukan Makanan/Non-FoodPerumahan, bahan bakar, penerangan, air 9 416 21 059 28 674 42 914 70 449Housing and household facility
Aneka barang dan jasa/Goods and services 4 760 7 389 12 142 19 942 35 448Biaya pendidikan/Education cost 3 193 5 316 6 826 9 232 13 248Biaya kesehatan/Health cost 874 1 456 2 496 3 759 6 724Pakaian, alas kaki, dan tutup kepala 482 987 1 997 3 176 5 889Clothing, footwear, and headgear
Barang yang tahan lama/Durable goods 299 461 883 1 855 4 621Pajak pemakaian dan premi asuransi 216 526 1 003 1 815 3 412Taxes and insurances
Keperluan pesta dan upacara 1 048 727 508 730 1 514Parties and ceremonies
Jumlah Bukan Makanan/Total of Non-Food 20 287 37 922 54 530 83 423 141 305
Jumlah/Total 89 083 135 037 179 836 251 853 389 949
Tabel ––––––
13.1.3Table
http
://www.b
ps.g
o.id

PENGELUARAN PENDUDUK SERTA KETERSEDIAAN DAN KONSUMSI MAKANAN
S t a t i s t i k I n d o n e s i a 2 0 1 3472
Lanjutan Tabel/Continued Table 13.1.3
Kelompok BarangCommodity Group
Golongan Pengeluaran per Kapita Sebulan (rupiah)
Monthly Expenditure per Capita Class (rupiahs) Rata-Rataper KapitaPer CapitaAverage
500 000–
749 999
750 000–
999 999
1 000 000dan lebihand over
(1) (7) (8) (9) (10)Makanan/Food
Padi-padian/Cereals 63 660 66 592 67 913 57 908Umbi-umbian/Tubers 2 964 3 572 3 739 2 785Ikan/Fish 31 382 40 644 51 332 26 600Daging/Meat 14 619 22 233 40 617 13 075Telur dan susu/Eggs and milk 20 732 31 686 50 196 19 024Sayur-sayuran/Vegetables 27 429 32 244 37 072 23 949Kacang-kacangan/Legumes 9 821 10 570 12 297 8 443Buah-buahan/Fruits 16 441 24 513 42 296 15 443Minyak dan lemak/Oil and fats 13 948 16 030 19 053 12 344Bahan minuman/Beverage stuffs 12 958 13 910 14 721 10 934Bumbu-bumbuan/Spices 7 316 8 596 10 266 6 440Konsumsi lainnya/Miscellaneous food items 8 170 9 971 12 494 6 962Makanan dan minuman jadi 81 124 121 888 232 406 80 532Prepared food and beverages
Tembakau dan sirih/Tobacco and betel 48 843 59 822 70 286 39 038
Jumlah Makanan/Total of Food 359 406 462 269 664 689 323 478
Bukan Makanan/Non-Food
Perumahan, bahan bakar, penerangan, air 119 352 182 548 441 466 133 331Housing and household facility
Aneka barang dan jasa/Goods and services 61 381 92 270 235 229 68 713Biaya pendidikan/Education cost 20 857 30 204 82 858 24 679Biaya kesehatan/Health cost 13 610 25 339 84 119 19 588Pakaian, alas kaki, dan tutup kepala 10 957 17 154 34 310 11 044Clothing, footwear, and headgear
Barang yang tahan lama/Durable goods 12 640 27 465 186 726 32 597Pajak pemakaian dan premi asuransi 6 559 11 933 39 844 9 361Taxes and insurances
Keperluan pesta dan upacara 3 631 9 296 59 937 10 478Parties and ceremonies
Jumlah Bukan Makanan/Total of Non-Food 248 986 396 210 1 164 489 309 791
Jumlah/Total 608 393 858 479 1 829 177 633 269
http
://www.b
ps.g
o.id

POPULATION EXPENDITURE AND FOOD AVAILABILITY AND CONSUMPTION
S t a t i s t i c a l Y e a r b o o k o f I n d o n e s i a 2 0 1 3 473
Pengeluaran Rata-Rata per Kapita Sebulan Menurut Kelompok Barang (rupiah), 2011 dan 2012Monthly Average Expenditure per Capita by Commodity Group (rupiahs), 2011 and 2012
[Diolah dari Hasil Survei Sosial Ekonomi Nasional (Susenas) Triwulan I-2011 dan Triwulan I-2012, BPS/Based on National Socio Economic Survey Quarter I-2011 and Quarter I-2012, BPS-Statistics Indonesia]
Kelompok BarangCommodity Group
2011 2012Kota
Urban DesaRural
Kota+DesaUrban+Rural
KotaUrban
DesaRural
Kota+DesaUrban+Rural
(1) (2) (3) (4) (5) (6) (7)Makanan/Food
Padi-padian/Cereals 40 065 48 752 44 427 54 851 60 941 57 908Umbi-umbian/Tubers 2 240 3 770 3 008 1 939 3 625 2 785Ikan/Fish 26 003 24 740 25 369 28 706 24 511 26 600Daging/Meat 13 973 7 995 10 972 18 146 8 043 13 075Telur dan susu/Eggs and milk 22 855 11 405 17 106 25 007 13 088 19 024Sayur-sayuran/Vegetables 25 355 25 769 25 563 25 051 22 856 23 949Kacang-kacangan/Legumes 8 430 6 577 7 500 9 637 7 258 8 443Buah-buahan/Fruits 15 200 10 338 12 759 19 079 11 835 15 443Minyak dan lemak/Oil and fats 11 221 11 462 11 342 13 478 11 220 12 344Bahan minuman/Beverage stuffs 10 363 10 997 10 681 9 662 12 197 10 934Bumbu-bumbuan/Spices 6 386 6 150 6 268 6 805 6 078 6 440Konsumsi lainnyaMiscellaneous food items
7 160 5 608 6 381 8 105 5 828 6 962
Makanan dan minuman jadi 111 584 51 737 81 536 112 566 48 749 80 532Prepared food and beveragesTembakau dan sirih/Tobacco and betel 31 674 29 629 30 647 42 078 36 023 39 038
Jumlah Makanan/Total of Food 332 509 254 926 293 556 375 110 272 249 323 478
Bukan Makanan/Non-Food Perumahan, bahan bakar, penerangan, air Housing and household facility
166 487 70 348 118 218 190 919 76 193 133 331
Aneka barang dan jasa Goods and services
93 981 39 758 66 757 97 073 43 550 68 713
Biaya pendidikan/Education cost 32 033 11 214 21 580 35 565 13 879 24 679Biaya kesehatan/Health cost 23 950 12 249 18 075 25 961 13 265 19 588Pakaian, alas kaki, dan tutup kepala 14 638 9 358 11 987 13 271 8 835 11 044Clothing, footwear, and headgear
Barang yang tahan lama/Durable goods 58 638 30 792 44 657 42 161 23 108 32 597Pajak pemakaian dan premi asuransi 15 224 4 284 9 731 13 812 4 945 9 361Taxes and insurances
Keperluan pesta dan upacara 11 599 6 624 9 101 15 664 5 332 10 478Parties and ceremonies
Jumlah Bukan Makanan/Total of Non- Food
416 551 184 627 300 108 431 426 189 107 309 791
Jumlah/Total 749 060 439 552 593 664 806 536 461 356 633 269
Tabel ––––––
13.1.4Table
http
://www.b
ps.g
o.id

PENGELUARAN PENDUDUK SERTA KETERSEDIAAN DAN KONSUMSI MAKANAN
S t a t i s t i k I n d o n e s i a 2 0 1 3474
Persentase Pengeluaran Rata-Rata per Kapita Sebulan Menurut Kelompok Barang, 2011 dan 2012Percentage of Monthly Average Expenditure per Capita by Commodity Group, 2011 and 2012
[Diolah dari Hasil Survei Sosial Ekonomi Nasional (Susenas) Triwulan I-2011 dan Triwulan I-2012, BPS/Based on National Socio Economic Survey Quarter I-2011 and Quarter I-2012, BPS-Statistics Indonesia]
Kelompok BarangCommodity Group
2011 2012Kota
Urban DesaRural
Kota+DesaUrban+Rural
KotaUrban
DesaRural
Kota+DesaUrban+Rural
(1) (2) (3) (4) (5) (6) (7)Makanan/Food
Padi-padian/Cereals 5,35 11,09 7,48 6,80 13,21 9,14Umbi-umbian/Tubers 0,30 0,86 0,51 0,24 0,79 0,44Ikan/Fish 3,47 5,63 4,27 3,56 5,31 4,20Daging/Meat 1,87 1,82 1,85 2,25 1,74 2,06Telur dan susu/Eggs and milk 3,05 2,59 2,88 3,10 2,84 3,00Sayur-sayuran/Vegetables 3,38 5,86 4,31 3,11 4,95 3,78Kacang-kacangan/Legumes 1,13 1,50 1,26 1,19 1,50 1,33Buah-buahan/Fruits 2,03 2,35 2,15 2,37 2,57 2,44Minyak dan lemak/Oil and fats 1,50 2,61 1,91 1,67 2,43 1,95Bahan minuman/Beverage stuffs 1,38 2,50 1,80 1,20 2,64 1,73Bumbu-bumbuan/Spices 0,85 1,40 1,06 0,84 1,32 1,02Konsumsi lainnya/Miscellaneous food items 0,96 1,28 1,07 1,00 1,26 1,10Makanan dan minuman jadi 14,90 11,77 13,73 13,96 10,57 12,72Prepared food and beverages
Tembakau dan sirih/Tobacco and betel 4,23 6,74 5,16 5,22 7,81 6,16
Jumlah Makanan/Total of Food 44,39 58,00 49,45 46,51 59,01 51,08
Bukan Makanan/Non-FoodPerumahan, bahan bakar, penerangan, air 22,23 16,00 19,91 23,67 16,52 21,08Housing and household facility
Aneka barang dan jasa/Goods and services 12,55 9,05 11,24 11,66 9,34 10,85Biaya pendidikan/Education cost 4,28 2,55 3,64 4,41 3,01 3,09Biaya kesehatan/Health cost 3,20 2,79 3,04 3,22 2,88 3,90Pakaian, alas kaki, dan tutup kepala 1,95 2,13 2,02 1,65 1,92 1,74Clothing, footwear, and headgear
Barang yang tahan lama/Durable goods 7,83 7,01 7,52 5,23 5,01 5,15Pajak pemakaian dan premi asuransi 2,03 0,97 1,64 1,71 1,07 1,48Taxes and insurances
Keperluan pesta dan upacara 1,55 1,51 1,53 1,94 1,16 1,65Parties and ceremonies
Jumlah Bukan Makanan/Total of Non-Food 55,61 42,00 50,55 53,49 40,99 48,92
Jumlah/Total 100,00 100,00 100,00 100,00 100,00 100,00
Tabel ––––––
13.1.5Table
http
://www.b
ps.g
o.id

POPULATION EXPENDITURE AND FOOD AVAILABILITY AND CONSUMPTION
S t a t i s t i c a l Y e a r b o o k o f I n d o n e s i a 2 0 1 3 475
Pengeluaran Rata-Rata per Kapita Sebulan di Daerah Perkotaan Menurut Provinsi dan Kelompok Barang (rupiah), 2011 dan 2012Monthly Average Expenditure per Capita in Urban Areas by Province and Commodity Groups (rupiahs), 2011 and 2012
[Diolah dari Hasil Survei Sosial Ekonomi Nasional (Susenas) Triwulan I-2011 dan Triwulan I-2012, BPS/Based on National Socio Economic Survey Quarter I-2011 and Quarter I-2012, BPS-Statistics Indonesia]
ProvinsiProvince
Makanan/Food Nonmakanan/Non-Food Jumlah/Total
2011 2012 2011 2012 2011 2012
(1) (2) (3) (4) (5) (6) (7)
Aceh 383 579 432 567 373 271 385 949 756 850 818 516Sumatera Utara 324 392 349 032 312 932 316 579 637 325 665 611Sumatera Barat 409 639 423 032 384 824 416 834 794 462 839 867Riau 424 696 525 993 503 248 554 568 927 943 1 080 560Kepulauan Riau 437 751 481 921 514 845 572 809 952 596 1 054 730Jambi 351 105 376 633 354 921 401 337 706 026 777 970Sumatera Selatan 324 594 343 788 273 395 445 946 597 989 789 734Kepulauan Bangka Belitung 393 810 442 601 383 301 468 917 777 111 911 518Bengkulu 324 352 343 106 338 855 365 968 663 207 709 074Lampung 305 734 338 261 351 031 376 967 656 766 715 229
DKI Jakarta 457 669 519 028 898 019 884 071 1 355 688 1 403 098Jawa Barat 322 195 380 259 385 386 385 707 707 581 765 967Banten 361 735 409 639 460 828 427 501 822 563 837 140Jawa Tengah 249 353 306 284 297 683 308 859 547 036 615 142DI Yogyakarta 302 958 361 214 399 829 440 295 702 787 801 509Jawa Timur 287 360 291 115 329 431 336 670 616 790 627 784
Bali 358 825 354 780 579 469 692 752 938 294 1 047 532Nusa Tenggara Barat 271 368 341 243 243 507 234 901 514 875 576 144Nusa Tenggara Timur 311 872 322 582 344 530 368 842 656 402 691 424
Kalimantan Barat 379 884 438 635 431 312 436 037 811 196 874 671Kalimantan Tengah 408 361 428 808 377 446 453 917 785 806 882 724Kalimantan Selatan 411 930 431 623 456 277 532 456 868 206 964 079Kalimantan Timur 442 723 500 364 605 591 623 081 1 048 314 1 123 445
Sulawesi Utara 327 688 390 854 409 939 459 041 737 628 849 894Gorontalo 314 046 319 105 361 647 365 828 675 692 684 933Sulawesi Tengah 344 858 425 229 399 098 448 929 743 956 874 158Sulawesi Selatan 318 992 337 460 366 609 404 453 685 601 741 913Sulawesi Barat 271 260 279 027 231 118 282 739 502 377 561 766Sulawesi Tenggara 325 118 340 137 419 952 445 349 745 070 785 486
Maluku 333 695 403 908 406 185 406 085 739 880 809 993Maluku Utara 344 662 340 350 430 976 502 200 775 638 842 550Papua 448 305 514 838 499 060 525 317 947 365 1 040 154Papua Barat 477 629 511 296 605 640 601 530 1 083 269 1 112 825
Indonesia 332 509 375 110 416 551 431 426 749 060 806 536
Tabel ––––––
13.1.6Table
http
://www.b
ps.g
o.id
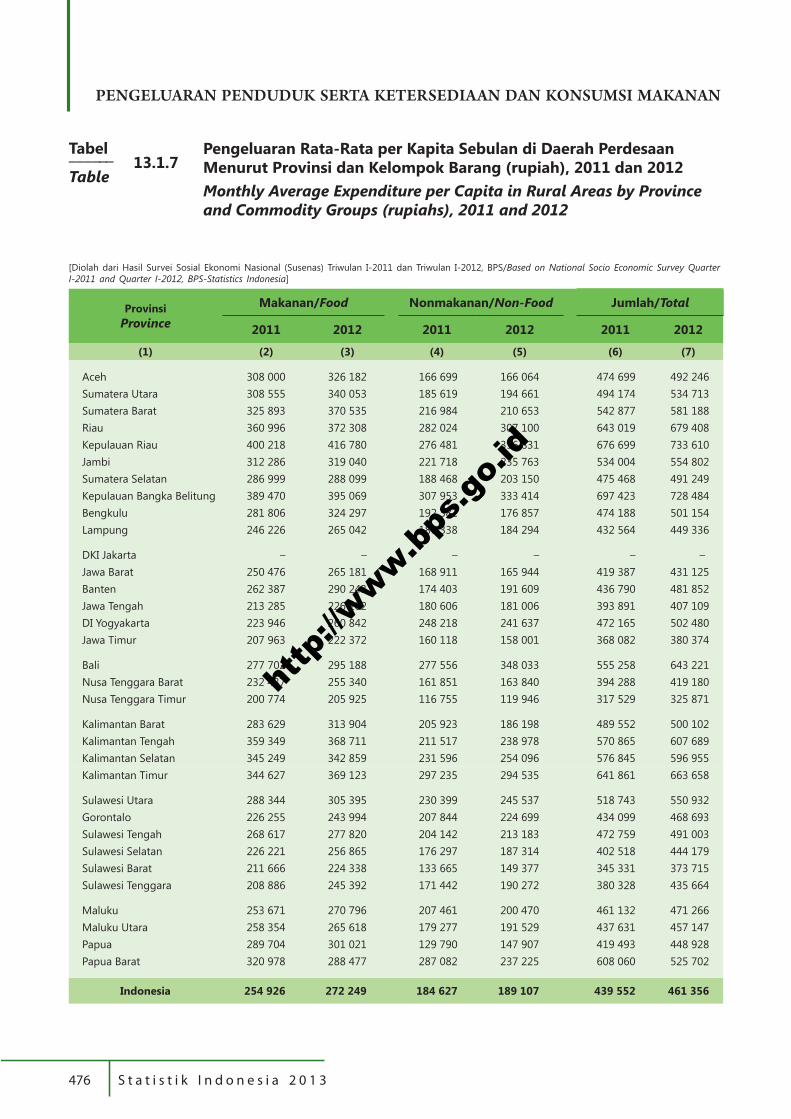
PENGELUARAN PENDUDUK SERTA KETERSEDIAAN DAN KONSUMSI MAKANAN
S t a t i s t i k I n d o n e s i a 2 0 1 3476
Pengeluaran Rata-Rata per Kapita Sebulan di Daerah Perdesaan Menurut Provinsi dan Kelompok Barang (rupiah), 2011 dan 2012Monthly Average Expenditure per Capita in Rural Areas by Province and Commodity Groups (rupiahs), 2011 and 2012
[Diolah dari Hasil Survei Sosial Ekonomi Nasional (Susenas) Triwulan I-2011 dan Triwulan I-2012, BPS/Based on National Socio Economic Survey Quarter I-2011 and Quarter I-2012, BPS-Statistics Indonesia]
ProvinsiProvince
Makanan/Food Nonmakanan/Non-Food Jumlah/Total
2011 2012 2011 2012 2011 2012
(1) (2) (3) (4) (5) (6) (7)
Aceh 308 000 326 182 166 699 166 064 474 699 492 246Sumatera Utara 308 555 340 053 185 619 194 661 494 174 534 713Sumatera Barat 325 893 370 535 216 984 210 653 542 877 581 188Riau 360 996 372 308 282 024 307 100 643 019 679 408Kepulauan Riau 400 218 416 780 276 481 316 831 676 699 733 610Jambi 312 286 319 040 221 718 235 763 534 004 554 802Sumatera Selatan 286 999 288 099 188 468 203 150 475 468 491 249Kepulauan Bangka Belitung 389 470 395 069 307 953 333 414 697 423 728 484Bengkulu 281 806 324 297 192 382 176 857 474 188 501 154Lampung 246 226 265 042 186 338 184 294 432 564 449 336
DKI Jakarta – – – – – –Jawa Barat 250 476 265 181 168 911 165 944 419 387 431 125Banten 262 387 290 243 174 403 191 609 436 790 481 852Jawa Tengah 213 285 226 102 180 606 181 006 393 891 407 109DI Yogyakarta 223 946 260 842 248 218 241 637 472 165 502 480Jawa Timur 207 963 222 372 160 118 158 001 368 082 380 374
Bali 277 702 295 188 277 556 348 033 555 258 643 221Nusa Tenggara Barat 232 437 255 340 161 851 163 840 394 288 419 180Nusa Tenggara Timur 200 774 205 925 116 755 119 946 317 529 325 871
Kalimantan Barat 283 629 313 904 205 923 186 198 489 552 500 102Kalimantan Tengah 359 349 368 711 211 517 238 978 570 865 607 689Kalimantan Selatan 345 249 342 859 231 596 254 096 576 845 596 955Kalimantan Timur 344 627 369 123 297 235 294 535 641 861 663 658
Sulawesi Utara 288 344 305 395 230 399 245 537 518 743 550 932Gorontalo 226 255 243 994 207 844 224 699 434 099 468 693Sulawesi Tengah 268 617 277 820 204 142 213 183 472 759 491 003Sulawesi Selatan 226 221 256 865 176 297 187 314 402 518 444 179Sulawesi Barat 211 666 224 338 133 665 149 377 345 331 373 715Sulawesi Tenggara 208 886 245 392 171 442 190 272 380 328 435 664
Maluku 253 671 270 796 207 461 200 470 461 132 471 266Maluku Utara 258 354 265 618 179 277 191 529 437 631 457 147Papua 289 704 301 021 129 790 147 907 419 493 448 928Papua Barat 320 978 288 477 287 082 237 225 608 060 525 702
Indonesia 254 926 272 249 184 627 189 107 439 552 461 356
Tabel ––––––
13.1.7Table
http
://www.b
ps.g
o.id

POPULATION EXPENDITURE AND FOOD AVAILABILITY AND CONSUMPTION
S t a t i s t i c a l Y e a r b o o k o f I n d o n e s i a 2 0 1 3 477
Pengeluaran Rata-Rata per Kapita Sebulan di Daerah Perkotaan dan Perdesaan Menurut Provinsi dan Kelompok Barang (rupiah), 2011 dan 2012Monthly Average Expenditure per Capita in Urban and Rural Areas by Province and Commodity Groups (rupiahs), 2011 and 2012
[Diolah dari Hasil Survei Sosial Ekonomi Nasional (Susenas) Triwulan I-2011 dan Triwulan I-2012, BPS/Based on National Socio Economic Survey Quarter I-2011 and Quarter I-2012, BPS-Statistics Indonesia]
ProvinsiProvince
Makanan/Food Nonmakanan/Non-Food Jumlah/Total
2011 2012 2011 2012 2011 2012
(1) (2) (3) (4) (5) (6) (7)
Aceh 329 257 356 132 224 798 227 968 554 055 584 100Sumatera Utara 316 343 344 467 248 222 254 593 564 565 599 060Sumatera Barat 358 338 390 870 282 009 290 521 640 348 681 391Riau 385 949 432 511 368 685 404 040 754 634 836 550Kepulauan Riau 431 248 470 371 473 543 527 422 904 790 997 793Jambi 324 197 336 737 262 589 286 641 586 786 623 378Sumatera Selatan 300 453 308 027 218 859 290 035 519 312 598 062Kepulauan Bangka Belitung 391 606 418 496 345 039 400 200 736 645 818 697Bengkulu 294 975 330 123 237 717 235 436 532 692 565 559Lampung 261 519 283 870 228 662 233 840 490 180 517 710
DKI Jakarta 457 669 519 028 898 019 884 071 1 355 688 1 403 098Jawa Barat 297 590 340 757 311 118 310 270 608 708 651 026Banten 328 623 370 088 365 364 349 359 693 987 719 447Jawa Tengah 229 775 262 761 234 132 239 459 463 907 502 220DI Yogyakarta 276 323 327 241 348 721 373 055 625 043 700 296Jawa Timur 245 743 255 081 240 683 243 014 486 426 498 094
Bali 326 490 330 963 459 132 554 979 785 622 885 942Nusa Tenggara Barat 248 690 291 176 195 940 234 901 444 630 484 661Nusa Tenggara Timur 222 575 228 660 161 451 168 451 384 025 397 111
Kalimantan Barat 312 711 351 590 274 022 261 683 586 732 613 273Kalimantan Tengah 375 767 388 822 267 100 310 905 642 867 699 727Kalimantan Selatan 373 301 380 306 326 116 371 527 699 417 751 833Kalimantan Timur 405 490 450 614 488 554 498 538 894 044 949 152
Sulawesi Utara 306 126 344 033 311 543 342 066 617 669 686 099Gorontalo 256 106 269 533 260 141 272 686 516 247 542 220Sulawesi Tengah 287 260 313 730 251 815 270 612 539 076 584 341Sulawesi Selatan 260 240 286 410 246 083 266 914 506 323 553 324Sulawesi Barat 225 501 236 901 156 289 180 012 381 790 416 912Sulawesi Tenggara 240 739 271 348 239 546 260 151 480 285 531 498
Maluku 283 407 320 271 281 304 276 893 564 711 597 163Maluku Utara 281 916 286 031 247 990 276 389 529 906 562 421Papua 330 865 356 651 225 626 246 100 556 491 602 751Papua Barat 367 893 354 867 382 488 345 772 750 381 700 639
Indonesia 293 556 323 478 300 108 309 791 593 664 633 269
Tabel ––––––
13.1.8Table
http
://www.b
ps.g
o.id

PENGELUARAN PENDUDUK SERTA KETERSEDIAAN DAN KONSUMSI MAKANAN
S t a t i s t i k I n d o n e s i a 2 0 1 3478
Persentase Pengeluaran Rata-Rata per Kapita Sebulan di Daerah Perkotaan Menurut Provinsi dan Kelompok Barang, 2011 dan 2012Percentage of Monthly Average Expenditure per Capita in Urban Areas by Province and Commodity Groups, 2011 and 2012
[Diolah dari Hasil Survei Sosial Ekonomi Nasional (Susenas) Triwulan I-2011 dan Triwulan I-2012, BPS/Based on National Socio Economic Survey Quarter I-2011 and Quarter I-2012, BPS-Statistics Indonesia]
ProvinsiProvince
Makanan/Food Nonmakanan/Non-Food
2011 2012 2011 2012
(1) (2) (3) (4) (5)
Aceh 50,68 52,85 49,32 47,15Sumatera Utara 50,90 52,44 49,10 47,56Sumatera Barat 51,56 50,37 48,44 49,63Riau 45,77 48,68 54,23 51,32Kepulauan Riau 45,95 45,69 54,05 54,31Jambi 49,73 48,41 50,27 51,59Sumatera Selatan 54,28 43,53 45,72 56,47Kepulauan Bangka Belitung 50,68 48,56 49,32 51,44Bengkulu 48,91 48,39 51,09 51,61Lampung 46,55 47,29 53,45 52,71
DKI Jakarta 33,76 36,99 66,24 63,01Jawa Barat 45,53 49,64 54,47 50,36Banten 43,98 48,93 56,02 51,07Jawa Tengah 45,58 49,79 54,42 50,21DI Yogyakarta 43,11 45,07 56,89 54,93Jawa Timur 46,59 46,37 53,41 53,63
Bali 38,24 33,87 61,76 66,13Nusa Tenggara Barat 52,71 59,23 47,29 40,77Nusa Tenggara Timur 47,51 46,65 52,49 53,35
Kalimantan Barat 46,83 50,15 53,17 49,85Kalimantan Tengah 51,97 48,58 48,03 51,42Kalimantan Selatan 47,45 44,77 52,55 55,23Kalimantan Timur 42,23 44,54 57,77 55,46
Sulawesi Utara 44,42 45,99 55,58 54,01Gorontalo 46,48 46,59 53,52 53,41Sulawesi Tengah 46,35 48,64 53,65 41,36Sulawesi Selatan 46,53 45,49 53,47 54,51Sulawesi Barat 54,00 49,67 46,00 50,33Sulawesi Tenggara 43,64 43,30 56,36 56,70
Maluku 45,10 49,87 54,90 50,13Maluku Utara 44,44 40,40 55,56 59,60Papua 47,32 49,50 52,68 50,50Papua Barat 44,09 45,95 55,91 54,05
Indonesia 44,39 46,51 55,61 53,49
Tabel ––––––
13.1.9Table
http
://www.b
ps.g
o.id

POPULATION EXPENDITURE AND FOOD AVAILABILITY AND CONSUMPTION
S t a t i s t i c a l Y e a r b o o k o f I n d o n e s i a 2 0 1 3 479
Persentase Pengeluaran Rata-Rata per Kapita Sebulan di Daerah Perdesaan Menurut Provinsi dan Kelompok Barang, 2011 dan 2012Percentage of Monthly Average Expenditure per Capita in Rural Areas by Province and Commodity Groups, 2011 and 2012
[Diolah dari Hasil Survei Sosial Ekonomi Nasional (Susenas) Triwulan I-2011 dan Triwulan I-2012, BPS/Based on National Socio Economic Survey Quarter I-2011 and Quarter I-2012, BPS-Statistics Indonesia]
ProvinsiProvince
Makanan/Food Nonmakanan/Non-Food
2011 2012 2011 2012
(1) (2) (3) (4) (5)
Aceh 64,88 66,26 35,12 33,74Sumatera Utara 62,44 63,60 37,56 36,40Sumatera Barat 60,03 63,75 39,97 36,25Riau 56,14 54,80 43,86 45,20Kepulauan Riau 59,14 56,81 40,86 43,19Jambi 58,48 57,51 41,52 42,49Sumatera Selatan 60,36 58,65 39,64 41,35Kepulauan Bangka Belitung 55,84 54,23 44,16 45,77Bengkulu 59,43 64,71 40,57 35,29Lampung 56,92 58,99 43,08 41,01
DKI Jakarta – – – –Jawa Barat 59,72 61,51 40,28 38,49Banten 60,07 60,23 39,93 39,77Jawa Tengah 54,15 55,54 45,85 44,46DI Yogyakarta 47,43 51,91 52,57 48,09Jawa Timur 56,50 58,46 43,50 41,54
Bali 50,01 45,89 49,99 54,11Nusa Tenggara Barat 58,95 60,91 41,05 39,09Nusa Tenggara Timur 63,23 63,19 36,77 36,81
Kalimantan Barat 57,94 62,77 42,06 37,23Kalimantan Tengah 62,95 60,67 37,05 39,33Kalimantan Selatan 59,85 57,43 40,15 42,57Kalimantan Timur 53,69 55,62 46,31 44,38
Sulawesi Utara 55,59 55,43 44,41 44,57Gorontalo 52,12 52,06 47,88 47,94Sulawesi Tengah 56,82 56,58 43,18 43,42Sulawesi Selatan 56,20 57,83 43,80 42,17Sulawesi Barat 61,29 60,03 38,71 39,97Sulawesi Tenggara 54,92 56,33 45,08 43,67
Maluku 55,01 57,46 44,99 42,54Maluku Utara 59,03 58,10 40,97 41,90Papua 69,06 67,05 30,94 32,95Papua Barat 52,79 54,87 47,21 45,13
Indonesia 58,00 59,01 42,00 40,99
Tabel ––––––
13.1.10Table
http
://www.b
ps.g
o.id
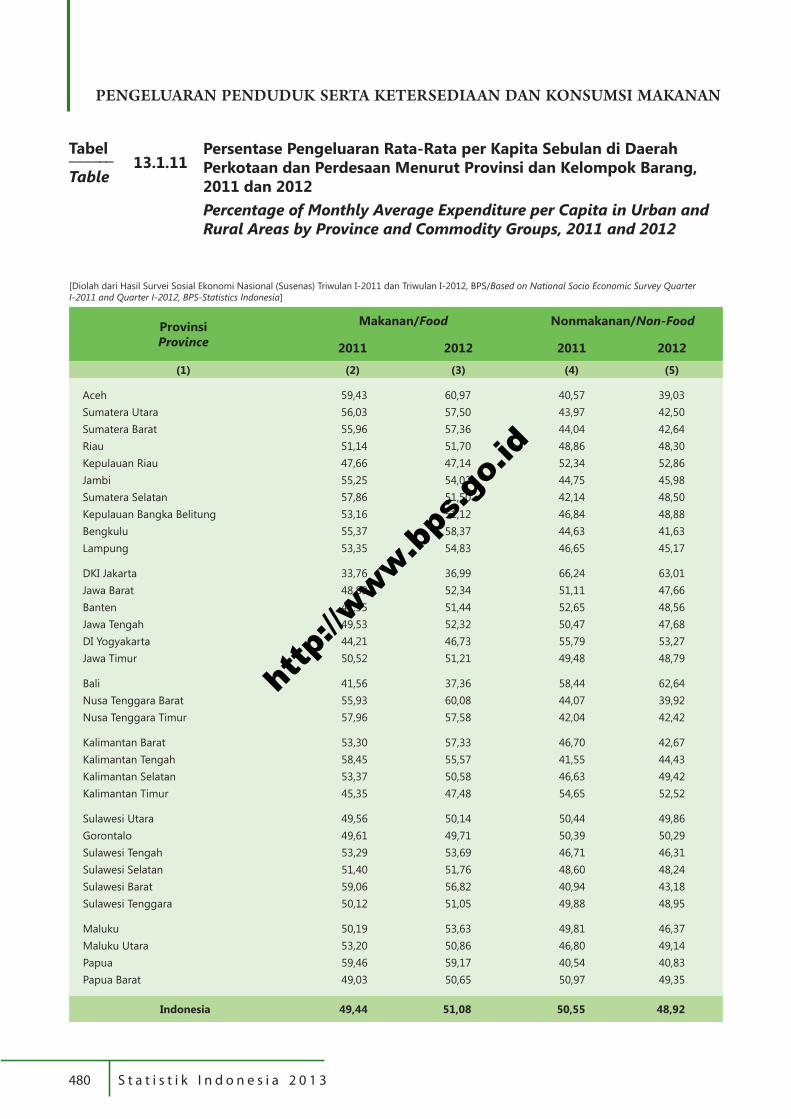
PENGELUARAN PENDUDUK SERTA KETERSEDIAAN DAN KONSUMSI MAKANAN
S t a t i s t i k I n d o n e s i a 2 0 1 3480
Persentase Pengeluaran Rata-Rata per Kapita Sebulan di Daerah Perkotaan dan Perdesaan Menurut Provinsi dan Kelompok Barang, 2011 dan 2012Percentage of Monthly Average Expenditure per Capita in Urban and Rural Areas by Province and Commodity Groups, 2011 and 2012
[Diolah dari Hasil Survei Sosial Ekonomi Nasional (Susenas) Triwulan I-2011 dan Triwulan I-2012, BPS/Based on National Socio Economic Survey Quarter I-2011 and Quarter I-2012, BPS-Statistics Indonesia]
ProvinsiProvince
Makanan/Food Nonmakanan/Non-Food
2011 2012 2011 2012
(1) (2) (3) (4) (5)
Aceh 59,43 60,97 40,57 39,03Sumatera Utara 56,03 57,50 43,97 42,50Sumatera Barat 55,96 57,36 44,04 42,64Riau 51,14 51,70 48,86 48,30Kepulauan Riau 47,66 47,14 52,34 52,86Jambi 55,25 54,02 44,75 45,98Sumatera Selatan 57,86 51,50 42,14 48,50Kepulauan Bangka Belitung 53,16 51,12 46,84 48,88Bengkulu 55,37 58,37 44,63 41,63Lampung 53,35 54,83 46,65 45,17
DKI Jakarta 33,76 36,99 66,24 63,01Jawa Barat 48,89 52,34 51,11 47,66Banten 47,35 51,44 52,65 48,56Jawa Tengah 49,53 52,32 50,47 47,68DI Yogyakarta 44,21 46,73 55,79 53,27Jawa Timur 50,52 51,21 49,48 48,79
Bali 41,56 37,36 58,44 62,64Nusa Tenggara Barat 55,93 60,08 44,07 39,92Nusa Tenggara Timur 57,96 57,58 42,04 42,42
Kalimantan Barat 53,30 57,33 46,70 42,67Kalimantan Tengah 58,45 55,57 41,55 44,43Kalimantan Selatan 53,37 50,58 46,63 49,42Kalimantan Timur 45,35 47,48 54,65 52,52
Sulawesi Utara 49,56 50,14 50,44 49,86Gorontalo 49,61 49,71 50,39 50,29Sulawesi Tengah 53,29 53,69 46,71 46,31Sulawesi Selatan 51,40 51,76 48,60 48,24Sulawesi Barat 59,06 56,82 40,94 43,18Sulawesi Tenggara 50,12 51,05 49,88 48,95
Maluku 50,19 53,63 49,81 46,37Maluku Utara 53,20 50,86 46,80 49,14Papua 59,46 59,17 40,54 40,83Papua Barat 49,03 50,65 50,97 49,35
Indonesia 49,44 51,08 50,55 48,92
Tabel ––––––
13.1.11Table
http
://www.b
ps.g
o.id
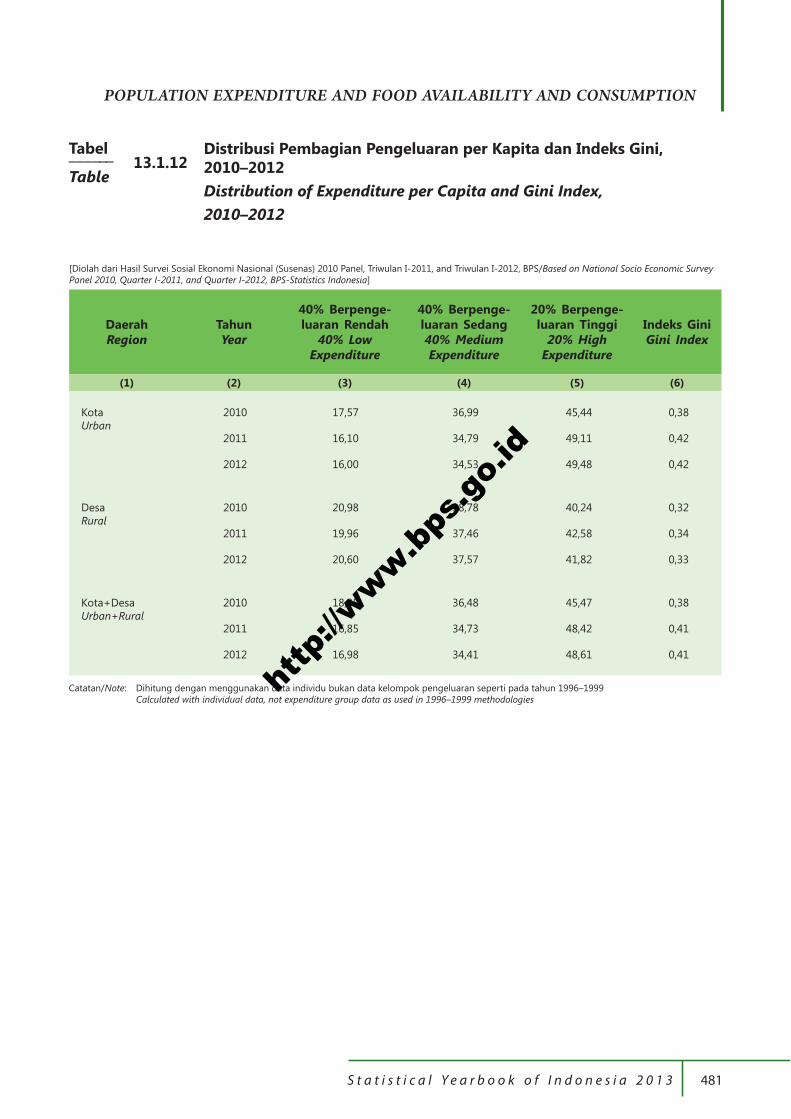
POPULATION EXPENDITURE AND FOOD AVAILABILITY AND CONSUMPTION
S t a t i s t i c a l Y e a r b o o k o f I n d o n e s i a 2 0 1 3 481
Distribusi Pembagian Pengeluaran per Kapita dan Indeks Gini,2010–2012Distribution of Expenditure per Capita and Gini Index,2010–2012
[Diolah dari Hasil Survei Sosial Ekonomi Nasional (Susenas) 2010 Panel, Triwulan I-2011, and Triwulan I-2012, BPS/Based on National Socio Economic Survey Panel 2010, Quarter I-2011, and Quarter I-2012, BPS-Statistics Indonesia]
DaerahRegion
TahunYear
40% Berpenge-luaran Rendah
40% LowExpenditure
40% Berpenge-luaran Sedang40% MediumExpenditure
20% Berpenge-luaran Tinggi
20% HighExpenditure
Indeks GiniGini Index
(1) (2) (3) (4) (5) (6)
KotaUrban
2010 17,57 36,99 45,44 0,38
2011 16,10 34,79 49,11 0,42
2012 16,00 34,53 49,48 0,42
DesaRural
2010 20,98 38,78 40,24 0,32
2011 19,96 37,46 42,58 0,34
2012 20,60 37,57 41,82 0,33
Kota+DesaUrban+Rural
2010 18,05 36,48 45,47 0,38
2011 16,85 34,73 48,42 0,41
2012 16,98 34,41 48,61 0,41
Catatan/Note: Dihitung dengan menggunakan data individu bukan data kelompok pengeluaran seperti pada tahun 1996–1999 Calculated with individual data, not expenditure group data as used in 1996–1999 methodologies
Tabel ––––––
13.1.12Table
http
://www.b
ps.g
o.id
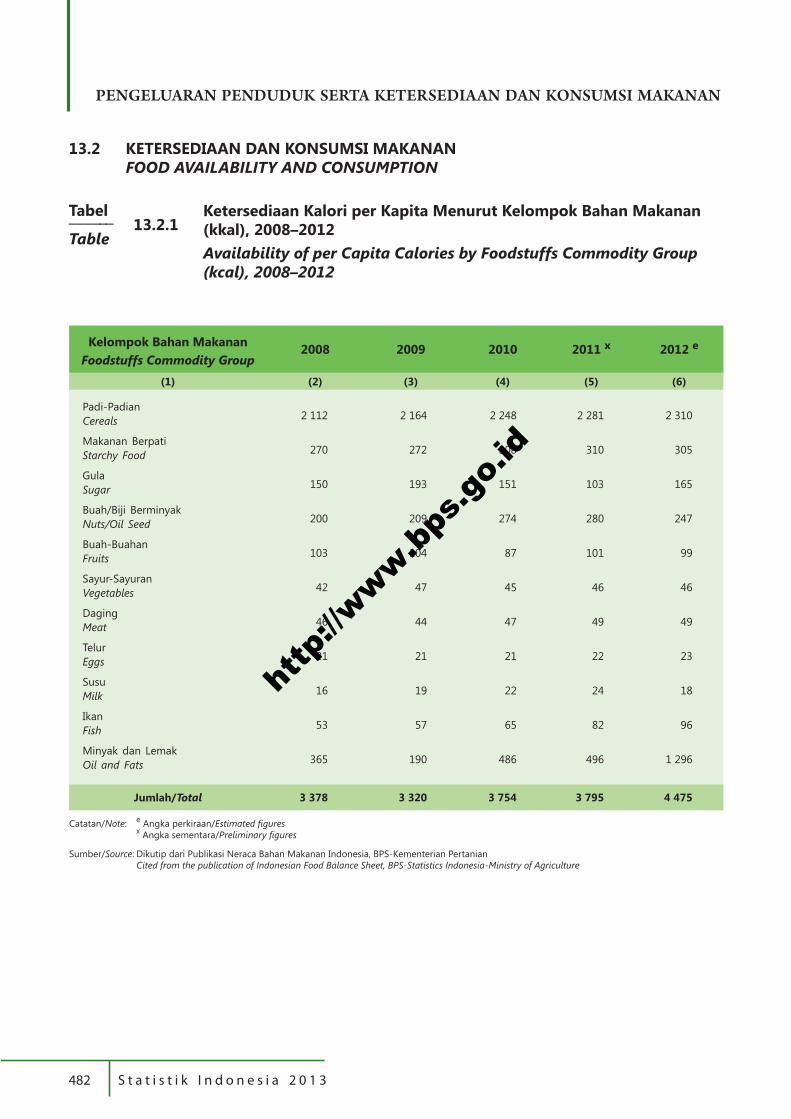
PENGELUARAN PENDUDUK SERTA KETERSEDIAAN DAN KONSUMSI MAKANAN
S t a t i s t i k I n d o n e s i a 2 0 1 3482
Ketersediaan Kalori per Kapita Menurut Kelompok Bahan Makanan (kkal), 2008–2012Availability of per Capita Calories by Foodstuffs Commodity Group (kcal), 2008–2012
Kelompok Bahan MakananFoodstuffs Commodity Group
2008 2009 2010 2011 x 2012 e
(1) (2) (3) (4) (5) (6)
Padi-PadianCereals 2 112 2 164 2 248 2 281 2 310
Makanan BerpatiStarchy Food 270 272 308 310 305
GulaSugar 150 193 151 103 165
Buah/Biji BerminyakNuts/Oil Seed 200 209 274 280 247
Buah-BuahanFruits 103 104 87 101 99
Sayur-SayuranVegetables 42 47 45 46 46
DagingMeat 46 44 47 49 49
TelurEggs 21 21 21 22 23
SusuMilk 16 19 22 24 18
IkanFish 53 57 65 82 96
Minyak dan LemakOil and Fats 365 190 486 496 1 296
Jumlah/Total 3 378 3 320 3 754 3 795 4 475
Catatan/Note: e Angka perkiraan/Estimated figures x Angka sementara/Preliminary figures
Sumber/Source: Dikutip dari Publikasi Neraca Bahan Makanan Indonesia, BPS-Kementerian Pertanian Cited from the publication of Indonesian Food Balance Sheet, BPS-Statistics Indonesia-Ministry of Agriculture
13.2 KETERSEDIAAN DAN KONSUMSI MAKANAN FOOD AVAILABILITY AND CONSUMPTION
Tabel ––––––
13.2.1Table
http
://www.b
ps.g
o.id
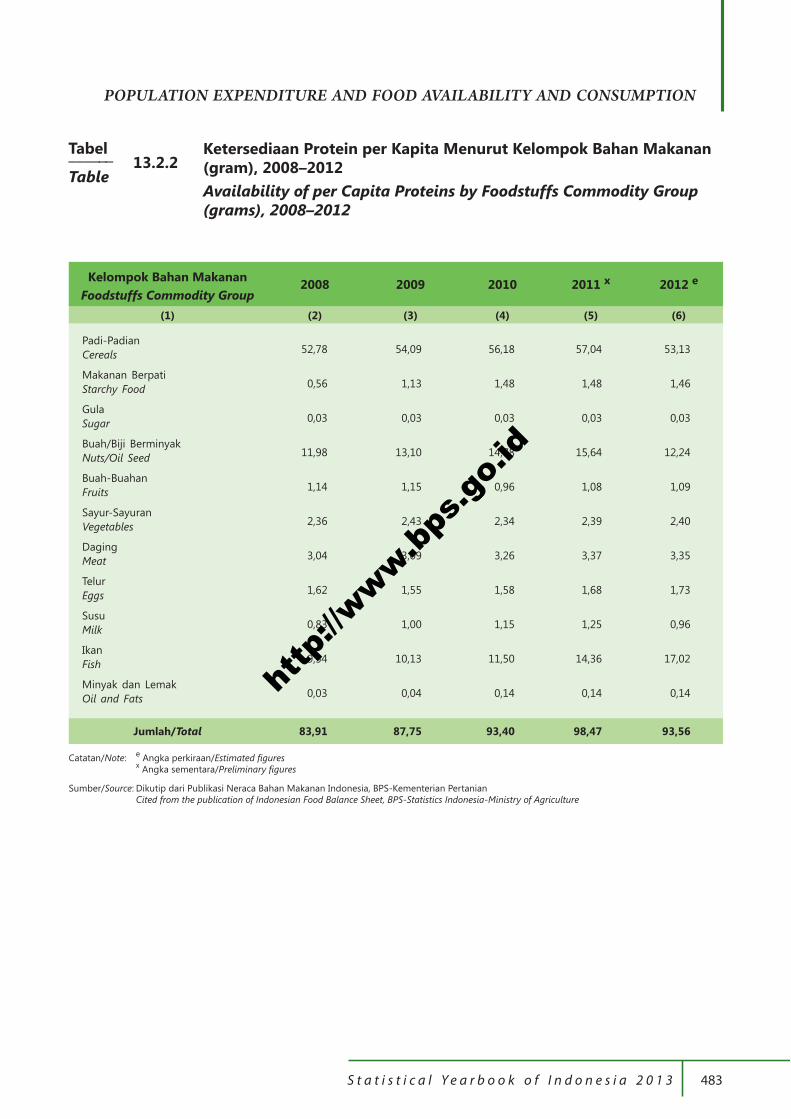
POPULATION EXPENDITURE AND FOOD AVAILABILITY AND CONSUMPTION
S t a t i s t i c a l Y e a r b o o k o f I n d o n e s i a 2 0 1 3 483
Ketersediaan Protein per Kapita Menurut Kelompok Bahan Makanan (gram), 2008–2012Availability of per Capita Proteins by Foodstuffs Commodity Group (grams), 2008–2012
Catatan/Note: e Angka perkiraan/Estimated figures x Angka sementara/Preliminary figures
Sumber/Source: Dikutip dari Publikasi Neraca Bahan Makanan Indonesia, BPS-Kementerian Pertanian Cited from the publication of Indonesian Food Balance Sheet, BPS-Statistics Indonesia-Ministry of Agriculture
Tabel ––––––
13.2.2Table
Kelompok Bahan MakananFoodstuffs Commodity Group
2008 2009 2010 2011 x 2012 e
(1) (2) (3) (4) (5) (6)
Padi-PadianCereals 52,78 54,09 56,18 57,04 53,13
Makanan BerpatiStarchy Food 0,56 1,13 1,48 1,48 1,46
GulaSugar 0,03 0,03 0,03 0,03 0,03
Buah/Biji BerminyakNuts/Oil Seed 11,98 13,10 14,78 15,64 12,24
Buah-BuahanFruits 1,14 1,15 0,96 1,08 1,09
Sayur-SayuranVegetables 2,36 2,43 2,34 2,39 2,40
DagingMeat 3,04 3,09 3,26 3,37 3,35
TelurEggs 1,62 1,55 1,58 1,68 1,73
SusuMilk 0,83 1,00 1,15 1,25 0,96
IkanFish 9,54 10,13 11,50 14,36 17,02
Minyak dan LemakOil and Fats 0,03 0,04 0,14 0,14 0,14
Jumlah/Total 83,91 87,75 93,40 98,47 93,56
http
://www.b
ps.g
o.id

PENGELUARAN PENDUDUK SERTA KETERSEDIAAN DAN KONSUMSI MAKANAN
S t a t i s t i k I n d o n e s i a 2 0 1 3484
Ketersediaan Lemak per Kapita Menurut Kelompok Bahan Makanan (gram), 2008-2012Availability of per Capita Fats by Foodstuffs Commodity Group (grams), 2008-2012
Tabel –––––– 13.2.3Table
Kelompok Bahan MakananFoodstuffs Commodity Group
2008 2009 2010 2011 x 2012 e
(1) (2) (3) (4) (5) (6)
Padi-PadianCereals 11,15 11,55 11,99 12,11 11,32
Makanan BerpatiStarchy Food 0,39 0,41 0,50 0,50 0,50
GulaSugar 0,10 0,08 0,09 0,10 0,10
Buah/Biji BerminyakNuts/Oil Seed 14,08 14,38 20,14 20,07 18,66
Buah-BuahanFruits 0,54 0,57 0,48 0,56 0,55
Sayur-SayuranVegetables 0,62 0,67 0,65 0,69 0,67
DagingMeat 3,45 3,46 3,64 3,81 3,87
TelurEggs 1,56 1,51 1,54 1,62 1,68
SusuMilk 0,91 1,10 1,26 1,37 1,06
IkanFish 1,20 1,30 1,52 1,94 2,25
Minyak dan LemakOil and Fats 40,53 21,13 54,10 55,29 143,95
Jumlah/Total 74,53 56,15 95,91 98,07 184,60
Catatan/Note: e Angka perkiraan/Estimated figures x Angka sementara/Preliminary figures
Sumber/Source: Dikutip dari Publikasi Neraca Bahan Makanan Indonesia, BPS-Kementerian Pertanian Cited from the publication of Indonesian Food Balance Sheet, BPS-Statistics Indonesia-Ministry of Agriculture
http
://www.b
ps.g
o.id

POPULATION EXPENDITURE AND FOOD AVAILABILITY AND CONSUMPTION
S t a t i s t i c a l Y e a r b o o k o f I n d o n e s i a 2 0 1 3 485
[Diolah dari Hasil Survei Sosial Ekonomi Nasional (Susenas) Triwulan I-2011 dan Triwulan I-2012, BPS/Based on National Socio Economic Survey Quarter I-2011 and Quarter I-2012, BPS-Statistics Indonesia]
Jenis Bahan MakananFood Items
SatuanUnit of Quantity 2011 2012
(1) (2) (3) (4)
1. Beras lokal/ketan/Local rice/Glutinous rice kg 1,721 1,675
2. Jagung basah dengan kulit/Fresh corn with husk kg 0,012 0,011
3. Jagung pocelan/pipilan/Dry shelled corn kg 0,023 0,029
4. Ketela pohon/Cassava kg 0,111 0,069
5. Ketela rambat/Sweet potatoes kg 0,055 0,0456. Gaplek/Dried cassava kg 0,002 0,0027. Ikan dan udang segar 1/Fresh fish and shrimp 1 kg 0,282 0,2598. Ikan dan udang diawetkan/Canned fish and shrimp ons/ounce 0,486 0,4719. Daging sapi/kerbau/Cow/buffalo meat kg 0,009 0,007
10. Daging ayam ras/kampung/Broiler/local chicken meat kg 0,083 0,076
11. Telur ayam ras/kampung 2/Chicken egg 2 kg 0,199 0,17812. Telur itik/manila/asin/Duck/salted egg butir/unit 0,080 0,06813. Susu kental manis/Canned liquid milk (397 gr) 0,063 0,05214. Susu bubuk kaleng manis/Canned/baby powder milk kg 0,040 0,01815. Bawang merah/Onion ons/ounce 0,453 0,530
16. Bawang putih/Garlic ons/ounce 0,259 0,30717. Cabe merah/Chillies ons/ounce 0,287 0,31718. Cabe rawit/Cayenne pepper ons/ounce 0,232 0,26919. Kacang kedelai/Soybean kg 0,001 0,00120. Tahu/Soybean curd kg 0,142 0,13421. Tempe/Fermented soybean curd kg 0,140 0,13622. Minyak kelapa/jagung/goreng lainnya liter/litre 0,195 0,205 Coconut/maize/other frying oil
23. Kelapa/Coconut butir/unit 0,143 0,13324. Gula pasir/Sugar ons/ounce 1,416 1,24225. Gula merah/Brown sugar ons/ounce 0,139 0,102
Konsumsi Rata-Rata per Kapita Seminggu Beberapa Macam Bahan Makanan Penting, 2011 dan 2012Per Capita Weekly Average Consumption of Several Food Items 2011 and 2012
Catatan/Note: 1 Ikan segar meliputi ikan darat, laut, dan udang/Fresh fish includes freshwater fish, sea fish, and shrimp 2 Satu butir telur ayam kampung diperkirakan beratnya sebesar 0,05 kg/The weight of one local chicken egg is approximately to 0.05 kg
Tabel ––––––
13.2.4Table
http
://www.b
ps.g
o.id
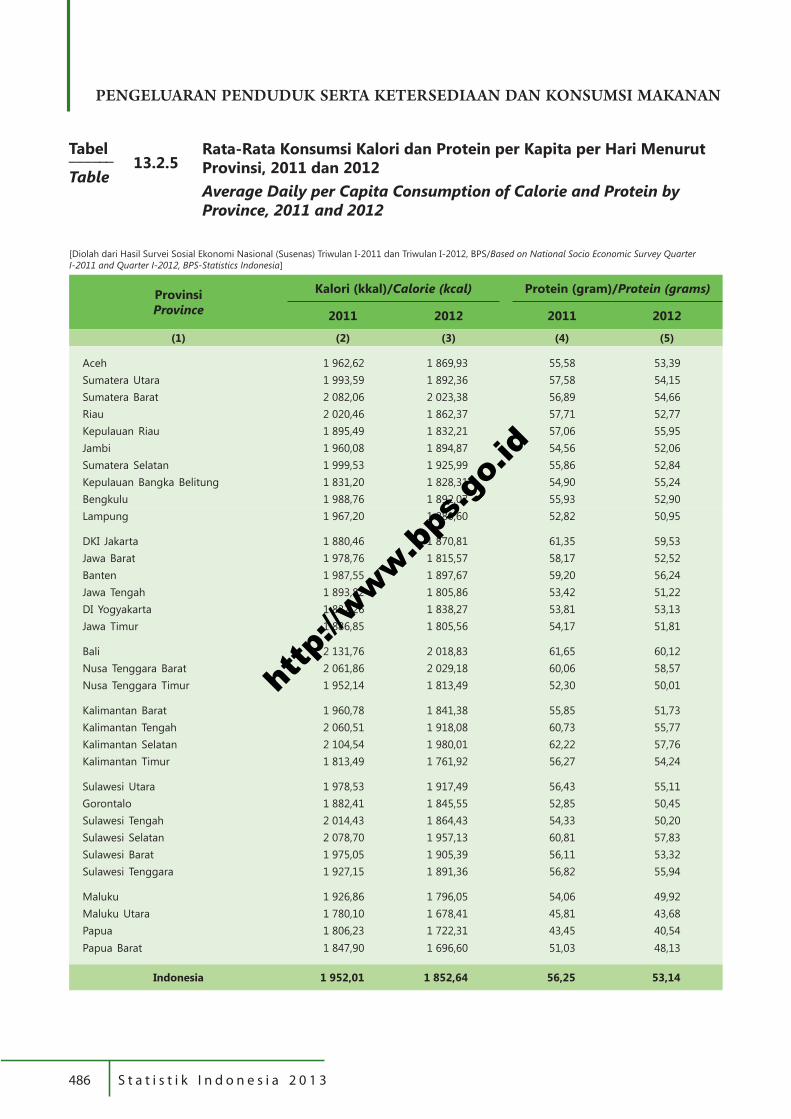
PENGELUARAN PENDUDUK SERTA KETERSEDIAAN DAN KONSUMSI MAKANAN
S t a t i s t i k I n d o n e s i a 2 0 1 3486
Rata-Rata Konsumsi Kalori dan Protein per Kapita per Hari Menurut Provinsi, 2011 dan 2012Average Daily per Capita Consumption of Calorie and Protein by Province, 2011 and 2012
[Diolah dari Hasil Survei Sosial Ekonomi Nasional (Susenas) Triwulan I-2011 dan Triwulan I-2012, BPS/Based on National Socio Economic Survey Quarter I-2011 and Quarter I-2012, BPS-Statistics Indonesia]
ProvinsiProvince
Kalori (kkal)/Calorie (kcal) Protein (gram)/Protein (grams)
2011 2012 2011 2012
(1) (2) (3) (4) (5)
Aceh 1 962,62 1 869,93 55,58 53,39Sumatera Utara 1 993,59 1 892,36 57,58 54,15Sumatera Barat 2 082,06 2 023,38 56,89 54,66Riau 2 020,46 1 862,37 57,71 52,77Kepulauan Riau 1 895,49 1 832,21 57,06 55,95Jambi 1 960,08 1 894,87 54,56 52,06Sumatera Selatan 1 999,53 1 925,99 55,86 52,84Kepulauan Bangka Belitung 1 831,20 1 828,31 54,90 55,24Bengkulu 1 988,76 1 892,07 55,93 52,90Lampung 1 967,20 1 880,60 52,82 50,95
DKI Jakarta 1 880,46 1 870,81 61,35 59,53Jawa Barat 1 978,76 1 815,57 58,17 52,52Banten 1 987,55 1 897,67 59,20 56,24Jawa Tengah 1 893,82 1 805,86 53,42 51,22DI Yogyakarta 1 832,26 1 838,27 53,81 53,13Jawa Timur 1 886,85 1 805,56 54,17 51,81
Bali 2 131,76 2 018,83 61,65 60,12Nusa Tenggara Barat 2 061,86 2 029,18 60,06 58,57Nusa Tenggara Timur 1 952,14 1 813,49 52,30 50,01
Kalimantan Barat 1 960,78 1 841,38 55,85 51,73Kalimantan Tengah 2 060,51 1 918,08 60,73 55,77Kalimantan Selatan 2 104,54 1 980,01 62,22 57,76Kalimantan Timur 1 813,49 1 761,92 56,27 54,24
Sulawesi Utara 1 978,53 1 917,49 56,43 55,11Gorontalo 1 882,41 1 845,55 52,85 50,45Sulawesi Tengah 2 014,43 1 864,43 54,33 50,20Sulawesi Selatan 2 078,70 1 957,13 60,81 57,83Sulawesi Barat 1 975,05 1 905,39 56,11 53,32Sulawesi Tenggara 1 927,15 1 891,36 56,82 55,94
Maluku 1 926,86 1 796,05 54,06 49,92Maluku Utara 1 780,10 1 678,41 45,81 43,68Papua 1 806,23 1 722,31 43,45 40,54Papua Barat 1 847,90 1 696,60 51,03 48,13
Indonesia 1 952,01 1 852,64 56,25 53,14
Tabel ––––––
13.2.5Table
http
://www.b
ps.g
o.id
PERDAGANGAN LUAR NEGERIForeign Trade 14ht
tp://w
ww.bps
.go.
id

http
://www.b
ps.g
o.id

FOREIGN TRADE
S t a t i s t i c a l Y e a r b o o k o f I n d o n e s i a 2 0 1 3 489
PENJELASAN TEKNIS
1. Sistem pencatatan Statistik Ekspor dan Impor adalah “General Trade” dengan wilayah pencatatan meliputi seluruh wilayah kepabeanan Indonesia. Sebelum tahun 2008, sistem pencatatan Statistik Impor adalah “Special Trade” dengan wilayah pencatatan meliputi seluruh wilayah kepabeanan Indonesia kecuali Kawasan Berikat yang dianggap/diperlakukan sebagai luar negeri.
2. Pengesahan dokumen kepabeanan ekspor dan impor dilakukan oleh Bea dan Cukai berdasarkan Persetujuan Muat/Bongkar Barang.
3. Data ekspor berasal dari dokumen kepabeanan BC 3.0 atau yang disebut dokumen Pemberitahuan Ekspor Barang (PEB) yang diisi oleh eksportir.
4. Data impor berasal dari dokumen kepabeanan BC 2.0 atau yang disebut dokumen Pemberitahuan Impor Barang (PIB) dan dokumen kepabeanan BC 2.3 yang mencatat impor barang dari Luar Negeri ke Kawasan Berikat.
5. Barang-barang yang dikirim ke luar negeri untuk diolah dicatat sebagai ekspor, sedangkan hasil olahan yang dikembalikan ke Indonesia dicatat sebagai impor.
6. Barang-barang luar negeri yang diolah di dalam negeri dicatat sebagai barang impor meskipun barang olahan tersebut akan kembali ke luar negeri.
7. Barang-barang yang tidak dicakup dalam pencatatan:a. Pakaian dan barang-barang perhiasan penumpangb. Barang-barang bawaan penumpang dari/ke luar
negeri untuk dipakai sendiri, kecuali lemari es, pesawat televisi dan sebagainya
c. Barang-barang untuk keperluan perwakilan kedutaan suatu negara
d. Barang-barang ekspedisi dan ekshibisi atau pameran
e. Barang-barang untuk militer, yang diimpor langsung oleh angkatan bersenjata
f. Pembungkus/peti kemas untuk diisi kembalig. Uang dan surat-surat berhargah. Barang-barang contoh.
TECHNICAL NOTES
1. The recording of export and import statistics is based on General Trade System covering all Indonesian customs areas. Before 2008, the recording of import statistics is based on Special Trade System, which covers all Indonesian customs areas except bounded zone, which are regarded as “abroad”.
2. The legalization of customs export and import documents is conducted by the Customs and Excise Office.
3. The export data are compiled based on customs export documents BC 3.0 or known as Export Declarations (PEB), filled by exporters.
4. The import data are compiled based on customs import documents BC 2.0 or known as Import Declarations Form (PIB), customs import documents BC 2.3 which records import goods from foreign country to Bounded Zones Area.
5. Goods send abroad for processing purposes are recorded as export while its product sent to Indonesia are recorded as import.
6. Foreign goods processed in Indonesia are still recorded as imports although the products will be sent to abroad.
7. The following goods are not included in the statistics:a. Clothings and passengers’ jewelryb. Luggage of passengers for own use, except refrigerators,
television sets, etcc. Goods imported/exported for the use of foreign
representive countries/embassiesd. Goods for expeditions, and shows or exhibitionse. Military goods directly imported by the Armed
Forcesf. Packings/containers to be refilledg. Bank notes and securitiesh. Sample goods.
http
://www.b
ps.g
o.id
PERDAGANGAN LUAR NEGERI
S t a t i s t i k I n d o n e s i a 2 0 1 3490
8. Sistem pengolahan dokumen impor/ekspor Indonesia adalah sistem “Carry Over” yaitu dokumen ditunggu selama satu bulan, setelah bulan berjalan, sedangkan dokumen-dokumen yang terlambat akan diolah pada bulan berikutnya. Dengan demikian dokumen bulan-bulan sebelumnya yang terlambat diterima dan masuk pada bulan berjalan, diperlakukan sebagai dokumen bulan pengolahan.
9. Negara utama adalah negara yang mempunyai nilai ekspor/impor terbesar.
10. Pelabuhan utama adalah pelabuhan yang mempunyai nilai ekspor/impor terbesar.
8. The carry-over system is used in processing Indonesian export and import documents. Documents are processed one month after the current month, while those received later will be processed for the succeeding month. This means previous documents received in the current month will be treated as processed documents.
9. Major country is country which recorded the biggest of export or import value.
10. Major port is port which recorded the biggest of export or import value.
http
://www.b
ps.g
o.id

FOREIGN TRADE
S t a t i s t i c a l Y e a r b o o k o f I n d o n e s i a 2 0 1 3 491
Nilai Ekspor 1 dan Impor 2 (juta US$), 1984-2012 Value of Exports 1 and Imports 2 (million US$), 1984-2012
14.1 PERKEMBANGAN EKSPOR IMPOR GROWTH OF EXPORT AND IMPORT
[Diolah dari dokumen kepabeanan Ditjen Bea dan Cukai (PEB dan PIB)/Based on customs declaration documents from Directorate General of Customs and Excise (Exports and Imports Declaration)]
TahunYear
NonmigasNon-oil and Gas
MigasOil and Gas
JumlahTotal
EksporExports
ImporImports
EksporExports
ImporImports
EksporExports
ImporImports
(1) (2) (3) (4) (5) (6) (7)
1984 5 869,7 11 185,3 16 018,1 2 696,8 21 887,8 13 882,11985 5 868,9 8 983,5 12 717,8 1 275,6 18 586,7 10 259,11986 6 528,4 9 632,0 8 276,6 1 086,4 14 805,0 10 718,4
1987 8 579,6 11 302,4 8 556,0 1 067,9 17 135,6 12 370,31988 11 536,9 12 339,5 7 681,6 909,0 19 218,5 13 248,51989 13 480,1 15 164,4 8 678,8 1 195,2 22 158,9 16 359,61990 14 604,2 19 916,6 11 071,1 1 920,4 25 675,3 21 837,01991 18 247,5 23 558,5 10 894,9 2 310,3 29 142,4 25 868,81992 23 296,1 25 164,6 10 670,9 2 115,0 33 967,0 27 279,61993 27 077,2 26 157,2 9 745,8 2 170,6 36 823,0 28 327,81994 30 359,8 29 616,1 9 693,6 2 367,4 40 053,4 31 983,51995 34 953,6 37 717,9 10 464,4 2 910,8 45 418,0 40 628,71996 38 093,0 39 333,0 11 721,8 3 595,5 49 814,8 42 928,51997 41 821,1 37 755,7 11 622,5 3 924,1 53 443,6 41 679,81998 40 975,5 24 683,2 7 872,1 2 653,7 48 847,6 27 336,91999 38 873,2 20 322,2 9 792,2 3 681,1 48 665,4 24 003,32000 47 757,4 27 495,3 14 366,6 6 019,5 62 124,0 33 514,82001 43 684,6 25 490,3 12 636,3 5 471,8 56 320,9 30 962,12002 45 046,1 24 763,1 12 112,7 6 525,8 57 158,8 31 288,92003 47 406,8 24 939,8 13 651,4 7 610,9 61 058,2 32 550,72004 55 939,3 34 792,5 15 645,3 11 732,0 71 584,6 46 524,52005 66 428,4 40 243,2 19 231,6 17 457,7 85 660,0 57 700,92006 79 589,1 42 102,6 21 209,5 18 962,9 100 798,6 61 065,52007 92 012,3 52 540,6 22 088,6 21 932,8 114 100,9 74 473,42008 107 894,2 98 644,4 29 126,3 30 552,9 137 020,4 129 197,32009 97 491,7 77 848,5 19 018,3 18 980,7 116 510,0 96 829,22010 129 739,5 108 250,6 28 039,6 27 412,7 157 779,1 135 663,32011 162 019,6 136 734,1 41 477,0 40 701,5 203 496,6 177 435,62012 153 043,0 149 125,3 36 977,3 42 564,2 190 020,3 191 689,5
Catatan/Note: 1 Nilai ekspor adalah nilai Free on Board (FOB)/Values of exports are Free on Board (FOB) value 2 Nilai impor adalah nilai Cost, Insurance and Freight (CIF). Data tahun 1984-2007 menggunakan Sistem Perdagangan Khusus (di Luar Kawasan
Berikat)/Values of imports are Cost, Insurance and Freight (CIF) value. The data of 1984-2007 used Special Trade System (Excluding Bounded Zone)
Tabel ––––––
14.1.1Table
http
://www.b
ps.g
o.id
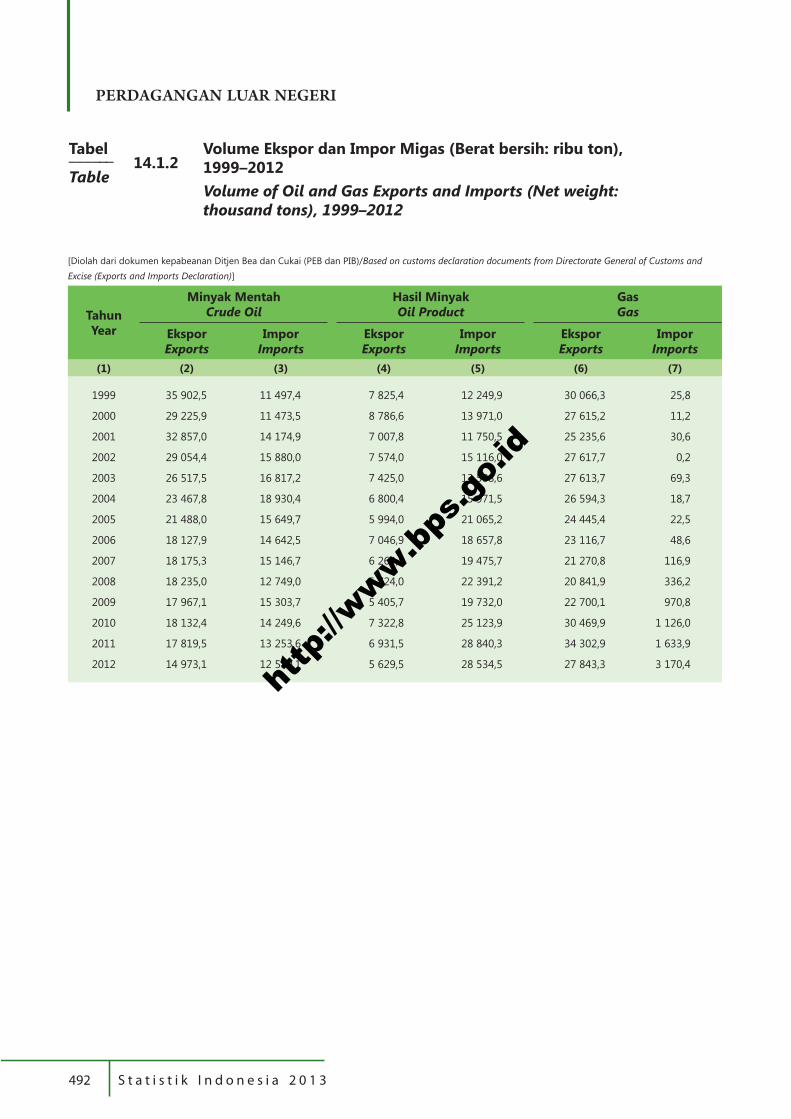
PERDAGANGAN LUAR NEGERI
S t a t i s t i k I n d o n e s i a 2 0 1 3492
Volume Ekspor dan Impor Migas (Berat bersih: ribu ton), 1999–2012Volume of Oil and Gas Exports and Imports (Net weight: thousand tons), 1999–2012
[Diolah dari dokumen kepabeanan Ditjen Bea dan Cukai (PEB dan PIB)/Based on customs declaration documents from Directorate General of Customs and Excise (Exports and Imports Declaration)]
TahunYear
Minyak MentahCrude Oil
Hasil MinyakOil Product
GasGas
EksporExports
ImporImports
EksporExports
ImporImports
EksporExports
ImporImports
(1) (2) (3) (4) (5) (6) (7)
1999 35 902,5 11 497,4 7 825,4 12 249,9 30 066,3 25,8
2000 29 225,9 11 473,5 8 786,6 13 971,0 27 615,2 11,2
2001 32 857,0 14 174,9 7 007,8 11 750,5 25 235,6 30,6
2002 29 054,4 15 880,0 7 574,0 15 116,0 27 617,7 0,2
2003 26 517,5 16 817,2 7 425,0 13 588,6 27 613,7 69,3
2004 23 467,8 18 930,4 6 800,4 15 971,5 26 594,3 18,7
2005 21 488,0 15 649,7 5 994,0 21 065,2 24 445,4 22,5
2006 18 127,9 14 642,5 7 046,9 18 657,8 23 116,7 48,6
2007 18 175,3 15 146,7 6 264,8 19 475,7 21 270,8 116,9
2008 18 235,0 12 749,0 5 724,0 22 391,2 20 841,9 336,2
2009 17 967,1 15 303,7 5 405,7 19 732,0 22 700,1 970,8
2010 18 132,4 14 249,6 7 322,8 25 123,9 30 469,9 1 126,0
2011 17 819,5 13 253,6 6 931,5 28 840,3 34 302,9 1 633,9
2012 14 973,1 12 550,1 5 629,5 28 534,5 27 843,3 3 170,4
Tabel ––––––
14.1.2Table
http
://www.b
ps.g
o.id

FOREIGN TRADE
S t a t i s t i c a l Y e a r b o o k o f I n d o n e s i a 2 0 1 3 493
Nilai Ekspor 1 dan Impor 2 Migas (juta US$), 1999–2012Value of Oil and Gas Exports 1 and Imports 2 (million US$), 1999–2012
[Diolah dari dokumen kepabeanan Ditjen Bea dan Cukai (PEB dan PIB)/Based on customs declaration documents from Directorate General of Customs and Excise (Exports and Imports Declaration)]
TahunYear
Minyak MentahCrude Oil
Hasil MinyakOil Product
GasGas
EksporExports
ImporImports
EksporExports
ImporImports
EksporExports
ImporImports
(1) (2) (3) (4) (5) (6) (7)
1999 4 517,3 1 587,7 918,0 2 088,0 4 357,0 5,4
2000 6 090,1 2 524,9 1 651,6 3 491,1 6 624,9 3,5
2001 5 714,7 2 887,5 1 189,5 2 574,2 5 732,2 10,1
2002 5 227,6 3 216,9 1 307,5 3 308,7 5 577,6 0,2
2003 5 621,0 4 027,4 1 553,7 3 562,0 6 476,7 21,5
2004 6 241,4 5 831,4 1 654,4 5 892,1 7 749,6 8,5
2005 8 145,8 6 797,0 1 932,0 10 645,8 9 153,7 14,9
2006 8 168,8 7 852,6 2 843,6 11 080,3 10 197,1 30,0
2007 9 226,0 9 056,9 2 878,8 12 786,7 9 983,8 89,2
2008 12 418,7 10 061,5 3 547,0 20 230,8 13 160,5 260,6
2009 7 820,3 7 362,2 2 262,3 11 129,4 8 935,7 489,1
2010 10 402,9 8 531,3 3 967,3 18 018,2 13 669,4 863,2
2011 13 828,7 11 154,4 4 776,8 28 134,6 22 871,5 1 412,5
2012 12 293,4 10 803,2 4 163,4 28 679,4 20 520,5 3 081,6
Catatan/Note: 1 Nilai ekspor adalah nilai Free on Board (FOB)/Values of exports are Free on Board (FOB) value 2 Nilai impor adalah nilai Cost, Insurance and Freight (CIF). Data tahun 1999-2007 menggunakan Sistem Perdagangan Khusus (di Luar Kawasan
Berikat)/Values of imports are Cost, Insurance and Freight (CIF) value. The data of 1999-2007 used Special Trade System (Excluding Bounded Zone)
Tabel ––––––
14.1.3Table
http
://www.b
ps.g
o.id

PERDAGANGAN LUAR NEGERI
S t a t i s t i k I n d o n e s i a 2 0 1 3494
Volume Ekspor dan Impor Menurut Golongan SITC (Berat bersih: ribu ton), 2010–2012Volume of Exports and Imports by SITC Group (Net weight: thousand tons), 2010–2012
[Diolah dari dokumen kepabeanan Ditjen Bea dan Cukai (PEB dan PIB)/Based on customs declaration documents from Directorate General of Customs and Excise (Exports and Imports Declaration)]
SITC Golongan BarangCommodity Group
Ekspor/Exports Impor/Imports
2010 2011 2012 2010 2011 2012(1) (2) (3) (4) (5) (6) (7) (8)
0 Bahan makanan dan binatang hidupFood and live animals
7 794,7 8 595,5 9 379,7 16 655,3 22 566,4 21 225,7
1 Minuman dan tembakauBeverages and tobacco
199,3 243,6 206,2 160,3 185,4 247,2
2 Bahan-bahan mentah, tidak untukdimakan/Raw materials, inedible
68 923,3 113 049,6 108 869,7 18 247,9 20 128,5 19 009,2
3 Bahan bakar pelikan, bahan penyemirdan bahan-bahan yang berkenaan dengan itu/Mineral fuels,lubricants, and related materials
355 181,4 412 828,7 433 105,8 40 698,0 43 923,1 44 547,5
4 Lemak serta minyak hewan dan nabatiAnimal and vegetable oils and fats
18 666,4 18 823,6 23 203,9 122,7 103,5 86,3
5 Bahan-bahan kimiaChemicals
9 238,6 10 782,4 9 500,6 14 835,0 18 250,9 20 392,1
6 Barang-barang buatan pabrik dirincimenurut bahan/Manufactured goodsclassified by materials
15 057,3 14 195,8 12 117,1 14 237,3 16 212,1 22 527,3
7 Mesin dan alat pengangkutanMachinery and transport equipment
1 903,5 1 904,2 1 963,4 5 047,3 6 008,4 7 253,1
8 Berbagai jenis barang buatan pabrikMiscellaneous manufactured articles
1 882,3 1 796,4 1 790,2 691,6 843,1 995,2
9 Barang-barang transaksi tidak dirinciCommodities and transactions not further specified
0,0 0,0 0,0 5,6 0,2 0,0
Jumlah/Total 478 846,8 582 219,8 600 136,6 110 701,0 r 128 221,6 136 283,6
Tabel ––––––
14.1.4Table
Catatan/Note: r Angka diperbaiki/Revised figures
http
://www.b
ps.g
o.id
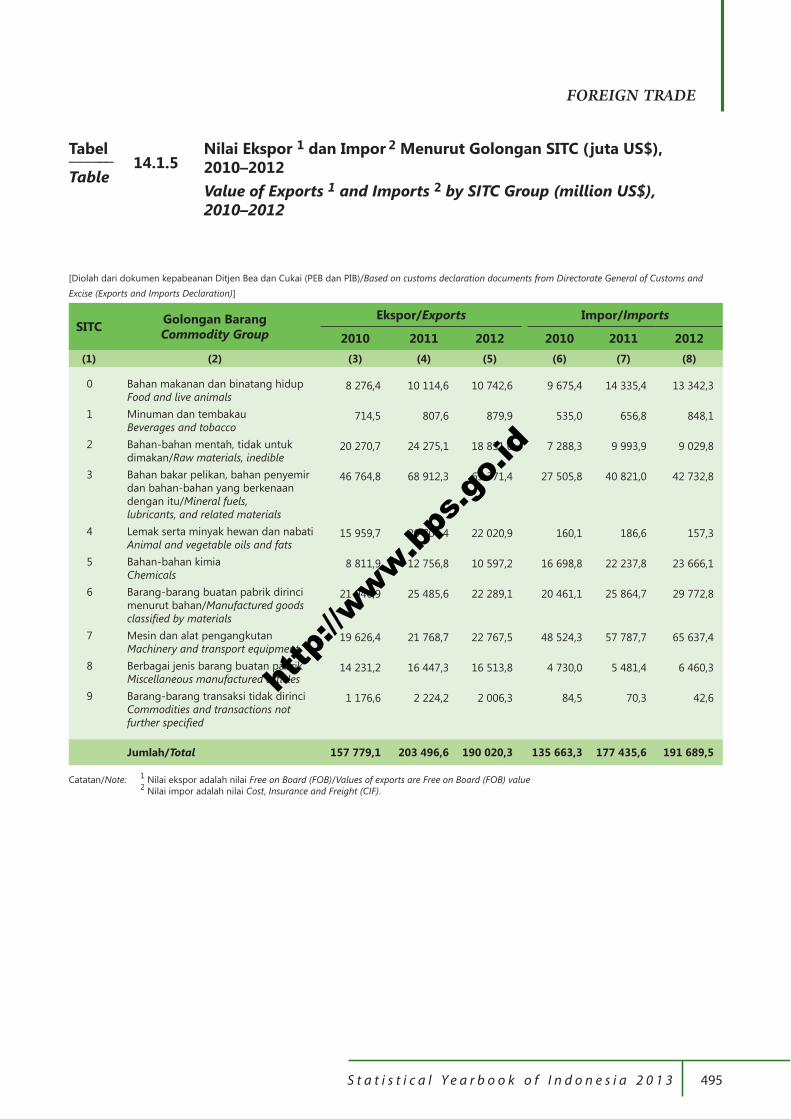
FOREIGN TRADE
S t a t i s t i c a l Y e a r b o o k o f I n d o n e s i a 2 0 1 3 495
Nilai Ekspor 1 dan Impor 2 Menurut Golongan SITC (juta US$), 2010–2012Value of Exports 1 and Imports 2 by SITC Group (million US$), 2010–2012
[Diolah dari dokumen kepabeanan Ditjen Bea dan Cukai (PEB dan PIB)/Based on customs declaration documents from Directorate General of Customs and Excise (Exports and Imports Declaration)]
SITC Golongan BarangCommodity Group
Ekspor/Exports Impor/Imports
2010 2011 2012 2010 2011 2012(1) (2) (3) (4) (5) (6) (7) (8)
0 Bahan makanan dan binatang hidupFood and live animals
8 276,4 10 114,6 10 742,6 9 675,4 14 335,4 13 342,3
1 Minuman dan tembakauBeverages and tobacco
714,5 807,6 879,9 535,0 656,8 848,1
2 Bahan-bahan mentah, tidak untukdimakan/Raw materials, inedible
20 270,7 24 275,1 18 831,6 7 288,3 9 993,9 9 029,8
3 Bahan bakar pelikan, bahan penyemirdan bahan-bahan yang berkenaan dengan itu/Mineral fuels,lubricants, and related materials
46 764,8 68 912,3 63 371,4 27 505,8 40 821,0 42 732,8
4 Lemak serta minyak hewan dan nabatiAnimal and vegetable oils and fats
15 959,7 20 704,4 22 020,9 160,1 186,6 157,3
5 Bahan-bahan kimiaChemicals
8 811,9 12 756,8 10 597,2 16 698,8 22 237,8 23 666,1
6 Barang-barang buatan pabrik dirincimenurut bahan/Manufactured goodsclassified by materials
21 946,9 25 485,6 22 289,1 20 461,1 25 864,7 29 772,8
7 Mesin dan alat pengangkutanMachinery and transport equipment
19 626,4 21 768,7 22 767,5 48 524,3 57 787,7 65 637,4
8 Berbagai jenis barang buatan pabrikMiscellaneous manufactured articles
14 231,2 16 447,3 16 513,8 4 730,0 5 481,4 6 460,3
9 Barang-barang transaksi tidak dirinciCommodities and transactions not further specified
1 176,6 2 224,2 2 006,3 84,5 70,3 42,6
Jumlah/Total 157 779,1 203 496,6 190 020,3 135 663,3 177 435,6 191 689,5
Catatan/Note: 1 Nilai ekspor adalah nilai Free on Board (FOB)/Values of exports are Free on Board (FOB) value 2 Nilai impor adalah nilai Cost, Insurance and Freight (CIF).
Tabel ––––––
14.1.5Table
http
://www.b
ps.g
o.id
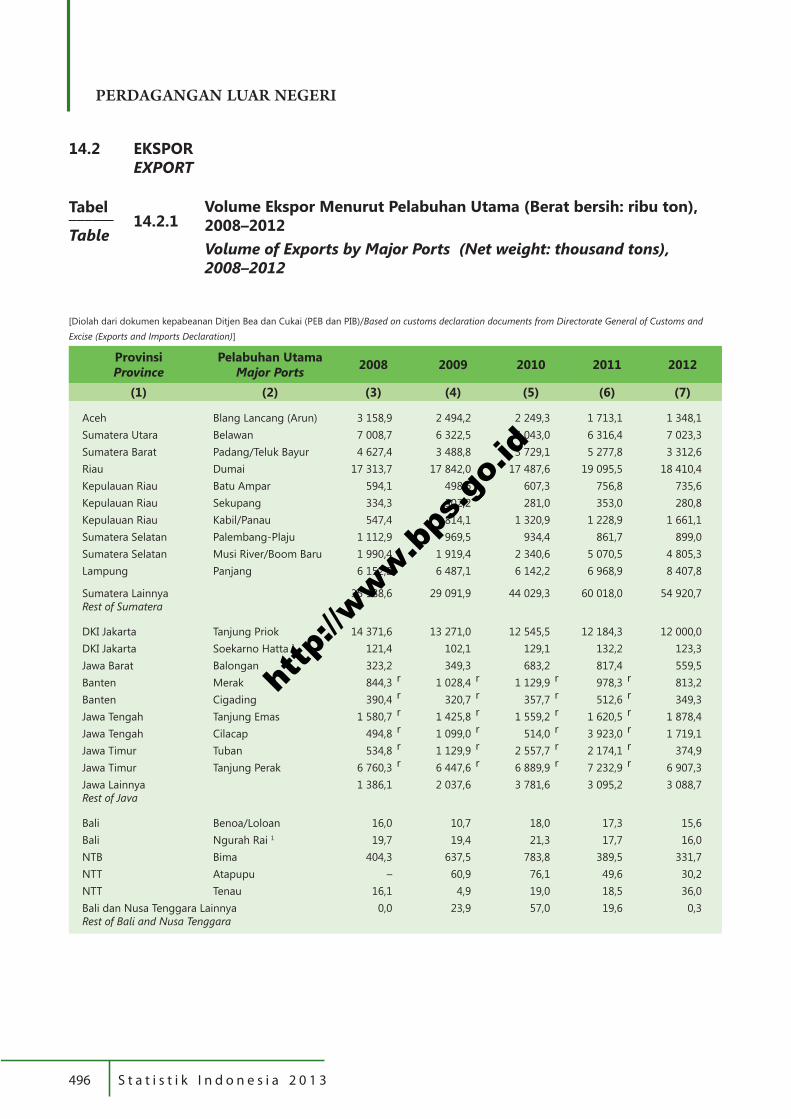
PERDAGANGAN LUAR NEGERI
S t a t i s t i k I n d o n e s i a 2 0 1 3496
Volume Ekspor Menurut Pelabuhan Utama (Berat bersih: ribu ton), 2008–2012Volume of Exports by Major Ports (Net weight: thousand tons), 2008–2012
14.2 EKSPOR EXPORT
[Diolah dari dokumen kepabeanan Ditjen Bea dan Cukai (PEB dan PIB)/Based on customs declaration documents from Directorate General of Customs and Excise (Exports and Imports Declaration)]
ProvinsiProvince
Pelabuhan UtamaMajor Ports 2008 2009 2010 2011 2012
(1) (2) (3) (4) (5) (6) (7)
Aceh Blang Lancang (Arun) 3 158,9 2 494,2 2 249,3 1 713,1 1 348,1Sumatera Utara Belawan 7 008,7 6 322,5 6 043,0 6 316,4 7 023,3Sumatera Barat Padang/Teluk Bayur 4 627,4 3 488,8 3 729,1 5 277,8 3 312,6Riau Dumai 17 313,7 17 842,0 17 487,6 19 095,5 18 410,4Kepulauan Riau Batu Ampar 594,1 498,6 607,3 756,8 735,6Kepulauan Riau Sekupang 334,3 302,2 281,0 353,0 280,8Kepulauan Riau Kabil/Panau 547,4 814,1 1 320,9 1 228,9 1 661,1Sumatera Selatan Palembang-Plaju 1 112,9 969,5 934,4 861,7 899,0Sumatera Selatan Musi River/Boom Baru 1 990,4 1 919,4 2 340,6 5 070,5 4 805,3Lampung Panjang 6 152,2 6 487,1 6 142,2 6 968,9 8 407,8
Sumatera LainnyaRest of Sumatera
35 188,6 29 091,9 44 029,3 60 018,0 54 920,7
DKI Jakarta Tanjung Priok 14 371,6 13 271,0 12 545,5 12 184,3 12 000,0DKI Jakarta Soekarno Hatta 1 121,4 102,1 129,1 132,2 123,3Jawa Barat Balongan 323,2 349,3 683,2 817,4 559,5Banten Merak 844,3 r 1 028,4 r 1 129,9 r 978,3 r 813,2Banten Cigading 390,4 r 320,7 r 357,7 r 512,6 r 349,3Jawa Tengah Tanjung Emas 1 580,7 r 1 425,8 r 1 559,2 r 1 620,5 r 1 878,4Jawa Tengah Cilacap 494,8 r 1 099,0 r 514,0 r 3 923,0 r 1 719,1Jawa Timur Tuban 534,8 r 1 129,9 r 2 557,7 r 2 174,1 r 374,9Jawa Timur Tanjung Perak 6 760,3 r 6 447,6 r 6 889,9 r 7 232,9 r 6 907,3Jawa LainnyaRest of Java
1 386,1 2 037,6 3 781,6 3 095,2 3 088,7
Bali Benoa/Loloan 16,0 10,7 18,0 17,3 15,6Bali Ngurah Rai 1 19,7 19,4 21,3 17,7 16,0NTB Bima 404,3 637,5 783,8 389,5 331,7NTT Atapupu – 60,9 76,1 49,6 30,2NTT Tenau 16,1 4,9 19,0 18,5 36,0Bali dan Nusa Tenggara LainnyaRest of Bali and Nusa Tenggara
0,0 23,9 57,0 19,6 0,3
Tabel ––––––
14.2.1Table
http
://www.b
ps.g
o.id
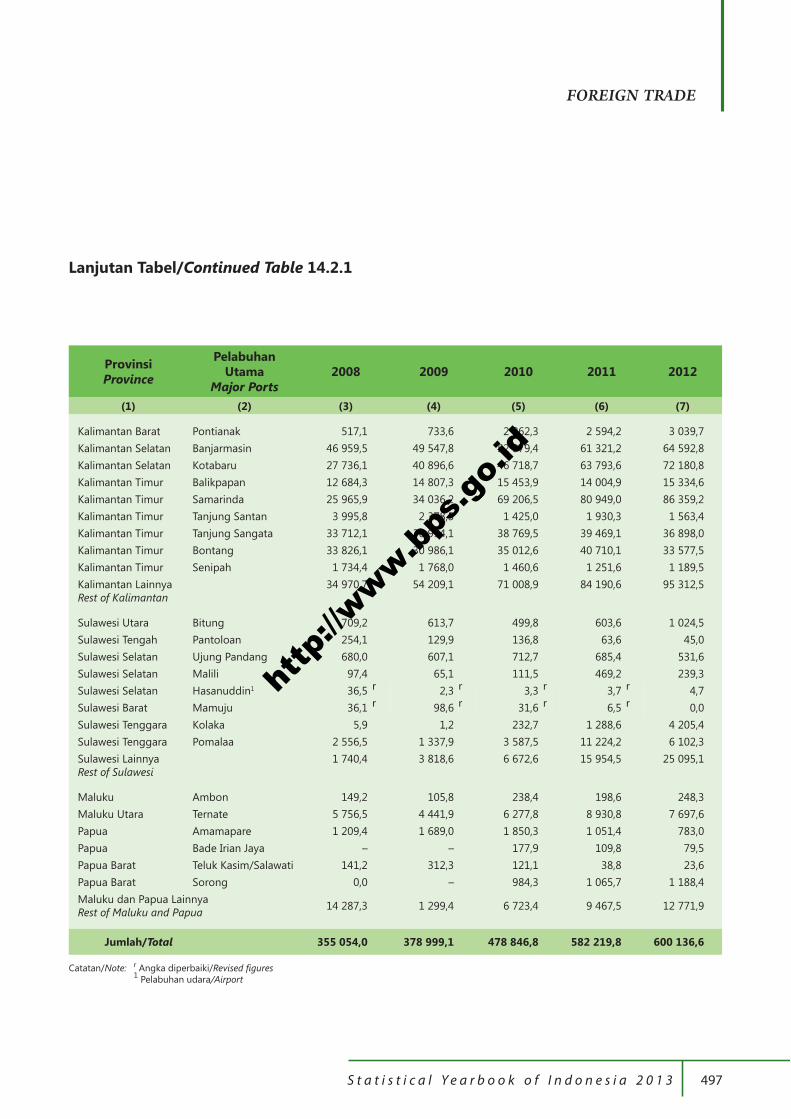
FOREIGN TRADE
S t a t i s t i c a l Y e a r b o o k o f I n d o n e s i a 2 0 1 3 497
Lanjutan Tabel/Continued Table 14.2.1
Catatan/Note: r Angka diperbaiki/Revised figures 1 Pelabuhan udara/Airport
ProvinsiProvince
Pelabuhan Utama
Major Ports2008 2009 2010 2011 2012
(1) (2) (3) (4) (5) (6) (7)
Kalimantan Barat Pontianak 517,1 733,6 2 262,3 2 594,2 3 039,7Kalimantan Selatan Banjarmasin 46 959,5 49 547,8 52 879,4 61 321,2 64 592,8Kalimantan Selatan Kotabaru 27 736,1 40 896,6 46 718,7 63 793,6 72 180,8Kalimantan Timur Balikpapan 12 684,3 14 807,3 15 453,9 14 004,9 15 334,6Kalimantan Timur Samarinda 25 965,9 34 036,2 69 206,5 80 949,0 86 359,2Kalimantan Timur Tanjung Santan 3 995,8 2 378,5 1 425,0 1 930,3 1 563,4Kalimantan Timur Tanjung Sangata 33 712,1 36 914,1 38 769,5 39 469,1 36 898,0Kalimantan Timur Bontang 33 826,1 30 986,1 35 012,6 40 710,1 33 577,5Kalimantan Timur Senipah 1 734,4 1 768,0 1 460,6 1 251,6 1 189,5Kalimantan LainnyaRest of Kalimantan
34 970,7 54 209,1 71 008,9 84 190,6 95 312,5
Sulawesi Utara Bitung 709,2 613,7 499,8 603,6 1 024,5Sulawesi Tengah Pantoloan 254,1 129,9 136,8 63,6 45,0Sulawesi Selatan Ujung Pandang 680,0 607,1 712,7 685,4 531,6Sulawesi Selatan Malili 97,4 65,1 111,5 469,2 239,3Sulawesi Selatan Hasanuddin1 36,5 r 2,3 r 3,3 r 3,7 r 4,7Sulawesi Barat Mamuju 36,1 r 98,6 r 31,6 r 6,5 r 0,0Sulawesi Tenggara Kolaka 5,9 1,2 232,7 1 288,6 4 205,4Sulawesi Tenggara Pomalaa 2 556,5 1 337,9 3 587,5 11 224,2 6 102,3Sulawesi LainnyaRest of Sulawesi
1 740,4 3 818,6 6 672,6 15 954,5 25 095,1
Maluku Ambon 149,2 105,8 238,4 198,6 248,3Maluku Utara Ternate 5 756,5 4 441,9 6 277,8 8 930,8 7 697,6Papua Amamapare 1 209,4 1 689,0 1 850,3 1 051,4 783,0Papua Bade Irian Jaya – – 177,9 109,8 79,5Papua Barat Teluk Kasim/Salawati 141,2 312,3 121,1 38,8 23,6Papua Barat Sorong 0,0 – 984,3 1 065,7 1 188,4Maluku dan Papua LainnyaRest of Maluku and Papua 14 287,3 1 299,4 6 723,4 9 467,5 12 771,9
Jumlah/Total 355 054,0 378 999,1 478 846,8 582 219,8 600 136,6
http
://www.b
ps.g
o.id

PERDAGANGAN LUAR NEGERI
S t a t i s t i k I n d o n e s i a 2 0 1 3498
Nilai Ekspor Menurut Pelabuhan Utama (Nilai FOB: juta US$), 2008–2012Value of Exports by Major Ports (FOB value: million US$), 2008–2012
[Diolah dari dokumen kepabeanan Ditjen Bea dan Cukai (PEB dan PIB)/Based on customs declaration documents from Directorate General of Customs and Excise (Exports and Imports Declaration)]
ProvinsiProvince
Pelabuhan UtamaMajor Ports 2008 2009 2010 2011 2012
(1) (2) (3) (4) (5) (6) (7)
Aceh Blang Lancang (Arun) 2 104,4 1 035,0 1 326,3 1 406,3 1 197,3Sumatera Utara Belawan 7 873,3 5 369,0 7 429,0 10 057,7 8 871,9Sumatera Barat Padang/Teluk Bayur 2 379,7 1 344,3 2 214,6 3 030,0 2 362,9Riau Dumai 12 453,2 8 993,7 11 770,9 16 485,3 15 516,8Kepulauan Riau Batu Ampar 3 451,8 2 548,5 3 690,0 4 677,9 3 803,2Kepulauan Riau Sekupang 1 297,1 1 701,2 2 154,7 2 722,5 2 660,6Kepulauan Riau Kabil/Panau 1 332,3 1 292,1 1 583,1 1 531,6 1 800,2Sumatera Selatan Palembang - Plaju 777,6 395,3 500,3 501,4 642,4Sumatera Selatan Musi River/Boom Baru 2 626,1 1 557,5 2 963,6 4 489,7 3 629,9Lampung Panjang 2 743,7 2 258,7 2 467,4 3 222,6 3 698,4
Sumatera LainnyaRest of Sumatera
9 145,3 8 171,6 13 587,9 18 636,6 17 725,2
DKI Jakarta Tanjung Priok 31 693,2 28 165,4 34 237,8 40 079,1 42 697,3DKI Jakarta Soekarno Hatta 1 4 331,8 4 243,1 5 282,0 6 269,9 5 320,9Jawa Barat Balongan 195,1 148,7 345,3 511,1 421,5Banten Merak 595,4 r 567,4 r 790,8 r 917,1 r 634,0Banten Cigading 129,5 r 59,8 r 147,2 r 189,4 r 85,8Jawa Tengah Tanjung Emas 3 160,3 r 2 850,8 r 3 663,8 r 4 166,8 r 4 423,9Jawa Tengah Cilacap 122,6 r 208,2 r 199,4 r 511,5 r 213,2Jawa Timur Tuban 443,0 r 683,7 r 1 823,3 r 2 355,4 r 328,8Jawa Timur Tanjung Perak 10 513,0 r 9 702,0 r 12 386,5 r 14 608,9 r 13 228,4Jawa Lainnya/Rest of Java 1 565,6 1 635,9 3 043,0 4 001,9 4 206,9
Bali Benoa/Loloan 26,9 22,9 43,8 43,6 46,0Bali Ngurah Rai 1 240,6 230,7 328,3 331,8 301,0NTB Bima 741,4 1 243,9 1 994,2 1 136,3 596,2NTT Atapupu – 19,4 20,1 18,0 7,0NTT Tenau 12,4 8,8 12,7 7,7 36,6Bali dan Nusa Tenggara LainnyaRest of Bali and Nusa Tenggara
0,2 1,6 3,9 1,9 1,4
Tabel ––––––
14.2.2Table
http
://www.b
ps.g
o.id
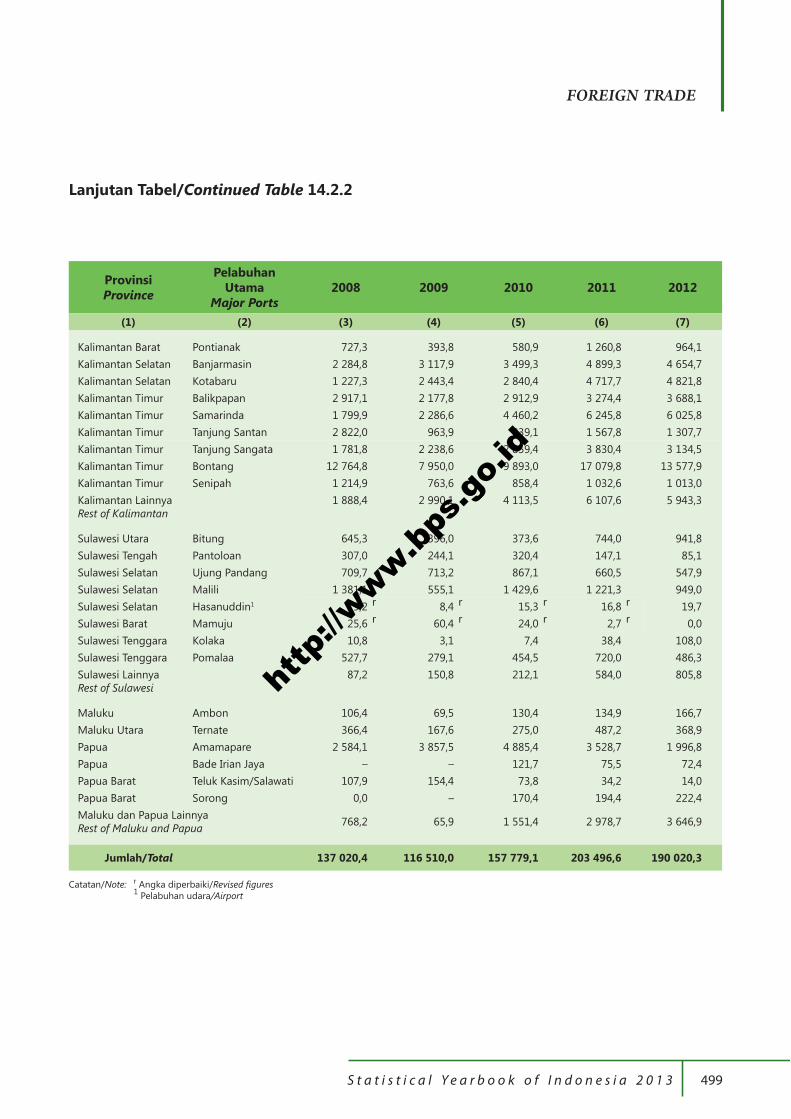
FOREIGN TRADE
S t a t i s t i c a l Y e a r b o o k o f I n d o n e s i a 2 0 1 3 499
ProvinsiProvince
Pelabuhan Utama
Major Ports2008 2009 2010 2011 2012
(1) (2) (3) (4) (5) (6) (7)
Kalimantan Barat Pontianak 727,3 393,8 580,9 1 260,8 964,1Kalimantan Selatan Banjarmasin 2 284,8 3 117,9 3 499,3 4 899,3 4 654,7Kalimantan Selatan Kotabaru 1 227,3 2 443,4 2 840,4 4 717,7 4 821,8Kalimantan Timur Balikpapan 2 917,1 2 177,8 2 912,9 3 274,4 3 688,1Kalimantan Timur Samarinda 1 799,9 2 286,6 4 460,2 6 245,8 6 025,8Kalimantan Timur Tanjung Santan 2 822,0 963,9 839,1 1 567,8 1 307,7Kalimantan Timur Tanjung Sangata 1 781,8 2 238,6 2 859,4 3 830,4 3 134,5Kalimantan Timur Bontang 12 764,8 7 950,0 9 893,0 17 079,8 13 577,9Kalimantan Timur Senipah 1 214,9 763,6 858,4 1 032,6 1 013,0Kalimantan LainnyaRest of Kalimantan
1 888,4 2 990,1 4 113,5 6 107,6 5 943,3
Sulawesi Utara Bitung 645,3 396,0 373,6 744,0 941,8Sulawesi Tengah Pantoloan 307,0 244,1 320,4 147,1 85,1Sulawesi Selatan Ujung Pandang 709,7 713,2 867,1 660,5 547,9Sulawesi Selatan Malili 1 381,1 555,1 1 429,6 1 221,3 949,0Sulawesi Selatan Hasanuddin1 9,2 r 8,4 r 15,3 r 16,8 r 19,7Sulawesi Barat Mamuju 25,6 r 60,4 r 24,0 r 2,7 r 0,0Sulawesi Tenggara Kolaka 10,8 3,1 7,4 38,4 108,0Sulawesi Tenggara Pomalaa 527,7 279,1 454,5 720,0 486,3Sulawesi LainnyaRest of Sulawesi
87,2 150,8 212,1 584,0 805,8
Maluku Ambon 106,4 69,5 130,4 134,9 166,7Maluku Utara Ternate 366,4 167,6 275,0 487,2 368,9Papua Amamapare 2 584,1 3 857,5 4 885,4 3 528,7 1 996,8Papua Bade Irian Jaya – – 121,7 75,5 72,4Papua Barat Teluk Kasim/Salawati 107,9 154,4 73,8 34,2 14,0Papua Barat Sorong 0,0 – 170,4 194,4 222,4Maluku dan Papua LainnyaRest of Maluku and Papua 768,2 65,9 1 551,4 2 978,7 3 646,9
Jumlah/Total 137 020,4 116 510,0 157 779,1 203 496,6 190 020,3
Catatan/Note: r Angka diperbaiki/Revised figures 1 Pelabuhan udara/Airport
Lanjutan Tabel/Continued Table 14.2.2
http
://www.b
ps.g
o.id
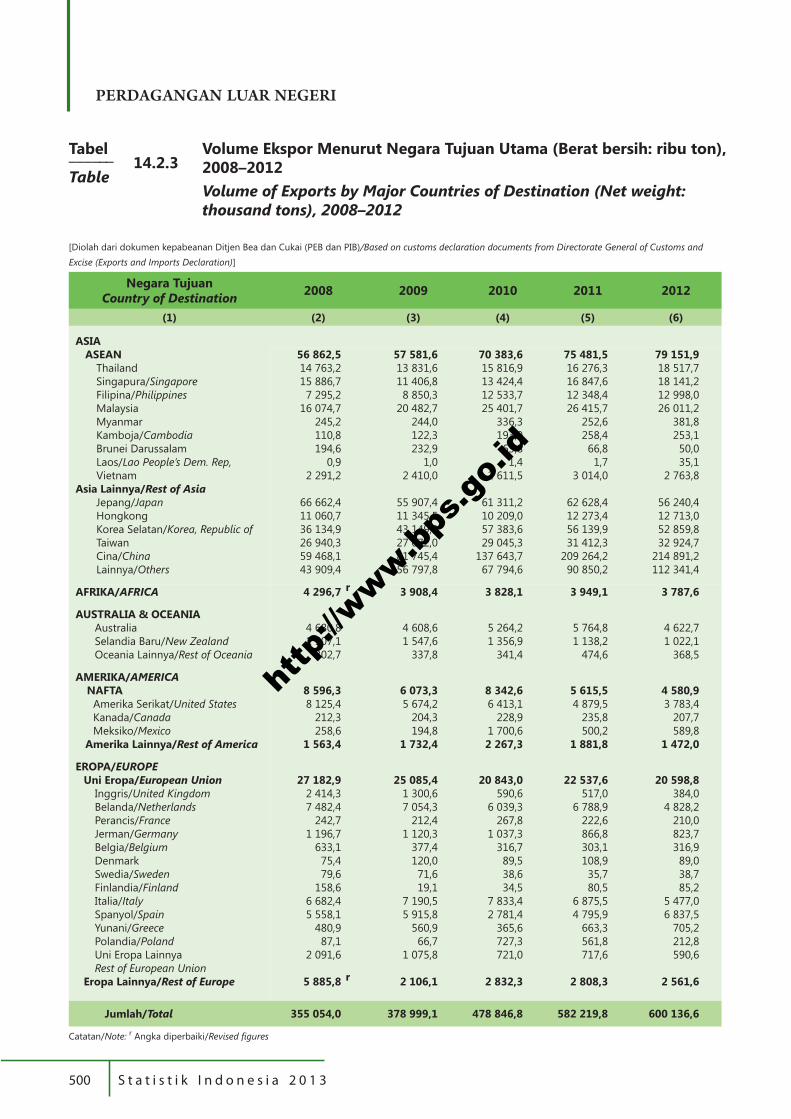
PERDAGANGAN LUAR NEGERI
S t a t i s t i k I n d o n e s i a 2 0 1 3500
Volume Ekspor Menurut Negara Tujuan Utama (Berat bersih: ribu ton), 2008–2012Volume of Exports by Major Countries of Destination (Net weight: thousand tons), 2008–2012
[Diolah dari dokumen kepabeanan Ditjen Bea dan Cukai (PEB dan PIB)/Based on customs declaration documents from Directorate General of Customs and Excise (Exports and Imports Declaration)]
Negara TujuanCountry of Destination 2008 2009 2010 2011 2012
(1) (2) (3) (4) (5) (6)
ASIAASEAN 56 862,5 57 581,6 70 383,6 75 481,5 79 151,9
Thailand 14 763,2 13 831,6 15 816,9 16 276,3 18 517,7Singapura/Singapore 15 886,7 11 406,8 13 424,4 16 847,6 18 141,2Filipina/Philippines 7 295,2 8 850,3 12 533,7 12 348,4 12 998,0Malaysia 16 074,7 20 482,7 25 401,7 26 415,7 26 011,2Myanmar 245,2 244,0 336,3 252,6 381,8Kamboja/Cambodia 110,8 122,3 193,9 258,4 253,1Brunei Darussalam 194,6 232,9 63,8 66,8 50,0Laos/Lao People’s Dem. Rep, 0,9 1,0 1,4 1,7 35,1Vietnam 2 291,2 2 410,0 2 611,5 3 014,0 2 763,8
Asia Lainnya/Rest of AsiaJepang/Japan 66 662,4 55 907,4 61 311,2 62 628,4 56 240,4Hongkong 11 060,7 11 345,5 10 209,0 12 273,4 12 713,0Korea Selatan/Korea, Republic of 36 134,9 43 149,8 57 383,6 56 139,9 52 859,8Taiwan 26 940,3 27 072,0 29 045,3 31 412,3 32 924,7Cina/China 59 468,1 81 745,4 137 643,7 209 264,2 214 891,2Lainnya/Others 43 909,4 56 797,8 67 794,6 90 850,2 112 341,4
AFRIKA/AFRICA 4 296,7 r 3 908,4 3 828,1 3 949,1 3 787,6
AUSTRALIA & OCEANIAAustralia 4 680,8 4 608,6 5 264,2 5 764,8 4 622,7Selandia Baru/New Zealand 1 507,1 1 547,6 1 356,9 1 138,2 1 022,1Oceania Lainnya/Rest of Oceania 302,7 337,8 341,4 474,6 368,5
AMERIKA/AMERICANAFTA 8 596,3 6 073,3 8 342,6 5 615,5 4 580,9
Amerika Serikat/United States 8 125,4 5 674,2 6 413,1 4 879,5 3 783,4Kanada/Canada 212,3 204,3 228,9 235,8 207,7Meksiko/Mexico 258,6 194,8 1 700,6 500,2 589,8
Amerika Lainnya/Rest of America 1 563,4 1 732,4 2 267,3 1 881,8 1 472,0
EROPA/EUROPEUni Eropa/European Union 27 182,9 25 085,4 20 843,0 22 537,6 20 598,8
Inggris/United Kingdom 2 414,3 1 300,6 590,6 517,0 384,0Belanda/Netherlands 7 482,4 7 054,3 6 039,3 6 788,9 4 828,2Perancis/France 242,7 212,4 267,8 222,6 210,0Jerman/Germany 1 196,7 1 120,3 1 037,3 866,8 823,7Belgia/Belgium 633,1 377,4 316,7 303,1 316,9Denmark 75,4 120,0 89,5 108,9 89,0Swedia/Sweden 79,6 71,6 38,6 35,7 38,7Finlandia/Finland 158,6 19,1 34,5 80,5 85,2Italia/Italy 6 682,4 7 190,5 7 833,4 6 875,5 5 477,0Spanyol/Spain 5 558,1 5 915,8 2 781,4 4 795,9 6 837,5Yunani/Greece 480,9 560,9 365,6 663,3 705,2Polandia/Poland 87,1 66,7 727,3 561,8 212,8Uni Eropa Lainnya 2 091,6 1 075,8 721,0 717,6 590,6Rest of European Union
Eropa Lainnya/Rest of Europe 5 885,8 r 2 106,1 2 832,3 2 808,3 2 561,6
Jumlah/Total 355 054,0 378 999,1 478 846,8 582 219,8 600 136,6
Tabel ––––––
14.2.3Table
Catatan/Note: r Angka diperbaiki/Revised figures
http
://www.b
ps.g
o.id
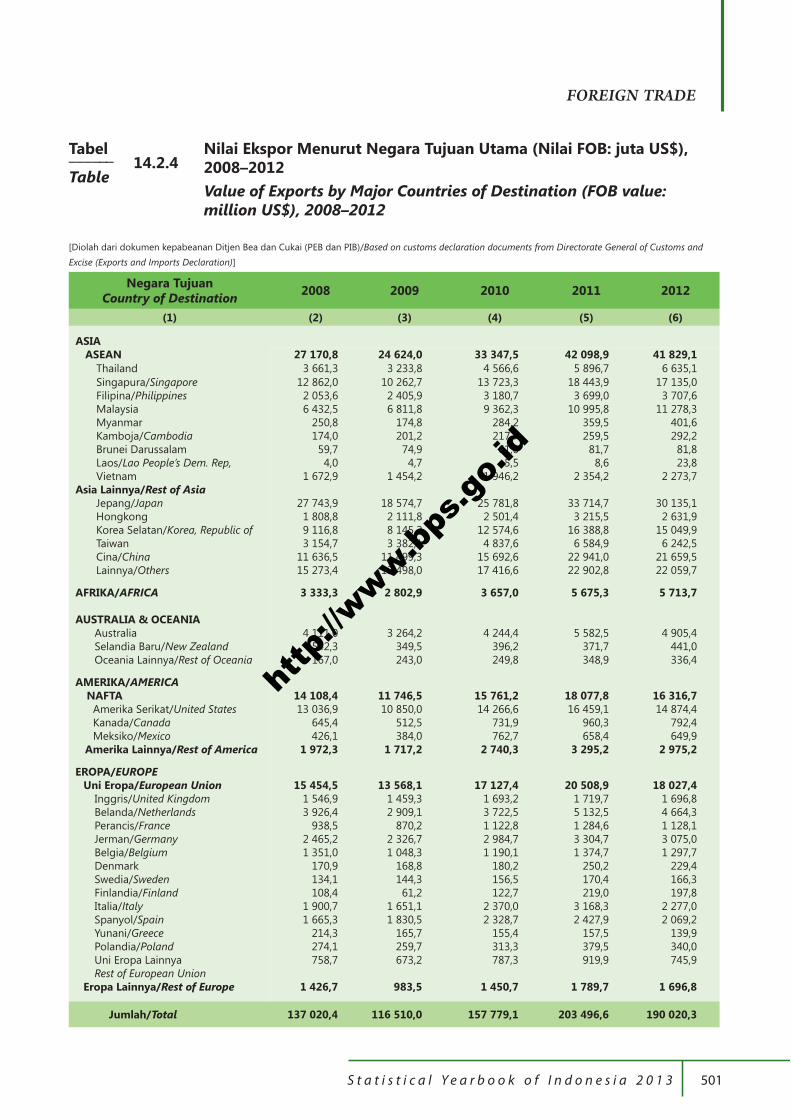
FOREIGN TRADE
S t a t i s t i c a l Y e a r b o o k o f I n d o n e s i a 2 0 1 3 501
Nilai Ekspor Menurut Negara Tujuan Utama (Nilai FOB: juta US$), 2008–2012Value of Exports by Major Countries of Destination (FOB value: million US$), 2008–2012
[Diolah dari dokumen kepabeanan Ditjen Bea dan Cukai (PEB dan PIB)/Based on customs declaration documents from Directorate General of Customs and Excise (Exports and Imports Declaration)]
Negara TujuanCountry of Destination 2008 2009 2010 2011 2012
(1) (2) (3) (4) (5) (6)
ASIAASEAN 27 170,8 24 624,0 33 347,5 42 098,9 41 829,1
Thailand 3 661,3 3 233,8 4 566,6 5 896,7 6 635,1Singapura/Singapore 12 862,0 10 262,7 13 723,3 18 443,9 17 135,0Filipina/Philippines 2 053,6 2 405,9 3 180,7 3 699,0 3 707,6Malaysia 6 432,5 6 811,8 9 362,3 10 995,8 11 278,3Myanmar 250,8 174,8 284,2 359,5 401,6Kamboja/Cambodia 174,0 201,2 217,7 259,5 292,2Brunei Darussalam 59,7 74,9 61,0 81,7 81,8Laos/Lao People’s Dem. Rep, 4,0 4,7 5,5 8,6 23,8Vietnam 1 672,9 1 454,2 1 946,2 2 354,2 2 273,7
Asia Lainnya/Rest of AsiaJepang/Japan 27 743,9 18 574,7 25 781,8 33 714,7 30 135,1Hongkong 1 808,8 2 111,8 2 501,4 3 215,5 2 631,9Korea Selatan/Korea, Republic of 9 116,8 8 145,2 12 574,6 16 388,8 15 049,9Taiwan 3 154,7 3 382,1 4 837,6 6 584,9 6 242,5Cina/China 11 636,5 11 499,3 15 692,6 22 941,0 21 659,5Lainnya/Others 15 273,4 13 498,0 17 416,6 22 902,8 22 059,7
AFRIKA/AFRICA 3 333,3 2 802,9 3 657,0 5 675,3 5 713,7
AUSTRALIA & OCEANIAAustralia 4 111,0 3 264,2 4 244,4 5 582,5 4 905,4Selandia Baru/New Zealand 542,3 349,5 396,2 371,7 441,0Oceania Lainnya/Rest of Oceania 167,0 243,0 249,8 348,9 336,4
AMERIKA/AMERICANAFTA 14 108,4 11 746,5 15 761,2 18 077,8 16 316,7
Amerika Serikat/United States 13 036,9 10 850,0 14 266,6 16 459,1 14 874,4Kanada/Canada 645,4 512,5 731,9 960,3 792,4Meksiko/Mexico 426,1 384,0 762,7 658,4 649,9
Amerika Lainnya/Rest of America 1 972,3 1 717,2 2 740,3 3 295,2 2 975,2
EROPA/EUROPEUni Eropa/European Union 15 454,5 13 568,1 17 127,4 20 508,9 18 027,4
Inggris/United Kingdom 1 546,9 1 459,3 1 693,2 1 719,7 1 696,8Belanda/Netherlands 3 926,4 2 909,1 3 722,5 5 132,5 4 664,3Perancis/France 938,5 870,2 1 122,8 1 284,6 1 128,1Jerman/Germany 2 465,2 2 326,7 2 984,7 3 304,7 3 075,0Belgia/Belgium 1 351,0 1 048,3 1 190,1 1 374,7 1 297,7Denmark 170,9 168,8 180,2 250,2 229,4Swedia/Sweden 134,1 144,3 156,5 170,4 166,3Finlandia/Finland 108,4 61,2 122,7 219,0 197,8Italia/Italy 1 900,7 1 651,1 2 370,0 3 168,3 2 277,0Spanyol/Spain 1 665,3 1 830,5 2 328,7 2 427,9 2 069,2Yunani/Greece 214,3 165,7 155,4 157,5 139,9Polandia/Poland 274,1 259,7 313,3 379,5 340,0Uni Eropa Lainnya 758,7 673,2 787,3 919,9 745,9Rest of European Union
Eropa Lainnya/Rest of Europe 1 426,7 983,5 1 450,7 1 789,7 1 696,8
Jumlah/Total 137 020,4 116 510,0 157 779,1 203 496,6 190 020,3
Tabel ––––––
14.2.4Table
http
://www.b
ps.g
o.id

PERDAGANGAN LUAR NEGERI
S t a t i s t i k I n d o n e s i a 2 0 1 3502
Ekspor Minyak Bumi Mentah Menurut Negara Tujuan Utama, 2008–2012Exports of Crude Petroleum by Major Countries of Destination, 2008–2012
[Diolah dari dokumen kepabeanan Ditjen Bea dan Cukai (PEB dan PIB)/Based on customs declaration documents from Directorate General of Customs and Excise (Exports and Imports Declaration)]
Negara TujuanCountry of Destination 2008 2009 2010 2011 2012
(1) (2) (3) (4) (5) (6)
Berat Bersih/Net Weight: 000 ton
Jepang/Japan 5 933,7 3 189,0 4 441,5 6 307,9 6 624,0Korea Selatan/Korea, Republic of 2 495,4 2 699,7 4 321,1 3 231,2 2 500,9Taiwan 359,5 371,1 556,2 317,1 44,4Cina/China 1 688,1 2 987,2 1 208,4 730,4 209,8Thailand 496,7 1 250,3 775,4 674,5 1 421,4Singapura/Singapore 2 833,9 1 522,4 1 171,7 2 105,2 1 677,0Malaysia 509,1 1 164,6 731,2 295,1 250,0Australia 2 727,2 3 430,9 3 209,2 3 022,2 1 839,1Amerika Serikat/United States 780,8 916,4 1 519,0 986,8 272,0Lainnya/Others 410,6 435,5 198,7 149,1 134,5
Jumlah/Total 18 235,0 17 967,1 18 132,4 17 819,5 14 973,1
Nilai FOB/FOB Value: 000 000 US$
Jepang/Japan 4 164,9 1 389,4 2 554,0 4 898,8 5 648,3Korea Selatan/Korea, Republic of 1 560,1 1 145,2 2 433,9 2 381,4 2 048,0Taiwan 226,5 135,6 308,7 210,7 31,4Cina/China 1 188,8 1 283,3 705,6 570,4 100,5Thailand 352,7 583,8 443,5 554,7 1 139,2Singapura/Singapore 1 767,4 648,5 665,1 1 674,5 1 255,9Malaysia 323,1 524,9 408,5 223,8 191,4Australia 2 003,4 1 552,5 1 880,5 2 477,2 1 542,8Amerika Serikat/United States 505,7 380,0 892,0 711,2 228,9Lainnya/Others 326,1 177,1 111,1 126,0 107,0
Jumlah/Total 12 418,7 7 820,3 10 402,9 13 828,7 12 293,4
Tabel ––––––
14.2.5Table
http
://www.b
ps.g
o.id

FOREIGN TRADE
S t a t i s t i c a l Y e a r b o o k o f I n d o n e s i a 2 0 1 3 503
Ekspor Hasil Minyak Menurut Negara Tujuan Utama, 2008–2012Exports of Petroleum Product by Major Countries of Destination, 2008–2012
[Diolah dari dokumen kepabeanan Ditjen Bea dan Cukai (PEB dan PIB)/Based on customs declaration documents from Directorate General of Customs and Excise (Exports and Imports Declaration)]
Negara TujuanCountry of Destination 2008 2009 2010 2011 2012
(1) (2) (3) (4) (5) (6)
Berat Bersih/Net Weight: 000 ton
Jepang/Japan 2 856,4 1 451,9 1 668,1 1 668,4 918,4Korea Selatan/Korea, Republic of 403,9 654,8 639,9 566,7 334,8Cina/China 387,8 659,7 1 209,6 662,7 438,0Thailand 26,6 11,5 1,3 3,2 3,4Singapura/Singapore 1 434,5 1 087,7 1 431,1 1 479,5 325,3Malaysia 195,7 1 276,8 1 753,8 2 010,6 3 124,0India 274,7 157,3 156,1 215,9 209,5Amerika Serikat/United States 0,0 0,0 99,3 47,1 63,1Lainnya/Others 144,4 106,0 363,6 277,4 213,0
Jumlah/Total 5 724,0 5 405,7 7 322,8 6 931,5 5 629,5
Nilai FOB/FOB Value: 000 000 US$
Jepang/Japan 1 819,9 540,4 839,3 1 147,0 725,0Korea Selatan/Korea, Republic of 238,7 306,1 393,8 368,7 370,7Cina/China 191,5 255,5 566,5 362,5 265,2Thailand 24,1 5,9 1,4 3,2 5,8Singapura/Singapore 990,1 512,2 922,7 1 283,1 289,1Malaysia 124,9 516,0 880,0 1 221,3 2 177,6India 102,5 61,8 56,4 56,7 49,6Amerika Serikat/United States 0,0 0,0 48,2 55,4 54,6Lainnya/Others 55,3 64,4 259,0 278,9 225,8
Jumlah/Total 3 547,0 2 262,3 3 967,3 4 776,8 4 163,4
Tabel ––––––
14.2.6Table
http
://www.b
ps.g
o.id
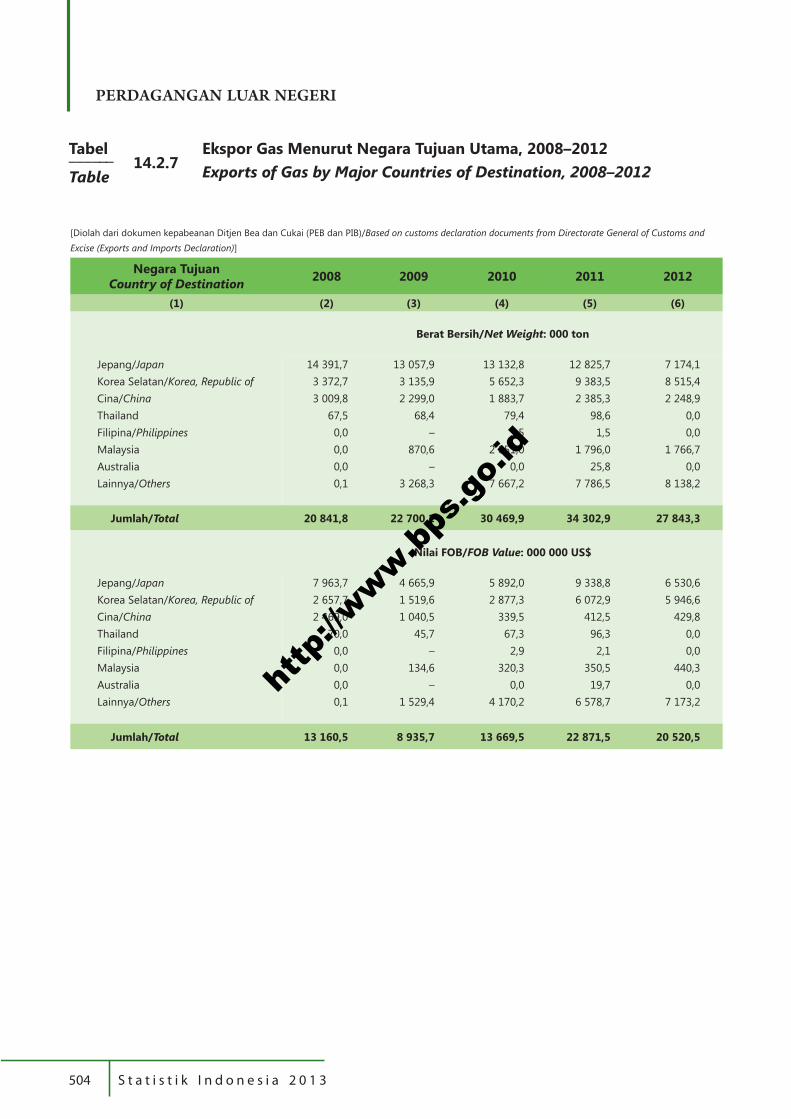
PERDAGANGAN LUAR NEGERI
S t a t i s t i k I n d o n e s i a 2 0 1 3504
Ekspor Gas Menurut Negara Tujuan Utama, 2008–2012Exports of Gas by Major Countries of Destination, 2008–2012
[Diolah dari dokumen kepabeanan Ditjen Bea dan Cukai (PEB dan PIB)/Based on customs declaration documents from Directorate General of Customs and Excise (Exports and Imports Declaration)]
Negara TujuanCountry of Destination 2008 2009 2010 2011 2012
(1) (2) (3) (4) (5) (6)
Berat Bersih/Net Weight: 000 ton
Jepang/Japan 14 391,7 13 057,9 13 132,8 12 825,7 7 174,1Korea Selatan/Korea, Republic of 3 372,7 3 135,9 5 652,3 9 383,5 8 515,4Cina/China 3 009,8 2 299,0 1 883,7 2 385,3 2 248,9Thailand 67,5 68,4 79,4 98,6 0,0Filipina/Philippines 0,0 – 3,5 1,5 0,0Malaysia 0,0 870,6 2 051,0 1 796,0 1 766,7Australia 0,0 – 0,0 25,8 0,0Lainnya/Others 0,1 3 268,3 7 667,2 7 786,5 8 138,2
Jumlah/Total 20 841,8 22 700,1 30 469,9 34 302,9 27 843,3
Nilai FOB/FOB Value: 000 000 US$
Jepang/Japan 7 963,7 4 665,9 5 892,0 9 338,8 6 530,6Korea Selatan/Korea, Republic of 2 657,7 1 519,6 2 877,3 6 072,9 5 946,6Cina/China 2 469,0 1 040,5 339,5 412,5 429,8Thailand 70,0 45,7 67,3 96,3 0,0Filipina/Philippines 0,0 – 2,9 2,1 0,0Malaysia 0,0 134,6 320,3 350,5 440,3Australia 0,0 – 0,0 19,7 0,0Lainnya/Others 0,1 1 529,4 4 170,2 6 578,7 7 173,2
Jumlah/Total 13 160,5 8 935,7 13 669,5 22 871,5 20 520,5
Tabel ––––––
14.2.7Table
http
://www.b
ps.g
o.id

FOREIGN TRADE
S t a t i s t i c a l Y e a r b o o k o f I n d o n e s i a 2 0 1 3 505
Ekspor Kopi Menurut Negara Tujuan Utama, 2008–2012Exports of Coffee by Major Countries of Destination, 2008–2012
[Diolah dari dokumen kepabeanan Ditjen Bea dan Cukai (PEB dan PIB)/Based on customs declaration documents from Directorate General of Customs and Excise (Exports and Imports Declaration)]
Negara TujuanCountry of Destination 2008 2009 2010 2011 2012
(1) (2) (3) (4) (5) (6)
Berat Bersih/Net Weight: ton
Jepang/Japan 52 992,2 53 678,5 59 170,9 58 878,9 51 438,4Singapura/Singapore 7 237,0 7 305,8 6 079,0 6 240,4 9 154,1Malaysia 17 370,4 17 803,2 26 200,1 26 382,1 33 134,1India 12 085,0 9 950,7 9 733,3 12 162,4 19 884,0Mesir/Egypt 10 109,0 10 079,8 12 024,7 10 013,9 17 594,6Maroko/Morocco 6 860,4 7 900,2 8 369,1 10 013,0 11 268,6Aljazair/Algeria 23 205,6 26 531,9 10 303,2 7 298,4 10 488,9Amerika Serikat/United States 65 646,0 71 603,7 63 048,0 48 094,7 69 651,6Inggris/United Kingdom 15 125,3 16 425,5 24 343,1 14 868,4 16 312,4Jerman/Germany 89 600,9 78 876,0 63 688,4 26 461,0 50 978,2Italia/Italy 30 213,4 36 188,4 26 770,7 27 344,4 29 080,8Rumania/Romania 4 565,9 4 816,9 2 219,4 1 497,0 1 362,0Georgia 9 238,4 11 486,7 9 077,4 6 893,0 9 133,5Lainnya/Others 123 602,8 157 383,1 111 693,8 89 915,0 117 529,6
Jumlah/Total 467 852,3 510 030,4 432 721,1 346 062,6 447 010,8
Nilai FOB/FOB Value: 000 US$
Jepang/Japan 123 781,4 98 123,8 118 889,8 174 712,2 145 733,9Singapura/Singapore 17 447,3 12 788,8 9 568,3 15 055,7 32 310,4Malaysia 31 454,0 24 526,1 36 797,9 56 404,2 67 125,5India 21 663,7 12 940,5 13 270,2 21 298,0 38 752,4Mesir/Egypt 19 841,6 15 691,6 19 009,3 24 035,4 38 090,8Maroko/Morocco 13 074,5 11 711,6 12 488,8 21 522,9 24 035,6Aljazair/Algeria 47 124,2 37 148,6 15 390,5 13 285,4 21 970,4Amerika Serikat/United States 173 404,2 161 240,2 176 360,6 274 491,0 330 814,7Inggris/United Kingdom 29 016,7 24 359,6 39 136,3 38 801,3 39 233,4Jerman/Germany 173 955,1 109 408,4 107 943,4 70 517,4 116 879,3Italia/Italy 60 613,9 53 102,4 43 225,7 57 757,9 64 636,3Rumania/Romania 8 511,4 6 577,5 3 395,6 3 119,9 2 866,7Georgia 18 242,2 16 020,9 13 650,9 15 253,3 19 323,4Lainnya/Others 250 698,7 238 316,6 203 232,7 248 470,1 302 053,0
Jumlah/Total 988 828,9 821 956,6 812 360,0 1 034 724,7 1 243 825,8
Tabel ––––––
14.2.8Table
http
://www.b
ps.g
o.id

PERDAGANGAN LUAR NEGERI
S t a t i s t i k I n d o n e s i a 2 0 1 3506
Ekspor Udang Menurut Negara Tujuan Utama, 2008–2012Exports of Shrimp by Major Countries of Destination, 2008–2012
[Diolah dari dokumen kepabeanan Ditjen Bea dan Cukai (PEB dan PIB)/Based on customs declaration documents from Directorate General of Customs and Excise (Exports and Imports Declaration)]
Negara TujuanCountry of Destination 2008 2009 2010 2011 2012
(1) (2) (3) (4) (5) (6)
Berat Bersih/Net Weight: ton
Jepang/Japan 37 666,8 35 060,7 32 669,4 31 000,2 32 497,6Hongkong 3 787,2 3 724,6 4 237,7 3 466,5 2 777,9Cina/China 6 399,5 1 796,6 5 958,8 5 843,4 6 315,4Singapura/Singapore 2 039,3 2 948,7 2 238,7 2 280,6 2 979,9Malaysia 4 247,1 3 394,5 2 895,6 2 801,3 2 593,7Australia 479,6 421,5 220,3 562,7 752,7Amerika Serikat/United States 57 692,7 45 213,6 43 560,9 55 007,0 59 137,9Inggris/United Kingdom 6 864,6 5 139,6 5 024,3 3 234,2 1 783,2Belanda/Netherlands 1 436,3 2 289,9 891,9 593,9 614,6Perancis/France 820,4 2 354,2 1 841,7 1 080,1 995,0Jerman/Germany 1 384,1 583,0 557,8 475,9 277,2Belgia/Belgium 7 912,4 3 728,4 2 828,4 2 786,0 1 013,7Italia/Italy 2 176,7 2 070,4 1 336,4 1 279,4 947,0Lainnya/Others 7 961,3 8 367,7 9 675,1 9 417,2 10 213,0
Jumlah/Total 140 868,0 117 093,4 113 937,0 119 828,4 122 898,8
Nilai FOB/FOB Value: 000 US$
Jepang/Japan 322 631,0 304 796,2 332 615,1 368 991,3 364 968,8Hongkong 19 446,4 16 664,0 21 738,6 21 207,6 20 412,6Cina/China 24 862,8 8 448,6 11 812,2 25 206,7 39 711,9Singapura/Singapore 5 791,5 6 696,5 5 931,8 8 345,6 9 645,5Malaysia 5 117,9 3 878,0 4 829,8 4 106,2 6 790,1Australia 3 132,5 3 424,2 1 993,3 6 507,0 7 809,6Amerika Serikat/United States 423 644,7 308 472,6 350 614,1 493 272,3 482 264,1Inggris /United Kingdom 46 469,6 33 774,1 40 251,8 30 860,5 16 383,9Belanda/Netherlands 7 794,3 10 525,8 5 477,9 4 384,9 5 002,9Perancis/France 4 667,2 14 263,4 13 838,3 8 749,4 8 744,4Jerman/Germany 9 826,4 3 981,1 4 687,1 4 219,3 3 162,1Belgia/Belgium 53 836,8 25 101,7 21 867,3 26 975,8 9 372,6Italia/Italy 7 335,0 6 289,2 3 989,0 4 277,5 3 060,2Lainnya/Others 45 225,1 44 625,9 42 156,5 58 901,1 87 931,5
Jumlah/Total 979 781,2 790 941,3 861 802,8 1 066 005,2 1 065 260,2
Tabel ––––––
14.2.9Table
http
://www.b
ps.g
o.id

FOREIGN TRADE
S t a t i s t i c a l Y e a r b o o k o f I n d o n e s i a 2 0 1 3 507
Ekspor Teh Menurut Negara Tujuan Utama, 2008–2012Exports of Tea by Major Countries of Destination, 2008–2012
[Diolah dari dokumen kepabeanan Ditjen Bea dan Cukai (PEB dan PIB)/Based on customs declaration documents from Directorate General of Customs and Excise (Exports and Imports Declaration)]
Negara TujuanCountry of Destination 2008 2009 2010 2011 2012
(1) (2) (3) (4) (5) (6)
Berat Bersih/Net Weight: ton
Malaysia 7 340,4 6 907,3 7 033,1 6 315,7 5 855,5Pakistan 11 400,4 10 440,3 9 808,4 6 706,0 7 857,8Umi Emirat Arab/United Arab Emirates 4 779,4 4 754,8 4 452,7 3 010,9 1 978,7Amerika Serikat/United States 6 316,0 7 069,1 6 283,3 6 009,0 3 919,2Inggris/United Kingdom 8 607,9 9 843,3 8 934,1 10 589,6 9 018,6Belanda/Netherlands 4 098,8 2 830,1 2 229,8 611,5 666,5Jerman/Germany 7 771,9 6 961,4 5 645,0 4 955,6 4 754,1Polandia/Poland 3 390,2 2 676,7 2 793,8 2 729,1 3 481,4Ukraina/Ukraine 902,7 1 816,2 1 087,9 1 258,5 1 021,4Rusia/Russia 15 080,8 17 895,8 13 488,5 11 545,8 10 305,3Lainnya/Others 14 054,4 11 842,7 17 376,1 14 422,1 12 684,0
Jumlah/Total 83 742,9 83 037,7 79 132,7 68 153,8 61 542,5
Nilai FOB/FOB Value: 000 US$
Malaysia 10 272,8 9 989,0 11 032,6 10 588,5 9 918,7Pakistan 20 210,0 20 604,3 23 639,7 17 125,3 19 444,1Umi Emirat Arab/United Arab Emirates 6 711,8 7 988,3 8 062,3 5 815,2 4 102,5Amerika Serikat/United States 9 596,0 11 735,1 11 945,3 11 757,4 7 818,4Inggris/United Kingdom 12 652,3 17 879,6 16 651,6 21 904,4 18 304,4Belanda/Netherlands 6 187,5 4 940,7 4 425,6 1 209,8 1 306,4Jerman/Germany 9 767,3 9 458,1 8 871,2 8 278,8 8 428,5Polandia/Poland 5 972,0 4 976,8 5 662,5 6 136,9 7 545,8Ukraina/Ukraine 1 306,5 2 900,6 1 916,8 2 311,4 1 920,7Rusia/Russia 22 099,1 33 176,0 25 177,8 22 275,9 20 245,5Lainnya/Others 20 278,2 20 774,7 32 219,6 29 025,9 25 972,3
Jumlah/Total 125 053,5 144 423,2 149 605,0 136 429,5 125 007,3
Tabel ––––––
14.2.10Table
http
://www.b
ps.g
o.id
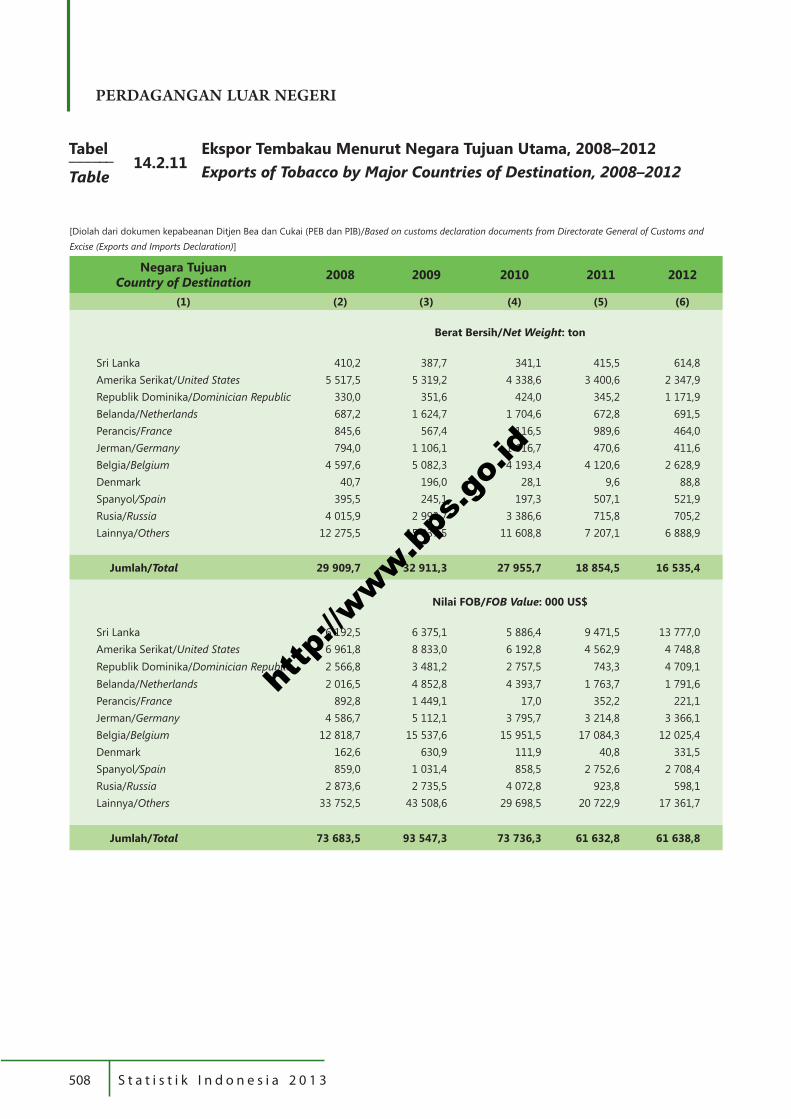
PERDAGANGAN LUAR NEGERI
S t a t i s t i k I n d o n e s i a 2 0 1 3508
Ekspor Tembakau Menurut Negara Tujuan Utama, 2008–2012Exports of Tobacco by Major Countries of Destination, 2008–2012
[Diolah dari dokumen kepabeanan Ditjen Bea dan Cukai (PEB dan PIB)/Based on customs declaration documents from Directorate General of Customs and Excise (Exports and Imports Declaration)]
Negara TujuanCountry of Destination 2008 2009 2010 2011 2012
(1) (2) (3) (4) (5) (6)
Berat Bersih/Net Weight: ton
Sri Lanka 410,2 387,7 341,1 415,5 614,8Amerika Serikat/United States 5 517,5 5 319,2 4 338,6 3 400,6 2 347,9Republik Dominika/Dominician Republic 330,0 351,6 424,0 345,2 1 171,9Belanda/Netherlands 687,2 1 624,7 1 704,6 672,8 691,5Perancis/France 845,6 567,4 116,5 989,6 464,0Jerman/Germany 794,0 1 106,1 1 616,7 470,6 411,6Belgia/Belgium 4 597,6 5 082,3 4 193,4 4 120,6 2 628,9Denmark 40,7 196,0 28,1 9,6 88,8Spanyol/Spain 395,5 245,1 197,3 507,1 521,9Rusia/Russia 4 015,9 2 993,7 3 386,6 715,8 705,2Lainnya/Others 12 275,5 15 037,5 11 608,8 7 207,1 6 888,9
Jumlah/Total 29 909,7 32 911,3 27 955,7 18 854,5 16 535,4
Nilai FOB/FOB Value: 000 US$
Sri Lanka 6 192,5 6 375,1 5 886,4 9 471,5 13 777,0Amerika Serikat/United States 6 961,8 8 833,0 6 192,8 4 562,9 4 748,8Republik Dominika/Dominician Republic 2 566,8 3 481,2 2 757,5 743,3 4 709,1Belanda/Netherlands 2 016,5 4 852,8 4 393,7 1 763,7 1 791,6Perancis/France 892,8 1 449,1 17,0 352,2 221,1Jerman/Germany 4 586,7 5 112,1 3 795,7 3 214,8 3 366,1Belgia/Belgium 12 818,7 15 537,6 15 951,5 17 084,3 12 025,4Denmark 162,6 630,9 111,9 40,8 331,5Spanyol/Spain 859,0 1 031,4 858,5 2 752,6 2 708,4Rusia/Russia 2 873,6 2 735,5 4 072,8 923,8 598,1Lainnya/Others 33 752,5 43 508,6 29 698,5 20 722,9 17 361,7
Jumlah/Total 73 683,5 93 547,3 73 736,3 61 632,8 61 638,8
Tabel ––––––
14.2.11Table
http
://www.b
ps.g
o.id

FOREIGN TRADE
S t a t i s t i c a l Y e a r b o o k o f I n d o n e s i a 2 0 1 3 509
Ekspor Biji Coklat Menurut Negara Tujuan Utama, 2008–2012Exports of Cocoa by Major Countries of Destination, 2008–2012
Tabel ––––––
14.2.12Table
[Diolah dari dokumen kepabeanan Ditjen Bea dan Cukai (PEB dan PIB)/Based on customs declaration documents from Directorate General of Customs and Excise (Exports and Imports Declaration)]
Negara TujuanCountry of Destination 2008 2009 2010 2011 2012
(1) (2) (3) (4) (5) (6)
Berat Bersih/Net Weight: ton
Cina/China 15 928,5 7 147,6 15 394,9 8 764,2 6 962,1Thailand 8 116,2 7 405,5 6 716,3 6 037,0 8 049,4Singapura/Singapore 45 195,5 56 403,4 53 933,3 34 839,4 40 879,4Malaysia 211 470,3 183 539,1 203 847,7 143 296,0 102 350,1Amerika Serikat/United States 53 689,6 120 304,1 89 306,5 9 841,0 143,3Kanada/Canada 13 000,0 5 200,3 3 500,0 5 500,0 0,0India 650,0 1 900,0 4 055,5 4 848,0 7 000,0Belanda/Netherlands 239,6 2 452,0 5 847,5 776,0 510,6Jerman/German 500,7 7 161,4 12 336,5 293,8 369,8Lainnya/Others 33 886,1 48 894,3 38 690,1 543,9 5 721,6
Jumlah/Total 382 676,5 440 407,7 433 628,3 214 739,3 171 986,3
Nilai FOB/FOB Value: 000 US$
Cina/China 35 612,6 17 034,3 42 886,1 25 093,9 13 999,4Thailand 16 722,1 17 845,6 18 476,5 17 206,6 18 719,4Singapura/Singapore 102 534,1 139 342,6 151 485,7 98 497,8 92 884,3Malaysia 470 203,2 451 885,0 551 439,1 411 374,1 228 653,2Amerika Serikat/United States 128 154,1 297 013,2 246 501,3 29 678,3 628,1Kanada/Canada 27 140,4 12 787,9 10 070,0 15 912,2 0,0India 1 341,3 4 541,8 10 752,2 14 032,0 17 036,9Belanda/Netherlands 822,8 5 816,4 15 563,6 2 758,1 1 917,1Jerman/German 1 498,3 20 717,2 35 197,3 1 084,1 1 136,2Lainnya/Others 71 996,5 121 152,4 109 095,1 1 453,5 13 360,8
Jumlah/Total 856 025,4 1 088 136,4 1 191 466,9 617 090,6 388 335,4
http
://www.b
ps.g
o.id

PERDAGANGAN LUAR NEGERI
S t a t i s t i k I n d o n e s i a 2 0 1 3510
Ekspor Ikan Tongkol/Tuna Menurut Negara Tujuan Utama, 2008–2012Exports of Tongkol/Tuna Fish by Major Countries of Destination, 2008–2012
[Diolah dari dokumen kepabeanan Ditjen Bea dan Cukai (PEB dan PIB)/Based on customs declaration documents from Directorate General of Customs and Excise (Exports and Imports Declaration)]
Negara TujuanCountry of Destination 2008 2009 2010 2011 2012
(1) (2) (3) (4) (5) (6)
Berat Bersih/Net Weight: ton
Jepang/Japan 18 921,0 22 557,2 30 282,3 35 010,2 29 236,6Hongkong 2 687,5 1 249,4 283,8 215,8 138,4Taiwan 3 289,8 4 332,7 4 500,3 305,8 255,5Thailand 28 887,4 24 140,7 9 083,5 12 824,8 42 974,2Singapura/Singapore 1 847,7 1 867,1 1 344,2 699,7 360,8Vietnam 7 671,8 5 035,1 3 042,6 2 675,9 3 320,0Australia 129,2 179,5 193,3 130,8 91,5Amerika Serikat/United States 5 395,5 5 526,4 4 536,9 4 117,1 4 515,5Belanda/Netherlands 411,1 108,8 181,6 348,2 156,0Belgia/Belgium 208,6 100,1 257,3 58,5 10,0Lainnya/Others 13 756,2 11 259,5 13 976,7 15 398,1 24 669,3
Jumlah/Total 83 205,8 76 356,5 67 682,5 71 784,9 105 727,8
Nilai FOB/FOB Value: 000 US$
Jepang/Japan 73 718,6 85 395,9 115 440,6 118 234,8 111 055,7Hongkong 3 478,9 1 928,7 572,7 590,9 935,2Taiwan 3 786,6 4 154,6 3 213,6 520,0 216,8Thailand 36 513,1 18 557,4 7 645,6 19 579,9 78 316,3Singapura/Singapore 4 490,5 4 165,9 4 167,8 1 649,9 1 275,4Vietnam 7 120,8 6 946,8 7 515,0 5 856,6 5 982,4Australia 514,5 566,0 811,6 643,1 675,4Amerika Serikat/United States 25 138,4 24 137,0 23 490,8 25 584,6 42 019,6Belanda/Netherlands 261,4 169,0 1 730,0 2 142,3 1 091,6Belgia/Belgium 621,7 466,0 1 309,0 451,7 81,6Lainnya/Others 17 203,2 15 640,2 31 155,7 44 186,5 58 238,0
Jumlah/Total 172 847,7 162 127,5 197 052,4 219 440,3 299 888,0
Tabel ––––––
14.2.13Table
http
://www.b
ps.g
o.id
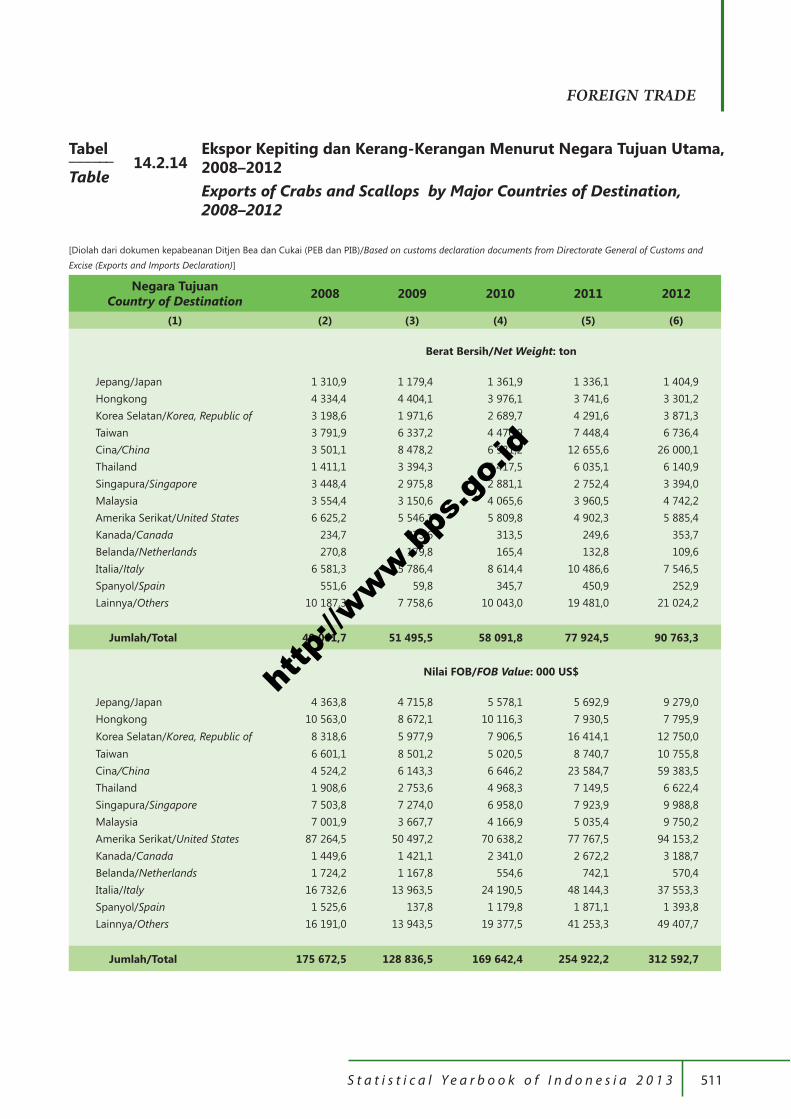
FOREIGN TRADE
S t a t i s t i c a l Y e a r b o o k o f I n d o n e s i a 2 0 1 3 511
Ekspor Kepiting dan Kerang-Kerangan Menurut Negara Tujuan Utama, 2008–2012Exports of Crabs and Scallops by Major Countries of Destination, 2008–2012
[Diolah dari dokumen kepabeanan Ditjen Bea dan Cukai (PEB dan PIB)/Based on customs declaration documents from Directorate General of Customs and Excise (Exports and Imports Declaration)]
Negara TujuanCountry of Destination 2008 2009 2010 2011 2012
(1) (2) (3) (4) (5) (6)
Berat Bersih/Net Weight: ton
Jepang/Japan 1 310,9 1 179,4 1 361,9 1 336,1 1 404,9Hongkong 4 334,4 4 404,1 3 976,1 3 741,6 3 301,2Korea Selatan/Korea, Republic of 3 198,6 1 971,6 2 689,7 4 291,6 3 871,3Taiwan 3 791,9 6 337,2 4 476,9 7 448,4 6 736,4Cina/China 3 501,1 8 478,2 6 931,2 12 655,6 26 000,1Thailand 1 411,1 3 394,3 6 417,5 6 035,1 6 140,9Singapura/Singapore 3 448,4 2 975,8 2 881,1 2 752,4 3 394,0Malaysia 3 554,4 3 150,6 4 065,6 3 960,5 4 742,2Amerika Serikat/United States 6 625,2 5 546,1 5 809,8 4 902,3 5 885,4Kanada/Canada 234,7 273,6 313,5 249,6 353,7Belanda/Netherlands 270,8 179,8 165,4 132,8 109,6Italia/Italy 6 581,3 5 786,4 8 614,4 10 486,6 7 546,5Spanyol/Spain 551,6 59,8 345,7 450,9 252,9Lainnya/Others 10 187,3 7 758,6 10 043,0 19 481,0 21 024,2
Jumlah/Total 49 001,7 51 495,5 58 091,8 77 924,5 90 763,3
Nilai FOB/FOB Value: 000 US$
Jepang/Japan 4 363,8 4 715,8 5 578,1 5 692,9 9 279,0Hongkong 10 563,0 8 672,1 10 116,3 7 930,5 7 795,9Korea Selatan/Korea, Republic of 8 318,6 5 977,9 7 906,5 16 414,1 12 750,0Taiwan 6 601,1 8 501,2 5 020,5 8 740,7 10 755,8Cina/China 4 524,2 6 143,3 6 646,2 23 584,7 59 383,5Thailand 1 908,6 2 753,6 4 968,3 7 149,5 6 622,4Singapura/Singapore 7 503,8 7 274,0 6 958,0 7 923,9 9 988,8Malaysia 7 001,9 3 667,7 4 166,9 5 035,4 9 750,2Amerika Serikat/United States 87 264,5 50 497,2 70 638,2 77 767,5 94 153,2Kanada/Canada 1 449,6 1 421,1 2 341,0 2 672,2 3 188,7Belanda/Netherlands 1 724,2 1 167,8 554,6 742,1 570,4Italia/Italy 16 732,6 13 963,5 24 190,5 48 144,3 37 553,3Spanyol/Spain 1 525,6 137,8 1 179,8 1 871,1 1 393,8Lainnya/Others 16 191,0 13 943,5 19 377,5 41 253,3 49 407,7
Jumlah/Total 175 672,5 128 836,5 169 642,4 254 922,2 312 592,7
Tabel ––––––
14.2.14Table
http
://www.b
ps.g
o.id

PERDAGANGAN LUAR NEGERI
S t a t i s t i k I n d o n e s i a 2 0 1 3512
Ekspor Buah-buahan Menurut Negara Tujuan Utama, 2008–2012Exports of Fruit by Major Countries of Destination, 2008–2012
[Diolah dari dokumen kepabeanan Ditjen Bea dan Cukai (PEB dan PIB)/Based on customs declaration documents from Directorate General of Customs and Excise (Exports and Imports Declaration)]
Negara TujuanCountry of Destination 2008 2009 2010 2011 2012
(1) (2) (3) (4) (5) (6)
Berat Bersih/Net Weight: ton
Hongkong 3 770,3 5 938,9 5 926,3 2 831,3 9 770,7 Cina/China 6 511,8 4 905,4 6 677,4 8 142,6 10 688,9 Singapura/Singapore 19 500,0 31 564,6 39 839,2 31 920,4 34 319,8 Malaysia 7 150,1 4 749,9 5 092,7 4 964,1 5 434,8 Nepal 15 015,9 14 475,3 16 189,0 8 797,0 5 104,1 Vietnam 3 571,6 768,9 474,6 352,7 2 327,7 India 70 672,7 66 756,5 54 773,7 19 487,4 23 675,1 Pakistan 64 648,6 73 026,2 73 773,6 71 948,9 87 013,3 Bangladesh 16 472,3 10 353,1 28 249,4 53 787,2 62 074,4 Iran/Iran (Islamic Republic of) 1 693,7 - 18,0 725,0 0,0 Lainnya/Others 4 962,1 3 474,4 3 277,7 5 993,0 5 848,7
Jumlah/Total 213 969,1 216 013,2 234 291,6 208 949,6 246 257,5
Nilai FOB/FOB Value: 000 US$
Hongkong 2 473,0 4 247,2 4 771,1 2 390,0 7 364,0 Cina/China 3 225,7 2 472,8 5 339,8 7 243,2 10 745,7 Singapura/Singapore 12 061,0 13 745,9 23 472,5 37 850,5 26 105,2 Malaysia 2 294,1 1 611,3 1 593,3 2 062,7 2 264,2 Nepal 7 043,9 6 103,8 7 334,6 7 403,5 3 616,2 Vietnam 2 830,3 387,3 193,4 247,8 1 387,6 India 40 199,6 29 815,7 24 746,3 12 249,5 18 233,7 Pakistan 40 980,0 37 660,5 44 018,8 56 351,4 67 233,9 Bangladesh 9 892,3 5 950,8 17 167,1 40 451,4 40 639,4 Iran/Iran (Islamic Republic of) 780,9 - 9,5 435,2 0,0 Lainnya/Others 3 621,7 2 263,2 3 129,1 6 341,5 5 901,6
Jumlah/Total 125 402,5 104 258,5 131 775,5 173 026,7 183 491,5
Tabel ––––––
14.2.15Table
http
://www.b
ps.g
o.id
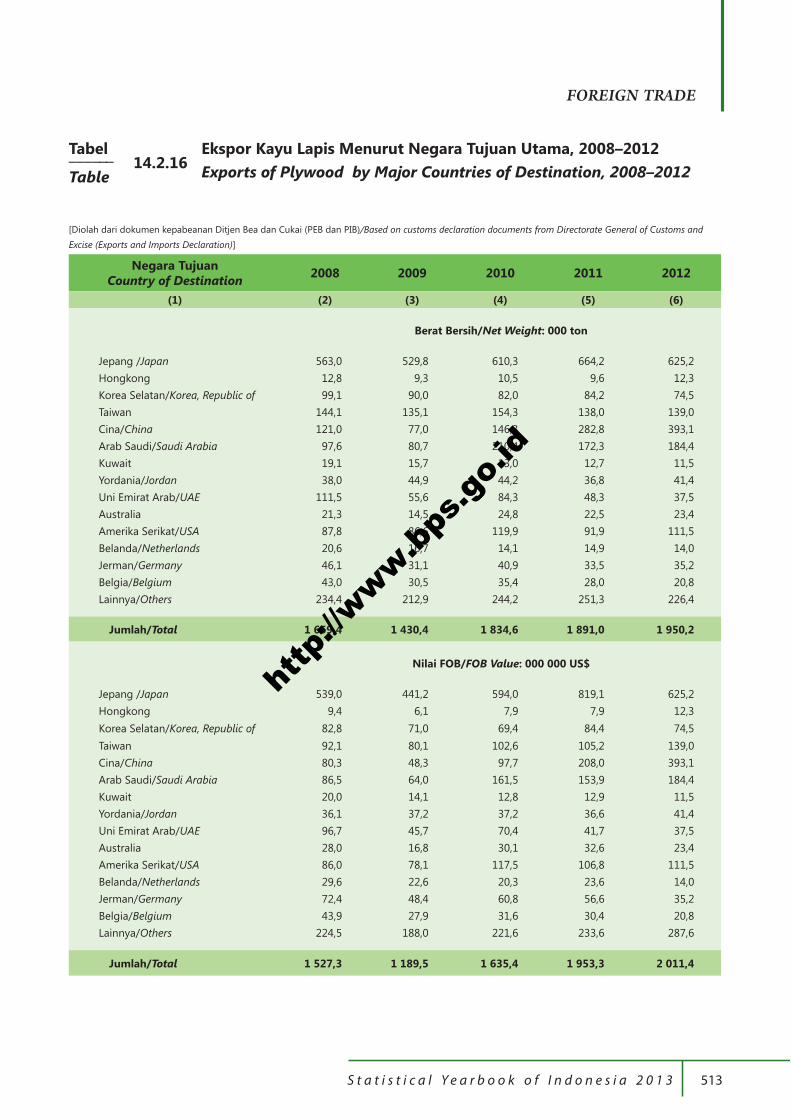
FOREIGN TRADE
S t a t i s t i c a l Y e a r b o o k o f I n d o n e s i a 2 0 1 3 513
Ekspor Kayu Lapis Menurut Negara Tujuan Utama, 2008–2012Exports of Plywood by Major Countries of Destination, 2008–2012
[Diolah dari dokumen kepabeanan Ditjen Bea dan Cukai (PEB dan PIB)/Based on customs declaration documents from Directorate General of Customs and Excise (Exports and Imports Declaration)]
Negara TujuanCountry of Destination 2008 2009 2010 2011 2012
(1) (2) (3) (4) (5) (6)
Berat Bersih/Net Weight: 000 ton
Jepang /Japan 563,0 529,8 610,3 664,2 625,2 Hongkong 12,8 9,3 10,5 9,6 12,3 Korea Selatan/Korea, Republic of 99,1 90,0 82,0 84,2 74,5 Taiwan 144,1 135,1 154,3 138,0 139,0 Cina/China 121,0 77,0 146,3 282,8 393,1 Arab Saudi/Saudi Arabia 97,6 80,7 210,4 172,3 184,4 Kuwait 19,1 15,7 13,0 12,7 11,5 Yordania/Jordan 38,0 44,9 44,2 36,8 41,4 Uni Emirat Arab/UAE 111,5 55,6 84,3 48,3 37,5 Australia 21,3 14,5 24,8 22,5 23,4 Amerika Serikat/USA 87,8 86,6 119,9 91,9 111,5 Belanda/Netherlands 20,6 16,7 14,1 14,9 14,0 Jerman/Germany 46,1 31,1 40,9 33,5 35,2 Belgia/Belgium 43,0 30,5 35,4 28,0 20,8 Lainnya/Others 234,4 212,9 244,2 251,3 226,4
Jumlah/Total 1 659,4 1 430,4 1 834,6 1 891,0 1 950,2
Nilai FOB/FOB Value: 000 000 US$
Jepang /Japan 539,0 441,2 594,0 819,1 625,2 Hongkong 9,4 6,1 7,9 7,9 12,3 Korea Selatan/Korea, Republic of 82,8 71,0 69,4 84,4 74,5 Taiwan 92,1 80,1 102,6 105,2 139,0 Cina/China 80,3 48,3 97,7 208,0 393,1 Arab Saudi/Saudi Arabia 86,5 64,0 161,5 153,9 184,4 Kuwait 20,0 14,1 12,8 12,9 11,5 Yordania/Jordan 36,1 37,2 37,2 36,6 41,4 Uni Emirat Arab/UAE 96,7 45,7 70,4 41,7 37,5 Australia 28,0 16,8 30,1 32,6 23,4 Amerika Serikat/USA 86,0 78,1 117,5 106,8 111,5 Belanda/Netherlands 29,6 22,6 20,3 23,6 14,0 Jerman/Germany 72,4 48,4 60,8 56,6 35,2 Belgia/Belgium 43,9 27,9 31,6 30,4 20,8 Lainnya/Others 224,5 188,0 221,6 233,6 287,6
Jumlah/Total 1 527,3 1 189,5 1 635,4 1 953,3 2 011,4
Tabel ––––––
14.2.16Table
http
://www.b
ps.g
o.id

PERDAGANGAN LUAR NEGERI
S t a t i s t i k I n d o n e s i a 2 0 1 3514
Ekspor Barang dari Tembaga1 Menurut Negara Tujuan Utama, 2008–2012Exports of Cooper Products1 by Major Countries of Destination, 2008–2012
[Diolah dari dokumen kepabeanan Ditjen Bea dan Cukai (PEB dan PIB)/Based on customs declaration documents from Directorate General of Customs and Excise (Exports and Imports Declaration)]
Negara TujuanCountry of Destination 2008 2009 2010 2011 2012
(1) (2) (3) (4) (5) (6)
Berat Bersih/Net Weight: ton
Jepang/Japan 4 642,4 9 221,7 7 023,7 8 670,5 6 353,0 Hongkong 10 026,9 6 737,6 8 461,5 6 943,9 6 181,0 Korea Selatan/Korea, Rep. of 5 782,5 7 074,8 5 424,1 8 433,4 12 720,5 Taiwan 15 912,7 19 592,6 19 441,7 14 984,6 9 378,4 Cina/China 62 810,4 77 140,7 53 305,0 48 048,0 43 422,0 Thailand 58 678,3 58 312,0 73 168,7 66 383,9 45 828,8 Singapura/Singapore 18 818,7 22 118,8 10 716,1 12 708,6 8 633,6 Pilipina/Philippines 13 978,0 9 739,5 12 891,7 10 583,0 14 116,5 Malaysia 77 892,7 97 750,9 104 790,0 77 246,0 65 096,9 Vietnam 8 780,3 11 642,8 16 214,2 22 059,0 18 447,9 India 1 027,0 1 313,8 1 556,4 1 409,3 367,0 Amerika Serikat/USA 3 962,0 1 009,1 966,0 705,2 508,6 Lainnya/Others 2 258,8 3 097,9 4 026,3 8 506,0 6 732,9
Jumlah/Total 284 570,7 324 752,2 317 985,4 286 681,4 237 787,1
Nilai FOB / FOB Value: 000 US$
Jepang/Japan 201 215,6 563 777,3 839 441,9 1 373 076,7 58 858,3 Hongkong 69 289,1 33 854,2 58 107,6 59 612,4 47 638,0 Korea Selatan/Korea, Rep. of 190 933,7 241 053,2 258 314,0 113 468,1 85 618,6 Taiwan 99 851,8 110 076,7 138 379,9 117 321,6 65 334,5 Cina/China 315 538,3 308 801,4 317 749,1 373 528,1 314 240,6 Thailand 422 285,0 304 748,0 548 912,1 597 092,9 365 066,3 Singapura/Singapore 187 384,8 102 718,9 84 542,9 127 436,8 100 209,3 Pilipina/Philippines 110 671,1 55 118,1 96 525,5 98 596,8 116 692,3 Malaysia 518 425,7 557 770,3 805 830,6 694 231,3 531 062,7 Vietnam 61 778,7 62 122,3 111 628,5 164 700,3 140 319,0 India 6 850,7 6 923,7 11 558,3 12 216,7 2 878,1 Amerika Serikat/USA 11 555,9 5 780,8 7 047,2 7 602,8 5 726,2 Lainnya/Others 6 679,2 14 375,7 27 739,0 71 788,2 52 558,4
Jumlah/Total 2 202 459,6 2 367 120,6 3 305 776,6 3 810 672,7 1 886 202,3
Tabel ––––––
14.2.17Table
Catatan/Note: 1 Tidak termasuk bijih tembaga/Exluding copper ore
http
://www.b
ps.g
o.id

FOREIGN TRADE
S t a t i s t i c a l Y e a r b o o k o f I n d o n e s i a 2 0 1 3 515
Ekspor Pakaian Jadi Menurut Negara Tujuan Utama, 2008–2012Exports of Garments by Major Countries of Destination, 2008–2012
[Diolah dari dokumen kepabeanan Ditjen Bea dan Cukai (PEB dan PIB)/Based on customs declaration documents from Directorate General of Customs and Excise (Exports and Imports Declaration)]
Negara TujuanCountry of Destination 2008 2009 2010 2011 2012
(1) (2) (3) (4) (5) (6)
Berat Bersih/Net Weight: ton
Jepang/Japan 9 882,6 10 369,8 12 140,0 20 943,7 27 417,5 Uni Emirat Arab/UAE 12 800,7 9 749,8 10 737,5 11 132,2 12 534,5 Amerika Serikat/USA 229 265,4 220 391,9 261 045,8 249 390,9 238 735,1 Kanada/Canada 6 150,5 5 875,7 8 692,1 8 218,7 7 500,8 Inggris/United Kingdom 19 691,1 18 397,1 18 342,3 16 812,1 14 297,8 Belanda/Netherlands 7 525,7 7 321,7 10 304,0 8 290,4 5 306,5 Perancis/France 6 197,3 6 610,7 6 718,1 6 401,1 10 497,2 Jerman/Germany 27 494,5 24 475,7 25 336,7 26 095,8 22 831,7 Belgia/Belgium 7 963,8 6 089,6 6 259,7 6 422,1 6 158,0 Italia/Italy 3 626,9 2 954,1 3 175,0 3 273,6 2 795,7 Lainnya/Others 86 836,4 81 026,9 82 516,1 93 952,3 102 324,0
Jumlah/Total 417 434,9 393 263,0 445 267,3 450 932,9 450 398,8
Nilai FOB/FOB Value: 000 US$
Jepang/Japan 127 372,6 146 391,2 169 534,1 328 924,9 470 312,6 Uni Emirat Arab/UAE 148 889,4 132 189,9 125 022,2 153 377,0 177 777,5 Amerika Serikat/USA 3 576 817,2 3 330 977,0 3 935 568,3 4 342 369,0 3 872 148,7 Kanada/Canada 124 202,2 111 817,4 142 442,6 178 292,7 154 933,8 Inggris/United Kingdom 333 749,2 324 874,1 331 070,5 351 261,4 319 692,4 Belanda/Netherlands 141 127,6 134 005,7 159 503,2 184 599,0 136 298,0 Perancis/France 113 312,9 107 825,5 119 775,7 141 042,8 108 028,5 Jerman/Germany 505 790,7 464 753,7 502 737,7 624 567,3 541 333,9 Belgia/Belgium 161 469,5 136 221,7 142 173,7 167 431,5 160 552,7 Italia/Italy 81 067,2 72 980,3 75 341,7 91 050,1 241,8 Lainnya/Others 778 265,9 773 559,5 894 939,6 1 238 683,9 1 363 417,6
Jumlah/Total 6 092 064,4 5 735 596,0 6 598 109,3 7 801 599,6 7 304 737,5
Tabel ––––––
14.2.18Table
http
://www.b
ps.g
o.id

PERDAGANGAN LUAR NEGERI
S t a t i s t i k I n d o n e s i a 2 0 1 3516
Ekspor Karet dalam Bentuk Remah Menurut Negara Tujuan Utama, 2008–2012Exports of Crumb Rubber by Major Countries of Destination, 2008–2012
[Diolah dari dokumen kepabeanan Ditjen Bea dan Cukai (PEB dan PIB)/Based on customs declaration documents from Directorate General of Customs and Excise (Exports and Imports Declaration)]
Negara TujuanCountry of Destination 2008 2009 2010 2011 2012
(1) (2) (3) (4) (5) (6)
Berat Bersih/Net Weight: 000 ton
Jepang/Japan 370,3 266,9 307,6 381,6 384,1Korea Selatan/Korea, Republic Of 103,2 98,4 90,1 119,1 141,9Cina/China 299,0 431,1 406,6 394,8 425,8Singapura/Singapore 137,6 93,7 110,3 96,7 57,2Amerika Serikat/USA 589,5 368,5 507,4 570,8 545,6Kanada/Canada 51,1 45,6 65,2 71,5 70,3Brasilia/Brazil 71,5 56,5 107,3 92,3 68,5Perancis/France 45,2 27,1 47,2 64,5 48,1Jerman/Germany 52,5 35,1 54,6 57,8 57,5Spanyol/Spain 35,7 23,2 42,4 58,5 39,3Lainnya/Others 362,6 426,7 490,5 528,0 501,4
Jumlah/Total 2 118,2 1 872,8 2 229,2 2 435,6 2 339,7
Nilai FOB/FOB Value: 000 000 US$
Jepang/Japan 974,1 443,6 954,3 1 758,3 1 237,6Korea Selatan/Korea, Republic Of 278,6 157,5 276,1 540,3 454,6Cina/China 813,1 657,1 1 273,4 1 817,2 1 379,1Singapura/Singapore 343,2 153,9 336,4 437,9 184,7Amerika Serikat/USA 1 547,5 612,6 1 571,9 2 612,8 1 746,1Kanada/Canada 134,9 76,9 204,8 330,3 225,7Brasilia/Brazil 190,9 103,6 340,0 431,1 220,9Perancis/France 119,4 47,5 148,7 301,0 155,3Jerman/Germany 143,1 60,1 171,9 269,6 185,2Spanyol/Spain 94,1 39,4 133,4 273,6 127,3Lainnya/Others 956,3 698,2 1 531,8 2 437,2 1 607,1
Jumlah/Total 5 595,2 3 050,4 6 942,7 11 209,3 7 523,6
Tabel ––––––
14.2.19Table
http
://www.b
ps.g
o.id
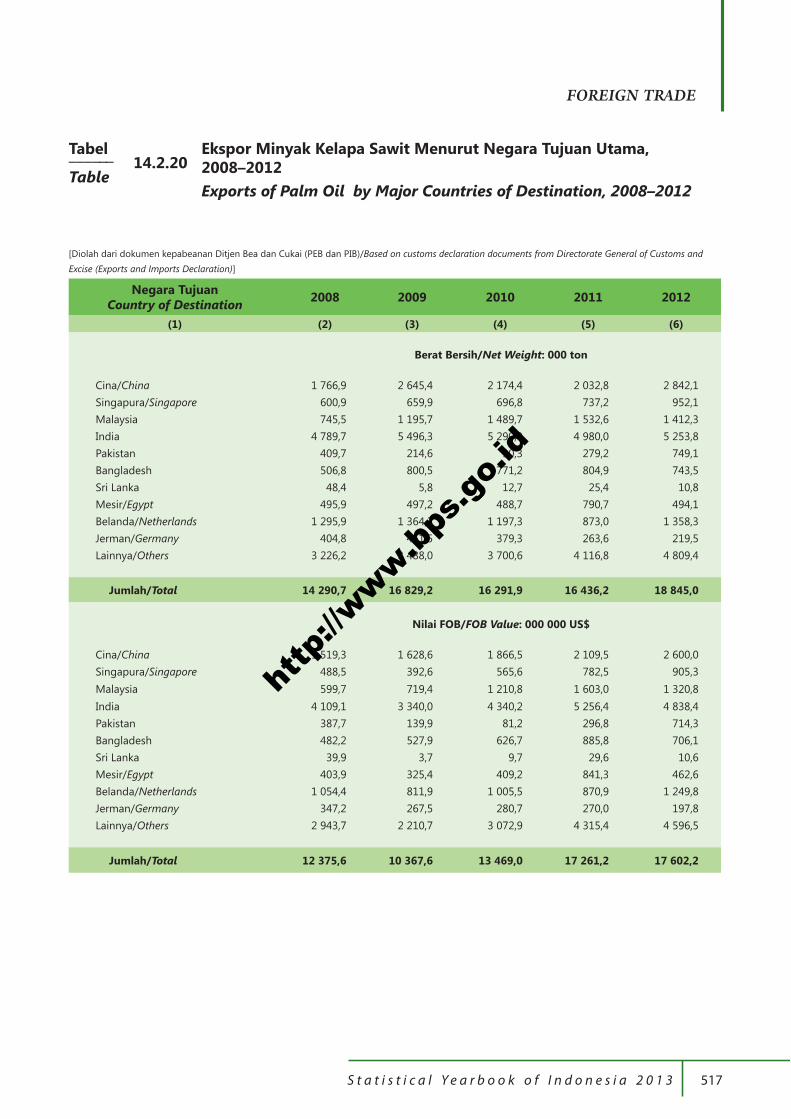
FOREIGN TRADE
S t a t i s t i c a l Y e a r b o o k o f I n d o n e s i a 2 0 1 3 517
Ekspor Minyak Kelapa Sawit Menurut Negara Tujuan Utama, 2008–2012Exports of Palm Oil by Major Countries of Destination, 2008–2012
[Diolah dari dokumen kepabeanan Ditjen Bea dan Cukai (PEB dan PIB)/Based on customs declaration documents from Directorate General of Customs and Excise (Exports and Imports Declaration)]
Negara TujuanCountry of Destination 2008 2009 2010 2011 2012
(1) (2) (3) (4) (5) (6)
Berat Bersih/Net Weight: 000 ton
Cina/China 1 766,9 2 645,4 2 174,4 2 032,8 2 842,1Singapura/Singapore 600,9 659,9 696,8 737,2 952,1Malaysia 745,5 1 195,7 1 489,7 1 532,6 1 412,3India 4 789,7 5 496,3 5 290,9 4 980,0 5 253,8Pakistan 409,7 214,6 90,3 279,2 749,1Bangladesh 506,8 800,5 771,2 804,9 743,5Sri Lanka 48,4 5,8 12,7 25,4 10,8Mesir/Egypt 495,9 497,2 488,7 790,7 494,1Belanda/Netherlands 1 295,9 1 364,3 1 197,3 873,0 1 358,3Jerman/Germany 404,8 461,5 379,3 263,6 219,5Lainnya/Others 3 226,2 3 488,0 3 700,6 4 116,8 4 809,4
Jumlah/Total 14 290,7 16 829,2 16 291,9 16 436,2 18 845,0
Nilai FOB/FOB Value: 000 000 US$
Cina/China 1 519,3 1 628,6 1 866,5 2 109,5 2 600,0Singapura/Singapore 488,5 392,6 565,6 782,5 905,3Malaysia 599,7 719,4 1 210,8 1 603,0 1 320,8India 4 109,1 3 340,0 4 340,2 5 256,4 4 838,4Pakistan 387,7 139,9 81,2 296,8 714,3Bangladesh 482,2 527,9 626,7 885,8 706,1Sri Lanka 39,9 3,7 9,7 29,6 10,6Mesir/Egypt 403,9 325,4 409,2 841,3 462,6Belanda/Netherlands 1 054,4 811,9 1 005,5 870,9 1 249,8Jerman/Germany 347,2 267,5 280,7 270,0 197,8Lainnya/Others 2 943,7 2 210,7 3 072,9 4 315,4 4 596,5
Jumlah/Total 12 375,6 10 367,6 13 469,0 17 261,2 17 602,2
Tabel ––––––
14.2.20Table
http
://www.b
ps.g
o.id
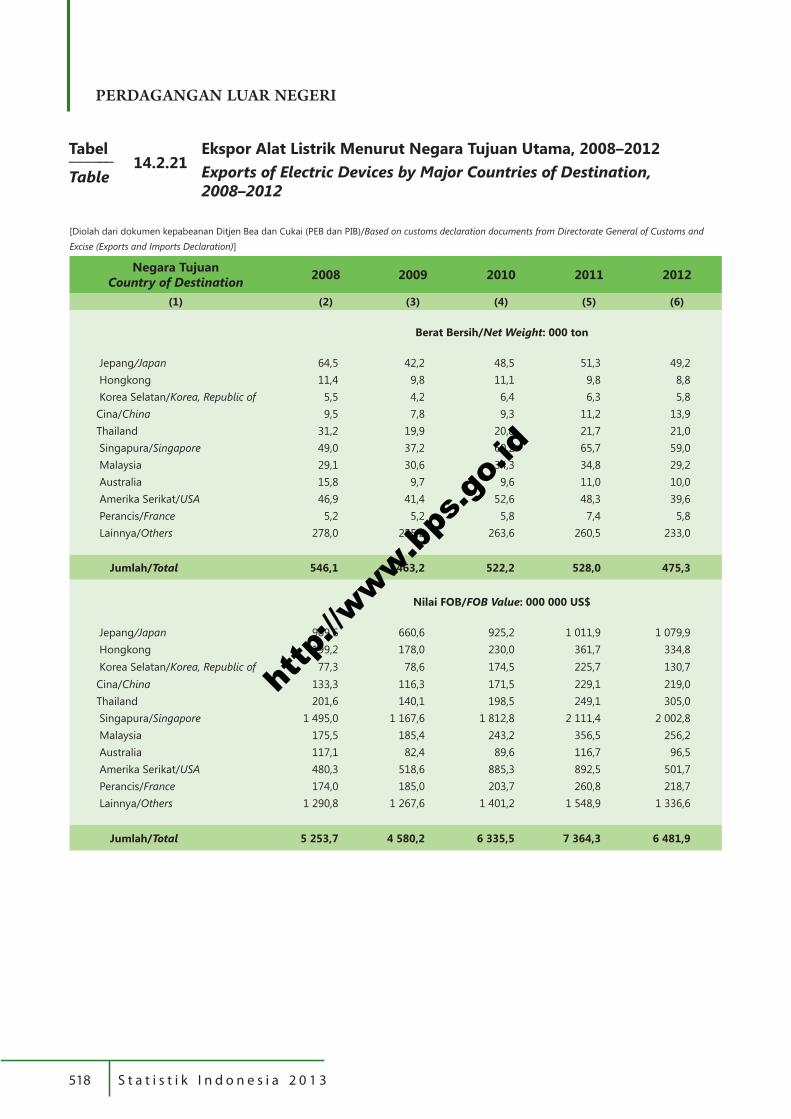
PERDAGANGAN LUAR NEGERI
S t a t i s t i k I n d o n e s i a 2 0 1 3518
Ekspor Alat Listrik Menurut Negara Tujuan Utama, 2008–2012Exports of Electric Devices by Major Countries of Destination, 2008–2012
[Diolah dari dokumen kepabeanan Ditjen Bea dan Cukai (PEB dan PIB)/Based on customs declaration documents from Directorate General of Customs and Excise (Exports and Imports Declaration)]
Negara TujuanCountry of Destination 2008 2009 2010 2011 2012
(1) (2) (3) (4) (5) (6)
Berat Bersih/Net Weight: 000 ton
Jepang/Japan 64,5 42,2 48,5 51,3 49,2 Hongkong 11,4 9,8 11,1 9,8 8,8 Korea Selatan/Korea, Republic of 5,5 4,2 6,4 6,3 5,8Cina/China 9,5 7,8 9,3 11,2 13,9Thailand 31,2 19,9 20,8 21,7 21,0 Singapura/Singapore 49,0 37,2 60,2 65,7 59,0 Malaysia 29,1 30,6 34,3 34,8 29,2 Australia 15,8 9,7 9,6 11,0 10,0 Amerika Serikat/USA 46,9 41,4 52,6 48,3 39,6 Perancis/France 5,2 5,2 5,8 7,4 5,8 Lainnya/Others 278,0 255,2 263,6 260,5 233,0
Jumlah/Total 546,1 463,2 522,2 528,0 475,3
Nilai FOB/FOB Value: 000 000 US$
Jepang/Japan 909,6 660,6 925,2 1 011,9 1 079,9 Hongkong 199,2 178,0 230,0 361,7 334,8 Korea Selatan/Korea, Republic of 77,3 78,6 174,5 225,7 130,7Cina/China 133,3 116,3 171,5 229,1 219,0Thailand 201,6 140,1 198,5 249,1 305,0 Singapura/Singapore 1 495,0 1 167,6 1 812,8 2 111,4 2 002,8 Malaysia 175,5 185,4 243,2 356,5 256,2 Australia 117,1 82,4 89,6 116,7 96,5 Amerika Serikat/USA 480,3 518,6 885,3 892,5 501,7 Perancis/France 174,0 185,0 203,7 260,8 218,7 Lainnya/Others 1 290,8 1 267,6 1 401,2 1 548,9 1 336,6
Jumlah/Total 5 253,7 4 580,2 6 335,5 7 364,3 6 481,9
Tabel ––––––
14.2.21Table
http
://www.b
ps.g
o.id

FOREIGN TRADE
S t a t i s t i c a l Y e a r b o o k o f I n d o n e s i a 2 0 1 3 519
Ekspor Audio Visual Menurut Negara Tujuan Utama, 2008–2012Exports of Audio Visual by Major Countries of Destination, 2008–2012
[Diolah dari dokumen kepabeanan Ditjen Bea dan Cukai (PEB dan PIB)/Based on customs declaration documents from Directorate General of Customs and Excise (Exports and Imports Declaration)]
Negara TujuanCountry of Destination 2008 2009 2010 2011 2012
(1) (2) (3) (4) (5) (6)
Berat Bersih/Net Weight: 000 ton
Jepang/Japan 8,2 6,9 9,3 6,8 7,7Hongkong 2,9 2,9 3,3 3,3 3,0Korea Selatan/Korea, Republic of 1,7 2,7 3,2 3,5 6,3Singapura/Singapore 13,9 11,2 14,6 13,7 11,3Uni Emirat Arab/UAE 6,2 8,0 5,2 5,6 4,4Amerika Serikat/USA 12,8 17,5 14,2 10,4 16,2Belanda/Netherlands 2,7 3,2 3,3 3,5 2,9Jerman/Germany 5,4 5,6 6,5 4,9 5,0Belgia/Belgium 7,3 5,8 4,8 3,8 3,2Finlandia/Finland 0,3 0,1 0,5 0,7 1,1Lainnya/Others 47,9 75,5 77,8 80,4 77,3
Jumlah/Total 109,3 139,4 142,7 136,6 138,4
Nilai FOB/FOB Value: 000 000 US$
Jepang/Japan 247,4 205,7 252,0 159,0 197,8Hongkong 192,2 181,2 241,3 355,7 327,7Korea Selatan/Korea, Republic of 136,1 155,4 148,0 119,6 248,9Singapura/Singapore 452,6 287,7 374,4 399,9 347,7Uni Emirat Arab/UAE 101,5 106,6 92,4 99,7 84,0Amerika Serikat/USA 451,6 628,0 488,5 385,8 587,6Belanda/Netherlands 128,3 147,5 103,9 196,7 143,8Jerman/Germany 88,9 153,4 166,5 101,2 137,9Belgia/Belgium 134,9 87,4 116,7 80,2 77,3Finlandia/Finland 3,5 1,4 3,5 4,4 6,2Lainnya/Others 930,2 1 477,7 1 888,2 1 724,1 1 810,7
Jumlah/Total 2 867,2 3 432,0 3 875,4 3 626,3 3 969,6
Tabel ––––––
14.2.22Table
http
://www.b
ps.g
o.id

PERDAGANGAN LUAR NEGERI
S t a t i s t i k I n d o n e s i a 2 0 1 3520
Ekspor Kertas dan Barang dari Kertas Menurut Negara Tujuan Utama, 2008–2012Exports of Paper and Its Product by Major Countries of Destination, 2008–2012
[Diolah dari dokumen kepabeanan Ditjen Bea dan Cukai (PEB dan PIB)/Based on customs declaration documents from Directorate General of Customs and Excise (Exports and Imports Declaration)]
Negara TujuanCountry of Destination 2008 2009 2010 2011 2012
(1) (2) (3) (4) (5) (6)
Berat Bersih/Net Weight: 000 ton
Jepang/Japan 329,1 449,6 447,5 487,2 515,0 Hongkong 106,4 114,4 80,6 86,5 87,5 Taiwan 142,8 130,8 117,1 140,9 155,7 Cina/China 253,7 237,7 193,8 237,9 170,2 Singapura/Singapore 196,7 179,1 132,5 180,1 182,1 Malaysia 338,0 378,5 343,0 384,4 398,7 Vietnam 186,4 247,0 258,9 287,9 307,0 Iran/Iran (Islamic Republic of) 171,9 98,7 101,3 114,3 87,4 Australia 179,9 147,4 168,0 141,7 125,8 Amerika Serikat/USA 275,2 285,3 267,1 249,0 270,1 Lainnya/Others 1 905,3 2 018,3 2 452,8 1 991,0 1 930,2
Jumlah/Total 4 085,4 4 286,8 4 562,6 4 300,9 4 229,7
Nilai FOB/FOB Value: 000 000 US$
Jepang/Japan 347,8 403,4 447,5 574,4 623,4 Hongkong 94,0 83,6 80,6 77,4 73,7 Taiwan 102,9 72,4 117,1 115,1 125,0 Cina/China 195,7 157,5 193,8 196,5 143,1 Singapura/Singapore 155,0 116,1 132,5 143,3 129,3 Malaysia 301,9 271,1 343,0 347,4 338,9 Vietnam 158,0 181,1 258,9 247,6 236,8 Iran/Iran (Islamic Republic of) 154,0 75,9 101,3 101,7 74,6 Australia 192,5 138,0 168,0 161,9 146,5 Amerika Serikat/USA 285,5 270,3 267,1 263,0 277,9 Lainnya/Others 1 809,6 1 635,6 2 132,0 1 986,2 1 802,9
Jumlah/Total 3 796,9 3 405,0 4 241,8 4 214,5 3 972,1
Tabel ––––––
14.2.23Table
http
://www.b
ps.g
o.id
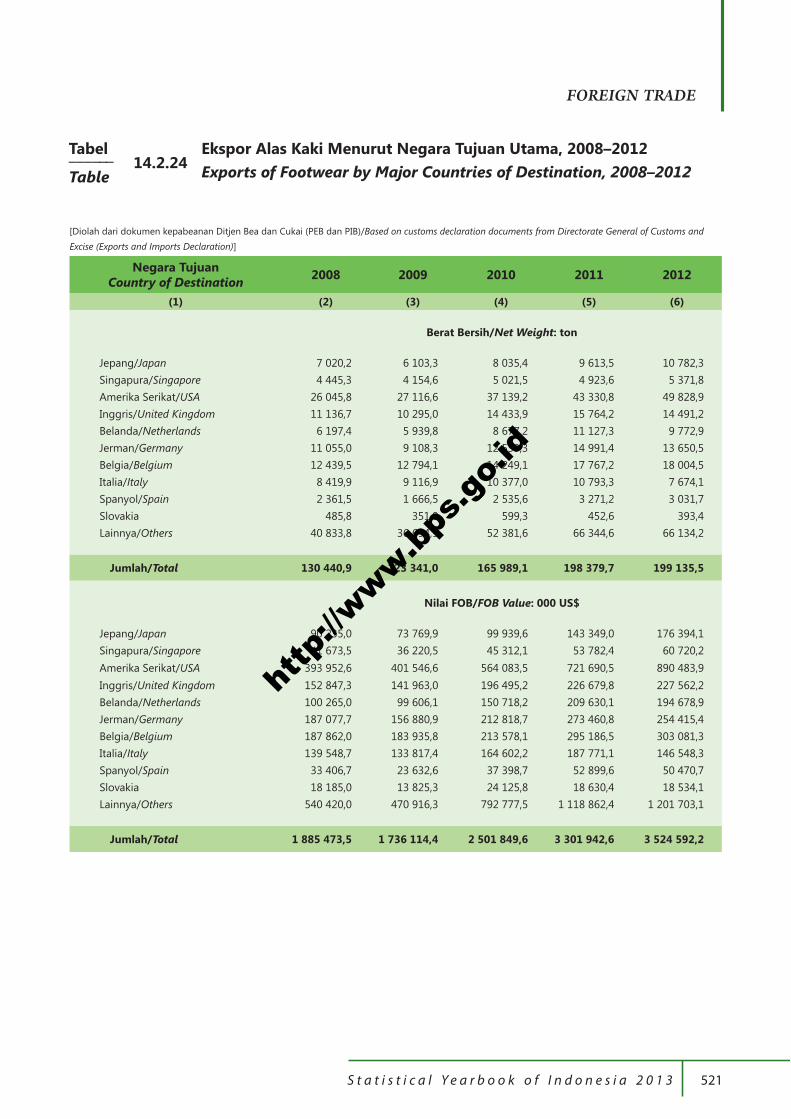
FOREIGN TRADE
S t a t i s t i c a l Y e a r b o o k o f I n d o n e s i a 2 0 1 3 521
Ekspor Alas Kaki Menurut Negara Tujuan Utama, 2008–2012Exports of Footwear by Major Countries of Destination, 2008–2012
[Diolah dari dokumen kepabeanan Ditjen Bea dan Cukai (PEB dan PIB)/Based on customs declaration documents from Directorate General of Customs and Excise (Exports and Imports Declaration)]
Negara TujuanCountry of Destination 2008 2009 2010 2011 2012
(1) (2) (3) (4) (5) (6)
Berat Bersih/Net Weight: ton
Jepang/Japan 7 020,2 6 103,3 8 035,4 9 613,5 10 782,3 Singapura/Singapore 4 445,3 4 154,6 5 021,5 4 923,6 5 371,8 Amerika Serikat/USA 26 045,8 27 116,6 37 139,2 43 330,8 49 828,9 Inggris/United Kingdom 11 136,7 10 295,0 14 433,9 15 764,2 14 491,2 Belanda/Netherlands 6 197,4 5 939,8 8 677,2 11 127,3 9 772,9 Jerman/Germany 11 055,0 9 108,3 12 539,3 14 991,4 13 650,5 Belgia/Belgium 12 439,5 12 794,1 14 249,1 17 767,2 18 004,5 Italia/Italy 8 419,9 9 116,9 10 377,0 10 793,3 7 674,1 Spanyol/Spain 2 361,5 1 666,5 2 535,6 3 271,2 3 031,7 Slovakia 485,8 351,0 599,3 452,6 393,4 Lainnya/Others 40 833,8 36 694,9 52 381,6 66 344,6 66 134,2
Jumlah/Total 130 440,9 123 341,0 165 989,1 198 379,7 199 135,5
Nilai FOB/FOB Value: 000 US$
Jepang/Japan 90 235,0 73 769,9 99 939,6 143 349,0 176 394,1 Singapura/Singapore 41 673,5 36 220,5 45 312,1 53 782,4 60 720,2 Amerika Serikat/USA 393 952,6 401 546,6 564 083,5 721 690,5 890 483,9 Inggris/United Kingdom 152 847,3 141 963,0 196 495,2 226 679,8 227 562,2 Belanda/Netherlands 100 265,0 99 606,1 150 718,2 209 630,1 194 678,9 Jerman/Germany 187 077,7 156 880,9 212 818,7 273 460,8 254 415,4 Belgia/Belgium 187 862,0 183 935,8 213 578,1 295 186,5 303 081,3 Italia/Italy 139 548,7 133 817,4 164 602,2 187 771,1 146 548,3 Spanyol/Spain 33 406,7 23 632,6 37 398,7 52 899,6 50 470,7 Slovakia 18 185,0 13 825,3 24 125,8 18 630,4 18 534,1 Lainnya/Others 540 420,0 470 916,3 792 777,5 1 118 862,4 1 201 703,1
Jumlah/Total 1 885 473,5 1 736 114,4 2 501 849,6 3 301 942,6 3 524 592,2
Tabel ––––––
14.2.24Table
http
://www.b
ps.g
o.id

PERDAGANGAN LUAR NEGERI
S t a t i s t i k I n d o n e s i a 2 0 1 3522
Ekspor Komputer dan Bagiannya Menurut Negara Tujuan Utama, 2008–2012Exports of Computer and Its Components by Major Countries of Destination, 2008–2012
[Diolah dari dokumen kepabeanan Ditjen Bea dan Cukai (PEB dan PIB)/Based on customs declaration documents from Directorate General of Customs and Excise (Exports and Imports Declaration)]
Negara TujuanCountry of Destination 2008 2009 2010 2011 2012
(1) (2) (3) (4) (5) (6)
Berat Bersih/Net Weight: ton
Jepang/Japan 2 465,5 1 509,5 1 207,7 791,0 922,3 Hongkong 2 003,3 2 527,6 908,8 1 627,9 1 792,3 Korea Selatan/Korea, Republic of 413,2 216,7 388,2 134,5 32,7 Taiwan 439,7 340,4 437,3 254,0 33,1 Cina/China 6 362,5 3 653,3 2 110,3 607,4 2 329,3 Thailand 1 049,8 1 141,2 1 087,3 1 357,9 553,8 Singapura/Singapore 8 567,0 7 742,2 12 219,1 11 603,2 9 781,7 Amerika Serikat/USA 3 216,8 2 557,1 2 450,5 2 002,5 2 495,8 Belanda/Netherlands 4 698,3 2 226,1 1 017,2 1 019,4 751,0 Jerman/Germany 227,9 1 271,0 1 646,7 1 373,6 1 246,2 Lainnya/Others 8 663,6 12 620,2 9 723,8 6 562,0 4 779,6
Jumlah/Total 38 107,6 35 805,3 33 196,9 27 333,4 24 717,8
Nilai FOB/FOB Value: 000 US$
Jepang/Japan 157 764,5 48 101,7 40 267,2 27 251,0 29 712,2 Hongkong 21 910,2 33 061,0 13 780,2 14 545,0 63 481,8 Korea Selatan/Korea, Republic of 4 022,8 3 794,4 18 886,8 6 495,9 832,5 Taiwan 5 780,3 6 500,4 11 805,4 6 601,3 1 171,1 Cina/China 150 202,5 118 562,8 36 790,0 18 378,9 35 840,3 Thailand 23 535,5 29 176,2 28 712,1 28 371,8 18 754,1 Singapura/Singapore 195 021,8 244 587,0 426 156,5 375 394,0 313 230,4 Amerika Serikat/USA 67 778,1 71 613,5 51 713,6 48 712,0 59 216,8 Belanda/Netherlands 78 854,4 48 980,2 20 747,0 26 524,9 15 837,7 Jerman/Germany 8 719,7 29 250,5 28 503,6 22 974,1 19 467,8 Lainnya/Others 150 963,0 246 806,0 196 101,9 142 951,1 133 993,6
Jumlah/Total 864 552,8 880 433,7 873 464,3 718 200,0 691 538,3
Tabel ––––––
14.2.25Table
http
://www.b
ps.g
o.id

FOREIGN TRADE
S t a t i s t i c a l Y e a r b o o k o f I n d o n e s i a 2 0 1 3 523
Ekspor Bijih Tembaga Menurut Negara Tujuan Utama, 2008–2012Exports of Copper Ore by Major Countries of Destination, 2008–2012
[Diolah dari dokumen kepabeanan Ditjen Bea dan Cukai (PEB dan PIB)/Based on customs declaration documents from Directorate General of Customs and Excise (Exports and Imports Declaration)]
Negara TujuanCountry of Destination 2008 2009 2010 2011 2012
(1) (2) (3) (4) (5) (6)
Berat Bersih/Net Weight: 000 ton
Jepang/Japan 749,6 961,2 1 120,5 330,3 418,5 Korea Selatan/Korea, Republic of 300,7 463,6 441,1 326,2 175,3 Cina/China 12,5 66,5 127,8 160,7 83,8 Filipina/Philippines 143,8 169,4 92,0 100,1 87,7 India 135,4 275,2 354,4 311,8 171,9 Jerman/Germany – 44,0 88,1 62,7 51,7 Spanyol/Spain 284,8 339,6 395,0 131,7 132,4 Lainnya/Others 0,2 10,8 23,2 48,1 3,1
Jumlah/Total 1 627,0 2 330,3 2 642,1 1 471,6 1 124,4
Nilai FOB/FOB Value: 000 000 US$
Jepang/Japan 1 546,6 2 075,0 2 876,3 1 043,5 958,4 Korea Selatan/Korea, Republic of 593,2 1 021,8 1 129,0 1 029,9 368,1 Cina/China 27,8 131,5 331,3 472,6 190,5 Filipina/Philippines 305,2 363,2 208,8 349,9 190,1 India 273,1 636,2 973,7 1 041,0 450,6 Jerman/Germany – 93,8 222,6 167,3 91,0 Spanyol/Spain 598,7 767,5 1 083,9 446,7 345,7 Lainnya/Others 0,0 12,3 56,6 149,7 1,0
Jumlah/Total 3 344,6 5 101,3 6 882,2 4 700,6 2 595,4
Tabel ––––––
14.2.26Table
http
://www.b
ps.g
o.id

PERDAGANGAN LUAR NEGERI
S t a t i s t i k I n d o n e s i a 2 0 1 3524
Ekspor Bijih Nikel Menurut Negara Tujuan Utama, 2008–2012Exports of Nickel Ore by Major Countries of Destination, 2008–2012
[Diolah dari dokumen kepabeanan Ditjen Bea dan Cukai (PEB dan PIB)/Based on customs declaration documents from Directorate General of Customs and Excise (Exports and Imports Declaration)]
Negara TujuanCountry of Destination 2008 2009 2010 2011 2012
(1) (2) (3) (4) (5) (6)
Berat Bersih/Net Weight: ton
Jepang/Japan 1 826 351,1 1 459 011,4 1 453 681,6 1 861 407,7 1 552 241,3Cina/China 6 594 319,2 7 604 354,0 14 346 464,2 36 142 280,6 43 095 682,4Australia 505 194,8 – 844 789,0 956 954,0 1 454 765,0Swiss/Switzerland 243 086,0 – 50 179,0 – -Yunani/Greece 348 193,2 389 706,1 240 937,9 573 617,4 643 872,4Ukraina/Ukraine 1 012 454,0 532 464,0 629 979,7 710 054,1 1 200 768,3Lainnya/Others 62 553,0 451 591,0 16,0 547 851,0 502 062,7
Jumlah/Total 10 592 151,3 10 437 126,5 17 566 047,4 40 792 164,8 48 449 392,1
Nilai FOB/ FOB Value: 000 US$
Jepang/Japan 171 112,8 72 693,6 99 009,0 140 467,7 102 301,6Cina/China 230 921,4 151 984,3 348 397,4 1 162 069,1 1 252 775,9Australia 16 813,8 – 17 136,5 21 001,4 27 304,9Swiss/Switzerland 16 795,7 – 1 455,2 – -Yunani/Greece 21 468,3 10 755,3 18 629,3 25 589,5 32 226,6Ukraina/Ukraine 65 544,9 31 504,5 47 818,3 59 477,8 60 948,1Lainnya/Others 1 602,6 10 631,5 0,4 19 434,6 13 527,2
Jumlah/Total 524 259,5 277 569,2 532 446,1 1 428 040,1 1 489 084,3
Tabel ––––––
14.2.27Table
http
://www.b
ps.g
o.id
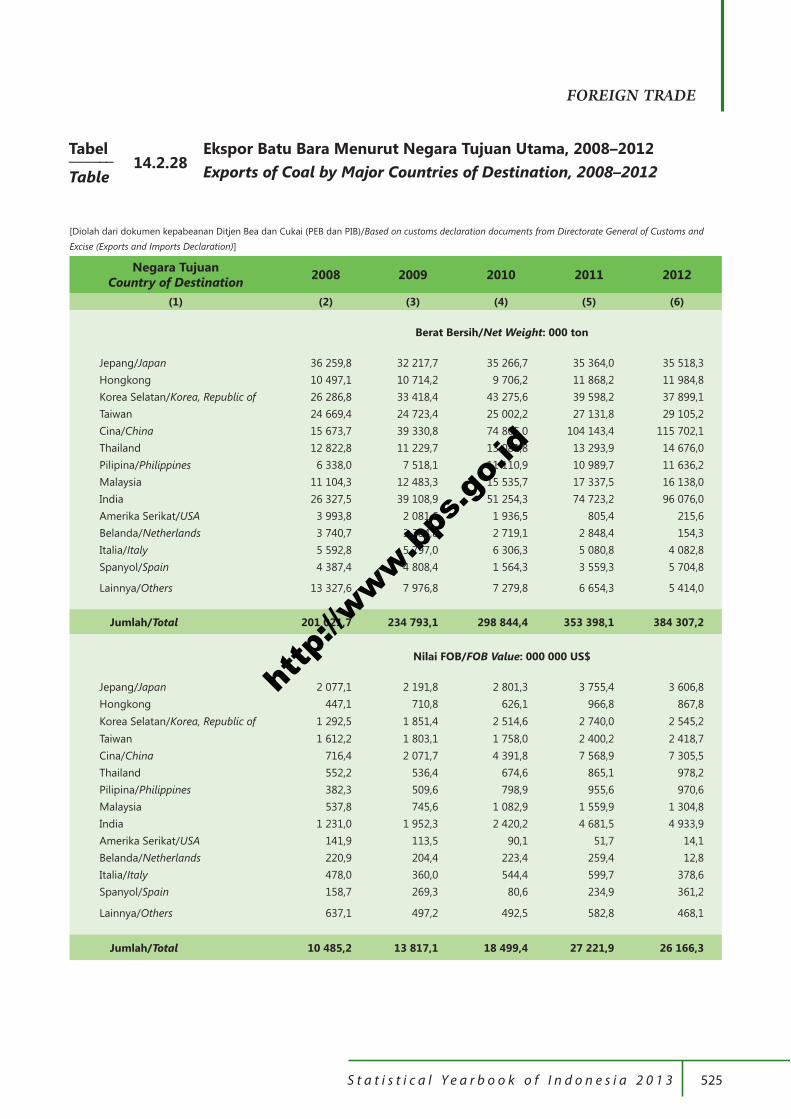
FOREIGN TRADE
S t a t i s t i c a l Y e a r b o o k o f I n d o n e s i a 2 0 1 3 525
Ekspor Batu Bara Menurut Negara Tujuan Utama, 2008–2012Exports of Coal by Major Countries of Destination, 2008–2012
[Diolah dari dokumen kepabeanan Ditjen Bea dan Cukai (PEB dan PIB)/Based on customs declaration documents from Directorate General of Customs and Excise (Exports and Imports Declaration)]
Negara TujuanCountry of Destination 2008 2009 2010 2011 2012
(1) (2) (3) (4) (5) (6)
Berat Bersih/Net Weight: 000 ton
Jepang/Japan 36 259,8 32 217,7 35 266,7 35 364,0 35 518,3 Hongkong 10 497,1 10 714,2 9 706,2 11 868,2 11 984,8 Korea Selatan/Korea, Republic of 26 286,8 33 418,4 43 275,6 39 598,2 37 899,1 Taiwan 24 669,4 24 723,4 25 002,2 27 131,8 29 105,2 Cina/China 15 673,7 39 330,8 74 805,0 104 143,4 115 702,1 Thailand 12 822,8 11 229,7 13 081,8 13 293,9 14 676,0 Pilipina/Philippines 6 338,0 7 518,1 11 110,9 10 989,7 11 636,2 Malaysia 11 104,3 12 483,3 15 535,7 17 337,5 16 138,0 India 26 327,5 39 108,9 51 254,3 74 723,2 96 076,0 Amerika Serikat/USA 3 993,8 2 081,6 1 936,5 805,4 215,6 Belanda/Netherlands 3 740,7 3 384,8 2 719,1 2 848,4 154,3 Italia/Italy 5 592,8 5 797,0 6 306,3 5 080,8 4 082,8 Spanyol/Spain 4 387,4 4 808,4 1 564,3 3 559,3 5 704,8
Lainnya/Others 13 327,6 7 976,8 7 279,8 6 654,3 5 414,0
Jumlah/Total 201 021,7 234 793,1 298 844,4 353 398,1 384 307,2
Nilai FOB/FOB Value: 000 000 US$
Jepang/Japan 2 077,1 2 191,8 2 801,3 3 755,4 3 606,8 Hongkong 447,1 710,8 626,1 966,8 867,8 Korea Selatan/Korea, Republic of 1 292,5 1 851,4 2 514,6 2 740,0 2 545,2 Taiwan 1 612,2 1 803,1 1 758,0 2 400,2 2 418,7 Cina/China 716,4 2 071,7 4 391,8 7 568,9 7 305,5 Thailand 552,2 536,4 674,6 865,1 978,2 Pilipina/Philippines 382,3 509,6 798,9 955,6 970,6 Malaysia 537,8 745,6 1 082,9 1 559,9 1 304,8 India 1 231,0 1 952,3 2 420,2 4 681,5 4 933,9 Amerika Serikat/USA 141,9 113,5 90,1 51,7 14,1 Belanda/Netherlands 220,9 204,4 223,4 259,4 12,8 Italia/Italy 478,0 360,0 544,4 599,7 378,6 Spanyol/Spain 158,7 269,3 80,6 234,9 361,2
Lainnya/Others 637,1 497,2 492,5 582,8 468,1
Jumlah/Total 10 485,2 13 817,1 18 499,4 27 221,9 26 166,3
Tabel ––––––
14.2.28Table
http
://www.b
ps.g
o.id

PERDAGANGAN LUAR NEGERI
S t a t i s t i k I n d o n e s i a 2 0 1 3526
[Diolah dari dokumen kepabeanan Ditjen Bea dan Cukai (PEB dan PIB)/Based on customs declaration documents from Directorate General of Customs and Excise (Exports and Imports Declaration)]
Negara AsalCountry of Origin 2008 2009 2010 2011 2012
(1) (2) (3) (4) (5) (6)ASIA
ASEAN 34 628,5 29 981,7 36 380,5 40 962,8 43 373,4Thailand 4 779,4 4 240,7 5 006,5 7 260,3 8 403,1Singapura/Singapore 15 973,7 14 472,8 17 691,9 19 218,1 19 163,0Filipina/Philippines 342,0 287,0 323,8 319,3 199,9Malaysia 9 567,2 8 817,2 11 208,7 9 817,2 11 456,5Myanmar 73,4 50,5 39,0 117,3 78,5Kamboja/Cambodia 0,3 5,3 2,3 2,0 11,6Brunei Darussalam 3 077,0 1 413,6 1 106,6 1 237,0 511,2Laos/Lao People’s Dem. Rep, 0,1 0,3 0,3 0,5 1,0Vietnam 815,4 694,3 1 001,4 2 991,1 3 548,6
Asia Lainnya/Rest of AsiaJepang/Japan 3 869,7 2 638,7 3 976,9 4 121,1 4 765,1Cina/China 9 895,0 8 044,2 10 554,4 12 147,4 14 460,6Korea Selatan/Korea, Republic of 4 148,2 3 506,9 5 315,4 9 074,2 7 871,2Lainnya/Others 16 644,8 16 888,2 18 121,2 20 615,0 21 959,0
AFRIKA / AFRICA 3 063,3 4 241,4 4 096,5 5 055,5 7 241,2
AUSTRALIA & OCEANIAAustralia 5 894,2 6 837,6 7 523,5 8 156,3 9 126,3Selandia Baru/New Zealand 624,0 647,9 571,2 537,6 585,1Oceania Lainnya/Rest of Oceania 29,5 70,6 35,6 71,4 80,1
AMERIKA / AMERICANAFTA 8 497,8 6 648,7 8 169,4 9 701,4 8 983,5
Amerika Serikat/United States 5 687,9 4 876,7 6 109,9 6 465,5 6 097,5Kanada/Canada 2 754,0 1 714,8 1 997,8 3 138,2 2 758,9Meksiko/Mexico 55,9 57,2 61,7 97,7 127,1
Amerika Lainnya/Rest of America 4 849,4 4 604,3 7 398,6 7 585,5 6 682,4
EROPA/EUROPEUni Eropa/European Union 2 3 143,7 3 417,5 3 702,3 4 021,9 4 151,1
Inggris/United Kingdom 567,4 657,4 579,4 766,5 666,7Belanda/Netherlands 386,5 369,7 430,4 317,4 315,7Perancis/France 274,9 266,2 341,7 409,3 522,7Jerman/Germany 758,0 712,8 728,0 790,1 877,5Austria 45,1 35,2 44,2 71,0 42,4Belgia/Belgium 376,5 459,0 401,6 336,7 337,5Denmark 12,9 20,7 26,6 28,6 43,6Swedia/Sweden 184,7 188,3 158,5 187,6 252,7Finlandia/Finland 69,9 63,6 61,3 69,4 65,7Irlandia/Ireland 22,5 11,7 24,6 43,0 36,2Italia/Italy 220,8 347,7 427,8 414,2 468,6Spanyol/Spain 79,7 69,8 123,9 110,8 120,9Uni Eropa Lainnya 144,8 215,4 354,3 477,3 400,9Others of European Union
Eropa Lainnya/Rest of Europe 3 376,2 3 826,7 4 855,5 6 171,5 7 004,6
Jumlah/Total 98 664,3 91 354,4 110 701,0 128 221,6 136 283,6
Volume Impor Menurut Negara Asal Utama 1 (Berat bersih:ribu ton), 2008–2012Volume of Imports by Major Countries of Origin 1 (Net weight: thousand tons), 2008–2012
Catatan/Note: 1 Termasuk Kawasan Berikat/Including Bounded Zones 2 Sejak Januari 2007 Uni Eropa menjadi 27 negara/Since January 2007 the European Union comprises 27 countries
Tabel ––––––
14.3.1Table
14.3 IMPOR IMPORTS
http
://www.b
ps.g
o.id
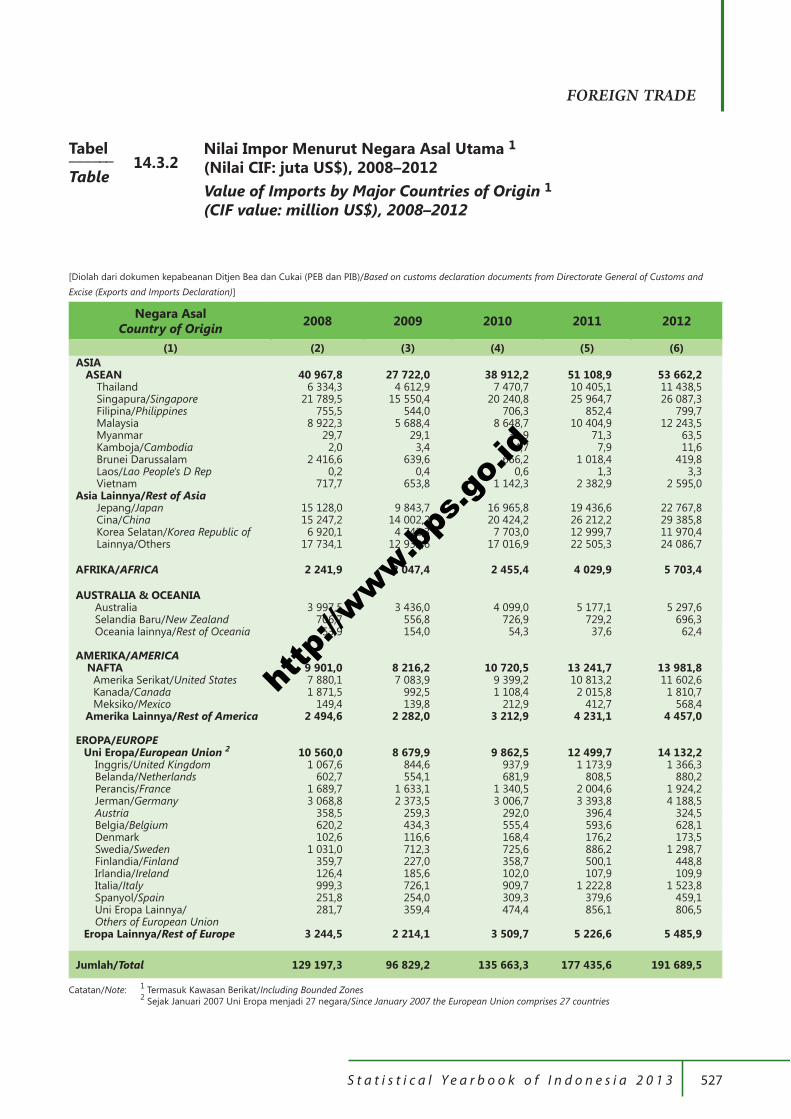
FOREIGN TRADE
S t a t i s t i c a l Y e a r b o o k o f I n d o n e s i a 2 0 1 3 527
Nilai Impor Menurut Negara Asal Utama 1(Nilai CIF: juta US$), 2008–2012Value of Imports by Major Countries of Origin 1
(CIF value: million US$), 2008–2012
[Diolah dari dokumen kepabeanan Ditjen Bea dan Cukai (PEB dan PIB)/Based on customs declaration documents from Directorate General of Customs and Excise (Exports and Imports Declaration)]
Negara AsalCountry of Origin 2008 2009 2010 2011 2012
(1) (2) (3) (4) (5) (6)ASIA
ASEAN 40 967,8 27 722,0 38 912,2 51 108,9 53 662,2Thailand 6 334,3 4 612,9 7 470,7 10 405,1 11 438,5Singapura/Singapore 21 789,5 15 550,4 20 240,8 25 964,7 26 087,3Filipina/Philippines 755,5 544,0 706,3 852,4 799,7Malaysia 8 922,3 5 688,4 8 648,7 10 404,9 12 243,5Myanmar 29,7 29,1 31,9 71,3 63,5Kamboja/Cambodia 2,0 3,4 4,7 7,9 11,6Brunei Darussalam 2 416,6 639,6 666,2 1 018,4 419,8Laos/Lao People's D Rep 0,2 0,4 0,6 1,3 3,3Vietnam 717,7 653,8 1 142,3 2 382,9 2 595,0
Asia Lainnya/Rest of AsiaJepang/Japan 15 128,0 9 843,7 16 965,8 19 436,6 22 767,8Cina/China 15 247,2 14 002,2 20 424,2 26 212,2 29 385,8Korea Selatan/Korea Republic of 6 920,1 4 742,3 7 703,0 12 999,7 11 970,4Lainnya/Others 17 734,1 12 932,6 17 016,9 22 505,3 24 086,7
AFRIKA/AFRICA 2 241,9 2 047,4 2 455,4 4 029,9 5 703,4
AUSTRALIA & OCEANIAAustralia 3 997,5 3 436,0 4 099,0 5 177,1 5 297,6Selandia Baru/New Zealand 706,7 556,8 726,9 729,2 696,3Oceania lainnya/Rest of Oceania 53,9 154,0 54,3 37,6 62,4
AMERIKA/AMERICANAFTA 9 901,0 8 216,2 10 720,5 13 241,7 13 981,8
Amerika Serikat/United States 7 880,1 7 083,9 9 399,2 10 813,2 11 602,6Kanada/Canada 1 871,5 992,5 1 108,4 2 015,8 1 810,7Meksiko/Mexico 149,4 139,8 212,9 412,7 568,4
Amerika Lainnya/Rest of America 2 494,6 2 282,0 3 212,9 4 231,1 4 457,0
EROPA/EUROPEUni Eropa/European Union 2 10 560,0 8 679,9 9 862,5 12 499,7 14 132,2
Inggris/United Kingdom 1 067,6 844,6 937,9 1 173,9 1 366,3Belanda/Netherlands 602,7 554,1 681,9 808,5 880,2Perancis/France 1 689,7 1 633,1 1 340,5 2 004,6 1 924,2Jerman/Germany 3 068,8 2 373,5 3 006,7 3 393,8 4 188,5Austria 358,5 259,3 292,0 396,4 324,5Belgia/Belgium 620,2 434,3 555,4 593,6 628,1Denmark 102,6 116,6 168,4 176,2 173,5Swedia/Sweden 1 031,0 712,3 725,6 886,2 1 298,7Finlandia/Finland 359,7 227,0 358,7 500,1 448,8Irlandia/Ireland 126,4 185,6 102,0 107,9 109,9Italia/Italy 999,3 726,1 909,7 1 222,8 1 523,8Spanyol/Spain 251,8 254,0 309,3 379,6 459,1Uni Eropa Lainnya/ 281,7 359,4 474,4 856,1 806,5Others of European Union
Eropa Lainnya/Rest of Europe 3 244,5 2 214,1 3 509,7 5 226,6 5 485,9
Jumlah/Total 129 197,3 96 829,2 135 663,3 177 435,6 191 689,5
Tabel ––––––
14.3.2Table
Catatan/Note: 1 Termasuk Kawasan Berikat/Including Bounded Zones 2 Sejak Januari 2007 Uni Eropa menjadi 27 negara/Since January 2007 the European Union comprises 27 countries
http
://www.b
ps.g
o.id
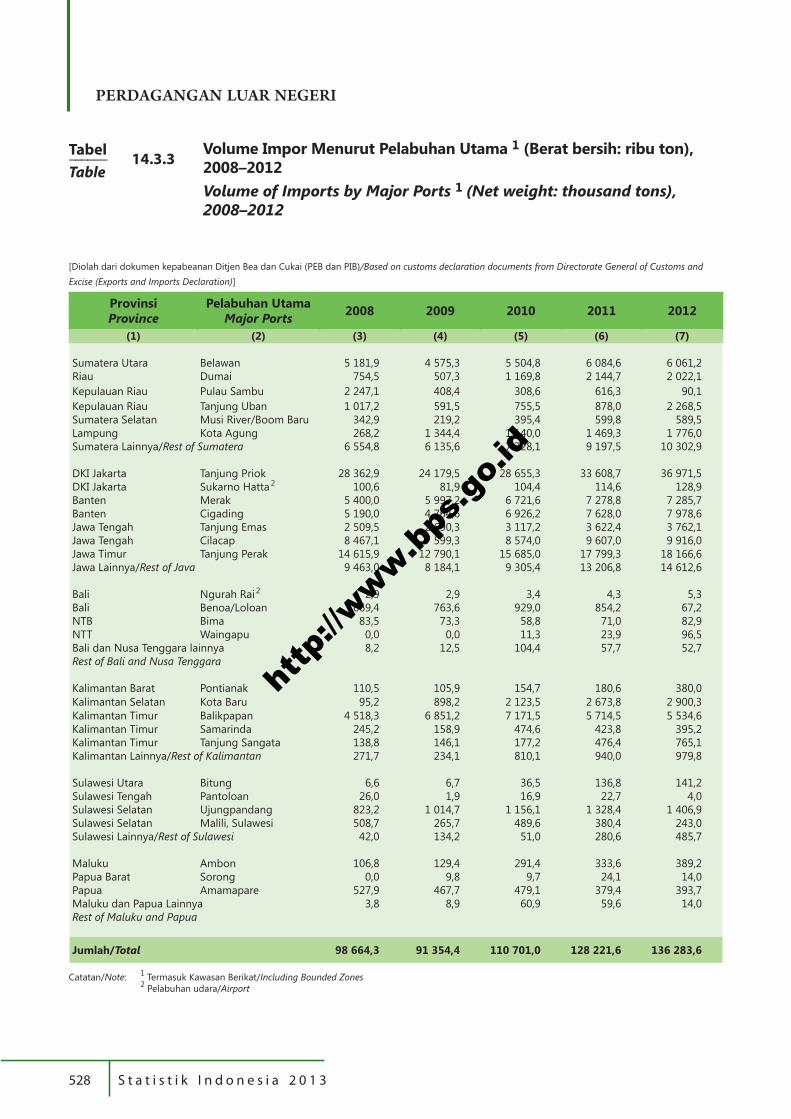
PERDAGANGAN LUAR NEGERI
S t a t i s t i k I n d o n e s i a 2 0 1 3528
Volume Impor Menurut Pelabuhan Utama 1 (Berat bersih: ribu ton), 2008–2012Volume of Imports by Major Ports 1 (Net weight: thousand tons), 2008–2012
[Diolah dari dokumen kepabeanan Ditjen Bea dan Cukai (PEB dan PIB)/Based on customs declaration documents from Directorate General of Customs and Excise (Exports and Imports Declaration)]
ProvinsiProvince
Pelabuhan UtamaMajor Ports 2008 2009 2010 2011 2012
(1) (2) (3) (4) (5) (6) (7)
Sumatera Utara Belawan 5 181,9 4 575,3 5 504,8 6 084,6 6 061,2Riau Dumai 754,5 507,3 1 169,8 2 144,7 2 022,1Kepulauan Riau Pulau Sambu 2 247,1 408,4 308,6 616,3 90,1Kepulauan Riau Tanjung Uban 1 017,2 591,5 755,5 878,0 2 268,5Sumatera Selatan Musi River/Boom Baru 342,9 219,2 395,4 599,8 589,5Lampung Kota Agung 268,2 1 344,4 1 140,0 1 469,3 1 776,0Sumatera Lainnya/Rest of Sumatera 6 554,8 6 135,6 7 728,1 9 197,5 10 302,9
DKI Jakarta Tanjung Priok 28 362,9 24 179,5 28 655,3 33 608,7 36 971,5DKI Jakarta Sukarno Hatta 2 100,6 81,9 104,4 114,6 128,9Banten Merak 5 400,0 5 997,2 6 721,6 7 278,8 7 285,7Banten Cigading 5 190,0 4 764,6 6 926,2 7 628,0 7 978,6Jawa Tengah Tanjung Emas 2 509,5 2 690,3 3 117,2 3 622,4 3 762,1Jawa Tengah Cilacap 8 467,1 7 599,3 8 574,0 9 607,0 9 916,0Jawa Timur Tanjung Perak 14 615,9 12 790,1 15 685,0 17 799,3 18 166,6Jawa Lainnya/Rest of Java 9 463,0 8 184,1 9 305,4 13 206,8 14 612,6
Bali Ngurah Rai 2 2,9 2,9 3,4 4,3 5,3Bali Benoa/Loloan 669,4 763,6 929,0 854,2 67,2NTB Bima 83,5 73,3 58,8 71,0 82,9NTT Waingapu 0,0 0,0 11,3 23,9 96,5Bali dan Nusa Tenggara lainnya 8,2 12,5 104,4 57,7 52,7Rest of Bali and Nusa Tenggara
Kalimantan Barat Pontianak 110,5 105,9 154,7 180,6 380,0Kalimantan Selatan Kota Baru 95,2 898,2 2 123,5 2 673,8 2 900,3Kalimantan Timur Balikpapan 4 518,3 6 851,2 7 171,5 5 714,5 5 534,6Kalimantan Timur Samarinda 245,2 158,9 474,6 423,8 395,2Kalimantan Timur Tanjung Sangata 138,8 146,1 177,2 476,4 765,1Kalimantan Lainnya/Rest of Kalimantan 271,7 234,1 810,1 940,0 979,8
Sulawesi Utara Bitung 6,6 6,7 36,5 136,8 141,2Sulawesi Tengah Pantoloan 26,0 1,9 16,9 22,7 4,0Sulawesi Selatan Ujungpandang 823,2 1 014,7 1 156,1 1 328,4 1 406,9Sulawesi Selatan Malili, Sulawesi 508,7 265,7 489,6 380,4 243,0Sulawesi Lainnya/Rest of Sulawesi 42,0 134,2 51,0 280,6 485,7
Maluku Ambon 106,8 129,4 291,4 333,6 389,2Papua Barat Sorong 0,0 9,8 9,7 24,1 14,0Papua Amamapare 527,9 467,7 479,1 379,4 393,7Maluku dan Papua Lainnya 3,8 8,9 60,9 59,6 14,0Rest of Maluku and Papua
Jumlah/Total 98 664,3 91 354,4 110 701,0 128 221,6 136 283,6
Catatan/Note: 1 Termasuk Kawasan Berikat/Including Bounded Zones 2 Pelabuhan udara/Airport
Tabel –––––– 14.3.3Table
http
://www.b
ps.g
o.id
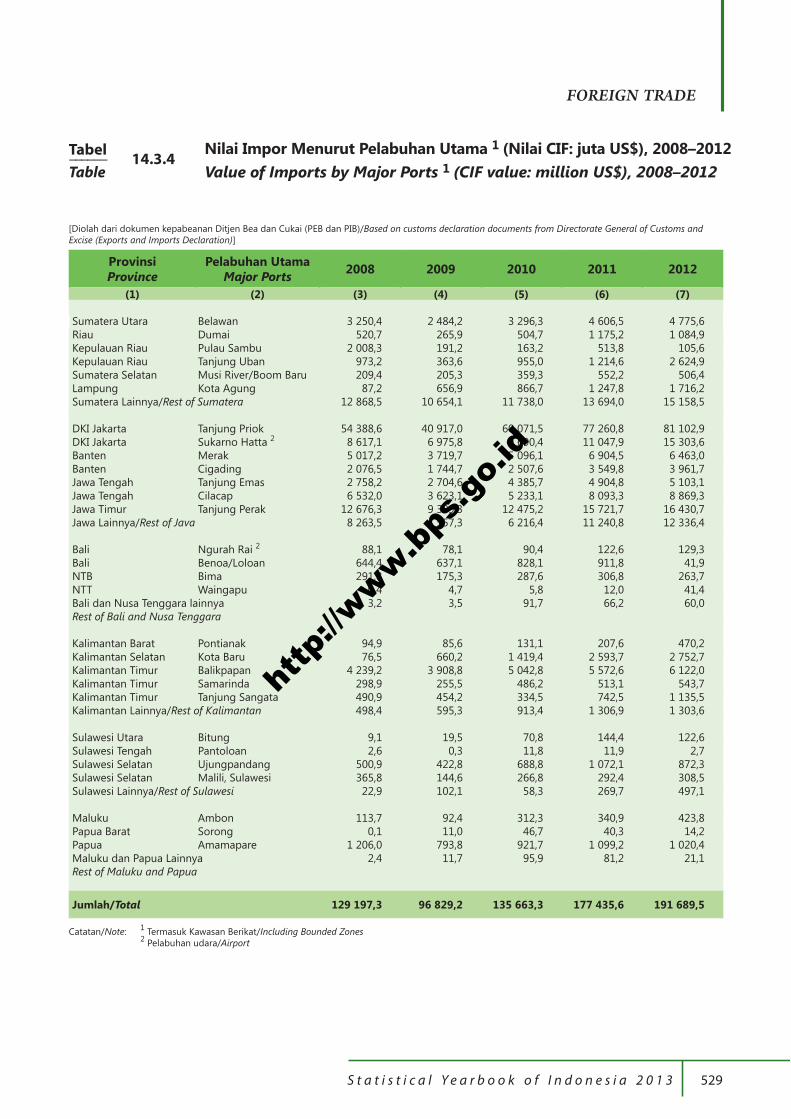
FOREIGN TRADE
S t a t i s t i c a l Y e a r b o o k o f I n d o n e s i a 2 0 1 3 529
Nilai Impor Menurut Pelabuhan Utama 1 (Nilai CIF: juta US$), 2008–2012Value of Imports by Major Ports 1 (CIF value: million US$), 2008–2012
[Diolah dari dokumen kepabeanan Ditjen Bea dan Cukai (PEB dan PIB)/Based on customs declaration documents from Directorate General of Customs and Excise (Exports and Imports Declaration)]
ProvinsiProvince
Pelabuhan UtamaMajor Ports 2008 2009 2010 2011 2012
(1) (2) (3) (4) (5) (6) (7)
Sumatera Utara Belawan 3 250,4 2 484,2 3 296,3 4 606,5 4 775,6Riau Dumai 520,7 265,9 504,7 1 175,2 1 084,9Kepulauan Riau Pulau Sambu 2 008,3 191,2 163,2 513,8 105,6Kepulauan Riau Tanjung Uban 973,2 363,6 955,0 1 214,6 2 624,9Sumatera Selatan Musi River/Boom Baru 209,4 205,3 359,3 552,2 506,4Lampung Kota Agung 87,2 656,9 866,7 1 247,8 1 716,2Sumatera Lainnya/Rest of Sumatera 12 868,5 10 654,1 11 738,0 13 694,0 15 158,5
DKI Jakarta Tanjung Priok 54 388,6 40 917,0 60 071,5 77 260,8 81 102,9DKI Jakarta Sukarno Hatta 2 8 617,1 6 975,8 9 690,4 11 047,9 15 303,6Banten Merak 5 017,2 3 719,7 5 096,1 6 904,5 6 463,0Banten Cigading 2 076,5 1 744,7 2 507,6 3 549,8 3 961,7Jawa Tengah Tanjung Emas 2 758,2 2 704,6 4 385,7 4 904,8 5 103,1Jawa Tengah Cilacap 6 532,0 3 623,1 5 233,1 8 093,3 8 869,3Jawa Timur Tanjung Perak 12 676,3 9 309,3 12 475,2 15 721,7 16 430,7Jawa Lainnya/Rest of Java 8 263,5 4 557,3 6 216,4 11 240,8 12 336,4
Bali Ngurah Rai 2 88,1 78,1 90,4 122,6 129,3Bali Benoa/Loloan 644,4 637,1 828,1 911,8 41,9NTB Bima 291,8 175,3 287,6 306,8 263,7NTT Waingapu 0,4 4,7 5,8 12,0 41,4Bali dan Nusa Tenggara lainnya 3,2 3,5 91,7 66,2 60,0Rest of Bali and Nusa Tenggara
Kalimantan Barat Pontianak 94,9 85,6 131,1 207,6 470,2Kalimantan Selatan Kota Baru 76,5 660,2 1 419,4 2 593,7 2 752,7Kalimantan Timur Balikpapan 4 239,2 3 908,8 5 042,8 5 572,6 6 122,0Kalimantan Timur Samarinda 298,9 255,5 486,2 513,1 543,7Kalimantan Timur Tanjung Sangata 490,9 454,2 334,5 742,5 1 135,5Kalimantan Lainnya/Rest of Kalimantan 498,4 595,3 913,4 1 306,9 1 303,6
Sulawesi Utara Bitung 9,1 19,5 70,8 144,4 122,6Sulawesi Tengah Pantoloan 2,6 0,3 11,8 11,9 2,7Sulawesi Selatan Ujungpandang 500,9 422,8 688,8 1 072,1 872,3Sulawesi Selatan Malili, Sulawesi 365,8 144,6 266,8 292,4 308,5Sulawesi Lainnya/Rest of Sulawesi 22,9 102,1 58,3 269,7 497,1
Maluku Ambon 113,7 92,4 312,3 340,9 423,8Papua Barat Sorong 0,1 11,0 46,7 40,3 14,2Papua Amamapare 1 206,0 793,8 921,7 1 099,2 1 020,4Maluku dan Papua Lainnya 2,4 11,7 95,9 81,2 21,1Rest of Maluku and Papua
Jumlah/Total 129 197,3 96 829,2 135 663,3 177 435,6 191 689,5
Tabel –––––– 14.3.4Table
Catatan/Note: 1 Termasuk Kawasan Berikat/Including Bounded Zones 2 Pelabuhan udara/Airport
http
://www.b
ps.g
o.id

PERDAGANGAN LUAR NEGERI
S t a t i s t i k I n d o n e s i a 2 0 1 3530
Impor Menurut Golongan Penggunaan Barang, 1997–2012Imports by Broad Economic Category, 1997–2012
[Diolah dari dokumen kepabeanan Ditjen Bea dan Cukai (PEB dan PIB)/Based on customs declaration documents from Directorate General of Customs and Excise (Exports and Imports Declaration)]
TahunYear
BarangKonsumsi
ComsumptionGoods
Bahan Baku danBarang Penolong
Raw Materials and Auxiliary Goods
Barang ModalCapital Goods
JumlahTotal
(1) (2) (3) (4) (5)
Berat Bersih/Net Weight: 000 ton
1997 2 338,3 55 410,6 1 399,5 59 148,41998 4 158,6 46 455,7 646,9 51 261,21999 7 324,5 54 175,4 740,9 62 240,82000 5 241,2 61 076,8 1 070,9 67 388,92001 4 071,2 60 245,1 1 250,5 65 566,82002 5 643,4 65 989,3 1 108,5 72 741,22003 4 903,4 63 952,7 849,0 69 705,12004 4 749,9 75 357,5 1 213,2 81 320,62005 5 562,1 76 582,9 1 519,5 83 664,52006 4 706,6 77 353,7 1 748,6 83 808,92007 6 714,4 81 741,0 1 480,2 89 935,62008 1 5 368,1 90 686,2 2 610,0 98 664,32009 1 4 056,6 84 720,0 2 577,8 91 354,42010 1 5 604,5 101 817,6 3 278,9 110 701,02011 1 8 110,5 116 101,8 4 009,3 128 221,62012 1 6 966,2 124 956,0 4 361,4 136 283,6
Nilai CIF/CIF value: 000 000 US $
1997 2 166,3 30 229,5 9 284,0 41 679,81998 1 917,6 19 611,8 5 807,5 27 336,91999 2 468,3 18 475,0 3 060,0 24 003,32000 2 718,7 26 018,7 4 777,4 33 514,82001 2 251,2 23 879,4 4 831,5 30 962,12002 2 650,5 24 227,5 4 410,9 31 288,92003 2 862,8 25 496,3 4 191,6 32 550,72004 3 786,5 36 204,2 6 533,8 46 524,52005 4 620,5 44 792,0 8 288,4 57 700,92006 4 738,2 47 171,4 9 155,9 61 065,52007 6 539,1 56 484,7 11 449,6 74 473,42008 1 8 303,7 99 492,7 21 400,9 129 197,32009 1 6 752,6 69 638,1 20 438,5 96 829,22010 1 9 991,6 98 755,1 26 916,6 135 663,32011 1 13 392,9 130 934,3 33 108,4 177 435,62012 1 13 408,1 140 126,6 38 154,8 191 689,5
Catatan/Note: 1 Termasuk Kawasan Berikat/Including Bounded Zones
Tabel –––––– 14.3.5Table
http
://www.b
ps.g
o.id
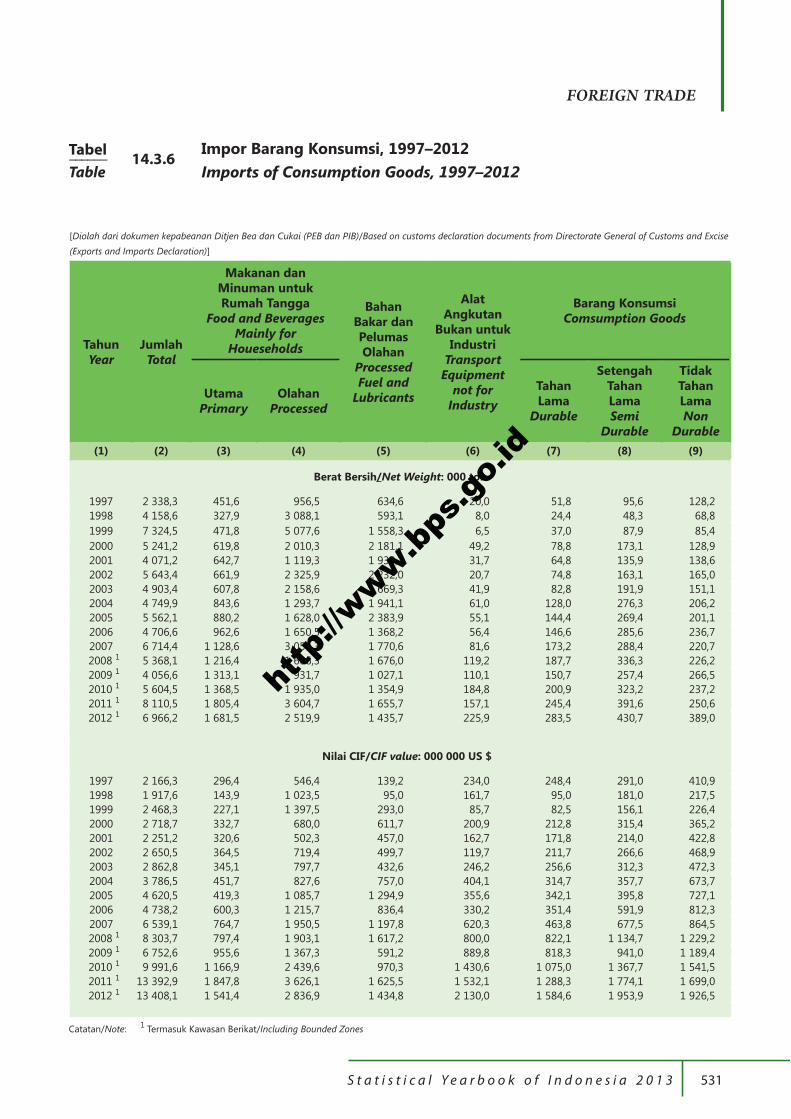
FOREIGN TRADE
S t a t i s t i c a l Y e a r b o o k o f I n d o n e s i a 2 0 1 3 531
Impor Barang Konsumsi, 1997–2012Imports of Consumption Goods, 1997–2012
[Diolah dari dokumen kepabeanan Ditjen Bea dan Cukai (PEB dan PIB)/Based on customs declaration documents from Directorate General of Customs and Excise (Exports and Imports Declaration)]
TahunYear
JumlahTotal
Makanan dan Minuman untuk Rumah Tangga
Food and Beverages Mainly for
Houeseholds
Bahan Bakar dan Pelumas Olahan
Processed Fuel and
Lubricants
Alat Angkutan
Bukan untuk Industri
Transport Equipment
not for Industry
Barang KonsumsiComsumption Goods
UtamaPrimary
OlahanProcessed
Tahan Lama
Durable
Setengah Tahan LamaSemi
Durable
Tidak Tahan LamaNon
Durable(1) (2) (3) (4) (5) (6) (7) (8) (9)
Berat Bersih/Net Weight: 000 ton
1997 2 338,3 451,6 956,5 634,6 20,0 51,8 95,6 128,21998 4 158,6 327,9 3 088,1 593,1 8,0 24,4 48,3 68,81999 7 324,5 471,8 5 077,6 1 558,3 6,5 37,0 87,9 85,42000 5 241,2 619,8 2 010,3 2 181,1 49,2 78,8 173,1 128,92001 4 071,2 642,7 1 119,3 1 938,2 31,7 64,8 135,9 138,62002 5 643,4 661,9 2 325,9 2 232,0 20,7 74,8 163,1 165,02003 4 903,4 607,8 2 158,6 1 669,3 41,9 82,8 191,9 151,12004 4 749,9 843,6 1 293,7 1 941,1 61,0 128,0 276,3 206,22005 5 562,1 880,2 1 628,0 2 383,9 55,1 144,4 269,4 201,12006 4 706,6 962,6 1 650,5 1 368,2 56,4 146,6 285,6 236,72007 6 714,4 1 128,6 3 051,3 1 770,6 81,6 173,2 288,4 220,72008 1 5 368,1 1 216,4 1 606,3 1 676,0 119,2 187,7 336,3 226,22009 1 4 056,6 1 313,1 931,7 1 027,1 110,1 150,7 257,4 266,52010 1 5 604,5 1 368,5 1 935,0 1 354,9 184,8 200,9 323,2 237,22011 1 8 110,5 1 805,4 3 604,7 1 655,7 157,1 245,4 391,6 250,62012 1 6 966,2 1 681,5 2 519,9 1 435,7 225,9 283,5 430,7 389,0
Nilai CIF/CIF value: 000 000 US $
1997 2 166,3 296,4 546,4 139,2 234,0 248,4 291,0 410,91998 1 917,6 143,9 1 023,5 95,0 161,7 95,0 181,0 217,51999 2 468,3 227,1 1 397,5 293,0 85,7 82,5 156,1 226,42000 2 718,7 332,7 680,0 611,7 200,9 212,8 315,4 365,22001 2 251,2 320,6 502,3 457,0 162,7 171,8 214,0 422,82002 2 650,5 364,5 719,4 499,7 119,7 211,7 266,6 468,92003 2 862,8 345,1 797,7 432,6 246,2 256,6 312,3 472,32004 3 786,5 451,7 827,6 757,0 404,1 314,7 357,7 673,72005 4 620,5 419,3 1 085,7 1 294,9 355,6 342,1 395,8 727,12006 4 738,2 600,3 1 215,7 836,4 330,2 351,4 591,9 812,32007 6 539,1 764,7 1 950,5 1 197,8 620,3 463,8 677,5 864,52008 1 8 303,7 797,4 1 903,1 1 617,2 800,0 822,1 1 134,7 1 229,22009 1 6 752,6 955,6 1 367,3 591,2 889,8 818,3 941,0 1 189,42010 1 9 991,6 1 166,9 2 439,6 970,3 1 430,6 1 075,0 1 367,7 1 541,52011 1 13 392,9 1 847,8 3 626,1 1 625,5 1 532,1 1 288,3 1 774,1 1 699,02012 1 13 408,1 1 541,4 2 836,9 1 434,8 2 130,0 1 584,6 1 953,9 1 926,5
Tabel –––––– 14.3.6Table
Catatan/Note: 1 Termasuk Kawasan Berikat/Including Bounded Zones
http
://www.b
ps.g
o.id
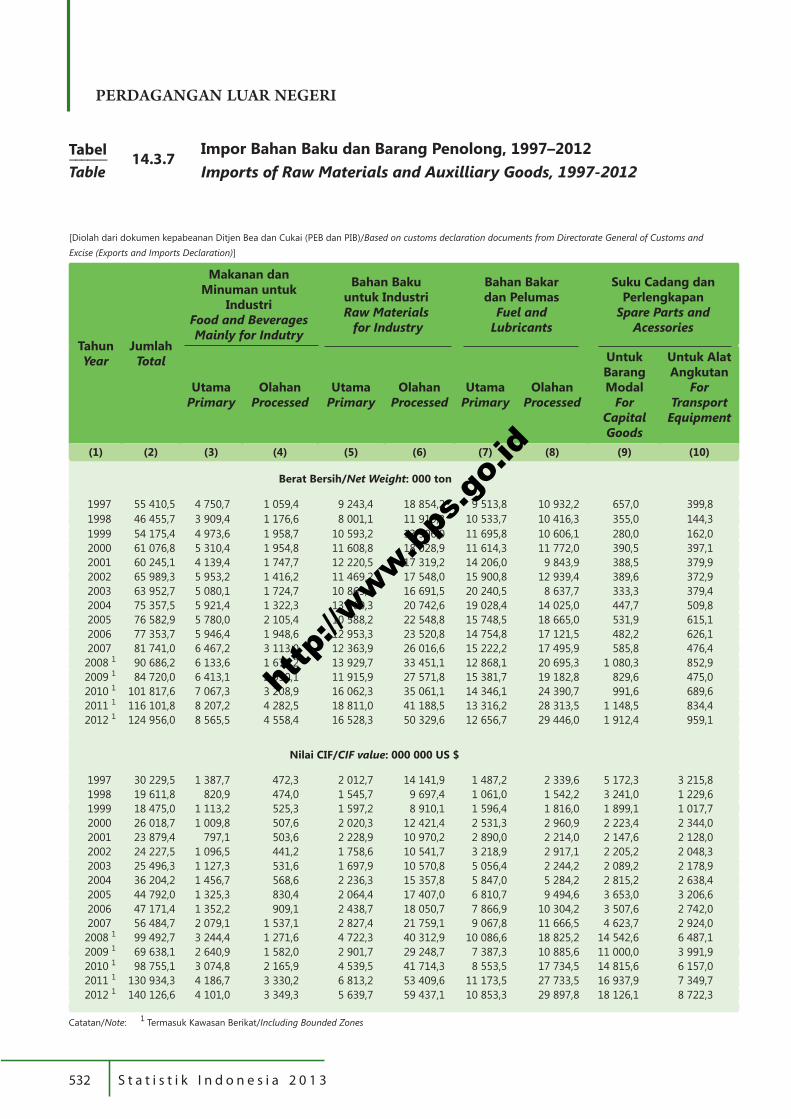
PERDAGANGAN LUAR NEGERI
S t a t i s t i k I n d o n e s i a 2 0 1 3532
Impor Bahan Baku dan Barang Penolong, 1997–2012Imports of Raw Materials and Auxilliary Goods, 1997-2012
[Diolah dari dokumen kepabeanan Ditjen Bea dan Cukai (PEB dan PIB)/Based on customs declaration documents from Directorate General of Customs and Excise (Exports and Imports Declaration)]
TahunYear
JumlahTotal
Makanan dan Minuman untuk
IndustriFood and Beverages Mainly for Indutry
Bahan Bakuuntuk IndustriRaw Materials for Industry
Bahan Bakardan Pelumas
Fuel andLubricants
Suku Cadang dan Perlengkapan
Spare Parts and Acessories
UtamaPrimary
OlahanProcessed
UtamaPrimary
OlahanProcessed
UtamaPrimary
OlahanProcessed
Untuk Barang Modal
For Capital Goods
Untuk Alat Angkutan
For Transport Equipment
(1) (2) (3) (4) (5) (6) (7) (8) (9) (10)
Berat Bersih/Net Weight: 000 ton
1997 55 410,5 4 750,7 1 059,4 9 243,4 18 854,2 9 513,8 10 932,2 657,0 399,81998 46 455,7 3 909,4 1 176,6 8 001,1 11 919,3 10 533,7 10 416,3 355,0 144,31999 54 175,4 4 973,6 1 958,7 10 593,2 13 906,0 11 695,8 10 606,1 280,0 162,02000 61 076,8 5 310,4 1 954,8 11 608,8 18 028,9 11 614,3 11 772,0 390,5 397,12001 60 245,1 4 139,4 1 747,7 12 220,5 17 319,2 14 206,0 9 843,9 388,5 379,92002 65 989,3 5 953,2 1 416,2 11 469,2 17 548,0 15 900,8 12 939,4 389,6 372,92003 63 952,7 5 080,1 1 724,7 10 865,5 16 691,5 20 240,5 8 637,7 333,3 379,42004 75 357,5 5 921,4 1 322,3 13 360,3 20 742,6 19 028,4 14 025,0 447,7 509,82005 76 582,9 5 780,0 2 105,4 10 588,2 22 548,8 15 748,5 18 665,0 531,9 615,12006 77 353,7 5 946,4 1 948,6 12 953,3 23 520,8 14 754,8 17 121,5 482,2 626,12007 81 741,0 6 467,2 3 113,0 12 363,9 26 016,6 15 222,2 17 495,9 585,8 476,42008 1 90 686,2 6 133,6 1 675,2 13 929,7 33 451,1 12 868,1 20 695,3 1 080,3 852,92009 1 84 720,0 6 413,1 2 950,1 11 915,9 27 571,8 15 381,7 19 182,8 829,6 475,02010 1 101 817,6 7 067,3 3 208,9 16 062,3 35 061,1 14 346,1 24 390,7 991,6 689,62011 1 116 101,8 8 207,2 4 282,5 18 811,0 41 188,5 13 316,2 28 313,5 1 148,5 834,42012 1 124 956,0 8 565,5 4 558,4 16 528,3 50 329,6 12 656,7 29 446,0 1 912,4 959,1
Nilai CIF/CIF value: 000 000 US $
1997 30 229,5 1 387,7 472,3 2 012,7 14 141,9 1 487,2 2 339,6 5 172,3 3 215,81998 19 611,8 820,9 474,0 1 545,7 9 697,4 1 061,0 1 542,2 3 241,0 1 229,61999 18 475,0 1 113,2 525,3 1 597,2 8 910,1 1 596,4 1 816,0 1 899,1 1 017,72000 26 018,7 1 009,8 507,6 2 020,3 12 421,4 2 531,3 2 960,9 2 223,4 2 344,02001 23 879,4 797,1 503,6 2 228,9 10 970,2 2 890,0 2 214,0 2 147,6 2 128,02002 24 227,5 1 096,5 441,2 1 758,6 10 541,7 3 218,9 2 917,1 2 205,2 2 048,32003 25 496,3 1 127,3 531,6 1 697,9 10 570,8 5 056,4 2 244,2 2 089,2 2 178,92004 36 204,2 1 456,7 568,6 2 236,3 15 357,8 5 847,0 5 284,2 2 815,2 2 638,42005 44 792,0 1 325,3 830,4 2 064,4 17 407,0 6 810,7 9 494,6 3 653,0 3 206,62006 47 171,4 1 352,2 909,1 2 438,7 18 050,7 7 866,9 10 304,2 3 507,6 2 742,02007 56 484,7 2 079,1 1 537,1 2 827,4 21 759,1 9 067,8 11 666,5 4 623,7 2 924,02008 1 99 492,7 3 244,4 1 271,6 4 722,3 40 312,9 10 086,6 18 825,2 14 542,6 6 487,12009 1 69 638,1 2 640,9 1 582,0 2 901,7 29 248,7 7 387,3 10 885,6 11 000,0 3 991,92010 1 98 755,1 3 074,8 2 165,9 4 539,5 41 714,3 8 553,5 17 734,5 14 815,6 6 157,02011 1 130 934,3 4 186,7 3 330,2 6 813,2 53 409,6 11 173,5 27 733,5 16 937,9 7 349,72012 1 140 126,6 4 101,0 3 349,3 5 639,7 59 437,1 10 853,3 29 897,8 18 126,1 8 722,3
Tabel –––––– 14.3.7Table
Catatan/Note: 1 Termasuk Kawasan Berikat/Including Bounded Zones
http
://www.b
ps.g
o.id
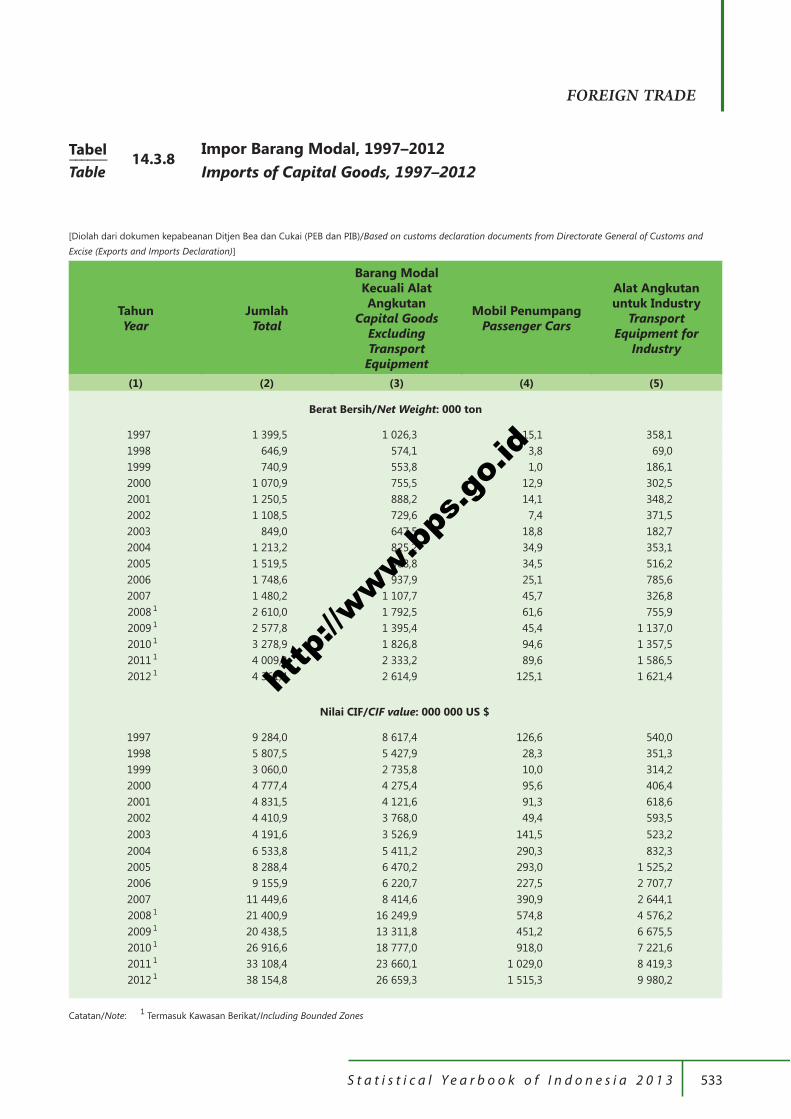
FOREIGN TRADE
S t a t i s t i c a l Y e a r b o o k o f I n d o n e s i a 2 0 1 3 533
Impor Barang Modal, 1997–2012Imports of Capital Goods, 1997–2012
[Diolah dari dokumen kepabeanan Ditjen Bea dan Cukai (PEB dan PIB)/Based on customs declaration documents from Directorate General of Customs and Excise (Exports and Imports Declaration)]
TahunYear
JumlahTotal
Barang Modal Kecuali Alat Angkutan
Capital Goods ExcludingTransport Equipment
Mobil PenumpangPassenger Cars
Alat Angkutan untuk Industry
Transport Equipment for
Industry
(1) (2) (3) (4) (5)
Berat Bersih/Net Weight: 000 ton
1997 1 399,5 1 026,3 15,1 358,11998 646,9 574,1 3,8 69,01999 740,9 553,8 1,0 186,12000 1 070,9 755,5 12,9 302,52001 1 250,5 888,2 14,1 348,22002 1 108,5 729,6 7,4 371,52003 849,0 647,5 18,8 182,72004 1 213,2 825,2 34,9 353,12005 1 519,5 968,8 34,5 516,22006 1 748,6 937,9 25,1 785,62007 1 480,2 1 107,7 45,7 326,82008 1 2 610,0 1 792,5 61,6 755,92009 1 2 577,8 1 395,4 45,4 1 137,02010 1 3 278,9 1 826,8 94,6 1 357,52011 1 4 009,3 2 333,2 89,6 1 586,52012 1 4 361,4 2 614,9 125,1 1 621,4
Nilai CIF/CIF value: 000 000 US $
1997 9 284,0 8 617,4 126,6 540,01998 5 807,5 5 427,9 28,3 351,31999 3 060,0 2 735,8 10,0 314,22000 4 777,4 4 275,4 95,6 406,42001 4 831,5 4 121,6 91,3 618,62002 4 410,9 3 768,0 49,4 593,52003 4 191,6 3 526,9 141,5 523,22004 6 533,8 5 411,2 290,3 832,32005 8 288,4 6 470,2 293,0 1 525,22006 9 155,9 6 220,7 227,5 2 707,72007 11 449,6 8 414,6 390,9 2 644,12008 1 21 400,9 16 249,9 574,8 4 576,22009 1 20 438,5 13 311,8 451,2 6 675,52010 1 26 916,6 18 777,0 918,0 7 221,62011 1 33 108,4 23 660,1 1 029,0 8 419,32012 1 38 154,8 26 659,3 1 515,3 9 980,2
Tabel –––––– 14.3.8Table
Catatan/Note: 1 Termasuk Kawasan Berikat/Including Bounded Zones
http
://www.b
ps.g
o.id

PERDAGANGAN LUAR NEGERI
S t a t i s t i k I n d o n e s i a 2 0 1 3534
Impor Beras Menurut Negara Asal Utama 1, 2008-2012Imports of Rice by Major Countries of Origin 1, 2008–2012
[Diolah dari dokumen kepabeanan Ditjen Bea dan Cukai (PEB dan PIB)/Based on customs declaration documents from Directorate General of Customs and Excise (Exports and Imports Declaration)]
Negara AsalCountry of Origin 2008 2009 2010 2011 2012
(1) (2) (3) (4) (5) (6)
Berat Bersih/Net Weight: ton
Vietnam/Viet Nam 125 070,5 20 970,5 467 369,6 1 778 480,6 1 084 782,8
Thailand 157 007,3 221 372,6 209 127,8 938 695,7 315 352,7
Cina/China 3 341,7 5 167,6 3 637,4 4 674,8 3 099,3
India 289,5 473,1 601,3 4 064,6 259 022,6
Pakistan 751,3 501,5 4 992,1 14 342,3 133 078,0
Amerika Serikat/United States 1 411,2 1 323,4 1 644,1 2 074,1 2 445,5
Taiwan 0,0 0,0 0,0 5 000,0 0,0
Singapura/Singapore 898,2 250,0 10,8 1 506,5 22,5
Lainnya/Others 919,7 414,4 198,4 1 637,6 12 568,9
Jumlah / Total 289 689,4 250 473,1 687 581,5 2 750 476,2 1 810 372,3
Nilai Value: CIF 000 US$
Vietnam/Viet Nam 47 392,1 7 936,9 232 915,7 946 490,1 564 925,7
Thailand 64 721,0 81 959,8 109 133,7 533 001,9 186 171,4
Cina/China 6 642,4 13 697,0 12 728,5 15 467,1 11 205,6
India 337,6 791,5 1 767,5 6 307,9 122 189,0
Pakistan 259,2 160,7 1 765,8 6 053,4 52 483,4
Amerika Serikat/United States 1 796,3 2 005,7 1 745,5 2 489,6 2 718,6
Taiwan 0,0 0,0 0,0 1 050,0 0,0
Singapura/Singapore 465,5 100,0 27,6 981,9 32,2
Lainnya/Others 2 528,7 1 501,7 700,7 1 321,6 5 897,3
Jumlah/Total 124 142,8 108 153,3 360 785,0 1 513 163,5 945 623,2
Tabel –––––– 14.3.9Table
Catatan/Note: 1 Termasuk Kawasan Berikat/Including Bounded Zones
http
://www.b
ps.g
o.id

FOREIGN TRADE
S t a t i s t i c a l Y e a r b o o k o f I n d o n e s i a 2 0 1 3 535
Impor Pupuk Menurut Negara Asal Utama 1, 2008–2012Imports of Fertilizers by Major Countries of Origin 1, 2008–2012
[Diolah dari dokumen kepabeanan Ditjen Bea dan Cukai (PEB dan PIB)/Based on customs declaration documents from Directorate General of Customs and Excise (Exports and Imports Declaration)]
Negara AsalCountry of Origin 2008 2009 2010 2011 2012
(1) (2) (3) (4) (5) (6)
Berat Bersih/Net Weight: 000 ton
Jepang/Japan 33,9 9,4 23,8 71,0 16,5Korea Selatan/Korea, Republic Of 224,6 70,7 130,8 149,9 337,9Cina/China 657,9 375,4 477,6 857,7 1 363,1Thailand 49,2 29,3 52,0 61,1 43,4Philipina/Philippines 59,1 45,4 38,5 19,0 0,2Malaysia 261,6 70,1 143,9 194,7 206,0Yordania/Jordan 92,4 63,2 104,2 197,4 268,7Australia 270,0 324,4 403,1 375,4 279,9Kanada/Canada 949,6 243,9 703,3 1 538,7 1 324,3Jerman/Germany 108,1 153,9 154,8 164,9 174,2Norwegia/Norway 77,5 59,0 109,4 115,2 132,6Rusia/Russia Federation 750,8 215,8 428,3 1 058,7 768,2Lainnya / Others 1 121,4 574,8 1 426,9 1 603,1 1 608,6
Jumlah/Total 4 656,1 2 235,3 4 196,6 6 406,8 6 523,6
Nilai CIF Value: 000 000 US$
Jepang/Japan 14,7 2,4 6,5 22,1 7,1Korea Selatan/Korea, Republic Of 131,0 14,6 26,6 40,7 91,2Cina/China 323,2 110,5 162,4 394,3 597,8Thailand 21,5 15,2 25,8 34,7 24,5Philipina/Philippines 22,3 19,0 23,5 12,1 0,2Malaysia 121,0 40,3 71,9 99,5 113,4Yordania/Jordan 54,3 38,7 40,5 89,1 135,6Australia 107,0 118,0 136,4 129,7 70,3Kanada/Canada 629,2 150,0 281,8 703,1 646,7Jerman/Germany 56,2 77,8 60,3 73,8 85,1Norwegia/Norway 53,1 26,3 54,1 67,8 76,6Rusia/Russia Federation 410,8 81,2 155,3 466,5 369,7Lainnya / Others 503,0 150,8 358,3 454,1 401,1
Jumlah/Total 2 447,3 844,8 1 403,4 2 587,5 2 619,3
Tabel –––––– 14.3.10Table
Catatan/Note: 1 Termasuk Kawasan Berikat/Including Bounded Zones
http
://www.b
ps.g
o.id

PERDAGANGAN LUAR NEGERI
S t a t i s t i k I n d o n e s i a 2 0 1 3536
Impor Semen Menurut Negara Asal Utama 1, 2008–2012Imports of Cement by Major Countries of Origin 1, 2008-2012
[Diolah dari dokumen kepabeanan Ditjen Bea dan Cukai (PEB dan PIB)/Based on customs declaration documents from Directorate General of Customs and Excise (Exports and Imports Declaration)]
Negara AsalCountry of Origin 2008 2009 2010 2011 2012
(1) (2) (3) (4) (5) (6)
Berat Bersih/Net Weight: ton
Malaysia 1 087 610,3 1 425 585,9 1 240 687,1 749 510,3 589 448,0Cina / China 6 089,8 18 436,9 280 080,4 3 770,9 26 201,6Taiwan 30,1 50 036,9 186 656,4 297 155,2 367 908,8Thailand 21 119,2 17 956,1 94 254,7 143 995,4 800 077,2Korea Selatan/Korea, Republic of 99,3 126,5 103,6 215 160,9 145 965,6Perancis / France 1 649,5 569,7 1 189,3 1 662,7 1 635,3Belanda / Netherlands 1 162,5 146,9 842,8 1 192,7 766,2Vietnam 0,0 0,0 0,0 467 368,0 1 378 789,8Switzerland 14 021,0 2 000,0 0,0 28 463,0 0,0Croasia/Croatia 252,0 378,0 357,0 420,0 273,0Lainnya / Others 19 600,4 603,5 45 019,1 1 170,6 24 748,1
Jumlah/Total 1 151 634,1 1 515 840,4 1 849 190,4 1 909 869,7 3 335 813,6
Nilai CIF Value: 000 US$
Malaysia 45 865,7 68 619,5 47 342,7 33 307,5 31 684,1Cina / China 2 662,4 1 608,1 16 799,2 2 266,0 3 172,7Taiwan 13,3 2 156,0 8 337,0 14 148,2 23 749,9Thailand 1 402,0 949,4 4 084,3 7 736,6 46 650,9Korea Selatan/Korea, Republic of 93,0 129,7 100,6 10 524,2 8 012,3Perancis / France 760,4 358,7 800,2 1 265,4 1 295,9Belanda / Netherlands 889,6 122,2 708,4 1 053,2 673,2Vietnam 0,0 0,0 0,0 24 355,2 94 517,9Switzerland 557,9 97,1 0,0 1 237,8 0,0Croasia/Croatia 100,2 210,3 197,6 216,5 158,4Lainnya / Others 3 082,5 693,2 3 385,6 1 120,2 3 255,8
Jumlah/Total 55 427,0 74 944,2 81 755,6 97 230,8 213 171,1
Tabel –––––– 14.3.11Table
Catatan/Note: 1 Termasuk Kawasan Berikat/Including Bounded Zones
http
://www.b
ps.g
o.id

FOREIGN TRADE
S t a t i s t i c a l Y e a r b o o k o f I n d o n e s i a 2 0 1 3 537
Impor Minyak Bumi dan Hasil-Hasilnya 1 Menurut Negara Asal Utama 2, 2008–2012Imports of Crude Petroleum and Petroleum Products 1 by Major Countries of Origin 2, 2008–2012
[Diolah dari dokumen kepabeanan Ditjen Bea dan Cukai (PEB dan PIB)/Based on customs declaration documents from Directorate General of Customs and Excise (Exports and Imports Declaration)]
Negara AsalCountry of Origin 2008 2009 2010 2011 2012
(1) (2) (3) (4) (5) (6)
Berat Bersih/Net Weight: 000 ton
Singapura/Singapore 12 125,6 11 099,5 13 820,3 15 445,1 14 899,5Malaysia 5 482,8 4 872,3 6 561,7 5 188,1 6 235,5Arab Saudi/Saudi Arabia 5 488,8 5 470,7 6 030,7 5 363,8 4 680,3Korea Selatan/Korea, Republic of 2 247,9 1 743,8 3 146,6 5 936,0 3 810,1Kuwait 1 914,7 2 540,2 1 779,3 1 332,0 1 992,2Brunei Darussalam 3 064,7 1 410,3 1 089,8 1 207,9 477,9Nigeria 123,5 1 146,3 1 484,4 1 855,8 3 136,8Azerbaijan 133,0 1 570,4 1 517,6 2 053,6 1 463,6Cina/China 416,5 801,8 1 079,6 747,2 444,1Turki/Turkey 1 042,8 735,5 0,1 267,1 0,0Lainnya/Others 3 436,1 4 615,7 3 989,4 4 331,2 7 115,0
Jumlah / Total 35 476,5 36 006,5 40 499,5 43 727,8 44 255,0
Nilai CIF Value: 000 000 US$
Singapura/Singapore 10 693,9 6 313,8 10 187,6 15 416,3 15 449,5Malaysia 4 991,1 2 504,2 4 126,9 4 659,4 5 922,4Arab Saudi/Saudi Arabia 4 229,5 2 678,1 3 624,6 4 477,2 4 154,2Korea Selatan/Korea, Republic of 2 127,7 934,6 2 110,0 5 558,9 3 668,9Kuwait 1 787,2 1 368,6 1 177,1 1 190,5 1 885,1Brunei Darussalam 2 410,8 636,7 659,1 1 004,9 405,1Nigeria 103,3 503,6 913,2 1 606,1 2 735,0Azerbaijan 100,0 756,3 894,7 1 760,6 1 233,5Cina/China 299,3 510,8 736,2 755,8 423,9Turki/Turkey 891,6 344,4 0,1 207,6 0,0Lainnya/Others 2 918,5 2 429,6 2 983,3 4 064,2 6 686,6
Jumlah/Total 30 552,9 18 980,7 27 412,7 40 701,5 42 564,2
Catatan/Note: 1 Termasuk Gas/Including Gas 2 Termasuk Kawasan Berikat/Including Bounded Zones
Tabel –––––– 14.3.12Table
http
://www.b
ps.g
o.id

PERDAGANGAN LUAR NEGERI
S t a t i s t i k I n d o n e s i a 2 0 1 3538
Impor Pipa Besi dan Baja Menurut Negara Asal Utama 1, 2008–2012Imports of Iron and Steel Tubes by Major Countries of Origin 1, 2008–2012
[Diolah dari dokumen kepabeanan Ditjen Bea dan Cukai (PEB dan PIB)/Based on customs declaration documents from Directorate General of Customs and Excise (Exports and Imports Declaration)]
Negara AsalCountry of Origin 2008 2009 2010 2011 2012
(1) (2) (3) (4) (5) (6)
Berat Bersih/Net Weight: 000 ton
Jepang/Japan 151,6 105,8 233,2 156,2 332,5Korea Selatan/Korea, Rep of 43,0 38,3 33,0 39,5 66,2Cina/China 292,4 268,4 306,8 328,3 509,2Thailand 9,8 9,4 10,9 10,4 10,5Singapura/Singapore 150,2 100,6 115,2 76,7 97,4India 2,5 5,4 2,5 59,3 76,7Italia/Italy 6,9 6,0 25,5 35,7 41,6Amerika Serikat/United States 12,1 4,4 4,2 5,5 9,4Perancis/France 12,4 9,6 29,8 47,0 28,4Jerman/Germany 5,7 5,4 18,9 10,1 8,4Lainnya/Others 103,3 40,2 62,3 100,5 135,7
Jumlah/Total 789,9 593,5 842,3 869,2 1 316,0
Nilai CIF Value: 000 000 US$
Jepang/Japan 366,6 269,8 426,9 347,7 742,1Korea Selatan/Korea, Rep of 97,4 136,7 88,2 93,0 164,1Cina/China 331,2 331,5 375,8 405,0 600,9Thailand 28,3 22,9 35,2 35,1 30,2Singapura/Singapore 345,6 301,9 268,1 193,8 251,9India 10,9 15,3 8,9 91,7 137,0Italia/Italy 34,8 26,3 52,7 79,5 90,1Amerika Serikat/United States 73,2 35,8 43,9 50,1 69,6Perancis/France 35,0 25,7 54,2 92,8 56,4Jerman/Germany 34,8 33,9 105,8 42,2 45,0Lainnya/Others 204,1 133,0 134,8 200,1 367,2
Jumlah/Total 1 561,9 1 332,8 1 594,5 1 631,0 2 554,5
Tabel –––––– 14.3.13Table
Catatan/Note: 1 Termasuk Kawasan Berikat/Including Bounded Zones
http
://www.b
ps.g
o.id

FOREIGN TRADE
S t a t i s t i c a l Y e a r b o o k o f I n d o n e s i a 2 0 1 3 539
Nilai Impor Kendaraan Bermotor 1 Menurut Negara Asal Utama 2(Nilai CIF: juta US$), 2008–2012Import Value of Motor Vehicles 1 by Major Countries of Origin 2
(CIF Value: million US$), 2008–2012
[Diolah dari dokumen kepabeanan Ditjen Bea dan Cukai (PEB dan PIB)/Based on customs declaration documents from Directorate General of Customs and Excise (Exports and Imports Declaration)]
Negara AsalCountry of Origin 2008 2009 2010 2011 2012
(1) (2) (3) (4) (5) (6)
Jepang/Japan 463,6 344,2 828,9 1 208,0 1 574,5
Korea Selatan/Korea Rep of 17,3 38,0 48,9 61,5 63,3
Thailand 1 000,5 556,3 1 195,5 1 412,8 2 033,1
Singapura/Singapore 122,7 90,5 51,3 65,0 196,5
India 99,7 92,0 196,6 370,7 347,7
Amerika Serikat/United States 196,2 68,8 70,0 293,3 258,7
Inggris/United Kingdom 91,6 26,8 76,2 122,7 228,8
Swedia/Sweden 57,2 59,7 98,0 181,6 247,0
Jerman/Germany 60,9 58,5 122,4 171,0 171,5
Cina/China 39,3 33,0 44,3 99,3 157,1
Lainnya/Others 186,1 134,5 131,2 210,3 264,0
Jumlah/Total 2 335,1 1 502,3 2 863,3 4 196,2 5 542,2
Catatan/Note: 1 Tidak termasuk sepeda motor/Excluding motor cycles 2 Termasuk Kawasan Berikat/Including Bounded Zones
Tabel –––––– 14.3.14Table
http
://www.b
ps.g
o.id
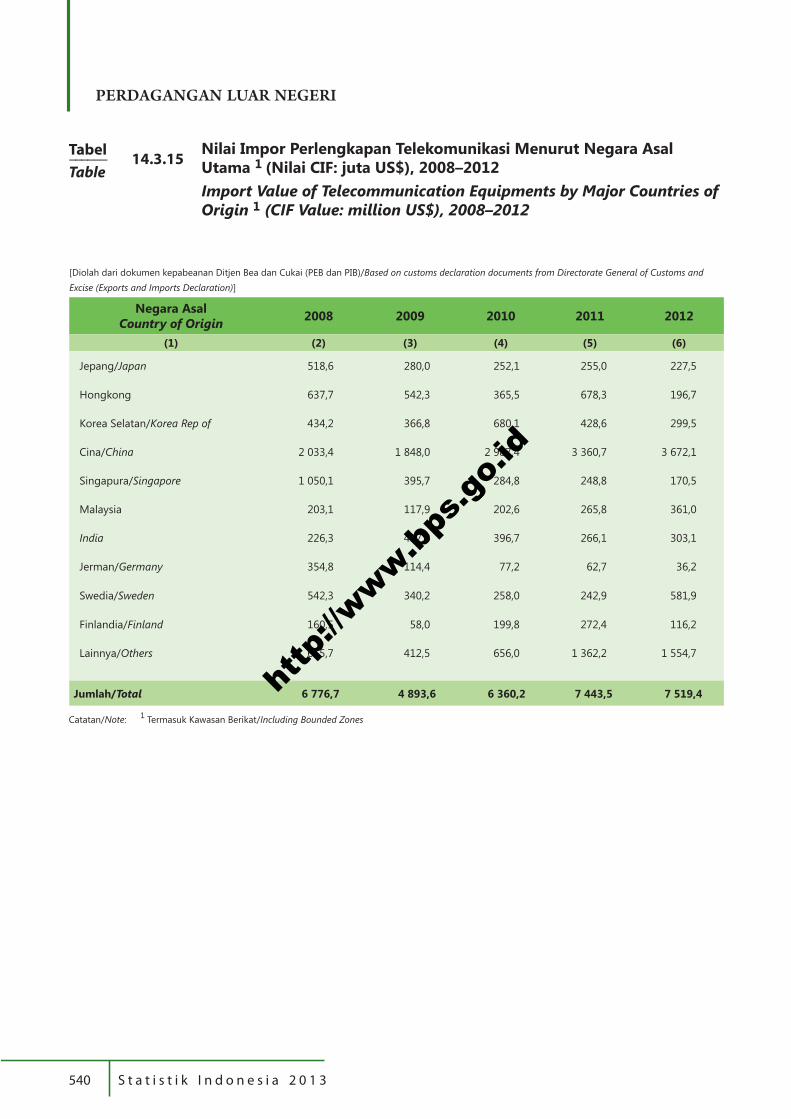
PERDAGANGAN LUAR NEGERI
S t a t i s t i k I n d o n e s i a 2 0 1 3540
Nilai Impor Perlengkapan Telekomunikasi Menurut Negara Asal Utama 1 (Nilai CIF: juta US$), 2008–2012Import Value of Telecommunication Equipments by Major Countries of Origin 1 (CIF Value: million US$), 2008–2012
[Diolah dari dokumen kepabeanan Ditjen Bea dan Cukai (PEB dan PIB)/Based on customs declaration documents from Directorate General of Customs and Excise (Exports and Imports Declaration)]
Negara AsalCountry of Origin 2008 2009 2010 2011 2012
(1) (2) (3) (4) (5) (6)
Jepang/Japan 518,6 280,0 252,1 255,0 227,5
Hongkong 637,7 542,3 365,5 678,3 196,7
Korea Selatan/Korea Rep of 434,2 366,8 680,1 428,6 299,5
Cina/China 2 033,4 1 848,0 2 987,4 3 360,7 3 672,1
Singapura/Singapore 1 050,1 395,7 284,8 248,8 170,5
Malaysia 203,1 117,9 202,6 265,8 361,0
India 226,3 417,8 396,7 266,1 303,1
Jerman/Germany 354,8 114,4 77,2 62,7 36,2
Swedia/Sweden 542,3 340,2 258,0 242,9 581,9
Finlandia/Finland 160,5 58,0 199,8 272,4 116,2
Lainnya/Others 615,7 412,5 656,0 1 362,2 1 554,7
Jumlah/Total 6 776,7 4 893,6 6 360,2 7 443,5 7 519,4
Tabel –––––– 14.3.15Table
Catatan/Note: 1 Termasuk Kawasan Berikat/Including Bounded Zones
http
://www.b
ps.g
o.id

FOREIGN TRADE
S t a t i s t i c a l Y e a r b o o k o f I n d o n e s i a 2 0 1 3 541
Impor Mesin Keperluan Industri Tertentu Menurut Negara Asal Utama 1, 2008–2012Imports of Machinery for Special Industries by Major Countries of Origin 1, 2008–2012
[Diolah dari dokumen kepabeanan Ditjen Bea dan Cukai (PEB dan PIB)/Based on customs declaration documents from Directorate General of Customs and Excise (Exports and Imports Declaration)]
Negara AsalCountry of Origin 2008 2009 2010 2011 2012
(1) (2) (3) (4) (5) (6)
Berat Bersih/Net Weight: 000 ton
Jepang/Japan 187,3 86,1 187,3 213,0 269,0Korea Selatan/Korea, Rep of 37,8 24,7 50,3 106,4 97,0Thailand 44,6 23,9 60,2 111,2 126,3Taiwan 36,3 20,1 40,3 43,3 67,2Cina/China 196,2 144,0 207,5 305,1 522,8Singapura/Singapore 51,6 33,2 31,9 45,0 2,0Malaysia 27,2 30,9 42,6 45,3 59,3Amerika Serikat/United States 35,2 23,3 26,7 39,4 44,7Jerman/Germany 18,3 12,8 24,0 27,9 36,1Italia/Italy 31,8 9,9 17,0 21,4 27,6Lainnya/Others 84,4 62,0 71,4 123,3 611,3
Jumlah/Total 750,7 470,9 759,2 1 081,3 1 863,3
Nilai CIF Value: 000 000 US$
Jepang/Japan 1 257,1 826,9 1 662,2 2 071,8 3 165,5Korea Selatan/Korea, Rep of 173,9 123,9 255,8 498,2 637,9Thailand 219,3 114,4 291,1 550,9 644,8Taiwan 250,7 146,8 288,7 324,3 549,1Cina/China 796,7 717,0 1 065,9 1 577,4 4 173,8Singapura/Singapore 598,1 429,1 466,1 508,2 52,6Malaysia 149,9 135,4 189,5 259,8 536,7Amerika Serikat/United States 474,1 330,2 378,7 565,9 738,1Jerman/Germany 400,2 301,0 546,0 640,4 827,6Italia/Italy 213,9 113,7 219,8 252,6 393,1Lainnya/Others 903,1 762,1 946,0 1 492,6 2 879,5
Jumlah/Total 5 437,0 4 000,5 6 309,8 8 742,1 14 598,7
Tabel –––––– 14.3.16Table
Catatan/Note: 1 Termasuk Kawasan Berikat/Including Bounded Zones
http
://www.b
ps.g
o.id

http
://www.b
ps.g
o.id
15SISTEM NERACANASIONAL
System of National Accounts
http
://www.b
ps.g
o.id

http
://www.b
ps.g
o.id
S Y S T E M O F N A T I O N A L A C C O U N T S
S t a t i s t i c a l Y e a r b o o k o f I n d o n e s i a 2 0 1 3 545
PENJELASAN TEKNIS
1. Penghitungan statistik neraca nasional yang digunakan di sini mengikuti buku petunjuk yang diterbitkan oleh Perserikatan Bangsa Bangsa yang dikenal sebagai “Sistem Neraca Nasional”. Namun, penerapan statistik neraca nasional tersebut telah disesuaikan dengan kondisi sosial-ekonomi Indonesia.
2. Produk Domestik Bruto (PDB) pada tingkat nasional serta Produk Domestik Regional Bruto (PDRB) pada tingkat regional (provinsi) menggambarkan kemampuan suatu wilayah untuk menciptakan output (nilai tambah) pada suatu waktu tertentu. Untuk menyusun PDB maupun PDRB digunakan 2 pendekatan, yaitu sektoral dan penggunaan. Keduanya menyajikan komposisi data nilai tambah dirinci menurut sumber kegiatan ekonomi (sektoral) dan menurut komponen penggunaannya. PDB maupun PDRB dari sisi sektoral merupakan penjumlahan seluruh komponen nilai tambah bruto yang mampu diciptakan oleh sektor-sektor ekonomi atas berbagai aktivitas produksinya. Sedangkan dari sisi penggunaan menjelaskan tentang penggunaan dari nilai tambah tersebut.
3. Penyajian PDB menurut sektor dirinci menurut total nilai tambah dari seluruh sektor ekonomi yang mencakup sektor Pertanian; Pertambangan dan Penggalian; Industri Pengolahan; Listrik, Gas, dan Air Bersih; Konstruksi; Perdagangan, Restoran, dan Hotel; Pengangkutan dan Komunikasi; Lembaga Keuangan; dan Jasa-Jasa.
4. PDB menurut penggunaan dirinci menurut komponen pengeluaran konsumsi rumah tangga (termasuk lembaga nirlaba), pengeluaran konsumsi pemerintah, pembentukan modal tetap bruto, perubahan inventori, ekspor, dan impor.
5. Pengeluaran konsumsi rumah tangga mencakup berbagai pengeluaran konsumsi akhir rumah tangga atas barang dan jasa untuk memenuhi kebutuhan individu ataupun kelompok secara langsung. Pengeluaran rumah tangga di sini mencakup pembelian untuk makanan dan bukan makanan (barang dan jasa) di dalam negeri maupun di luar negeri. Termasuk pula di sini pengeluaran lembaga nirlaba yang tujuan usahanya adalah untuk melayani keperluan rumah tangga.
TECHNICAL NOTES
1. The method used to estimate national accounts statistics is based on the standard guidelines formed by United Nation known as “System of National Accounts”. The implementation of the method however, has been adjusted according to Indonesian social-economic condition.
2. The basic measure of the output arising from economic activity is known as Gross Domestic Product (GDP) at the national level and Gross Regional Domestic Product (GRDP) at the regional level (provinces/regencies/municipalities). To compile these statistics, two approaches have been used, i.e. “production approach” and “expenditure approach”. The first approach is to measure value added produced by various kinds of economic activities, while the second approach is to measure final uses of the country’s output. In other words, GDP/GRDP is the sum of total value added produced by all economic sectors (activities) and the way of using it.
3. GDP by sector is classified by types of economic activities such as Agriculture; Mining dan Quarrying; Manufacturing; Electricity, Gas, dan Water Supply; Construction; Wholesale dan Retail Trade, Restaurants, dan Hotels; Transport and Communication; Finance, Insurance, Real Estate, dan Business Services; and other Services.
4. GDP by type of expenditures is classified into: Private consumption expenditure (household and non-profit institution), Government consumption expenditure, Gross fixed capital formation, Changes in inventories, Exports, and Imports.
5. Household consumption expenditures consist of expenditures incurred by households, which are used for both individual or collective needs. Household consumptions are classified into food and non-food (goods and services) expenditures that may take place in domestic or abroad. Expenditures here include expenditures of non-profit institutions serving households.
http
://www.b
ps.g
o.id
S I S T E M N E R A C A N A S I O N A L
S t a t i s t i k I n d o n e s i a 2 0 1 3546
6. Pengeluaran konsumsi pemerintah mencakup pengeluaran pemerintah untuk belanja pegawai, penyusutan maupun belanja barang (termasuk biaya perjalanan, pemeliharaan, dan pengeluaran rutin lainnya), baik yang dilakukan oleh pemerintah pusat maupun pemerintah daerah.
7. Pembentukan Modal Tetap Bruto mencakup pengadaan, pembuatan, dan pembelian barang modal. Barang modal dimaksud adalah barang-barang yang digunakan untuk proses produksi, tahan lama atau yang mempunyai umur pemakaian lebih dari satu tahun seperti bangunan, mesin-mesin dan alat angkutan. Termasuk pula di sini perbaikan besar (berat) yang sifatnya memperpanjang umur atau mengubah bentuk atau kapasitas barang modal tersebut. Pengeluaran barang modal untuk keperluan militer tidak dicakup di sini tetapi digolongkan sebagai konsumsi pemerintah.
8. Ekspor barang dan jasa merupakan transaksi perdagangan barang dan jasa dari penduduk (residen) ke bukan penduduk (nonresiden). Impor barang dan jasa adalah transaksi perdagangan dari bukan penduduk ke penduduk. Ekspor atau impor barang terjadi pada saat terjadi perubahan hak kepemilikan barang antara penduduk dengan bukan penduduk (dengan atau tanpa perpindahan fisik barang tersebut).
9. Produk Domestik Bruto maupun agregat turunannya disajikan dalam 2 (dua) versi penilaian, yaitu atas dasar “harga berlaku” dan atas dasar “harga konstan”. Disebut sebagai harga berlaku karena seluruh agregat dinilai dengan menggunakan harga pada tahun berjalan, sedangkan harga konstan penilaiannya didasarkan kepada harga satu tahun dasar tertentu. Dalam publikasi di sini digunakan harga tahun 2000 sebagai dasar penilaian.
10. Laju pertumbuhan Produk Domestik Bruto diperoleh dari perhitungan PDB atas dasar harga konstan. Diperoleh dengan cara mengurangi nilai PDB pada tahun ke-n terhadap nilai pada tahun ke n-1 (tahun sebelumnya), dibagi dengan nilai pada tahun ke n-1, kemudian dikalikan dengan 100 persen. Laju pertumbuhan menunjukkan perkembangan agregat pendapatan dari satu waktu tertentu terhadap waktu sebelumnya.
6. Government consumption expenditures consist of expenditures for the compensation of employees, capital consumption (depreciation) and intermediate consumption (including travel allowance, maintenance cost, and other routine expenditures) spent by either central or local government.
7. Gross fixed capital formation consists of resident producers acquisitions, less disposals, of fixed assets during a given period plus certain addition to the value of non-produced assets done by the productive activity of producer or institutional units. Fixed assets are tangible and intangible assets produced as outputs from processes of production that are used by themselves and repeatedly, or continuously in process of production for more than one year. The expenditure for military purposes are classified as government expenditure not as capital formation.
8. Exports of goods and services consist of transactions of goods and services from residents to non-residents. Imports of goods and services consist of transaction of goods and services from non-residents to residents. Exports and imports of goods occur when there are changes in ownership of goods between residents and non-residents (with or without physical movements of goods across frontiers).
9. GDP and its aggregations are presented in two forms: at current market prices and at constant base year market prices. In presenting current market prices, all aggregates are valued at current market prices, while base year constant market prices are shown by valuing all aggregates at fixed base year prices. Year of 2000 is used as the base year in this publication.
10. Growth rate of Gross Domestic Product (GDP) is derived from GDP at constant market prices. It is obtained by subtracting the value of GDP year n with the value of GDP year n-1, divided by the value of GDP year n-1 then multiplied by 100 percent. The growth rate of GDP explains the income growth during the given period.
http
://www.b
ps.g
o.id

S Y S T E M O F N A T I O N A L A C C O U N T S
S t a t i s t i c a l Y e a r b o o k o f I n d o n e s i a 2 0 1 3 547
11. Produk Nasional Bruto (PNB) adalah Produk Domestik Bruto ditambah dengan pendapatan faktor neto dari luar negeri. Pendapatan faktor neto merupakan pendapatan faktor produksi yang diterima dikurangi dengan pendapatan yang dibayarkan dari/ke luar negeri oleh residen dengan nonresiden. Pendapatan faktor produksi meliputi upah dan gaji, deviden, bunga modal, royalti, maupun pendapatan atas faktor kepemilikan lainnya.
12. Produk Nasional Neto adalah Produk Nasional Bruto dikurangi dengan penyusutan atas ausnya nilai barang modal tetap yang digunakan dalam proses produksi selama satu tahun. Disebut juga sebagai Produk Nasional Neto atas dasar harga pasar.
13. Produk Nasional Neto atas dasar biaya faktor adalah Produk Nasional Neto atas dasar harga pasar dikurangi dengan pajak tidak langsung neto (pajak tidak langsung dikurangi subsidi). Dengan istilah lain disebut sebagai Pendapatan Nasional, yang menggambarkan pendapatan yang benar-benar diterima oleh penduduk Indonesia.
14. Pendapatan Nasional per Kapita adalah pendapatan nasional atau Produk Nasional Neto atas dasar biaya faktor dibagi dengan jumlah penduduk pertengahan tahun.
15. Tabel Input-Output (I-O) pada dasarnya merupakan uraian statistik dalam bentuk matriks yang menyajikan informasi tentang transaksi barang dan jasa serta saling keterkaitan antarsatuan kegiatan ekonomi (sektor) dalam suatu wilayah pada suatu periode tertentu. Isian sepanjang baris dalam matriks menunjukkan bagaimana output suatu sektor ekonomi dialokasikan ke sektor-sektor lainnya untuk memenuhi permintaan antara dan permintaan akhir, sedangkan isian dalam kolom menunjukkan pemakaian input antara dan input primer oleh suatu sektor dalam proses produksinya.
16. Output adalah nilai dari seluruh produk yang dihasilkan oleh sektor-sektor produksi dengan memanfaatkan faktor produksi yang tersedia di suatu wilayah (negara, provinsi, dan sebagainya) dalam suatu periode waktu tertentu (umumnya satu tahun), tanpa memperhatikan asal-usul pelaku produksinya.
11. Gross National Product (GNP) is gross domestic product plus net factor income from abroad. Net factor income is received minus paid incomes due to the ownership of production factor from or to non-residents. This income could be in the form of compensation of employees, dividend, capital interests, royalties and income from other properties factors.
12. Net National Product is gross national product minus the depreciation of fixed capital goods utilized in the process of production in one year. It is also called Net National Product at market prices.
13. Net National Product at factor costs equals to net national product at market prices minus net indirect taxes (indirect taxes less subsidies). It is also known as national income that describes income actually received by Indonesian residents.
14. Per Capita National Income is national income or net national product at factor costs divided by mid-year population.
15. Input-Output (I-O) Table is a statistical framework presented in a matrix form showing the interdependence between economic sectors in a particular region and in a given period. Each row describes output of each sector distributed among intermediate and final demands, while each column shows the intermediate and primary inputs obtained from other sectors in a production process.
16. Output is the value of products produced by production sectors utilizing all production factors available in the region during a given period, without taking into account the origin of producers.
http
://www.b
ps.g
o.id

S I S T E M N E R A C A N A S I O N A L
S t a t i s t i k I n d o n e s i a 2 0 1 3548
17. Input antara adalah seluruh biaya yang dikeluarkan untuk barang dan jasa yang digunakan habis dalam proses produksi. Komponen input antara terdiri dari barang tidak tahan lama dan jasa yang dapat berupa hasil produksi dalam negeri atau impor.
18. Input primer adalah input atau biaya yang timbul sebagai akibat dari pemakaian faktor produksi dalam suatu kegiatan ekonomi. Faktor produksi antara lain tediri dari tenaga kerja, tanah, modal, dan kewiraswastaan.
19. Permintaan akhir adalah permintaan atas barang dan jasa yang digunakan untuk konsumsi akhir. Sesuai dengan pengertian ini maka permintaan akhir tidak mencakup barang jasa yang digunakan untuk kegiatan produksi. Permintaan akhir terdiri dari pengeluaran konsumsi rumah tangga, pengeluaran konsumsi pemerintah, pembentukan modal tetap bruto, perubahan stok, dan ekspor. Barang dan jasa yang digunakan untuk memenuhi permintaan akhir dapat berupa barang dan jasa hasil produksi dalam negeri (domestik) atau barang dan jasa yang diperoleh dari impor.
20. Berdasarkan hal ini jelas bahwa impor adalah komponen penyediaan dan bukan merupakan bagian dari permintaan akhir. Namun demikian dalam sistem penyajian tabel I-O, permintaan akhir dan impor disajikan dalam satu kuadran (kuadran II). Itulah sebabnya dalam konteks tabel I-O, pembahasan permintaan akhir digabung dengan impor.
21. Daya penyebaran merupakan nilai yang menjelaskan besarnya dampak dari satu unit permintaan akhir suatu sektor terhadap pertumbuhan ekonomi di masing-masing sektor secara keseluruhan. Jumlah daya penyebaran merupakan salah satu ukuran untuk melihat keterkaitan ke belakang (backward linkages).
22. Derajat kepekaan merupakan nilai yang menjelaskan besarnya pengaruh terhadap output suatu sektor yang terbentuk sebagai akibat dari satu unit permintaan akhir pada masing-masing sektor perekonomian. Oleh karena besaran ini menjelaskan pembentukan output di suatu sektor yang dipengaruhi oleh permintaan akhir masing-masing sektor perekonomian, maka ukuran ini dapat dimanfaatkan untuk melihat keterkaitan ke depan (forward linkages).
17. Intermediate inputs are all costs of obtaining goods and services that are fully utilized in the production process. The intermediate input components consist of non-durable goods and services in the form of both domestic production and imports.
18. Primary inputs are costs relating to the utilization of production factors in an economic activity. Production factors include workers, land, capital, and entrepreneurship.
19. Final demand is the demand for goods and services utilized for final consumption. In line with this definition, final demand excludes goods and services utilized in the production process. Final demand includes household consumption expenditures, government consumption expenditures, gross fixed capital formation, change in stock, and exports. Goods and services used to fulfill the final demand can be in the form of goods and services resulted from either the domestic production or imports.
20. Based on the above concept, import is a component of supply, not a part of final demand. However, in the Input-Output (I-O) Table, final demand and imports are presented in one quadrant (quadrant II). That is why in the context of I-O Table, discussion of final demand is integrated with that of imports.
21. Backward linkage is a value measuring the impact of one unit final demand of a particular sector on the economic growth of each sector. Total backward linkage can be used to observe backward interconnection among sectors.
22. Forward linkage is a value measuring output of a particular sector which is resulted from one unit final demand in each sector in the economy. This measure can be used to look at forward interconnection among sectors ( forward linkages).
http
://www.b
ps.g
o.id
S Y S T E M O F N A T I O N A L A C C O U N T S
S t a t i s t i c a l Y e a r b o o k o f I n d o n e s i a 2 0 1 3 549
23. Sistem Neraca Sosial Ekonomi (SNSE) merupakan suatu kerangka data yang disusun dalam bentuk matriks yang merangkum berbagai variabel sosial dan ekonomi secara terintegrasi sehingga dapat memberikan gambaran umum mengenai perekonomian suatu negara dan keterkaitan antar variabel-variabel ekonomi dan sosial pada suatu waktu tertentu. Dengan menggunakan SNSE, keragaman ekonomi dan sosial suatu negara, seperti tabungan, distribusi pendapatan, baik distribusi pendapatan rumah tangga maupun distribusi pendapatan faktorial, dan juga pola pengeluaran rumah tangga dapat ditelaah.
24. Upah/gaji adalah nilai tambah yang dibayarkan sebagai balas jasa atas penggunaan faktor produksi tenaga kerja (termasuk di dalamnya imputasi upah dan gaji).
25. Ekivalen tenaga kerja (ETK) adalah ukuran produktivitas tenaga kerja, yang artinya 1 (satu) ETK setara dengan 1 (satu) tenaga kerja yang bekerja selama 40 jam seminggu, sehingga bila seorang tenaga kerja bekerja kurang dari 40 jam seminggu maka tenaga kerja tersebut dihitung sebagai kurang dari 1 (satu) ETK, demikian juga sebaliknya.
26. Pendapatan rumah tangga adalah pendapatan yang diterima oleh rumah tangga, baik yang berasal dari pendapatan kepala rumah tangga maupun pendapatan anggota rumah tangga. Pendapatan rumah tangga dapat berasal dari balas jasa faktor produksi tenaga kerja (upah dan gaji, keuntungan, bonus, dll), balas jasa kapital (sewa, bagi hasil, dll), maupun pendapatan yang berasal dari pemberian pihak lain (transfer).
27. Jumlah pendapatan rumah tangga adalah total pendapatan yang diterima oleh rumah tangga, baik yang berasal dari pendapatan kepala rumah tangga maupun pendapatan anggota rumah tangga.
28. Pendapatan rumah tangga setelah pajak adalah pendapatan rumah tangga setelah dikurangi pajak.
29. Pendapatan disposabel adalah pendapatan rumah tangga setelah dikurangi dengan beban yang harus dibayar oleh rumah tangga.
23. Social Accounting Matrix (SAM) is a data framework in matrix form that covers various social and economic variables integrally to describe economic performances in a country and the relationships between economic and social variables in a certain period. SAM particularly shows social and economic indicators such as saving, income distribution in terms of both household income distribution and factorial income distribution, and household expenditure patterns accordingly.
24. Wage/salary is value added paid as reward of employing labor production factor (including imputation of wage and salary).
25. Worker equivalent is an indicator of worker productivity. Worker equivalent equals to one means that one worker equivalent equals to one worker working for 40 hours a week. If a worker works less than 40 hours a week, the worker is said to be less than 1 worker equivalent, and vice versa.
26. Household income is defined as incomes received by all household members. Household income can be in the form of production factors compensation (wages and salaries, profits, bonuses, etc.), capital compensation (rent, profit sharing, etc.), or incomes from transfer.
27. Total household income is total income received by all household members (head of household and its members).
28. Household income after tax is household income minus tax.
29. Disposable income is household income minus liabilities that must be paid by household.
http
://www.b
ps.g
o.id

S I S T E M N E R A C A N A S I O N A L
S t a t i s t i k I n d o n e s i a 2 0 1 3550
30. Pendapatan kapital adalah nilai tambah yang dibayarkan sebagai balas jasa atas penggunaan faktor produksi bukan tenaga kerja termasuk di dalamnya keuntungan, dividen, bunga, sewa tanah, dan sejenisnya.
31. Pengeluaran konsumsi adalah pengeluaran aktual rumah tangga untuk konsumsi akhir terhadap berbagai jenis produk seperti sandang, pangan, papan (tidak termasuk pengeluaran untuk transfer). Pengeluaran konsumsi ini mencakup pembelian berbagai jenis barang dan jasa hasil dari produksi domestik maupun impor.
32. Pajak yang dimaksud disini adalah pajak langsung, yakni jenis pungutan pemerintah secara langsung dikumpulkan dari pihak yang wajib membayar pajak.
33. Rumah tangga adalah seseorang atau sekelompok orang yang tinggal dalam satu atap dan makan dari satu dapur.
34. Tenaga kerja pertanian adalah tenaga kerja dalam usaha pertanian termasuk perkebunan, perikanan, kehutanan, dan perburuan, yang atas nama sendiri atau bersama dengan pihak lain, memimpin, menyelenggarakan, mengawasi, atau melaksanakan usaha pertanian, peternakan, kehutanan, perikanan, perburuan, dan penangkapan hewan dan usaha-usaha yang berhubungan dengan itu.
35. Tenaga kerja produksi, operator alat angkutan, manual adalah tenaga kerja yang melaksanakan kegiatan penggalian dan pengolahan bahan tambang, minyak dan gas bumi; proses pemuatan barang; konstruksi, perawatan, dan perbaikan berbagai jenis jalan, bangunan, mesin, dan lain-lain, termasuk di dalamnya tenaga kerja yang mengerjakan bahan-bahan, mengemudikan alat angkutan dan peralatan lain serta melaksanakan tugas yang terutama menggunakan tenaga jasmani.
36. Tenaga kerja tata usaha, penjualan, dan jasa adalah tenaga kerja dalam berbagai jabatan tata usaha yang meliputi pekerja pengawas tata usaha, pejabat pelaksana pemerintah, pengawas pelaksanaan jasa angkutan dan komunikasi, penyusun dan pemelihara catatan transaksi keuangan termasuk pengurus kas, pencatat, baik lisan atau tertulis (steno, mesin, dan
30. Capital income is value added paid as a result of the utilization of non-worker production factors. It includes profits, dividend, interest, land renting, and others in the same category.
31. Consumption expenditure is actual expenditure of household for final consumption spent for various goods and services (excluding transfer). Consumption expenditure includes spending for various goods and services resulted from domestic production and imports.
32. Tax defined here refers to direct tax, which is defined as government charges directly collected from tax payers.
33. Household is an individual or a group of people living in a physical/census building unit or part thereof who make common provision for food and other essensials of living.
34. Agricultural worker is someone working in the agricultural sector including estates, fishery, forestry, and hunting, whether working as an individual or in collaboration with other parties, leading, supervising , and conducting activities in agriculture, estates, forestry, fishery, and hunting as well as related activites.
35. Production, operator, and manual workers are those having activities of quarrying and processing mining ore, oil and gas; processing of stuffing; constructing , maintaining, and repairing roads, buildings, machineries, etc, including workers who prepares materials, driving and operating vehicles and other equipments and other physical jobs.
36. Clerical, sales, and services workers consist of administration supervisors, governmental officers, supervisors of transportation and communication activities, staff of financial transaction activities, including distributors of shipment articles, and other related jobs.
http
://www.b
ps.g
o.id

S Y S T E M O F N A T I O N A L A C C O U N T S
S t a t i s t i c a l Y e a r b o o k o f I n d o n e s i a 2 0 1 3 551
ketik), melayani mesin kantor, peralatan telepon dsb, termasuk penyelenggara angkutan darat bagi penumpang, pendistribusi barang kiriman, dan tugas lain yang sejenis.
37. Tenaga kerja profesional, teknisi, manajer, militer meliputi pejabat legislatif dan tenaga manajemen; manajer (utama, produksi, kecuali produksi pertanian, pemasaran, keuangan, administrasi, personalia, litbang) dan direktur. Sedangkan tenaga profesional dan teknisi adalah mereka yang dalam pekerjaannya dengan menerapkan ilmu pengetahuan untuk memecahkan berbagai persoalan teknologi, sosial, ekonomi, industri serta melakukan fungsi-fungsi keahlian, teknis, kesenian, dan yang berhubungan dengan itu dalam berbagai bidang termasuk olahraga.
38. Tenaga kerja penerima upah gaji meliputi buruh/karyawan/pegawai dan pekerja bebas (pertanian/ nonpertanian).
39. Tenaga kerja bukan penerima upah gaji meliputi tenaga kerja yang status pekerjaannya berusaha sendiri, berusaha dibantu buruh tidak tetap/buruh tak dibayar, berusaha dibantu buruh tetap/dibayar, serta pekerja keluarga/tak dibayar.
40. Rumah tangga buruh tani adalah rumah tangga dengan kepala rumah tangga atau penerima pendapatan terbesar bekerja sebagai buruh tani.
41. Rumah tangga petani gurem adalah rumah tangga yang kepala rumah tangganya atau penerima pendapatan terbesar menerima pendapatan dari hasil mengusahakan lahan pertanian yang memiliki lahan pertanian kurang dari 0,5 ha.
42. Rumah tangga pengusaha pertanian yang memiliki lahan 0,5–1 ha adalah rumah tangga yang kepala rumah tangganya atau penerima pendapatan terbesar, menerima pendapatan dari hasil mengusahakan lahan pertanian yang memiliki lahan pertanian 0,5–1 ha.
43. Rumah tangga pengusaha pertanian yang memiliki lahan lebih dari 1 ha adalah rumah tangga yang kepala rumah tangganya atau penerima pendapatan terbesar, menerima pendapatan dari hasil mengusahakan lahan pertanian yang memiliki lahan pertanian lebih dari 1 ha.
37. Professional, technician, managerial, and non-civilian workers consist of managers (main, production excluding agricultural production, marketing, financial, administration, HRD, and research and development), and director. Meanwhile, professional and technician are those who are implementing their knowledge in technological, social, economic, and industrial problems, as well as experts, arts, and sports.
38. Paid workers consist of labors/employees and free labors (agricultural and non-agricultural).
39. Unpaid workers consist of own workers, own workers with temporary/unpaid workers, own workers with permanent/paid workers, and family workers.
40. Agricultural labour household is a household with household head working as agricultural labor or the main income being from working as agricultural laborer.
41. Operator, landowner of 0,0–0,5 ha agricultural household is defined as household with household’s head working for or the main income being from utilizing agricultural land of less than 0,5 ha.
42. Operator, landowner of 0,5–1,0 ha agricultural household is defined as household with household’s head working for or the main income being from utilizing agricultural land of 0,5–1 ha.
43. Operator, landowner of > 1,0 ha agricultural household is defined as household with household’s head working for or the main income being from utilizing agricultural land of more than 1 ha.
http
://www.b
ps.g
o.id

S I S T E M N E R A C A N A S I O N A L
S t a t i s t i k I n d o n e s i a 2 0 1 3552
44. Rumah tangga bukan pertanian golongan rendah di desa/kota adalah rumah tangga bukan pertanian yang kepala rumah tangganya atau penerima pendapatan terbesar bekerja sebagai pengusaha bebas golongan rendah, tenaga tata usaha golongan rendah, pedagang keliling, pekerja bebas sektor angkutan (seperti supir bus, kondektur bus), pekerja bebas sektor jasa perorangan, atau pekerja kasar di perdesaan/perkotaan.
45. Rumah tangga bukan angkatan kerja di desa/kota adalah rumah tangga dengan kepala rumah tangga yang sudah tidak bekerja lagi (penerima pensiun) atau pendapatan terbesarnya berasal dari transfer (penerimaan tanpa balas) di perdesaan/perkotaan.
46. Rumah tangga bukan pertanian golongan atas di desa/kota adalah rumah tangga bukan pertanian yang kepala rumah tangganya atau penerima pendapatan terbesarnya bekerja sebagai pengusaha bebas (bukan pertanian) golongan atas seperti manajer, profesional (akuntan, dokter, dsb), militer, guru/dosen/guru besar, pekerja tata usaha, dan penjualan golongan atas di perdesaan/perkotaan.
47. Neraca Arus Dana (NAD) merupakan suatu sistem data finansial yang secara lengkap menggambarkan penggunaan tabungan dan sumber dana lainnya dimasing-masing sektor institusi untuk membiayai investasi finansial maupun investasi nonfinansial (investasi riil) pada periode waktu tertentu. Sumber dana lainnya adalah penerimaan yang berasal dari transaksi keuangan, seperti: penerimaan dana hasil penerbitan saham/obigasi, kredit, dsb. Sedangkan sektor institusi yang dicakup meliputi: Bank Sentral, Bank, Pemerintahan Umum, Lembaga Keuangan Bukan Bank, Rumah Tangga, Perusahaan Swasta Nonfinansial, Perusahaan Pemerintah Nonfinansial, dan Luar Negeri.
48. Tabungan Bruto merupakan selisih antara penerimaan dan pengeluaran dari kegiatan ekonomi ditambah penyusutan barang modal. Penerimaan meliputi: pendapatan dari penjualan barang dan jasa, peneriman dari balas jasa faktor produksi yang dimiliki (upah/gaji, deviden, bunga, sewa, dsb), dan transfer (subsidi, pajak, bantuan luar negeri, dan pensiun). Pengeluaran mencakup: pengeluaran untuk konsumsi, transfer (seperti pajak, dll), dan pengeluaran lainnya
44. Non-agricultural low income level rural/urban household is non-agricultural household in urban/rural areas with household’s head working as or the main income being from working as own account worker with low income, low level clerical worker, vendor, casual employee in the transportation, and individual service sectors or laborer.
45. Non-labour force rural/urban household is household in urban/rural areas with household’s head not working anymore (pension receiver) or the main income being from transfer.
46. Non-agricultural high income level rural/urban household is non-agricultural household in urban/ rural areas with household’s head working as or the main income being from working as own account worker with high income, manager, professional worker, and high level clerical or sales worker.
47. Flow of fund accounts is a financial data system that completely describes the flows of saving and other sources in institution sectors, which used to funding financial investment and non financial investment (real investment) in a certain period. Other sources of fund are incomes from financial transaction, such as: stock or bond issued, credit, etc. While institution sectors in these system covers: Central Bank, Banks, General Government, Non-Banks Financial Institutions, Households, Non-Financial Private Enterprises, Non-Financial Government Enterprises, and Rest of the World.
48. Gross saving is difference between incomes and expenditures from economic activity plus the consumption of fixed capital. Incomes including: earning from selling of goods and services, income from own production factors (wages/salary, dividend, interest, rent, etc), and current transfer (subsidy, taxes, foreign aids, and pension). Expenditures include: consumption expenditure, current transfer (such as taxes, etc), and other expenditure (except expenditurse for production activity) such as
http
://www.b
ps.g
o.id
S Y S T E M O F N A T I O N A L A C C O U N T S
S t a t i s t i c a l Y e a r b o o k o f I n d o n e s i a 2 0 1 3 553
(selain pengeluaran untuk kegiatan produksi) seperti pembayaran deviden dan bunga.
Pada masing-masing sektor, tabungan bruto awalnya merupakan sumber dana untuk investasi nonfinansial. Selisihnya digunakan untuk membiayai investasi finansial. Pada perekonomian nasional, tabungan bruto seluruh institusi (S) sama dengan investasi nonfinansial seluruh institusi (I). Sehingga secara makro, Tabungan sama dengan Investasi (S = I).
49. Investasi Nonfinansial terdiri dari Pembentukan Modal Tetap Bruto dan Perubahan Inventori.
50. Pinjaman Neto atau Saving Investment Gap merupakan selisih antara Tabungan Bruto dengan Investasi Nonfinansial. Pinjaman Neto disebut juga investasi finansal (neto) karena merupakan salah satu sumber untuk investasi finansial.
dividend and interest payment. In each sector, at the first time gross saving was source
of fund for non-financial investment. The residual used for financing financial investment. In macro economic, gross saving for all institution (S) equal to non financial investment for all institution (I). So, in the macro, Saving equal to Investment (S = I).
49. Non-Finacial Investment consist of Gross Fixed Capital Formation and Changes in Inventories.
50. Net Lending or Saving Investment Gap is the difference between gross saving and non-financial investment. Net lending also called net financial investment because it is one of source for financial investment.
http
://www.b
ps.g
o.id
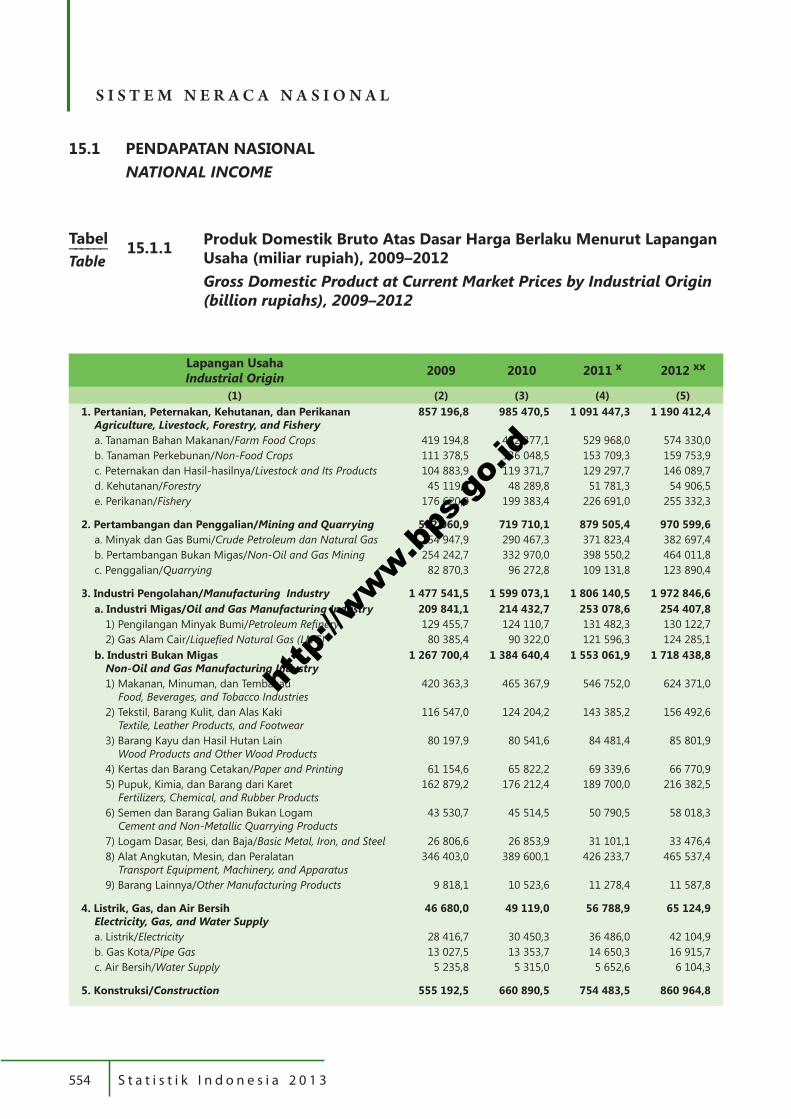
S I S T E M N E R A C A N A S I O N A L
S t a t i s t i k I n d o n e s i a 2 0 1 3554
Lapangan UsahaIndustrial Origin 2009 2010 2011 x 2012 xx
(1) (2) (3) (4) (5)1. Pertanian, Peternakan, Kehutanan, dan Perikanan
Agriculture, Livestock, Forestry, and Fishery 857 196,8 985 470,5 1 091 447,3
1 190 412,4
a. Tanaman Bahan Makanan/Farm Food Crops 419 194,8 482 377,1 529 968,0 574 330,0 b. Tanaman Perkebunan/Non-Food Crops 111 378,5 136 048,5 153 709,3 159 753,9 c. Peternakan dan Hasil-hasilnya/Livestock and Its Products 104 883,9 119 371,7 129 297,7 146 089,7 d. Kehutanan/Forestry 45 119,6 48 289,8 51 781,3 54 906,5 e. Perikanan/Fishery 176 620,0 199 383,4 226 691,0 255 332,3
2. Pertambangan dan Penggalian/Mining and Quarrying 592 060,9 719 710,1 879 505,4 970 599,6 a. Minyak dan Gas Bumi/Crude Petroleum dan Natural Gas 254 947,9 290 467,3 371 823,4 382 697,4 b. Pertambangan Bukan Migas/Non-Oil and Gas Mining 254 242,7 332 970,0 398 550,2 464 011,8 c. Penggalian/Quarrying 82 870,3 96 272,8 109 131,8 123 890,4
3. Industri Pengolahan/Manufacturing Industry 1 477 541,5 1 599 073,1 1 806 140,5 1 972 846,6 a. Industri Migas/Oil and Gas Manufacturing Industry 209 841,1 214 432,7 253 078,6 254 407,8
1) Pengilangan Minyak Bumi/Petroleum Refinery 129 455,7 124 110,7 131 482,3 130 122,7 2) Gas Alam Cair/Liquefied Natural Gas (LNG) 80 385,4 90 322,0 121 596,3 124 285,1
b. Industri Bukan MigasNon-Oil and Gas Manufacturing Industry
1 267 700,4 1 384 640,4 1 553 061,9 1 718 438,8
1) Makanan, Minuman, dan TembakauFood, Beverages, and Tobacco Industries
420 363,3 465 367,9 546 752,0 624 371,0
2) Tekstil, Barang Kulit, dan Alas Kaki Textile, Leather Products, and Footwear
116 547,0 124 204,2 143 385,2 156 492,6
3) Barang Kayu dan Hasil Hutan LainWood Products and Other Wood Products
80 197,9 80 541,6 84 481,4 85 801,9
4) Kertas dan Barang Cetakan/Paper and Printing 61 154,6 65 822,2 69 339,6 66 770,9 5) Pupuk, Kimia, dan Barang dari Karet
Fertilizers, Chemical, and Rubber Products 162 879,2 176 212,4 189 700,0 216 382,5
6) Semen dan Barang Galian Bukan Logam Cement and Non-Metallic Quarrying Products
43 530,7 45 514,5 50 790,5 58 018,3
7) Logam Dasar, Besi, dan Baja/Basic Metal, Iron, and Steel 26 806,6 26 853,9 31 101,1 33 476,4 8) Alat Angkutan, Mesin, dan Peralatan
Transport Equipment, Machinery, and Apparatus 346 403,0 389 600,1 426 233,7 465 537,4
9) Barang Lainnya/Other Manufacturing Products 9 818,1 10 523,6 11 278,4 11 587,8
4. Listrik, Gas, dan Air BersihElectricity, Gas, and Water Supply
46 680,0 49 119,0 56 788,9 65 124,9
a. Listrik/Electricity 28 416,7 30 450,3 36 486,0 42 104,9 b. Gas Kota/Pipe Gas 13 027,5 13 353,7 14 650,3 16 915,7 c. Air Bersih/Water Supply 5 235,8 5 315,0 5 652,6 6 104,3
5. Konstruksi/Construction 555 192,5 660 890,5 754 483,5 860 964,8
15.1 PENDAPATAN NASIONAL NATIONAL INCOME
Produk Domestik Bruto Atas Dasar Harga Berlaku Menurut Lapangan Usaha (miliar rupiah), 2009–2012Gross Domestic Product at Current Market Prices by Industrial Origin (billion rupiahs), 2009–2012
Tabel –––––– 15.1.1Table
http
://www.b
ps.g
o.id
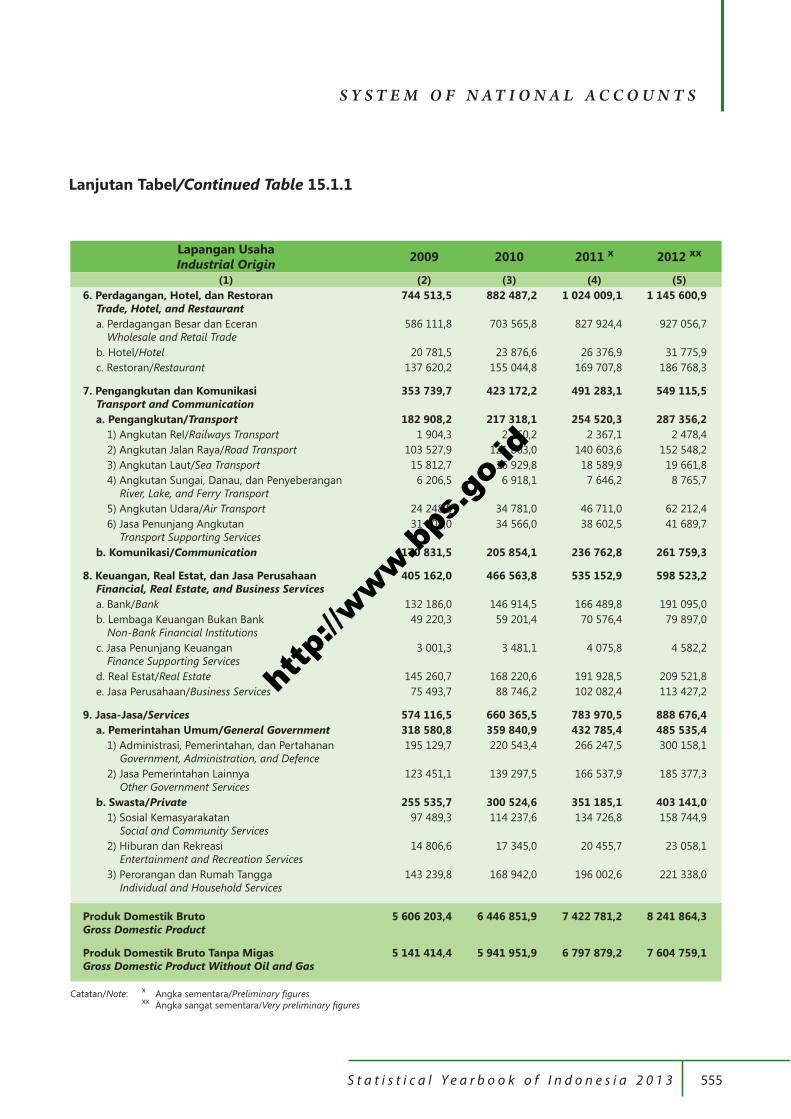
S Y S T E M O F N A T I O N A L A C C O U N T S
S t a t i s t i c a l Y e a r b o o k o f I n d o n e s i a 2 0 1 3 555
Lapangan UsahaIndustrial Origin 2009 2010 2011 x 2012 xx
(1) (2) (3) (4) (5)6. Perdagangan, Hotel, dan Restoran
Trade, Hotel, and Restaurant 744 513,5 882 487,2 1 024 009,1 1 145 600,9
a. Perdagangan Besar dan Eceran Wholesale and Retail Trade
586 111,8 703 565,8 827 924,4 927 056,7
b. Hotel/Hotel 20 781,5 23 876,6 26 376,9 31 775,9 c. Restoran/Restaurant 137 620,2 155 044,8 169 707,8 186 768,3
7. Pengangkutan dan Komunikasi Transport and Communication
353 739,7 423 172,2 491 283,1 549 115,5
a. Pengangkutan/Transport 182 908,2 217 318,1 254 520,3 287 356,2 1) Angkutan Rel/Railways Transport 1 904,3 2 260,2 2 367,1 2 478,4 2) Angkutan Jalan Raya/Road Transport 103 527,9 121 863,0 140 603,6 152 548,2 3) Angkutan Laut/Sea Transport 15 812,7 16 929,8 18 589,9 19 661,8 4) Angkutan Sungai, Danau, dan Penyeberangan
River, Lake, and Ferry Transport 6 206,5 6 918,1 7 646,2 8 765,7
5) Angkutan Udara/Air Transport 24 248,8 34 781,0 46 711,0 62 212,4 6) Jasa Penunjang Angkutan
Transport Supporting Services 31 208,0 34 566,0 38 602,5 41 689,7
b. Komunikasi/Communication 170 831,5 205 854,1 236 762,8 261 759,3
8. Keuangan, Real Estat, dan Jasa PerusahaanFinancial, Real Estate, and Business Services
405 162,0 466 563,8 535 152,9 598 523,2
a. Bank/Bank 132 186,0 146 914,5 166 489,8 191 095,0 b. Lembaga Keuangan Bukan Bank
Non-Bank Financial Institutions 49 220,3 59 201,4 70 576,4 79 897,0
c. Jasa Penunjang Keuangan Finance Supporting Services
3 001,3 3 481,1 4 075,8 4 582,2
d. Real Estat/Real Estate 145 260,7 168 220,6 191 928,5 209 521,8 e. Jasa Perusahaan/Business Services 75 493,7 88 746,2 102 082,4 113 427,2
9. Jasa-Jasa/Services 574 116,5 660 365,5 783 970,5 888 676,4 a. Pemerintahan Umum/General Government 318 580,8 359 840,9 432 785,4 485 535,4
1) Administrasi, Pemerintahan, dan Pertahanan Government, Administration, and Defence
195 129,7 220 543,4 266 247,5 300 158,1
2) Jasa Pemerintahan LainnyaOther Government Services
123 451,1 139 297,5 166 537,9 185 377,3
b. Swasta/Private 255 535,7 300 524,6 351 185,1 403 141,0 1) Sosial Kemasyarakatan
Social and Community Services 97 489,3 114 237,6 134 726,8 158 744,9
2) Hiburan dan RekreasiEntertainment and Recreation Services
14 806,6 17 345,0 20 455,7 23 058,1
3) Perorangan dan Rumah TanggaIndividual and Household Services
143 239,8 168 942,0 196 002,6 221 338,0
Produk Domestik Bruto Gross Domestic Product
5 606 203,4 6 446 851,9 7 422 781,2 8 241 864,3
Produk Domestik Bruto Tanpa Migas Gross Domestic Product Without Oil and Gas
5 141 414,4 5 941 951,9
6 797 879,2 7 604 759,1
Lanjutan Tabel/Continued Table 15.1.1
Catatan/Note: x Angka sementara/Preliminary figures xx Angka sangat sementara/Very preliminary figures
http
://www.b
ps.g
o.id

S I S T E M N E R A C A N A S I O N A L
S t a t i s t i k I n d o n e s i a 2 0 1 3556
Lapangan UsahaIndustrial Origin 2009 2010 2011 x 2012 xx
(1) (2) (3) (4) (5)1. Pertanian, Peternakan, Kehutanan, dan Perikanan
Agriculture, Livestock, Forestry, and Fishery 295 883,8 304 777,1 315 036,8 327 549,7
a. Tanaman Bahan Makanan/Farm Food Crops 149 057,8 151 500,7 154 153,9 158 694,5 b. Tanaman Perkebunan/Non-Food Crops 45 558,4 47 150,6 49 260,4 51 763,3 c. Peternakan dan Hasil-hasilnya/Livestock and Its Products 36 648,9 38 214,4 40 040,3 41 971,8 d. Kehutanan/Forestry 16 843,6 17 249,6 17 395,5 17 423,0 e. Perikanan/Fishery 47 775,1 50 661,8 54 186,7 57 697,1
2. Pertambangan dan Penggalian/Mining and Quarrying 180 200,5 187 152,5 189 761,4 192 585,4 a. Minyak dan Gas Bumi/Crude Petroleum dan Natural Gas 95 230,0 96 146,0 95 155,2 91 691,1 b. Pertambangan Bukan Migas/Non-Oil and Gas Mining 63 820,1 68 481,5 70 405,9 74 836,4 c. Penggalian/Quarrying 21 150,4 22 525,0 24 200,3 26 057,9
3. Industri Pengolahan/Manufacturing Industry 570 102,5 597 134,9 633 781,9 670 109,0 a. Industri Migas/Oil and Gas Manufacturing Industry 46 934,9 47 199,3 46 757,8 45 492,3
1) Pengilangan Minyak Bumi/Petroleum Refinery 21 083,6 21 346,5 21 459,7 21 088,2 2) Gas Alam Cair/Liquefied Natural Gas (LNG) 25 851,3 25 852,8 25 298,1 24 404,1
b. Industri Bukan MigasNon-Oil and Gas Manufacturing Industry
523 167,6 549 935,6 587 024,1 624 616,7
1) Makanan, Minuman, dan TembakauFood, Beverages, and Tobacco Industries
155 620,2 159 947,2 174 566,7 188 081,7
2) Tekstil, Barang Kulit, dan Alas Kaki Textile, Leather Products, and Footwear
51 299,9 52 206,2 56 131,1 58 483,6
3) Barang Kayu dan Hasil Hutan LainWood Products and Other Wood Products
20 055,0 19 359,7 19 427,4 18 887,3
4) Kertas dan Barang Cetakan/Paper and Printing 27 092,4 27 544,7 27 930,3 26 460,2 5) Pupuk, Kimia, dan Barang dari Karet
Fertilizers, Chemical, and Rubber Products 69 514,2 72 782,0 75 657,5 83 412,4
6) Semen dan Barang Galian Bukan Logam Cement and Non-Metallic Quarrying Products
15 908,9 16 255,6 17 424,1 18 791,9
7) Logam Dasar, Besi, dan Baja/Basic Metal, Iron, and Steel 7 702,0 7 885,6 8 915,2 9 490,5 8) Alat Angkutan, Mesin, dan Peralatan
Transport Equipment, Machinery, and Apparatus 172 085,1 189 947,9 202 892,0 216 970,0
9) Barang Lainnya/Other Manufacturing Products 3 889,9 4 006,7 4 079,8 4 039,1
4 Listrik, Gas, dan Air BersihElectricity, Gas, and Water Supply
17 136,8 18 050,2 18 921,0 20 131,4
a. Listrik/Electricity 10 483,1 11 050,8 11 959,6 12 959,0 b. Gas Kota/Pipe Gas 4 496,6 4 718,0 4 583,9 4 696,4 c. Air Bersih/Water Supply 2 157,1 2 281,4 2 377,5 2 476,0
5. Konstruksi/Construction 140 267,8 150 022,4 159 993,4 171 996,6
Produk Domestik Bruto Atas Dasar Harga Konstan 2000 Menurut Lapangan Usaha (miliar rupiah), 2009–2012Gross Domestic Product at 2000 Constant Market Prices by Industrial Origin (billion rupiahs), 2009–2012
Tabel –––––– 15.1.2Table
http
://www.b
ps.g
o.id

S Y S T E M O F N A T I O N A L A C C O U N T S
S t a t i s t i c a l Y e a r b o o k o f I n d o n e s i a 2 0 1 3 557
Lapangan UsahaIndustrial Origin 2009 2010 2011 x 2012 xx
(1) (2) (3) (4) (5)6. Perdagangan, Hotel, dan Restoran
Trade, Hotel, and Restaurant 368 463,0 400 474,9 437 199,7 472 646,2
a. Perdagangan Besar dan Eceran Wholesale and Retail Trade
302 028,4 331 312,9 364 321,8 395 890,0
b. Hotel/Hotel 15 200,8 16 230,9 17 745,7 19 297,1 c. Restoran/Restaurant 51 233,8 52 931,1 55 132,2 57 459,1
7. Pengangkutan dan Komunikasi Transport and Communication
192 198,8 217 980,4 241 298,0 265 378,4
a. Pengangkutan/Transport 79 571,5 85 293,4 91 841,8 97 873,5 1) Angkutan Rel/Railways Transport 792,2 832,0 798,8 745,5 2) Angkutan Jalan Raya/Road Transport 34 226,5 35 974,4 38 339,3 41 071,0 3) Angkutan Laut/Sea Transport 8 855,6 8 864,6 9 157,2 9 547,9 4) Angkutan Sungai, Danau, dan Penyeberangan
River, Lake, and Ferry Transport 2 760,7 2 964,2 3 083,5 3 288,9
5) Angkutan Udara/Air Transport 14 564,3 17 330,4 19 817,8 21 481,1 6) Jasa Penunjang Angkutan
Transport Supporting Services 18 372,2 19 327,8 20 645,2 21 739,1
b. Komunikasi/Communication 112 627,3 132 687,0 149 456,2 167 504,9
8. Keuangan, Real Estat, dan Jasa PerusahaanFinancial, Real Estate, and Business Services
209 163,0 221 024,2 236 146,6 253 022,7
a. Bank/Bank 86 057,5 90 167,8 96 393,1 104 391,0 b. Lembaga Keuangan Bukan Bank
Non-Bank Financial Institutions 18 147,6 19 333,5 20 745,1 22 222,8
c. Jasa Penunjang Keuangan Finance Supporting Services
1 424,6 1 508,5 1 627,2 1 729,8
d. Real Estat/Real Estate 63 957,6 67 497,1 71 760,2 76 100,3 e. Jasa Perusahaan/Business Services 39 575,7 42 517,3 45 621,0 48 578,8
9. Jasa-Jasa/Services 205 434,2 217 842,2 232 537,7 244 719,8 a. Pemerintahan Umum/General Government 88 683,2 92 802,6 97 799,1 99 563,2
1) Administrasi, Pemerintahan, dan Pertahanan Government, Administration, and Defence
55 845,8 58 395,7 61 506,5 62 535,8
2) Jasa Pemerintahan LainnyaOther Government Services
32 837,4 34 406,9 36 292,6 37 027,4
b. Swasta/Private 116 751,0 125 039,6 134 738,6 145 156,6 1) Sosial Kemasyarakatan
Social and Community Services 29 688,7 31 591,1 33 685,6 36 130,8
2) Hiburan dan RekreasiEntertainment and Recreation Services
9 000,1 9 671,6 10 461,7 11 265,9
3) Perorangan dan Rumah TanggaIndividual and Household Services
78 062,2 83 776,9 90 591,3 97 759,9
Produk Domestik Bruto Gross Domestic Product
2 178 850,4 2 314 458,8 2 464 676,5 2 618 139,2
Produk Domestik Bruto Tanpa Migas Gross Domestic Product Without Oil and Gas
2 036 685,5 2 171 113,5 2 322 763,5 2 480 955,8
Lanjutan Tabel/Continued Table 15.1.2
Catatan/Note: x Angka sementara/Preliminary figures xx Angka sangat sementara/Very preliminary figures
http
://www.b
ps.g
o.id

S I S T E M N E R A C A N A S I O N A L
S t a t i s t i k I n d o n e s i a 2 0 1 3558
Lapangan UsahaIndustrial Origin 2009 2010 2011 x 2012 xx
(1) (2) (3) (4) (5)1. Pertanian, Peternakan, Kehutanan, dan Perikanan
Agriculture, Livestock, Forestry, and Fishery15,29 15,29 14,70 14,44
a. Tanaman Bahan Makanan/Farm Food Crops 7,48 7,48 7,14 6,97b. Tanaman Perkebunan/Non-Food Crops 1,99 2,11 2,07 1,94c. Peternakan dan Hasil-hasilnya/Livestock and Its Products 1,87 1,85 1,74 1,77d. Kehutanan/Forestry 0,80 0,75 0,70 0,67e. Perikanan/Fishery 3,15 3,09 3,05 3,10
2. Pertambangan dan Penggalian/Mining and Quarrying 10,56 11,16 11,85 11,78a. Minyak dan Gas Bumi/Crude Petroleum dan Natural Gas 4,55 4,51 5,01 4,64b. Pertambangan Bukan Migas/Non-Oil and Gas Mining 4,54 5,16 5,37 5,63c. Penggalian/Quarrying 1,48 1,49 1,47 1,50
3. Industri Pengolahan/Manufacturing Industry 26,36 24,80 24,33 23,94a. Industri Migas/Oil and Gas Manufacturing Industry 3,74 3,33 3,41 3,09
1) Pengilangan Minyak Bumi/Petroleum Refinery 2,31 1,93 1,77 1,582) Gas Alam Cair/Liquefied Natural Gas (LNG) 1,43 1,40 1,64 1,51
b. Industri Bukan MigasNon-Oil and Gas Manufacturing Industry
22,61 21,48 20,92 20,85
1) Makanan, Minuman, dan TembakauFood, Beverages, and Tobacco Industries
7,50 7,22 7,37 7,58
2) Tekstil, Barang Kulit, dan Alas Kaki Textile, Leather Products, and Footwear
2,08 1,93 1,93 1,90
3) Barang Kayu dan Hasil Hutan LainWood Products and Other Wood Products
1,43 1,25 1,14 1,04
4) Kertas dan Barang Cetakan/Paper and Printing 1,09 1,02 0,93 0,815) Pupuk, Kimia, dan Barang dari Karet
Fertilizers, Chemical, and Rubber Products2,91 2,73 2,56 2,63
6) Semen dan Barang Galian Bukan Logam Cement and Non-Metallic Quarrying Products
0,78 0,71 0,68 0,70
7) Logam Dasar, Besi, dan Baja/Basic Metal, Iron, and Steel 0,48 0,42 0,42 0,418) Alat Angkutan, Mesin, dan Peralatan
Transport Equipment, Machinery, and Apparatus6,18 6,04 5,74 5,65
9) Barang Lainnya/Other Manufacturing Products 0,18 0,16 0,15 0,14
4. Listrik, Gas, dan Air BersihElectricity, Gas, and Water Supply
0,83 0,76 0,77 0,79
a. Listrik/Electricity 0,51 0,47 0,49 0,51b. Gas Kota/Pipe Gas 0,23 0,21 0,20 0,21c. Air Bersih/Water Supply 0,09 0,08 0,08 0,07
5. Konstruksi/Construction 9,90 10,25 10,16 10,45
Distribusi Persentase Produk Domestik Bruto Atas Dasar Harga Berlaku Menurut Lapangan Usaha, 2009–2012Percentage Distribution of Gross Domestic Product at Current Market Prices by Industrial Origin, 2009–2012
Tabel –––––– 15.1.3Table
http
://www.b
ps.g
o.id

S Y S T E M O F N A T I O N A L A C C O U N T S
S t a t i s t i c a l Y e a r b o o k o f I n d o n e s i a 2 0 1 3 559
Lapangan UsahaIndustrial Origin 2009 2010 2011 x 2012 xx
(1) (2) (3) (4) (5)6. Perdagangan, Hotel, dan Restoran
Trade, Hotel, and Restaurant13,28 13,69 13,80 13,90
a. Perdagangan Besar dan Eceran Wholesale and Retail Trade
10,45 10,91 11,15 11,25
b. Hotel/Hotel 0,37 0,37 0,36 0,39c. Restoran/Restaurant 2,45 2,40 2,29 2,27
7. Pengangkutan dan Komunikasi Transport and Communication
6,31 6,56 6,62 6,66
a. Pengangkutan/Transport 3,26 3,37 3,43 3,491) Angkutan Rel/Railways Transport 0,03 0,04 0,03 0,032) Angkutan Jalan Raya/Road Transport 1,85 1,89 1,89 1,853) Angkutan Laut/Sea Transport 0,28 0,26 0,25 0,244) Angkutan Sungai, Danau, dan Penyeberangan
River, Lake, and Ferry Transport0,11 0,11 0,10 0,11
5) Angkutan Udara/Air Transport 0,43 0,54 0,63 0,756) Jasa Penunjang Angkutan
Transport Supporting Services0,56 0,54 0,52 0,51
b. Komunikasi/Communication 3,05 3,19 3,19 3,18
8. Keuangan, Real Estat, dan Jasa PerusahaanFinancial, Real Estate, and Business Services
7,23 7,24 7,21 7,26
a. Bank/Bank 2,36 2,28 2,24 2,32b. Lembaga Keuangan Bukan Bank
Non-Bank Financial Institutions0,88 0,92 0,95 0,97
c. Jasa Penunjang Keuangan Finance Supporting Services
0,05 0,05 0,05 0,06
d. Real Estat/Real Estate 2,59 2,61 2,59 2,54e. Jasa Perusahaan/Business Services 1,35 1,38 1,38 1,38
9. Jasa-Jasa/Services 10,24 10,24 10,56 10,78a. Pemerintahan Umum/General Government 5,68 5,58 5,83 5,89
1) Administrasi, Pemerintahan, dan Pertahanan Government, Administration, and Defence
3,48 3,42 3,59 3,64
2) Jasa Pemerintahan LainnyaOther Government Services
2,20 2,16 2,24 2,25
b. Swasta/Private 4,56 4,66 4,73 4,891) Sosial Kemasyarakatan
Social and Community Services1,74 1,77 1,82 1,93
2) Hiburan dan RekreasiEntertainment and Recreation Services
0,26 0,27 0,28 0,28
3) Perorangan dan Rumah TanggaIndividual and Household Services
2,56 2,62 2,64 2,69
Produk Domestik Bruto Gross Domestic Product
100,00 100,00 100,00 100,00
Produk Domestik Bruto Tanpa Migas Gross Domestic Product Without Oil and Gas
91,71 92,17 91,58 92,27
Lanjutan Tabel/Continued Table 15.1.3
Catatan/Note: x Angka sementara/Preliminary figures xx Angka sangat sementara/Very preliminary figures
http
://www.b
ps.g
o.id

S I S T E M N E R A C A N A S I O N A L
S t a t i s t i k I n d o n e s i a 2 0 1 3560
Lapangan UsahaIndustrial Origin 2009 2010 2011 x 2012 xx
(1) (2) (3) (4) (5)1. Pertanian, Peternakan, Kehutanan, dan Perikanan
Agriculture, Livestock, Forestry, and Fishery3,96 3,01 3,37 3,97
a. Tanaman Bahan Makanan/Farm Food Crops 4,97 1,64 1,75 2,95 b. Tanaman Perkebunan/Non-Food Crops 1,73 3,49 4,47 5,08 c. Peternakan dan Hasil-hasilnya/Livestock and Its Products 3,45 4,27 4,78 4,82 d. Kehutanan/Forestry 1,82 2,41 0,85 0,16 e. Perikanan/Fishery 4,16 6,04 6,96 6,48
2. Pertambangan dan Penggalian/Mining and Quarrying 4,47 3,86 1,39 1,49 a. Minyak dan Gas Bumi/Crude Petroleum dan Natural Gas 0,07 0,96 -1,03 -3,64b. Pertambangan Bukan Migas/Non-Oil and Gas Mining 10,86 7,30 2,81 6,29 c. Penggalian/Quarrying 7,04 6,50 7,44 7,68
3. Industri Pengolahan/Manufacturing Industry 2,21 4,74 6,14 5,73 a. Industri Migas/Oil and Gas Manufacturing Industry -1,53 0,56 -0,94 -2,71
1) Pengilangan Minyak Bumi/Petroleum Refinery 0,53 1,25 0,53 -1,732) Gas Alam Cair/Liquefied Natural Gas (LNG) -3,14 0,01 -2,15 -3,53
b. Industri Bukan MigasNon-Oil and Gas Manufacturing Industry
2,56 5,12 6,74 6,40
1) Makanan, Minuman, dan TembakauFood, Beverages, and Tobacco Industries
11,22 2,78 9,14 7,74
2) Tekstil, Barang Kulit, dan Alas Kaki Textile, Leather Products, and Footwear
0,60 1,77 7,52 4,19
3) Barang Kayu dan Hasil Hutan LainWood Products and Other Wood Products
-1,38 -3,47 0,35 -2,78
4) Kertas dan Barang Cetakan/Paper and Printing 6,34 1,67 1,40 -5,265) Pupuk, Kimia, dan Barang dari Karet
Fertilizers, Chemical, and Rubber Products1,64 4,70 3,95 10,25
6) Semen dan Barang Galian Bukan Logam Cement and Non-Metallic Quarrying Products
-0,51 2,18 7,19 7,85
7) Logam Dasar, Besi, dan Baja/Basic Metal, Iron, and Steel -4,26 2,38 13,06 6,45 8) Alat Angkutan, Mesin, dan Peralatan
Transport Equipment, Machinery, and Apparatus-2,87 10,38 6,81 6,94
9) Barang Lainnya/Other Manufacturing Products 3,19 3,00 1,82 -1,00
4. Listrik, Gas, dan Air BersihElectricity, Gas, and Water Supply
14,29 5,33 4,82 6,40
a. Listrik/Electricity 7,74 5,42 8,22 8,36 b. Gas Kota/Pipe Gas 41,03 4,92 -2,84 2,45 c. Air Bersih/Water Supply 3,91 5,76 4,21 4,14
5. Konstruksi/Construction 7,07 6,95 6,65 7,50
Laju Pertumbuhan Produk Domestik Bruto Atas Dasar Harga Konstan 2000 Menurut Lapangan Usaha (persen), 2009–2012Growth Rate of Gross Domestic Product at 2000 Constant Market Prices by Industrial Origin (percent), 2009–2012
Tabel –––––– 15.1.4Table
http
://www.b
ps.g
o.id

S Y S T E M O F N A T I O N A L A C C O U N T S
S t a t i s t i c a l Y e a r b o o k o f I n d o n e s i a 2 0 1 3 561
Lapangan UsahaIndustrial Origin 2009 2010 2011 x 2012 xx
(1) (2) (3) (4) (5)6. Perdagangan, Hotel, dan Restoran
Trade, Hotel, and Restaurant1,28 8,69 9,17 8,11
a. Perdagangan Besar dan Eceran Wholesale and Retail Trade
0,03 9,70 9,96 8,66
b. Hotel/Hotel 6,59 6,78 9,33 8,74 c. Restoran/Restaurant 7,60 3,31 4,16 4,22
7. Pengangkutan dan Komunikasi Transport and Communication
15,85 13,41 10,70 9,98
a. Pengangkutan/Transport 6,40 7,19 7,68 6,57 1) Angkutan Rel/Railways Transport 9,83 5,02 -3,99 -6,672) Angkutan Jalan Raya/Road Transport 5,67 5,11 6,57 7,13 3) Angkutan Laut/Sea Transport 0,52 0,10 3,30 4,27 4) Angkutan Sungai, Danau, dan Penyeberangan
River, Lake, and Ferry Transport4,90 7,37 4,02 6,66
5) Angkutan Udara/Air Transport 11,65 18,99 14,35 8,39 6) Jasa Penunjang Angkutan
Transport Supporting Services6,89 5,20 6,82 5,30
b. Komunikasi/Communication 23,61 17,81 12,64 12,08
8. Keuangan, Real Estat, dan Jasa PerusahaanFinancial, Real Estate, and Business Services
5,21 5,67 6,84 7,15
a. Bank/Bank 2,40 4,78 6,90 8,30 b. Lembaga Keuangan Bukan Bank
Non-Bank Financial Institutions9,86 6,53 7,30 7,12
c. Jasa Penunjang Keuangan Finance Supporting Services
3,51 5,89 7,87 6,31
d. Real Estat/Real Estate 5,24 5,53 6,32 6,05 e. Jasa Perusahaan/Business Services 9,66 7,43 7,30 6,48
9. Jasa-Jasa/Services 6,42 6,04 6,75 5,24
a. Pemerintahan Umum/General Government 5,10 4,65 5,38 1,80 1) Administrasi, Pemerintahan, dan Pertahanan
Government, Administration, and Defence4,91 4,57 5,33 1,67
2) Jasa Pemerintahan LainnyaOther Government Services
5,43 4,78 5,48 2,02
b. Swasta/Private 7,44 7,10 7,76 7,73 1) Sosial Kemasyarakatan
Social and Community Services7,34 6,41 6,63 7,26
2) Hiburan dan RekreasiEntertainment and Recreation Services
7,85 7,46 8,17 7,69
3) Perorangan dan Rumah TanggaIndividual and Household Services
7,42 7,32 8,13 7,91
Produk Domestik Bruto Gross Domestic Product
4,63 6,22 6,49 6,23
Produk Domestik Bruto Tanpa Migas Gross Domestic Product Without Oil and Gas
5,00 6,60 6,98 6,81
Lanjutan Tabel/Continued Table 15.1.4
Catatan/Note: x Angka sementara/Preliminary figures xx Angka sangat sementara/Very preliminary figures
http
://www.b
ps.g
o.id

S I S T E M N E R A C A N A S I O N A L
S t a t i s t i k I n d o n e s i a 2 0 1 3562
[Diolah dari Hasil Sensus, Survei, dan Berbagai Sumber Lainnya/Based on Census, Surveys, and Other Sources]
Jenis PengeluaranType of Expenditure 2009 2010 2011 x 2012 xx
(1) (2) (3) (4) (5)
Pengeluaran konsumsi rumah tanggaHousehold consumption expenditure
3 290 995,9 3 643 425,0 4 053 363,6 4 496 373,4
Pengeluaran konsumsi pemerintahGeneral government consumption expenditure
537 588,8 587 282,9 668 582,8 732 344,9
Pembentukan modal tetap domestik brutoGross domestic fixed capital formation
1 744 357,1 2 064 994,1 2 372 765,8 2 733 180,5
Perubahan inventoriChanges in inventories
-7 264,2 18 364,4 70 774,2 178 189,9
Diskrepansi statistik 1
Statistical discrepancies 1-116 790,9 24 732,0 152 544,2 229 940,5
Ekspor barang dan jasaExport of goods and services
1 354 409,4 1 584 673,8 1 955 821,0 1 999 379,9
Dikurangi: Impor barang dan jasaLess: Import of goods and services
1 197 092,7 1 476 620,3 1 851 070,4 2 127 544,8
Produk Domestik Bruto/Gross Domestic Product 5 606 203,4 6 446 851,9 7 422 781,2 8 241 864,3
Pendapatan neto terhadap luar negeri atas faktor produksiNet factor income from abroad
-196 219,5 -180 968,9 -211 689,3 -239 186,4
Produk Nasional Bruto/Gross National Product 5 409 983,9 6 265 883,0 7 211 091,9 8 002 677,9
Dikurangi: Pajak tak langsung netoLess: Net indirect taxes
214 833,2 225 193,6 179 725,3 46 436,5
Dikurangi: Penyusutan/Less: Depreciation 280 310,2 322 342,6 371 139,1 412 093,2
Pendapatan Nasional/National Income 4 914 840,5 5 718 346,9 6 660 227,6 7 544 148,2
Produk Domestik Bruto Menurut Jenis Pengeluaran, Produk Nasional Bruto, dan Pendapatan Nasional Atas Dasar Harga Berlaku(miliar rupiah), 2009–2012Gross Domestic Product by Type of Expenditure, Gross National Product, and National Income at Current Market Prices (billion rupiahs), 2009–2012
Tabel ––––––
15.1.5Table
Catatan/Note: x Angka sementara/Preliminary figures xx Angka sangat sementara/Very preliminary figures 1 Butir penyeimbang (perbedaan antara PDB menurut lapangan usaha dengan PDB menurut penggunaan)/Balancing item (the difference between GDP by sector and GDP by expenditure)
http
://www.b
ps.g
o.id

S Y S T E M O F N A T I O N A L A C C O U N T S
S t a t i s t i c a l Y e a r b o o k o f I n d o n e s i a 2 0 1 3 563
[Diolah dari Hasil Sensus, Survei, dan Berbagai Sumber Lainnya/Based on Census, Surveys, and Other Sources]
Jenis PengeluaranType of Expenditure 2009 2010 2011 x 2012 xx
(1) (2) (3) (4) (5)
Pengeluaran konsumsi rumah tanggaHousehold consumption expenditure
1 249 070,1 1 308 272,8 1 369 881,0 1 442 193,2
Pengeluaran konsumsi pemerintahGeneral government consumption expenditure
195 834,4 196 468,8 202 755,8 205 289,7
Pembentukan modal tetap domestik brutoGross domestic fixed capital formation
510 085,9 553 347,7 601 890,6 660 942,3
Perubahan inventoriChanges in inventories
-2 065,2 -604,4 9 033,5 53 228,4
Diskrepansi statistik 1
Statistical discrepancies 12 205,3 13 823,5 2 184,0 15 662,1
Ekspor barang dan jasaExport of goods and services
932 248,6 1 074 568,7 1 221 229,0 1 245 781,0
Dikurangi: Impor barang dan jasaLess: Import of goods and services
708 528,8 831 418,3 942 297,3 1 004 957,5
Produk Domestik Bruto/Gross Domestic Product 2 178 850,4 2 314 458,8 2 464 676,5 2 618 139,2
Pendapatan neto terhadap luar negeri atas faktor produksiNet factor income from abroad
-109 819,3 -92 992,0 -96 458,7 -100 655,9
Produk Nasional Bruto/Gross National Product 2 069 031,1 2 221 466,8 2 368 217,8 2 517 483,3
Dikurangi: Pajak tak langsung netoLess: Net indirect taxes
83 421,6 81 054,0 42 979,6 40 383,7
Dikurangi: Penyusutan/Less: Depreciation 108 942,5 115 722,9 123 233,8 130 907,0
Pendapatan Nasional/National Income 1 876 667,0 2 024 689,9 2 202 004,4 2 346 192,6
Produk Domestik Bruto Menurut Jenis Pengeluaran, Produk Nasional Bruto, dan Pendapatan Nasional Atas Dasar Harga Konstan 2000 (miliar rupiah), 2009–2012Gross Domestic Product by Type of Expenditure, Gross National Product, and National Income at 2000 Constant Market Prices (billion rupiahs), 2009–2012
Tabel ––––––
15.1.6Table
Catatan/Note: x Angka sementara/Preliminary figures xx Angka sangat sementara/Very preliminary figures 1 Butir penyeimbang (perbedaan antara PDB menurut lapangan usaha dengan PDB menurut penggunaan)/Balancing item (the difference between GDP by sector and GDP by expenditure)
http
://www.b
ps.g
o.id

S I S T E M N E R A C A N A S I O N A L
S t a t i s t i k I n d o n e s i a 2 0 1 3564
Distribusi Persentase Produk Domestik Bruto Atas Dasar Harga Berlaku Menurut Jenis Pengeluaran, 2009–2012Percentage Distribution of Gross Domestic Product at Current Market Prices by Type of Expenditure, 2009–2012
[Diolah dari Hasil Sensus, Survei, dan Berbagai Sumber Lainnya/Based on Census, Surveys, and Other Sources]
Jenis PengeluaranType of Expenditure 2009 2010 2011 x 2012 xx
(1) (2) (3) (4) (5)
Pengeluaran konsumsi rumah tanggaHousehold consumption expenditure
58,70 56,51 54,61 54,56
Pengeluaran konsumsi pemerintahGeneral government consumption expenditure
9,59 9,11 9,01 8,89
Pembentukan modal tetap domestik brutoGross domestic fixed capital formation
31,11 32,03 31,97 33,16
Perubahan inventoriChanges in inventories
- 0,13 0,28 0,95 2,16
Diskrepansi statistik 1
Statistical discrepancies 1-2,08 0,38 2,06 2,79
Ekspor barang dan jasaExport of goods and services
24,16 24,58 26,35 24,26
Dikurangi: Impor barang dan jasaLess: Import of goods and services
21,35 22,90 24,94 25,81
Produk Domestik BrutoGross Domestic Product
100,00 100,00 100,00 100,00
Tabel ––––––
15.1.7Table
Catatan/Note: x Angka sementara/Preliminary figures xx Angka sangat sementara/Very preliminary figures 1 Butir penyeimbang (perbedaan antara PDB menurut lapangan usaha dengan PDB menurut penggunaan)/Balancing item (the difference between GDP by sector and GDP by expenditure)
http
://www.b
ps.g
o.id
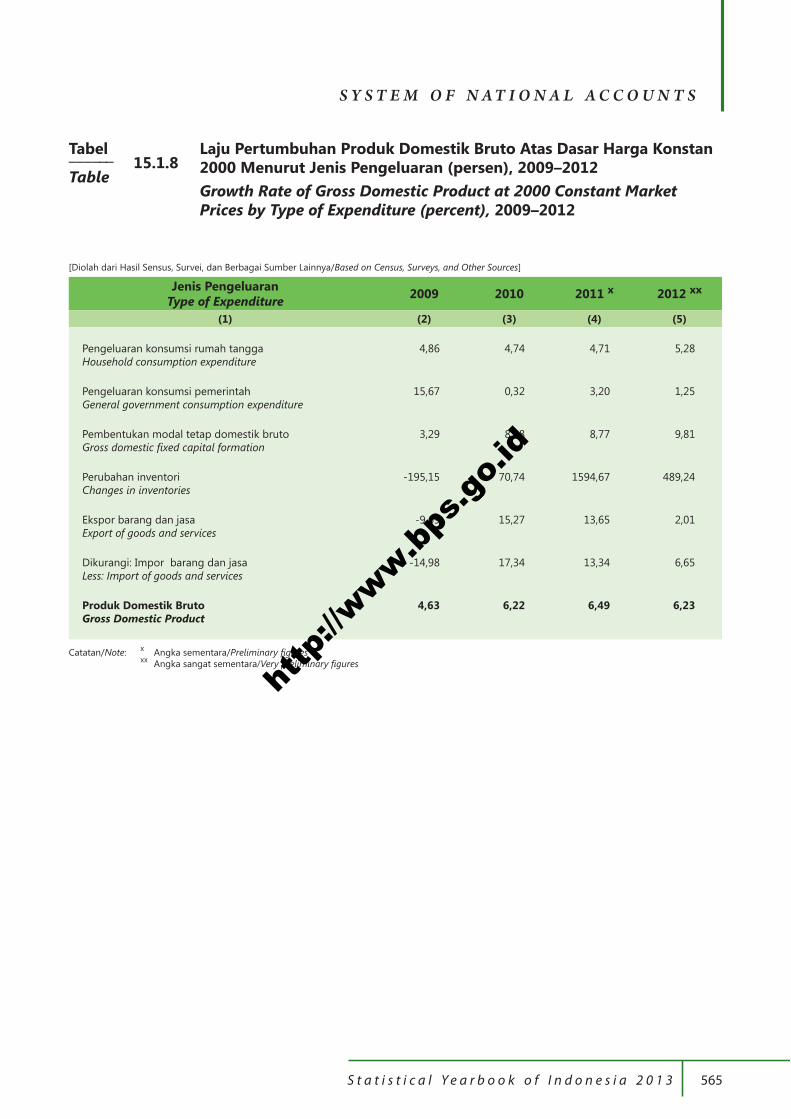
S Y S T E M O F N A T I O N A L A C C O U N T S
S t a t i s t i c a l Y e a r b o o k o f I n d o n e s i a 2 0 1 3 565
[Diolah dari Hasil Sensus, Survei, dan Berbagai Sumber Lainnya/Based on Census, Surveys, and Other Sources]
Jenis PengeluaranType of Expenditure 2009 2010 2011 x 2012 xx
(1) (2) (3) (4) (5)
Pengeluaran konsumsi rumah tanggaHousehold consumption expenditure
4,86 4,74 4,71 5,28
Pengeluaran konsumsi pemerintahGeneral government consumption expenditure
15,67 0,32 3,20 1,25
Pembentukan modal tetap domestik brutoGross domestic fixed capital formation
3,29 8,48 8,77 9,81
Perubahan inventoriChanges in inventories
-195,15 70,74 1594,67 489,24
Ekspor barang dan jasaExport of goods and services
-9,69 15,27 13,65 2,01
Dikurangi: Impor barang dan jasaLess: Import of goods and services
-14,98 17,34 13,34 6,65
Produk Domestik Bruto Gross Domestic Product
4,63 6,22 6,49 6,23
Laju Pertumbuhan Produk Domestik Bruto Atas Dasar Harga Konstan 2000 Menurut Jenis Pengeluaran (persen), 2009–2012Growth Rate of Gross Domestic Product at 2000 Constant Market Prices by Type of Expenditure (percent), 2009–2012
Tabel ––––––
15.1.8Table
Catatan/Note: x Angka sementara/Preliminary figures xx Angka sangat sementara/Very preliminary figures ht
tp://w
ww.bps
.go.
id

S I S T E M N E R A C A N A S I O N A L
S t a t i s t i k I n d o n e s i a 2 0 1 3566
[Diolah dari Hasil Sensus, Survei, dan Berbagai Sumber Lainnya/Based on Census, Surveys, and Other Sources]
RincianItems 2009 2010 2011 x 2012 xx
(1) (2) (3) (4) (5)
Produk Domestik BrutoGross Domestic Product(miliar rupiah/billion rupiahs)
5 606 203,4 6 446 851,9 7 422 781,2 8 241 864,3
Produk Domestik Bruto per kapitaPer capita Gross Domestic Product(ribu rupiah/thousand rupiahs)
23 880,9 r 27 028,7 30 795,1 33 748,3
Produk Domestik Bruto tanpa migas dan hasil-hasilnya 1
Gross Domestic Product without oil and gas and its products 1
(miliar rupiah/billion rupiahs)
5 141 414,4 5 941 951,9 6 797 879,2 7 604 759,1
Produk Domestik Bruto tanpa migas dan hasil-hasilnya per kapitaPer capita Gross Domestic Product without oil and gas and its products (ribu rupiah/thousand rupiahs)
21 901,0 r 24 911,9 28 202,5 31 139,5
Produk Nasional BrutoGross National Product(miliar rupiah/billion rupiahs)
5 409 983,9 6 265 883,0 7 211 091,9 8 002 677,9
Produk Nasional Bruto per kapitaPer capita Gross National Product(ribu rupiah/thousand rupiahs)
23 045,0 r 26 270,0 29 916,9 32 768,9
Pendapatan NasionalNational Income(miliar rupiah/billion rupiahs)
4 914 840,5 5 718 346,9 6 660 227,6 7 544 148,2
Pendapatan Nasional per kapitaPer capita National Income(ribu rupiah/thousand rupiahs)
20 935,9 r 23 974,4 27 631,5 30 891,3
Jumlah penduduk pertengahan tahun 2
Mid-year population 2
( juta orang/million people)
234,76 r 238,52 241,04 244,22
Perkembangan Beberapa Agregat Pendapatan dan Pendapatan per Kapita Atas Dasar Harga Berlaku, 2009–2012Trend of Several Aggregates on Income and per Capita Income at Current Market Prices, 2009–2012
Tabel ––––––
15.1.9Table
Catatan/Note: r Angka diperbaiki/Revised figures x Angka sementara/Preliminary figures xx Angka sangat sementara/Very preliminary figures 1 Migas dan hasil-hasilnya meliputi: minyak mentah, gas bumi, gas alam cair, dan pengilangan minyak Petroleum, gas and its products consist of crude petroleum, natural gas, LNG, and refined petroleum 2 Sumber/Source: Sensus Penduduk 2010/Population Census 2010
http
://www.b
ps.g
o.id

S Y S T E M O F N A T I O N A L A C C O U N T S
S t a t i s t i c a l Y e a r b o o k o f I n d o n e s i a 2 0 1 3 567
[Diolah dari Hasil Sensus, Survei, dan Berbagai Sumber Lainnya/Based on Census, Surveys, and Other Sources]
RincianItems 2009 2010 2011 x 2012 xx
(1) (2) (3) (4) (5)
Produk Domestik BrutoGross Domestic Product(miliar rupiah/billion rupiahs)
2 178 850,4 2 314 458,8 2 464 676,5 2 618 139,2
Produk Domestik Bruto per kapitaPer capita Gross Domestic Product(ribu rupiah/thousand rupiahs)
9 281,3 r 9 703,5 10 225,3 10 720,6
Produk Domestik Bruto tanpa migas dan hasil-hasilnya 1
Gross Domestic Product without oil and gas and its products 1
(miliar rupiah/billion rupiahs)
2 036 685,5 2 171 113,5 2 322 763,5 2 480 955,8
Produk Domestik Bruto tanpa migas dan hasil-hasilnya per kapitaPer capita Gross Domestic Product without oil and gas and its products (ribu rupiah/thousand rupiahs)
8 675,7 r 9 102,5 9 636,5 10 158,9
Produk Nasional BrutoGross National Product(miliar rupiah/billion rupiahs)
2 069 031,1 2 221 466,8 2 368 217,8 2 517 483,3
Produk Nasional Bruto per kapitaPer capita Gross National Product(ribu rupiah/thousand rupiahs)
8 813,5 r 9 313,6 9 825,1 10 308,4
Pendapatan NasionalNational Income(miliar rupiah/billion rupiahs)
1 876 667,0 2 024 689,9 2 202 004,4 2 346 192,6
Pendapatan Nasional per kapitaPer capita National Income(ribu rupiah/thousand rupiahs)
7 994,1 r 8 488,6 9 135,5 9 607,0
Jumlah penduduk pertengahan tahun 2
Mid-year population 2
( juta orang/million people)
234,76 r 238,52 241,04 244,22
Perkembangan Beberapa Agregat Pendapatan dan Pendapatan per Kapita Atas Dasar Harga Konstan 2000, 2009–2012Trend of Several Aggregates on Income and per Capita Income at 2000 Constant Market Prices, 2009–2012
Tabel ––––––
15.1.10Table
Catatan/Note: r Angka diperbaiki/Revised figures x Angka sementara/Preliminary figures xx Angka sangat sementara/Very preliminary figures 1 Migas dan hasil-hasilnya meliputi: minyak mentah, gas bumi, gas alam cair, dan pengilangan minyak Petroleum, gas and its products consist of crude petroleum, natural gas, LNG, and refined petroleum 2 Sumber/Source: Sensus Penduduk 2010/Population Census 2010
http
://www.b
ps.g
o.id

S I S T E M N E R A C A N A S I O N A L
S t a t i s t i k I n d o n e s i a 2 0 1 3568
[Diolah dari Hasil Sensus, Survei, dan Berbagai Sumber Lainnya/Based on Census, Surveys, and Other Sources]
RincianItems 2009 2010 2011 x 2012 xx
(1) (2) (3) (4) (5)
Produk Domestik BrutoGross Domestic Product
4,63 6,22 6,49 6,23
Produk Domestik Bruto per kapita Per capita Gross Domestic Product
3,24 r 4,55 5,38 4,84
Produk Domestik Bruto tanpa migas dan hasil-hasilnya 1
Gross Domestic Product without oil and gas and its products 15,00 6,60 6,98 6,81
Produk Domestik Bruto tanpa migas dan hasil-hasilnya per kapitaPer capita Gross Domestic Product without oil and gas and its products
3,61 r 4,92 5,87 5,42
Produk Nasional Bruto Gross National Product
4,19 7,37 6,61 6,30
Produk Nasional Bruto per kapitaPer capita Gross National Product
2,80 r 5,67 5,49 4,92
Pendapatan NasionalNational Income
2,20 7,89 8,76 6,55
Pendapatan Nasional per kapitaPer capita National Income
0,83 r 6,19 7,62 5,16
Jumlah penduduk pertengahan tahun 2
Mid-year population 2234,76 r 238,52 241,04 244,22
Laju Pertumbuhan Beberapa Agregat Pendapatan dan Pendapatanper Kapita Atas Dasar Harga Konstan 2000 (persen), 2009–2012Growth Rate of Several Aggregates on Income and per Capita Income at 2000 Constant Market Prices (percent), 2009–2012
Tabel ––––––
15.1.11Table
Catatan/Note: r Angka diperbaiki/Revised figures x Angka sementara/Preliminary figures xx Angka sangat sementara/Very preliminary figures 1 Migas dan hasil-hasilnya meliputi: minyak mentah, gas bumi, gas alam cair, dan pengilangan minyak Petroleum, gas and its products consist of crude petroleum, natural gas, LNG, and refined petroleum 2 Sumber/Source: Sensus Penduduk 2010/Population Census 2010
http
://www.b
ps.g
o.id

S Y S T E M O F N A T I O N A L A C C O U N T S
S t a t i s t i c a l Y e a r b o o k o f I n d o n e s i a 2 0 1 3 569
15.2 PRODUK DOMESTIK REGIONAL BRUTO GROSS REGIONAL DOMESTIC PRODUCT
Produk Domestik Regional Bruto Atas Dasar Harga Berlaku Menurut Provinsi (miliar rupiah), 2008–2011Gross Regional Domestic Product at Current Market Prices by Province (billion rupiahs), 2008–2011
Provinsi/Province 2008 2009 2010 x 2011 xx
(1) (2) (3) (4) (5) Aceh 73 547,6 71 987,0 77 983,8 85 538,0 Sumatera Utara 213 931,7 236 353,6 275 700,2 314 156,9 Sumatera Barat 70 954,5 76 752,9 87 221,3 98 917,3 Riau 276 400,1 297 173,0 345 661,3 413 350,1 Kepulauan Riau 58 575,0 63 892,9 71 614,5 80 242,8 Jambi 41 056,5 44 127,0 53 816,7 63 268,1 Sumatera Selatan 133 665,0 137 331,8 157 535,0 181 776,1 Kepulauan Bangka Belitung 21 421,3 22 997,9 26 565,0 30 254,8 Bengkulu 14 915,9 16 385,4 18 649,6 21 150,3 Lampung 73 719,3 88 934,9 108 378,5 128 408,9
DKI Jakarta 677 044,7 757 696,6 862 089,7 982 540,0 Jawa Barat 633 283,5 689 841,3 771 593,9 861 006,3 Banten 139 864,8 152 556,2 171 690,4 192 218,9 Jawa Tengah 367 136,0 397 903,9 444 692,0 498 614,6 DI Yogyakarta 38 101,7 41 407,0 45 625,6 51 782,1 Jawa Timur 621 391,7 686 847,6 778 565,8 884 143,6
Bali 51 916,2 60 292,2 66 690,6 73 478,2 Nusa Tenggara Barat 35 314,7 44 014,6 49 559,8 48 729,1 Nusa Tenggara Timur 21 655,9 24 179,4 27 738,8 31 204,4
Kalimantan Barat 49 133,0 54 281,2 60 501,5 66 780,2 Kalimantan Tengah 32 760,2 37 161,8 42 621,0 49 072,5 Kalimantan Selatan 45 843,8 51 460,2 59 821,2 68 234,9 Kalimantan Timur 314 813,5 285 590,8 321 904,9 390 638,6
Sulawesi Utara 28 697,8 33 033,6 36 911,8 41 505,1 Gorontalo 5 906,7 7 069,1 8 056,5 9 153,7 Sulawesi Tengah 28 727,5 32 461,3 37 319,1 44 317,9 Sulawesi Selatan 85 143,2 99 954,6 117 862,2 137 389,9 Sulawesi Barat 8 296,6 9 403,4 10 986,6 12 895,4 Sulawesi Tenggara 22 202,8 25 655,9 28 369,0 32 032,5
Maluku 6 270,0 7 069,6 8 084,8 9 594,9 Maluku Utara 3 862,2 4 691,2 5 389,8 6 057,0 Papua 61 516,2 76 886,7 87 776,6 76 370,6 Papua Barat 13 975,1 18 144,5 26 879,6 36 170,5
Jumlah 33 ProvinsiTotal of 33 Provinces
4 271 044,6 4 653 539,2 5 293 857,0 6 020 994,1
Tabel –––––– 15.2.1Table
Catatan/Note: x Angka sementara/Preliminary figures xx Angka sangat sementara/Very preliminary figures
http
://www.b
ps.g
o.id

S I S T E M N E R A C A N A S I O N A L
S t a t i s t i k I n d o n e s i a 2 0 1 3570
Produk Domestik Regional Bruto Atas Dasar Harga Konstan 2000 Menurut Provinsi (miliar rupiah), 2008–2011Gross Regional Domestic Product at 2000 Constant Market Prices by Province (billion rupiahs), 2008–2011
Tabel –––––– 15.2.2Table
Provinsi/Province 2008 2009 2010 x 2011 xx
(1) (2) (3) (4) (5) Aceh 34 098,0 32 219,1 33 118,2 34 779,7 Sumatera Utara 106 172,4 111 559,2 118 640,9 126 450,6 Sumatera Barat 35 176,6 36 683,2 38 860,2 41 276,4 Riau 91 085,4 93 786,2 97 707,5 102 605,9 Kepulauan Riau 37 014,7 38 318,8 41 075,9 43 816,7 Jambi 15 297,8 16 274,9 17 470,7 18 962,4 Sumatera Selatan 58 065,5 60 452,9 63 858,2 68 011,3 Kepulauan Bangka Belitung 9 899,9 10 270,1 10 879,4 11 575,3 Bengkulu 7 441,9 7 859,9 8 336,0 8 869,3 Lampung 34 443,2 36 256,3 38 378,4 40 829,4
DKI Jakarta 353 723,4 371 469,5 395 633,6 422 162,6 Jawa Barat 291 205,8 303 405,3 322 223,8 343 111,2 Banten 79 700,7 83 453,7 88 525,9 94 222,4 Jawa Tengah 168 034,5 176 673,5 186 995,5 198 226,3 DI Yogyakarta 19 212,5 20 064,3 21 044,0 22 129,7 Jawa Timur 305 538,7 320 861,2 342 280,8 366 984,3
Bali 25 910,3 27 290,9 28 880,7 30 753,7 Nusa Tenggara Barat 16 831,6 18 874,4 20 069,9 19 432,3 Nusa Tenggara Timur 11 429,8 11 920,6 12 543,8 13 249,7
Kalimantan Barat 27 438,8 28 756,9 30 299,8 32 100,7 Kalimantan Tengah 16 726,5 17 657,8 18 803,7 20 070,7 Kalimantan Selatan 27 593,1 29 051,6 30 674,1 32 552,8 Kalimantan Timur 103 206,9 105 564,9 110 886,7 115 244,2
Sulawesi Utara 15 902,1 17 149,6 18 376,8 19 734,3 Gorontalo 2 520,7 2 710,7 2 917,5 3 141,5 Sulawesi Tengah 15 047,4 16 207,6 17 626,2 19 239,9 Sulawesi Selatan 44 549,8 47 326,1 51 199,9 55 116,9 Sulawesi Barat 3 998,5 4 239,5 4 744,3 5 238,4 Sulawesi Tenggara 10 010,6 10 768,6 11 650,2 12 661,9
Maluku 3 787,3 3 993,1 4 251,4 4 507,3 Maluku Utara 2 651,1 2 812,0 3 035,6 3 230,2 Papua 18 931,8 23 138,4 22 407,3 21 137,5 Papua Barat 6 399,5 7 287,0 9 366,4 11 916,1
Jumlah 33 ProvinsiTotal of 33 Provinces
1 999 046,6 2 094 358,0 2 222 763,1 2 363 341,7
Catatan/Note: x Angka sementara/Preliminary figures xx Angka sangat sementara/Very preliminary figures
http
://www.b
ps.g
o.id
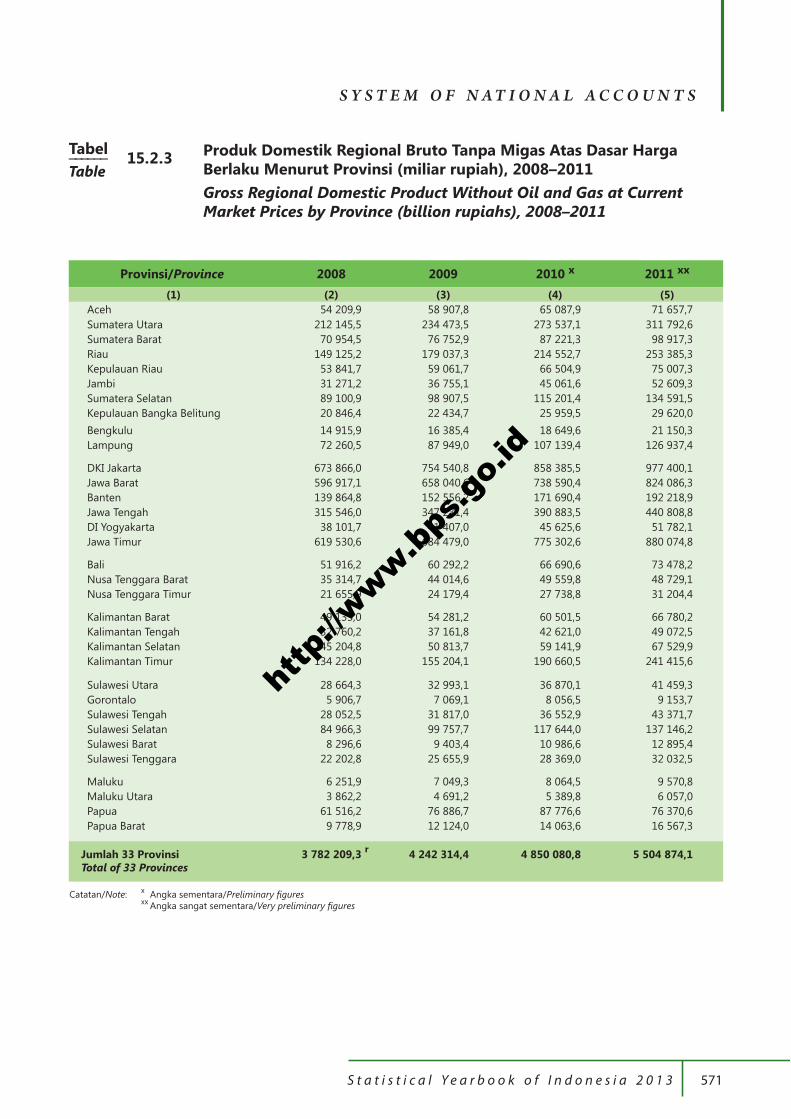
S Y S T E M O F N A T I O N A L A C C O U N T S
S t a t i s t i c a l Y e a r b o o k o f I n d o n e s i a 2 0 1 3 571
Produk Domestik Regional Bruto Tanpa Migas Atas Dasar Harga Berlaku Menurut Provinsi (miliar rupiah), 2008–2011Gross Regional Domestic Product Without Oil and Gas at Current Market Prices by Province (billion rupiahs), 2008–2011
Provinsi/Province 2008 2009 2010 x 2011 xx
(1) (2) (3) (4) (5) Aceh 54 209,9 58 907,8 65 087,9 71 657,7 Sumatera Utara 212 145,5 234 473,5 273 537,1 311 792,6 Sumatera Barat 70 954,5 76 752,9 87 221,3 98 917,3 Riau 149 125,2 179 037,3 214 552,7 253 385,3 Kepulauan Riau 53 841,7 59 061,7 66 504,9 75 007,3 Jambi 31 271,2 36 755,1 45 061,6 52 609,3 Sumatera Selatan 89 100,9 98 907,5 115 201,4 134 591,5 Kepulauan Bangka Belitung 20 846,4 22 434,7 25 959,5 29 620,0 Bengkulu 14 915,9 16 385,4 18 649,6 21 150,3 Lampung 72 260,5 87 949,0 107 139,4 126 937,4
DKI Jakarta 673 866,0 754 540,8 858 385,5 977 400,1 Jawa Barat 596 917,1 658 040,6 738 590,4 824 086,3 Banten 139 864,8 152 556,2 171 690,4 192 218,9 Jawa Tengah 315 546,0 347 231,4 390 883,5 440 808,8 DI Yogyakarta 38 101,7 41 407,0 45 625,6 51 782,1 Jawa Timur 619 530,6 684 479,0 775 302,6 880 074,8
Bali 51 916,2 60 292,2 66 690,6 73 478,2 Nusa Tenggara Barat 35 314,7 44 014,6 49 559,8 48 729,1 Nusa Tenggara Timur 21 655,9 24 179,4 27 738,8 31 204,4
Kalimantan Barat 49 133,0 54 281,2 60 501,5 66 780,2 Kalimantan Tengah 32 760,2 37 161,8 42 621,0 49 072,5 Kalimantan Selatan 45 204,8 50 813,7 59 141,9 67 529,9 Kalimantan Timur 134 228,0 155 204,1 190 660,5 241 415,6
Sulawesi Utara 28 664,3 32 993,1 36 870,1 41 459,3 Gorontalo 5 906,7 7 069,1 8 056,5 9 153,7 Sulawesi Tengah 28 052,5 31 817,0 36 552,9 43 371,7 Sulawesi Selatan 84 966,3 99 757,7 117 644,0 137 146,2 Sulawesi Barat 8 296,6 9 403,4 10 986,6 12 895,4 Sulawesi Tenggara 22 202,8 25 655,9 28 369,0 32 032,5
Maluku 6 251,9 7 049,3 8 064,5 9 570,8 Maluku Utara 3 862,2 4 691,2 5 389,8 6 057,0 Papua 61 516,2 76 886,7 87 776,6 76 370,6 Papua Barat 9 778,9 12 124,0 14 063,6 16 567,3
Jumlah 33 ProvinsiTotal of 33 Provinces
3 782 209,3 r 4 242 314,4 4 850 080,8 5 504 874,1
Tabel –––––– 15.2.3Table
Catatan/Note: x Angka sementara/Preliminary figures xx Angka sangat sementara/Very preliminary figures
http
://www.b
ps.g
o.id

S I S T E M N E R A C A N A S I O N A L
S t a t i s t i k I n d o n e s i a 2 0 1 3572
Produk Domestik Regional Bruto Tanpa Migas Atas Dasar Harga Konstan 2000 Menurut Provinsi (miliar rupiah), 2008–2011Gross Regional Domestic Product Without Oil and Gas at 2000 Constant Market Prices by Province (billion rupiahs), 2008–2011
Provinsi/Province 2008 2009 2010 x 2011 xx
(1) (2) (3) (4) (5) Aceh 26 523,1 27 574,8 29 089,4 30 801,7 Sumatera Utara 105 431,9 110 850,7 117 901,0 125 668,4 Sumatera Barat 35 176,6 36 683,2 38 860,2 41 276,4 Riau 42 596,9 45 391,9 48 641,8 52 355,1 Kepulauan Riau 35 307,6 36 600,8 39 349,8 42 079,0 Jambi 13 716,5 14 675,3 15 677,4 16 765,8 Sumatera Selatan 44 763,1 47 029,3 50 314,0 54 353,2 Kepulauan Bangka Belitung 9 713,2 10 100,2 10 709,3 11 402,4 Bengkulu 7 441,9 7 859,9 8 336,0 8 869,3 Lampung 33 979,5 35 855,3 38 003,2 40 433,9
DKI Jakarta 352 785,4 370 533,5 394 683,6 421 130,5 Jawa Barat 282 745,3 294 324,4 313 190,5 334 457,1 Banten 79 700,7 83 453,7 88 525,9 94 222,4 Jawa Tengah 157 267,7 166 176,2 176 187,0 187 111,8 DI Yogyakarta 19 212,5 20 064,3 21 044,0 22 129,7 Jawa Timur 304 470,8 319 531,4 340 613,7 365 152,4
Bali 25 910,3 27 290,9 28 880,7 30 753,7 Nusa Tenggara Barat 16 831,6 18 874,4 20 069,9 19 432,3 Nusa Tenggara Timur 11 429,8 11 920,6 12 543,8 13 249,7
Kalimantan Barat 27 438,8 28 756,9 30 299,8 32 100,7 Kalimantan Tengah 16 726,5 17 657,8 18 803,7 20 070,7 Kalimantan Selatan 27 119,4 28 578,3 30 204,5 32 101,4 Kalimantan Timur 56 079,6 60 031,0 67 051,8 74 920,0
Sulawesi Utara 15 874,2 17 116,8 18 343,2 19 699,0 Gorontalo 2 520,7 2 710,7 2 917,5 3 141,5 Sulawesi Tengah 14 761,7 15 943,3 17 336,4 18 932,4 Sulawesi Selatan 44 456,8 47 225,0 51 091,4 55 001,8 Sulawesi Barat 3 998,5 4 239,5 4 744,3 5 238,4 Sulawesi Tenggara 10 010,6 10 768,6 11 650,2 12 661,9
Maluku 3 774,8 3 980,1 4 237,8 4 492,9 Maluku Utara 2 651,1 2 812,0 3 035,6 3 230,2 Papua 18 931,8 23 138,4 22 407,3 21 137,5 Papua Barat 4 988,5 5 446,5 5 915,7 6 534,2
Jumlah 33 ProvinsiTotal of 33 Provinces
1 854 337,2 1 953 195,8 2 080 660,3 2 220 907,2
Tabel –––––– 15.2.4Table
Catatan/Note: x Angka sementara/Preliminary figures xx Angka sangat sementara/Very preliminary figures
http
://www.b
ps.g
o.id
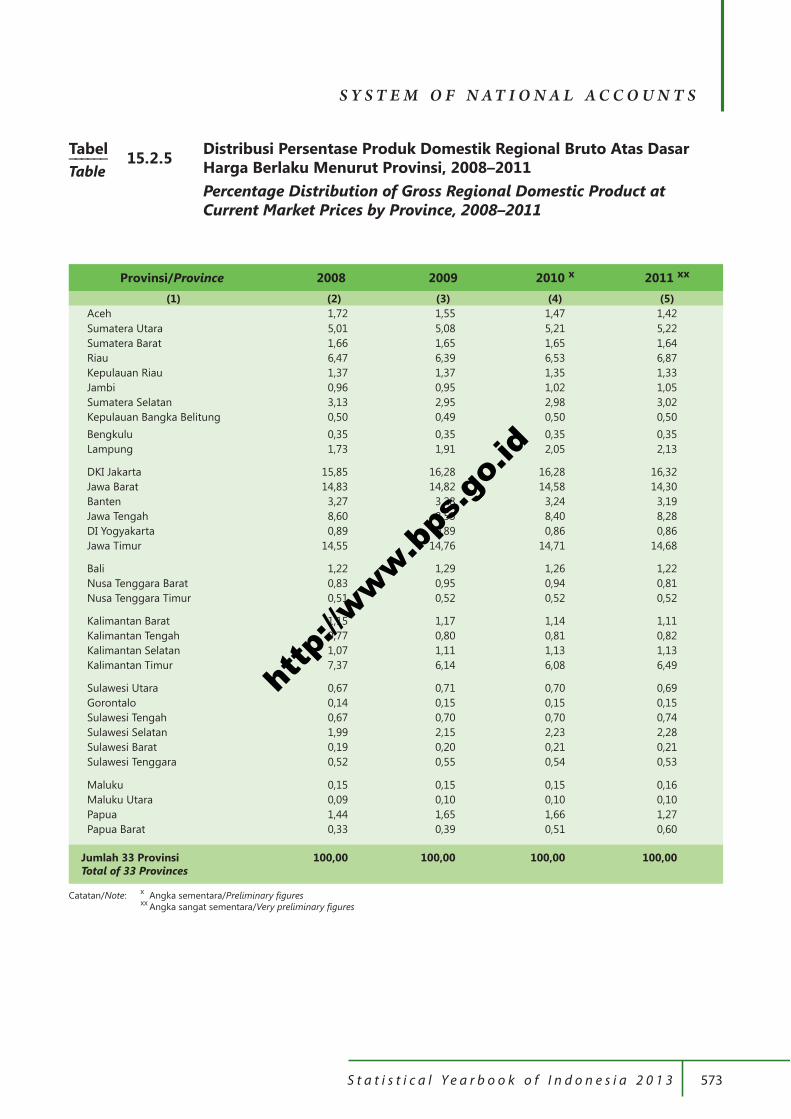
S Y S T E M O F N A T I O N A L A C C O U N T S
S t a t i s t i c a l Y e a r b o o k o f I n d o n e s i a 2 0 1 3 573
Distribusi Persentase Produk Domestik Regional Bruto Atas Dasar Harga Berlaku Menurut Provinsi, 2008–2011Percentage Distribution of Gross Regional Domestic Product at Current Market Prices by Province, 2008–2011
Provinsi/Province 2008 2009 2010 x 2011 xx
(1) (2) (3) (4) (5) Aceh 1,72 1,55 1,47 1,42 Sumatera Utara 5,01 5,08 5,21 5,22 Sumatera Barat 1,66 1,65 1,65 1,64 Riau 6,47 6,39 6,53 6,87 Kepulauan Riau 1,37 1,37 1,35 1,33 Jambi 0,96 0,95 1,02 1,05 Sumatera Selatan 3,13 2,95 2,98 3,02 Kepulauan Bangka Belitung 0,50 0,49 0,50 0,50 Bengkulu 0,35 0,35 0,35 0,35 Lampung 1,73 1,91 2,05 2,13
DKI Jakarta 15,85 16,28 16,28 16,32 Jawa Barat 14,83 14,82 14,58 14,30 Banten 3,27 3,28 3,24 3,19 Jawa Tengah 8,60 8,55 8,40 8,28 DI Yogyakarta 0,89 0,89 0,86 0,86 Jawa Timur 14,55 14,76 14,71 14,68
Bali 1,22 1,29 1,26 1,22 Nusa Tenggara Barat 0,83 0,95 0,94 0,81 Nusa Tenggara Timur 0,51 0,52 0,52 0,52
Kalimantan Barat 1,15 1,17 1,14 1,11 Kalimantan Tengah 0,77 0,80 0,81 0,82 Kalimantan Selatan 1,07 1,11 1,13 1,13 Kalimantan Timur 7,37 6,14 6,08 6,49
Sulawesi Utara 0,67 0,71 0,70 0,69 Gorontalo 0,14 0,15 0,15 0,15 Sulawesi Tengah 0,67 0,70 0,70 0,74 Sulawesi Selatan 1,99 2,15 2,23 2,28 Sulawesi Barat 0,19 0,20 0,21 0,21 Sulawesi Tenggara 0,52 0,55 0,54 0,53
Maluku 0,15 0,15 0,15 0,16 Maluku Utara 0,09 0,10 0,10 0,10 Papua 1,44 1,65 1,66 1,27 Papua Barat 0,33 0,39 0,51 0,60
Jumlah 33 ProvinsiTotal of 33 Provinces
100,00 100,00 100,00 100,00
Tabel –––––– 15.2.5Table
Catatan/Note: x Angka sementara/Preliminary figures xx Angka sangat sementara/Very preliminary figures
http
://www.b
ps.g
o.id

S I S T E M N E R A C A N A S I O N A L
S t a t i s t i k I n d o n e s i a 2 0 1 3574
Laju Pertumbuhan Produk Domestik Regional Bruto Atas Dasar Harga Konstan 2000 Menurut Provinsi (persen), 2008–2011Growth Rate of Gross Regional Domestic Product at 2000 Constant Market Prices by Province (percent), 2008–2011
Provinsi/ProvinceProduk Domestik Regional BrutoGross Regional Domestic Product
Produk Domestik Regional Bruto Tanpa Migas
Gross Regional Domestic Product Without Oil and Gas
2008 2009 2010 x 2011 xx 2008 2009 2010 x 2011 xx
(1) (2) (3) (4) (5) (6) (7) (8) (9) Aceh -5,24 -5,51 2,79 5,02 1,92 3,97 5,49 5,89 Sumatera Utara 6,39 5,07 6,35 6,58 6,40 5,14 6,36 6,59 Sumatera Barat 6,88 4,28 5,93 6,22 6,88 4,28 5,93 6,22 Riau 5,65 2,97 4,18 5,01 8,06 6,56 7,16 7,63 Kepulauan Riau 6,63 3,52 7,19 6,67 7,19 3,66 7,51 6,94 Jambi 7,16 6,39 7,35 8,54 7,37 6,99 6,83 6,94 Sumatera Selatan 5,07 4,11 5,63 6,50 6,31 5,06 6,98 8,03 Kepulauan Bangka Belitung 4,60 3,74 5,93 6,40 4,93 3,98 6,03 6,47 Bengkulu 5,75 5,62 6,06 6,40 5,75 5,62 6,06 6,40 Lampung 5,35 5,26 5,85 6,39 5,42 5,52 5,99 6,40
DKI Jakarta 6,23 5,02 6,50 6,71 6,25 5,03 6,52 6,70 Jawa Barat 6,21 4,19 6,20 6,48 6,36 4,10 6,41 6,79 Banten 5,77 4,71 6,08 6,43 5,77 4,71 6,08 6,43 Jawa Tengah 5,61 5,14 5,84 6,01 5,49 5,66 6,02 6,20 DI Yogyakarta 5,03 4,43 4,88 5,16 5,03 4,43 4,88 5,16 Jawa Timur 5,94 5,01 6,68 7,22 5,90 4,95 6,60 7,20
Bali 5,97 5,33 5,83 6,49 5,97 5,33 5,83 6,49 Nusa Tenggara Barat 2,82 12,14 6,33 -3,18 2,82 12,14 6,33 -3,18 Nusa Tenggara Timur 4,84 4,29 5,23 5,63 4,84 4,29 5,23 5,63
Kalimantan Barat 5,45 4,80 5,37 5,94 5,45 4,80 5,37 5,94 Kalimantan Tengah 6,17 5,57 6,49 6,74 6,17 5,57 6,49 6,74 Kalimantan Selatan 6,45 5,29 5,58 6,12 6,54 5,38 5,69 6,28 Kalimantan Timur 4,90 2,28 5,04 3,93 6,34 7,05 11,70 11,73
Sulawesi Utara 10,86 7,85 7,16 7,39 10,86 7,83 7,17 7,39 Gorontalo 7,76 7,54 7,63 7,68 7,76 7,54 7,63 7,68 Sulawesi Tengah 7,78 7,71 8,75 9,16 7,44 8,00 8,74 9,21 Sulawesi Selatan 7,78 6,23 8,19 7,65 7,79 6,23 8,19 7,65 Sulawesi Barat 12,07 6,03 11,91 10,41 12,07 6,03 11,91 10,41 Sulawesi Tenggara 7,27 7,57 8,19 8,68 7,27 7,57 8,19 8,68
Maluku 4,23 5,44 6,47 6,02 4,23 5,44 6,47 6,02 Maluku Utara 5,99 6,07 7,95 6,41 5,99 6,07 7,95 6,41 Papua -1,40 22,22 -3,16 -5,67 -1,40 22,22 -3,16 -5,67 Papua Barat 7,84 13,87 28,54 27,22 9,25 9,18 8,61 10,45
Jumlah 33 ProvinsiTotal of 33 Provinces
5,74 4,77 6,13 6,32 6,08 5,33 6,53 6,74
Tabel –––––– 15.2.6Table
Catatan/Note: x Angka sementara/Preliminary figures xx Angka sangat sementara/Very preliminary figures
http
://www.b
ps.g
o.id
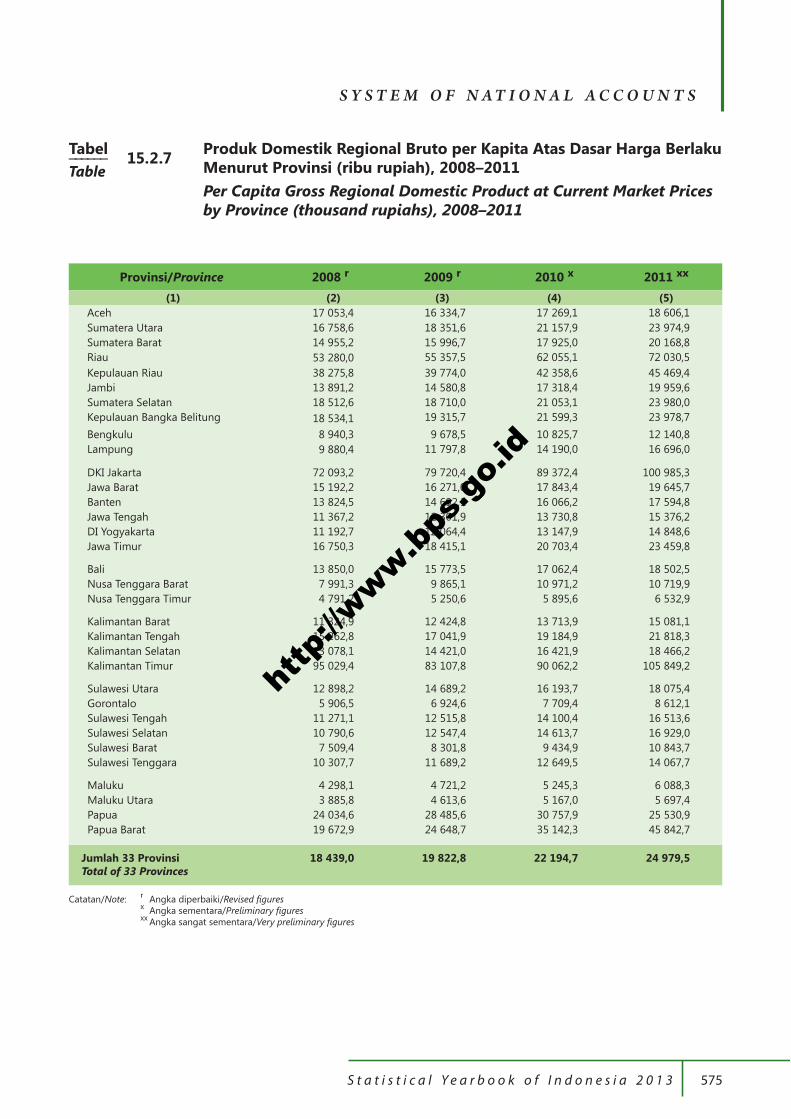
S Y S T E M O F N A T I O N A L A C C O U N T S
S t a t i s t i c a l Y e a r b o o k o f I n d o n e s i a 2 0 1 3 575
Produk Domestik Regional Bruto per Kapita Atas Dasar Harga Berlaku Menurut Provinsi (ribu rupiah), 2008–2011Per Capita Gross Regional Domestic Product at Current Market Prices by Province (thousand rupiahs), 2008–2011
Provinsi/Province 2008 r 2009 r 2010 x 2011 xx (1) (2) (3) (4) (5)
Aceh 17 053,4 16 334,7 17 269,1 18 606,1 Sumatera Utara 16 758,6 18 351,6 21 157,9 23 974,9 Sumatera Barat 14 955,2 15 996,7 17 925,0 20 168,8 Riau 53 280,0 55 357,5 62 055,1 72 030,5 Kepulauan Riau 38 275,8 39 774,0 42 358,6 45 469,4 Jambi 13 891,2 14 580,8 17 318,4 19 959,6 Sumatera Selatan 18 512,6 18 710,0 21 053,1 23 980,0 Kepulauan Bangka Belitung 18 534,1 19 315,7 21 599,3 23 978,7 Bengkulu 8 940,3 9 678,5 10 825,7 12 140,8 Lampung 9 880,4 11 797,8 14 190,0 16 696,0
DKI Jakarta 72 093,2 79 720,4 89 372,4 100 985,3 Jawa Barat 15 192,2 16 271,0 17 843,4 19 645,7 Banten 13 824,5 14 692,1 16 066,2 17 594,8 Jawa Tengah 11 367,2 12 301,9 13 730,8 15 376,2 DI Yogyakarta 11 192,7 12 064,4 13 147,9 14 848,6 Jawa Timur 16 750,3 18 415,1 20 703,4 23 459,8
Bali 13 850,0 15 773,5 17 062,4 18 502,5 Nusa Tenggara Barat 7 991,3 9 865,1 10 971,2 10 719,9 Nusa Tenggara Timur 4 791,2 5 250,6 5 895,6 6 532,9
Kalimantan Barat 11 324,9 12 424,8 13 713,9 15 081,1 Kalimantan Tengah 15 262,8 17 041,9 19 184,9 21 818,3 Kalimantan Selatan 13 078,1 14 421,0 16 421,9 18 466,2 Kalimantan Timur 95 029,4 83 107,8 90 062,2 105 849,2
Sulawesi Utara 12 898,2 14 689,2 16 193,7 18 075,4 Gorontalo 5 906,5 6 924,6 7 709,4 8 612,1 Sulawesi Tengah 11 271,1 12 515,8 14 100,4 16 513,6 Sulawesi Selatan 10 790,6 12 547,4 14 613,7 16 929,0 Sulawesi Barat 7 509,4 8 301,8 9 434,9 10 843,7 Sulawesi Tenggara 10 307,7 11 689,2 12 649,5 14 067,7
Maluku 4 298,1 4 721,2 5 245,3 6 088,3 Maluku Utara 3 885,8 4 613,6 5 167,0 5 697,4 Papua 24 034,6 28 485,6 30 757,9 25 530,9 Papua Barat 19 672,9 24 648,7 35 142,3 45 842,7
Jumlah 33 ProvinsiTotal of 33 Provinces
18 439,0 19 822,8 22 194,7 24 979,5
Tabel –––––– 15.2.7Table
Catatan/Note: r Angka diperbaiki/Revised figures x Angka sementara/Preliminary figures xx Angka sangat sementara/Very preliminary figures
http
://www.b
ps.g
o.id

S I S T E M N E R A C A N A S I O N A L
S t a t i s t i k I n d o n e s i a 2 0 1 3576
Produk Domestik Regional Bruto per Kapita Atas Dasar Harga Konstan 2000 Menurut Provinsi (ribu rupiah), 2008–2011Per Capita Gross Regional Domestic Product at 2000 Constant Market Prices by Province (thousand rupiahs), 2008–2011
Provinsi/Province 2008 r 2009 r 2010 x 2011 xx (1) (2) (3) (4) (5)
Aceh 7 906,3 7 310,9 7 333,9 7 565,2 Sumatera Utara 8 317,2 8 662,0 9 104,8 9 650,1 Sumatera Barat 7 414,3 7 645,4 7 986,2 8 416,1 Riau 17 558,0 17 470,5 17 541,0 17 880,1 Kepulauan Riau 24 187,2 23 853,8 24 295,6 24 828,6 Jambi 5 175,9 5 377,7 5 622,1 5 982,2 Sumatera Selatan 8 042,1 8 236,1 8 534,0 8 972,1 Kepulauan Bangka Belitung 8 565,6 8 625,8 8 845,8 9 174,1 Bengkulu 4 460,5 4 642,7 4 838,9 5 091,2 Lampung 4 616,3 4 809,6 5 024,9 5 308,7
DKI Jakarta 37 665,2 39 083,9 41 015,1 43 389,8 Jawa Barat 6 985,9 7 156,3 7 451,6 7 828,8 Banten 7 877,8 8 037,1 8 283,9 8 624,7 Jawa Tengah 5 202,7 5 462,2 5 773,9 6 112,9 DI Yogyakarta 5 643,8 5 845,9 6 064,2 6 345,8 Jawa Timur 8 236,1 8 602,6 9 101,8 9 737,5
Bali 6 912,2 7 139,8 7 389,0 7 744,1 Nusa Tenggara Barat 3 808,8 4 230,4 4 442,9 4 274,9 Nusa Tenggara Timur 2 528,7 2 588,6 2 666,1 2 773,9
Kalimantan Barat 6 324,5 6 582,4 6 868,1 7 249,3 Kalimantan Tengah 7 792,8 8 097,6 8 464,1 8 923,7 Kalimantan Selatan 7 871,6 8 141,3 8 420,5 8 809,7 Kalimantan Timur 31 154,0 30 719,7 31 023,8 31 227,1
Sulawesi Utara 7 147,2 7 626,0 8 062,1 8 594,2 Gorontalo 2 520,6 2 655,3 2 791,8 2 955,6 Sulawesi Tengah 5 903,8 6 249,0 6 659,8 7 169,1 Sulawesi Selatan 5 646,0 5 940,9 6 348,3 6 791,4 Sulawesi Barat 3 619,1 3 742,8 4 074,2 4 404,9 Sulawesi Tenggara 4 647,4 4 906,3 5 194,7 5 560,8
Maluku 2 596,2 2 666,7 2 758,2 2 860,0 Maluku Utara 2 667,3 2 765,5 2 910,2 3 038,4 Papua 7 396,7 8 572,5 7 851,8 7 066,3 Papua Barat 9 008,7 9 899,1 12 245,6 15 102,6
Jumlah 33 ProvinsiTotal of 33 Provinces
8 630,3 8 921,4 9 319,0 9 804,9
Tabel –––––– 15.2.8Table
Catatan/Note: r Angka diperbaiki/Revised figures x Angka sementara/Preliminary figures xx Angka sangat sementara/Very preliminary figures
http
://www.b
ps.g
o.id
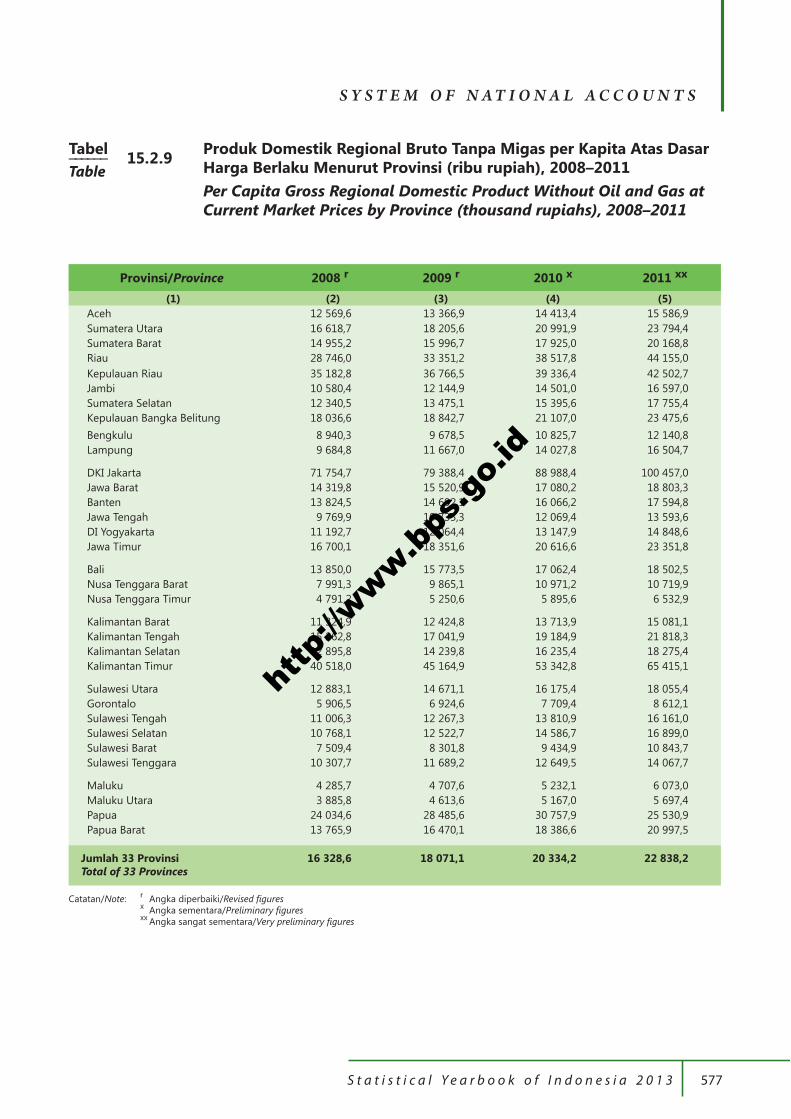
S Y S T E M O F N A T I O N A L A C C O U N T S
S t a t i s t i c a l Y e a r b o o k o f I n d o n e s i a 2 0 1 3 577
Produk Domestik Regional Bruto Tanpa Migas per Kapita Atas Dasar Harga Berlaku Menurut Provinsi (ribu rupiah), 2008–2011Per Capita Gross Regional Domestic Product Without Oil and Gas at Current Market Prices by Province (thousand rupiahs), 2008–2011
Tabel –––––– 15.2.9Table
Provinsi/Province 2008 r 2009 r 2010 x 2011 xx
(1) (2) (3) (4) (5) Aceh 12 569,6 13 366,9 14 413,4 15 586,9 Sumatera Utara 16 618,7 18 205,6 20 991,9 23 794,4 Sumatera Barat 14 955,2 15 996,7 17 925,0 20 168,8 Riau 28 746,0 33 351,2 38 517,8 44 155,0 Kepulauan Riau 35 182,8 36 766,5 39 336,4 42 502,7 Jambi 10 580,4 12 144,9 14 501,0 16 597,0 Sumatera Selatan 12 340,5 13 475,1 15 395,6 17 755,4 Kepulauan Bangka Belitung 18 036,6 18 842,7 21 107,0 23 475,6 Bengkulu 8 940,3 9 678,5 10 825,7 12 140,8 Lampung 9 684,8 11 667,0 14 027,8 16 504,7
DKI Jakarta 71 754,7 79 388,4 88 988,4 100 457,0 Jawa Barat 14 319,8 15 520,9 17 080,2 18 803,3 Banten 13 824,5 14 692,1 16 066,2 17 594,8 Jawa Tengah 9 769,9 10 735,3 12 069,4 13 593,6 DI Yogyakarta 11 192,7 12 064,4 13 147,9 14 848,6 Jawa Timur 16 700,1 18 351,6 20 616,6 23 351,8
Bali 13 850,0 15 773,5 17 062,4 18 502,5 Nusa Tenggara Barat 7 991,3 9 865,1 10 971,2 10 719,9 Nusa Tenggara Timur 4 791,2 5 250,6 5 895,6 6 532,9
Kalimantan Barat 11 324,9 12 424,8 13 713,9 15 081,1 Kalimantan Tengah 15 262,8 17 041,9 19 184,9 21 818,3 Kalimantan Selatan 12 895,8 14 239,8 16 235,4 18 275,4 Kalimantan Timur 40 518,0 45 164,9 53 342,8 65 415,1
Sulawesi Utara 12 883,1 14 671,1 16 175,4 18 055,4 Gorontalo 5 906,5 6 924,6 7 709,4 8 612,1 Sulawesi Tengah 11 006,3 12 267,3 13 810,9 16 161,0 Sulawesi Selatan 10 768,1 12 522,7 14 586,7 16 899,0 Sulawesi Barat 7 509,4 8 301,8 9 434,9 10 843,7 Sulawesi Tenggara 10 307,7 11 689,2 12 649,5 14 067,7
Maluku 4 285,7 4 707,6 5 232,1 6 073,0 Maluku Utara 3 885,8 4 613,6 5 167,0 5 697,4 Papua 24 034,6 28 485,6 30 757,9 25 530,9 Papua Barat 13 765,9 16 470,1 18 386,6 20 997,5
Jumlah 33 ProvinsiTotal of 33 Provinces
16 328,6 18 071,1 20 334,2 22 838,2
Catatan/Note: r Angka diperbaiki/Revised figures x Angka sementara/Preliminary figures xx Angka sangat sementara/Very preliminary figures
http
://www.b
ps.g
o.id

S I S T E M N E R A C A N A S I O N A L
S t a t i s t i k I n d o n e s i a 2 0 1 3578
Produk Domestik Regional Bruto Tanpa Migas per Kapita Atas Dasar Harga Konstan 2000 Menurut Provinsi (ribu rupiah), 2008–2011Per Capita Gross Regional Domestic Product Without Oil and Gas at 2000 Constant Market Prices by Province (thousand rupiahs), 2008–2011
Tabel –––––– 15.2.10Table
Provinsi/Province 2008 r 2009 r 2010 x 2011 xx
(1) (2) (3) (4) (5) Aceh 6 149,9 6 257,1 6 441,7 6 699,9 Sumatera Utara 8 259,2 8 607,0 9 048,0 9 590,4 Sumatera Barat 7 414,3 7 645,4 7 986,2 8 416,1 Riau 8 211,2 8 455,6 8 732,5 9 123,4 Kepulauan Riau 23 071,7 22 784,3 23 274,6 23 844,0 Jambi 4 640,9 4 849,1 5 045,0 5 289,2 Sumatera Selatan 6 199,7 6 407,2 6 724,0 7 170,3 Kepulauan Bangka Belitung 8 404,0 8 483,1 8 707,4 9 037,1 Bengkulu 4 460,5 4 642,7 4 838,9 5 091,2 Lampung 4 554,2 4 756,4 4 975,8 5 257,3
DKI Jakarta 37 565,4 38 985,4 40 916,6 43 283,7 Jawa Barat 6 782,9 6 942,1 7 242,7 7 631,3 Banten 7 877,8 8 037,1 8 283,9 8 624,7 Jawa Tengah 4 869,3 5 137,6 5 440,2 5 770,1 DI Yogyakarta 5 643,8 5 845,9 6 064,2 6 345,8 Jawa Timur 8 207,3 8 567,0 9 057,5 9 688,9
Bali 6 912,2 7 139,8 7 389,0 7 744,1 Nusa Tenggara Barat 3 808,8 4 230,4 4 442,9 4 274,9 Nusa Tenggara Timur 2 528,7 2 588,6 2 666,1 2 773,9
Kalimantan Barat 6 324,5 6 582,4 6 868,1 7 249,3 Kalimantan Tengah 7 792,8 8 097,6 8 464,1 8 923,7 Kalimantan Selatan 7 736,5 8 008,7 8 291,6 8 687,5 Kalimantan Timur 16 928,2 17 469,2 18 759,7 20 300,7
Sulawesi Utara 7 134,6 7 611,4 8 047,4 8 578,9 Gorontalo 2 520,6 2 655,3 2 791,8 2 955,6 Sulawesi Tengah 5 791,7 6 147,1 6 550,3 7 054,5 Sulawesi Selatan 5 634,2 5 928,2 6 334,8 6 777,3 Sulawesi Barat 3 619,1 3 742,8 4 074,2 4 404,9 Sulawesi Tenggara 4 647,4 4 906,3 5 194,7 5 560,8
Maluku 2 587,6 2 658,0 2 749,4 2 850,9 Maluku Utara 2 667,3 2 765,5 2 910,2 3 038,4 Papua 7 396,7 8 572,5 7 851,8 7 066,3 Papua Barat 7 022,3 7 398,9 7 734,2 8 281,5
Jumlah 33 ProvinsiTotal of 33 Provinces
8 005,6 8 320,1 8 723,3 9 213,9
Catatan/Note: r Angka diperbaiki/Revised figures x Angka sementara/Preliminary figures xx Angka sangat sementara/Very preliminary figures
http
://www.b
ps.g
o.id

S Y S T E M O F N A T I O N A L A C C O U N T S
S t a t i s t i c a l Y e a r b o o k o f I n d o n e s i a 2 0 1 3 579
Laju Pertumbuhan Produk Domestik Regional Bruto per Kapita Atas Dasar Harga Konstan 2000 Menurut Provinsi (persen), 2008–2011Growth Rate of per Capita Gross Regional Domestic Product at 2000 Constant Market Prices by Province (percent), 2008–2011
Tabel –––––– 15.2.11Table
Catatan/Note: r Angka diperbaiki/Revised figures x Angka sementara/Preliminary figures xx Angka sangat sementara/Very preliminary figures
Provinsi/ProvinceProduk Domestik Regional BrutoGross Regional Domestic Product
Produk Domestik Regional Bruto Tanpa Migas
Gross Regional Domestic Product Without Oil and Gas
2008 r 2009 r 2010 x 2011 xx 2008 r 2009 r 2010 x 2011 xx
(1) (2) (3) (4) (5) (6) (7) (8) (9) Aceh -7,29 -7,53 0,31 3,15 -0,28 1,74 2,95 4,01 Sumatera Utara 4,93 4,15 5,11 5,99 4,94 4,21 5,12 5,99 Sumatera Barat 5,17 3,12 4,46 5,38 5,17 3,12 4,46 5,38 Riau 1,93 -0,50 0,40 1,93 4,25 2,98 3,27 4,48 Kepulauan Riau 1,76 -1,38 1,85 2,19 2,30 -1,25 2,15 2,45 Jambi 4,30 3,90 4,55 6,40 4,50 4,49 4,04 4,84 Sumatera Selatan 2,91 2,41 3,62 5,13 4,12 3,35 4,94 6,64 Kepulauan Bangka Belitung 1,29 0,70 2,55 3,71 1,61 0,94 2,64 3,79 Bengkulu 3,74 4,08 4,23 5,21 3,74 4,08 4,23 5,21 Lampung 3,76 4,19 4,48 5,65 3,83 4,44 4,61 5,66
DKI Jakarta 4,47 3,77 4,94 5,79 4,48 3,78 4,95 5,79 Jawa Barat 3,98 2,44 4,13 5,06 4,13 2,35 4,33 5,37 Banten 2,74 2,02 3,07 4,11 2,74 2,02 3,07 4,11 Jawa Tengah 4,90 4,99 5,71 5,87 4,78 5,51 5,89 6,07 DI Yogyakarta 3,65 3,58 3,73 4,64 3,65 3,58 3,73 4,64 Jawa Timur 4,83 4,45 5,80 6,98 4,78 4,38 5,73 6,97
Bali 3,51 3,29 3,49 4,81 3,51 3,29 3,49 4,81 Nusa Tenggara Barat 1,34 11,07 5,03 -3,78 1,34 11,07 5,03 -3,78 Nusa Tenggara Timur 2,48 2,37 2,99 4,05 2,48 2,37 2,99 4,05
Kalimantan Barat 4,19 4,08 4,34 5,55 4,19 4,08 4,34 5,55 Kalimantan Tengah 4,04 3,91 4,53 5,43 4,04 3,91 4,53 5,43 Kalimantan Selatan 4,13 3,43 3,43 4,62 4,22 3,52 3,53 4,77 Kalimantan Timur 1,01 -1,39 0,99 0,66 2,40 3,20 7,39 8,21
Sulawesi Utara 9,15 6,70 5,72 6,60 9,15 6,68 5,73 6,60 Gorontalo 5,15 5,35 5,14 5,87 5,15 5,35 5,14 5,87 Sulawesi Tengah 5,47 5,85 6,57 7,65 5,13 6,14 6,56 7,70 Sulawesi Selatan 6,23 5,22 6,86 6,98 6,24 5,22 6,86 6,98 Sulawesi Barat 8,96 3,42 8,85 8,12 8,96 3,42 8,85 8,12 Sulawesi Tenggara 4,85 5,57 5,88 7,05 4,85 5,57 5,88 7,05
Maluku 1,23 2,71 3,43 3,69 1,23 2,72 3,44 3,69 Maluku Utara 3,24 3,68 5,23 4,41 3,24 3,68 5,23 4,41 Papua -6,21 15,90 -8,41 -10,00 -6,21 15,90 -8,41 -10,00 Papua Barat 3,93 9,88 23,70 23,33 5,29 5,36 4,53 7,08
Jumlah 33 ProvinsiTotal of 33 Provinces
3,89 3,37 4,46 5,21 4,23 3,93 4,85 5,63
http
://www.b
ps.g
o.id

S I S T E M N E R A C A N A S I O N A L
S t a t i s t i k I n d o n e s i a 2 0 1 3580
SektorSector 1 2 3 4 5 6 7 8
(1) (2) (3) (4) (5) (6) (7) (8) (9)
1 36 922,0 60,3 260 609,0 0,0 11 331,7 41 858,7 87,9 90,82 0,3 37 011,3 185 112,6 12 802,7 38 830,3 24,6 29,6 0,0 3 61 060,5 15 595,7 732 902,5 30 796,6 273 410,5 109 641,3 94 217,9 18 311,24 269,2 277,2 24 184,1 13 504,0 248,1 10 812,6 4 010,1 2 281,55 4 341,9 4 013,4 2 446,7 847,9 589,4 9 272,4 6 377,9 10 103,06 404,0 394,5 8 578,5 83,3 5 101,8 8 991,7 3 654,4 2 600,87 2 641,7 4 000,1 41 418,1 335,7 5 725,3 32 474,5 33 945,0 9 789,38 7 020,7 5 207,8 54 829,5 3 426,9 32 828,2 72 885,9 25 024,2 56 318,09 2 604,6 3 521,4 22 382,2 185,6 3 514,4 11 787,5 36 656,1 13 301,9190 115 264,7 70 081,7 1 332 463,1 61 982,8 371 579,6 297 749,1 204 003,0 112 796,6200 – – – – – – – –201 84 728,4 43 670,5 227 388,8 8 688,6 76 881,8 129 859,5 64 154,1 53 524,9202 276 301,7 243 517,1 478 521,8 13 504,3 103 773,7 250 073,5 67 930,9 164 439,1203 8 729,7 16 855,8 91 159,9 12 065,2 18 722,1 36 438,0 59 778,5 16 422,4204 6 002,8 13 126,3 54 553,6 1 503,2 7 484,5 16 814,5 3 404,4 5 005,1205 -147,8 0,0 -55 943,2 -8 850,6 0,0 0,0 -845,4 0,0 209 375 614,9 317 169,6 795 680,9 26 910,8 206 862,2 433 185,6 194 422,5 239 391,5210 490 879,7 387 251,3 2 128 143,9 88 893,5 578 441,8 730 934,6 398 425,5 352 188,0
Transaksi Total Atas Dasar Harga Pembeli 9 Sektor Ekonomi (miliar rupiah), 2005 Total Transaction at Purchaser's Prices of 9 Economic Sectors (billion rupiahs), 2005
15.3 TABEL INPUT-OUTPUT INPUT-OUTPUT TABLE
Tabel ––––––
15.3.1Table
Catatan/Note: 1 Pertanian, Peternakan, Kehutanan, dan Perikanan/Agriculture, Livestock, Forestry, and Fishery 2 Pertambangan dan Penggalian/Mining and Quarrying 3 Industri Pengolahan/Manufacturing Industry 4 Listrik, Gas, dan Air Bersih/Electricity, Gas, and Water Supply 5 Bangunan/Construction 6 Perdagangan, Hotel, dan Restoran/Trade, Hotel, and Restaurant 7 Pengangkutan dan Komunikasi/Transport and Communication 8 Keuangan, Real Estat, dan Jasa Perusahaan/Financial, Real Estate, and Business Services 9 Jasa-Jasa/Services
http
://www.b
ps.g
o.id
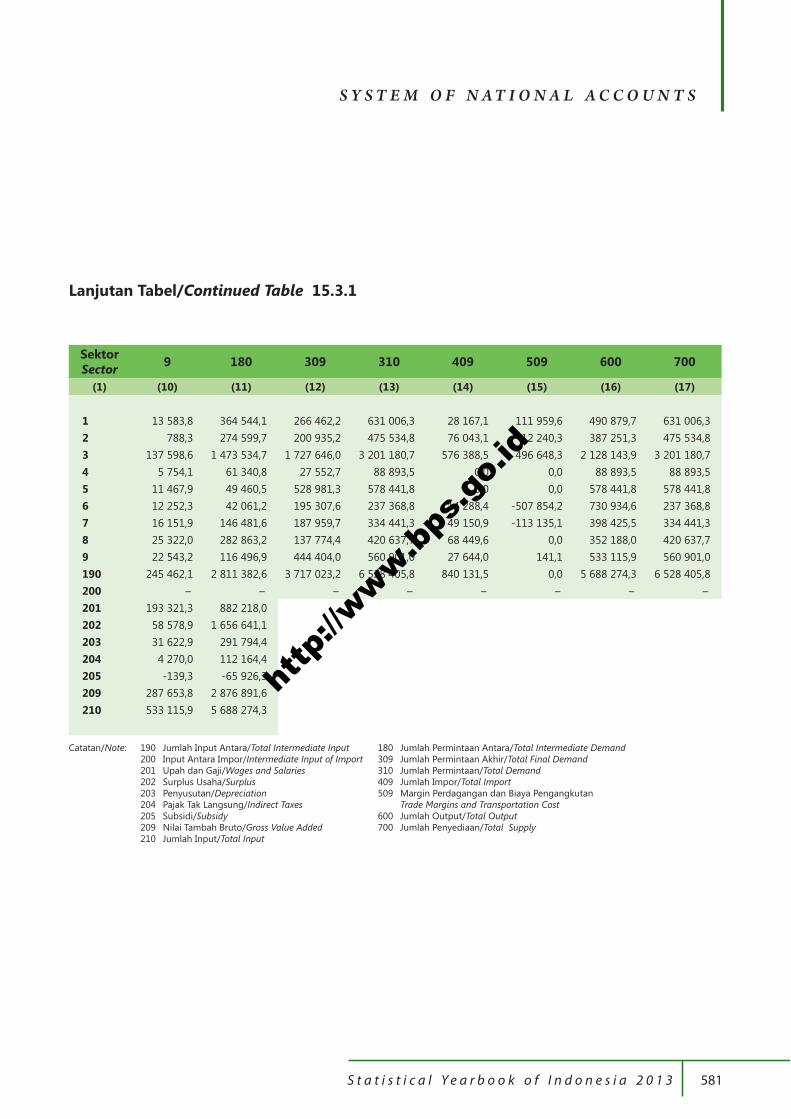
S Y S T E M O F N A T I O N A L A C C O U N T S
S t a t i s t i c a l Y e a r b o o k o f I n d o n e s i a 2 0 1 3 581
SektorSector 9 180 309 310 409 509 600 700
(1) (10) (11) (12) (13) (14) (15) (16) (17)
1 13 583,8 364 544,1 266 462,2 631 006,3 28 167,1 111 959,6 490 879,7 631 006,32 788,3 274 599,7 200 935,2 475 534,8 76 043,1 12 240,3 387 251,3 475 534,83 137 598,6 1 473 534,7 1 727 646,0 3 201 180,7 576 388,5 496 648,3 2 128 143,9 3 201 180,74 5 754,1 61 340,8 27 552,7 88 893,5 0,0 0,0 88 893,5 88 893,55 11 467,9 49 460,5 528 981,3 578 441,8 0,0 0,0 578 441,8 578 441,86 12 252,3 42 061,2 195 307,6 237 368,8 14 288,4 -507 854,2 730 934,6 237 368,87 16 151,9 146 481,6 187 959,7 334 441,3 49 150,9 -113 135,1 398 425,5 334 441,38 25 322,0 282 863,2 137 774,4 420 637,7 68 449,6 0,0 352 188,0 420 637,79 22 543,2 116 496,9 444 404,0 560 901,0 27 644,0 141,1 533 115,9 560 901,0190 245 462,1 2 811 382,6 3 717 023,2 6 528 405,8 840 131,5 0,0 5 688 274,3 6 528 405,8200 – – – – – – – –201 193 321,3 882 218,0202 58 578,9 1 656 641,1203 31 622,9 291 794,4204 4 270,0 112 164,4205 -139,3 -65 926,3209 287 653,8 2 876 891,6210 533 115,9 5 688 274,3
Lanjutan Tabel/Continued Table 15.3.1
Catatan/Note: 190 Jumlah Input Antara/Total Intermediate Input 180 Jumlah Permintaan Antara/Total Intermediate Demand 200 Input Antara Impor/Intermediate Input of Import 309 Jumlah Permintaan Akhir/Total Final Demand 201 Upah dan Gaji/Wages and Salaries 310 Jumlah Permintaan/Total Demand 202 Surplus Usaha/Surplus 409 Jumlah Impor/Total Import 203 Penyusutan/Depreciation 509 Margin Perdagangan dan Biaya Pengangkutan 204 Pajak Tak Langsung/Indirect Taxes Trade Margins and Transportation Cost 205 Subsidi/Subsidy 600 Jumlah Output/Total Output 209 Nilai Tambah Bruto/Gross Value Added 700 Jumlah Penyediaan/Total Supply 210 Jumlah Input/Total Input
http
://www.b
ps.g
o.id

S I S T E M N E R A C A N A S I O N A L
S t a t i s t i k I n d o n e s i a 2 0 1 3582
SektorSector 1 2 3 4 5 6 7 8
(1) (2) (3) (4) (5) (6) (7) (8) (9)
1 32 907,4 48,8 231 119,9 0,0 9 254,7 32 634,8 72,7 63,52 0,2 36 900,3 183 443,4 12 654,5 31 563,3 21,1 28,4 0,03 51 706,2 12 551,6 640 765,3 27 046,6 227 898,3 89 253,7 82 028,1 15 316,94 269,2 277,2 24 184,1 13 504,0 248,1 10 812,6 4 010,1 2 281,55 4 341,9 4 013,4 2 446,7 847,9 589,4 9 272,4 6 377,9 10 103,06 11 132,0 2 952,8 108 337,6 3 229,8 49 423,9 33 004,7 13 518,6 5 043,07 5 283,1 4 608,4 65 049,3 1 087,4 16 260,8 38 151,3 36 287,1 10 368,78 7 020,7 5 207,8 54 829,5 3 426,9 32 828,2 72 885,9 25 024,2 56 318,09 2 603,9 3 521,4 22 287,3 185,6 3 512,9 11 712,6 36 656,0 13 301,9190 115 264,7 70 081,7 1 332 463,1 61 982,8 371 579,6 297 749,1 204 003,0 112 796,6200 – – – – – – – –201 84 728,4 43 670,5 227 388,8 8 688,6 76 881,8 129 859,5 64 154,1 53 524,9202 276 301,7 243 517,1 478 521,8 13 504,3 103 773,7 250 073,5 67 930,9 164 439,1203 8 729,7 16 855,8 91 159,9 12 065,2 18 722,1 36 438,0 59 778,5 16 422,4204 6 002,8 13 126,3 54 553,6 1 503,2 7 484,5 16 814,5 3 404,4 5 005,1205 -147,8 0,0 -55 943,2 -8 850,6 0,0 0,0 -845,4 0,0209 375 614,9 317 169,6 795 680,9 26 910,8 206 862,2 433 185,6 194 422,5 239 391,5210 490 879,7 387 251,3 2 128 143,9 88 893,5 578 441,8 730 934,6 398 425,5 352 188,0
Transaksi Total Atas Dasar Harga Produsen 9 Sektor Ekonomi (miliar rupiah), 2005 Total Transaction at Producer’s Prices of 9 Economic Sectors (billion rupiahs), 2005
Tabel ––––––
15.3.2Table
Catatan/Note: 1 Pertanian, Peternakan, Kehutanan, dan Perikanan/Agriculture, Livestock, Forestry, and Fishery 2 Pertambangan dan Penggalian/Mining and Quarrying 3 Industri Pengolahan/Manufacturing Industry 4 Listrik, Gas, dan Air Bersih/Electricity, Gas, and Water Supply 5 Bangunan/Construction 6 Perdagangan, Hotel, dan Restoran/Trade, Hotel, and Restaurant 7 Pengangkutan dan Komunikasi/Transport and Communication 8 Keuangan, Real Estat, dan Jasa Perusahaan/Financial, Real Estate, and Business Services 9 Jasa-Jasa/Services
http
://www.b
ps.g
o.id

S Y S T E M O F N A T I O N A L A C C O U N T S
S t a t i s t i c a l Y e a r b o o k o f I n d o n e s i a 2 0 1 3 583
SektorSector 9 180 309 310 409 509 600 700
(1) (10) (11) (12) (13) (14) (15) (16) (17)
1 10 238,0 316 339,9 202 706,8 519 046,7 28 167,1 – 490 879,7 519 046,72 673,7 265 284,8 198 009,7 463 294,5 76 043,1 – 387 251,3 463 294,53 117 901,1 1 264 467,9 1 440 064,5 2 704 532,4 576 388,5 – 2 128 143,9 2 704 532,44 5 754,1 61 340,8 27 552,7 88 893,5 0,0 – 88 893,5 88 893,55 11 467,9 49 460,5 528 981,3 578 441,8 0,0 – 578 441,8 578 441,86 30 941,4 257 583,9 487 639,1 745 223,0 14 288,4 – 730 934,6 745 223,07 20 622,3 197 718,3 249 858,1 447 576,4 49 150,9 – 398 425,5 447 576,48 25 322,0 282 863,2 137 774,4 420 637,7 68 449,6 – 352 188,0 420 637,79 22 541,6 116 323,3 444 436,6 560 759,9 27 644,0 – 533 115,9 560 759,9190 245 462,1 2 811 382,6 3 717 023,2 6 528 405,8 840 131,5 – 5 688 274,3 6 528 405,8200 – – – – – – – –201 193 321,3 882 218,0202 58 578,9 1 656 641,1203 31 622,9 291 794,4204 4 270,0 112 164,4205 -139,3 -65 926,3209 287 653,8 2 876 891,6210 533 115,9 5 688 274,3
Lanjutan Tabel/Continued Table 15.3.2
Catatan/Note: 190 Jumlah Input Antara/Total Intermediate Input 180 Jumlah Permintaan Antara/Total Intermediate Demand 200 Input Antara Impor/Intermediate Input of Import 309 Jumlah Permintaan Akhir/Total Final Demand 201 Upah dan Gaji/Wages and Salaries 310 Jumlah Permintaan/Total Demand 202 Surplus Usaha/Surplus 409 Jumlah Impor/Total Import 203 Penyusutan/Depreciation 509 Margin Perdagangan dan Biaya Pengangkutan 204 Pajak Tak Langsung/Indirect Taxes Trade Margins and Transportation Cost 205 Subsidi/Subsidy 600 Jumlah Output/Total Output 209 Nilai Tambah Bruto/Gross Value Added 700 Jumlah Penyediaan/Total Supply 210 Jumlah Input/Total Input
http
://www.b
ps.g
o.id

S I S T E M N E R A C A N A S I O N A L
S t a t i s t i k I n d o n e s i a 2 0 1 3584
SektorSector 1 2 3 4 5 6 7 8
(1) (2) (3) (4) (5) (6) (7) (8) (9)
1 32 519,3 48,8 210 813,0 0,0 9 254,7 32 471,0 72,7 63,52 0,2 27 370,3 118 351,6 12 560,5 30 855,8 13,3 25,4 0,03 43 162,6 11 434,7 410 802,5 20 908,0 171 184,1 85 026,8 55 935,8 9 645,34 269,2 277,2 24 184,1 13 504,0 248,1 10 812,6 4 010,1 2 281,55 4 341,9 4 013,4 2 446,7 847,9 589,4 9 272,4 6 377,9 10 103,06 11 114,2 2 944,2 107 949,5 3 222,5 49 181,9 30 821,5 13 238,6 4 840,67 5 278,7 3 663,1 53 079,8 1 063,8 15 738,4 35 825,7 28 702,7 9 316,18 6 586,2 2 985,0 44 420,2 2 440,1 22 141,6 59 329,6 15 956,9 46 934,59 2 533,2 3 428,1 20 800,8 170,3 3 378,7 11 342,4 35 478,4 11 964,3190 105 805,5 56 164,8 992 848,2 54 717,2 302 572,7 274 915,3 159 798,5 95 148,7200 9 459,2 13 917,0 339 614,9 7 265,5 69 006,9 22 833,7 44 204,5 17 647,8201 84 728,4 43 670,5 227 388,8 8 688,6 76 881,8 129 859,5 64 154,1 53 524,9202 276 301,7 243 517,1 478 521,8 13 504,3 103 773,7 250 073,5 67 930,9 164 439,1203 8 729,7 16 855,8 91 159,9 12 065,2 18 722,1 36 438,0 59 778,5 16 422,4204 6 002,8 13 126,3 54 553,6 1 503,2 7 484,5 16 814,5 3 404,4 5 005,1205 -147,8 0,0 -55 943,2 -8 850,6 0,0 0,0 -845,4 0,0209 375 614,9 317 169,6 795 680,9 26 910,8 206 862,2 433 185,6 194 422,5 239 391,5210 490 879,7 387 251,3 2 128 143,9 88 893,5 578 441,8 730 934,6 398 425,5 352 188,0
Transaksi Domestik Atas Dasar Harga Produsen 9 Sektor Ekonomi (miliar rupiah), 2005 Domestic Transaction at Producer’s Prices of 9 Economic Sector (billion rupiahs), 2005
Tabel ––––––
15.3.3Table
Catatan/Note: 1 Pertanian, Peternakan, Kehutanan, dan Perikanan/Agriculture, Livestock, Forestry, and Fishery 2 Pertambangan dan Penggalian/Mining and Quarrying 3 Industri Pengolahan/Manufacturing Industry 4 Listrik, Gas, dan Air Bersih/Electricity, Gas, and Water Supply 5 Bangunan/Construction 6 Perdagangan, Hotel, dan Restoran/Trade, Hotel, and Restaurant 7 Pengangkutan dan Komunikasi/Transport and Communication 8 Keuangan, Real Estat, dan Jasa Perusahaan/Financial, Real Estate, and Business Services 9 Jasa-Jasa/Services
http
://www.b
ps.g
o.id
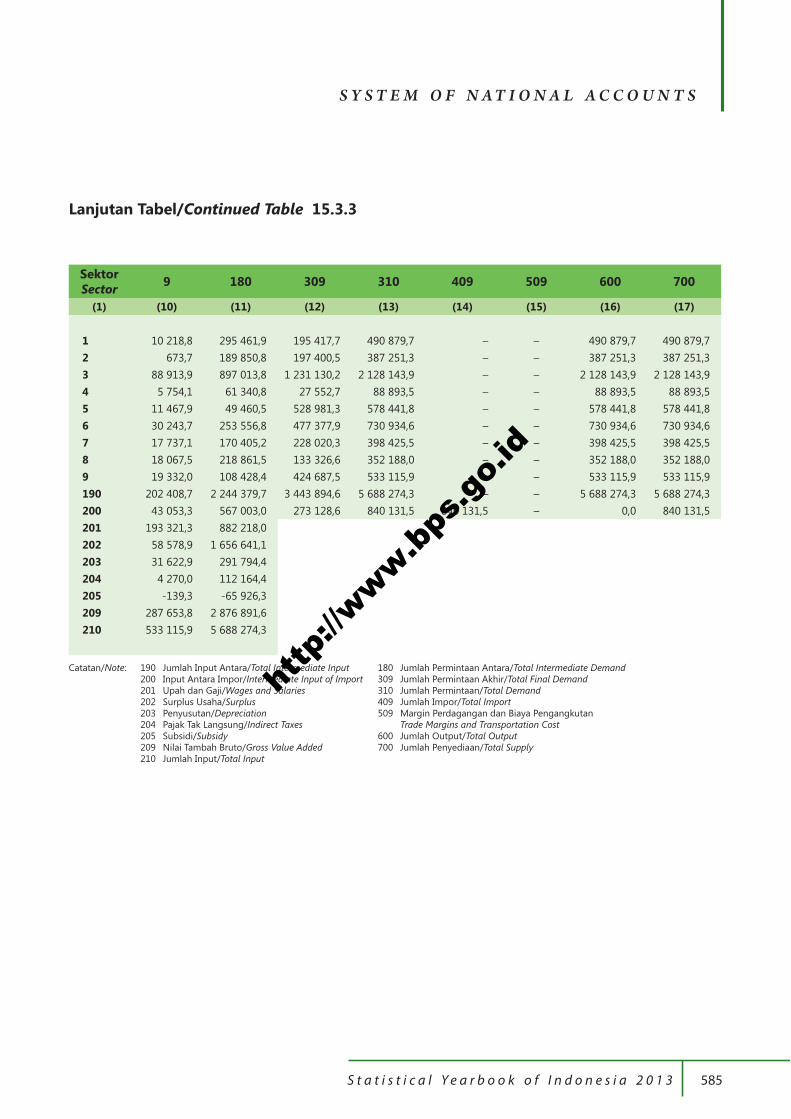
S Y S T E M O F N A T I O N A L A C C O U N T S
S t a t i s t i c a l Y e a r b o o k o f I n d o n e s i a 2 0 1 3 585
SektorSector 9 180 309 310 409 509 600 700
(1) (10) (11) (12) (13) (14) (15) (16) (17)
1 10 218,8 295 461,9 195 417,7 490 879,7 – – 490 879,7 490 879,72 673,7 189 850,8 197 400,5 387 251,3 – – 387 251,3 387 251,33 88 913,9 897 013,8 1 231 130,2 2 128 143,9 – – 2 128 143,9 2 128 143,94 5 754,1 61 340,8 27 552,7 88 893,5 – – 88 893,5 88 893,55 11 467,9 49 460,5 528 981,3 578 441,8 – – 578 441,8 578 441,86 30 243,7 253 556,8 477 377,9 730 934,6 – – 730 934,6 730 934,67 17 737,1 170 405,2 228 020,3 398 425,5 – – 398 425,5 398 425,58 18 067,5 218 861,5 133 326,6 352 188,0 – – 352 188,0 352 188,09 19 332,0 108 428,4 424 687,5 533 115,9 – – 533 115,9 533 115,9190 202 408,7 2 244 379,7 3 443 894,6 5 688 274,3 – – 5 688 274,3 5 688 274,3200 43 053,3 567 003,0 273 128,6 840 131,5 840 131,5 – 0,0 840 131,5201 193 321,3 882 218,0202 58 578,9 1 656 641,1203 31 622,9 291 794,4204 4 270,0 112 164,4205 -139,3 -65 926,3209 287 653,8 2 876 891,6210 533 115,9 5 688 274,3
Lanjutan Tabel/Continued Table 15.3.3
Catatan/Note: 190 Jumlah Input Antara/Total Intermediate Input 180 Jumlah Permintaan Antara/Total Intermediate Demand 200 Input Antara Impor/Intermediate Input of Import 309 Jumlah Permintaan Akhir/Total Final Demand 201 Upah dan Gaji/Wages and Salaries 310 Jumlah Permintaan/Total Demand 202 Surplus Usaha/Surplus 409 Jumlah Impor/Total Import 203 Penyusutan/Depreciation 509 Margin Perdagangan dan Biaya Pengangkutan 204 Pajak Tak Langsung/Indirect Taxes Trade Margins and Transportation Cost 205 Subsidi/Subsidy 600 Jumlah Output/Total Output 209 Nilai Tambah Bruto/Gross Value Added 700 Jumlah Penyediaan/Total Supply 210 Jumlah Input/Total Input
http
://www.b
ps.g
o.id
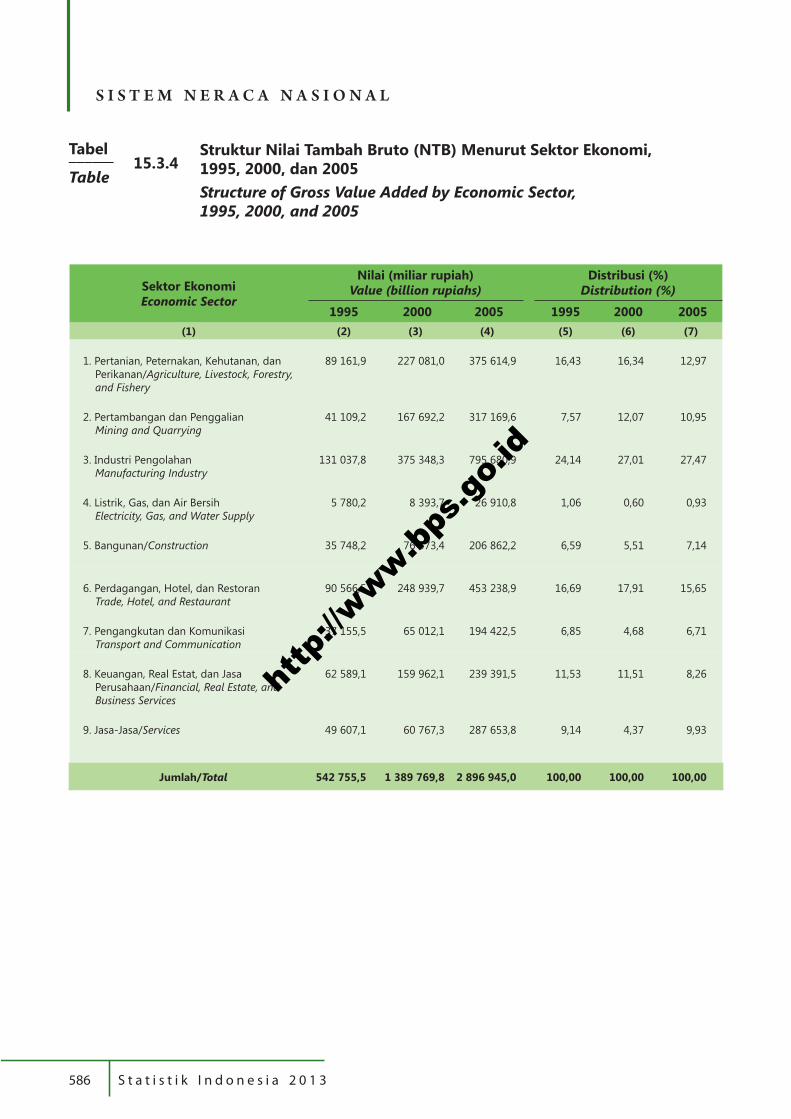
S I S T E M N E R A C A N A S I O N A L
S t a t i s t i k I n d o n e s i a 2 0 1 3586
Struktur Nilai Tambah Bruto (NTB) Menurut Sektor Ekonomi, 1995, 2000, dan 2005 Structure of Gross Value Added by Economic Sector, 1995, 2000, and 2005
Sektor EkonomiEconomic Sector
Nilai (miliar rupiah)Value (billion rupiahs)
Distribusi (%)Distribution (%)
1995 2000 2005 1995 2000 2005(1) (2) (3) (4) (5) (6) (7)
1. Pertanian, Peternakan, Kehutanan, dan Perikanan/Agriculture, Livestock, Forestry, and Fishery
89 161,9 227 081,0 375 614,9 16,43 16,34 12,97
2. Pertambangan dan Penggalian Mining and Quarrying
41 109,2 167 692,2 317 169,6 7,57 12,07 10,95
3. Industri Pengolahan Manufacturing Industry
131 037,8 375 348,3 795 680,9 24,14 27,01 27,47
4. Listrik, Gas, dan Air Bersih Electricity, Gas, and Water Supply
5 780,2 8 393,7 26 910,8 1,06 0,60 0,93
5. Bangunan/Construction 35 748,2 76 573,4 206 862,2 6,59 5,51 7,14
6. Perdagangan, Hotel, dan Restoran Trade, Hotel, and Restaurant
90 566,5 248 939,7 453 238,9 16,69 17,91 15,65
7. Pengangkutan dan Komunikasi Transport and Communication
37 155,5 65 012,1 194 422,5 6,85 4,68 6,71
8. Keuangan, Real Estat, dan Jasa Perusahaan/Financial, Real Estate, and Business Services
62 589,1 159 962,1 239 391,5 11,53 11,51 8,26
9. Jasa-Jasa/Services 49 607,1 60 767,3 287 653,8 9,14 4,37 9,93
Jumlah/Total 542 755,5 1 389 769,8 2 896 945,0 100,00 100,00 100,00
Tabel ––––––
15.3.4Table
http
://www.b
ps.g
o.id

S Y S T E M O F N A T I O N A L A C C O U N T S
S t a t i s t i c a l Y e a r b o o k o f I n d o n e s i a 2 0 1 3 587
Struktur Output Menurut Sektor Ekonomi, 1995, 2000, dan 2005 Structure of Output by Economic Sector, 1995, 2000, and 2005
Sektor EkonomiEconomic Sector
Nilai (miliar rupiah)Value (billion rupiahs)
Distribusi (%)Distribution (%)
1995 2000 2005 1995 2000 2005(1) (2) (3) (4) (5) (6) (7)
1. Pertanian, Peternakan, Kehutanan, dan Perikanan/Agriculture, Livestock, Forestry, and Fishery
121 706,6 307 436,0 490 879,7 12,24 11,38 8,63
2. Pertambangan dan Penggalian Mining and Quarrying
47 564,6 196 815,2 387 251,3 4,79 7,29 6,81
3. Industri Pengolahan Manufacturing Industry
355 146,4 1 052 451,3 2 128 143,9 35,73 38,96 37,41
4. Listrik, Gas, dan Air Bersih Electricity, Gas, and Water Supply
12 049,9 30 637,7 88 893,5 1,21 1,13 1,56
5. Bangunan/Construction 103 644,7 227 677,1 578 441,8 10,43 8,43 10,17
6. Perdagangan, Hotel, dan Restoran Trade, Hotel, and Restaurant
126 790,9 396 214,3 730 934,6 12,76 14,67 12,85
7. Pengangkutan dan Komunikasi Transport and Communication
59 660,8 151 272,2 398 425,5 6,00 5,60 7,00
8. Keuangan, Real Estat, dan Jasa Perusahaan/Financial, Real Estate, and Business Services
87 025,5 161 353,9 352 188,0 8,76 5,97 6,19
9. Jasa-Jasa/Services 80 341,5 177 242,3 533 115,9 8,08 6,56 9,37
Jumlah/Total 993 930,8 2 701 099,8 5 688 274,3 100,00 100,00 100,00
Tabel ––––––
15.3.5Table
http
://www.b
ps.g
o.id

S I S T E M N E R A C A N A S I O N A L
S t a t i s t i k I n d o n e s i a 2 0 1 3588
Sektor EkonomiEconomic Sectors
Indeks Daya PenyebaranBackward Linkages
Indeks Derajat KepekaanForward Linkages
1995 2000 2005 1995 2000 2005(1) (2) (3) (4) (5) (6) (7)
1. Pertanian, Peternakan, Kehutanan, dan Perikanan/Agriculture, Livestock, Forestry, and Fishery
0,8645 0,8745 0,8331 1,0850 0,9826 0,9436
2. Pertambangan dan Penggalian Mining and Quarrying
0,7663 0,7413 0,7528 0,8775 1,2302 0,9483
3. Industri Pengolahan Manufacturing Industry
1,1503 1,1110 1,0740 1,7891 1,5444 1,9043
4. Listrik, Gas, dan Air Bersih Electricity, Gas, and Water Supply
1,1278 1,1924 1,2576 0,7746 0,7479 0,8059
5. Bangunan/Construction 1,2363 1,1351 1,1477 0,7472 0,7319 0,7234
6. Perdagangan, Hotel, dan Restoran Trade, Hotel, and Restaurant
0,9743 1,0262 0,9974 0,9518 1,2065 0,9680
7. Pengangkutan dan Komunikasi Transport and Communication
0,9580 1,0509 1,0374 0,9059 0,8724 0,8826
8. Keuangan, Real Estat, dan Jasa Perusahaan/Financial, Real Estate, and Business Services
0,9143 0,8756 0,8861 1,0850 0,9928 1,0071
9. Jasa-Jasa/Services 1,0081 0,9931 1,0140 0,7840 0,6914 0,8169
Indeks Daya Penyebaran dan Indeks Derajat Kepekaan Menurut Sektor Ekonomi, 1995, 2000, dan 2005Backward and Forward Linkage by Economic Sector, 1995, 2000, and 2005
Tabel ––––––
15.3.6Table
http
://www.b
ps.g
o.id

S Y S T E M O F N A T I O N A L A C C O U N T S
S t a t i s t i c a l Y e a r b o o k o f I n d o n e s i a 2 0 1 3 589
[Diolah dari Hasil Sensus, Survei, dan Berbagai Sumber Lainnya/Based on Census, Surveys, and Other Sources]
Klasifikasi Tenaga KerjaWorker Classifications 2000 2005 2008
(1) (2) (3) (4)
Pertanian penerima upah dan gajiPaid agricultural labour
48 402,1 76 488,8 166 135,0
Pertanian bukan penerima upah dan gajiUnpaid agricultural labour
97 320,7 207 859,3 428 377,0
Produksi, operator, manual penerima upah dan gajiPaid production, operator, manual workers
142 000,3 332 433,7 633 907,1
Produksi, operator, manual bukan penerima upah dan gajiUnpaid production, operator, manual workers
40 969,8 145 635,8 252 311,2
Tata usaha, penjualan, dan jasa penerima upah dan gajiPaid clerical, sales, and services workers
136 698,7 316 555,9 526 744,4
Tata usaha, penjualan, dan jasa bukan penerima upah dan gajiUnpaid clerical, sales, and services workers
99 644,9 224 946,3 376 973,6
Profesional, teknisi, manager, militer penerima upah dan gajiPaid professional, technician, managerial, and non-civilian workers
70 477,5 156 739,6 261 707,4
Profesional, teknisi, manager, militer bukan penerima upah dan gajiUnpaid professional, technician, managerial, and non-civilian workers
6 560,1 25 519,2 46 463,1
15.4 SISTEM NERACA SOSIAL EKONOMI SOCIAL ACCOUNTING MATRIX
Upah dan Gaji Menurut Klasifikasi Tenaga Kerja (miliar rupiah), 2000, 2005, dan 2008Wages and Salaries by Worker Classification (billion rupiahs), 2000, 2005, and 2008
Tabel ––––––
15.4.1Table
http
://www.b
ps.g
o.id

S I S T E M N E R A C A N A S I O N A L
S t a t i s t i k I n d o n e s i a 2 0 1 3590
[Diolah dari Hasil Sensus, Survei, dan Berbagai Sumber Lainnya/Based on Census, Surveys, and Other Sources]
Klasifikasi Tenaga KerjaWorker Classification 2000 2005 2008
(1) (2) (3) (4)
Pertanian penerima upah dan gajiPaid agricultural labour
5 132,0 9 409,5 20 656,1
Pertanian bukan penerima upah dan gajiUnpaid agricultural labour
4 139,0 7 948,1 15 949,6
Produksi, operator, manual penerima upah dan gajiPaid production, operator, manual workers
8 498,3 21 066,1 35 127,9
Produksi, operator, manual bukan penerima upah dan gajiUnpaid production, operator, manual workers
4 567,1 12 458,0 17 669,7
Tata usaha, penjualan, dan jasa penerima upah dan gajiPaid clerical, sales, and services workers
10 053,7 25 558,3 39 468,0
Tata usaha, penjualan, dan jasa bukan penerima upah dan gajiUnpaid clerical, sales, and services workers
6 251,2 12 754,8 17 960,6
Profesional, teknisi, manager, militer penerima upah dan gajiPaid professional, technician, managerial, and non-civilian workers
14 028,7 36 926,4 46 555,2
Profesional, teknisi, manager, militer bukan penerima upah dan gajiUnpaid professional, technician, managerial, and non-civilian workers
9 273,5 25 383,5 36 367,8
Rata-Rata Upah dan Gaji per Ekuivalen Tenaga Kerja (ETK) Menurut Klasifikasi Tenaga Kerja (ribu rupiah), 2000, 2005, dan 2008Average of Wages and Salaries per Worker Equivalents by Worker Classification (thousand rupiahs), 2000, 2005, and 2008
Tabel ––––––
15.4.2Table
http
://www.b
ps.g
o.id

S Y S T E M O F N A T I O N A L A C C O U N T S
S t a t i s t i c a l Y e a r b o o k o f I n d o n e s i a 2 0 1 3 591
[Diolah dari Hasil Sensus, Survei, dan Berbagai Sumber Lainnya/Based on Census, Surveys, and Other Sources]
Golongan Rumah TanggaHousehold Group 2000 2005 2008
(1) (2) (3) (4)
Rumah tangga buruh taniAgricultural labour household
31 943,9 80 559,1 105 406,5
Rumah tangga pengusaha pertanianAgricultural enterpreneur household
135 449,5 292 285,1 518 425,7
Rumah tangga petani guremOperator, landowner of 0,0–0,5 ha agricultural household
67 823,9 143 715,5 ...
Rumah tangga pengusaha pertanian yang memiliki lahan 0,5–1 haOperator, landowner of 0,5–1,0 ha agricultural household
36 618,2 85 015,5 ...
Rumah tangga pengusaha pertanian yang memiliki lahan lebih dari 1 haOperator, landowner of > 1,0 ha agricultural household
31 007,4 63 554,0 ...
Rumah tangga bukan pertanian golongan rendah di desaNon-agricultural low income level rural household
71 309,0 196 326,8 333 694,9
Rumah tangga bukan angkatan kerja di desaNon-labour force rural household
28 019,2 62 608,2 111 674,3
Rumah tangga bukan pertanian golongan atas di desaNon-agricultural high income level rural household
65 221,1 155 452,2 312 663,7
Rumah tangga bukan pertanian golongan rendah di kotaNon-agricultural low income level urban household
127 986,5 278 771,7 517 690,7
Rumah tangga bukan angkatan kerja di kotaNon-labour force urban household
47 479,6 95 302,6 170 650,1
Rumah tangga bukan pertanian golongan atas di kotaNon-agricultural high income level urban household
134 428,2 322 718,0 618 699,4
Nilai Upah dan Gaji Menurut Golongan Rumah Tangga (miliar rupiah), 2000, 2005, dan 2008Value of Wages and Salaries by Household Group (billion rupiahs), 2000, 2005, and 2008
Tabel ––––––
15.4.3Table
http
://www.b
ps.g
o.id

S I S T E M N E R A C A N A S I O N A L
S t a t i s t i k I n d o n e s i a 2 0 1 3592
Rata-Rata Upah dan Gaji per Kapita Menurut Golongan Rumah Tangga (ribu rupiah), 2000, 2005, dan 2008Average of per Capita Wages and Salaries by Household Group (thousand rupiahs), 2000, 2005, and 2008
[Diolah dari Hasil Sensus, Survei, dan Berbagai Sumber Lainnya/Based on Census, Surveys, and Other Sources]
Golongan Rumah TanggaHousehold Group 2000 2005 2008
(1) (2) (3) (4)
Rumah tangga buruh taniAgricultural labour household
1 022,0 2 735,2 3 569,7
Rumah tangga pengusaha pertanianAgricultural enterpreneur household
2 182,2 4 616,5 8 092,9
Rumah tangga petani guremOperator, landowner of 0,0–0,5 ha agricultural household
1 740,8 3 710,7 ...
Rumah tangga pengusaha pertanian yang memiliki lahan 0,5–1 haOperator, landowner of 0,5–1,0 ha agricultural household
2 786,1 5 867,5 ...
Rumah tangga pengusaha pertanian yang memiliki lahan lebih dari 1 haOperator, landowner of > 1,0 ha agricultural household
3 111,8 6 296,5 ...
Rumah tangga bukan pertanian golongan rendah di desaNon-agricultural low income level rural household
2 373,9 5 686,4 9 062,1
Rumah tangga bukan angkatan kerja di desaNon-labour force rural household
2 651,8 6 015,0 9 699,9
Rumah tangga bukan pertanian golongan atas di desaNon-agricultural high income level rural household
4 901,8 10 313,2 19 491,7
Rumah tangga bukan pertanian golongan rendah di kotaNon-agricultural low income level urban household
4 195,9 7 963,4 13 675,6
Rumah tangga bukan angkatan kerja di kotaNon-labour force urban household
4 490,8 8 113,9 13 699,5
Rumah tangga bukan pertanian golongan atas di kotaNon-agricultural high income level urban household
7 667,6 16 683,2 30 557,5
Tabel ––––––
15.4.4Table
http
://www.b
ps.g
o.id
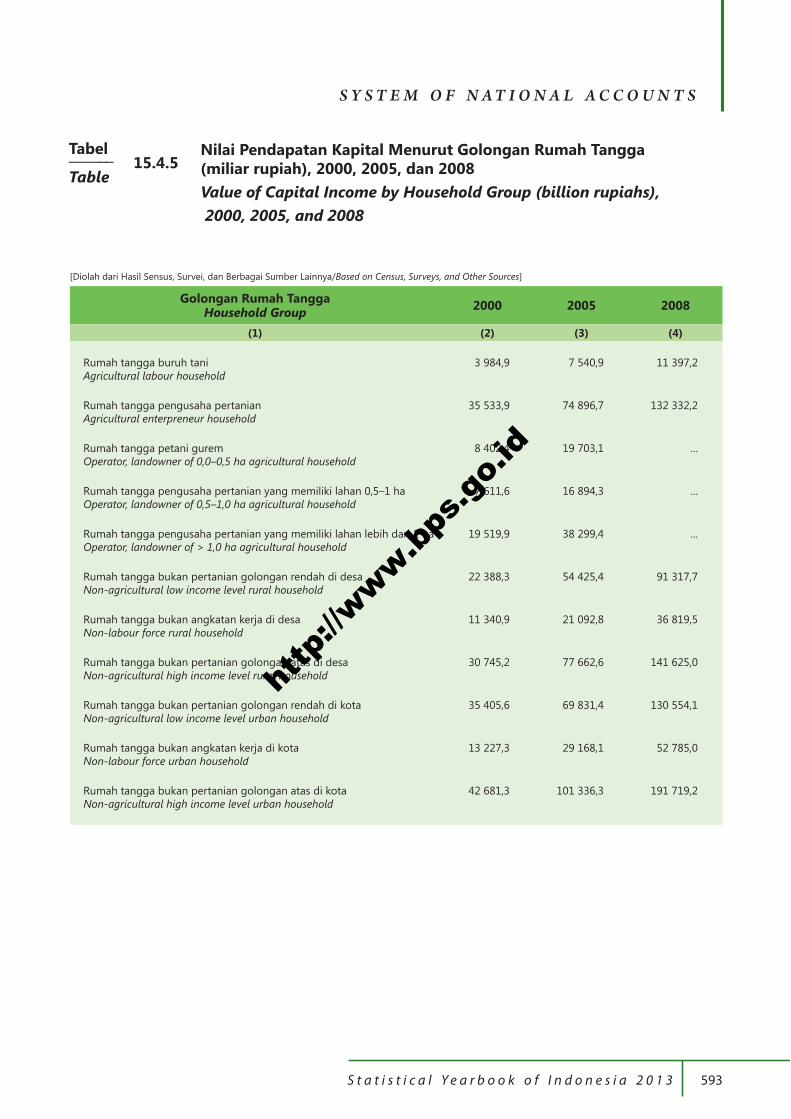
S Y S T E M O F N A T I O N A L A C C O U N T S
S t a t i s t i c a l Y e a r b o o k o f I n d o n e s i a 2 0 1 3 593
Nilai Pendapatan Kapital Menurut Golongan Rumah Tangga (miliar rupiah), 2000, 2005, dan 2008Value of Capital Income by Household Group (billion rupiahs), 2000, 2005, and 2008
[Diolah dari Hasil Sensus, Survei, dan Berbagai Sumber Lainnya/Based on Census, Surveys, and Other Sources]
Golongan Rumah TanggaHousehold Group 2000 2005 2008
(1) (2) (3) (4)
Rumah tangga buruh taniAgricultural labour household
3 984,9 7 540,9 11 397,2
Rumah tangga pengusaha pertanianAgricultural enterpreneur household
35 533,9 74 896,7 132 332,2
Rumah tangga petani guremOperator, landowner of 0,0–0,5 ha agricultural household
8 402,4 19 703,1 ...
Rumah tangga pengusaha pertanian yang memiliki lahan 0,5–1 haOperator, landowner of 0,5–1,0 ha agricultural household
7 611,6 16 894,3 ...
Rumah tangga pengusaha pertanian yang memiliki lahan lebih dari 1 haOperator, landowner of > 1,0 ha agricultural household
19 519,9 38 299,4 ...
Rumah tangga bukan pertanian golongan rendah di desaNon-agricultural low income level rural household
22 388,3 54 425,4 91 317,7
Rumah tangga bukan angkatan kerja di desaNon-labour force rural household
11 340,9 21 092,8 36 819,5
Rumah tangga bukan pertanian golongan atas di desaNon-agricultural high income level rural household
30 745,2 77 662,6 141 625,0
Rumah tangga bukan pertanian golongan rendah di kotaNon-agricultural low income level urban household
35 405,6 69 831,4 130 554,1
Rumah tangga bukan angkatan kerja di kotaNon-labour force urban household
13 227,3 29 168,1 52 785,0
Rumah tangga bukan pertanian golongan atas di kotaNon-agricultural high income level urban household
42 681,3 101 336,3 191 719,2
Tabel ––––––
15.4.5Table
http
://www.b
ps.g
o.id

S I S T E M N E R A C A N A S I O N A L
S t a t i s t i k I n d o n e s i a 2 0 1 3594
Rata-Rata Pendapatan Kapital per Kapita Menurut Golongan Rumah Tangga (ribu rupiah), 2000, 2005, dan 2008Average of per Capita Capital Income by Household Group (thousand rupiahs), 2000, 2005, and 2008
[Diolah dari Hasil Sensus, Survei, dan Berbagai Sumber Lainnya/Based on Census, Surveys, and Other Sources]
Golongan Rumah TanggaHousehold Group 2000 2005 2008
(1) (2) (3) (4)
Rumah tangga buruh taniAgricultural labour household
127,5 256,0 386,0
Rumah tangga pengusaha pertanianAgricultural enterpreneur household
572,5 1 183,0 2 065,8
Rumah tangga petani guremOperator, landowner of 0,0–0,5 ha agricultural household
215,7 508,7 ...
Rumah tangga pengusaha pertanian yang memiliki lahan 0,5–1 haOperator, landowner of 0,5–1,0 ha agricultural household
579,1 1 166,0 ...
Rumah tangga pengusaha pertanian yang memiliki lahan lebih dari 1 haOperator, landowner of > 1,0 ha agricultural household
1 959,0 3 794,4 ...
Rumah tangga bukan pertanian golongan rendah di desaNon-agricultural low income level rural household
745,3 1 576,4 2 479,9
Rumah tangga bukan angkatan kerja di desaNon-labour force rural household
1 073,3 2 026,4 3 198,1
Rumah tangga bukan pertanian golongan atas di desaNon-agricultural high income level rural household
2 310,7 5 152,4 8 829,0
Rumah tangga bukan pertanian golongan rendah di kotaNon-agricultural low income level urban household
1 160,7 1 994,8 3 448,8
Rumah tangga bukan angkatan kerja di kotaNon-labour force urban household
1 251,1 2 483,3 4 237,5
Rumah tangga bukan pertanian golongan atas di kotaNon-agricultural high income level urban household
2 434,5 5 238,7 9 469,0
Tabel ––––––
15.4.6Table
http
://www.b
ps.g
o.id
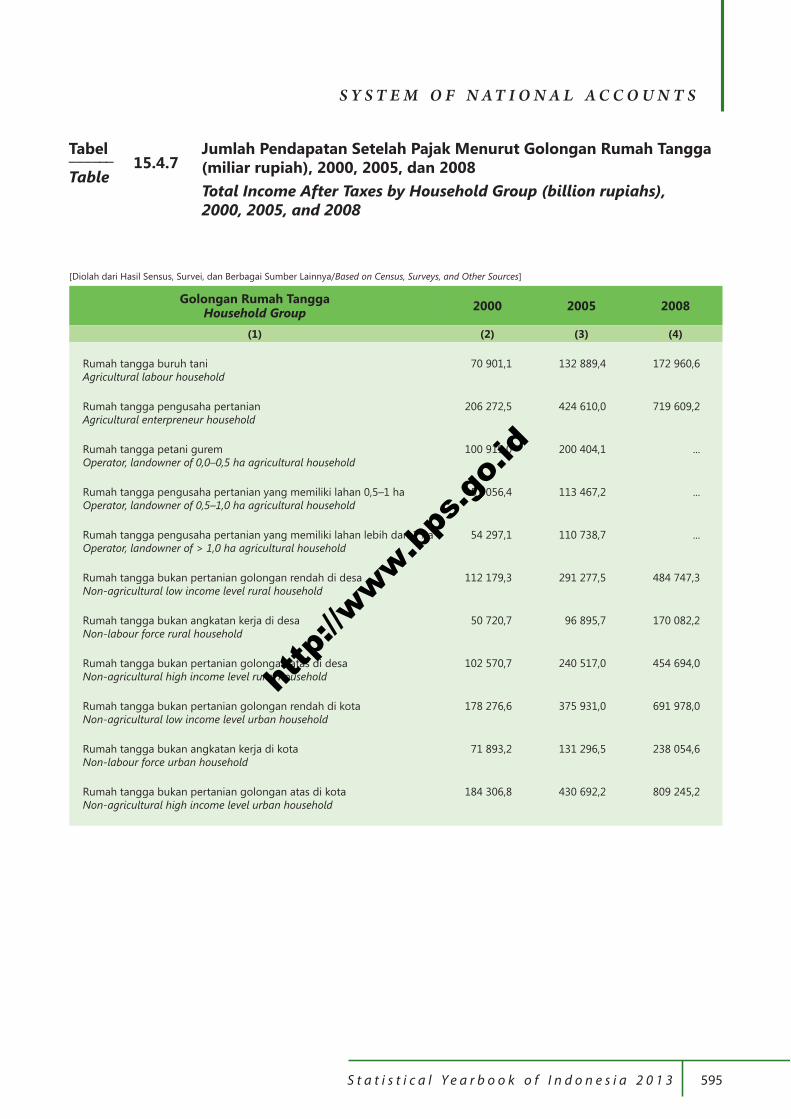
S Y S T E M O F N A T I O N A L A C C O U N T S
S t a t i s t i c a l Y e a r b o o k o f I n d o n e s i a 2 0 1 3 595
Jumlah Pendapatan Setelah Pajak Menurut Golongan Rumah Tangga (miliar rupiah), 2000, 2005, dan 2008Total Income After Taxes by Household Group (billion rupiahs), 2000, 2005, and 2008
[Diolah dari Hasil Sensus, Survei, dan Berbagai Sumber Lainnya/Based on Census, Surveys, and Other Sources]
Golongan Rumah TanggaHousehold Group 2000 2005 2008
(1) (2) (3) (4)
Rumah tangga buruh taniAgricultural labour household
70 901,1 132 889,4 172 960,6
Rumah tangga pengusaha pertanianAgricultural enterpreneur household
206 272,5 424 610,0 719 609,2
Rumah tangga petani guremOperator, landowner of 0,0–0,5 ha agricultural household
100 919,0 200 404,1 ...
Rumah tangga pengusaha pertanian yang memiliki lahan 0,5–1 haOperator, landowner of 0,5–1,0 ha agricultural household
51 056,4 113 467,2 ...
Rumah tangga pengusaha pertanian yang memiliki lahan lebih dari 1 haOperator, landowner of > 1,0 ha agricultural household
54 297,1 110 738,7 ...
Rumah tangga bukan pertanian golongan rendah di desaNon-agricultural low income level rural household
112 179,3 291 277,5 484 747,3
Rumah tangga bukan angkatan kerja di desaNon-labour force rural household
50 720,7 96 895,7 170 082,2
Rumah tangga bukan pertanian golongan atas di desaNon-agricultural high income level rural household
102 570,7 240 517,0 454 694,0
Rumah tangga bukan pertanian golongan rendah di kotaNon-agricultural low income level urban household
178 276,6 375 931,0 691 978,0
Rumah tangga bukan angkatan kerja di kotaNon-labour force urban household
71 893,2 131 296,5 238 054,6
Rumah tangga bukan pertanian golongan atas di kotaNon-agricultural high income level urban household
184 306,8 430 692,2 809 245,2
Tabel ––––––
15.4.7Table
http
://www.b
ps.g
o.id
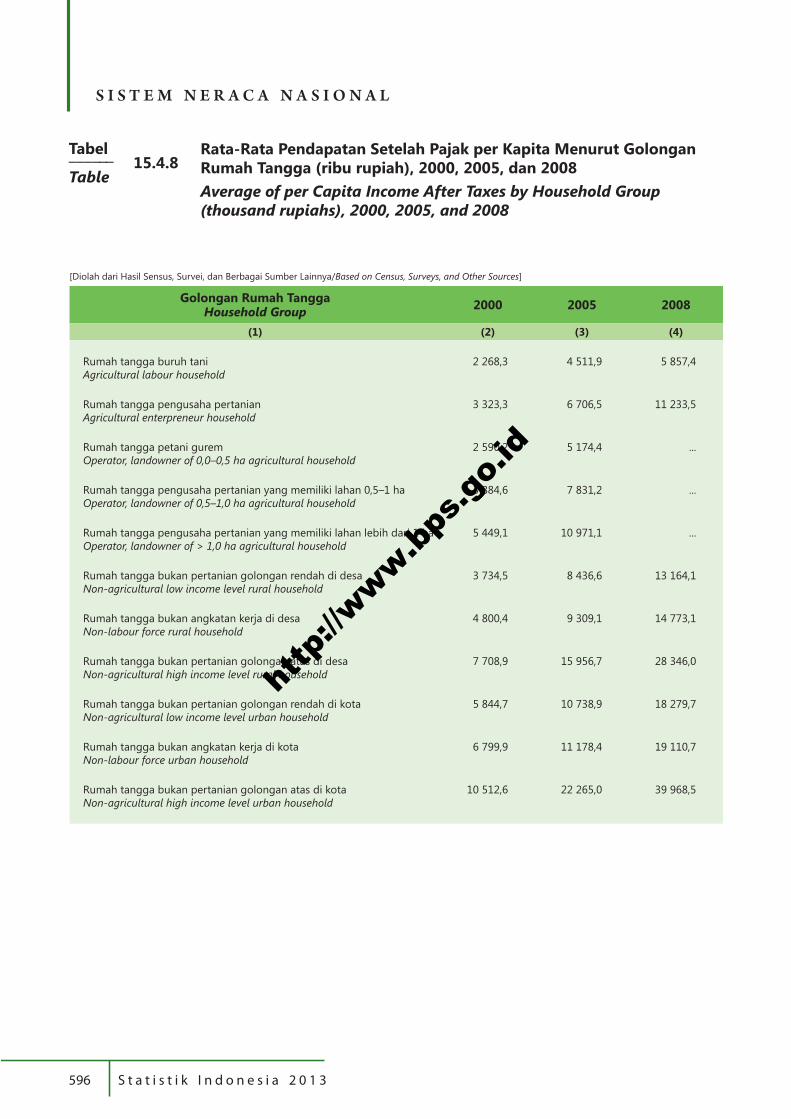
S I S T E M N E R A C A N A S I O N A L
S t a t i s t i k I n d o n e s i a 2 0 1 3596
Rata-Rata Pendapatan Setelah Pajak per Kapita Menurut Golongan Rumah Tangga (ribu rupiah), 2000, 2005, dan 2008Average of per Capita Income After Taxes by Household Group (thousand rupiahs), 2000, 2005, and 2008
[Diolah dari Hasil Sensus, Survei, dan Berbagai Sumber Lainnya/Based on Census, Surveys, and Other Sources]
Golongan Rumah TanggaHousehold Group 2000 2005 2008
(1) (2) (3) (4)
Rumah tangga buruh taniAgricultural labour household
2 268,3 4 511,9 5 857,4
Rumah tangga pengusaha pertanianAgricultural enterpreneur household
3 323,3 6 706,5 11 233,5
Rumah tangga petani guremOperator, landowner of 0,0–0,5 ha agricultural household
2 590,2 5 174,4 ...
Rumah tangga pengusaha pertanian yang memiliki lahan 0,5–1 haOperator, landowner of 0,5–1,0 ha agricultural household
3 884,6 7 831,2 ...
Rumah tangga pengusaha pertanian yang memiliki lahan lebih dari 1 haOperator, landowner of > 1,0 ha agricultural household
5 449,1 10 971,1 ...
Rumah tangga bukan pertanian golongan rendah di desaNon-agricultural low income level rural household
3 734,5 8 436,6 13 164,1
Rumah tangga bukan angkatan kerja di desaNon-labour force rural household
4 800,4 9 309,1 14 773,1
Rumah tangga bukan pertanian golongan atas di desaNon-agricultural high income level rural household
7 708,9 15 956,7 28 346,0
Rumah tangga bukan pertanian golongan rendah di kotaNon-agricultural low income level urban household
5 844,7 10 738,9 18 279,7
Rumah tangga bukan angkatan kerja di kotaNon-labour force urban household
6 799,9 11 178,4 19 110,7
Rumah tangga bukan pertanian golongan atas di kotaNon-agricultural high income level urban household
10 512,6 22 265,0 39 968,5
Tabel ––––––
15.4.8Table
http
://www.b
ps.g
o.id

S Y S T E M O F N A T I O N A L A C C O U N T S
S t a t i s t i c a l Y e a r b o o k o f I n d o n e s i a 2 0 1 3 597
Jumlah Pendapatan Menurut Golongan Rumah Tangga (miliar rupiah), 2000, 2005, dan 2008Total Income by Household Group (billion rupiahs), 2000, 2005, and 2008
[Diolah dari Hasil Sensus, Survei, dan Berbagai Sumber Lainnya/Based on Census, Surveys, and Other Sources]
Golongan Rumah TanggaHousehold Group 2000 2005 2008
(1) (2) (3) (4)
Rumah tangga buruh taniAgricultural labour household
71 632,2 136 485,9 176 756,7
Rumah tangga pengusaha pertanianAgricultural enterpreneur household
1 118 384,4 435 362,4 731 562,8
Rumah tangga petani guremOperator, landowner of 0,0–0,5 ha agricultural household
1 011 984,2 205 435,8 ...
Rumah tangga pengusaha pertanian yang memiliki lahan 0,5–1 haOperator, landowner of 0,5–1,0 ha agricultural household
51 548,4 116 075,9 ...
Rumah tangga pengusaha pertanian yang memiliki lahan lebih dari 1 haOperator, landowner of > 1,0 ha agricultural household
54 851,8 113 850,7 ...
Rumah tangga bukan pertanian golongan rendah di desaNon-agricultural low income level rural household
113 332,8 298 378,5 494 234,2
Rumah tangga bukan angkatan kerja di desaNon-labour force rural household
51 178,7 99 183,2 173 151,9
Rumah tangga bukan pertanian golongan atas di desaNon-agricultural high income level rural household
103 792,6 250 123,8 468 454,5
Rumah tangga bukan pertanian golongan rendah di kotaNon-agricultural low income level urban household
180 850,4 387 982,1 710 495,5
Rumah tangga bukan angkatan kerja di kotaNon-labour force urban household
72 474,4 136 523,0 243 905,5
Rumah tangga bukan pertanian golongan atas di kotaNon-agricultural high income level urban household
186 838,0 447 269,8 827 883,5
Tabel ––––––
15.4.9Table
http
://www.b
ps.g
o.id

S I S T E M N E R A C A N A S I O N A L
S t a t i s t i k I n d o n e s i a 2 0 1 3598
Rata-Rata Jumlah Pendapatan per Kapita Menurut Golongan Rumah Tangga (ribu rupiah), 2000, 2005, dan 2008Average of per Capita Total Income by Household Group (thousand rupiahs), 2000, 2005, and 2008
[Diolah dari Hasil Sensus, Survei, dan Berbagai Sumber Lainnya/Based on Census, Surveys, and Other Sources]
Golongan Rumah TanggaHousehold Group 2000 2005 2008
(1) (2) (3) (4)
Rumah tangga buruh taniAgricultural labour household
2 291,7 4 634,0 5 986,0
Rumah tangga pengusaha pertanianAgricultural enterpreneur household
18 018,3 6 876,4 11 420,1
Rumah tangga petani guremOperator, landowner of 0,0–0,5 ha agricultural household
2 617,6 5 304,3 ...
Rumah tangga pengusaha pertanian yang memiliki lahan 0,5–1 haOperator, landowner of 0,5–1,0 ha agricultural household
3 922,0 8 011,2 ...
Rumah tangga pengusaha pertanian yang memiliki lahan lebih dari 1 haOperator, landowner of > 1,0 ha agricultural household
5 504,7 11 279,5 ...
Rumah tangga bukan pertanian golongan rendah di desaNon-agricultural low income level rural household
3 772,9 8 642,3 13 421,8
Rumah tangga bukan angkatan kerja di desaNon-labour force rural household
4 843,7 9 528,8 15 039,8
Rumah tangga bukan pertanian golongan atas di desaNon-agricultural high income level rural household
7 800,7 16 594,1 29 203,8
Rumah tangga bukan pertanian golongan rendah di kotaNon-agricultural low income level urban household
5 929,0 11 083,2 18 768,9
Rumah tangga bukan angkatan kerja di kotaNon-labour force urban household
6 854,9 11 623,4 19 580,4
Rumah tangga bukan pertanian golongan atas di kotaNon-agricultural high income level urban household
10 657,0 23 122,0 40 889,1
Tabel ––––––
15.4.10Table
http
://www.b
ps.g
o.id
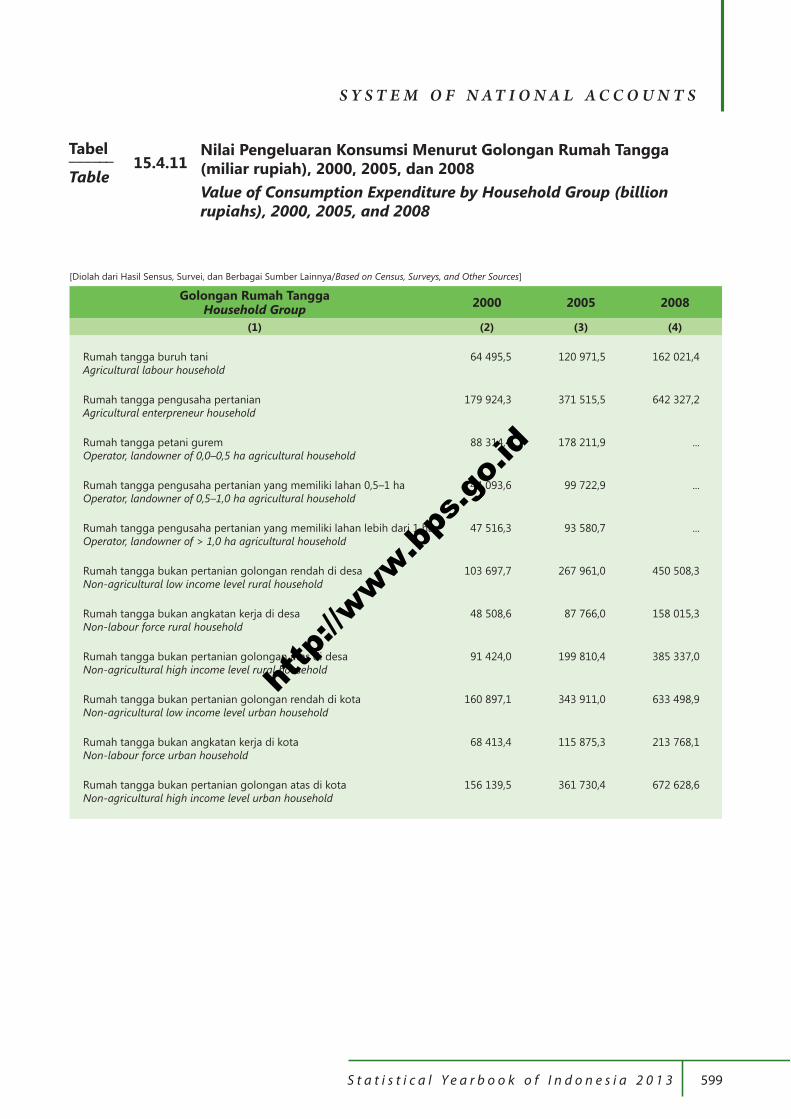
S Y S T E M O F N A T I O N A L A C C O U N T S
S t a t i s t i c a l Y e a r b o o k o f I n d o n e s i a 2 0 1 3 599
Nilai Pengeluaran Konsumsi Menurut Golongan Rumah Tangga(miliar rupiah), 2000, 2005, dan 2008Value of Consumption Expenditure by Household Group (billion rupiahs), 2000, 2005, and 2008
[Diolah dari Hasil Sensus, Survei, dan Berbagai Sumber Lainnya/Based on Census, Surveys, and Other Sources]
Golongan Rumah TanggaHousehold Group 2000 2005 2008
(1) (2) (3) (4)
Rumah tangga buruh taniAgricultural labour household
64 495,5 120 971,5 162 021,4
Rumah tangga pengusaha pertanianAgricultural enterpreneur household
179 924,3 371 515,5 642 327,2
Rumah tangga petani guremOperator, landowner of 0,0–0,5 ha agricultural household
88 314,4 178 211,9 ...
Rumah tangga pengusaha pertanian yang memiliki lahan 0,5–1 haOperator, landowner of 0,5–1,0 ha agricultural household
44 093,6 99 722,9 ...
Rumah tangga pengusaha pertanian yang memiliki lahan lebih dari 1 haOperator, landowner of > 1,0 ha agricultural household
47 516,3 93 580,7 ...
Rumah tangga bukan pertanian golongan rendah di desaNon-agricultural low income level rural household
103 697,7 267 961,0 450 508,3
Rumah tangga bukan angkatan kerja di desaNon-labour force rural household
48 508,6 87 766,0 158 015,3
Rumah tangga bukan pertanian golongan atas di desaNon-agricultural high income level rural household
91 424,0 199 810,4 385 337,0
Rumah tangga bukan pertanian golongan rendah di kotaNon-agricultural low income level urban household
160 897,1 343 911,0 633 498,9
Rumah tangga bukan angkatan kerja di kotaNon-labour force urban household
68 413,4 115 875,3 213 768,1
Rumah tangga bukan pertanian golongan atas di kotaNon-agricultural high income level urban household
156 139,5 361 730,4 672 628,6
Tabel ––––––
15.4.11Table
http
://www.b
ps.g
o.id
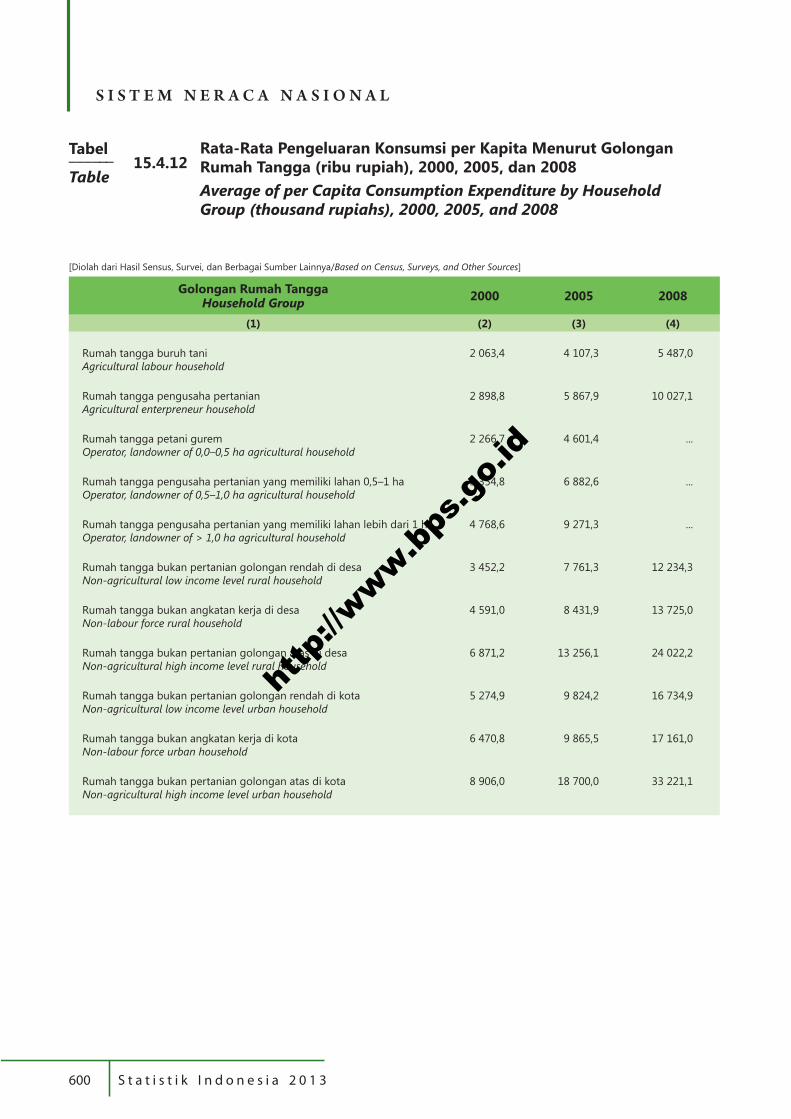
S I S T E M N E R A C A N A S I O N A L
S t a t i s t i k I n d o n e s i a 2 0 1 3600
Rata-Rata Pengeluaran Konsumsi per Kapita Menurut Golongan Rumah Tangga (ribu rupiah), 2000, 2005, dan 2008Average of per Capita Consumption Expenditure by HouseholdGroup (thousand rupiahs), 2000, 2005, and 2008
[Diolah dari Hasil Sensus, Survei, dan Berbagai Sumber Lainnya/Based on Census, Surveys, and Other Sources]
Golongan Rumah TanggaHousehold Group 2000 2005 2008
(1) (2) (3) (4)
Rumah tangga buruh taniAgricultural labour household
2 063,4 4 107,3 5 487,0
Rumah tangga pengusaha pertanianAgricultural enterpreneur household
2 898,8 5 867,9 10 027,1
Rumah tangga petani guremOperator, landowner of 0,0–0,5 ha agricultural household
2 266,7 4 601,4 ...
Rumah tangga pengusaha pertanian yang memiliki lahan 0,5–1 haOperator, landowner of 0,5–1,0 ha agricultural household
3 354,8 6 882,6 ...
Rumah tangga pengusaha pertanian yang memiliki lahan lebih dari 1 haOperator, landowner of > 1,0 ha agricultural household
4 768,6 9 271,3 ...
Rumah tangga bukan pertanian golongan rendah di desaNon-agricultural low income level rural household
3 452,2 7 761,3 12 234,3
Rumah tangga bukan angkatan kerja di desaNon-labour force rural household
4 591,0 8 431,9 13 725,0
Rumah tangga bukan pertanian golongan atas di desaNon-agricultural high income level rural household
6 871,2 13 256,1 24 022,2
Rumah tangga bukan pertanian golongan rendah di kotaNon-agricultural low income level urban household
5 274,9 9 824,2 16 734,9
Rumah tangga bukan angkatan kerja di kotaNon-labour force urban household
6 470,8 9 865,5 17 161,0
Rumah tangga bukan pertanian golongan atas di kotaNon-agricultural high income level urban household
8 906,0 18 700,0 33 221,1
Tabel ––––––
15.4.12Table
http
://www.b
ps.g
o.id

S Y S T E M O F N A T I O N A L A C C O U N T S
S t a t i s t i c a l Y e a r b o o k o f I n d o n e s i a 2 0 1 3 601
Nilai Pendapatan Disposabel Menurut Golongan Rumah Tangga (miliar rupiah), 2000, 2005, dan 2008Value of Disposable Income by Household Groups (billion rupiahs), 2000, 2005, and 2008
[Diolah dari Hasil Sensus, Survei, dan Berbagai Sumber Lainnya/Based on Census, Surveys, and Other Sources]
Golongan Rumah TanggaHousehold Group 2000 2005 2008
(1) (2) (3) (4)
Rumah tangga buruh taniAgricultural labour household
66 272,7 128 391,1 171 254,2
Rumah tangga pengusaha pertanianAgricultural enterpreneur household
193 308,0 408 689,4 703 951,0
Rumah tangga petani guremOperator, landowner of 0,0–0,5 ha agricultural household
94 543,6 193 206,3 ...
Rumah tangga pengusaha pertanian yang memiliki lahan 0,5–1 haOperator, landowner of 0,5–1,0 ha agricultural household
47 860,0 109 803,6 ...
Rumah tangga pengusaha pertanian yang memiliki lahan lebih dari 1 haOperator, landowner of > 1,0 ha agricultural household
50 904,4 105 679,5 ...
Rumah tangga bukan pertanian golongan rendah di desaNon-agricultural low income level rural household
105 625,3 283 438,5 476 495,0
Rumah tangga bukan angkatan kerja di desaNon-labour force rural household
49 216,0 94 074,9 167 662,9
Rumah tangga bukan pertanian golongan atas di desaNon-agricultural high income level rural household
95 439,7 230 245,0 441 588,8
Rumah tangga bukan pertanian golongan rendah di kotaNon-agricultural low income level urban household
164 022,7 365 657,2 671 493,5
Rumah tangga bukan angkatan kerja di kotaNon-labour force urban household
70 252,5 127 202,1 233 824,6
Rumah tangga bukan pertanian golongan atas di kotaNon-agricultural high income level urban household
169 018,2 418 064,5 777 279,0
Tabel ––––––
15.4.13Table
http
://www.b
ps.g
o.id

S I S T E M N E R A C A N A S I O N A L
S t a t i s t i k I n d o n e s i a 2 0 1 3602
Rata-Rata Pendapatan Disposabel per Kapita Menurut Golongan Rumah Tangga (ribu rupiah), 2000, 2005, dan 2008Average of per Capita Disposable Income by Household Groups (thousand rupiahs), 2000, 2005, and 2008
[Diolah dari Hasil Sensus, Survei, dan Berbagai Sumber Lainnya/Based on Census, Surveys, and Other Sources]
Golongan Rumah TanggaHousehold Group 2000 2005 2008
(1) (2) (3) (4)
Rumah tangga buruh taniAgricultural labour household
2 120,3 4 359,2 5 799,7
Rumah tangga pengusaha pertanianAgricultural enterpreneur household
3 114,4 6 455,1 10 989,1
Rumah tangga petani guremOperator, landowner of 0,0–0,5 ha agricultural household
2 426,6 4 988,5 ...
Rumah tangga pengusaha pertanian yang memiliki lahan 0,5–1 haOperator, landowner of 0,5–1,0 ha agricultural household
3 641,4 7 578,3 ...
Rumah tangga pengusaha pertanian yang memiliki lahan lebih dari 1 haOperator, landowner of > 1,0 ha agricultural household
5 108,6 10 469,9 ...
Rumah tangga bukan pertanian golongan rendah di desaNon-agricultural low income level rural household
3 516,3 8 209,6 12 940,0
Rumah tangga bukan angkatan kerja di desaNon-labour force rural household
4 658,0 9 038,0 14 563,0
Rumah tangga bukan pertanian golongan atas di desaNon-agricultural high income level rural household
7 173,0 15 275,2 27 529,0
Rumah tangga bukan pertanian golongan rendah di kotaNon-agricultural low income level urban household
5 377,4 10 445,4 17 738,6
Rumah tangga bukan angkatan kerja di kotaNon-labour force urban household
6 644,7 10 829,8 18 771,1
Rumah tangga bukan pertanian golongan atas di kotaNon-agricultural high income level urban household
9 640,6 21 612,3 38 389,7
Tabel ––––––
15.4.14Table
http
://www.b
ps.g
o.id

S Y S T E M O F N A T I O N A L A C C O U N T S
S t a t i s t i c a l Y e a r b o o k o f I n d o n e s i a 2 0 1 3 603
Rincian/TriwulanItems/Quarter 2007 2008 2009 2010 2011 x 2012 xx
(1) (2) (3) (4) (5) (6) (7)
a. Tabungan Bruto Domestik 1Gross Domestic Saving 1
Triwulan/Quarter I 228,9 328,9 382,4 472,2 569,6 666,8Triwulan/Quarter II 236,5 371,7 417,3 486,5 584,4 633,3Triwulan/Quarter III 254,4 422,8 433,3 524,0 599,2 652,0Triwulan/Quarter IV 262,0 422,1 465,2 527,8 583,3 591,9
Jumlah/Total 981,8 1 545,5 1 698,2 2 010,5 2 336,5 2 544,0
b. Investasi NonfinansialNon-Financial Investment
Triwulan/Quarter I 218,5 327,7 392,4 482,1 577,3 715,6Triwulan/Quarter II 238,0 361,4 427,4 513,7 599,0 742,1Triwulan/Quarter III 263,0 409,2 462,5 562,7 637,7 727,2Triwulan/Quarter IV 265,1 410,5 454,8 524,9 629,5 726,5
Jumlah/Total 984,6 1 508,8 1 737,1 2 083,4 2 443,5 2 911,4
c. Tabungan Luar Negeri 2Rest of the World 2
Triwulan/Quarter I -10,4 -1,2 10,0 9,9 7,7 48,8Triwulan/Quarter II 1,5 -10,3 10,1 27,2 14,6 108,8Triwulan/Quarter III 8,6 -13,6 29,2 38,7 38,5 75,2Triwulan/Quarter IV 3,1 -11,6 -10,4 -2,9 46,2 134,6
Jumlah/Total 2,8 - 36,7 38,9 72,9 107,0 367,4
15.5 NERACA ARUS DANA FLOW OF FUNDS ACCOUNTS
Tabungan Bruto Domestik, Investasi Nonfinansial, dan Tabungan Luar Negeri Triwulanan (triliun rupiah), 2007–2012Quarterly Gross Domestic Saving, Non-Financial Investment, and Rest of the World Saving (trillion rupiahs), 2007–2012
Tabel –––––– 15.5.1Table
Catatan/Note: x Angka sementara/Preliminary figures xxAngka sangat sementara/Very preliminary figures
1 Terdiri dari tabungan bruto sektor-sektor: Bank Sentral, Bank, Pemerintahan Umum, dan Domestik Lain (Lembaga Keuangan Bukan Bank, Rumah Tangga, Perusahaan Swasta Nonfinansial, dan Perusahaan Pemerintah Nonfinansial)/Consist of gross saving of sectors: Central Bank, Banks, General Government, and Other Domestics (Non Bank Financial Institutions, Household, Non-Financial Private Enterprises, and Non-Financial Government Enterprises)
2 Dihitung dari nilai ekspor (barang dan jasa) dikurangi nilai impor (barang dan jasa) ditambah pendapatan neto dari luar negeri, dilihat dari sisi kebalikan/Counted from export value (goods and services) minus import value (goods and services) plus net factor income from abroad, looked from reverse side
Sumber/Source: 1 Tahun 2007–2009, data dikutip dari publikasi Neraca Arus Dana Indonesia Triwulanan/In 2007–2009, data cited from the publication of Quarterly Indonesian Flow of Funds Accounts 2 Tahun 2010–2012, data diolah dari angka Produk Domestik Bruto menurut penggunaan atas dasar harga berlaku In 2010–2012, data proceed from Gross Domestic Product by expenditure at current price
http
://www.b
ps.g
o.id

S I S T E M N E R A C A N A S I O N A L
S t a t i s t i k I n d o n e s i a 2 0 1 3604
Rincian/TriwulanItems/Quarter 2007 2008 2009 2010 2011 2012
(1) (2) (3) (4) (5) (6) (7)
a. Tabungan BrutoGross Saving
Triwulan/Quarter I -1 255 2 122 5 768 -5 389 -5 830 17Triwulan/Quarter II -14 641 3 796 -5 688 -6 849 -3 622 1 083Triwulan/Quarter III 1 166 949 -1 711 -6 536 -7 205 6 064Triwulan/Quarter IV -702 11 756 -3 423 -8 741 8 425 2 838
Jumlah/Total -15 432 18 623 -5 054 -27 515 -8 232 10 002
b. Investasi NonfinansialNon-Financial Investment
Triwulan/Quarter I 9 -7 10 100 -38 57Triwulan/Quarter II 116 -29 -170 156 9 8 692Triwulan/Quarter III 97 193 205 103 51 120Triwulan/Quarter IV 61 19 257 -9 115 330
Jumlah/Total 283 176 302 350 137 9 199
c. Pinjaman NetoNet Lending
Triwulan/Quarter I -1 264 2 129 5 758 -5 489 -5 792 -40Triwulan/Quarter II -14 757 3 825 -5 518 -7 005 -3 631 -7 609Triwulan/Quarter III 1 069 756 -1 916 -6 639 -7 256 5 944Triwulan/Quarter IV -763 11 737 -3 680 -8 732 8 310 2 508
Jumlah/Total -15 715 18 447 -5 356 -27 865 -8 369 803
Tabungan Bruto, Investasi Nonfinansial, dan Pinjaman Neto Triwulanan Sektor Bank Sentral (miliar rupiah), 2007–2012 Quarterly Gross Saving, Non-Financial Investment, and Net Lending of Central Bank Sector (billion rupiahs), 2007–2012
Tabel –––––– 15.5.2Table
Sumber/Source: 1. Tahun 2007–2012 triwulan II, data dikutip dari publikasi Neraca Arus Dana Indonesia Triwulanan/In 2007–2012 quarter II, data cited from the publication of Quarterly Indonesian Flow of Funds Accounts 2. Tahun 2012 triwulan III–IV, data berasal dari Bank Indonesia/In 2012 quarter III–IV, data originated from Bank Indonesia
http
://www.b
ps.g
o.id
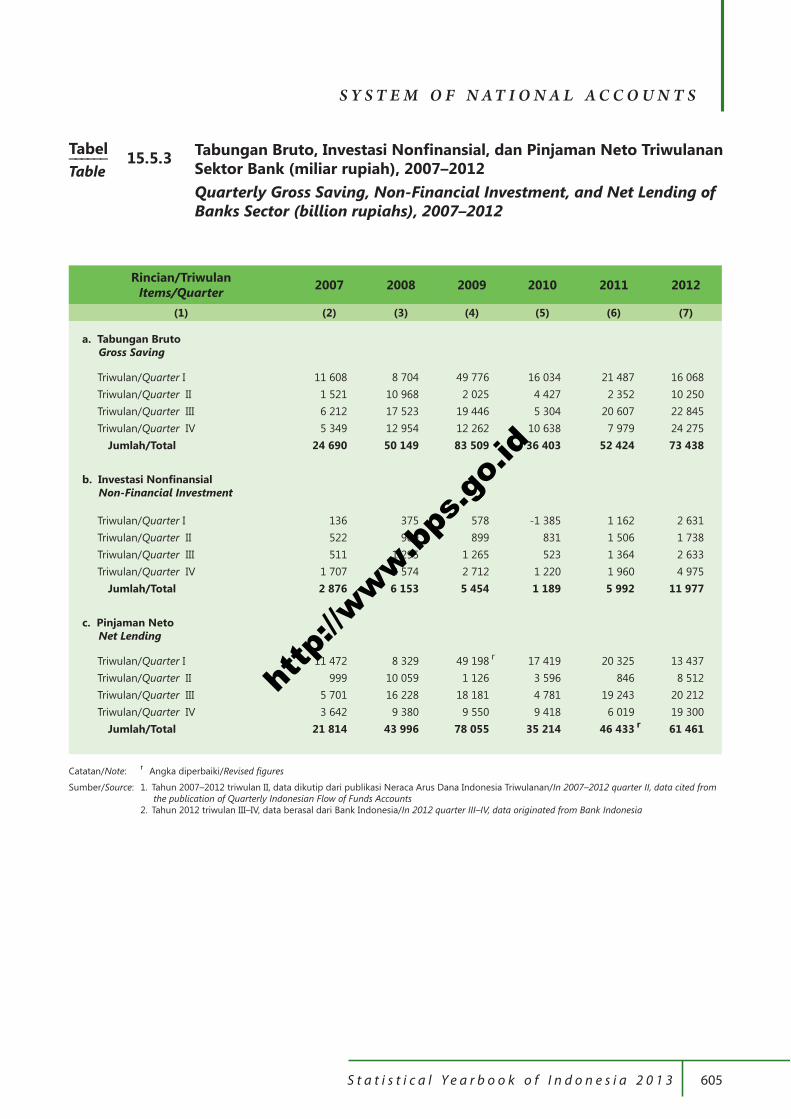
S Y S T E M O F N A T I O N A L A C C O U N T S
S t a t i s t i c a l Y e a r b o o k o f I n d o n e s i a 2 0 1 3 605
Rincian/TriwulanItems/Quarter 2007 2008 2009 2010 2011 2012
(1) (2) (3) (4) (5) (6) (7)
a. Tabungan BrutoGross Saving
Triwulan/Quarter I 11 608 8 704 49 776 16 034 21 487 16 068Triwulan/Quarter II 1 521 10 968 2 025 4 427 2 352 10 250Triwulan/Quarter III 6 212 17 523 19 446 5 304 20 607 22 845Triwulan/Quarter IV 5 349 12 954 12 262 10 638 7 979 24 275
Jumlah/Total 24 690 50 149 83 509 36 403 52 424 73 438
b. Investasi NonfinansialNon-Financial Investment
Triwulan/Quarter I 136 375 578 -1 385 1 162 2 631Triwulan/Quarter II 522 909 899 831 1 506 1 738Triwulan/Quarter III 511 1 295 1 265 523 1 364 2 633Triwulan/Quarter IV 1 707 3 574 2 712 1 220 1 960 4 975
Jumlah/Total 2 876 6 153 5 454 1 189 5 992 11 977
c. Pinjaman NetoNet Lending
Triwulan/Quarter I 11 472 8 329 49 198 r 17 419 20 325 13 437Triwulan/Quarter II 999 10 059 1 126 3 596 846 8 512Triwulan/Quarter III 5 701 16 228 18 181 4 781 19 243 20 212Triwulan/Quarter IV 3 642 9 380 9 550 9 418 6 019 19 300
Jumlah/Total 21 814 43 996 78 055 35 214 46 433 r 61 461
Tabungan Bruto, Investasi Nonfinansial, dan Pinjaman Neto Triwulanan Sektor Bank (miliar rupiah), 2007–2012 Quarterly Gross Saving, Non-Financial Investment, and Net Lending of Banks Sector (billion rupiahs), 2007–2012
Tabel –––––– 15.5.3Table
Catatan/Note: r Angka diperbaiki/Revised figures
Sumber/Source: 1. Tahun 2007–2012 triwulan II, data dikutip dari publikasi Neraca Arus Dana Indonesia Triwulanan/In 2007–2012 quarter II, data cited from the publication of Quarterly Indonesian Flow of Funds Accounts 2. Tahun 2012 triwulan III–IV, data berasal dari Bank Indonesia/In 2012 quarter III–IV, data originated from Bank Indonesia
http
://www.b
ps.g
o.id
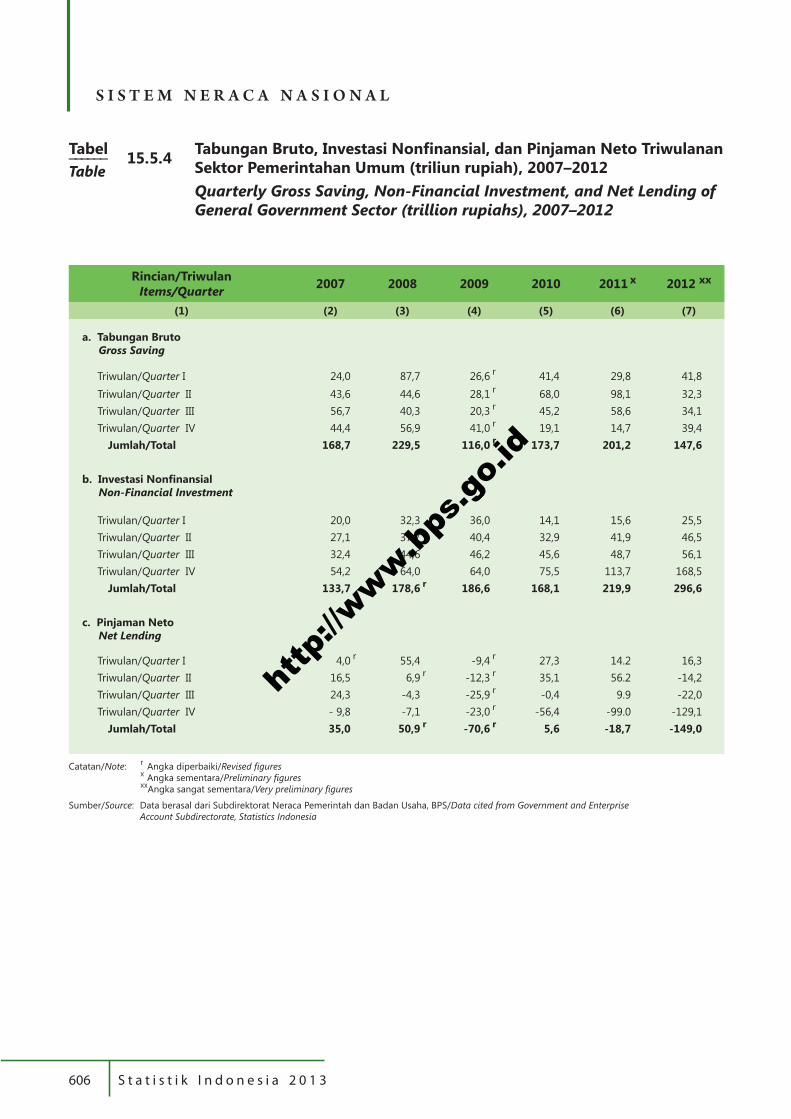
S I S T E M N E R A C A N A S I O N A L
S t a t i s t i k I n d o n e s i a 2 0 1 3606
Rincian/TriwulanItems/Quarter 2007 2008 2009 2010 2011 x 2012 xx
(1) (2) (3) (4) (5) (6) (7)
a. Tabungan BrutoGross Saving
Triwulan/Quarter I 24,0 87,7 26,6 r 41,4 29,8 41,8Triwulan/Quarter II 43,6 44,6 28,1 r 68,0 98,1 32,3Triwulan/Quarter III 56,7 40,3 20,3 r 45,2 58,6 34,1Triwulan/Quarter IV 44,4 56,9 41,0 r 19,1 14,7 39,4
Jumlah/Total 168,7 229,5 116,0 r 173,7 201,2 147,6
b. Investasi NonfinansialNon-Financial Investment
Triwulan/Quarter I 20,0 32,3 36,0 14,1 15,6 25,5Triwulan/Quarter II 27,1 37,7 r 40,4 32,9 41,9 46,5Triwulan/Quarter III 32,4 44,6 46,2 45,6 48,7 56,1Triwulan/Quarter IV 54,2 64,0 64,0 75,5 113,7 168,5
Jumlah/Total 133,7 178,6 r 186,6 168,1 219,9 296,6
c. Pinjaman NetoNet Lending
Triwulan/Quarter I 4,0 r 55,4 -9,4 r 27,3 14.2 16,3Triwulan/Quarter II 16,5 6,9 r -12,3 r 35,1 56.2 -14,2Triwulan/Quarter III 24,3 -4,3 -25,9 r -0,4 9.9 -22,0Triwulan/Quarter IV - 9,8 -7,1 -23,0 r -56,4 -99.0 -129,1
Jumlah/Total 35,0 50,9 r -70,6 r 5,6 -18,7 -149,0
Tabungan Bruto, Investasi Nonfinansial, dan Pinjaman Neto Triwulanan Sektor Pemerintahan Umum (triliun rupiah), 2007–2012Quarterly Gross Saving, Non-Financial Investment, and Net Lending of General Government Sector (trillion rupiahs), 2007–2012
Tabel –––––– 15.5.4Table
Catatan/Note: r Angka diperbaiki/Revised figures x Angka sementara/Preliminary figures xxAngka sangat sementara/Very preliminary figures
Sumber/Source: Data berasal dari Subdirektorat Neraca Pemerintah dan Badan Usaha, BPS/Data cited from Government and Enterprise Account Subdirectorate, Statistics Indonesia
http
://www.b
ps.g
o.id

S Y S T E M O F N A T I O N A L A C C O U N T S
S t a t i s t i c a l Y e a r b o o k o f I n d o n e s i a 2 0 1 3 607
Rincian/TriwulanItems/Quarter 2007 2008 2009 2010 2011 x 2012 xx
(1) (2) (3) (4) (5) (6) (7)
a. Tabungan Bruto 2Gross Saving 2
Triwulan/Quarter I 194,6 230,4 300,2 r 420,2 524,1 608,9Triwulan/Quarter II 206,0 312,3 392,9 420,9 487,5 589,6Triwulan/Quarter III 190,3 364,1 395,3 r 480,0 527,2 589,0Triwulan/Quarter IV 213,0 340,4 415,3 r 506,8 552,2 525,4
Jumlah/Total 803,9 1 247,2 1 503,7 r 1 827,9 2 091,0 2 312,9
b. Investasi Nonfinansial 3Non-Financial Investment 3
Triwulan/Quarter I 198,4 295,0 r 355,8 469,3 560,5 687,4Triwulan/Quarter II 210,3 322,8 r 386,3 479,8 555,6 685,2Triwulan/Quarter III 230,0 363,1 r 414,8 516,5 587,5 668,4Triwulan/Quarter IV 209,1 342,9 r 387,8 448,2 513,7 552,7
Jumlah/Total 847,8 1 324,2 r 1 544,7 1 913,8 2 217,3 2 593,7
c. Pinjaman NetoNet Lending
Triwulan/Quarter I -3,8 -64,6 r -55,6 r -49,1 -36,4 -78,5Triwulan/Quarter II -4,3 -10,5 r 6,6 r -58,9 -68,1 -95,6Triwulan/Quarter III -39,7 1,0 r -19,5 r -36,5 -60,3 -79,4Triwulan/Quarter IV 3,9 -2,5 r 27,5 r 58,6 38,5 -27,3
Jumlah/Total -43,9 -77,0 r -41,0 r -85,9 -126,3 -280,8
Tabungan Bruto, Investasi Nonfinansial, dan Pinjaman Neto Triwulanan Sektor Domestik Lain 1 (triliun rupiah), 2007–2012Quarterly Gross Saving, Non-Financial Investment, and Net Lending of Other Domestic Sectors 1 (trillion rupiahs), 2007–2012
Tabel –––––– 15.5.5Table
Catatan/Note: r Angka diperbaiki/Revised figures x Angka sementara/Preliminary figures xxAngka sangat sementara/Very preliminary figures
1 Terdiri dari sektor-sektor: Lembaga Keuangan Bukan Bank, Rumah Tangga, Perusahaan Swasta Nonfinansial, dan Perusahaan Pemerintah Nonfinansial/Consist of sectors: Non Bank Financial Institutions, Household, Non-Financial Private Enterprises, and Non-Financial Government Enterprises
2 Angka ini merupakan selisih antara tabungan bruto domestik (tabel 15.5.1) dengan tabungan bruto sektor-sektor Bank Sentral, Bank, dan Pemerintahan Umum (tabel 15.5.2–15.5.4)/This figures is difference between domestic gross saving (table 15.5.1) and gross saving of sectors of Central Bank, Banks, and General Government (table 15.5.2–15.5.4)
3 Angka ini merupakan selisih antara investasi nonfinansial (tabel 15.5.1) dengan investasi nonfinansial sektor-sektor Bank Sentral, Bank, dan Pemerintahan Umum (tabel 15.5.2–15.5.4)/This figures is difference between non-financial investment (table 15.5.1) and non-financial investment of sectors of Central Bank, Banks, and General Government (table 15.5.2–15.5.4)
http
://www.b
ps.g
o.id

S I S T E M N E R A C A N A S I O N A L
S t a t i s t i k I n d o n e s i a 2 0 1 3608
SektorSector 2007 2008 2009 2010 2011 x 2012 xx
(1) (2) (3) (4) (5) (6) (7)
I. Keuangan/Financial1. Bank Sentral/Central Bank -15,4 18,6 -5,1 -27,5 -8,2 10,02. Bank/Banks 24,7 50,1 83,5 36,4 52,4 73,4
3. Bukan Bank/Non-Banks 19,4 18,6 40,7 22,6 15,4 …
II. Bukan Keuangan/Non-Financial
1. Rumah Tangga/Household 241,3 325,4 398,8 453,7 551,9 …
2. Pemerintahan Umum General Government
168,7 229,5 116,0 r 173,7 201,2 147,6
3. Perusahaan Pemerintah NonfinansialNon-Financial Government Enterprises
40,6 64,5 52,3 7,8 98,8 …
4. Perusahaan Swasta NonfinansialNon-Financial Private Enterprises
502,5 838,8 1 012,0 r 1 343,8 1 425,0 …
III. Luar Negeri/Rest of the World 2,8 -36,7 38,9 72,9 107,0 367,4
Jumlah/Total 984,6 1 508,8 1 737,1 2 083,4 2 443,5 2 911,4
Tabungan Bruto Menurut Sektor (triliun rupiah), 2007–2012Gross Saving by Sectors (trillion rupiahs), 2007–2012
Tabel –––––– 15.5.6Table
Catatan/Note: r Angka diperbaiki/Revised figures x Angka sementara/Preliminary figures xxAngka sangat sementara/Very preliminary figures
Sumber/Source: 1. Tahun 2007–2009, data dikutip dari publikasi Neraca Arus Dana Indonesia Tahunan/In 2007–2009, data cited from the publication of Yearly Indonesian Flow of Funds Accounts
2. Tahun 2010–2011 data dikutip dari publikasi Neraca Arus Dana Indonesia Tahunan dengan revisi pada sektor Pemerintahan Umum, sektor Perusahaan Swasta Nonfinansial dan Jumlah Tabungan Bruto/In 2010–2011, data cited from the publication of Yearly Indonesian Flow of Funds Accounts with revision for General Government sector, Non-financial Private Enterprises sector, and Total of Gross Saving
3. Tahun 2012, data dikutip dari tabel 15.5.1–15.5.4/In 2012, data cited from tables 15.5.1–15.5.4
http
://www.b
ps.g
o.id

S Y S T E M O F N A T I O N A L A C C O U N T S
S t a t i s t i c a l Y e a r b o o k o f I n d o n e s i a 2 0 1 3 609
SektorSector 2007 2008 2009 2010 2011 x 2012 xx
(1) (2) (3) (4) (5) (6) (7)
I. Keuangan/Financial1. Bank Sentral/Central Bank 0,3 0,2 0,3 0,4 0,1 9,22. Bank/Banks 2,9 6,2 5,5 1,2 6,0 12,03. Bukan Bank/Non-Banks 0,2 2,9 6,2 13,6 -4,3 …
II. Bukan Keuangan/Non-Financial
1. Rumah Tangga/Household 161,7 186,5 215,3 217,8 227,0 …
2. Pemerintahan UmumGeneral Government
133,7 178,2 186,6 168,1 219,9 296,6
3. Perusahaan Pemerintah NonfinansialNon-Financial Government Enterprises
75,5 114,5 110,4 28,1 130,4 …
4. Perusahaan Swasta NonfinansialNon-Financial Private Enterprises
610,3 1 020,3 1 212,8 1 654,2 1 864,4 …
III. Luar Negeri/Rest of the World – – – – – –
Jumlah/Total 984,6 1 508,8 1 737,1 2 083,4 2 443,5 2 911,4
Investasi Nonfinansial Menurut Sektor (triliun rupiah), 2007–2012Non-Finansial Investment by Sectors (trillion rupiahs), 2007–2012
Tabel –––––– 15.5.7Table
Catatan/Note: x Angka sementara/Preliminary figures xxAngka sangat sementara/Very preliminary figures
Sumber/Source: 1. Tahun 2007–2009, data dikutip dari publikasi Neraca Arus Dana Indonesia Tahunan/In 2007–2009, data cited from the publication of Yearly Indonesian Flow of Funds Accounts
2. Tahun 2010–2011 data dikutip dari publikasi Neraca Arus Dana Indonesia Tahunan dengan revisi pada sektor Perusahaan Swasta Nonfinansial dan Jumlah Tabungan Bruto/In 2010–2011, data cited from the publication of Yearly Indonesian Flow of Funds Accounts with revision for Non-financial Private Enterprises sector and Total of Gross Saving
3. Tahun 2012, data dikutip dari tabel 15.5.1–15.5.4/In 2012, data cited from tables 15.5.1–15.5.4http
://www.b
ps.g
o.id

S I S T E M N E R A C A N A S I O N A L
S t a t i s t i k I n d o n e s i a 2 0 1 3610
SektorSector 2007 2008 2009 2010 2011 x 2012 xx
(1) (2) (3) (4) (5) (6) (7)
I. Keuangan/Financial1. Bank Sentral/Central Bank -15,7 18,4 -5,4 -27,9 -8,3 0,82. Bank/Banks 21,8 43,9 78,0 35,2 46,4 61,43. Bukan Bank/Non-Banks 19,2 15,7 34,5 9,0 19,7 …
II. Bukan Keuangan/Non-Financial
1. Rumah Tangga/Household 79,6 138,9 183,5 235,9 324,9 …
2. Pemerintahan UmumGeneral Government
35,0 51,3 -70,6 r 5,6 -18,7 -149,0
3. Perusahaan Pemerintah NonfinasialNon-Financial Government Enterprises
-34,9 -50,0 -58,1 r -20,3 -31,6 …
4. Perusahaan Swasta Nonfinansial Non-Financial Private Enterprises
-107,8 -181,5 -200,8 r -310,4 -439,4 …
III. Luar Negeri/Rest of the World 2,8 -36,7 38,9 72,9 107,0 367,4
Jumlah/Total 0,0 0,0 0,0 0,0 0,0 0,0
Pinjaman Neto Menurut Sektor (triliun rupiah), 2007–2012 1
Net Lending by Sectors (trillion rupiahs), 2007–2012 1Tabel –––––– 15.5.8Table
Catatan/Note: r Angka diperbaiki/Revised figures x Angka sementara/Preliminary figures xxAngka sangat sementara/Very preliminary figures 1 Angka ini merupakan selisih antara tabungan bruto (tabel 15.5.6) dengan investasi nonfinansial (tabel 15.5.7)/This figures is difference
between gross saving (table 15.5.6) and non-financial investment (table 15.5.7)
http
://www.b
ps.g
o.id
16PERBANDINGAN INTERNASIONAL
International Comparisonht
tp://w
ww.bps
.go.
id

http
://www.b
ps.g
o.id

I N T E R N A T I O N A L C O M P A R I S O N
S t a t i s t i c a l Y e a r b o o k o f I n d o n e s i a 2 0 1 3 613
PENJELASAN TEKNIS
1. Sumber data yang digunakan dalam bab ini berasal dari Perserikatan Bangsa-Bangsa (PBB) dan International Monetary Fund (IMF) baik yang diperoleh dari publikasi maupun situs internet. Khusus data Indonesia berasal dari publikasi BPS, kecuali data mengenai produksi minyak mentah yang berasal dari PBB.
2. Jumlah penduduk dan angka harapan hidup penduduk setiap negara merupakan hasil estimasi yang merujuk pada data sensus yang dilakukan setiap negara. Misalnya Indonesia mengacu pada hasil Sensus Penduduk (SP) 2000 dan Survei Penduduk Antar Sensus (SUPAS) 2005. Estimasi tersebut memperhatikan perubahan tingkat kelahiran, kematian, dan perpindahan penduduk.
3. Tingkat pengangguran setiap negara dihitung berdasarkan hasil Survei Angkatan Kerja yang dilakukan oleh masing-masing negara dengan waktu (bulan) pelaksanaan yang berbeda-beda. Dalam hal penghitungan tingkat pengangguran tersebut, setiap negara menggunakan batasan usia kerja yang berbeda-beda. Umumnya batas bawah usia yang digunakan 15 tahun, tapi ada juga yang menggunakan usia 16 tahun, 14 tahun, 13 tahun bahkan 10 tahun. Pada umumnya tidak ada batas atas usia kerja namun demikian, di beberapa negara membatasi sampai usia 64 tahun, 66 tahun, 72 tahun, dan 74 tahun.
4. Laju pertumbuhan produk domestik bruto (PDB) per kapita menggunakan data PDB per kapita atas dasar harga konstan. Diperoleh dengan cara mengurangi nilai PDB per kapita pada tahun ke-n dengan nilai pada tahun ke n-1 (tahun sebelumnya), dibagi dengan nilai pada tahun ke n-1, kemudian dikalikan dengan 100 persen. Laju pertumbuhan tersebut menunjukkan perkembangan agregat pendapatan per kapita penduduk dari satu waktu tertentu terhadap waktu sebelumnya (perkembangan berantai).
5. Dalam penghitungan indeks harga konsumen (IHK), setiap negara memiliki cakupan maupun unit sampel yang berbeda. Perbedaan cakupan sampel tersebut, diantaranya: ada negara yang hanya mencakup perkotaan saja, atau hanya daerah metropolitan saja, atau hanya ibu kota negara saja. Demikian pula dari sisi responden/unit sampel, tiap negara berbeda-beda diantaranya ada yang rumah tangga, usaha perdagangan, pegawai pemerintah, pekerja sektor industri, dan lain-lain.
TECHNICAL NOTES
1. Data sources in this chapter were mainly from the United Nations (UN) and the International Monetary Fund (IMF) obtained from both publications and websites. Special for Indonesia, data were obtained from BPS Statistics Indonesia publications, except the data of crude petroleum production were obtained from UN.
2. Population data and life expectancy at birth data of each country refer to the population cencus - based estimation result conducted by each country. For example, Indonesia population data refer to the result of the 2000 Pupulation Cencus and the 2005 Intercensal Population Survey. The estimates took into account the trends in fertility, mortality, and migration.
3. Unemployment rate for each country is calculated based on the result of Labor Force Survey conducted in each respective country with different time reference. In calculating the unemployment rate, each country applied different concept of working age. 15 years is generally used as the minimum working age, but in several countries 16 years, 14 years, 13 years even 10 years are used as the minimum working age. Upper boundary of working age is not commonly applied, but in several countries the maximum working ages of 64 years, 66 years, 72 years and 74 years, are used.
4. Growth rate of per capita gross domestic product (GDP) is derived from per capita GDP at constant market prices. It is obtained by subtracting the value of per capita GDP year n with the value of per capita GDP year n-1, divided by the value of per capita GDP year n-1 then multiplied by 100 percent. The growth rate of per capita GDP explains the per capita income growth during the given period.
5. In calculating consumer prices indices (CPI), every country has their own approaches with different coverage and sample unit. In some countries, the sample coverage may consist of only urban area, only metropolitan areas, or only the capital city. In terms of sample unit, it can be household, trade sector, government official, industrial worker, etc.
http
://www.b
ps.g
o.id

P E R B A N D I N G A N I N T E R N A S I O N A L
S t a t i s t i k I n d o n e s i a 2 0 1 3614
NegaraCountry 2008 2009 2010 2011 1 2012 1
(1) (2) (3) (4) (5) (6)
Amerika Serikat/USA 305,0 307,7 310,4 313,1 315,8Arab Saudi/Saudi Arabia 26,2 r 26,8 27,4 28,1 28,8Australia 21,5 21,9 22,3 22,6 22,9 Bangladesh 145,5 r 147,0 148,7 150,7 152,8 Belanda/Netherlands 16,5 16,6 16,6 16,7 16,7Belgia/Belgium 10,6 10,7 10,7 10,8 10,8 Brazil 191,5 193,2 194,9 196,7 198,6 Cina/China 1 328,3 r 1 334,9 r 1 341,3 1 348,1 1 354,8 Denmark 5,5 5,5 5,6 5,6 5,6 Federasi Rusia/Russian Federation 143,2 143,1 143,0 142,8 142,5Filipina/Philippines 90,2 r 91,7 93,3 94,9 96,7Finlandia/Finland 5,3 5,3 5,4 5,4 5,4 Hongkong/Hongkong SAR 6,9 7,0 7,1 7,1 7,2India 1 190,9 r 1 207,7 r 1 224,6 1 242,6 1 261,0Indonesia 2 231,6 r 234,8 r 238,5 r 241,0 r 244,2 r
Inggris/United Kingdom 61,3 61,7 62,0 62,4 62,8Italia/Italy 59,9 60,3 r 60,6 60,8 60,9Jepang/Japan 126,5 r 126,6 126,5 126,4 126,3Jerman/Germany 82,5 82,4 82,3 82,1 81,9Kamboja/Cambodia 13,8 14,0 14,1 14,3 14,5Kanada/Canada 33,3 33,7 34,0 34,3 34,7Kazakhstan 15,7 15,8 16,0 16,2 16,4Korea Selatan/Korea, Rep. of 47,7 48,0 48,2 48,4 48,5 Kuwait 2,5 2,6 2,7 2,8 2,9Malaysia 27,5 27,9 r 28,4 28,9 29,4Meksiko/Mexico 110,6 112,0 113,4 114,9 116,4 Mesir/Egypt 78,3 79,7 81,1 82,6 84,2 Myanmar 47,3 r 47,6 48,0 48,4 48,8 Nigeria 150,7 r 154,5 r 158,4 162,6 166,9Norwegia/Norway 4,8 4,8 4,9 4,9 5,0Pakistan 167,4 r 170,5 r 173,6 177,0 180,7 Perancis/France 62,1 62,4 62,8 63,1 63,4Singapura/Singapore 4,8 4,9 5,1 5,2 5,3 Sri Lanka 20,5 20,7 20,9 21,1 21,3 Swedia/Sweden 9,2 9,3 9,4 9,4 9,5 Thailand 68,3 r 68,7 69,1 69,5 70,0 Venezuela 28,1 r 28,5 29,0 29,5 29,9Vietnam 86,0 r 86,9 87,8 88,9 89,9
Tabel –––––– 16.1Table
16. PERBANDINGAN INTERNASIONAL INTERNATIONAL COMPARISON
Perkiraan Penduduk Beberapa Negara (juta), 2008–2012Estimated Population of Selected Countries (million), 2008–2012
Catatan/Note: r Angka diperbaiki/Revised figures 1 Data estimasi dengan ragam fertilitas konstan/Estimates data with constant-fertility variant 2 Data penduduk pertengahan tahun bersumber dari BPS/The Middle of the Year Popoulation Data from BPS Statistics Indonesia Sumber/Source: United Nations: “World Population Prospect: The 2010 Revision Population Database”
http
://www.b
ps.g
o.id

I N T E R N A T I O N A L C O M P A R I S O N
S t a t i s t i c a l Y e a r b o o k o f I n d o n e s i a 2 0 1 3 615
Tabel –––––– 16.2Table
Catatan/Note: 1 Data estimasi dengan ragam fertilitas konstan/Estimates data with constant-fertility variant 2 Berdasarkan data penduduk pertengahan tahun bersumber dari BPS/Based on the Middle of the Year Popoulation Data from BPS Statistics
Indonesia Sumber/Source: United Nations: “World Population Prospect: The 2010 Revision Population Database”
Kepadatan Penduduk Beberapa Negara (penduduk per km2), 2008-2012Population Density of Selected Countries (people per sq.km), 2008-2012
NegaraCountry 2008 2009 2010 2011 1 2012 1
(1) (2) (3) (4) (5) (6)
Amerika Serikat/USA 31,7 32,0 32,2 32,5 32,8Arab Saudi/Saudi Arabia 12,2 12,5 12,8 13,1 13,4Australia 2,8 2,8 2,9 2,9 3,0Bangladesh 1 010,3 1 021,1 1 032,6 1 046,2 1 061,2Belanda/Netherlands 397,4 398,7 400,0 401,2 402,3Belgia/Belgium 347,3 349,2 350,9 352,2 353,2Brazil 22,5 22,7 22,9 23,1 23,3Cina/China 138,4 139,1 139,8 140,5 141,2Denmark 127,6 128,2 128,8 129,3 129,7Federasi Rusia/Russian Federation 8,4 8,4 8,4 8,4 8,3Filipina/Philippines 300,6 305,7 310,9 316,5 322,3Finlandia/Finland 15,7 15,8 15,9 15,9 16,0Hongkong/Hongkong SAR 6 302,4 6 358,5 6 417,8 6 475,8 6 536,5India 362,3 367,4 372,5 378,0 383,6Indonesia 2 128,0 129,0 131,0 133,0 135,0Inggris/United Kingdom 252,2 253,8 255,4 256,9 258,5Italia/Italy 198,8 200,0 201,0 201,7 202,1Jepang/Japan 334,9 334,9 334,9 334,6 334,3Jerman/Germany 231,0 230,8 230,5 230,1 229,5Kamboja/Cambodia 76,4 77,2 78,1 79,2 80,3Kanada/Canada 3,3 3,4 3,4 3,4 3,5Kazakhstan 5,7 5,8 5,9 6,0 6,0Korea Selatan/Korea, Rep. of 479,6 481,9 484,1 485,9 487,6Kuwait 143,0 148,5 153,6 158,2 162,4Malaysia 83,4 84,7 86,1 87,5 89,0Meksiko/Mexico 56,5 57,2 57,9 58,7 59,4Mesir/Egypt 78,2 79,6 81,0 82,5 84,0Myanmar 69,8 70,4 70,9 71,5 72,1Nigeria 163,1 167,2 171,5 176,0 180,6Norwegia/Norway 12,4 12,6 12,7 12,8 12,9Pakistan 210,3 214,2 218,1 222,4 227,0Perancis/France 112,6 113,2 113,8 114,5 115,0Singapura/Singapore 6 987,1 7 241,1 7 447,2 7 592,1 7 686,9Sri Lanka 312,1 315,0 317,9 320,9 323,9Swedia/Sweden 20,5 20,7 20,8 21,0 21,1Thailand 133,0 133,9 134,7 135,5 136,3Venezuela 30,8 31,3 31,8 32,3 32,8Vietnam 259,1 262,0 264,9 267,9 271,0
http
://www.b
ps.g
o.id

P E R B A N D I N G A N I N T E R N A S I O N A L
S t a t i s t i k I n d o n e s i a 2 0 1 3616
Tabel –––––– 16.3Table
Catatan/Note: r Angka diperbaiki/Revised figures 1 Data estimasi dengan ragam fertilitas medium/Estimates data with medium-fertility variant 2 Data bersumber dari BPS/Data from BPS Statistics Indonesia Sumber/Source: United Nations: “World Population Prospect: The 2010 Revision Population Database”
NegaraCountry 1995-2000 2000-2005 2005-2010 2010-20151
(1) (2) (3) (4) (5)
Amerika Serikat/USA 76,4 77,2 78,0 78,8 Arab Saudi/Saudi Arabia 70,7 71,9 73,1 74,2 Australia 78,8 80,3 81,4 82,1Bangladesh 63,5 65,9 67,8 69,4 Belanda/Netherlands 77,9 78,7 80,2 80,9 Belgia/Belgium 77,5 78,2 79,8 80,0 Brazil 69,3 70,9 72,2 74,0 Cina/China 70,8 71,6 72,7 73,8 Denmark 76,0 77,2 78,3 79,0Federasi Rusia/Russian Federation 65,7 64,9 67,7 69,2 Filipina/Philippines 66,4 67,1 67,8 69,2 Finlandia/Finland 77,0 78,3 79,3 80,2 Hongkong/Hongkong SAR 79,4 80,5 81,6 83,2 India 60,7 62,5 64,2 65,9 Indonesia 2 66,0 67,8 69,1 70,0Inggris/United Kingdom 77,1 78,4 79,6 80,4 Italia/Italy 78,7 80,2 81,4 82,0 Jepang/Japan 80,5 81,8 82,7 83,7Jerman/Germany 77,4 78,7 79,8 80,6 Kamboja/Cambodia 56,8 58,8 61,5 63,7Kanada/Canada 78,5 79,7 80,5 81,2 Kazakhstan 63,0 64,6 65,8 67,6Korea Selatan/Korea, Rep. of 74,9 77,4 80,0 80,7 Kuwait 73,3 73,7 74,2 74,8 Malaysia 71,6 72,5 73,4 74,6 Meksiko/Mexico 73,7 74,9 76,2 77,4 Mesir/Egypt 67,4 70,5 72,3 73,5 Myanmar 61,2 62,4 63,5 66,0 Nigeria 45,2 47,8 50,3 52,5 Norwegia/Norway 78,2 79,2 80,5 81,3 Pakistan 62,6 63,6 64,6 65,8 Perancis/France 78,5 79,6 81,0 81,7 Singapura/Singapore 78,0 79,4 80,6 r 81,3Sri Lanka 68,9 73,2 74,2 75,2 Swedia/Sweden 79,2 80,0 80,9 81,7Thailand 72,2 72,9 73,6 74,4 Venezuela 72,1 72,7 73,7 74,7 Vietnam 70,7 73,1 74,3 75,5
Angka Harapan Hidup Penduduk Beberapa Negara (tahun), 1995–2015Life Expectancy of Population on Selected Countries (years), 1995–2015
http
://www.b
ps.g
o.id
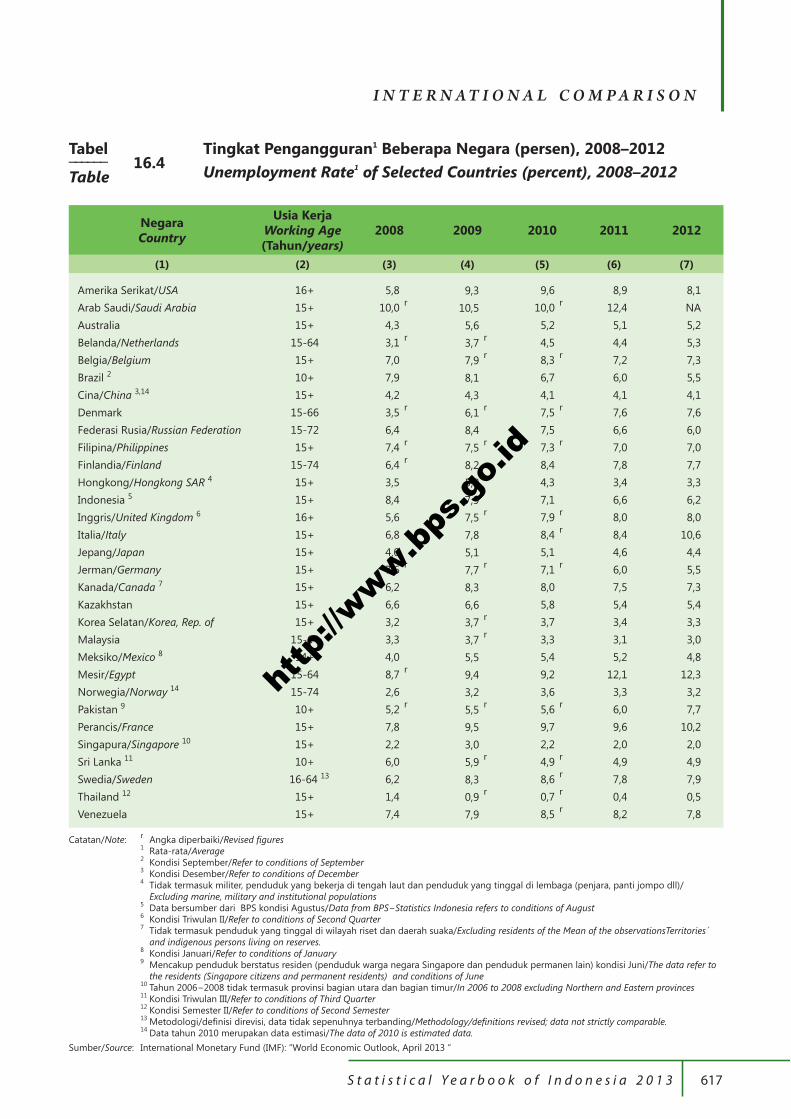
I N T E R N A T I O N A L C O M P A R I S O N
S t a t i s t i c a l Y e a r b o o k o f I n d o n e s i a 2 0 1 3 617
Tabel –––––– 16.4Table
Catatan/Note: r Angka diperbaiki/Revised figures 1 Rata-rata/Average 2 Kondisi September/Refer to conditions of September 3 Kondisi Desember/Refer to conditions of December 4 Tidak termasuk militer, penduduk yang bekerja di tengah laut dan penduduk yang tinggal di lembaga (penjara, panti jompo dll)/
Excluding marine, military and institutional populations 5 Data bersumber dari BPS kondisi Agustus/Data from BPS−Statistics Indonesia refers to conditions of August 6 Kondisi Triwulan II/Refer to conditions of Second Quarter 7 Tidak termasuk penduduk yang tinggal di wilayah riset dan daerah suaka/Excluding residents of the Mean of the observationsTerritories´
and indigenous persons living on reserves. 8 Kondisi Januari/Refer to conditions of January 9 Mencakup penduduk berstatus residen (penduduk warga negara Singapore dan penduduk permanen lain) kondisi Juni/The data refer to
the residents (Singapore citizens and permanent residents) and conditions of June 10 Tahun 2006−2008 tidak termasuk provinsi bagian utara dan bagian timur/In 2006 to 2008 excluding Northern and Eastern provinces 11 Kondisi Triwulan III/Refer to conditions of Third Quarter 12 Kondisi Semester II/Refer to conditions of Second Semester 13 Metodologi/definisi direvisi, data tidak sepenuhnya terbanding/Methodology/definitions revised; data not strictly comparable. 14 Data tahun 2010 merupakan data estimasi/The data of 2010 is estimated data.Sumber/Source: International Monetary Fund (IMF): “World Economic Outlook, April 2013 ”
NegaraCountry
Usia KerjaWorking Age(Tahun/years)
2008 2009 2010 2011 2012
(1) (2) (3) (4) (5) (6) (7)
Amerika Serikat/USA 16+ 5,8 9,3 9,6 8,9 8,1Arab Saudi/Saudi Arabia 15+ 10,0 r 10,5 10,0 r 12,4 NAAustralia 15+ 4,3 5,6 5,2 5,1 5,2Belanda/Netherlands 15-64 3,1 r 3,7 r 4,5 4,4 5,3Belgia/Belgium 15+ 7,0 7,9 r 8,3 r 7,2 7,3Brazil 2 10+ 7,9 8,1 6,7 6,0 5,5Cina/China 3,14 15+ 4,2 4,3 4,1 4,1 4,1Denmark 15-66 3,5 r 6,1 r 7,5 r 7,6 7,6Federasi Rusia/Russian Federation 15-72 6,4 8,4 7,5 6,6 6,0Filipina/Philippines 15+ 7,4 r 7,5 r 7,3 r 7,0 7,0Finlandia/Finland 15-74 6,4 r 8,2 8,4 7,8 7,7Hongkong/Hongkong SAR 4 15+ 3,5 5,2 4,3 3,4 3,3Indonesia 5 15+ 8,4 7,9 7,1 6,6 6,2Inggris/United Kingdom 6 16+ 5,6 7,5 r 7,9 r 8,0 8,0Italia/Italy 15+ 6,8 7,8 8,4 r 8,4 10,6Jepang/Japan 15+ 4,0 5,1 5,1 4,6 4,4Jerman/Germany 15+ 7,6 r 7,7 r 7,1 r 6,0 5,5Kanada/Canada 7 15+ 6,2 8,3 8,0 7,5 7,3Kazakhstan 15+ 6,6 6,6 5,8 5,4 5,4Korea Selatan/Korea, Rep. of 15+ 3,2 3,7 r 3,7 3,4 3,3Malaysia 15-64 3,3 3,7 r 3,3 3,1 3,0Meksiko/Mexico 8 14+ 4,0 5,5 5,4 5,2 4,8Mesir/Egypt 15-64 8,7 r 9,4 9,2 12,1 12,3Norwegia/Norway 14 15-74 2,6 3,2 3,6 3,3 3,2Pakistan 9 10+ 5,2 r 5,5 r 5,6 r 6,0 7,7Perancis/France 15+ 7,8 9,5 9,7 9,6 10,2Singapura/Singapore 10 15+ 2,2 3,0 2,2 2,0 2,0Sri Lanka 11 10+ 6,0 5,9 r 4,9 r 4,9 4,9Swedia/Sweden 16-64 13 6,2 8,3 8,6 r 7,8 7,9Thailand 12 15+ 1,4 0,9 r 0,7 r 0,4 0,5Venezuela 15+ 7,4 7,9 8,5 r 8,2 7,8
Tingkat Pengangguran1 Beberapa Negara (persen), 2008–2012Unemployment Rate1 of Selected Countries (percent), 2008–2012
http
://www.b
ps.g
o.id
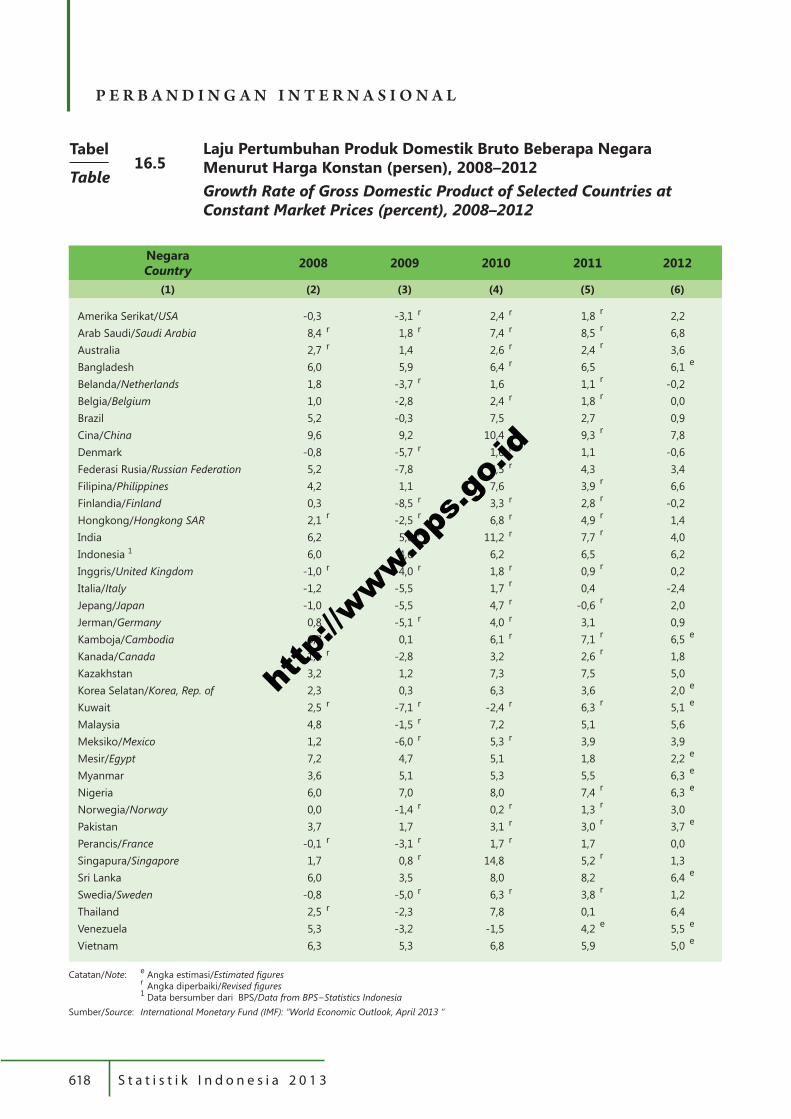
P E R B A N D I N G A N I N T E R N A S I O N A L
S t a t i s t i k I n d o n e s i a 2 0 1 3618
Tabel –––––– 16.5Table
Negara Country 2008 2009 2010 2011 2012
(1) (2) (3) (4) (5) (6)
Amerika Serikat/USA -0,3 -3,1 r 2,4 r 1,8 r 2,2Arab Saudi/Saudi Arabia 8,4 r 1,8 r 7,4 r 8,5 r 6,8Australia 2,7 r 1,4 2,6 r 2,4 r 3,6Bangladesh 6,0 5,9 6,4 r 6,5 6,1 e
Belanda/Netherlands 1,8 -3,7 r 1,6 1,1 r -0,2Belgia/Belgium 1,0 -2,8 2,4 r 1,8 r 0,0Brazil 5,2 -0,3 7,5 2,7 0,9Cina/China 9,6 9,2 10,4 9,3 r 7,8Denmark -0,8 -5,7 r 1,6 r 1,1 -0,6Federasi Rusia/Russian Federation 5,2 -7,8 4,5 r 4,3 3,4Filipina/Philippines 4,2 1,1 7,6 3,9 r 6,6Finlandia/Finland 0,3 -8,5 r 3,3 r 2,8 r -0,2Hongkong/Hongkong SAR 2,1 r -2,5 r 6,8 r 4,9 r 1,4India 6,2 5,0 r 11,2 r 7,7 r 4,0Indonesia 1 6,0 4,6 6,2 6,5 6,2Inggris/United Kingdom -1,0 r -4,0 r 1,8 r 0,9 r 0,2Italia/Italy -1,2 -5,5 1,7 r 0,4 -2,4Jepang/Japan -1,0 -5,5 4,7 r -0,6 r 2,0Jerman/Germany 0,8 -5,1 r 4,0 r 3,1 0,9Kamboja/Cambodia 6,7 0,1 6,1 r 7,1 r 6,5 e
Kanada/Canada 1,1 r -2,8 3,2 2,6 r 1,8Kazakhstan 3,2 1,2 7,3 7,5 5,0Korea Selatan/Korea, Rep. of 2,3 0,3 6,3 3,6 2,0 e
Kuwait 2,5 r -7,1 r -2,4 r 6,3 r 5,1 e
Malaysia 4,8 -1,5 r 7,2 5,1 5,6Meksiko/Mexico 1,2 -6,0 r 5,3 r 3,9 3,9Mesir/Egypt 7,2 4,7 5,1 1,8 2,2 e
Myanmar 3,6 5,1 5,3 5,5 6,3 e
Nigeria 6,0 7,0 8,0 7,4 r 6,3 e
Norwegia/Norway 0,0 -1,4 r 0,2 r 1,3 r 3,0Pakistan 3,7 1,7 3,1 r 3,0 r 3,7 e
Perancis/France -0,1 r -3,1 r 1,7 r 1,7 0,0Singapura/Singapore 1,7 0,8 r 14,8 5,2 r 1,3Sri Lanka 6,0 3,5 8,0 8,2 6,4 e
Swedia/Sweden -0,8 -5,0 r 6,3 r 3,8 r 1,2Thailand 2,5 r -2,3 7,8 0,1 6,4Venezuela 5,3 -3,2 -1,5 4,2 e 5,5 e
Vietnam 6,3 5,3 6,8 5,9 5,0 e
Laju Pertumbuhan Produk Domestik Bruto Beberapa Negara Menurut Harga Konstan (persen), 2008–2012Growth Rate of Gross Domestic Product of Selected Countries at Constant Market Prices (percent), 2008–2012
Catatan/Note: e Angka estimasi/Estimated figures r Angka diperbaiki/Revised figures 1 Data bersumber dari BPS/Data from BPS−Statistics Indonesia Sumber/Source: International Monetary Fund (IMF): “World Economic Outlook, April 2013 ”
http
://www.b
ps.g
o.id

I N T E R N A T I O N A L C O M P A R I S O N
S t a t i s t i c a l Y e a r b o o k o f I n d o n e s i a 2 0 1 3 619
Negara Country 2008 2009 2010 2011 2012
(1) (2) (3) (4) (5) (6)
Amerika Serikat/USA -1,3 -3,9 r 1,6 r 1,1 r 1,5 e
Arab Saudi/Saudi Arabia 4,9 r -1,5 r 3,9 r 5,4 e 4,5 e
Australia 0,7 r -0,2 r 1,4 r 1,1 2,3 e
Bangladesh 4,9 r 4,8 r 5,2 r 5,4 e 4,9 e
Belanda/Netherlands 1,4 -4,2 r 1,1 0,5 r -1,3 e
Belgia/Belgium 0,2 r -3,6 1,6 r 0,3 r -1,0Brazil 4,1 -1,3 6,5 1,8 e 0,0 e
Cina/China 9,1 8,7 9,9 8,8 r 7,3Denmark -1,3 -6,3 r 1,1 r 0,6 r -0,9 e
Federasi Rusia/Russian Federation 5,2 r -7,7 r 4,4 r 4,7 3,8Filipina/Philippines 2,1 0,6 r 5,8 r 2,1 r 4,8 e
Finlandia/Finland -0,2 -9,0 r 2,9 r 2,3 r -0,7 e
Hongkong/Hongkong SAR 1,8 r -2,9 r 5,9 r 4,0 r 0,6 e
India 4,7 3,6 r 9,7 r 6,3 r 2,6 e
Indonesia 1 4,5 3,2 r 4,7 r 5,0 r 4,5Inggris/United Kingdom -1,6 r -4,6 r 1,0 r 0,2 e -0,6 e
Italia/Italy -2,0 -6,2 1,2 r -0,1 r -2,7Jepang/Japan -1,1 r -5,5 r 4,7 r -0,5 r 2,2Jerman/Germany 1,0 -4,8 4,2 r 3,1 r 0,7Kamboja/Cambodia 4,9 -1,6 e 5,0 e 6,0 e 5,4 e
Kanada/Canada -0,1 r -4,0 2,0 1,5 r 0,7Kazakhstan 2,0 r -1,4 5,7 6,0 5,4Korea Selatan/Korea, Rep. of 1,6 r -0,2 r 5,8 r 2,9 r 1,6 e
Kuwait 1,2 r -8,2 r -5,0 r 3,4 r 2,2 e
Malaysia 3,5 -3,4 r 5,3 r 3,7 r 3,8Meksiko/Mexico -0,4 -7,5 r 3,7 r 2,6 r 2,9Mesir/Egypt 4,9 2,4 r 2,7 r -0,4 e -0,4 e
Myanmar e 1,6 3,1 3,3 3,4 r 4,2Nigeria e 3,1 4,1 5,1 4,5 r 3,5Norwegia/Norway -1,3 r -2,5 r -1,1 r 0,0 r 1,7Pakistan 1,9 -2,6 0,9 r 0,9 r 1,6 e
Perancis/France -0,6 r -3,7 r 1,2 r 1,2 r -0,5 e
Singapura/Singapore -1,3 -2,5 r 12,4 2,6 r -0,4 e
Sri Lanka 5,1 2,7 7,2 7,5 5,7 e
Swedia/Sweden -1,6 -5,8 r 5,4 r 3,0 r 0,6Thailand 1,9 r -2,5 r 7,2 -0,2 5,9 e
Venezuela 3,6 r -4,7 r -3,0 r 2,6 e 4,0 e
Vietnam 5,1 4,1 5,5 4,6 e 3,8 e
Laju Pertumbuhan Produk Domestik Bruto per Kapita Beberapa Negara Menurut Harga Konstan (persen), 2008–2012Growth Rate of per Capita Gross Domestic Product of Selected Countries at Constant Market Prices (percent), 2008–2012
Tabel –––––– 16.6Table
Catatan/Note: e Angka estimasi/Estimated figures r Angka diperbaiki/Revised figures 1 Data bersumber dari BPS/Data from BPS−Statistics Indonesia Sumber/Source: International Monetary Fund (IMF): “World Economic Outlook, April 2013 ”
http
://www.b
ps.g
o.id

P E R B A N D I N G A N I N T E R N A S I O N A L
S t a t i s t i k I n d o n e s i a 2 0 1 3620
Catatan/Note: r Angka diperbaiki/Revised figures 1 Termasuk zona netral berdasar bagi hasil/Including neutral zone on share basis 2 Hanya Sabah dan Serawak/Sabah and Sarawak only Sumber/Source: UN: Monthly Bulletin of Statistics
Negara Country 2008 2009 2010 2011 2012
(1) (2) (3) (4) (5) (6)
Amerika Serikat/USA 28 122 r 30 106 r 31 310 r 32 585 r 36 592Arab Saudi/Saudi Arabia 38 345 33 998 33 916 38 675 40 664
Argentina 2 696 2 987 ... ... ...
Australia 1 979 1 919 1 977 r 1 673 r ...Belanda/Netherlands 144 109 85 90 ...Brazil 7 698 8 262 ... ... ...Cina/China 15 835 15 800 16 986 16 971 17 250Denmark 1 170 1 074 1 010 940 861
Federasi Rusia/Russian Federation 39 286 39 857 40 493 40 714 41 267India 2 831 2 769 3 059 3 186 ...Indonesia 4 026 3 892 3 834 3 723 3 549Inggris/United Kingdom 5 458 5 235 4 837 4 048 3 502Iran 16 864 14 720 14 665 ... ...Italia/Italy 445 370 428 442 r 451Jepang/Japan 70 65 62 59 56Jerman/Germany 395 365 400 415 ...Kanada/Canada 10 549 10 470 11 157 11 813 ...Kazakhstan 5 549 6 382 ... ... ...Kolombia/Colombia 2 511 2 880 3 372 3 928 ...Kuwait 1 11 244 9 484 9 700 11 161 12 526Libyan Arab Jamahiriya 6 947 5 914 5 965 ... ...Malaysia 2 2 754 2 619 2 521 2 279 r 2 322Meksiko/Mexico 12 127 11 270 r 11 160 r 11 048 11 039Mesir/Egypt 2 772 2 763 ... ... 3 022Nigeria 8 645 8 698 10 007 9 713 9 572Norwegia/Norway 8 274 8 188 7 610 7 139 r 6 534Pakistan 269 263 r 265 264 ...Perancis/France 81 75 75 77 70Thailand 950 983 1 006 932 995Uni Emirat Arab/United Arab Emirates 10 410 8 961 9 304 10 267 10 669Venezuela 13 607 12 458 12 063 12 287 12 220Vietnam 1 242 1 358 1 244 1 265 1 395
Rata-Rata Produksi Minyak Mentah per Bulan Beberapa Negara (ribu metrik ton), 2008–2012Monthly Average of Crude Petroleum Production of Selected Countries (thousand metric ton), 2008–2012
Tabel –––––– 16.7Table
http
://www.b
ps.g
o.id

I N T E R N A T I O N A L C O M P A R I S O N
S t a t i s t i c a l Y e a r b o o k o f I n d o n e s i a 2 0 1 3 621
Tabel–––––– 16.8Table
NegaraCountry Tahun Dasar 2009 2010 2011 2012
(1) (2) (3) (4) (5) (6)
Amerika Serikat/USA 2005=100 109,8 111,7 115,2 117,6Arab Saudi/Saudi Arabia 2005=100 122,9 129,5 135,9 ...Australia 1 2005=100 112,6 115,8 119,7 ...Bangladesh 2000=100 168,8 182,5 202,0 219,7Belanda/Netherlands 2006=100 105,4 106,7 109,2 111,9Belgia/Belgium 2005=100 108,2 110,6 114,5 117,8Brazil 2005=100 119,7 125,7 134,1 141,3Cina/China 2 2000=100 119,6 123,5 130,2 133,6Denmark 2005=100 108,6 111,1 114,1 116,9Federasi Rusia/Russian Federation 2005=100 152,3 162,8 176,5 ...Filipina/Philippines 2006=100 116,0 120,4 126,2 130,1Finlandia/Finland 2005=100 108,3 109,7 113,5 116,7Hongkong/Hongkong SAR 2005=100 109,2 111,7 117,6 ...India 3 2000=100 163,1 182,7 198,9 ...Indonesia 4 2007=100 115,1 121,0 127,4 132,9Inggris/United Kingdom 5 2005=100 111,3 116,4 122,5 126,4Italia/Italy 2010=100 98,5 100,0 102,8 105,9Jepang/Japan 2010=100 100,7 100,0 r 99,7 99,7Jerman/Germany 2005=100 107,0 108,2 110,7 112,9Kamboja/Cambodia 2008=100 99,3 103,3 109,0 ...Kanada/Canada 2005=100 106,9 108,9 112,0 113,7Korea Selatan/Korea, Rep. of 2010=100 97,1 100,0 104,0 106,3Kuwait 2005=100 125,0 130,0 136,2 140,2Malaysia 2010=100 98,3 100,0 103,2 104,9Meksiko/Mexico 2005=100 119,3 124,2 128,5 133,7Mesir/Egypt 2005=100 155,8 173,1 190,5 204,1Myanmar 2006=100 144,6 155,7 163,5 111,9Nigeria 2000=100 296,6 337,9 374,5 ...Norwegia/Norway 2005=100 109,2 111,9 113,3 114,1Pakistan 2000=100 205,5 234,0 249,8 ...Perancis/France 2005=100 106,2 107,8 110,1 112,3Singapura/Singapore 2005=100 110,6 113,7 119,6 ...Sri Lanka (Colombo) 2008=100 103,5 109,9 117,3 126,1Swedia/Sweden 2005=100 106,9 108,2 111,1 112,1Thailand 2007=100 104,5 108,0 112,1 115,5Venezuela 2008=100 127,1 162,9 205,4 248,7Vietnam 2005=100 152,9 166,9 195,1 212,8
Indeks Harga Konsumen Beberapa Negara (2005=100), 2009–2012Consumer Price Indices of Selected Countries (2005=100), 2009–2012
Catatan/Note: Cakupan wilayah sampel setiap negara berbeda, seperti Indonesia: 45 kota (sebelum 2008) dan 66 kota (tahun 2008), Amerika Serikat: semua perkotaan, Arab Saudi: seluruh kota, Kamboja: hanya kota Phnom Penh, Mesir: populasi perkotaan, Nigeria: perkotaan dan perdesaan, Sri Langka: hanya kota Kolombo. / Sample coverage of each country is different, such as Indonesia: 45 cities (before 2008) and 66 cities (2008), United States: all urban areas, Saudi Arabia: all cities, Cambodia: for Phnom Penh only, Egypt: urban population, Nigeria: urban and rural areas, Sri Langka: for Colombo only.
1 Rata-rata tertimbang dan nilai indeks dihitung dari 8 kota utama/Weighted average of index values computed for the eight capital cities 2 Periode dasar penghitungan indeks merujuk pada bulan yang sama tahun 2000=100/Index base period is the same month of 2000=100 3 Berdasarkan konsumsi pekerja industri/Refers to industrial workers consumption 4 Data bersumber dari BPS/Data from BPS Statistics Indonesia 5 Berdasarkan Indeks Harga Eceran/Refers to Retail Price Indeks
Sumber/Source: UN: Monthly Bulletin of Statistics
http
://www.b
ps.g
o.id

P E R B A N D I N G A N I N T E R N A S I O N A L
S t a t i s t i k I n d o n e s i a 2 0 1 3622
NegaraCountry 2008 2009 2010 2011 2012
(1) (2) (3) (4) (5) (6)
Amerika Serikat/USA 1 M 2 169 490 1 605 300 1 969 180 r 2 265 890 r 2 335 260X 1 301 110 1 056 750 1 277 580 1 480 410 1 546 830B -868 380 -548 550 -691 600 r -785 480 r -788 430
Arab Saudi/Saudi Arabia M 115 133 95 544 106 864 r 131 656 r 103 741X 313 427 192 296 251 147 r 364 441 ...B 198 294 96 752 144 283 r 232 785 ...
Australia M 200 273 r 165 470 201 639 r 243 700 r ...X 186 965 r 153 884 212 362 r 271 697 r ...B -13 308 r -11 587 10 724 27 997 r ...
Bangladesh M 22 473 20 631 26 071 33 978 ...X 11 777 12 443 14 195 19 807 ...B -10 695 -8 188 -11 877 -14 171 ...
Belanda/Netherlands M 495 043 382 268 440 018 r 507 563 498 227X 541 398 431 839 492 411 r 563 129 556 176B 46 355 49 571 52 394 r 55 566 57 949
Belgia/Belgium M 466 437 r 354 666 r 391 356 r 466 505 r 435 217X 471 932 r 371 397 r 408 269 r 476 458 r 446 976B 5 494 r 16 731 r 16 912 r 9 953 r 11 759
Brazil M 182 377 133 673 191 537 214 131 228 377X 197 942 152 995 201 915 256 040 242 294B 15 565 19 322 10 378 41 909 13 917
Cina/China M 1 131 620 1 004 170 1 396 200 1 742 850 r 1 817 830X 1 428 660 1 201 790 1 578 270 1 899 180 2 048 940B 297 040 197 620 182 070 156 330 r 231 110
Denmark M 109 158 80 372 r 82 815 r 95 724 r 93 460X 115 929 r 91 817 r 95 642 r 111 339 r 105 933B 6 722 r 11 445 r 12 827 r 15 615 r 12 473
Federasi Rusia/Russian Fed. M 267 101 167 411 229 655 305 605 314 150X 467 581 301 656 397 668 516 481 525 383B 200 480 134 245 168 013 210 877 211 233
Filipina/Philippines M 60 491 r 45 856 r 58 533 r 64 097 ...X 49 462 r 38 421 r 51 541 r 48 316 ...B -11 030 r -7 436 r -6 992 r -15 781 ...
Finlandia/Finland M 92 160 60 822 68 772 84 013 r 75 203X 96 890 62 859 69 491 78 866 r 72 583B 4 730 2 037 719 -5 146 r -2 620
Hongkong/Hongkong SAR M 388 505 347 311 433 111 483 633 504 405X 362 675 318 510 390 143 428 733 442 799B -25 830 -28 801 -42 968 -54 901 -61 606
India 2 M 321 026 257 200 350 192 464 507 r 489 265X 194 816 164 912 226 334 r 302 892 r 290 707B -126 210 -92 288 -123 858 r -161 615 r -198 559
Indonesia 3 M 129 197 96 829 135 663 r 177 436 191 691X 137 020 116 510 157 779 203 497 190 032B 7 823 19 681 22 116 r 26 061 -1 659
Neraca Perdagangan Beberapa Negara (juta US$), 2008–2012Balance of Trade of Selected Countries (million US$), 2008–2012
Tabel –––––– 16.9Table
http
://www.b
ps.g
o.id

I N T E R N A T I O N A L C O M P A R I S O N
S t a t i s t i c a l Y e a r b o o k o f I n d o n e s i a 2 0 1 3 623
NegaraCountry 2008 2009 2010 2011 2012
(1) (2) (3) (4) (5) (6)
Inggris/United Kingdom M 643 387 r 486 737 r 563 090 r 640 272 r ...X 468 354 r 357 353 r 410 715 r 479 386 r ...B -173 033 r -129 384 r -152 375 r -160 885 r ...
Italia/Italy M 563 436 414 725 486 968 r 558 813 r 487 011X 544 962 406 685 446 852 523 283 r 500 905B -18 474 -8 040 -40 116 -35 530 r 13 894
Jepang/Japan M 762 626 r 550 550 692 435 854 098 r 885 601X 782 049 r 580 719 769 772 r 822 564 r 798 568B 19 422 r 30 169 77 337 -31 534 r -87 033
Jerman/Germany M 1 186 681 926 154 1 056 170 1 255 421 r 1 168 843X 1 451 390 1 120 666 1 261 577 1 475 491 1 410 384B 264 709 194 512 205 408 220 070 r 241 541
Kamboja/Cambodia M 6 508 5 830 r 6 791 r 9 300 ...X 4 708 4 196 r 5 143 r 6 950 ...B -1 800 -1 634 r -1 648 r -2 350 ...
Kanada/Canada 4 M 407 165 320 287 390 527 r 452 131 469 638X 452 170 313 981 386 011 451 735 r 461 792B 45 005 -6 306 -4 515 -396 r -7 845
Kazakstan M 38 452 28 409 30 438 r 38 039 ...X 71 172 r 43 196 59 544 r 88 118 ...B 32 720 r 14 787 29 106 r 50 079 ...
Korea Selatan/Korea, Rep of. M 435 275 322 843 425 212 524 366 519 574X 422 007 361 614 466 384 556 602 548 100B -13 268 38 771 41 172 32 236 28 526
Kuwait M 24 836 20 348 r 22 017 r ... ...X 87 648 51 985 r 65 988 r ... ...B 62 812 31 637 r 43 972 r ... ...
Malaysia M 156 348 r 123 757 r 164 622 r 187 473 r 187 317X 199 414 r 157 244 r 198 612 r 228 086 r 219 253B 43 066 r 33 487 r 33 990 r 40 613 r 31 936
Meksiko/Mexico 4,5 M 310 561 234 385 301 482 350 856 370 746X 291 827 229 683 298 138 349 569 370 889B -18 734 -4 702 -3 344 -1 287 143
Mesir/Egypt 6,7 M 48 775 44 946 52 923 58 903 ...X 26 246 23 062 26 438 30 528 ...B -22 528 -21 884 -26 485 -28 376 ...
Myanmar M 4 256 r 4 348 r 4 760 r 9 019 r ...X 6 882 r 6 662 r 8 661 r 9 238 r ...B 2 626 r 2 314 r 3 901 r 219 r ...
Nigeria M 42 378 33 906 44 235 r 55 000 ...X 80 615 56 742 r 84 000 r 119 000 ...B 38 237 22 836 r 39 765 r 64 000 ...
Norwegia/Norway M 90 293 68 970 r 77 326 r 90 853 r 85 887X 171 764 r 116 778 r 130 669 r 159 253 r 158 298B 81 471 r 47 808 r 53 344 r 68 401 r 72 412
Lanjutan Tabel/Continued Table 16.9
http
://www.b
ps.g
o.id

P E R B A N D I N G A N I N T E R N A S I O N A L
S t a t i s t i k I n d o n e s i a 2 0 1 3624
NegaraCountry 2008 2009 2010 2011 2012
(1) (2) (3) (4) (5) (6)
Pakistan M 42 326 31 648 37 783 43 955 ...X 20 323 17 523 21 410 r 25 383 ...B -22 003 -14 125 -16 373 -18 572 ...
Perancis/France M 715 783 560 484 r 608 096 r 709 325 r 661 440X 608 942 r 476 091 r 516 597 r 583 862 r 556 204B -106 840 r -84 393 r -91 498 r -125 463 r -105 236
Singapura/Singapore M 319 781 245 785 310 791 365 770 379 723X 338 176 269 832 351 867 409 503 408 393B 18 396 24 048 41 076 43 733 28 670
Sri Lanka M 13 953 10 049 13 512 19 943 ...X 8 137 7 085 8 307 10 242 ...
B -5 816 -2 965 -5 205 -9 701 ...
Swedia/Sweden M 168 993 120 262 148 471 174 740 r 161 423X 183 907 131 042 158 089 187 242 r 172 428B 14 914 10 780 9 619 12 501 r 11 005
Thailand M 179 168 134 734 185 121 228 845 250 254X 175 897 151 910 195 371 226 412 r 228 174B -3 270 17 176 10 250 -2 433 r -22 080
Venezuela M 49 602 40 597 33 815 38 346 43 501X 95 021 r 57 603 r 65 745 r 92 602 ...B 45 419 r 17 006 r 31 930 r 54 256 ...
Vietnam M 80 714 69 949 83 779 104 041 ...X 62 685 57 096 72 237 r 96 906 r ...B -18 029 -12 853 -11 543 r -7 135 r ...
Lanjutan Tabel/Continued Table 16.9
Catatan/Note: M : Impor/Import X : Ekspor/Export B : Neraca Perdagangan/Balance of trade r Angka diperbaiki/Revised figures 1 Termasuk perdagangan dengan Kepulauan Virgin dan Puerto Rico tetapi tidak termasuk pengiriman barang diantara Amerika Serikat dan
wilayah lainnya (Guam dan American Samoa). Termasuk ekspor dan impor emas non moneter/Including the trade of the US Virgin Islands and Puerto Rico but excluding shipments of merchandise between the United States and its other possessions (Guam, American Samoa). Data include imports and exports of non-monetary gold.
2 Tidak termasuk barang-barang keperluan militer, material tak tampak, bunker, kapal dan peralatan pesawat/Excluding military goods, fissionable materials, bunkers, ships and aircraft.
3 Data bersumber dari BPS/Data from BPS Statistics Indonesia 4 Impor dalam FOB/Imports in FOB value 5 Termasuk barang setengah jadi yang dimakloonkan melewati batas negara, tidak termasuk kawasan berikat. Total ekspor termasuk nilai
evaluasi kembali dan ekspor perak/Trade data include maquiladoras and exclude good from customsbonded warehouses. Total exports include revaluation and exports of silver.
6 Impor tidak termasuk pengiriman minyak mentah yang nilainya tidak tetap, sedangkan ekspor meliputi ekspor dalam wilayah domestik/Imports exclude petroleum imported without stated value. Exports cover domestic exports.
7 Sebelum 2008, perdadangan khusus/Prior to 2008, special trade.Sumber/Source: UN: Monthly Bulletin of Statistics
http
://www.b
ps.g
o.id

INDEKSI n d e x
http
://www.b
ps.g
o.id

http
://www.b
ps.g
o.id
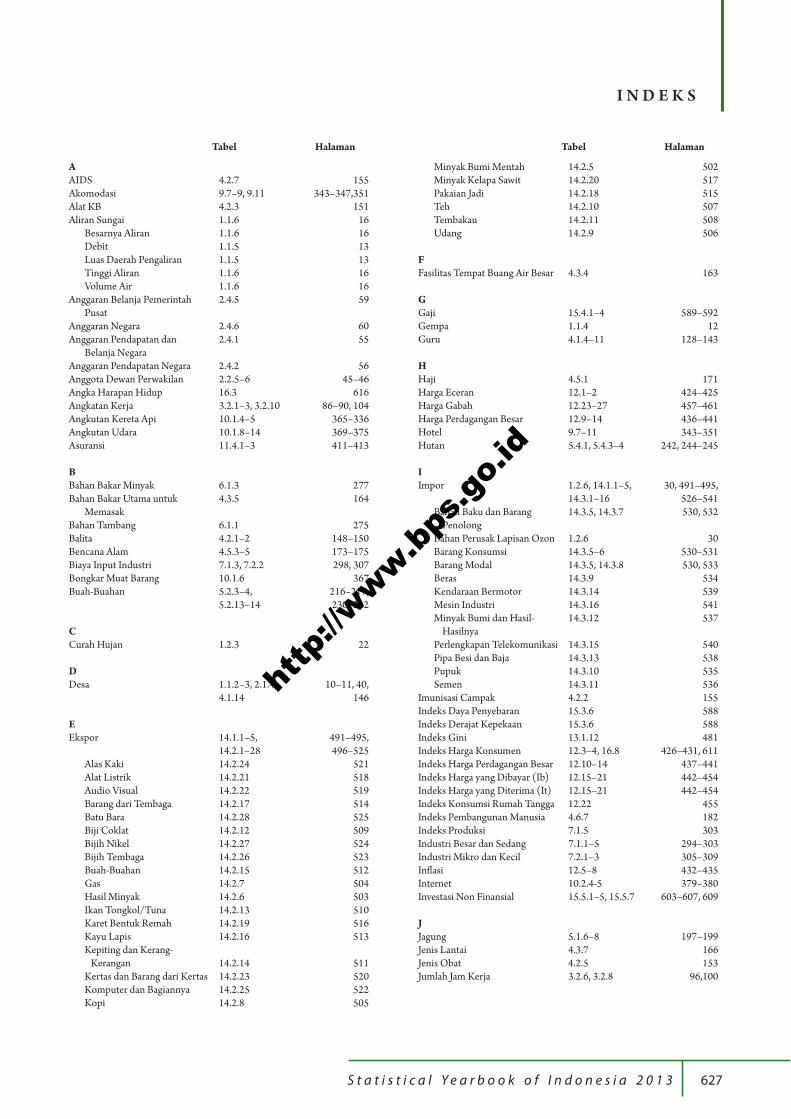
I N D E K S
S t a t i s t i c a l Y e a r b o o k o f I n d o n e s i a 2 0 1 3 627
A AIDS 4.2.7 155Akomodasi 9.7–9, 9.11 343–347,351Alat KB 4.2.3 151Aliran Sungai 1.1.6 16 Besarnya Aliran 1.1.6 16 Debit 1.1.5 13 Luas Daerah Pengaliran 1.1.5 13 Tinggi Aliran 1.1.6 16 Volume Air 1.1.6 16Anggaran Belanja Pemerintah 2.4.5 59 Pusat Anggaran Negara 2.4.6 60Anggaran Pendapatan dan 2.4.1 55 Belanja Negara Anggaran Pendapatan Negara 2.4.2 56 Anggota Dewan Perwakilan 2.2.5–6 45–46Angka Harapan Hidup 16.3 616Angkatan Kerja 3.2.1–3, 3.2.10 86–90, 104Angkutan Kereta Api 10.1.4–5 365–336Angkutan Udara 10.1.8–14 369–375Asuransi 11.4.1–3 411–413 B Bahan Bakar Minyak 6.1.3 277Bahan Bakar Utama untuk 4.3.5 164 Memasak Bahan Tambang 6.1.1 275Balita 4.2.1–2 148–150Bencana Alam 4.5.3–5 173–175Biaya Input Industri 7.1.3, 7.2.2 298, 307 Bongkar Muat Barang 10.1.6 367Buah-Buahan 5.2.3–4, 216–217, 5.2.13–14 230–232 C Curah Hujan 1.2.3 22 D Desa 1.1.2–3, 2.1.4, 10–11, 40, 4.1.14 146 E Ekspor 14.1.1–5, 491–495, 14.2.1–28 496–525 Alas Kaki 14.2.24 521 Alat Listrik 14.2.21 518 Audio Visual 14.2.22 519 Barang dari Tembaga 14.2.17 514 Batu Bara 14.2.28 525 Biji Coklat 14.2.12 509 Bijih Nikel 14.2.27 524 Bijih Tembaga 14.2.26 523 Buah-Buahan 14.2.15 512 Gas 14.2.7 504 Hasil Minyak 14.2.6 503 Ikan Tongkol/Tuna 14.2.13 510 Karet Bentuk Remah 14.2.19 516 Kayu Lapis 14.2.16 513 Kepiting dan Kerang- Kerangan 14.2.14 511 Kertas dan Barang dari Kertas 14.2.23 520 Komputer dan Bagiannya 14.2.25 522 Kopi 14.2.8 505
Minyak Bumi Mentah 14.2.5 502 Minyak Kelapa Sawit 14.2.20 517 Pakaian Jadi 14.2.18 515 Teh 14.2.10 507 Tembakau 14.2.11 508 Udang 14.2.9 506
F Fasilitas Tempat Buang Air Besar 4.3.4 163
G Gaji 15.4.1–4 589–592Gempa 1.1.4 12Guru 4.1.4–11 128–143
H Haji 4.5.1 171Harga Eceran 12.1–2 424–425Harga Gabah 12.23–27 457–461Harga Perdagangan Besar 12.9–14 436–441Hotel 9.7–11 343–351Hutan 5.4.1, 5.4.3–4 242, 244–245 I Impor 1.2.6, 14.1.1–5, 30, 491–495, 14.3.1–16 526–541 Bahan Baku dan Barang 14.3.5, 14.3.7 530, 532 Penolong Bahan Perusak Lapisan Ozon 1.2.6 30 Barang Konsumsi 14.3.5–6 530–531 Barang Modal 14.3.5, 14.3.8 530, 533 Beras 14.3.9 534 Kendaraan Bermotor 14.3.14 539 Mesin Industri 14.3.16 541 Minyak Bumi dan Hasil- 14.3.12 537 Hasilnya Perlengkapan Telekomunikasi 14.3.15 540 Pipa Besi dan Baja 14.3.13 538 Pupuk 14.3.10 535 Semen 14.3.11 536Imunisasi Campak 4.2.2 155Indeks Daya Penyebaran 15.3.6 588Indeks Derajat Kepekaan 15.3.6 588Indeks Gini 13.1.12 481Indeks Harga Konsumen 12.3–4, 16.8 426–431, 611Indeks Harga Perdagangan Besar 12.10–14 437–441Indeks Harga yang Dibayar (Ib) 12.15–21 442–454Indeks Harga yang Diterima (It) 12.15–21 442–454Indeks Konsumsi Rumah Tangga 12.22 455Indeks Pembangunan Manusia 4.6.7 182Indeks Produksi 7.1.5 303Industri Besar dan Sedang 7.1.1–5 294–303Industri Mikro dan Kecil 7.2.1–3 305–309Inflasi 12.5–8 432–435Internet 10.2.4-5 379–380Investasi Non Finansial 15.5.1–5, 15.5.7 603–607, 609 J Jagung 5.1.6–8 197–199Jenis Lantai 4.3.7 166Jenis Obat 4.2.5 153Jumlah Jam Kerja 3.2.6, 3.2.8 96,100
Tabel Halaman Tabel Halaman
http
://www.b
ps.g
o.id
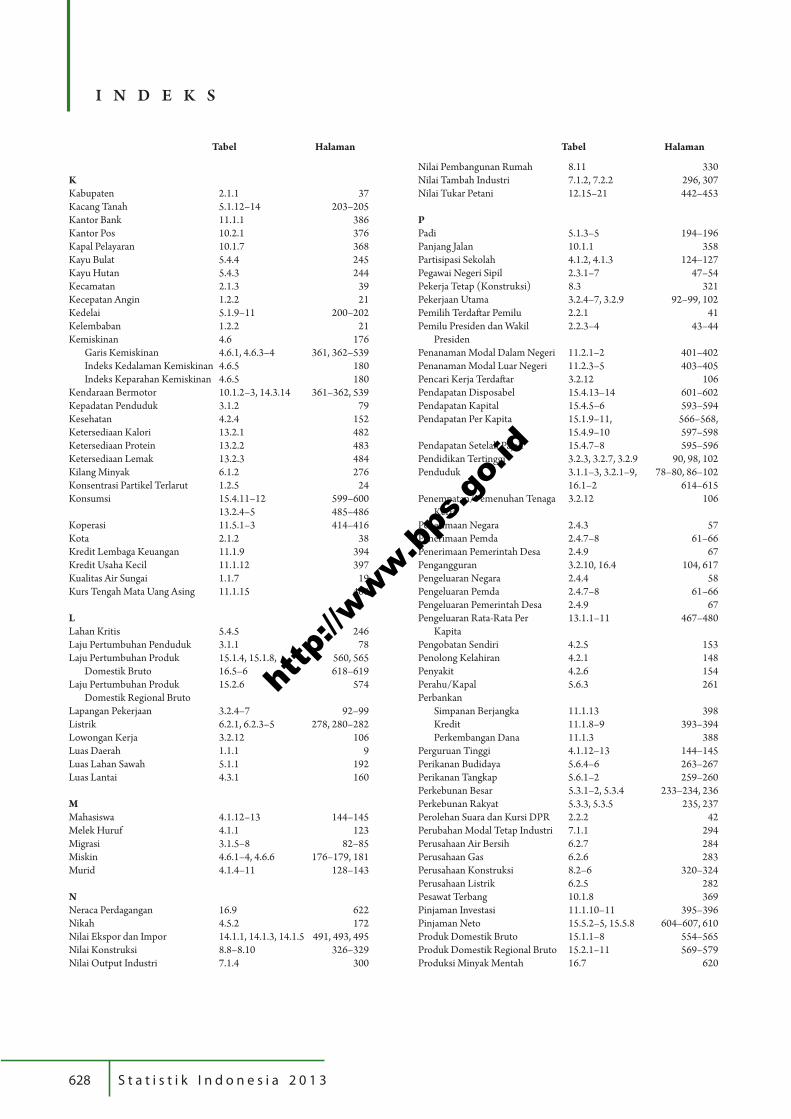
I N D E K S
S t a t i s t i k I n d o n e s i a 2 0 1 3628
K Kabupaten 2.1.1 37Kacang Tanah 5.1.12–14 203–205Kantor Bank 11.1.1 386Kantor Pos 10.2.1 376Kapal Pelayaran 10.1.7 368Kayu Bulat 5.4.4 245Kayu Hutan 5.4.3 244Kecamatan 2.1.3 39Kecepatan Angin 1.2.2 21Kedelai 5.1.9–11 200–202Kelembaban 1.2.2 21Kemiskinan 4.6 176 Garis Kemiskinan 4.6.1, 4.6.3–4 361, 362–539 Indeks Kedalaman Kemiskinan 4.6.5 180 Indeks Keparahan Kemiskinan 4.6.5 180Kendaraan Bermotor 10.1.2–3, 14.3.14 361–362, 539Kepadatan Penduduk 3.1.2 79Kesehatan 4.2.4 152Ketersediaan Kalori 13.2.1 482Ketersediaan Protein 13.2.2 483Ketersediaan Lemak 13.2.3 484Kilang Minyak 6.1.2 276Konsentrasi Partikel Terlarut 1.2.5 24Konsumsi 15.4.11–12 599–600 13.2.4–5 485–486Koperasi 11.5.1–3 414–416Kota 2.1.2 38Kredit Lembaga Keuangan 11.1.9 394Kredit Usaha Kecil 11.1.12 397Kualitas Air Sungai 1.1.7 19Kurs Tengah Mata Uang Asing 11.1.15 400 L Lahan Kritis 5.4.5 246Laju Pertumbuhan Penduduk 3.1.1 78Laju Pertumbuhan Produk 15.1.4, 15.1.8, 560, 565 Domestik Bruto 16.5–6 618–619Laju Pertumbuhan Produk 15.2.6 574 Domestik Regional Bruto Lapangan Pekerjaan 3.2.4–7 92–99Listrik 6.2.1, 6.2.3–5 278, 280–282Lowongan Kerja 3.2.12 106Luas Daerah 1.1.1 9Luas Lahan Sawah 5.1.1 192Luas Lantai 4.3.1 160 M Mahasiswa 4.1.12–13 144–145Melek Huruf 4.1.1 123Migrasi 3.1.5–8 82–85Miskin 4.6.1–4, 4.6.6 176–179, 181Murid 4.1.4–11 128–143 N Neraca Perdagangan 16.9 622Nikah 4.5.2 172Nilai Ekspor dan Impor 14.1.1, 14.1.3, 14.1.5 491, 493, 495Nilai Konstruksi 8.8–8.10 326–329Nilai Output Industri 7.1.4 300
Nilai Pembangunan Rumah 8.11 330Nilai Tambah Industri 7.1.2, 7.2.2 296, 307Nilai Tukar Petani 12.15–21 442–453 P Padi 5.1.3–5 194–196Panjang Jalan 10.1.1 358Partisipasi Sekolah 4.1.2, 4.1.3 124–127Pegawai Negeri Sipil 2.3.1–7 47–54Pekerja Tetap (Konstruksi) 8.3 321Pekerjaan Utama 3.2.4–7, 3.2.9 92–99, 102Pemilih Terdaftar Pemilu 2.2.1 41Pemilu Presiden dan Wakil 2.2.3–4 43–44 Presiden Penanaman Modal Dalam Negeri 11.2.1–2 401–402Penanaman Modal Luar Negeri 11.2.3–5 403–405Pencari Kerja Terdaftar 3.2.12 106Pendapatan Disposabel 15.4.13–14 601–602Pendapatan Kapital 15.4.5–6 593–594Pendapatan Per Kapita 15.1.9–11, 566–568, 15.4.9–10 597–598Pendapatan Setelah Pajak 15.4.7–8 595–596Pendidikan Tertinggi 3.2.3, 3.2.7, 3.2.9 90, 98, 102Penduduk 3.1.1–3, 3.2.1–9, 78–80, 86–102 16.1–2 614–615Penempatan/Pemenuhan Tenaga 3.2.12 106 KerjaPenerimaan Negara 2.4.3 57Penerimaan Pemda 2.4.7–8 61–66Penerimaan Pemerintah Desa 2.4.9 67Pengangguran 3.2.10, 16.4 104, 617Pengeluaran Negara 2.4.4 58Pengeluaran Pemda 2.4.7–8 61–66Pengeluaran Pemerintah Desa 2.4.9 67Pengeluaran Rata-Rata Per 13.1.1–11 467–480 Kapita Pengobatan Sendiri 4.2.5 153Penolong Kelahiran 4.2.1 148Penyakit 4.2.6 154Perahu/Kapal 5.6.3 261Perbankan Simpanan Berjangka 11.1.13 398 Kredit 11.1.8–9 393–394 Perkembangan Dana 11.1.3 388Perguruan Tinggi 4.1.12–13 144–145Perikanan Budidaya 5.6.4–6 263–267Perikanan Tangkap 5.6.1–2 259–260Perkebunan Besar 5.3.1–2, 5.3.4 233–234, 236 Perkebunan Rakyat 5.3.3, 5.3.5 235, 237Perolehan Suara dan Kursi DPR 2.2.2 42Perubahan Modal Tetap Industri 7.1.1 294Perusahaan Air Bersih 6.2.7 284Perusahaan Gas 6.2.6 283Perusahaan Konstruksi 8.2–6 320–324Perusahaan Listrik 6.2.5 282Pesawat Terbang 10.1.8 369Pinjaman Investasi 11.1.10–11 395–396Pinjaman Neto 15.5.2–5, 15.5.8 604–607, 610Produk Domestik Bruto 15.1.1–8 554–565Produk Domestik Regional Bruto 15.2.1–11 569–579Produksi Minyak Mentah 16.7 620
Tabel Halaman Tabel Halaman
http
://www.b
ps.g
o.id

I N D E K S
S t a t i s t i c a l Y e a r b o o k o f I n d o n e s i a 2 0 1 3 629
Pulau 1.1.1 9Puskesmas 4.2.8 156 R Rasio Jenis Kelamin 3.1.3 80Rata-Rata Lama Menginap Tamu 9.10–11 349–351Rata-Rata Upah Nominal 3.2.13–16 108–111Reboisasi 5.4.2 243Ringkasan Anggaran Negara 2.4.6 60Rujuk 4.5.2 172Rumah Sakit 4.2.8 156Rumah Siap Huni 8.13 332Rumah Tangga 3.1.4 81 S Sarana Kesehatan 4.2.10 158Sayuran 5.2.1–4, 5.2.14 212–217, 232Sekolah 4.1.4–11 128–143Status Pekerjaan Utama 3.2.5, 3.2.9 94, 102Status Penguasaan Bangunan 4.3.6 165Partisipasi Sekolah 4.1.2 124Stok Akhir Rumah 8.12 331Struktur Nilai Tambah Bruto 15.3.4 586Suhu 1.2.1 20Sumber Air Minum 4.3.2 161Sumber Penerangan 4.3.3 162 T Tabungan 11.1.14 399Tabungan Bruto 15.5.2–6 604–608Tabungan Domestik 15.5.1 603Tabungan Luar Negeri 15.5.1 603Talaq dan Cerai 4.5.2 172Tanaman Biofarmaka 5.2.5–8 218–223Tanaman Hias 5.2.9–12 224–229Tanaman Pangan 5.1.2 193Tekanan Udara 1.2.4 23Telepon Kabel 10.2.2 377
Telepon Seluler 10.2.3 378Telur 5.5.6 257Tenaga Edukatif 4.1.12–13 144–145Tenaga Kerja 3.2.12, 7.1.1, 7.2.1 106, 292, 303Tenaga Profesi 8.4–5 322–323Ternak 5.5.1, 5.5.3–4 247, 251–253Tindak Pidana 4.4.1–4 167–170Tingkat Partisipasi Angkatan 3.2.10 104 Kerja (TPAK) Tingkat Pengangguran Terbuka 3.2.10 104 (TPT)Tingkat Penghunian Kamar 9.9 347TKI 3.2.11 105Topografi 1.1.3 11Transaksi Domestik 15.3.3 584Transaksi Total 15.3.1–2 580–582Tuberkulosis 4.2.9 157 U Uang Beredar 11.1.2 387Ubi Jalar 5.1.18–20 209–211Ubi Kayu 5.1.15–17 206–208Unggas 5.5.2, 5.5.5–6 249, 255–257Upah 3.2.13–17, 108–112, 15.4.1–4 589–592Upah Minimum Provinsi (UMP) 3.2.17 112Utang Luar Negeri 11.3.1–4 406–409 V Valuta Asing 11.1.5 390Volume Ekspor 14.1.2, 14.1.4 492, 494 14.2.1, 14.2.3 496–500Volume Impor 14.1.2, 14.1.4 492, 494 14.3.1, 14.3.3 526, 528Volume Pembangunan Rumah 8.11 330 W Wisatawan Mancanegara 9.1–6 337–342
Tabel Halaman Tabel Halaman
http
://www.b
ps.g
o.id
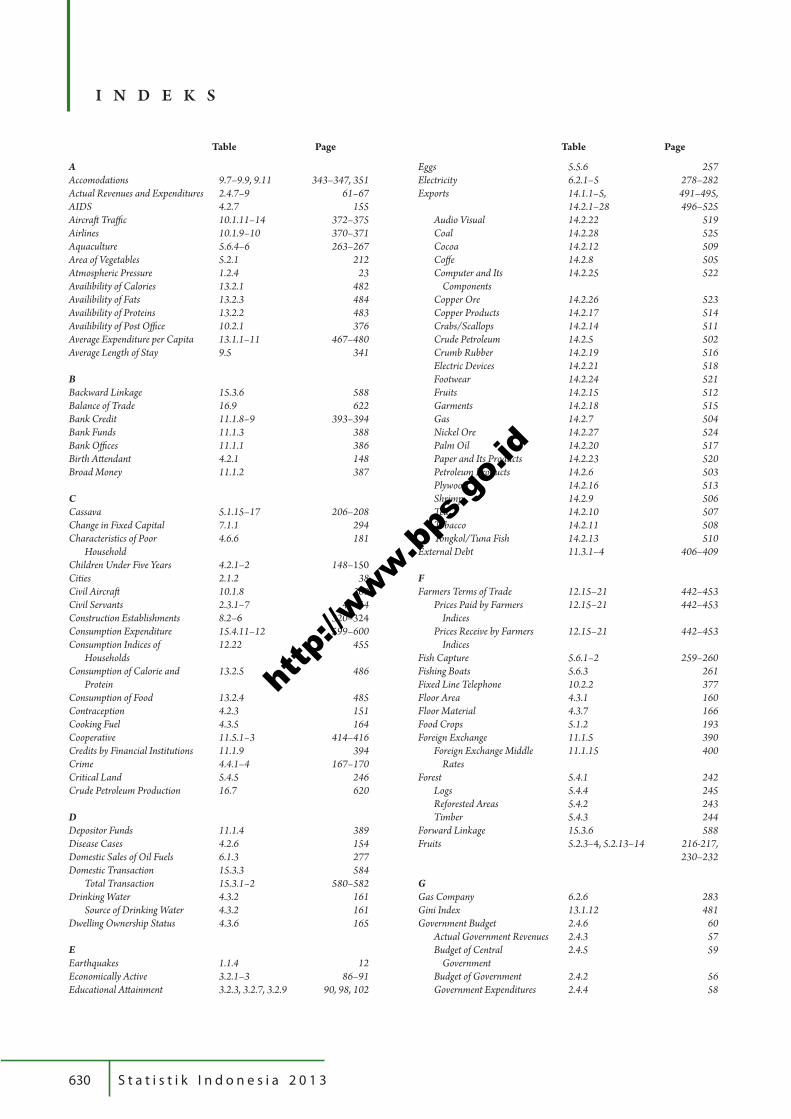
I N D E K S
S t a t i s t i k I n d o n e s i a 2 0 1 3630
A Accomodations 9.7–9.9, 9.11 343–347, 351Actual Revenues and Expenditures 2.4.7–9 61–67AIDS 4.2.7 155Aircraft Traffic 10.1.11–14 372–375Airlines 10.1.9–10 370–371Aquaculture 5.6.4–6 263–267Area of Vegetables 5.2.1 212Atmospheric Pressure 1.2.4 23Availibility of Calories 13.2.1 482Availibility of Fats 13.2.3 484Availibility of Proteins 13.2.2 483Availibility of Post Office 10.2.1 376Average Expenditure per Capita 13.1.1–11 467–480Average Length of Stay 9.5 341 B Backward Linkage 15.3.6 588Balance of Trade 16.9 622Bank Credit 11.1.8–9 393–394Bank Funds 11.1.3 388Bank Offices 11.1.1 386Birth Attendant 4.2.1 148Broad Money 11.1.2 387 C Cassava 5.1.15–17 206–208Change in Fixed Capital 7.1.1 294Characteristics of Poor 4.6.6 181 Household Children Under Five Years 4.2.1–2 148–150Cities 2.1.2 38Civil Aircraft 10.1.8 369Civil Servants 2.3.1–7 47–54Construction Establishments 8.2–6 320–324Consumption Expenditure 15.4.11–12 599–600Consumption Indices of 12.22 455 Households Consumption of Calorie and 13.2.5 486 Protein Consumption of Food 13.2.4 485Contraception 4.2.3 151Cooking Fuel 4.3.5 164Cooperative 11.5.1–3 414–416Credits by Financial Institutions 11.1.9 394Crime 4.4.1–4 167–170Critical Land 5.4.5 246Crude Petroleum Production 16.7 620 D Depositor Funds 11.1.4 389Disease Cases 4.2.6 154Domestic Sales of Oil Fuels 6.1.3 277Domestic Transaction 15.3.3 584 Total Transaction 15.3.1–2 580–582Drinking Water 4.3.2 161 Source of Drinking Water 4.3.2 161Dwelling Ownership Status 4.3.6 165 E Earthquakes 1.1.4 12Economically Active 3.2.1–3 86–91Educational Attainment 3.2.3, 3.2.7, 3.2.9 90, 98, 102
Eggs 5.5.6 257Electricity 6.2.1–5 278–282 Exports 14.1.1–5, 491–495, 14.2.1–28 496–525 Audio Visual 14.2.22 519 Coal 14.2.28 525 Cocoa 14.2.12 509 Coffe 14.2.8 505 Computer and Its 14.2.25 522 Components Copper Ore 14.2.26 523 Copper Products 14.2.17 514 Crabs/Scallops 14.2.14 511 Crude Petroleum 14.2.5 502 Crumb Rubber 14.2.19 516 Electric Devices 14.2.21 518 Footwear 14.2.24 521 Fruits 14.2.15 512 Garments 14.2.18 515 Gas 14.2.7 504 Nickel Ore 14.2.27 524 Palm Oil 14.2.20 517 Paper and Its Products 14.2.23 520 Petroleum Products 14.2.6 503 Plywood 14.2.16 513 Shrimp 14.2.9 506 Tea 14.2.10 507 Tobacco 14.2.11 508 Tongkol/Tuna Fish 14.2.13 510External Debt 11.3.1–4 406–409 F Farmers Terms of Trade 12.15–21 442–453 Prices Paid by Farmers 12.15–21 442–453 Indices Prices Receive by Farmers 12.15–21 442–453 Indices Fish Capture 5.6.1–2 259–260Fishing Boats 5.6.3 261Fixed Line Telephone 10.2.2 377Floor Area 4.3.1 160Floor Material 4.3.7 166Food Crops 5.1.2 193Foreign Exchange 11.1.5 390 Foreign Exchange Middle 11.1.15 400 Rates Forest 5.4.1 242 Logs 5.4.4 245 Reforested Areas 5.4.2 243 Timber 5.4.3 244Forward Linkage 15.3.6 588Fruits 5.2.3–4, 5.2.13–14 216-217, 230–232 G Gas Company 6.2.6 283Gini Index 13.1.12 481Government Budget 2.4.6 60 Actual Government Revenues 2.4.3 57 Budget of Central 2.4.5 59 Government Budget of Government 2.4.2 56 Government Expenditures 2.4.4 58
Table Page Table Page
http
://www.b
ps.g
o.id

I N D E K S
S t a t i s t i c a l Y e a r b o o k o f I n d o n e s i a 2 0 1 3 631
Revenues State Budget 2.4.1 55Gross Domestic Products 15.1.1–8 554–565 Gross National Products 15.1.5–6 562–563 Gross Regional Domestic 15.2.1–11 569–579 Products Growth Rate of Gross 15.1.4– 15.1.8, 560, 565, Domestic 16.5 618 Growth Rate of Gross 15.2.6 574 Regional Domestic Products Percentage Distribution of 15.1.3, 15.1.7 558, 564 Gross Domestic Products H Hajj 4.5.1 171Harvested Area of Ornamental 5.2.9 224 Plant Health 4.2.4 152Health Facilities 4.2.10 158Hospital 4.2.8 156 Population Having Health 4.2.4 152 Complaint Population Having Self 4.2.5 153 Treatment Public Health Centre 4.2.8 156Household 3.1.4 81Human Development Index 4.6.7 182Humidity 1.2.2 21Housing Final Stock 8.12 331 I Imports 14.1.1–5, 491–495, 14.3.1–16 526–541 Capital Goods 14.3.5, 14.3.8 530, 533 Cement 14.3.11 536 Consumption Goods 14.3.5–6 530–531 Crude Petroleum and 14.3.12 537 Petroleum Products Fertilizers 14.3.10 535 Iron and Steel Tubes 14.3.13 538 Machinery for Special 14.3.16 541 Industries Motor Vehicles 14.3.14 539 Ozone Depleting Substance 1.2.6 30 Raw Materials and Auxiliary 14.3.5, 14.3.7 530, 532 Goods Rice 14.3.9 534 Telecommunication 14.3.15 540 Equipments Income 15.4.9–10 597–598 Capital Income 15.4.5 593 Disposable Income 15.4.13–14 601–602 Growth Rate of Per Capita 15.1.11 568 Income Income After Tax 15.4.7–8 595–596 National Income 15.1.5–6, 562–563, 15.1.9–11 566–568 Per Capita Income 15.1.9–11 566–568 Total Income 15.4.9 597Indicators of Electricity 6.2.5 282 Company Indicators of Gas Company 6.2.6 283
Indicators of Water Supply 6.2.7 284 Company Indonesian Overseas Workers 3.2.11 105Inflation Rate 12.5–8 432–435 Consumer Prices Indices 12.3–4, 16.8 426–428, 621Input Costs of Manufacture 7.1.3, 7.2.2 298, 307Insurance 11.4.1–3 411–413Internet 10.2.4-5 379–380Investment Credits of 11.1.10–11 395–396 Commercial Bank Domestic Direct Investment 11.2.1–2 401–402 Foreign Direct Investment 11.2.3–5 403–405 Nonfinancial Investment 15.5.1–5, 15.5.7 603–607, 609Islands 1.1.1 9 L Labor Force Participation Rate 3.2.10 104 (LFPR) Labor Cost 7.1.1, 7.2.1 294, 305 Main Employment Status 3.2.5, 3.2.9 94, 102 Main Industry 3.2.4–7 92–99 Provincial Minimum Wage 3.2.17 112 Registered Job Applicants 3.2.12 106 Registered Job Vacancies 3.2.12 106 Total Working Hours 3.2.6, 3.2.8 96, 100 Unemployment 3.2.1–3 86-91 Unemployment Rate (UR) 3.2.10, 16.4 104, 617 Wage 3.2.13–17, 108–112, 15.4.1–4 589–592 Wage and Salaries 15.4.1–4 589–592Large and Medium 7.1.1–5 294–304 Manufacturing Industry Large Estate Crop 5.3.1–2, 5.3.4 233–234, 236 Length of Roads 10.1.1 358Literate 4.1.1 123Livestock 5.5.1, 5.5.3–4 247, 251–254 Poultry 5.5.2, 5.5.5 249, 255–256 M Main Jobs 3.2.6 96Maize 5.1.6–8 197–199Marriages 4.5.2 172 Divorces 4.5.2 172 Reconciliations 4.5.2 172Measles Immunization 4.2.2 150Medicinal Plants 5.2.5–8 218–223Micro and Small 7.2.1–3 305–309 Manufacturing IndustryMigration 3.1.5–8 82–85Mining Material 6.1.1 275Mobile Cellular 10.2.3 378Motor Vehicles 10.1.2–3 361–362 N Natural Disaster 4.5.3–5 173–175 Number of Victims 4.5.3 173 Number of Damaged House 4.5.4 174Net Lending 15.5.2–5, 15.5.8 604–607, 610 O Oil Fuels 6.1.3 277Ornamental Plants 5.2.9–12 224–229
Table Page Table Page
http
://www.b
ps.g
o.id
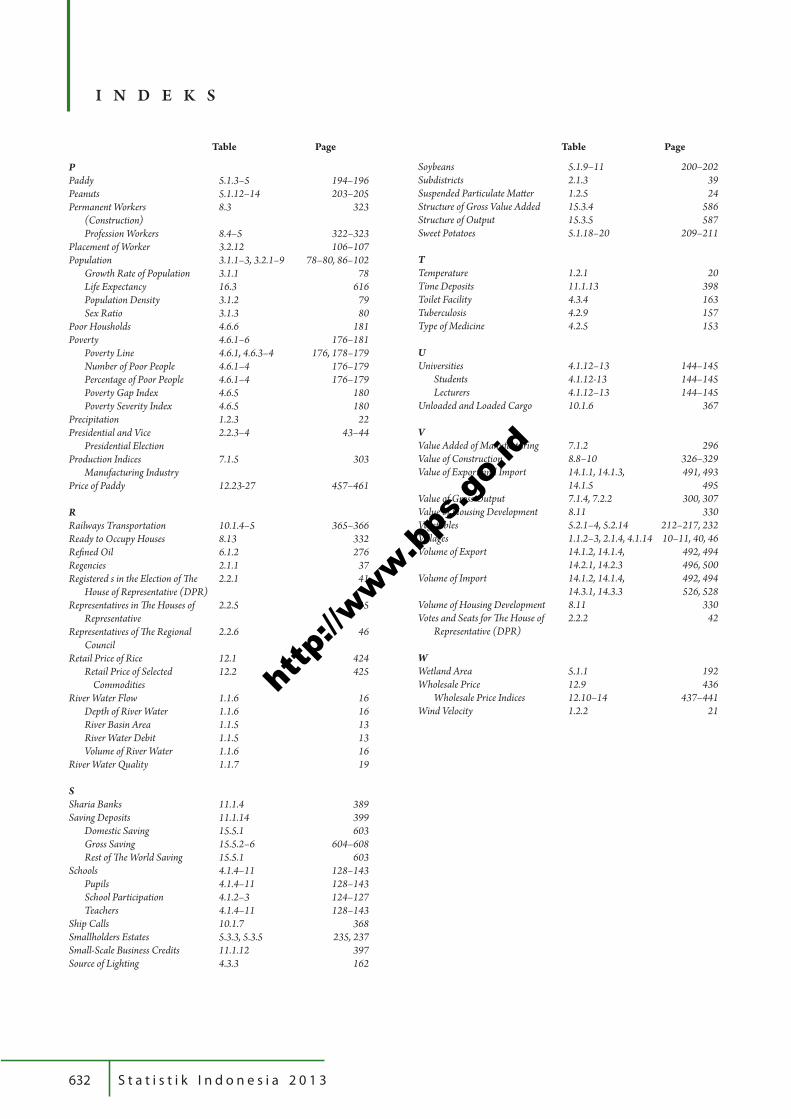
I N D E K S
S t a t i s t i k I n d o n e s i a 2 0 1 3632
P Paddy 5.1.3–5 194–196Peanuts 5.1.12–14 203–205Permanent Workers 8.3 323 (Construction) Profession Workers 8.4–5 322–323Placement of Worker 3.2.12 106–107Population 3.1.1–3, 3.2.1–9 78–80, 86–102 Growth Rate of Population 3.1.1 78 Life Expectancy 16.3 616 Population Density 3.1.2 79 Sex Ratio 3.1.3 80Poor Housholds 4.6.6 181Poverty 4.6.1–6 176–181 Poverty Line 4.6.1, 4.6.3–4 176, 178–179 Number of Poor People 4.6.1–4 176–179 Percentage of Poor People 4.6.1–4 176–179 Poverty Gap Index 4.6.5 180 Poverty Severity Index 4.6.5 180Precipitation 1.2.3 22Presidential and Vice 2.2.3–4 43–44 Presidential Election Production Indices 7.1.5 303 Manufacturing IndustryPrice of Paddy 12.23-27 457–461 R Railways Transportation 10.1.4–5 365–366Ready to Occupy Houses 8.13 332Refined Oil 6.1.2 276Regencies 2.1.1 37Registered s in the Election of The 2.2.1 41 House of Representative (DPR)Representatives in The Houses of 2.2.5 45 RepresentativeRepresentatives of The Regional 2.2.6 46 CouncilRetail Price of Rice 12.1 424 Retail Price of Selected 12.2 425 Commodities River Water Flow 1.1.6 16 Depth of River Water 1.1.6 16 River Basin Area 1.1.5 13 River Water Debit 1.1.5 13 Volume of River Water 1.1.6 16River Water Quality 1.1.7 19 S Sharia Banks 11.1.4 389Saving Deposits 11.1.14 399 Domestic Saving 15.5.1 603 Gross Saving 15.5.2–6 604–608 Rest of The World Saving 15.5.1 603Schools 4.1.4–11 128–143 Pupils 4.1.4–11 128–143 School Participation 4.1.2–3 124–127 Teachers 4.1.4–11 128–143 Ship Calls 10.1.7 368Smallholders Estates 5.3.3, 5.3.5 235, 237Small-Scale Business Credits 11.1.12 397Source of Lighting 4.3.3 162
Soybeans 5.1.9–11 200–202Subdistricts 2.1.3 39Suspended Particulate Matter 1.2.5 24Structure of Gross Value Added 15.3.4 586Structure of Output 15.3.5 587Sweet Potatoes 5.1.18–20 209–211 T Temperature 1.2.1 20Time Deposits 11.1.13 398Toilet Facility 4.3.4 163Tuberculosis 4.2.9 157Type of Medicine 4.2.5 153 U Universities 4.1.12–13 144–145 Students 4.1.12-13 144–145 Lecturers 4.1.12–13 144–145Unloaded and Loaded Cargo 10.1.6 367 V Value Added of Manufacturing 7.1.2 296Value of Construction 8.8–10 326–329 Value of Export and Import 14.1.1, 14.1.3, 491, 493 14.1.5 495 Value of Gross Output 7.1.4, 7.2.2 300, 307Value of Housing Development 8.11 330Vegetables 5.2.1–4, 5.2.14 212–217, 232Villages 1.1.2–3, 2.1.4, 4.1.14 10–11, 40, 46 Volume of Export 14.1.2, 14.1.4, 492, 494 14.2.1, 14.2.3 496, 500 Volume of Import 14.1.2, 14.1.4, 492, 494 14.3.1, 14.3.3 526, 528 Volume of Housing Development 8.11 330Votes and Seats for The House of 2.2.2 42 Representative (DPR) W Wetland Area 5.1.1 192Wholesale Price 12.9 436 Wholesale Price Indices 12.10–14 437–441Wind Velocity 1.2.2 21
Table Page Table Page
http
://www.b
ps.g
o.id

http
://www.b
ps.g
o.id
9 770126 291002
ISSN 0126-2912
http
://www.b
ps.g
o.id