Embed Size (px)
Citation preview

Published May 2015
OIE Staff:Miriam Qumsieh - Associate Director
Henok Gebrehiwot - Research Analyst IIISophia Yan - Research Analyst IIIDebra Ross - Research Analyst II
Mary Ballew - Research Analyst & Assessment CoordinatorAmi Moller - Research Assessment Associate
Office ofInstitutional Effectiveness
Graduation Trends: Fiscal Year2010 through Fiscal Year 2014
stei ns cn yo C S i myt pir lia cl itC y
UH s
sC eL n O evf if ti cc ee f fo Ef lIn as nt ioit tu

University of Houston-Clear LakeOffice of Institutional Effectiveness
Graduation Trends: Fiscal Year 2010 through Fiscal Year 2014Report Published: May 2015
- INDEX -Please click on any selection below to go directly to the corresponding page
Page #Degrees Conferred and Mean Number of Terms to Receive Degree:
Figure 1a. School of Business Sorted by CIP Code 2
Figure 1b. School of Human Sciences and Humanities Sorted by CIP Code 3
Figure 1c. School of Science and Computer Engineering Sorted by CIP Code 4
Figure 1d. School of Education Sorted by CIP Code 5
Figure 1e. UHCL Total Sorted by CIP Code 6-8
Summary of Degrees Conferred by School and by Ethnicity:Figure 2a. School of Business 9
Figure 2b. School of Human Sciences and Humanities 10
Figure 2c. School of Science and Computer Engineering 11
Figure 2d. School of Education 12-13
Figure 2e. UHCL Total 14-16
Fiscal Year 2014 Summary of Degrees Conferred by School, Gender, Degree and by Ethnicity:
Figure 3a. School of Business Sorted by CIP Code 17-18
Figure 3b. School of Human Sciences and Humanities Sorted by CIP Code 19-20
Figure 3c. School of Science and Computer Engineering Sorted by CIP Code 21-22
Figure 3d. School of Education Sorted by CIP Code 23-24
page 2 mlb; graduation trends fy10 thru fy14.xlsx
University of Houston-Clear LakeOffice of Institutional Effectiveness
Graduation Trends: Fiscal Year 2010 through Fiscal Year 2014Report Published: May 2015
Degrees Conferred and Mean Number of Terms to Receive DegreeFY 2010 FY 2011 FY 2012 FY 2013 FY 2014 FY 2010 vs.
FY 2014Level of Award CIP Code for Degree / Degree Name Number
DegreesMean # of
TermsNumber Degrees
Mean # of Terms
Number Degrees
Mean # of Terms
Number Degrees
Mean # of Terms
Number Degrees
Mean # of Terms
% Chg. for Number of Degrees
Bachelor's 22030200 Legal Studies 9 6.22 15 5.20 14 7.00 15 6.67 14 6.36 55.6309999401 Interdsicip.Studies-Hlthcare Svcs. 0 0.00 2 4.00 3 5.00 4 6.00 9 5.56 n/a45100100 Political Science 1 9.00 0 0.00 1 14.00 0 0.00 0 0.00 -100.0510701002 BS in Healthcare Admin. incl. HlthAdmPB 25 5.68 34 5.91 45 6.80 34 6.62 41 6.07 64.052010100 General Business 30 5.17 28 3.57 28 5.71 21 5.19 26 6.19 -13.3520101002 General Business PB - Online 0 0.00 0 0.00 0 0.00 0 0.00 4 5.25 55.652020100 Business Administration and Management 61 4.12 65 4.31 70 4.53 69 5.78 61 7.08 0.052029921 Environmental Management 2 4.00 8 6.63 9 4.44 9 6.67 12 5.92 500.052030100 Accounting NONDEGRGR 0 0.00 0 0.00 0 0.00 2 7.50 0 0.00 n/a520301002 BS in Accounting - includes AcctBSPB 124 5.82 142 5.80 127 5.55 125 5.66 91 6.56 -26.6520301003 BS in Professional Accounting incl. ProActBSPB 12 7.33 11 8.09 15 9.93 6 9.17 8 9.00 -33.3520301006 BS in Accounting ACCTGBSPL Pearland 0 0.00 0 0.00 1 6.00 1 8.00 9 6.11 n/a52080100 Finance 33 5.55 39 6.03 26 5.92 31 4.90 34 5.29 3.0520801004 Finance BS - Online 0 0.00 0 0.00 0 0.00 0 0.00 5 5.60 n/a52120100 Mgmt Information Systems BS 14 8.14 13 7.77 17 4.65 20 5.85 17 5.82 21.452140100 Marketing 25 4.84 29 5.17 31 4.61 15 5.33 18 6.56 -28.0Total / Mean 336 5.51 386 5.49 387 5.65 352 5.83 349 6.28 3.9
Master's 11040100 Mgmt Information Systems MS 62 7.20 63 6.78 58 5.95 38 6.53 48 7.02 -22.6510701003 MHA Healthcare Administration 22 7.23 32 6.97 42 7.95 32 7.31 27 7.96 22.7510701004 MHA-MBA Healthcare Administration 19 10.00 24 10.50 39 9.26 306 10.76 39 9.74 105.352020100 Business Administration and Management 131 7.73 150 5.74 129 5.96 138 5.86 87 7.78 -33.6520201002 Business Adm.and Mgmt. MBA Online 0 0.00 0 0.00 0 0.00 0 0.00 36 8.19 n/a52029921 Environmental Management 5 6.80 4 5.50 15 9.00 7 7.57 4 6.25 -20.0520301004 MS in Accounting 43 8.93 45 7.78 34 5.76 48 7.10 54 8.07 25.6520301005 MS in Professional Accounting 15 4.73 11 4.91 15 6.53 7 4.43 8 5.13 -46.752080100 Finance 33 6.64 22 6.55 25 6.08 27 5.74 23 7.87 -30.3520801003 Finance MS Online 0 0.00 0 0.00 0 0.00 0 0.00 2 13.00 n/a52100500 Human Resource Management 9 2.75 7 3.86 9 6.44 13 8.54 0 0.00 -11.1521005002 Human Resource Management MA Online 0 0.00 0 0.00 0 0.00 0 0.00 8 7.63 n/aTotal / Mean 339 7.51 358 6.59 366 6.69 343 6.81 336 7.96 -0.9
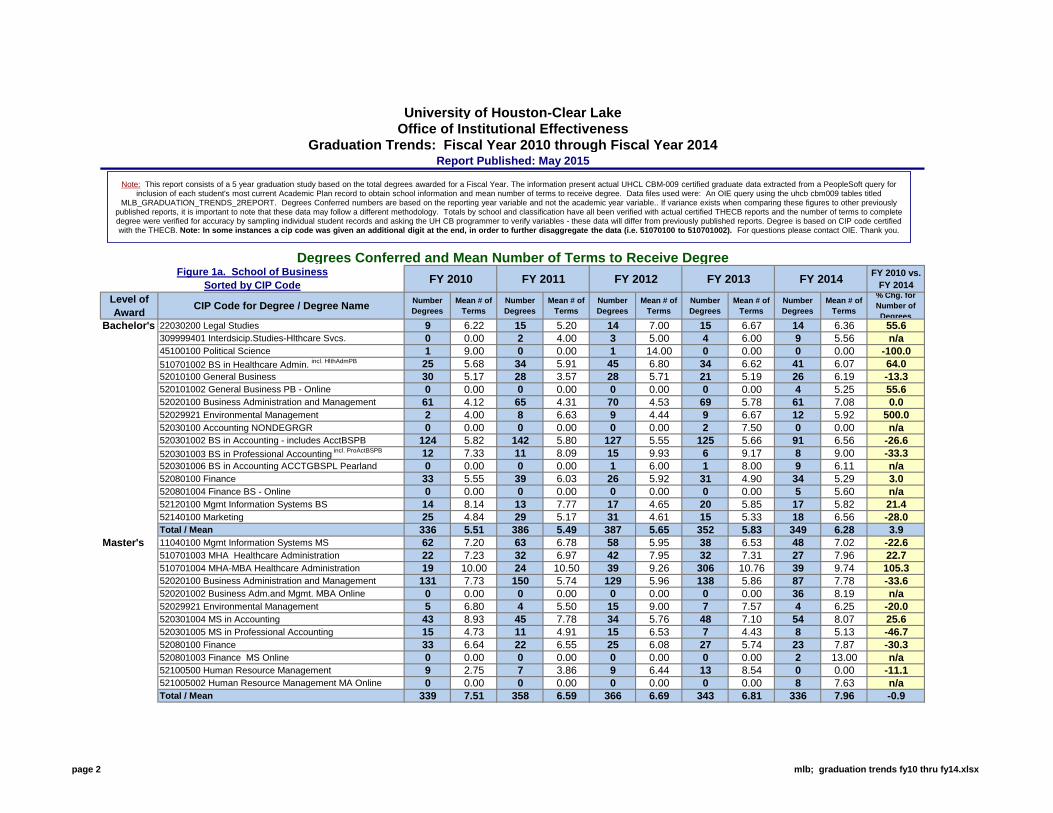
Figure 1a. School of BusinessSorted by CIP Code
Note: This report consists of a 5 year graduation study based on the total degrees awarded for a Fiscal Year. The information present actual UHCL CBM-009 certified graduate data extracted from a PeopleSoft query for inclusion of each student's most current Academic Plan record to obtain school information and mean number of terms to receive degree. Data files used were: An OIE query using the uhcb cbm009 tables titled
MLB_GRADUATION_TRENDS_2REPORT. Degrees Conferred numbers are based on the reporting year variable and not the academic year variable.. If variance exists when comparing these figures to other previously published reports, it is important to note that these data may follow a different methodology. Totals by school and classification have all been verified with actual certified THECB reports and the number of terms to complete degree were verified for accuracy by sampling individual student records and asking the UH CB programmer to verify variables - these data will differ from previously published reports. Degree is based on CIP code certified with the THECB. Note: In some instances a cip code was given an additional digit at the end, in order to further disaggregate the data (i.e. 51070100 to 510701002). For questions please contact OIE. Thank you.

page 3 mlb; graduation trends fy10 thru fy14.xlsx
FY 2010 FY 2011 FY 2012 FY 2013 FY 2010 vs. FY 2014
Level of Award CIP Code for Degree / Degree Name Number
DegreesMean # of
TermsNumber Degrees
Mean # of Terms
Number Degrees
Mean # of Terms
Number Degrees
Mean # of Terms
Number Degrees
Mean # of Terms
% Chg. for Number of Degrees
Bachelor's 05020700 Womens Studies 0 0.00 4 7.50 2 3.00 1 4.00 2 5.00 n/a09010000 Communication 29 7.97 49 6.94 43 6.09 25 6.48 30 7.67 3.423010100 Literature 32 6.47 33 5.79 30 6.07 25 6.32 29 7.10 -9.424010300 Humanities 19 7.05 27 5.48 26 5.92 24 6.38 16 6.75 -15.830170100 Behavioral Science 38 8.53 40 8.73 34 8.32 27 8.63 21 9.14 -44.7310505001 Fitness and Human Performance BS 49 6.40 55 6.69 57 7.09 62 6.73 73 6.81 49.042010100 Psychology 118 7.95 92 7.23 125 7.22 96 6.80 110 7.36 -6.8420101002 Psychology - BS Online 0 0.00 0 0.00 0 0.00 0 0.00 9 6.67 n/a44040100 Public Service Leadership 8 4.25 14 6.36 5 6.60 4 7.25 10 7.90 25.0440401002 Public Service Leadership PB - Online 0 0.00 0 0.00 0 0.00 0 0.00 3 7.67 n/a44070100 Social Work 13 8.00 18 8.28 14 6.29 13 6.23 12 7.58 -7.745020100 Anthropology 0 0.00 4 5.25 11 5.00 12 8.58 15 7.53 n/a45040100 Criminology 14 6.46 18 6.83 23 7.00 29 6.93 30 5.70 114.3450401002 Criminology BS Online 0 0.00 0 0.00 0 0.00 0 0.00 6 5..67 n/a45070100 Geography 2 1.50 7 4.00 4 6.75 6 4.50 8 4.88 300.045100100 Political Science 3 4.67 11 5.00 10 5.20 5 5.60 1 8.00 -66.745110100 Sociology 15 6.53 11 5.36 16 6.88 19 6.63 18 7.94 20.050070200 BFA in Art and Design 33 6.58 27 6.70 19 7.42 34 7.12 38 8.26 27.3500702002 BFA in Art and Design/Art EC-12 33 6.58 27 6.70 19 7.42 34 7.12 4 10.50 -87.954010100 History 52 5.73 37 5.76 54 5.74 50 6.26 45 6.02 -13.5Total / Mean 425 7.08 447 6.73 473 6.70 432 6.78 480 7.17 12.9
Master's 10010500 Digital Media Studies 12 6.92 14 8.36 15 8.33 29 8.07 22 9.86 83.323010100 Literature 23 8.48 32 7.44 21 9.67 25 11.32 21 9.76 -8.724010300 Humanities 31 11.35 18 9.83 26 11.46 23 9.30 17 11.06 -45.230170100 Behavioral Science 25 7.40 27 7.19 19 9.37 8 9.13 7 11.86 -72.0302301001 Cross-Cultural Studies 11 8.91 11 7.36 6 6.00 14 7.86 8 7.88 -27.3310505002 Exercise and Health Sciences MS 7 7.86 12 6.33 18 5.78 23 6.65 19 6.68 171.442010100 Psychology 24 11.75 32 7.88 29 8.69 28 9.29 20 9.55 -16.7422801001 Clinical Psychology - f10 new cip 17 9.59 16 9.69 14 7.29 23 7.87 19 8.16 11.8422801002 Behavior Analysis 6 5.17 5 8.00 13 8.23 8 9.00 9 8.67 50.042280400 Industrial Organizational Psychology 0 0.00 0 0.00 10 1.40 16 4.13 25 6.72 n/a42280500 School Psychology SSP 9 9.78 10 10.20 11 8.82 12 9.92 12 9.58 33.345040100 Criminology 26 8.27 21 8.24 24 7.50 25 7.72 19 8.16 -26.945110100 Sociology 5 8.60 6 8.33 9 10.33 5 9.20 14 7.50 180.051150500 Family Therapy 18 8.72 12 9.92 17 8.35 26 8.35 19 7.16 5.654010100 History 12 13.00 8 13.50 7 8.00 8 8.88 11 10.27 -8.3Total / Mean 226 9.31 224 8.40 239 8.31 273 8.40 242 8.67 7.1
FY 2014
Degrees Conferred and Mean Number of Terms to Receive DegreeFigure 1b. School of Human Sciences and Humanities
Sorted by CIP Code

page 4 mlb; graduation trends fy10 thru fy14.xlsx
FY 2010 FY 2011 FY 2012 FY 2013 FY 2010 vs. FY 2014
Level of Award CIP Code for Degree / Degree Name Number
DegreesMean # of
TermsNumber Degrees
Mean # of Terms
Number Degrees
Mean # of Terms
Number Degrees
Mean # of Terms
Number Degrees
Mean # of Terms
% Chg. for Number of Degrees
Bachelor's 03010400 Environmental Science 13 7.62 10 8.30 15 7.00 12 7.25 17 7.76 30.811010100 Computer Information Systems 16 7.56 20 8.45 16 10.00 16 8.81 12 9.25 -25.011070100 Computer Science 5 8.80 11 7.18 11 7.36 13 8.85 11 9.00 120.0140901002 Computer Engineering 10 5.60 12 5.83 13 6.77 7 11.57 10 8.40 0.026010100 Biology 50 7.24 50 7.40 42 7.76 49 7.57 40 7.98 -20.027010100 Mathematical Sciences 26 7.38 28 7.25 22 6.32 32 6.59 21 6.95 -19.2309999405 Interdiscip Studies-Information Tech BAS 0 0.00 0 0.00 3 4.67 7 6.43 23 6.48 n/a40050100 Chemistry 4 7.50 7 9.00 12 7.58 6 5.67 7 13.14 75.040080100 Physics 2 8.00 1 4.00 0 0.00 5 7.00 5 6.00 150.0
Master's Total / Mean 126 7.30 139 7.49 134 7.49 147 7.62 146 7.96 15.903010400 Environmental Science 12 9.25 11 8.55 17 6.71 25 7.83 28 8.21 133.3030104002 Environmental Science MS Online 0 0.00 0 0.00 0 0.00 0 0.00 2 2.50 n/a11010100 Computer Information Systems 20 8.25 12 6.50 14 6.50 5 10.00 5 7.80 -75.011070100 Computer Science 58 6.74 74 6.15 100 5.07 103 5.68 71 5.76 22.4140901003 Computer Engineering 27 6.52 35 6.14 32 4.72 43 5.51 36 5.22 33.314090300 Computer Software Engineering 12 8.00 18 8.83 10 6.20 43 5.65 38 4.08 216.7140903002 Computer Software Engineering MS Online 0 0.00 0 0.00 0 0.00 0 0.00 5 9.20 n/a14270100 Systems Engineering MS 6 5.00 13 9.62 11 7.36 8 9.00 9 7.33 50.015150100 Engineering Management 14 5.86 12 5.42 26 5.50 21 5.86 31 6.71 121.4151501006 Engineering Management MS Online 0 0.00 0 0.00 0 0.00 0 0.00 6 8.33 n/a26010100 Biology 12 8.92 9 5.00 13 5.69 23 5.61 15 6.53 25.026120100 Biotechnology 34 6.44 65 5.97 40 5.38 40 5.70 20 5.90 -41.227010100 Mathematical Sciences 2 8.00 7 7.71 6 11.33 3 10.00 5 8.40 150.027050100 Statistics 7 9.57 4 8.75 2 5.00 2 7.00 6 6.00 -14.340050100 Chemistry 9 8.33 5 7.80 6 7.83 12 5.92 25 5.24 177.840080100 Physics 13 7.92 5 9.20 3 12.67 3 8.00 3 10.67 -76.952029921 Environmental Management 0 0.00 0 0.00 1 16.00 0 0.00 0 0.00 n/aTotal / Mean 226 7.25 270 6.66 281 5.75 331 6.04 305 6.08 35.0
FY 2014
Degrees Conferred and Mean Number of Terms to Receive DegreeFigure 1c. School of Science and Computer Engineering
Sorted by CIP Code
For Mean Number of Terms (to Receive Degree): The CBM009 Extract obtains the Completion terms from the Academic Degree table where the confer date is between the current and previous fiscal year and obtains the Required term from the most recent Academic Program up to the completion term. It then counts the number of terms between the required term and the completion term.
Note that the 1st term the student entered the institution is the term chosen, regardless if the student dropped out for a term or more.

page 5 mlb; graduation trends fy10 thru fy14.xlsx
FY 2010 FY 2011 FY 2012 FY 2013 FY 2014 FY 2010 vs. FY 2014
Level of Award CIP Code for Degree / Degree Name Number
DegreesMean # of
TermsNumber Degrees
Mean # of Terms
Number Degrees
Mean # of Terms
Number Degrees
Mean # of Terms
Number Degrees
Mean # of Terms
% Chg. for Number of Degrees
Bachelor's 30999901 Interdsicip.Studies 237 6.83 223 7.67 251 8.33 258 8.50 275 8.23 16.0309999402 Interdsicip.Studies Early Childhood Prg Leadership BAS 0 0.00 2 3.00 3 5.33 7 7.71 4 7.75 n/a309999403 Interdsicip.Studies Educator of Young Children BAS 0 0.00 0 0.00 3 5.00 6 7.17 0 0.00 n/a309999404 Interdisciplinary Studies-Young Children w Disab 0 0.00 0 0.00 0 0.00 1 7.00 1 6.00 n/aTotal / Mean 237 6.83 225 7.63 257 8.26 272 8.45 280 8.22 18.1
Master's 13030100 Curriculum and Instruction 29 6.24 20 6.10 16 6.50 10 7.70 13 8.77 -55.213040100 Educational Management 115 8.33 74 8.64 54 8.28 59 4.78 59 5.81 -48.713050100 Instructional Design and Technology 23 9.39 23 6.87 13 9.38 21 7.90 4 12.50 -82.6130501002 Instructional Design and Technology MS Online 0 0.00 0 0.00 0 0.00 0 0.00 15 10.93 n/a13110100 Counseling 22 9.64 55 9.33 38 8.34 37 9.03 46 9.22 109.113121000 Early Childhood Education 14 9.36 16 8.50 14 6.93 20 8.90 21 8.14 50.013131500 Reading 11 7.45 11 9.18 7 9.14 7 9.57 3 9.00 -72.725010100 School Library and Information Science 32 9.06 42 7.88 30 7.53 8 8.63 5 13.40 -84.4302301002 Multicultural Studies in Education 3 7.67 3 13.00 1 7.00 5 9.60 5 10.00 66.7Total / Mean 249 8.41 244 8.36 173 8.00 167 7.31 171 8.25 -31.3
Doctoral 130401002 Educational Management - Doctoral Only 3 4.33 9 4.56 15 7.67 15 11.13 9 11.78 200.0Total / Mean 3 4.33 9 4.56 15 7.67 15 11.13 9 11.78 200.0
Degrees Conferred and Mean Number of Terms to Receive DegreeFigure 1d. School of Education
Sorted by CIP Code
For Mean Number of Terms (to Receive Degree): The CBM009 Extract obtains the Completion terms from the Academic Degree table where the confer date is between the current and previous fiscal year and obtains the Required term from the most recent Academic Program up to the completion term. It then counts the number of terms between the required term and the completion term.
Note that the 1st term the student entered the institution is the term chosen, regardless if the student dropped out for a term or more.

page 6 mlb; graduation trends fy10 thru fy14.xlsx
FY 2010 FY 2011 FY 2012 FY 2013 FY 2009 vs. FY 2013
Level of Award CIP Code for Degree / Degree Name Number
DegreesMean # of
TermsNumber Degrees
Mean # of Terms
Number Degrees
Mean # of Terms
Number Degrees
Mean # of Terms
Number Degrees
Mean # of Terms
% Chg. for Number of Degrees
Bachelor's 03010400 Environmental Science 13 7.62 10 8.30 15 7.00 12 7.25 17 7.76 30.805020700 Womens Studies 0 0.00 4 7.50 2 3.00 1 4.00 2 5.00 n/a09010000 Communication 29 7.97 49 6.94 43 6.09 25 6.48 30 7.63 3.411010100 Computer Information Systems 16 7.56 20 8.45 16 10.00 16 8.81 12 9.25 -25.011070100 Computer Science 5 8.80 11 7.18 11 7.36 13 8.85 11 9.00 120.0140901002 Computer Engineering 10 5.60 12 5.83 13 6.77 7 11.57 10 8.40 0.022030200 Legal Studies 9 6.22 15 5.20 14 7.00 15 6.67 14 6.36 55.623010100 Literature 32 6.47 33 5.79 30 6.07 25 6.32 29 7.10 -9.424010300 Humanities 19 7.05 27 5.48 26 5.92 24 6.38 16 6.75 -15.826010100 Biology 50 7.24 50 7.40 42 7.76 49 7.57 40 7.98 -20.027010100 Mathematical Sciences 26 7.38 28 7.25 22 6.32 32 6.59 21 6.95 -19.230170100 Behavioral Science 38 8.53 40 8.73 34 8.32 27 8.63 21 9.14 -44.730999901 Interdsicip.Studies 237 6.83 223 7.67 251 8.33 258 8.50 275 8.23 16.0309999401 Interdsicip.Studies Healthcare Services BAS 0 0.00 2 4.00 3 5.00 4 6.00 9 5.56 n/a309999402 Interdsicip.Studies Erly Chldhd Prg Ldrship BAS 0 0.00 2 3.00 3 5.33 7 7.71 4 7.75 n/a309999403 Interdsicip.Studies Educator of Young Children BAS 0 0.00 0 0.00 3 5.00 6 7.17 0 0.00 n/a309999404 Interdisciplinary Studies-Young Children w Disab 0 0.00 0 0.00 0 0.00 1 7.00 1 6.00 n/a309999405 Interdsicip.Studies-Info. Tech BAS 0 0.00 0 0.00 3 4.67 7 6.43 23 6.48 n/a310505001 Fitness and Human Performance BS 49 6.40 55 6.69 57 7.09 62 6.73 73 6.81 49.040010100 Physical Sciences 0 0.00 0 0.00 0 0.00 0 0.00 0 0.00 n/a40050100 Chemistry 4 7.50 7 9.00 12 7.58 6 5.67 7 13.14 75.040080100 Physics 2 8.00 1 4.00 0 0.00 5 7.00 5 6.00 150.042010100 Psychology 118 7.95 92 7.23 125 7.22 96 6.80 110 7.36 -6.8420101002 Psychology BS Online 0 0.00 0 0.00 0 0.00 0 0.00 9 6.67 n/a44040100 Public Service Leadership 8 4.25 14 6.36 5 6.60 4 7.25 10 7.90 25.0440401002 Public Service Leadership PB - Onlline 0 0.00 0 0.00 0 0.00 0 0.00 3 7.67 n/a44070100 Social Work 13 8.00 18 8.28 14 6.29 13 6.23 12 7.58 -7.745020100 Anthropology 0 0.00 4 5.25 11 5.00 12 8.58 15 7.53 n/a45040100 Criminology 14 6.46 18 6.83 23 7.00 29 6.93 30 5.70 114.3450401002 Criminology Online 0 0.00 0 0.00 0 0.00 0 0.00 6 5.67 n/a45070100 Geography 2 1.50 7 4.00 4 6.75 6 4.50 8 4.88 300.045100100 Political Science 4 5.75 11 5.00 11 6.00 5 5.60 1 8.00 -75.045110100 Sociology 15 6.53 11 5.36 16 6.88 19 6.63 18 7.94 20.0500702001 BFA in Art and Design 33 6.58 27 6.70 19 7.42 34 7.12 38 8.26 15.2500702002 BFA in Art and Design/ART EC-12 0 0.00 0 0.00 0 0.00 0 0.00 4 10.50 n/a510701002 BS in Healthcare Admin. incl. HlthAdmPB 25 5.68 34 5.91 45 6.80 34 6.62 41 6.07 64.052010100 General Business 30 5.17 28 3.57 28 5.71 21 5.19 26 6.19 -13.3520101002 General Business PB Online 0 0.00 0 0.00 0 0.00 0 0.00 4 5.25 n/a52020100 Business Administration and Management 61 4.12 65 4.31 70 4.53 69 5.78 60 7.15 -1.652029921 Environmental Management 2 4.00 8 6.63 9 4.44 9 6.67 12 5.92 500.052030100 Accounting NONDEGRGR 0 0.00 0 0.00 0 0.00 2 7.50 0 0.00 n/a520301002 BS in Accounting - includes AcctBSPB 124 5.82 142 5.80 127 5.55 125 5.66 90 6.57 -27.4520301003 BS in Professional Accounting incl. ProActBSPB 12 7.33 11 8.09 15 9.93 6 9.17 8 9.00 -33.3520301006 BS in Accounting ACCTGBSPL Pearland 0 0.00 0 0.00 1 6.00 1 8.00 9 6.11 n/a52080100 Finance 33 5.55 39 6.03 26 5.92 31 4.90 34 5.29 3.0520801004 Finance BS Online 0 0.00 0 0.00 0 0.00 0 0.00 5 5.60 n/a52120100 Mgmt Information Systems BS 14 8.14 13 7.77 17 4.65 20 5.85 17 5.82 21.452140100 Marketing 25 4.84 29 5.17 31 4.61 15 5.33 18 6.56 -28.054010100 History 52 5.73 37 5.76 54 5.74 50 6.26 45 6.02 -13.5Total / Mean 1,124 6.58 1,197 6.59 1,251 6.78 1,203 6.98 1,255 7.27 11.7
FY 2014Figure 1e. UHCL Total Sorted by CIP Code
Degrees Conferred and Mean Number of Terms to Receive Degree

page 7 mlb; graduation trends fy10 thru fy14.xlsx
Degrees Conferred and Mean Number of Terms to Receive DegreeFY 2010 FY 2011 FY 2012 FY 2013 FY 2009 vs.
FY 2013Level of Award CIP Code for Degree / Degree Name Number
DegreesMean # of
TermsNumber Degrees
Mean # of Terms
Number Degrees
Mean # of Terms
Number Degrees
Mean # of Terms
Number Degrees
Mean # of Terms
% Chg. for Number of Degrees
Master's 03010400 Environmental Science 12 9.25 11 8.55 17 6.71 25 7.76 28 8.21 133.3030104002 Environmental Science MS Online 0 0.00 0 0.00 0 0.00 0 0.00 2 2.50 n/a10010500 Digital Media Studies 12 6.92 14 8.36 15 8.33 29 8.07 22 9.86 83.311010100 Computer Information Systems 20 8.25 12 6.50 14 6.50 5 10.00 5 7.80 -75.011040100 Mgmt Information Systems MS 62 7.20 63 6.78 58 5.95 38 6.53 48 7.02 -22.611070100 Computer Science 58 6.74 74 6.15 100 5.07 103 5.68 71 5.76 22.413030100 Curriculum and Instruction 29 6.24 20 6.10 16 6.50 10 7.70 13 8.77 -55.213040100 Educational Management 115 8.33 74 8.64 54 8.28 59 4.78 59 5.81 -48.713050100 Instructional Design and Technology 23 9.39 23 6.87 13 9.38 21 7.90 4 12.50 -82.6130501002 Instructional Design and Technology MS Online 0 0.00 0 0.00 0 0.00 0 0.00 15 10.93 n/a13110100 Counseling 22 9.64 55 9.33 38 8.34 37 9.03 46 9.22 109.113121000 Early Childhood Education 14 9.36 16 8.50 14 6.93 20 8.90 21 8.14 50.013131500 Reading 11 7.45 11 9.18 7 9.14 7 9.57 3 9.00 -72.7140901003 Computer Engineering 27 6.52 35 6.14 32 4.72 43 5.51 36 5.22 33.314090300 Computer Software Engineering 12 8.00 18 8.83 10 6.20 43 5.65 38 4.08 216.7140903002 Computer Software Engineering MS Online 0 0.00 0 0.00 0 0.00 0 0.00 5 9.20 n/a14270100 Systems Engineering MS 6 5.00 13 9.62 11 7.36 8 9.00 9 7.33 50.015150100 Engineering Management 14 5.86 12 5.42 26 5.50 21 5.86 31 6.71 121.4151501006 Engineering Management MS Online 0 0.00 0 0.00 0 0.00 0 0.00 6 8.33 n/a23010100 Literature 23 8.48 32 7.44 21 9.67 25 11.32 21 9.76 -8.724010300 Humanities 31 11.35 18 9.83 26 11.46 23 9.30 17 11.06 -45.225010100 School Library and Information Science 32 9.06 42 7.88 30 7.53 8 8.63 5 13.40 -84.426010100 Biological Science 12 8.92 9 5.00 13 5.69 23 5.61 15 6.53 25.026120100 Biotechnology 34 6.44 65 5.97 40 5.38 40 5.70 20 5.90 -41.227010100 Mathematical Sciences 2 8.00 7 7.71 6 11.33 3 10.00 5 8.40 150.027050100 Statistics 7 9.57 4 8.75 2 5.00 2 7.00 6 6.00 -14.330170100 Behavioral Science 25 7.40 27 7.19 19 9.37 8 9.13 7 11.86 -72.0302301001 Cross-Cultural Studies 11 8.91 11 7.36 6 6.00 14 7.86 8 7.88 -27.3302301002 Multicultural Studies in Education 3 7.67 3 13.00 1 7.00 5 9.60 5 10.00 66.730999902 Studies of the Future 0 0.00 0 0.00 0 0.00 0 0.00 0 0.00 n/a310505002 Exercise and Health Sciences 7 7.86 12 6.33 18 5.78 23 6.65 19 6.68 171.440010100 Physical Sciences 0 0.00 0 0.00 0 0.00 0 0.00 0 0.00 n/a40050100 Chemistry 9 8.33 5 7.80 6 7.83 12 5.92 25 5.24 177.840080100 Physics 13 7.92 5 9.20 3 12.67 3 8.00 3 10.67 -76.942010100 Psychology 24 11.75 32 7.88 29 8.69 28 9.29 20 9.55 -16.7422801001 Clinical Psychology f10 new cip 17 9.59 16 9.69 14 7.29 23 7.87 19 8.16 11.8422801002 Behavior Analysis 6 5.17 5 8.00 13 8.23 8 9.00 9 8.67 50.0422804001 Industrial Organizational Psychology 0 0.00 0 0.00 10 1.40 16 4.13 25 6.72 n/a42280500 School Psychology SSP 9 9.78 10 10.20 11 8.82 12 9.92 12 9.58 33.345040100 Criminology 26 8.27 21 8.24 24 7.50 25 7.72 19 8.16 -26.945110100 Sociology 5 8.60 6 8.33 9 10.33 5 9.20 14 7.50 180.0510701003 MHA Healthcare Administration 22 7.23 32 6.97 42 7.95 32 7.31 27 7.96 22.7510701004 MHA-MBA Healthcare Administration 19 10.00 24 10.50 39 9.26 33 10.76 39 9.74 105.351150500 Family Therapy 18 8.72 12 9.92 17 8.35 26 8.35 19 7.16 5.652020100 Business Admin. and Management 131 7.73 150 5.74 129 5.96 138 5.86 87 7.78 -33.6520201002 Business Admin. and Management MBA Online 0 0.00 0 0.00 0 0.00 0 0.00 36 8.19 n/a52029921 Environmental Management 5 6.80 4 5.50 16 9.44 7 7.57 4 6.25 -20.0
FY 2014Figure 1e. UHCL Total Sorted by CIP Code

page 8 mlb; graduation trends fy10 thru fy14.xlsx
Degrees Conferred and Mean Number of Terms to Receive DegreeFY 2010 FY 2011 FY 2012 FY 2013 FY 2009 vs.
FY 2013Level of Award CIP Code for Degree / Degree Name Number
DegreesMean # of
TermsNumber Degrees
Mean # of Terms
Number Degrees
Mean # of Terms
Number Degrees
Mean # of Terms
Number Degrees
Mean # of Terms
% Chg. for Number of Degrees
Master's 52030100 Accounting NONDEGRGR 0 0.00 0 0.00 0 0.00 0 0.00 0 0.00 n/a520301004 MS in Accounting 43 8.93 45 7.78 34 5.76 48 7.10 54 8.07 25.6520301005 MS in Professional Accounting 15 4.73 11 4.91 15 6.53 7 4.43 8 5.12 -46.7
cont'd 52080100 Finance 33 6.64 22 6.55 25 6.08 27 5.74 23 7.87 -30.3520801003 Finance - MS Oline 0 0.00 0 0.00 0 0.00 0 0.00 2 13.00 n/a52100500 Human Resource Management 9 2.75 7 3.86 9 6.44 13 8.54 0 0.00 -100.0521005002 Human Resource Management MA Online 0 0.00 0 0.00 0 0.00 0 0.00 8 7.63 n/a
Doctoral 54010100 History 12 13.00 8 13.50 7 8.00 8 8.88 11 10.27 -8.3Total / Mean 1,040 8.06 1,096 7.37 1,059 7.02 1,114 7.05 1,054 7.62 1.3130401002 Educational Management - Doctoral Only 3 4.33 9 4.56 15 7.67 15 11.13 9 11.78 200.0Total / Mean 3 4.33 9 4.56 15 7.67 15 11.13 9 11.78 200.0
FY 2010 FY 2011 FY 2012 FY 2013 FY 20142,167 2,302 2,325 2,332 2,318
Total UHCL Degrees Conferred
Figure 1e. UHCL Total Sorted by CIP Code FY 2014
For Mean Number of Terms (to Receive Degree): The CBM009 Extract obtains the Completion terms from the Academic Degree table where the confer date is between the current and previous fiscal year and obtains the Required term from the most recent Academic Program up to the completion term. It then counts the number of terms between the required term and the completion term.
Note that the 1st term the student entered the institution is the term chosen, regardless if the student dropped out for a term or more.

page 9 mlb; graduation trends fy10 thru fy14.xlsx
University of Houston-Clear LakeOffice of Institutional Effectiveness
Graduation Trends: Fiscal Year 2010 through Fiscal Year 2014Report Published: May 2015
Summary of Degrees Conferred by School and by Ethnicity
FY 2010 FY 2011 FY 2012 FY 2013 FY 2014 FY 2010 vs. FY 2014
Ethnicity Number Degrees
Number Degrees Percent
Number Degrees
Number Degrees Percent
Number Degrees
Number Degrees Percent
Number Degrees
Number Degrees Percent
Number Degrees
Number Degrees Percent
% Chg. for Number of Degrees
Bachelor's White 192 57.1 184 47.7 194 50.1 179 50.9 157 45.0 -18.2Black 21 6.3 21 5.4 26 6.7 23 6.5 30 8.6 42.9Hispanic 62 18.5 101 26.2 107 27.6 104 29.5 110 31.5 77.4Asian 38 11.3 50 13.0 40 10.3 32 9.1 35 10.0 -7.9Am. Indian 1 0.3 0 0.0 1 0.3 1 0.3 1 0.3 0.0International 16 4.8 20 5.2 12 3.1 13 3.7 13 3.7 -18.8Unknown 0 0.0 5 1.3 2 0.5 0 0.0 3 0.9 n/aNative Hawaiian 0 0.0 1 0.3 1 0.3 0 0.0 0 0.0 n/aMulti-racial 6 1.8 4 1.0 4 1.0 0 0.0 0 0.0 -100.0Total 336 100.0 386 100.0 387 100.0 352 100.0 349 100.0 3.9
Master's White 120 35.4 126 35.2 137 37.4 127 37.2 115 34.2 -4.2Black 29 8.6 33 9.2 22 6.0 15 4.4 16 4.8 -44.8Hispanic 29 8.6 26 7.3 28 7.7 35 10.2 31 9.2 6.9Asian 32 9.4 40 11.2 52 14.2 51 14.8 56 16.7 75.0Am. Indian 1 0.3 1 0.3 0 0.0 0 0.0 0 0.0 -100.0International 124 36.6 130 36.3 121 33.1 115 33.4 115 34.2 -7.3Unknown 2 0.6 2 0.6 2 0.5 0 0.0 3 0.9 50.0Native Hawaiian 0 0.0 0 0.0 0 0.0 0 0.0 0 0.0 n/aMulti-racial 2 0.6 0 0.0 4 1.1 0 0.0 0 0.0 -100.0Total 339 100.0 358 100.0 366 100.0 343 100.0 336 100.0 -0.9
Total White 312 46.2 310 41.7 331 44.0 306 44.1 270 39.4 -13.5Black 50 7.4 54 7.3 48 6.4 38 5.5 46 6.7 -8.0Hispanic 91 13.5 127 17.1 135 17.9 139 20.0 141 20.6 54.9Asian 70 10.4 90 12.1 92 12.2 83 11.9 91 13.3 30.0Am. Indian 2 0.3 1 0.1 1 0.1 1 0.1 1 0.1 -50.0International 140 20.7 150 20.2 133 17.7 128 18.4 128 18.7 -8.6Unknown 2 0.3 7 0.9 4 0.5 0 0.0 6 0.9 200.0Native Hawaiian 0 0.0 1 0.1 1 0.1 0 0.0 0 0.0 n/aMulti-racial 8 1.2 4 0.5 8 1.1 0 0.0 0 0.0 -100.0Total 675 100.0 744 100.0 753 100.0 695 100.0 685 100.0 1.5
Figure 2a. School of Business

page 10 mlb; graduation trends fy10 thru fy14.xlsx
Summary of Degrees Conferred by School and by Ethnicity
Figure 2b. School of Human Sciences and
HumanitiesFY 2010 FY 2011 FY 2012 FY 2013 FY 2014 FY 2010 vs. FY
2014
Ethnicity Number Degrees
Number Degrees Percent
Number Degrees
Number Degrees Percent
Number Degrees
Number Degrees Percent
Number Degrees
Number Degrees Percent
Number Degrees
Number Degrees Percent
% Chg. for Number of Degrees
Bachelor's White 262 61.6 250 55.9 279 59.0 257 59.5 274 57.1 4.6Black 35 8.2 47 10.5 46 9.7 42 9.7 39 8.1 11.4Hispanic 107 25.2 116 26.0 112 23.7 111 25.7 138 28.8 29.0Asian 7 1.6 11 2.5 16 3.4 16 3.7 18 3.8 157.1Am. Indian 3 0.7 5 1.1 2 0.4 0 0.0 4 0.8 33.3International 2 0.5 3 0.7 6 1.3 2 0.5 3 0.6 50.0Unknown 2 0.5 3 0.7 4 0.8 4 0.9 4 0.8 100.0Native Hawaiian 2 0.5 3 0.7 0 0.0 0 0.0 0 0.0 -100.0Multi-racial 5 1.2 9 2.0 8 1.7 0 0.0 0 0.0 -100.0Total 425 100.0 447 100.0 473 100.0 432 100.0 480 100.0 12.9
Master's White 131 58.0 126 56.3 140 58.6 158 57.9 114 47.1 -13.0Black 35 15.5 33 14.7 33 13.8 36 13.2 53 21.9 51.4Hispanic 40 17.7 41 18.3 40 16.7 50 18.3 50 20.7 25.0Asian 10 4.4 8 3.6 11 4.6 16 5.9 14 5.8 40.0Am. Indian 1 0.4 1 0.4 2 0.8 1 0.4 2 0.8 100.0International 3 1.3 4 1.8 6 2.5 9 3.3 9 3.7 200.0Unknown 1 0.4 3 1.3 2 0.8 3 1.1 0 0.0 -100.0Native Hawaiian 1 0.4 2 0.9 0 0.0 0 0.0 0 0.0 -100.0Multi-racial 4 1.8 6 2.7 5 2.1 0 0.0 0 0.0 -100.0Total 226 100.0 224 100.0 239 100.0 273 100.0 242 100.0 7.1
Total White 393 60.4 376 56.0 419 58.8 415 58.9 388 53.7 -1.3Black 70 10.8 80 11.9 79 11.1 78 11.1 92 12.7 31.4Hispanic 147 22.6 157 23.4 152 21.3 161 22.8 188 26.0 27.9Asian 17 2.6 19 2.8 27 3.8 32 4.5 32 4.4 88.2Am. Indian 4 0.6 6 0.9 4 0.6 1 0.1 6 0.8 50.0International 5 0.8 7 1.0 12 1.7 11 1.6 12 1.7 140.0Unknown 3 0.5 6 0.9 6 0.8 7 1.0 4 0.6 33.3Native Hawaiian 3 0.5 5 0.7 0 0.0 0 0.0 0 0.0 -100.0Multi-racial 9 1.4 15 2.2 13 1.8 0 0.0 0 0.0 -100.0Total 651 100.0 671 100.0 712 100.0 705 100.0 722 100.0 10.9

page 11 mlb; graduation trends fy10 thru fy14.xlsx
Summary of Degrees Conferred by School and by Ethnicity
Figure 2c. School of Science and Computer
EngineeringFY 2010 FY 2011 FY 2012 FY 2013 FY 2014 FY 2010 vs. FY
2014
Ethnicity Number Degrees
Number Degrees Percent
Number Degrees
Number Degrees Percent
Number Degrees
Number Degrees Percent
Number Degrees
Number Degrees Percent
Number Degrees
Number Degrees Percent
% Chg. for Number of Degrees
Bachelor's White 64 50.8 84 60.4 75 56.0 79 53.7 78 53.4 21.9Black 6 4.8 6 4.3 7 5.2 7 4.8 6 4.1 0.0Hispanic 32 25.4 24 17.3 25 18.7 35 23.8 42 28.8 31.3Asian 11 8.7 17 12.2 17 12.7 16 10.9 11 7.5 0.0Am. Indian 0 0.0 1 0.7 0 0.0 1 0.7 2 1.4 n/aInternational 8 6.3 2 1.4 6 4.5 9 6.1 5 3.4 -37.5Unknown 1 0.8 1 0.7 0 0.0 0 0.0 2 1.4 100.0Native Hawaiian 0 0.0 0 0.0 2 1.5 0 0.0 0 0.0 n/aMulti-racial 4 3.2 4 2.9 2 1.5 0 0.0 0 0.0 -100.0Total 126 100.0 139 100.0 134 100.0 147 100.0 146 100.0 15.9
Master's White 39 17.3 47 17.4 45 16.0 56 16.7 41 13.4 5.1Black 14 6.2 12 4.4 11 3.9 10 3.0 17 5.6 21.4Hispanic 9 4.0 11 4.1 9 3.2 4 1.2 13 4.3 44.4Asian 5 2.2 11 4.1 9 3.2 19 5.8 10 3.3 100.0Am. Indian 0 0.0 1 0.4 0 0.0 0 0.0 1 0.3 n/aInternational 157 69.5 184 68.1 206 73.3 242 73.3 222 72.8 41.4Unknown 1 0.4 2 0.7 1 0.4 0 0.0 1 0.3 0.0Native Hawaiian 1 0.4 0 0.0 0 0.0 0 0.0 0 0.0 -100.0Multi-racial 0 0.0 2 0.7 0 0.0 0 0.0 0 0.0 n/a
Total Total 226 100.0 270 100.0 281 100.0 331 100.0 305 100.0 35.0White 103 29.3 131 32.0 120 28.9 134 28.1 119 26.4 15.5Black 20 5.7 18 4.4 18 4.3 17 3.6 23 5.1 15.0Hispanic 41 11.6 35 8.6 34 8.2 39 8.2 55 12.2 34.1Asian 16 4.5 28 6.8 26 6.3 35 7.3 21 4.7 31.3Am. Indian 0 0.0 2 0.5 0 0.0 1 0.2 3 0.7 n/aInternational 165 46.9 186 45.5 212 51.1 251 52.6 227 50.3 37.6Unknown 2 0.6 3 0.7 1 0.2 0 0.0 3 0.7 50.0Native Hawaiian 1 0.3 0 0.0 2 0.5 0 0.0 0 0.0 -100.0Multi-racial 4 1.1 6 1.5 2 0.5 0 0.0 0 0.0 -100.0Total 352 100.0 409 100.0 415 100.0 477 100.0 451 100.0 28.1

page 12 mlb; graduation trends fy10 thru fy14.xlsx
Summary of Degrees Conferred by School and by Ethnicity
Figure 2d. School of Education
FY 2010 FY 2011 FY 2012 FY 2013 FY 2014 FY 2010 vs. FY 2014
Ethnicity Number Degrees
Number Degrees Percent
Number Degrees
Number Degrees Percent
Number Degrees
Number Degrees Percent
Number Degrees
Number Degrees Percent
Number Degrees
Number Degrees Percent
% Chg. for Number of Degrees
Bachelor's White 147 62.0 123 54.7 155 60.3 145 53.3 136 48.6 -7.5Black 5 2.1 4 1.8 7 2.7 21 7.7 17 6.1 240.0Hispanic 79 33.3 92 40.9 87 33.9 101 37.1 115 41.1 45.6Asian 4 1.7 4 1.8 2 0.8 3 1.1 10 3.6 150.0Am. Indian 1 0.4 0 0.0 2 0.8 0 0.0 1 0.4 0.0International 1 0.4 0 0.0 0 0.0 1 0.4 0 0.0 -100.0Unknown 0 0.0 0 0.0 1 0.4 1 0.4 1 0.4 n/aNative Hawaiian 0 0.0 0 0.0 0 0.0 0 0.0 0 0.0 n/aMulti-racial 0 0.0 2 0.9 3 1.2 0 0.0 0 0.0 n/aTotal 237 100.0 225 100.0 257 100.0 272 100.0 280 100.0 18.1
Master's White 130 52.2 128 52.5 96 55.5 81 48.5 92 53.8 -29.2Black 53 21.3 42 17.2 37 21.4 29 17.4 32 18.7 -39.6Hispanic 57 22.9 54 22.1 25 14.5 41 24.6 30 17.5 -47.4Asian 2 0.8 13 5.3 8 4.6 9 5.4 10 5.8 400.0Am. Indian 1 0.4 0 0.0 1 0.6 0 0.0 0 0.0 -100.0International 6 2.4 2 0.8 5 2.9 6 3.6 2 1.2 -66.7Unknown 0 0.0 1 0.4 1 0.6 1 0.6 5 2.9 n/aNative Hawaiian 0 0.0 0 0.0 0 0.0 0 0.0 0 0.0 n/aMulti-racial 0 0.0 4 1.6 0 0.0 0 0.0 0 0.0 n/aTotal 249 100.0 244 100.0 173 100.0 167 100.0 171 100.0 -31.3
Doctoral White 3 100.0 6 66.7 11 73.3 11 73.3 5 55.6 66.7Black 0 0.0 2 22.2 2 13.3 0 0.0 3 33.3 n/aHispanic 0 0.0 0 0.0 2 13.3 4 26.7 1 11.1 n/aAsian 0 0.0 0 0.0 0 0.0 0 0.0 0 0.0 n/aAm. Indian 0 0.0 1 11.1 0 0.0 0 0.0 0 0.0 n/aInternational 0 0.0 0 0.0 0 0.0 0 0.0 0 0.0 n/aUnknown 0 0.0 0 0.0 0 0.0 0 0.0 0 0.0 n/aNative Hawaiian 0 0.0 0 0.0 0 0.0 0 0.0 0 0.0 n/aMulti-racial 0 0.0 0 0.0 0 0.0 0 0.0 0 0.0 n/aTotal 3 100.0 9 100.0 15 100.0 15 100.0 9 100.0 200.0

page 13 mlb; graduation trends fy10 thru fy14.xlsx
Summary of Degrees Conferred by School and by Ethnicity
Figure 2d. School of Education
FY 2010 FY 2011 FY 2012 FY 2013 FY 2014 FY 2010 vs. FY 2014
Ethnicity Number Degrees
Number Degrees Percent
Number Degrees
Number Degrees Percent
Number Degrees
Number Degrees Percent
Number Degrees
Number Degrees Percent
Number Degrees
Number Degrees Percent
% Chg. for Number of Degrees
Total White 280 57.3 257 53.8 262 58.9 237 52.2 233 50.7 -16.8Black 58 11.9 48 10.0 46 10.3 50 11.0 52 11.3 -10.3Hispanic 136 27.8 146 30.5 114 25.6 146 32.2 146 31.7 7.4Asian 6 1.2 17 3.6 10 2.2 12 2.6 20 4.3 233.3Am. Indian 2 0.4 1 0.2 3 0.7 0 0.0 1 0.2 -50.0International 7 1.4 2 0.4 5 1.1 7 1.5 2 0.4 -71.4Unknown 0 0.0 1 0.2 2 0.4 2 0.4 6 1.3 n/aNative Hawaiian 0 0.0 0 0.0 0 0.0 0 0.0 0 0.0 n/aMulti-racial 0 0.0 6 1.3 3 0.7 0 0.0 0 0.0 n/aTotal 489 100.0 478 100.0 445 100.0 454 100.0 460 100.0 -5.9

page 14 mlb; graduation trends fy10 thru fy14.xlsx
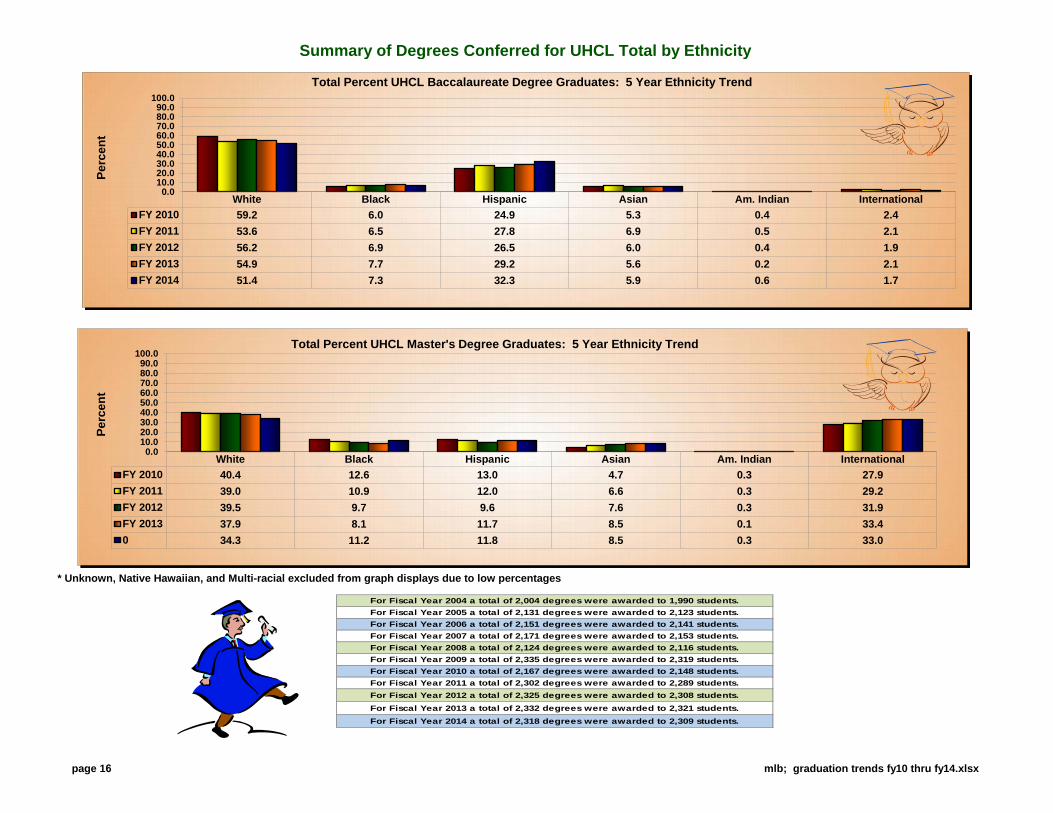
Summary of Degrees Conferred for UHCL Total by Ethnicity
Figure 2e. UHCL Total FY 2010 FY 2011 FY 2012 FY 2013 FY 2014 FY 2010 vs. FY 2014
Ethnicity Number Degrees
Number Degrees Percent
Number Degrees
Number Degrees Percent
Number Degrees
Number Degrees Percent
Number Degrees
Number Degrees Percent
Number Degrees
Number Degrees Percent
% Chg. for Number of Degrees
Bachelor's White 665 59.2 641 53.6 703 56.2 660 54.9 645 51.4 -3.0Black 67 6.0 78 6.5 86 6.9 93 7.7 92 7.3 37.3Hispanic 280 24.9 333 27.8 331 26.5 351 29.2 405 32.3 44.6Asian 60 5.3 82 6.9 75 6.0 67 5.6 74 5.9 23.3Am. Indian 5 0.4 6 0.5 5 0.4 2 0.2 8 0.6 60.0International 27 2.4 25 2.1 24 1.9 25 2.1 21 1.7 -22.2Unknown 3 0.3 9 0.8 7 0.6 5 0.4 10 0.8 233.3Native Hawaiian 2 0.2 4 0.3 3 0.2 0 0.0 0 0.0 -100.0Multi-racial 15 1.3 19 1.6 17 1.4 0 0.0 0 0.0 -100.0Total 1,124 100.0 1,197 100.0 1,251 100.0 1,203 100.0 1,255 100.0 11.7
Master's White 420 40.4 427 39.0 418 39.5 422 37.9 362 34.3 -13.8Black 131 12.6 120 10.9 103 9.7 90 8.1 118 11.2 -9.9Hispanic 135 13.0 132 12.0 102 9.6 130 11.7 124 11.8 -8.1Asian 49 4.7 72 6.6 80 7.6 95 8.5 90 8.5 83.7Am. Indian 3 0.3 3 0.3 3 0.3 1 0.1 3 0.3 0.0International 290 27.9 320 29.2 338 31.9 372 33.4 348 33.0 20.0Unknown 4 0.4 8 0.7 6 0.6 4 0.4 9 0.9 125.0Native Hawaiian 2 0.2 2 0.2 0 0.0 0 0.0 0 0.0 -100.0Multi-racial 6 0.6 12 1.1 9 0.8 0 0.0 0 0.0 -100.0Total 1,040 100.0 1,096 100.0 1,059 100.0 1,114 100.0 1,054 100.0 1.3
Doctoral White 3 100.0 6 66.7 11 73.3 11 73.3 5 55.6 66.7Black 0 0.0 2 22.2 2 13.3 0 0.0 3 33.3 n/aHispanic 0 0.0 0 0.0 2 13.3 4 26.7 1 11.1 n/aAsian 0 0.0 0 0.0 0 0.0 0 0.0 0 0.0 n/aAm. Indian 0 0.0 1 11.1 0 0.0 0 0.0 0 0.0 n/aInternational 0 0.0 0 0.0 0 0.0 0 0.0 0 0.0 n/aUnknown 0 0.0 0 0.0 0 0.0 0 0.0 0 0.0 n/aNative Hawaiian 0 0.0 0 0.0 0 0.0 0 0.0 0 0.0 n/aMulti-racial 0 0.0 0 0.0 0 0.0 0 0.0 0 0.0 n/aTotal 3 100.0 9 100.0 15 100.0 15 100.0 9 100.0 200.0

page 15 mlb; graduation trends fy10 thru fy14.xlsx
Summary of Degrees Conferred for UHCL Total by Ethnicity
Figure 2e. UHCL Total FY 2010 FY 2011 FY 2012 FY 2013 FY 2014 FY 2010 vs. FY 2014
Ethnicity Number Degrees
Number Degrees Percent
Number Degrees
Number Degrees Percent
Number Degrees
Number Degrees Percent
Number Degrees
Number Degrees Percent
Number Degrees
Number Degrees Percent
% Chg. for Number of Degrees
Total White 1,088 50.2 1,074 46.7 1,132 48.7 1,093 46.9 1,012 43.7 -7.0Black 198 9.1 200 8.7 191 8.2 183 7.8 213 9.2 7.6Hispanic 415 19.2 465 20.2 435 18.7 485 20.8 530 22.9 27.7Asian 109 5.0 154 6.7 155 6.7 162 6.9 164 7.1 50.5Am. Indian 8 0.4 10 0.4 8 0.3 3 0.1 11 0.5 37.5International 317 14.6 345 15.0 362 15.6 397 17.0 369 15.9 16.4Unknown 7 0.3 17 0.7 13 0.6 9 0.4 19 0.8 171.4Native Hawaiian 4 0.2 6 0.3 3 0.1 0 0.0 0 0.0 -100.0Multi-racial 21 1.0 31 1.3 26 1.1 0 0.0 0 0.0 -100.0Total 2,167 100.0 2,302 100.0 2,325 100.0 2,332 100.0 2,318 100.0 7.0
page 16 mlb; graduation trends fy10 thru fy14.xlsx
Summary of Degrees Conferred for UHCL Total by Ethnicity
For FY 2006 - International students were under-reported due to a PeopleSoft coding error.
* Unknown, Native Hawaiian, and Multi-racial excluded from graph displays due to low percentages
White Black Hispanic Asian Am. Indian InternationalFY 2010 59.2 6.0 24.9 5.3 0.4 2.4FY 2011 53.6 6.5 27.8 6.9 0.5 2.1FY 2012 56.2 6.9 26.5 6.0 0.4 1.9FY 2013 54.9 7.7 29.2 5.6 0.2 2.1FY 2014 51.4 7.3 32.3 5.9 0.6 1.7
0.010.020.030.040.050.060.070.080.090.0
100.0Pe
rcen
tTotal Percent UHCL Baccalaureate Degree Graduates: 5 Year Ethnicity Trend
White Black Hispanic Asian Am. Indian InternationalFY 2010 40.4 12.6 13.0 4.7 0.3 27.9FY 2011 39.0 10.9 12.0 6.6 0.3 29.2FY 2012 39.5 9.7 9.6 7.6 0.3 31.9FY 2013 37.9 8.1 11.7 8.5 0.1 33.40 34.3 11.2 11.8 8.5 0.3 33.0
0.010.020.030.040.050.060.070.080.090.0
100.0
Perc
ent
Total Percent UHCL Master's Degree Graduates: 5 Year Ethnicity Trend
For Fiscal Year 2004 a total of 2,004 degrees were awarded to 1,990 students.For Fiscal Year 2005 a total of 2,131 degrees were awarded to 2,123 students.For Fiscal Year 2006 a total of 2,151 degrees were awarded to 2,141 students.For Fiscal Year 2007 a total of 2,171 degrees were awarded to 2,153 students.For Fiscal Year 2008 a total of 2,124 degrees were awarded to 2,116 students.For Fiscal Year 2009 a total of 2,335 degrees were awarded to 2,319 students.For Fiscal Year 2010 a total of 2,167 degrees were awarded to 2,148 students.For Fiscal Year 2011 a total of 2,302 degrees were awarded to 2,289 students.For Fiscal Year 2012 a total of 2,325 degrees were awarded to 2,308 students.For Fiscal Year 2013 a total of 2,332 degrees were awarded to 2,321 students.For Fiscal Year 2014 a total of 2,318 degrees were awarded to 2,309 students.

page 17 mlb; graduation trends fy10 thru fy14.xlsx
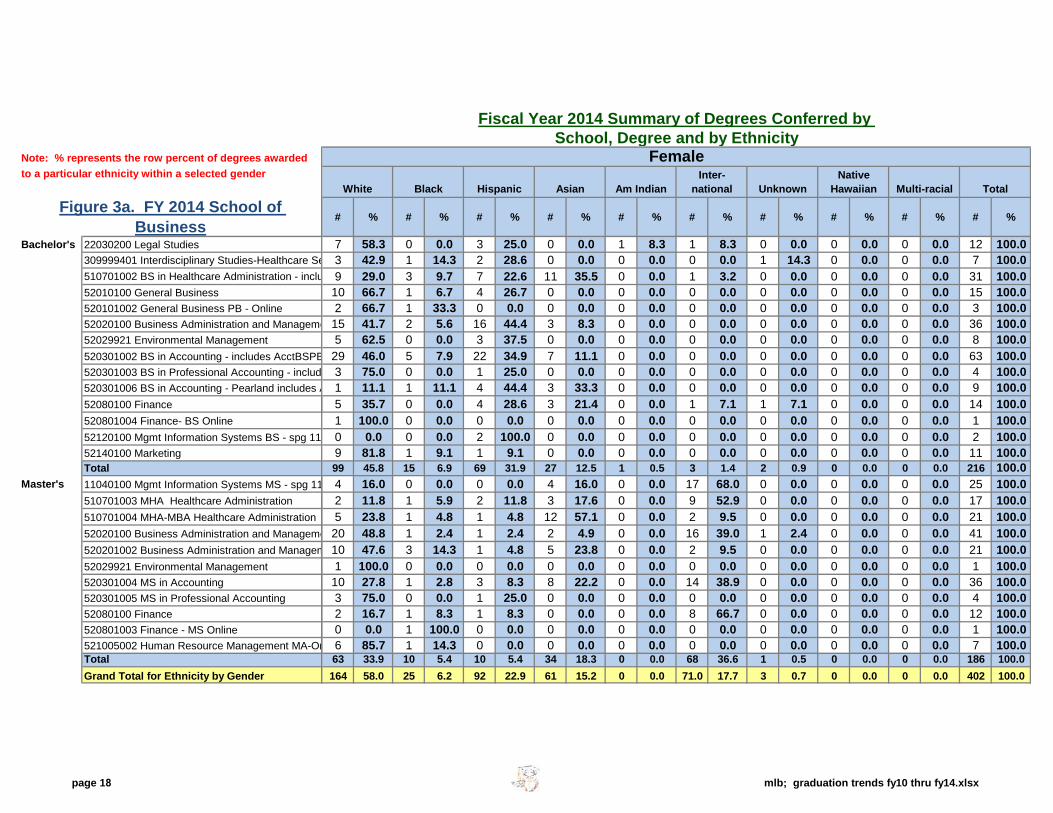
Fiscal Year 2014 Summary of Degrees Conferred by School, Degree and by Ethnicity
Note: % represents the row percent of degrees awarded Maleto a particular ethnicity within a selected gender
White Black Hispanic Asian Am IndianInter-
national UnknownNative
Hawaiian Multi-racial Total
# % # % # % # % # % # % # % # % # % # %
Bachelor's 22030200 Legal Studies 2 100.0 0 0.0 0 0.0 0 0.0 0 0.0 0 0.0 0 0.0 0 0.0 0 0.0 2 100.0309999401 Interdisciplinary Studies-Healthcare Se 0 0.0 1 50.0 1 50.0 0 0.0 0 0.0 0 0.0 0 0.0 0 0.0 0 0.0 2 100.0510701002 BS in Healthcare Administration - inclu 1 10.0 1 10.0 2 20.0 6 60.0 0 0.0 0 0.0 0 0.0 0 0.0 0 0.0 10 100.052010100 General Business 5 45.5 0 0.0 6 54.5 0 0.0 0 0.0 0 0.0 0 0.0 0 0.0 0 0.0 11 100.0520101002 General Business PB - Online 1 100.0 0 0.0 0 0.0 0 0.0 0 0.0 0 0.0 0 0.0 0 0.0 0 0.0 1 100.052020100 Business Administration and Manageme 11 44.0 2 8.0 10 40.0 0 0.0 0 0.0 2 8.0 0 0.0 0 0.0 0 0.0 25 100.052029921 Environmental Management 4 100.0 0 0.0 0 0.0 0 0.0 0 0.0 0 0.0 0 0.0 0 0.0 0 0.0 4 100.0520301002 BS in Accounting - includes AcctBSPB 10 35.7 1 3.6 12 42.9 0 0.0 0 0.0 5 17.9 0 0.0 0 0.0 0 0.0 28 100.0520301003 BS in Professional Accounting - includ 3 75.0 1 25.0 0 0.0 0 0.0 0 0.0 0 0.0 0 0.0 0 0.0 0 0.0 4 100.0520301006 BS in Accounting - Pearland includes A 0 0.0 0 0.0 0 0.0 0 0.0 0 0.0 0 0.0 0 0.0 0 0.0 0 0.0 0 0.052080100 Finance 9 45.0 3 15.0 6 30.0 1 5.0 0 0.0 0 0.0 1 5.0 0 0.0 0 0.0 20 100.0520801004 Finance- BS Online 2 50.0 1 25.0 0 0.0 1 25.0 0 0.0 0 0.0 0 0.0 0 0.0 0 0.0 4 100.052120100 Mgmt Information Systems BS - spg 11 5 33.3 4 26.7 3 20.0 0 0.0 0 0.0 3 20.0 0 0.0 0 0.0 0 0.0 15 100.052140100 Marketing 5 71.4 1 14.3 1 14.3 0 0.0 0 0.0 0 0.0 0 0.0 0 0.0 0 0.0 7 100.0Total 58 43.6 15 11.3 41 30.8 8 6.0 0 0.0 10 7.5 1 0.8 0 0.0 0 0.0 133 100.0
Master's 11040100 Mgmt Information Systems MS - spg 11 3 13.0 0 0.0 1 4.3 1 4.3 0 0.0 18 78.3 0 0.0 0 0.0 0 0.0 23 100.0510701003 MHA Healthcare Administration 1 10.0 0 0.0 3 30.0 4 40.0 0 0.0 2 20.0 0 0.0 0 0.0 0 0.0 10 100.0510701004 MHA-MBA Healthcare Administration 6 33.3 1 5.6 5 27.8 5 27.8 0 0.0 1 5.6 0 0.0 0 0.0 0 0.0 18 100.052020100 Business Administration and Manageme 22 47.8 1 2.2 6 13.0 4 8.7 0 0.0 12 26.1 1 2.2 0 0.0 0 0.0 46 100.0520201002 Business Administration and Managem 7 46.7 2 13.3 1 6.7 3 20.0 0 0.0 2 13.3 0 0.0 0 0.0 0 0.0 15 100.052029921 Environmental Management 3 100.0 0 0.0 0 0.0 0 0.0 0 0.0 0 0.0 0 0.0 0 0.0 0 0.0 3 100.0520301004 MS in Accounting 6 33.3 1 5.6 3 16.7 3 16.7 0 0.0 4 22.2 1 5.6 0 0.0 0 0.0 18 100.0520301005 MS in Professional Accounting 3 75.0 1 25.0 0 0.0 0 0.0 0 0.0 0 0.0 0 0.0 0 0.0 0 0.0 4 100.052080100 Finance 0 0.0 0 0.0 2 18.2 1 9.1 0 0.0 8 72.7 0 0.0 0 0.0 0 0.0 11 100.0520801003 Finance - MS Online 1 100.0 0 0.0 0 0.0 0 0.0 0 0.0 0 0.0 0 0.0 0 0.0 0 0.0 1 100.0521005002 Human Resource Management MA-On 0 0.0 0 0.0 0 0.0 1 100.0 0 0.0 0 0.0 0 0.0 0 0.0 0 0.0 1 100.0Total 52 34.7 6 4.0 21 14.0 22 14.7 0 0.0 47 31.3 2 1.3 0 0.0 0 0.0 150 100.0Grand Total for Ethnicity by Gender 110 38.9 21 7.4 62 21.9 30 10.6 306 108.1 57 306.0 3 1.1 0 0.0 0 0 283 100.0
Figure 3a. FY 2014 School of Business
page 18 mlb; graduation trends fy10 thru fy14.xlsx
Note: % represents the row percent of degrees awardedto a particular ethnicity within a selected gender
Bachelor's 22030200 Legal Studies309999401 Interdisciplinary Studies-Healthcare Se510701002 BS in Healthcare Administration - inclu52010100 General Business520101002 General Business PB - Online52020100 Business Administration and Manageme52029921 Environmental Management 520301002 BS in Accounting - includes AcctBSPB520301003 BS in Professional Accounting - includ520301006 BS in Accounting - Pearland includes A52080100 Finance520801004 Finance- BS Online52120100 Mgmt Information Systems BS - spg 11 52140100 MarketingTotal
Master's 11040100 Mgmt Information Systems MS - spg 11 510701003 MHA Healthcare Administration510701004 MHA-MBA Healthcare Administration52020100 Business Administration and Manageme520201002 Business Administration and Managem52029921 Environmental Management 520301004 MS in Accounting520301005 MS in Professional Accounting52080100 Finance520801003 Finance - MS Online521005002 Human Resource Management MA-OnTotalGrand Total for Ethnicity by Gender
Figure 3a. FY 2014 School of Business
Fiscal Year 2014 Summary of Degrees Conferred by School, Degree and by Ethnicity
Female
White Black Hispanic Asian Am IndianInter-
national UnknownNative
Hawaiian Multi-racial Total
# % # % # % # % # % # % # % # % # % # %
7 58.3 0 0.0 3 25.0 0 0.0 1 8.3 1 8.3 0 0.0 0 0.0 0 0.0 12 100.03 42.9 1 14.3 2 28.6 0 0.0 0 0.0 0 0.0 1 14.3 0 0.0 0 0.0 7 100.09 29.0 3 9.7 7 22.6 11 35.5 0 0.0 1 3.2 0 0.0 0 0.0 0 0.0 31 100.0
10 66.7 1 6.7 4 26.7 0 0.0 0 0.0 0 0.0 0 0.0 0 0.0 0 0.0 15 100.02 66.7 1 33.3 0 0.0 0 0.0 0 0.0 0 0.0 0 0.0 0 0.0 0 0.0 3 100.0
15 41.7 2 5.6 16 44.4 3 8.3 0 0.0 0 0.0 0 0.0 0 0.0 0 0.0 36 100.05 62.5 0 0.0 3 37.5 0 0.0 0 0.0 0 0.0 0 0.0 0 0.0 0 0.0 8 100.0
29 46.0 5 7.9 22 34.9 7 11.1 0 0.0 0 0.0 0 0.0 0 0.0 0 0.0 63 100.03 75.0 0 0.0 1 25.0 0 0.0 0 0.0 0 0.0 0 0.0 0 0.0 0 0.0 4 100.01 11.1 1 11.1 4 44.4 3 33.3 0 0.0 0 0.0 0 0.0 0 0.0 0 0.0 9 100.05 35.7 0 0.0 4 28.6 3 21.4 0 0.0 1 7.1 1 7.1 0 0.0 0 0.0 14 100.01 100.0 0 0.0 0 0.0 0 0.0 0 0.0 0 0.0 0 0.0 0 0.0 0 0.0 1 100.00 0.0 0 0.0 2 100.0 0 0.0 0 0.0 0 0.0 0 0.0 0 0.0 0 0.0 2 100.09 81.8 1 9.1 1 9.1 0 0.0 0 0.0 0 0.0 0 0.0 0 0.0 0 0.0 11 100.099 45.8 15 6.9 69 31.9 27 12.5 1 0.5 3 1.4 2 0.9 0 0.0 0 0.0 216 100.04 16.0 0 0.0 0 0.0 4 16.0 0 0.0 17 68.0 0 0.0 0 0.0 0 0.0 25 100.02 11.8 1 5.9 2 11.8 3 17.6 0 0.0 9 52.9 0 0.0 0 0.0 0 0.0 17 100.05 23.8 1 4.8 1 4.8 12 57.1 0 0.0 2 9.5 0 0.0 0 0.0 0 0.0 21 100.0
20 48.8 1 2.4 1 2.4 2 4.9 0 0.0 16 39.0 1 2.4 0 0.0 0 0.0 41 100.010 47.6 3 14.3 1 4.8 5 23.8 0 0.0 2 9.5 0 0.0 0 0.0 0 0.0 21 100.01 100.0 0 0.0 0 0.0 0 0.0 0 0.0 0 0.0 0 0.0 0 0.0 0 0.0 1 100.0
10 27.8 1 2.8 3 8.3 8 22.2 0 0.0 14 38.9 0 0.0 0 0.0 0 0.0 36 100.03 75.0 0 0.0 1 25.0 0 0.0 0 0.0 0 0.0 0 0.0 0 0.0 0 0.0 4 100.02 16.7 1 8.3 1 8.3 0 0.0 0 0.0 8 66.7 0 0.0 0 0.0 0 0.0 12 100.00 0.0 1 100.0 0 0.0 0 0.0 0 0.0 0 0.0 0 0.0 0 0.0 0 0.0 1 100.06 85.7 1 14.3 0 0.0 0 0.0 0 0.0 0 0.0 0 0.0 0 0.0 0 0.0 7 100.063 33.9 10 5.4 10 5.4 34 18.3 0 0.0 68 36.6 1 0.5 0 0.0 0 0.0 186 100.0164 58.0 25 6.2 92 22.9 61 15.2 0 0.0 71.0 17.7 3 0.7 0 0.0 0 0.0 402 100.0

page 19 mlb; graduation trends fy10 thru fy14.xlsx
Fiscal Year 2014 Summary of Degrees Conferred by School, Degree and by Ethnicity
MaleWhite Black Hispanic Asian Am Indian
Inter-national Unknown
Native Hawaiian Multi-racial Total
# % # % # % # % # % # % # % # % # % # %
Bachelor's 05020700 Womens Studies 0 0.0 0 0.0 0 0.0 0 0.0 0 0.0 0 0.0 0 0.0 0 0.0 0 0.0 0 0.009010000 Communication - BA 7 58.3 0 0.0 5 41.7 0 0.0 0 0.0 0 0.0 0 0.0 0 0.0 0 0.0 12 100.023010100 Literature 2 66.7 1 33.3 0 0.0 0 0.0 0 0.0 0 0.0 0 0.0 0 0.0 0 0.0 3 100.024010300 Humanities 3 50.0 1 16.7 2 33.3 0 0.0 0 0.0 0 0.0 0 0.0 0 0.0 0 0.0 6 100.030170100 Behavioral Science 3 27.3 3 27.3 2 18.2 0 0.0 0 0.0 0 0.0 3 27.3 0 0.0 0 0.0 11 100.0310505001 Fitness and Human Performance BS - 12 44.4 3 11.1 8 29.6 3 11.1 0 0.0 1 3.7 0 0.0 0 0.0 0 0.0 27 100.042010100 Psychology 11 64.7 0 0.0 6 35.3 0 0.0 0 0.0 0 0.0 0 0.0 0 0.0 0 0.0 17 100.0420101002 Psychology - BS Online 0 0.0 0 0.0 0 0.0 0 0.0 0 0.0 0 0.0 0 0.0 0 0.0 0 0.0 0 0.044040100 Public Service Leadership 4 57.1 0 0.0 3 42.9 0 0.0 0 0.0 0 0.0 0 0.0 0 0.0 0 0.0 7 100.0440401002 Public Service Leadership PB-Online 1 50.0 0 0.0 1 50.0 0 0.0 0 0.0 0 0.0 0 0.0 0 0.0 0 0.0 2 100.044070100 Social Work 0 0.0 0 0.0 0 0.0 0 0.0 0 0.0 0 0.0 0 0.0 0 0.0 0 0.0 0 0.045020100 Anthropology 3 100.0 0 0.0 0 0.0 0 0.0 0 0.0 0 0.0 0 0.0 0 0.0 0 0.0 3 100.045040100 Criminology 7 63.6 1 9.1 3 27.3 0 0.0 0 0.0 0 0.0 0 0.0 0 0.0 0 0.0 11 100.0450401002 Criminology - Online 2 100.0 0 0.0 0 0.0 0 0.0 0 0.0 0 0.0 0 0.0 0 0.0 0 0.0 2 100.045070100 Geography 2 100.0 0 0.0 0 0.0 0 0.0 0 0.0 0 0.0 0 0.0 0 0.0 0 0.0 2 100.045100100 Political Science 0 0.0 0 0.0 0 0.0 0 0.0 0 0.0 0 0.0 0 0.0 0 0.0 0 0.0 0 0.045110100 Sociology 1 25.0 0 0.0 2 50.0 1 25.0 0 0.0 0 0.0 0 0.0 0 0.0 0 0.0 4 100.050070200 BFA in Art and Design 9 75.0 0 0.0 3 25.0 0 0.0 0 0.0 0 0.0 0 0.0 0 0.0 0 0.0 12 100.0500702002 BFA in Art and Design/ART EC-12 0 0.0 0 0.0 0 0.0 0 0.0 0 0.0 0 0.0 0 0.0 0 0.0 0 0.0 0 0.054010100 History 19 79.2 1 4.2 4 16.7 0 0.0 0 0.0 0 0.0 0 0.0 0 0.0 0 0.0 24 100.0Total 86 60.1 10 7.0 39 27.3 4 2.8 0 0.0 1 0.7 3 2.1 0 0.0 0 0.0 143 100.0
Master's 1001050019 Digital Media Studies 4 44.4 3 33.3 1 11.1 1 11.1 0 0.0 0 0.0 0 0.0 0 0.0 0 0.0 9 100.023010100 Literature 6 75.0 1 12.5 1 12.5 0 0.0 0 0.0 0 0.0 0 0.0 0 0.0 0 0.0 8 100.024010300 Humanities 1 16.7 3 50.0 2 33.3 0 0.0 0 0.0 0 0.0 0 0.0 0 0.0 0 0.0 6 100.030170100 Behavioral Science 0 0.0 0 0.0 0 0.0 0 0.0 0 0.0 0 0.0 0 0.0 0 0.0 0 0.0 0 0.0302301001 Cross-Cultural Studies 0 0.0 1 100.0 0 0.0 0 0.0 0 0.0 0 0.0 0 0.0 0 0.0 0 0.0 1 100.0310505002 Exercise and Health Sciences 5 50.0 2 20.0 2 20.0 1 10.0 0 0.0 0 0.0 0 0.0 0 0.0 0 0.0 10 100.042010100 Psychology 0 0.0 0 0.0 5 100.0 0 0.0 0 0.0 0 0.0 0 0.0 0 0.0 0 0.0 5 100.0422801001 Clinical Psychology - f10 new cip 3 100.0 0 0.0 0 0.0 0 0.0 0 0.0 0 0.0 0 0.0 0 0.0 0 0.0 3 100.0422801002 Behavior Analysis - f10 new cip 1 100.0 0 0.0 0 0.0 0 0.0 0 0.0 0 0.0 0 0.0 0 0.0 0 0.0 1 100.042280400 Industrial Organizational Psychology (M 2 40.0 0 0.0 2 40.0 1 20.0 0 0.0 0 0.0 0 0.0 0 0.0 0 0.0 5 100.042280500 School Psychology SSP - formerly MA - 1 100.0 0 0.0 0 0.0 0 0.0 0 0.0 0 0.0 0 0.0 0 0.0 0 0.0 1 100.045040100 Criminology 1 20.0 3 60.0 1 20.0 0 0.0 0 0.0 0 0.0 0 0.0 0 0.0 0 0.0 5 100.045110100 Sociology 1 50.0 1 50.0 0 0.0 0 0.0 0 0.0 0 0.0 0 0.0 0 0.0 0 0.0 2 100.051150500 Family Therapy 3 75.0 0 0.0 0 0.0 1 25.0 0 0.0 0 0.0 0 0.0 0 0.0 0 0.0 4 100.054010100 History 6 85.7 0 0.0 1 14.3 0 0.0 0 0.0 0 0.0 0 0.0 0 0.0 0 0.0 7 100.0Total 34 50.7 14 20.9 15 22.4 4 6.0 0 0.0 0 0.0 0 0.0 0 0.0 0 0.0 67 100.0Grand Total for Ethnicity by Gender 120 57.1 24 11.4 54 25.7 8 3.8 0 0.0 1 0.5 3 1.4 0 0.0 0 0.0 210 100.0
Figure 3b. FY 2014 School of Human Sciences and Humanities

page 20 mlb; graduation trends fy10 thru fy14.xlsx
Bachelor's 05020700 Womens Studies09010000 Communication - BA23010100 Literature24010300 Humanities30170100 Behavioral Science310505001 Fitness and Human Performance BS - 42010100 Psychology420101002 Psychology - BS Online44040100 Public Service Leadership440401002 Public Service Leadership PB-Online44070100 Social Work45020100 Anthropology45040100 Criminology450401002 Criminology - Online45070100 Geography45100100 Political Science45110100 Sociology50070200 BFA in Art and Design500702002 BFA in Art and Design/ART EC-1254010100 HistoryTotal
Master's 1001050019 Digital Media Studies23010100 Literature24010300 Humanities30170100 Behavioral Science302301001 Cross-Cultural Studies310505002 Exercise and Health Sciences42010100 Psychology422801001 Clinical Psychology - f10 new cip422801002 Behavior Analysis - f10 new cip42280400 Industrial Organizational Psychology (M42280500 School Psychology SSP - formerly MA - 45040100 Criminology45110100 Sociology51150500 Family Therapy54010100 HistoryTotalGrand Total for Ethnicity by Gender
Figure 3b. FY 2014 School of Human Sciences and Humanities
Fiscal Year 2014 Summary of Degrees Conferred by School, Degree and by Ethnicity
FemaleWhite Black Hispanic Asian Am Indian
Inter-national Unknown
Native Hawaiian Multi-racial Total
# % # % # % # % # % # % # % # % # % # %
2 100.0 0 0.0 0 0.0 0 0.0 0 0.0 0 0.0 0 0.0 0 0.0 0 0.0 2 100.012 66.7 2 11.1 4 22.2 0 0.0 0 0.0 0 0.0 0 0.0 0 0.0 0 0.0 18 100.021 80.8 0 0.0 4 15.4 1 3.8 0 0.0 0 0.0 0 0.0 0 0.0 0 0.0 26 100.06 60.0 1 10.0 3 30.0 0 0.0 0 0.0 0 0.0 0 0.0 0 0.0 0 0.0 10 100.04 40.0 1 10.0 4 40.0 0 0.0 1 10.0 0 0.0 0 0.0 0 0.0 0 0.0 10 100.0
27 58.7 2 4.3 13 28.3 2 4.3 1 2.2 1 2.2 0 0.0 0 0.0 0 0.0 46 100.045 48.4 10 10.8 31 33.3 5 5.4 0 0.0 1 1.1 1 1.1 0 0.0 0 0.0 93 100.05 55.6 1 11.1 2 22.2 1 11.1 0 0.0 0 0.0 0 0.0 0 0.0 0 0.0 9 100.02 66.7 0 0.0 1 33.3 0 0.0 0 0.0 0 0.0 0 0.0 0 0.0 0 0.0 3 100.00 0.0 0 0.0 1 100.0 0 0.0 0 0.0 0 0.0 0 0.0 0 0.0 0 0.0 1 100.05 41.7 3 25.0 3 25.0 0 0.0 1 8.3 0 0.0 0 0.0 0 0.0 0 0.0 12 100.0
11 91.7 0 0.0 1 8.3 0 0.0 0 0.0 0 0.0 0 0.0 0 0.0 0 0.0 12 100.07 36.8 2 10.5 9 47.4 1 5.3 0 0.0 0 0.0 0 0.0 0 0.0 0 0.0 19 100.02 50.0 0 0.0 2 50.0 0 0.0 0 0.0 0 0.0 0 0.0 0 0.0 0 0.0 4 100.04 66.7 0 0.0 1 16.7 0 0.0 1 16.7 0 0.0 0 0.0 0 0.0 0 0.0 6 100.01 100.0 0 0.0 0 0.0 0 0.0 0 0.0 0 0.0 0 0.0 0 0.0 0 0.0 1 100.05 35.7 4 28.6 4 28.6 1 7.1 0 0.0 0 0.0 0 0.0 0 0.0 0 0.0 14 100.0
14 53.8 2 7.7 8 30.8 2 7.7 0 0.0 0 0.0 0 0.0 0 0.0 0 0.0 26 100.02 50.0 0 0.0 2 50.0 0 0.0 0 0.0 0 0.0 0 0.0 0 0.0 0 0.0 4 100.0
13 61.9 1 4.8 6 28.6 1 4.8 0 0.0 0 0.0 0 0.0 0 0.0 0 0.0 21 100.0188 55.8 29 8.6 99 29.4 14 4.2 4 1.2 2 0.6 1 0.3 0 0.0 0 0.0 337 100.07 53.8 4 30.8 0 0.0 2 15.4 0 0.0 0 0.0 0 0.0 0 0.0 0 0.0 13 100.0
10 76.9 0 0.0 1 7.7 1 7.7 0 0.0 1 7.7 0 0.0 0 0.0 0 0.0 13 100.06 54.5 1 9.1 4 36.4 0 0.0 0 0.0 0 0.0 0 0.0 0 0.0 0 0.0 11 100.02 28.6 3 42.9 1 14.3 0 0.0 0 0.0 1 14.3 0 0.0 0 0.0 0 0.0 7 100.02 28.6 3 42.9 1 14.3 0 0.0 0 0.0 1 14.3 0 0.0 0 0.0 0 0.0 7 100.05 55.6 2 22.2 1 11.1 0 0.0 0 0.0 1 11.1 0 0.0 0 0.0 0 0.0 9 100.05 33.3 5 33.3 3 20.0 0 0.0 1 6.7 1 6.7 0 0.0 0 0.0 0 0.0 15 100.08 50.0 0 0.0 3 18.8 3 18.8 0 0.0 2 12.5 0 0.0 0 0.0 0 0.0 16 100.05 62.5 2 25.0 1 12.5 0 0.0 0 0.0 0 0.0 0 0.0 0 0.0 0 0.0 8 100.05 25.0 7 35.0 5 25.0 2 10.0 1 5.0 0 0.0 0 0.0 0 0.0 0 0.0 20 100.07 63.6 1 9.1 3 27.3 0 0.0 0 0.0 0 0.0 0 0.0 0 0.0 0 0.0 11 100.03 21.4 5 35.7 5 35.7 1 7.1 0 0.0 0 0.0 0 0.0 0 0.0 0 0.0 14 100.04 33.3 3 25.0 4 33.3 0 0.0 0 0.0 1 8.3 0 0.0 0 0.0 0 0.0 12 100.08 53.3 2 13.3 3 20.0 1 6.7 0 0.0 1 6.7 0 0.0 0 0.0 0 0.0 15 100.03 75.0 1 25.0 0 0.0 0 0.0 0 0.0 0 0.0 0 0.0 0 0.0 0 0.0 4 100.080 45.7 39 22.3 35 20.0 10 5.7 2 1.1 9 5.1 0 0.0 0 0.0 0 0.0 175 100.0268 52.3 68 13.3 134 26.2 24 4.7 6 1.2 11 2.1 1 0.2 0 0.0 0 0.0 512 100.0

page 21 mlb; graduation trends fy10 thru fy14.xlsx
Fiscal Year 2014 Summary of Degrees Conferred by School, Degree and by Ethnicity
Male
White Black Hispanic Asian Am IndianInter-
national UnknownNative
Hawaiian Multi-racial Total# % # % # % # % # % # % # % # % # % # %
Bachelor's 03010400 Environmental Science 2 33.3 0 0.0 3 50.0 1 16.7 0 0.0 0 0.0 0 0.0 0 0.0 0 0.0 6 100.011010100 Computer Information Systems 6 75.0 0 0.0 2 25.0 0 0.0 0 0.0 0 0.0 0 0.0 0 0.0 0 0.0 8 100.011070100 Computer Science 9 90.0 1 10.0 0 0.0 0 0.0 0 0.0 0 0.0 0 0.0 0 0.0 0 0.0 10 100.0140901002 Computer Engineering 6 75.0 0 0.0 2 25.0 0 0.0 0 0.0 0 0.0 0 0.0 0 0.0 0 0.0 8 100.026010100 Biological Sciences 9 56.3 0 0.0 5 31.3 2 12.5 0 0.0 0 0.0 0 0.0 0 0.0 0 0.0 16 100.027010100 Mathematical Sciences 6 75.0 0 0.0 0 0.0 0 0.0 1 12.5 0 0.0 1 12.5 0 0.0 0 0.0 8 100.0309999405 Interdisciplinary Studies-Information Te 10 58.8 1 5.9 5 29.4 0 0.0 0 0.0 1 5.9 0 0.0 0 0.0 0 0.0 17 100.040050100 Chemistry 0 0.0 0 0.0 2 100.0 0 0.0 0 0.0 0 0.0 0 0.0 0 0.0 0 0.0 2 100.040080100 Physics 3 60.0 0 0.0 2 40.0 0 0.0 0 0.0 0 0.0 0 0.0 0 0.0 0 0.0 5 100.0Total 51 63.7 2 2.5 21 26.3 3 3.8 1 1.3 1 1.3 1 1.3 0 0.0 0 0.0 80 100.0
Master's 03010400 Environmental Science 4 30.8 3 23.1 3 23.1 1 7.7 0 0.0 2 15.4 0 0.0 0 0.0 0 0.0 13 100.011010100 Computer Information Systems 0 0.0 0 0.0 0 0.0 0 0.0 0 0.0 2 100.0 0 0.0 0 0.0 0 0.0 2 100.011070100 Computer Science 0 0.0 2 5.0 1 2.5 1 2.5 0 0.0 36 90.0 0 0.0 0 0.0 0 0.0 40 100.0140901003 Computer Engineering 1 4.3 1 4.3 1 4.3 0 0.0 0 0.0 20 87.0 0 0.0 0 0.0 0 0.0 23 100.014090300 Computer Software Engineering 0 0.0 1 3.3 0 0.0 0 0.0 0 0.0 29 96.7 0 0.0 0 0.0 0 0.0 30 100.0140903002 Computer Software Engineering - MS O 1 20.0 1 20.0 1 20.0 1 20.0 0 0.0 1 20.0 0 0.0 0 0.0 0 0.0 5 100.014270100 Systems Engineering MS 3 42.9 0 0.0 1 14.3 0 0.0 0 0.0 2 28.6 1 14.3 0 0.0 0 0.0 7 100.015150100 Engineering Management - f10 new cip 2 9.5 3 14.3 1 4.8 0 0.0 0 0.0 15 71.4 0 0.0 0 0.0 0 0.0 21 100.0151501006 Engineering Management - MS Online 1 25.0 1 25.0 0 0.0 2 50.0 0 0.0 0 0.0 0 0.0 0 0.0 0 0.0 4 100.026010100 Biological Sciences 0 0.0 0 0.0 1 33.3 0 0.0 0 0.0 2 66.7 0 0.0 0 0.0 0 0.0 3 100.02612010002 Biotechnology 0 0.0 0 0.0 0 0.0 0 0.0 0 0.0 6 100.0 0 0.0 0 0.0 0 0.0 6 100.027010100 Mathematical Sciences 0 0.0 0 0.0 2 66.7 0 0.0 1 33.3 0 0.0 0 0.0 0 0.0 0 0.0 3 100.027050100 Statistics 2 66.7 0 0.0 0 0.0 0 0.0 0 0.0 1 33.3 0 0.0 0 0.0 0 0.0 3 100.030104002 Environmental Science MS - Online 0 0.0 1 100.0 0 0.0 0 0.0 0 0.0 0 0.0 0 0.0 0 0.0 0 0.0 1 100.040050100 Chemistry 1 8.3 0 0.0 0 0.0 0 0.0 0 0.0 11 91.7 0 0.0 0 0.0 0 0.0 12 100.040080100 Physics 1 100.0 0 0.0 0 0.0 0 0.0 0 0.0 0 0.0 0 0.0 0 0.0 0 0.0 1 100.0Total 16 9.2 13 7.5 11 6.3 5 2.9 1 0.6 127 73.0 1 0.6 0 0.0 0 0.0 174 100.0Grand Total for Ethnicity by Gender 67 26.4 15 5.9 32 12.6 8 3.1 2 0.8 128 50.4 2 0.8 0 0.0 0 0.0 254 100.0
Figure 3c. FY 2014 School of Science and Computer Engineering

page 22 mlb; graduation trends fy10 thru fy14.xlsx
Bachelor's 03010400 Environmental Science11010100 Computer Information Systems11070100 Computer Science140901002 Computer Engineering26010100 Biological Sciences27010100 Mathematical Sciences309999405 Interdisciplinary Studies-Information Te40050100 Chemistry40080100 PhysicsTotal
Master's 03010400 Environmental Science11010100 Computer Information Systems11070100 Computer Science140901003 Computer Engineering14090300 Computer Software Engineering140903002 Computer Software Engineering - MS 14270100 Systems Engineering MS15150100 Engineering Management - f10 new cip151501006 Engineering Management - MS Online26010100 Biological Sciences2612010002 Biotechnology27010100 Mathematical Sciences27050100 Statistics30104002 Environmental Science MS - Online40050100 Chemistry40080100 PhysicsTotalGrand Total for Ethnicity by Gender
Figure 3c. FY 2014 School of Science and Computer Engineering
Fiscal Year 2014 Summary of Degrees Conferred by School, Degree and by Ethnicity
Female
White Black Hispanic Asian Am IndianInter-
national UnknownNative
Hawaiian Multi-racial Total# % # % # % # % # % # % # % # % # % # %5 45.5 0 0.0 4 36.4 0 0.0 0 0.0 2 18.2 0 0.0 0 0.0 0 0.0 11 100.02 50.0 2 50.0 0 0.0 0 0.0 0 0.0 0 0.0 0 0.0 0 0.0 0 0.0 4 100.00 0.0 0 0.0 1 100.0 0 0.0 0 0.0 0 0.0 0 0.0 0 0.0 0 0.0 1 100.00 0.0 1 50.0 1 50.0 0 0.0 0 0.0 0 0.0 0 0.0 0 0.0 0 0.0 2 100.09 37.5 0 0.0 6 25.0 5 20.8 1 4.2 2 8.3 1 4.2 0 0.0 0 0.0 24 100.08 61.5 0 0.0 5 38.5 0 0.0 0 0.0 0 0.0 0 0.0 0 0.0 0 0.0 13 100.01 16.7 1 16.7 3 50.0 1 16.7 0 0.0 0 0.0 0 0.0 0 0.0 0 0.0 6 100.02 40.0 0 0.0 1 20.0 2 40.0 0 0.0 0 0.0 0 0.0 0 0.0 0 0.0 5 100.00 0.0 0 0.0 0 0.0 0 0.0 0 0.0 0 0.0 0 0.0 0 0.0 0 0.0 0 0.027 40.9 4 6.1 21 31.8 8 12.1 1 1.5 4 6.1 1 1.5 0 0.0 0 0.0 66 100.010 66.7 1 6.7 1 6.7 1 6.7 0 0.0 2 13.3 0 0.0 0 0.0 0 0.0 15 100.01 33.3 0 0.0 0 0.0 0 0.0 0 0.0 2 66.7 0 0.0 0 0.0 0 0.0 3 100.00 0.0 0 0.0 0 0.0 0 0.0 0 0.0 31 100.0 0 0.0 0 0.0 0 0.0 31 100.00 0.0 0 0.0 0 0.0 0 0.0 0 0.0 13 100.0 0 0.0 0 0.0 0 0.0 13 100.01 12.5 0 0.0 0 0.0 0 0.0 0 0.0 7 87.5 0 0.0 0 0.0 0 0.0 8 100.00 0.0 0 0.0 0 0.0 0 0.0 0 0.0 0 0.0 0 0.0 0 0.0 0 0.0 0 0.00 0.0 0 0.0 0 0.0 0 0.0 0 0.0 2 100.0 0 0.0 0 0.0 0 0.0 2 100.02 20.0 1 10.0 0 0.0 1 10.0 0 0.0 6 60.0 0 0.0 0 0.0 0 0.0 10 100.01 50.0 1 50.0 0 0.0 0 0.0 0 0.0 0 0.0 0 0.0 0 0.0 0 0.0 2 100.04 33.3 0 0.0 0 0.0 3 25.0 0 0.0 5 41.7 0 0.0 0 0.0 0 0.0 12 100.02 14.3 0 0.0 0 0.0 0 0.0 0 0.0 12 85.7 0 0.0 0 0.0 0 0.0 14 100.02 100.0 0 0.0 0 0.0 0 0.0 0 0.0 0 0.0 0 0.0 0 0.0 0 0.0 2 100.01 33.3 0 0.0 0 0.0 0 0.0 0 0.0 2 66.7 0 0.0 0 0.0 0 0.0 3 100.00 0.0 0 0.0 0 0.0 0 0.0 0 0.0 1 100.0 0 0.0 0 0.0 0 0.0 1 100.00 0.0 1 7.7 1 7.7 0 0.0 0 0.0 11 84.6 0 0.0 0 0.0 0 0.0 13 100.01 50.0 0 0.0 0 0.0 0 0.0 0 0.0 1 50.0 0 0.0 0 0.0 0 0.0 2 100.025 19.1 4 3.1 2 1.5 5 3.8 0 0.0 95 72.5 0 0.0 0 0.0 0 0.0 131 100.052 26.4 8 4.1 23 11.7 13 6.6 1 0.5 99 50.3 1 0.5 0 0.0 0 0.0 197 100.0

page 23 mlb; graduation trends fy10 thru fy14.xlsx
Fiscal Year 2014 Summary of Degrees Conferred by
Male
White Black Hispanic Asian Am IndianInter-
national UnknownNative
Hawaiian Multi-racial Total
# % # % # % # % # % # % # % # % # % # %Bachelor's 30999901 Interdisciplinary Studies 8 50.0 0 0.0 8 50.0 0 0.0 0 0.0 0 0.0 0 0.0 0 0.0 0 0.0 16 100.0
309999402 Interdisciplinary Studies-Early Childhoo 0 0.0 0 0.0 0 0.0 0 0.0 0 0.0 0 0.0 0 0.0 0 0.0 0 0.0 0 0.0309999404 Interdisciplinary Studies-Young Childre 0 0.0 0 0.0 0 0.0 0 0.0 0 0.0 0 0.0 0 0.0 0 0.0 0 0.0 0 0.0Total 8 50.0 0 0.0 8 50.0 0 0.0 0 0.0 0 0.0 0 0.0 0 0.0 0 0.0 16 100.0
Master's 13030100 Curriculum and Instruction 1 100.0 0 0.0 0 0.0 0 0.0 0 0.0 0 0.0 0 0.0 0 0.0 0 0.0 1 100.013040100 Educational Management 6 46.2 2 15.4 2 15.4 1 7.7 0 0.0 0 0.0 2 15.4 0 0.0 0 0.0 13 100.013050100 Instructional Design and Technology 1 100.0 0 0.0 0 0.0 0 0.0 0 0.0 0 0.0 0 0.0 0 0.0 0 0.0 1 100.0130501002 Instructional Design and Technology - 2 50.0 1 25.0 1 25.0 0 0.0 0 0.0 0 0.0 0 0.0 0 0.0 0 0.0 4 100.013110100 Counseling 3 50.0 0 0.0 1 16.7 2 33.3 0 0.0 0 0.0 0 0.0 0 0.0 0 0.0 6 100.013121000 Early Childhood Education 0 0.0 0 0.0 0 0.0 0 0.0 0 0.0 0 0.0 0 0.0 0 0.0 0 0.0 0 0.013131500 Reading 0 0.0 0 0.0 0 0.0 0 0.0 0 0.0 0 0.0 0 0.0 0 0.0 0 0.0 0 0.02501010010 School Library and Information Scien 1 100.0 0 0.0 0 0.0 0 0.0 0 0.0 0 0.0 0 0.0 0 0.0 0 0.0 1 100.0302301002 Multicultural Studies in Education 0 0.0 0 0.0 0 0.0 0 0.0 0 0.0 0 0.0 0 0.0 0 0.0 0 0.0 0 0.0Total 14 53.8 3 11.5 4 15.4 3 11.5 0 0.0 0 0.0 2 7.7 0 0.0 0 0.0 26 100.0
Doctoal 130401002 Educational Management - Doctoral O 1 100.0 0 0.0 0 0.0 0 0.0 0 0.0 0 0.0 0 0.0 0 0.0 0 0.0 1 100.0Total 1 100.0 0 0.0 0 0.0 0 0.0 0 0.0 0 0.0 0 0.0 0 0.0 0 0.0 1 100.0Grand Total for Ethnicity by Gender 23 53.5 3 7.0 12 27.9 3 7.0 0 0.0 0 0.0 2 4.7 0 0.0 0 0.0 43 100.0
Figure 3d. FY 2014 School of Education
School, Degree and by Ethnicity

page 24 mlb; graduation trends fy10 thru fy14.xlsx
Bachelor's 30999901 Interdisciplinary Studies309999402 Interdisciplinary Studies-Early Childhoo309999404 Interdisciplinary Studies-Young Childre
TotalMaster's 13030100 Curriculum and Instruction
13040100 Educational Management13050100 Instructional Design and Technology130501002 Instructional Design and Technology - 13110100 Counseling13121000 Early Childhood Education13131500 Reading2501010010 School Library and Information Scien302301002 Multicultural Studies in EducationTotal
Doctoal 130401002 Educational Management - Doctoral OTotalGrand Total for Ethnicity by Gender
Figure 3d. FY 2014 School of Education
Fiscal Year 2014 Summary of Degrees Conferred by School, Degree and by Ethnicity
Female
White Black Hispanic Asian Am IndianInter-
national UnknownNative
Hawaiian Multi-racial Total
# % # % # % # % # % # % # % # % # % # %126 48.6 16 6.2 105 40.5 10 3.9 1 0.4 0 0.0 1 0.4 0 0.0 0 0.0 259 100.0
2 50.0 1 25.0 1 25.0 0 0.0 0 0.0 0 0.0 0 0.0 0 0.0 0 0.0 4 100.00 0.0 0 0.0 1 100.0 0 0.0 0 0.0 0 0.0 0 0.0 0 0.0 0 0.0 1 100.0
128 48.5 17 6.4 107 40.5 10 3.8 1 0.4 0 0.0 1 0.4 0 0.0 0 0.0 264 100.05 41.7 6 50.0 1 8.3 0 0.0 0 0.0 0 0.0 0 0.0 0 0.0 0 0.0 12 100.0
23 50.0 11 23.9 9 19.6 2 4.3 0 0.0 0 0.0 1 2.2 0 0.0 0 0.0 46 100.03 100.0 0 0.0 0 0.0 0 0.0 0 0.0 0 0.0 0 0.0 0 0.0 0 0.0 3 100.07 63.6 2 18.2 1 9.1 1 9.1 0 0.0 0 0.0 0 0.0 0 0.0 0 0.0 11 100.0
26 65.0 5 12.5 6 15.0 1 2.5 0 0.0 1 2.5 1 2.5 0 0.0 0 0.0 40 100.09 42.9 4 19.0 5 23.8 2 9.5 0 0.0 1 4.8 0 0.0 0 0.0 0 0.0 21 100.02 66.7 0 0.0 0 0.0 1 33.3 0 0.0 0 0.0 0 0.0 0 0.0 0 0.0 3 100.03 75.0 0 0.0 0 0.0 0 0.0 0 0.0 0 0.0 1 25.0 0 0.0 0 0.0 4 100.00 0.0 1 20.0 4 80.0 0 0.0 0 0.0 0 0.0 0 0.0 0 0.0 0 0.0 5 100.078 53.8 29 20.0 26 17.9 7 4.8 0 0.0 2 1.4 3 2.1 0 0.0 0 0.0 145 100.04 50.0 3 37.5 1 12.5 0 0.0 0 0.0 0 0.0 0 0.0 0 0.0 0 0.0 8 100.04 50.0 3 37.5 1 12.5 0 0.0 0 0.0 0 0.0 0 0.0 0 0.0 0 0.0 8 100.0
210 50.4 49 11.8 134 32.1 17 4.1 1 0.2 2 0.5 4 1.0 0 0.0 0 0.0 417 100.0