Embed Size (px)
Citation preview
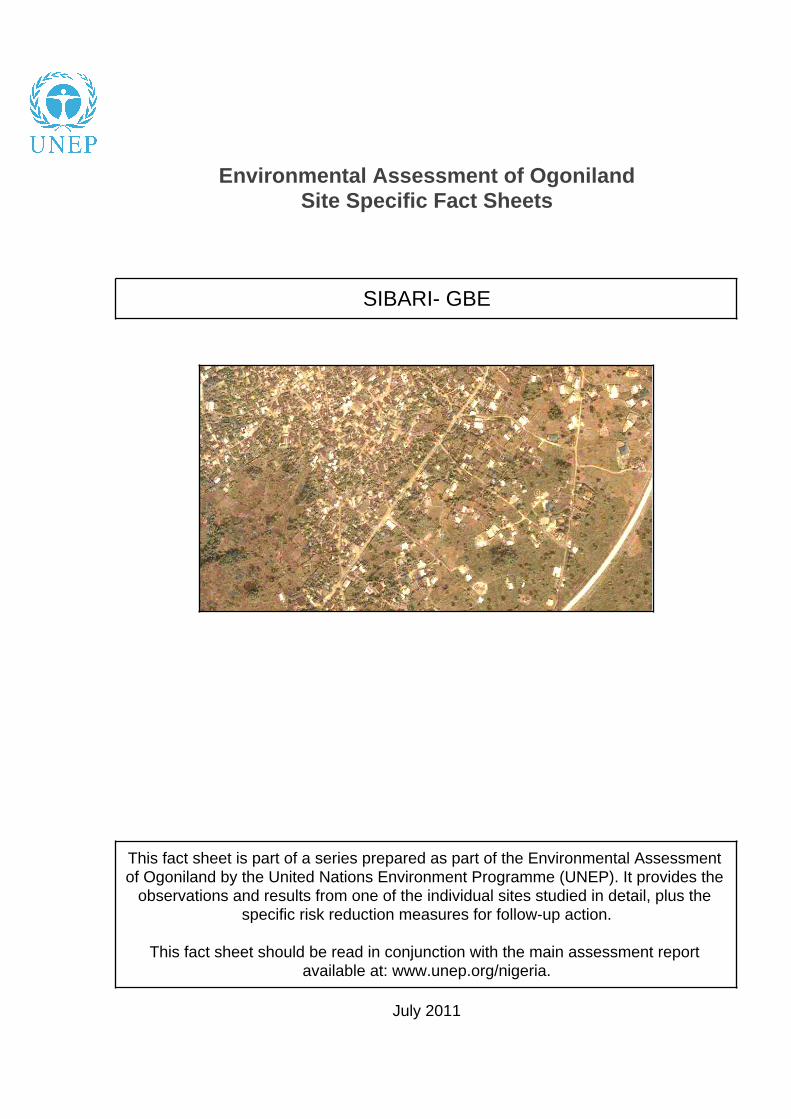
Environmental Assessment of OgonilandSite Specific Fact Sheets
SIBARI- GBE
This fact sheet is part of a series prepared as part of the Environmental Assessment of Ogoniland by the United Nations Environment Programme (UNEP). It provides the
observations and results from one of the individual sites studied in detail, plus the specific risk reduction measures for follow-up action.
This fact sheet should be read in conjunction with the main assessment report available at: www.unep.org/nigeria.
July 2011
July 2011 2 / 11
UNEP Environmental Assessment of Ogoniland
Site fact sheetSee Guide to content and terminology on last page.
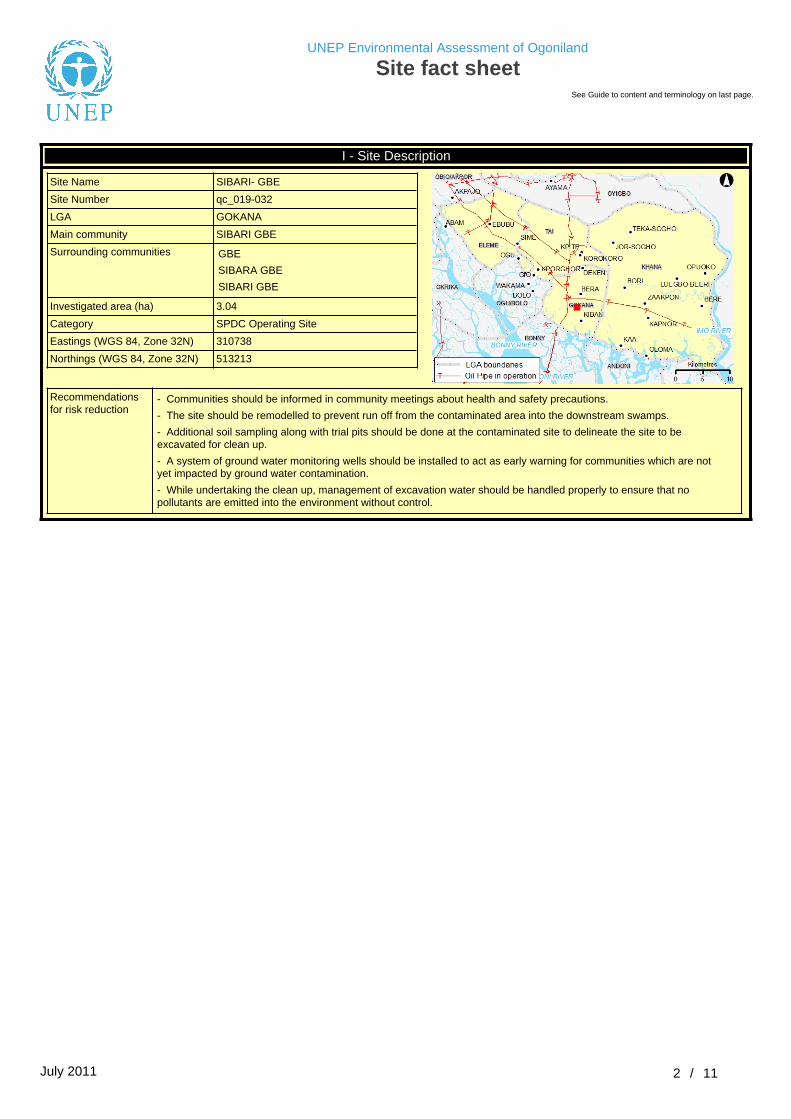
I - Site Description
Site Name SIBARI- GBE
Site Number qc_019-032
LGA GOKANA
Main community SIBARI GBE
Surrounding communities GBE
SIBARA GBE
SIBARI GBE
Investigated area (ha) 3.04
Category SPDC Operating Site
Eastings (WGS 84, Zone 32N) 310738
Northings (WGS 84, Zone 32N) 513213
Recommendations for risk reduction
- Communities should be informed in community meetings about health and safety precautions.
- The site should be remodelled to prevent run off from the contaminated area into the downstream swamps.
- Additional soil sampling along with trial pits should be done at the contaminated site to delineate the site to be excavated for clean up.
- A system of ground water monitoring wells should be installed to act as early warning for communities which are not yet impacted by ground water contamination.
- While undertaking the clean up, management of excavation water should be handled properly to ensure that no pollutants are emitted into the environment without control.
July 2011 3 / 11
II - Oilfield Infrastructure Type
Wells BOMU-033 (closed in)
Flowstations No
Manifolds No
Flaresites No
Oil pipeline in operation No
NNPC crude line No
NNPC product line No
III - Spill History
Spills reported by SPDC Incident Number Incident Date
1986_0059 19860218
Spill reported by community Yes
IV - Data Screening
Assessment criteriaSoil contamination Nigerian standards EGASPIN (intervention value 5000 mg/kg; target value 50 mg/kg)
Groundwater contamination Nigerian standards EGASPIN (intervention value 600 µg/l; target value 50 µg/l)
Sediment contamination Nigerian standards EGASPIN (intervention value 5000 mg/kg; target value 50 mg/kg)
Drinking water contamination WHO guidelines (benzene: 10 µg/l)Nigerian drinking water standards (mineral oils: 3 µg/l)
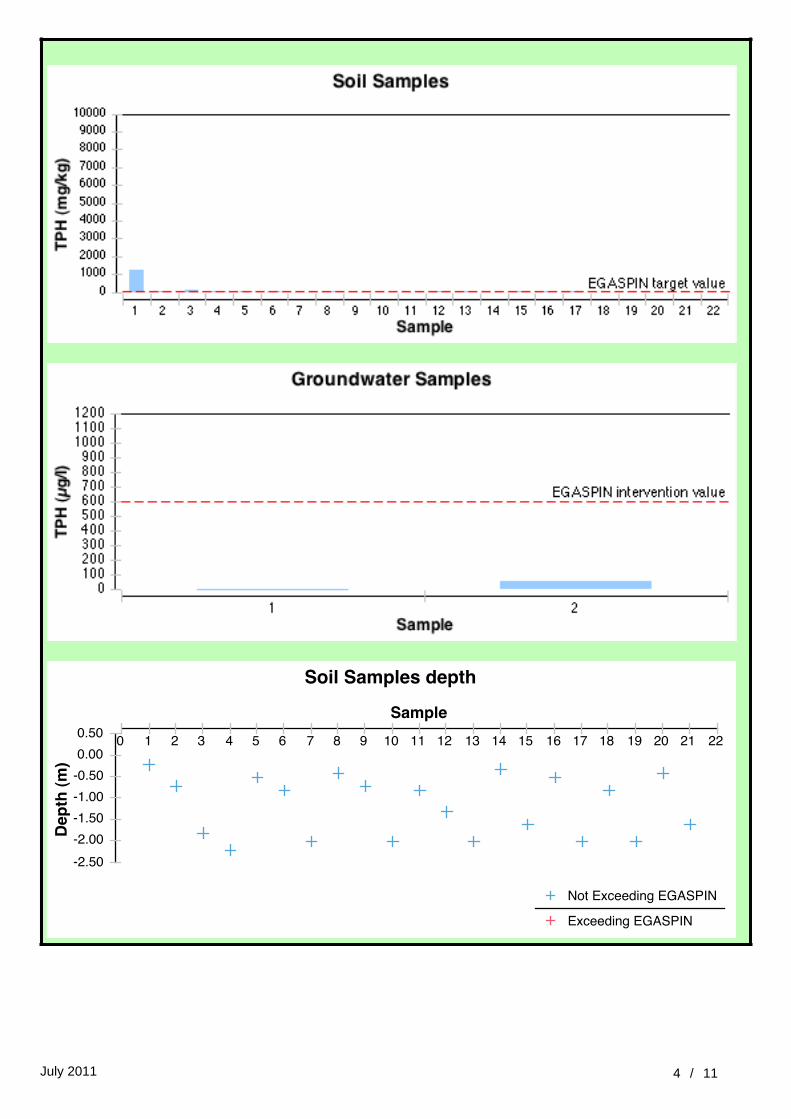
Number of soil samples 22
Deepest investigation (m) 2.2
Maximum soil TPH (mg/kg) 1,220.000
Number of soil measurements greater than EGASPIN intervention value 0
Deepest sample greater than EGASPIN (m) 0
Number of soil measurements below 1m 10
Number of soil measurements below 1m greater than EGASPIN intervention value 0
Number of ground water samples 2
Maximum groundwater TPH (µg/l) 49
Number of groundwater measurements greater than EGASPIN intervention value 0
Number of community well samples 0
Presence of hydrocarbons in community wells Not applicable
Number of CL sediment samples 0
Maximum CL sediment TPH (mg/kg) Not applicable
Number of CL sediment measurements greater than EGASPIN intervention value 0
Presence of hydrocarbons in sediment above EGASPIN intervention value Not applicable
July 2011 4 / 11
July 2011 5 / 11
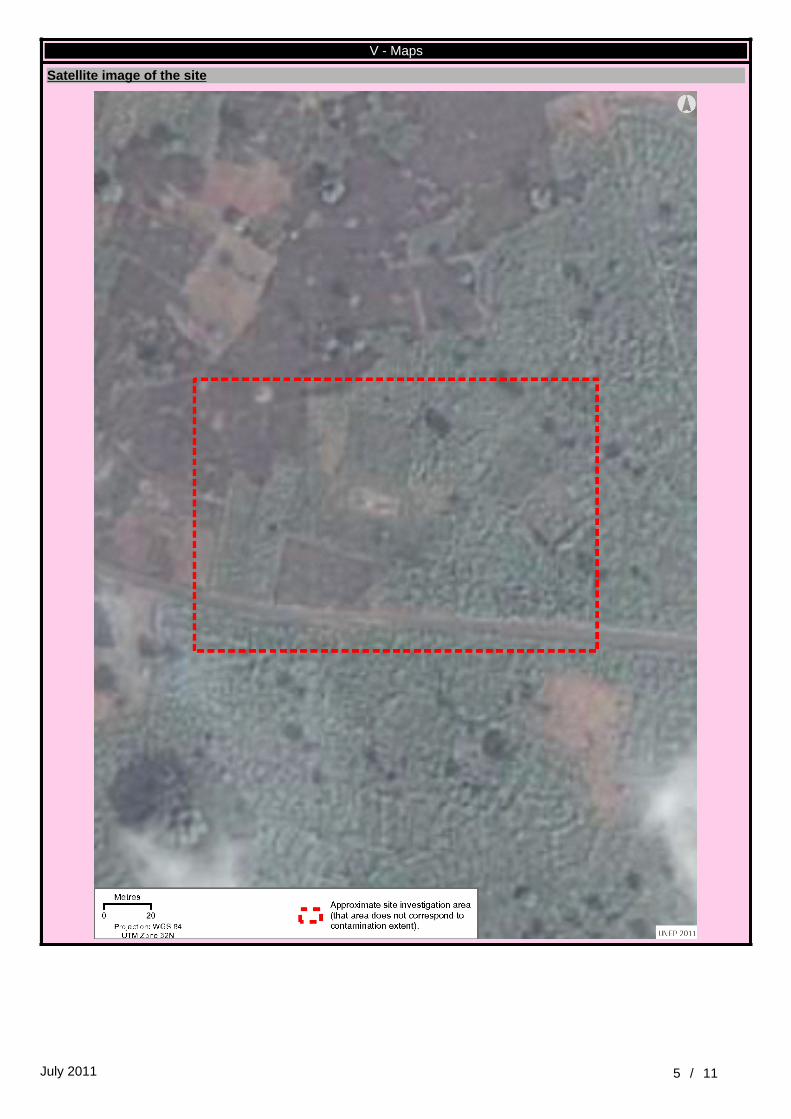
V - Maps
Satellite image of the site
July 2011 6 / 11
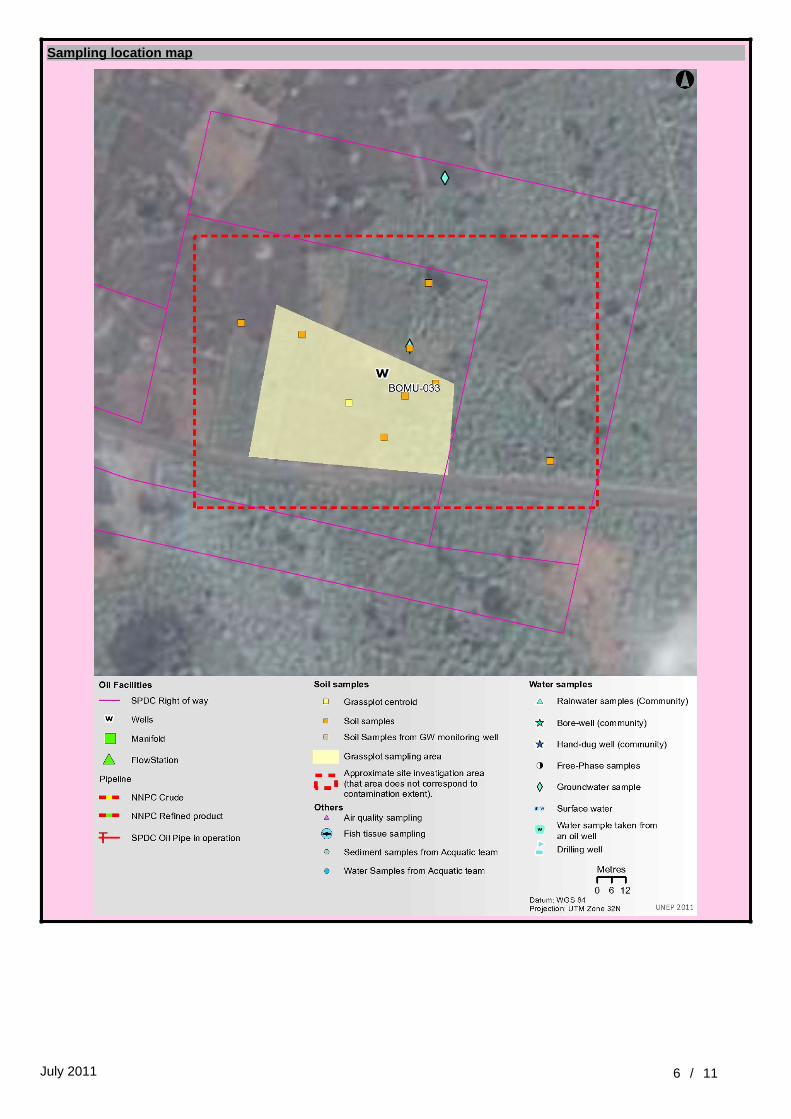
Sampling location map
July 2011 7 / 11
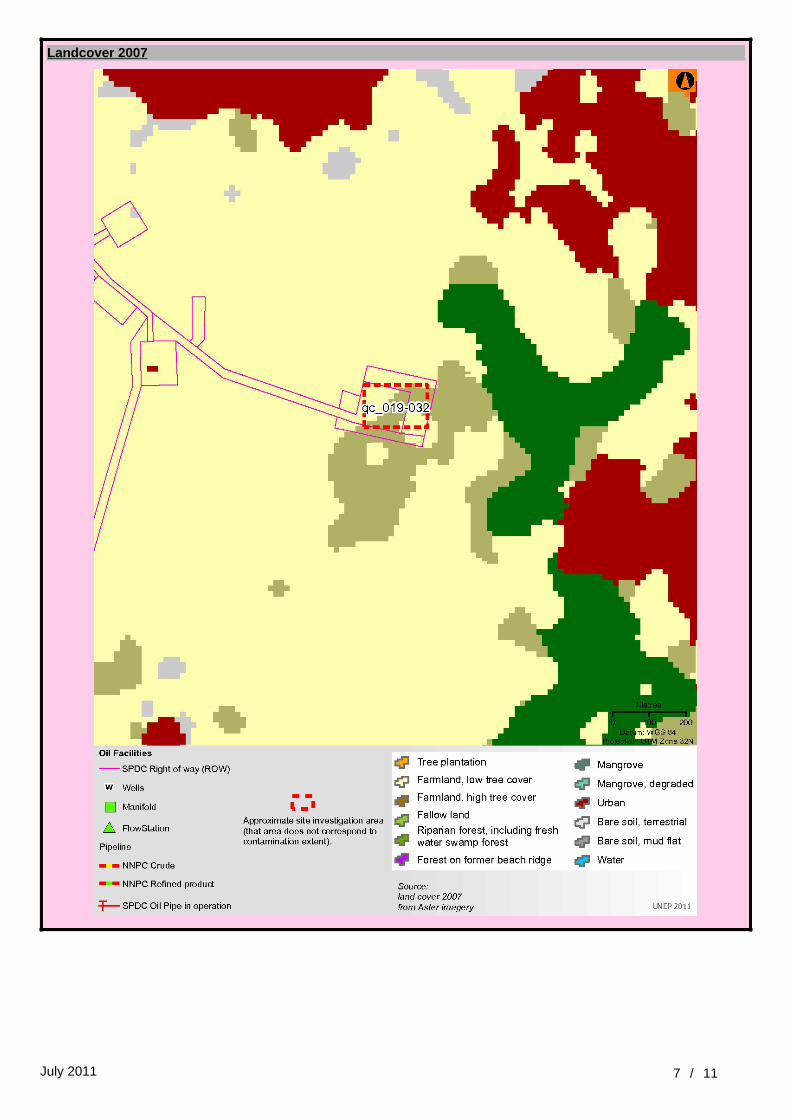
Landcover 2007
July 2011 8 / 11
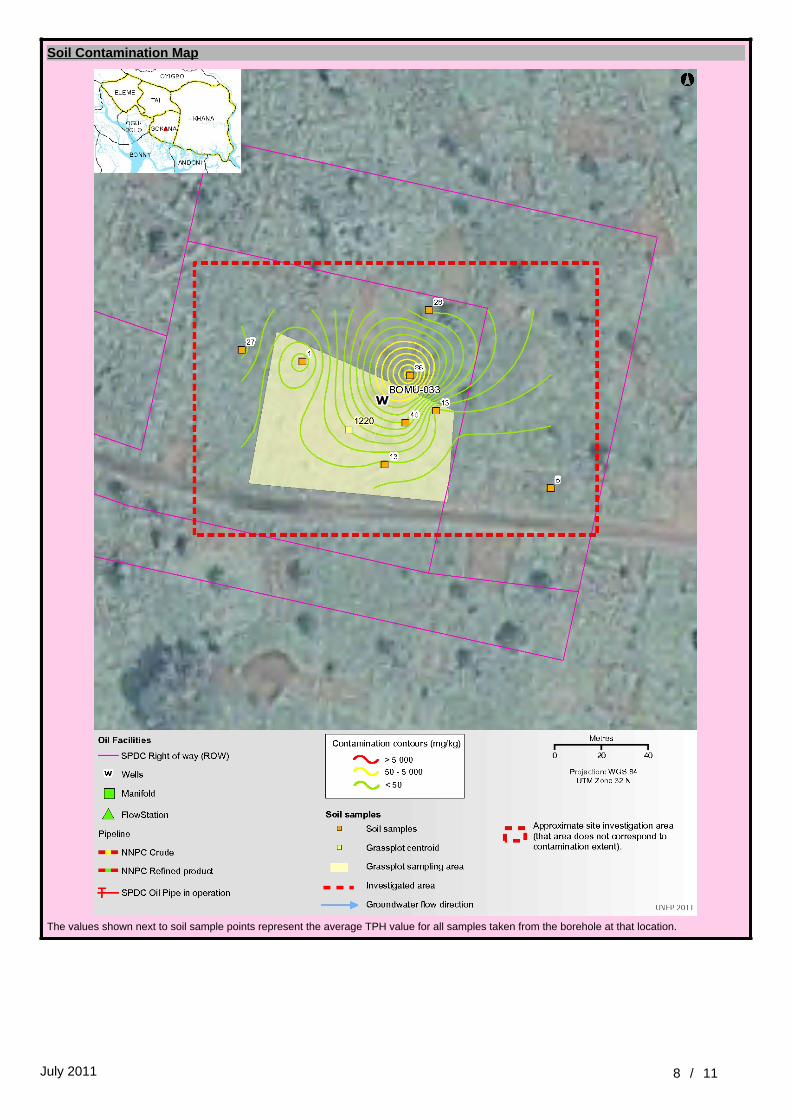
Soil Contamination Map
The values shown next to soil sample points represent the average TPH value for all samples taken from the borehole at that location.
July 2011 9 / 11
VI - Photos
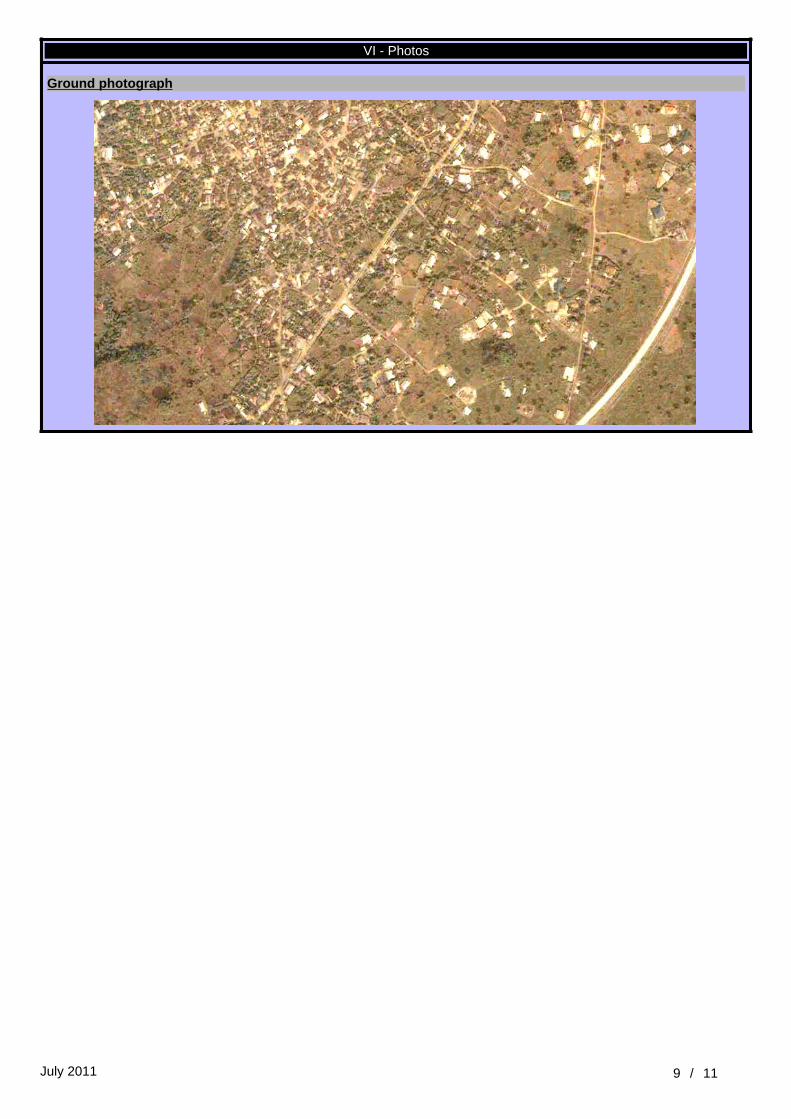
Ground photograph
July 2011 10 / 11
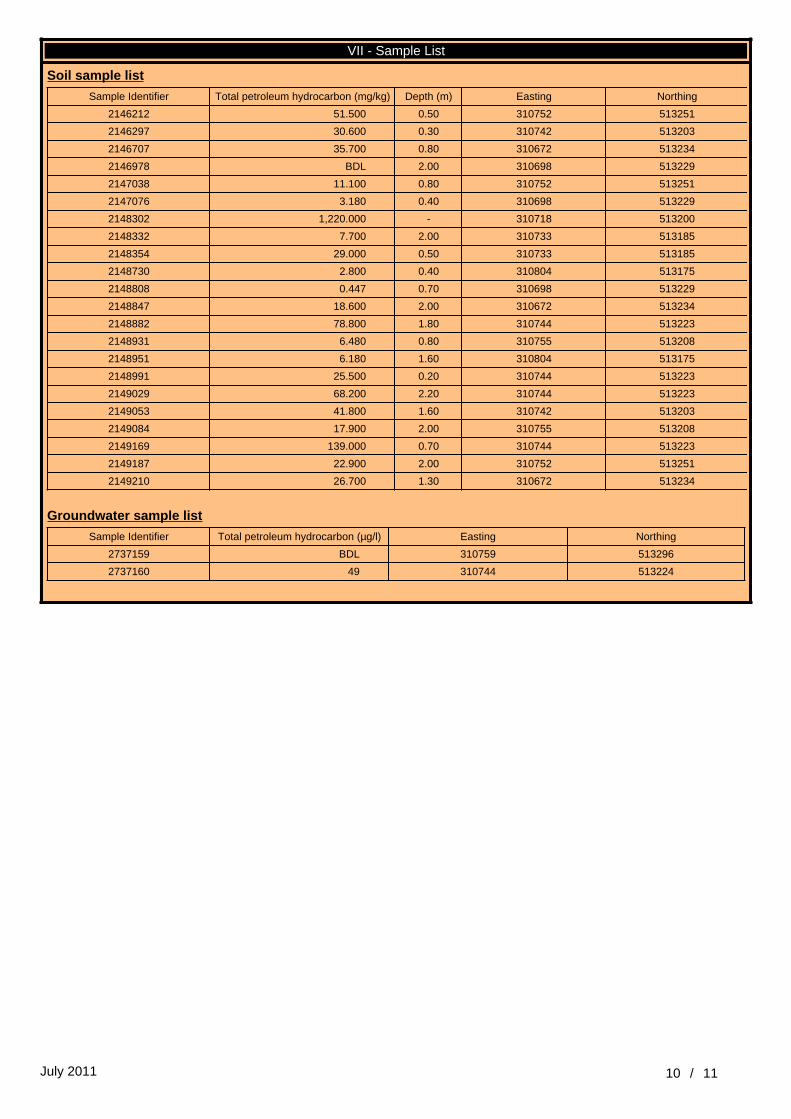
VII - Sample List
Soil sample list
Sample Identifier Total petroleum hydrocarbon (mg/kg) Depth (m) Easting Northing
2146212 51.500 0.50 310752 513251
2146297 30.600 0.30 310742 513203
2146707 35.700 0.80 310672 513234
2146978 BDL 2.00 310698 513229
2147038 11.100 0.80 310752 513251
2147076 3.180 0.40 310698 513229
2148302 1,220.000 - 310718 513200
2148332 7.700 2.00 310733 513185
2148354 29.000 0.50 310733 513185
2148730 2.800 0.40 310804 513175
2148808 0.447 0.70 310698 513229
2148847 18.600 2.00 310672 513234
2148882 78.800 1.80 310744 513223
2148931 6.480 0.80 310755 513208
2148951 6.180 1.60 310804 513175
2148991 25.500 0.20 310744 513223
2149029 68.200 2.20 310744 513223
2149053 41.800 1.60 310742 513203
2149084 17.900 2.00 310755 513208
2149169 139.000 0.70 310744 513223
2149187 22.900 2.00 310752 513251
2149210 26.700 1.30 310672 513234
Groundwater sample list
Sample Identifier Total petroleum hydrocarbon (µg/l) Easting Northing
2737159 BDL 310759 513296
2737160 49 310744 513224
July 2011 11 / 11
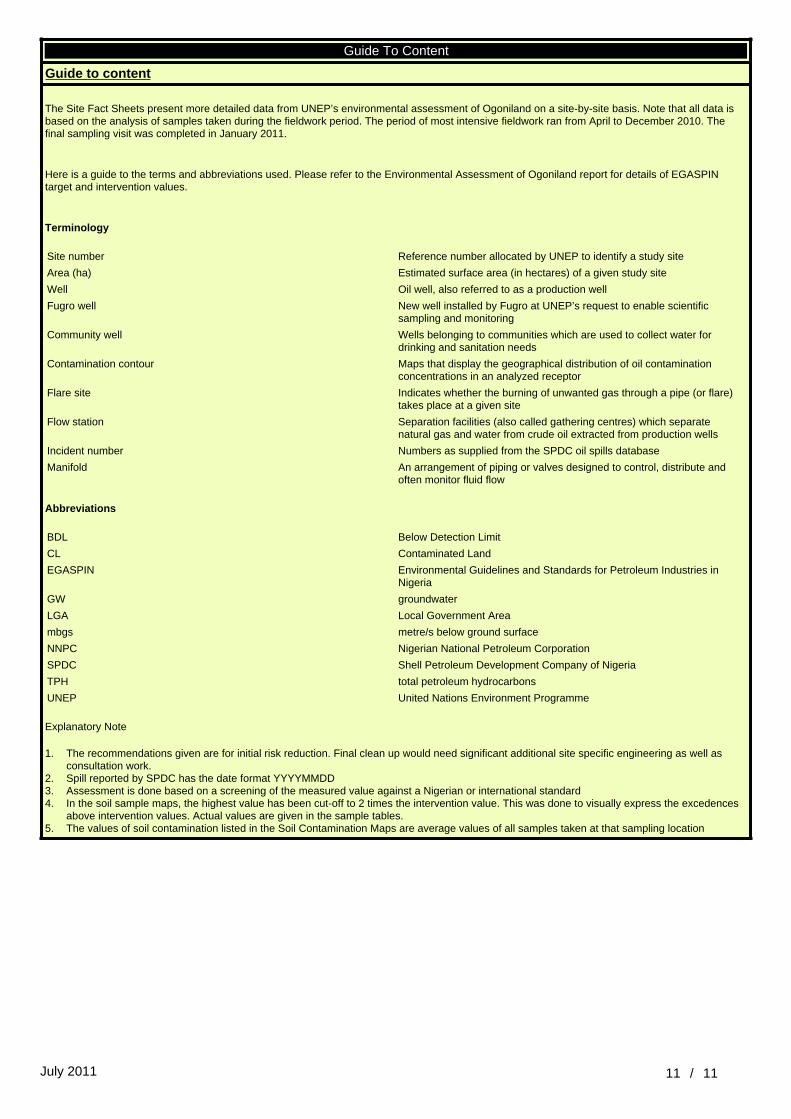
Guide To Content
Guide to content
The Site Fact Sheets present more detailed data from UNEP’s environmental assessment of Ogoniland on a site-by-site basis. Note that all data is based on the analysis of samples taken during the fieldwork period. The period of most intensive fieldwork ran from April to December 2010. The final sampling visit was completed in January 2011.
Here is a guide to the terms and abbreviations used. Please refer to the Environmental Assessment of Ogoniland report for details of EGASPIN target and intervention values.
Terminology
Site number Reference number allocated by UNEP to identify a study site
Area (ha) Estimated surface area (in hectares) of a given study site
Well Oil well, also referred to as a production well
Fugro well New well installed by Fugro at UNEP’s request to enable scientific sampling and monitoring
Community well Wells belonging to communities which are used to collect water for drinking and sanitation needs
Contamination contour Maps that display the geographical distribution of oil contamination concentrations in an analyzed receptor
Flare site Indicates whether the burning of unwanted gas through a pipe (or flare) takes place at a given site
Flow station Separation facilities (also called gathering centres) which separate natural gas and water from crude oil extracted from production wells
Incident number Numbers as supplied from the SPDC oil spills database
Manifold An arrangement of piping or valves designed to control, distribute and often monitor fluid flow
Abbreviations
BDL Below Detection Limit
CL Contaminated Land
EGASPIN Environmental Guidelines and Standards for Petroleum Industries in Nigeria
GW groundwater
LGA Local Government Area
mbgs metre/s below ground surface
NNPC Nigerian National Petroleum Corporation
SPDC Shell Petroleum Development Company of Nigeria
TPH total petroleum hydrocarbons
UNEP United Nations Environment Programme
Explanatory Note
1. The recommendations given are for initial risk reduction. Final clean up would need significant additional site specific engineering as well as consultation work.
2. Spill reported by SPDC has the date format YYYYMMDD3. Assessment is done based on a screening of the measured value against a Nigerian or international standard4. In the soil sample maps, the highest value has been cut-off to 2 times the intervention value. This was done to visually express the excedences
above intervention values. Actual values are given in the sample tables.5. The values of soil contamination listed in the Soil Contamination Maps are average values of all samples taken at that sampling location