Embed Size (px)
Citation preview
SiC-FET methanol sensors for process control
and leakage detection
Zhafira Darmastuti, P. Bhattacharyya, Mike Andersson, Jayita Kanungo, Sukumar Basu, Per-
Olov Käll, Lars Ojamäe and Anita Lloyd Spetz
Linköping University Post Print
N.B.: When citing this work, cite the original article.
Original Publication:
Zhafira Darmastuti, P. Bhattacharyya, Mike Andersson, Jayita Kanungo, Sukumar Basu, Per-
Olov Käll, Lars Ojamäe and Anita Lloyd Spetz, SiC-FET methanol sensors for process
control and leakage detection, 2013, Sensors and actuators. B, Chemical, (187), SI, 553-562.
http://dx.doi.org/10.1016/j.snb.2013.04.019
Copyright: Elsevier
http://www.elsevier.com/
Postprint available at: Linköping University Electronic Press
http://urn.kb.se/resolve?urn=urn:nbn:se:liu:diva-85636
1
SiC-FET Methanol Sensors for Process Control and Leakage Detection
Z. Darmastutia*, P. Bhattacharyyab, M. Anderssona, J. Kanungoc, S. Basuc, P-O. Källa, L. Ojamäea, A. Lloyd Spetza a Dept. of Physics, Chemistry and Biology, Linköping University, Sweden b Dept. of Electronics and Telecommunication Engineering, Bengal Engineering and Science University, India c IC Design & Fabrication Centre, Department of Electronics and Telecommunication Engineering, Jadavpur University, India
Abstract
Two types of SiC based Field Effect Transistor sensors, with Pt or Ir gate, were tested to
detect methanol in the concentration range 0-1600 ppm for both process control and
leak detection applications. The methanol response was investigated both with and
without oxygen, since the process control might be considered as oxygen free
application, while the sensor is operated in air during leak detection. Pt sensors offered
very fast response with appreciably high response magnitude at 200oC, while Ir sensors
showed both higher response and response time up to 300oC, but this decreased
considerably at 350oC. Cross sensitivity effect in presence of oxygen, hydrogen, propene
and water vapor was also investigated. The presence of oxygen improved the response
of both sensors, which is favorable for the leak detection application. Hydrogen had a
large influence on the methanol response of both sensors, propene had a negligible
influence, while water vapor changed direction of the methanol response for the Pt
sensor. The detection mechanism and different sensing behavior of Pt and Ir gate sensors
were discussed in the light of model reaction mechanisms derived from hybrid density-
functional theory quantum-chemical calculations.
Key words: SiC-FET sensor, methanol, quantum-chemical calculation, Pt, Ir, gas sensor.
2
1. Introduction
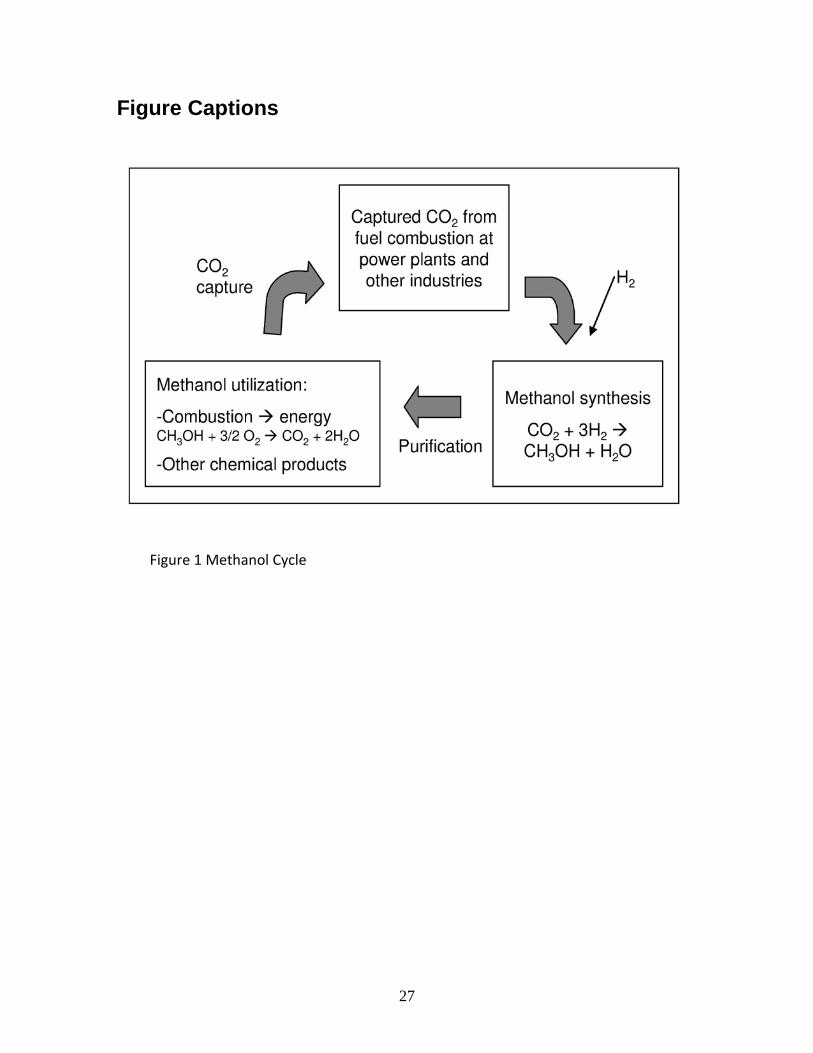
The high industrial CO2 emissions are believed to be the principal driving force for
climate change and different types of CO2 capture techniques are now being considered
high priority projects in thermal power generation plants. However, the post processing
of such captured CO2 remains a question of great concern. Development of the process
of CO2 conversion to methanol or other rich organic compounds [1] gives a very
promising option to re-use captured CO2 as described in Fig.1. This option is especially
interesting because it offers the possibility to use methanol as an energy carrier for
energy produced from unreliable and intermittent primary energy sources such as solar,
wind, or tidal power plants [1]. With this option, the H2 (Fig. 1) can be generated from
renewable energy sources and will thus close the energy cycle. Recent advancement in
the catalysis area contributes to the higher methanol yield at lower energy consumption
[2],[3] and this increases the importance of this process.
However, methanol is toxic even at modest concentrations (down to 200 ppm) and large
scale handling of the substance has environmental implications, similar to those applying
to conventional liquid fuels. Methanol sensors that can work at different ranges of
methanol concentrations will therefore be very useful both for process control and leak
detection.
The most accurate methods to measure methanol in an industrial facility is by wet
chemistry methods, where the gas is sampled, cooled, and flowed to an external

3
measuring device in the lab. However, this measurement results sometimes do not really
represent the characteristic inside the process unit and it takes time. In-situ
measurement is always preferable for industrial system, with wet chemistry methods as
a reference for the control purpose. Electrochemical cell provides an accurate
measurements, however, due to the electrolyte limitation, it is usually not possible to
operate the sensor above 50oC [4]. Therefore, a bypass will be required for these
sensors. This approach will increase the cost and decrease the overall accuracy. Metal
oxide sensors [5] [6] are also common for alcohol detection, including methanol. It can
tolerate high temperature for in-situ measurement. However, it is limited by the oxygen
content and the humidity of the process line. They usually can only operate with 20%
oxygen content, resulting in the need of a bypass with the injection of additional air.
Infrared optical sensors are usually preferable. However, they are usually much more
expensive than the chemical sensors.
SiC based Field Effect Transistor (SiC-FET) gas sensors have proven excellent long term
stability at high temperature and in harsh environments [7][8]. The sensitivity and
selectivity of SiC-FET sensors can be tailored toward a specific test gas e.g. by changing
the operating temperature and sensing (gate) material [7]. Hydrogen-containing gases
like methanol, will typically dissociate upon adsorption on the sensor surface and
released hydrogen will form a layer of polarized OH groups on the (gate) insulator
surface, which will change the conductivity of the channel between source and drain in
the transistor device, which in turn causes a change of the voltage-current profile [7][8]..
4
In our earlier study, J. Kanungo et al reported the characteristics of SiC-FET sensors
where either porous Pt or Ir metal were used as gate material for the detection of
gaseous methanol in high concentrations (0.3-5%) [9]. We concluded that the Pt sensors
(at the optimum temperature of 200oC) have higher sensitivity than the Ir sensors (at the
optimum temperature of 250oC), and that hydrogen cause cross-sensitivity at their
respective optimum operating temperature. The present study is a continuation of this
work where the following novel aspects are addressed:
– The study covers low (0 - 200 ppm) and medium concentrations (200-1600 ppm) of
methanol.
– Besides hydrogen and propene, a study of the influence of different oxygen
concentrations in the carrier gas has been carried out, as well as the influence of
humidity.
– A more comprehensive theoretical study on the decomposition and oxidation of
methanol on the catalytic metal gate (Pt or Ir) has also been performed. The study
consists of the computation of energies and structures of the intermediate
structures, activation energies for each steps of the surface reactions, and a
comparison of the reaction mechanisms with and without the presence of oxygen.
5
2. Material and Methods
2.1 Experimental
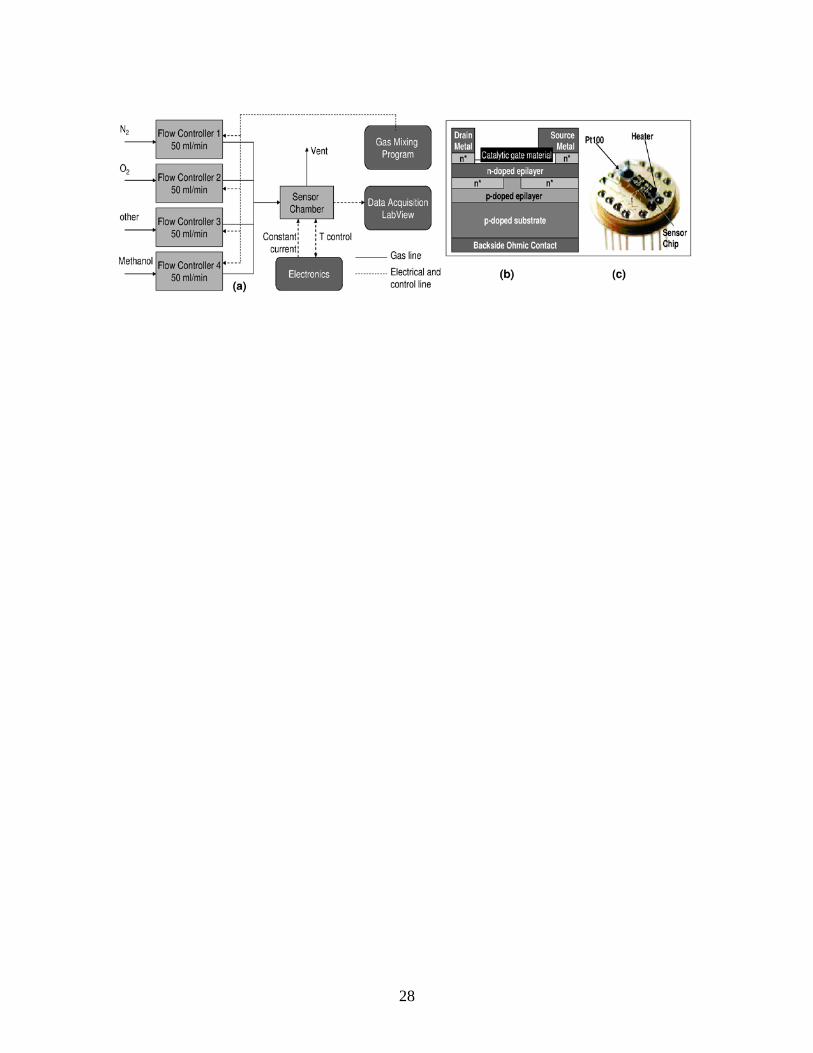
The sensor structure is described in Fig. 2(b). The sensing layer of Pt or Ir with 20 nm
thickness was deposited as the catalytic metal gate of the SiC transistor device by DC
magnetron sputtering. In order to form three phase boundaries, the film deposition was
performed at a pressure of 50 mTorr to create a porous film. The film outside the gate
area was removed by lift-off technique. The SiC transistor device is a commercial device
provided by SenSiC AB (www.sensic.se). It is fully processed except for the gate metal.
The device has a lift off pattern for the gate material, which makes it very convenient to
process tailor made sensor devices for a certain application. The SiC substrate is naturally
doped by nitrogen and epilayers are grown with nitrogen for n-type SiC and boron for p-
type SiC. The Ohmic contacts to drain, source and the backside of the SiC substrate
consist of 50 nm Ni (annealed at 950⁰C for 5 min in Ar), 50 nm TaSix as adhesion layer,
and 400 nm Pt as oxygen diffusion barrier for high temperature operation.
The sensor chips were mounted into 16 pin headers together with individual heaters and
temperature sensors as shown in Fig 2(c). The headers acted as a port for electrical and
data connections to and from the sensors.
The measurement set up is shown in Fig. 2(a). The gas testing rig consisted of several
mass flow controllers operated by a gas mixing program. Different concentrations of
methanol were injected to the sensor chamber by adjusting the flow of the methanol
and the carrier gas. The methanol concentration was varied between 0-1600 ppm. The
6
methanol source was in the form of gas, from two gas bottles with different
concentrations of methanol: 200 ppm for low concentrations and 2000 ppm for medium
concentrations, diluted in N2. The operating temperature was varied between 150oC to
350oC. The experiment was performed with two different carrier gases: pure N2 or 20%
O2 in N2 and for some experiments, 10% O2 in N2. The response was collected from the
sensor every 2s. The sensor response, response time, and recovery time were calculated
in the same way as described in the previous study [9]. Response was defined as the
difference between the sensor signal when the test gas was introduced and the baseline.
Response time was measured as the time needed to achieve 90% of the full response.
Recovery time was defined as when the sensor signal had relaxed back to 10% of the
baseline. For Pt, as the sensing material, in total 6 sensor devices (on two sensor chips)
were tested and for Ir three devices (on the same sensor chip).
Similar to the earlier study for higher concentrations of methanol [9], the cross sensitivity
to hydrogen and propene was also studied for the lower concentrations of methanol
investigated in this paper. Besides, changes in response characteristics of the sensors
towards different oxygen concentrations in the carrier gas and the influence of humidity
are also reported in the present work. The study of the influence of humidity was
performed by passing the test gas through a water bottle and assuming that the resulting
gas was saturated with water vapor at 20oC, which give a water content of about 2%.
7
2.2 Theoretical Calculations
The theoretical study concerned the modeling of the surface reactions on the catalytic
metal gate by quantum chemical calculations. The Gaussian03 program [10] with the
B3LYP [11][12][13] hybrid density functional and the LanL2MB [11][12][13] basis set was
employed for the calculations.
The catalytic metal gate surface was modeled using clusters of metal atoms. Different
sizes and shapes of Pt and Ir clusters were investigated by geometry optimization
calculations to find the energy-minimum structures. In general, increasing the size of the
cluster resulted in more stable structures, but also higher computational costs. The
stability was indicated by lower energy difference between the total energy of the cluster
divided by the number of atoms in the cluster, and the energy of a single atom.
As a compromise between those two parameters, clusters consisting of 14 atoms were
chosen for both Pt and Ir because they were adequately small, sufficiently stable, and
provided a sufficient number of atoms at the surface to allow for the interaction with
methanol and other adsorbates.
Two sets of surface reactions were investigated for both Pt and Ir: with and without
oxygen. For oxygen at the sensor’s operating temperature, dissociative adsorption on the
metal surface is more favorable than molecular adsorption [14]. Therefore, these
calculations were performed with oxygen dissociated into O atoms on the metal surface.
8
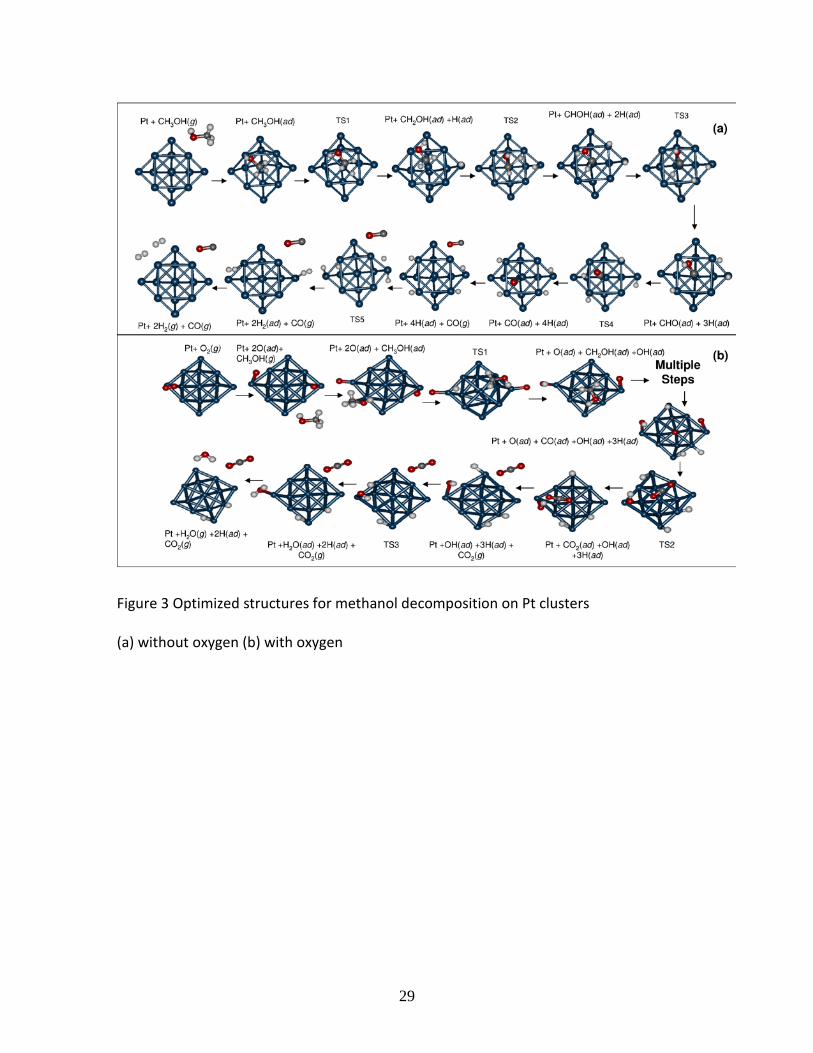
In agreement with the previous studies [15][16][17], the modeling of the methanol
decomposition in this study involved the reaction mechanisms below. The numbers in
the parentheses are the sequential numbers for each intermediate structure in the
reaction mechanism for which the energies are presented, also later given in Fig. 12 and
13. The optimized structures of each species during methanol decomposition on the Pt
surface are shown in Fig. 3, and the same mechanism is applied to the Ir surface. In
between the stable species (reactants, intermediates and products), transition states (TS)
were localized to determine the activation energy for each reaction.
a. The core reaction steps for methanol decomposition without oxygen (see also Fig. 3(a)
and Section 3.3)
CH3OH (g) CH3OH (ad) (2)
CH3OH (ad) (2) TS1 (3) {CH2OH (ad) + H (ad)} (4)
(4) TS2 (5) {CHOH (ad) + 2H (ad)} (6)
(6) TS3 (7) {COH (ad) + 3H (ad)} (8)
(8) TS4 (9) {CO (ad) + 4H (ad)} (10)
(10) CO (g) + 4H (ad) (11)
2 x {H (ad) + H (ad)} TS5 (12) 2H2 (ad) (13)
H2 (ad) H2 (g)
9
Structure (1) (the reactants) is represented by the bare metal cluster and free
methanol, i.e. M_14 + CH3OH(g) and structure (14) (the products) is M_14 + CO (g) +
2H2(g). M is either Pt or Ir.
b. The core reaction steps for methanol oxidation with oxygen present (see also Fig. 3(b)
and Section 3.3)
M_14 (1) + O2 (g) 2O (ad) (2)
CH3OH (g) + 2O (ad) {CH3OH (ad) + 2O (ad)} (3)
{CH3OH (ad) + 2O (ad)} (3) TS1 (4) {CH2OH (ad) + OH (ad) + O (ad)} (5)
(5) Multiple steps {O-CO (ad) + 3H (ad) + OH (ad)} (7)
(7) TS2 (8) {CO2 (ad) + 3H (ad) + OH (ad)} (9)
(9) {3H (ad) + OH (ad)} (10) + CO2 (g)
{2H (ad) + OH (ad) + H (ad)} (10) TS3 (11) {2H (ad) + H2O (ad)} (12)
(12) 2H (ad) (13) + H2O (g)
Also the remaining two H atoms will react with oxygen to form OH groups and water
and will be released from the surface.
The energies for the structures participating in the reactions on the Pt and Ir surfaces
were compared to study the different characteristics of the sensing layers. For the
reaction with oxygen present there were multiple reaction steps that were not explicitly
investigated, in order to focus on the processes of adsorption and desorption (see
10
Section 3.3). However, these reactions may by different for Pt and Ir, which deserves
further studies in the future.
3. Results and Discussion
3.1 Sensor characterizations
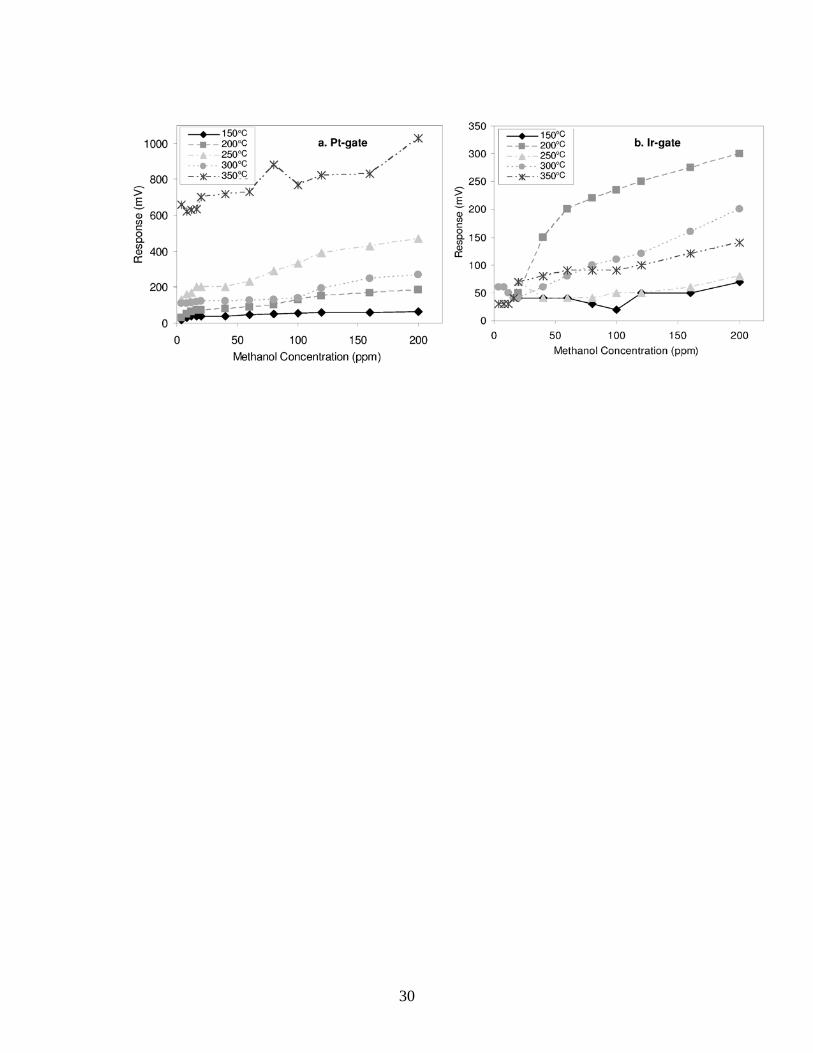
The first sets of measurements were performed at a low concentration of methanol (0-
200 ppm) with N2 as carrier gas. These tests were intended to test the sensor for process
control applications. As shown in Fig. 4, the maximum response was achieved at 350oC
for Pt sensors (a) and at 200oC for Ir sensors (b). It was also observed that for methanol
concentrations lower than 20 ppm, both type of sensors could only detect if there was
methanol present or not. The response starts to be proportional to the methanol
concentration at around 50 ppm. In this case, the sensors can be utilized as a process
control instrument down to a methanol concentration of 50 ppm.
For sensors like SiC-FET, which detect the electric field induced by the adsorbed species
on the sensor surface, there is normally a maximum operation temperature for a certain
gas response, which was demonstrated for NH3 and CO detection (in 10%
oxygen/nitrogen atmosphere) [18][19]. This is because adsorption of gases increases at
lower temperatures, while an increase in temperature normally speeds up chemical
reactions and may even change reaction pathways. Temperature affects the kinetics of
all chemical reactions. At low temperatures, the molecular species adsorb stronger, but it
is harder to desorb them, and the overall reaction kinetics is slower. At higher
11
temperatures, the chemical species adsorb less strong, but the reaction kinetics and the
desorption rate are faster. This is implying that there is an optimum temperature at
which the overall reactions proceeds most efficiently in order to get optimum sensing
behavior of the gas sensor. Fig. 4(a) shows that the maximum response for Pt-gate
sensors is at 250oC, and then the response decreases at 300oC. However, it increases
again at 350oC. The results suggest that at high temperature, the adsorbed species on
the sensor surface might overcome the energy barrier for additional reactions to occur.
There is possibly other species formed, which are detected by the sensors.
In the case of the Ir-gate sensors, it can be observed in Fig. 4(b) that the highest response
is achieved at 200oC. However, the response at 300oC and 350oC is higher than the
response at 250oC. Thus, also on the Ir sensor surface, the chemical reactions seem to
give rise to different species, which are detected at different temperatures.
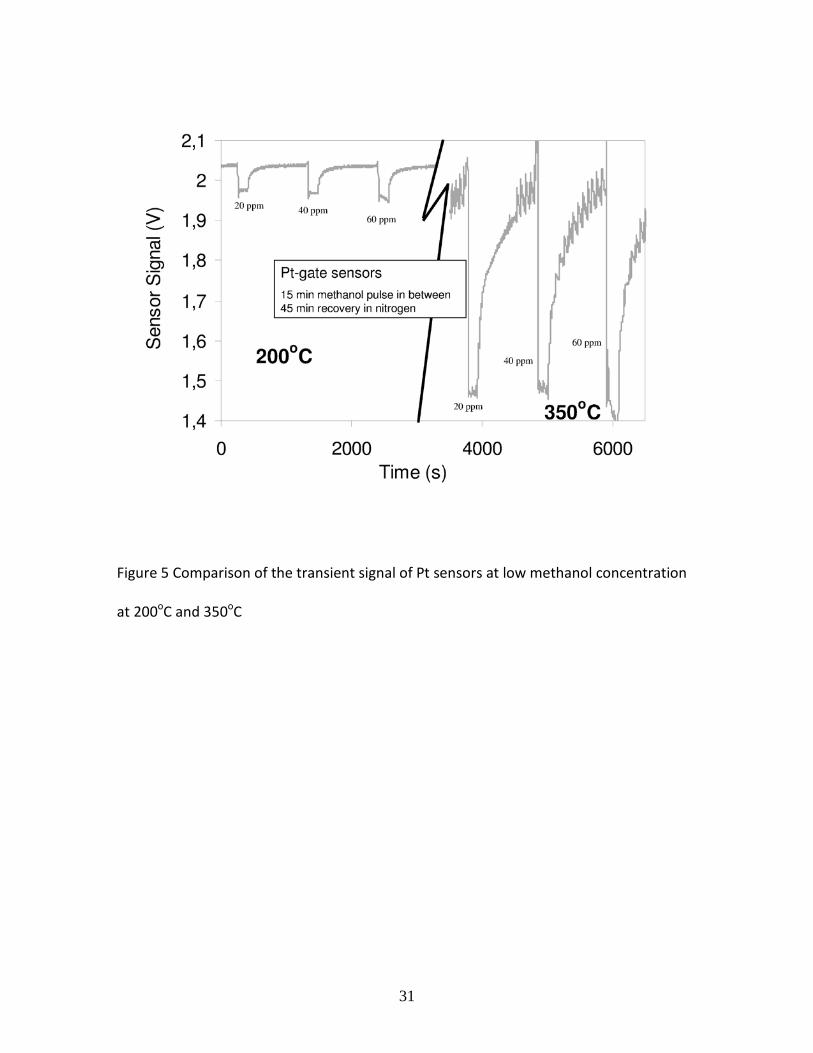
Furthermore, when comparing the transient signals as shown in Fig. 5, the preferable
operating temperature is actually 200oC for Pt at the low methanol concentration. With
response and recovery times of the order of 50-100s and 300-700s, respectively, the Pt
sensors are very slow and unstable at 350oC when compared to the transient responses
at 200oC, which are fast and stable. This also indicates a different chemistry on the
sensor surface at 200oC and 350oC.
12
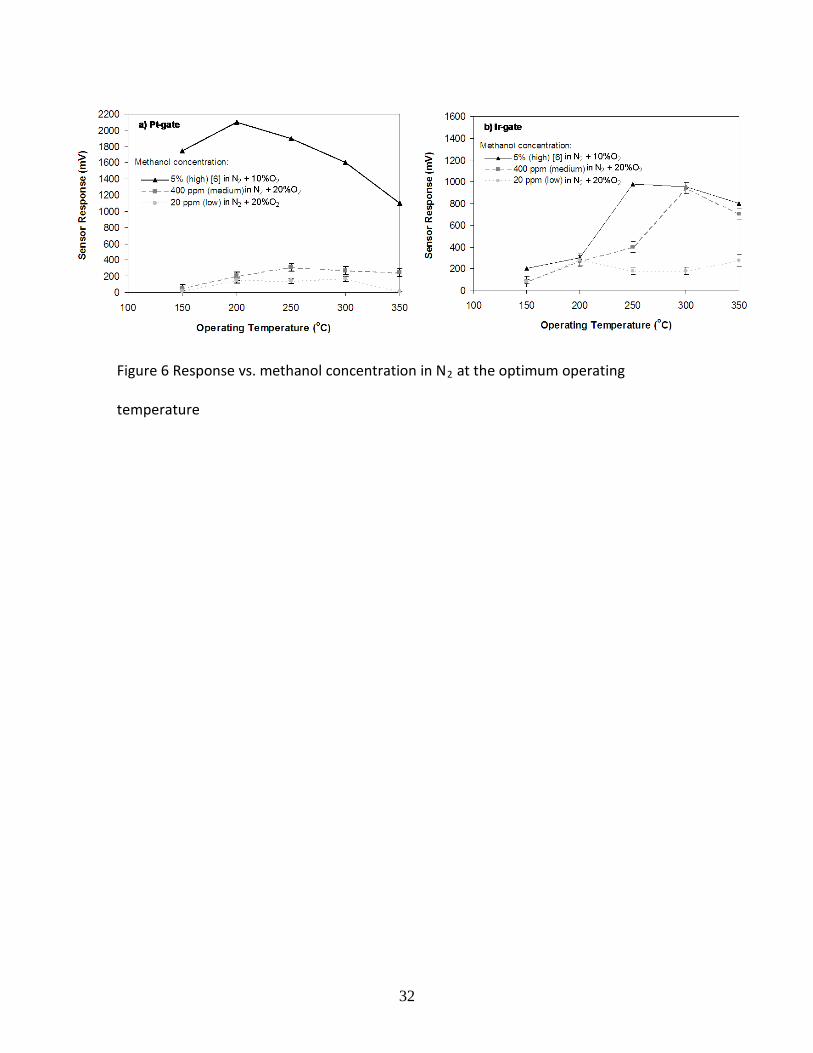
In Fig. 4 the response level of Pt is higher than that for Ir. However, Fig. 6 reveals a
reverse order at methanol concentration of 300-1600 ppm. In the later concentration
range the Ir sensors show higher response and sensitivity (the derivative of the response
versus the methanol concentration). In these measurements, the dynamic range of the Ir
sensors in Fig. 6 is 50-1600 ppm, while for the Pt sensors it is only 50 to about 200 ppm.
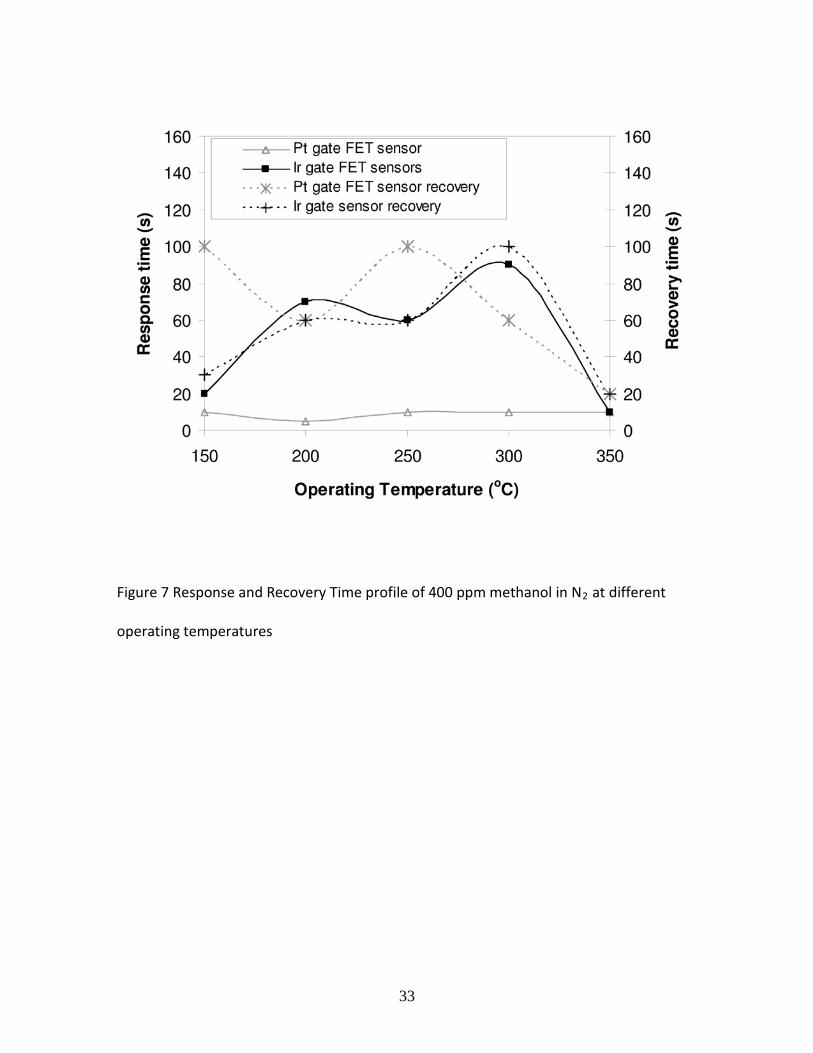
As shown in Fig. 7 for 400 ppm methanol, the operating temperature that gives both the
fastest response and recovery time is 350oC for both Pt and Ir, and this is valid in the
methanol concentration range 0-1600 ppm. It can be observed that the response time
for the Ir sensors in the operating temperature range 150-300ºC is on the average more
than 10 times higher compared to that for the Pt sensors. For both leak detection and
process control applications, sensors with shorter response time are more favorable.
Since a lower operation temperature may also be favorable for long term stability
operation, although Pt sensors exhibit lower response level for the methanol
concentration of 300-1600 ppm, they may still be preferred over Ir sensors in some
applications.
3.2 Influence of other gases on the sensor response
3.2.1 Oxygen
The influence of oxygen is especially important to study for the sensors intended for leak
detection purposes. Therefore we have focused this study on low methanol
13
concentrations (0-200 ppm). Based on our experiences, there is no significant difference
of the sensor signal for oxygen concentrations between 10% and 20% in the carrier gas.
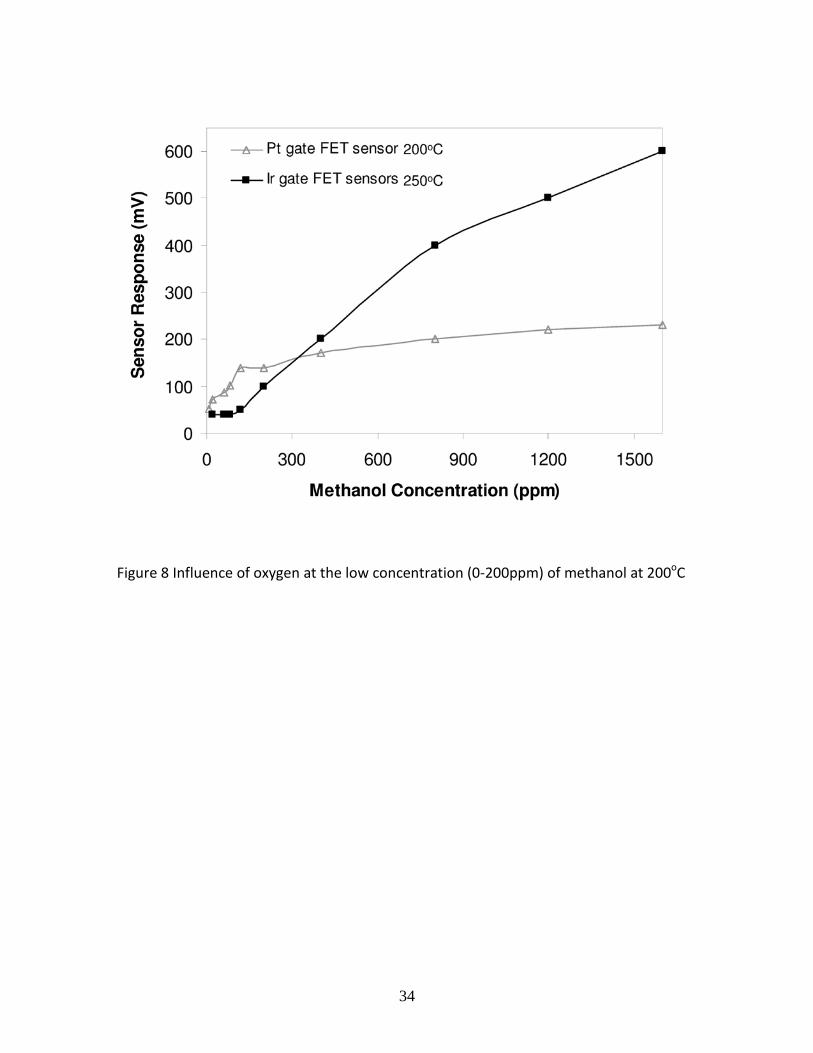
For both cases of Pt and Ir sensors, the presence of oxygen in the carrier gas improves
the performance by increasing the sensitivity as shown in Fig. 8. Moreover, the presence
of oxygen also reduces the response and recovery time by about 50% as compared to
pure nitrogen as the carrier gas. Methanol dissociates and is oxidized on top of the metal
surface [15]. The oxygen decomposes on the metal surface and is involved in the
interaction between the sensor surface and the methanol molecule [16], see section 2.2,
reaction b. Improved response and recovery times in oxygen is normal for these type of
sensors. However, the results in section 3.1 shows that applications of the methanol
sensors, even in the oxygen free environment, also seems to be a possibility.
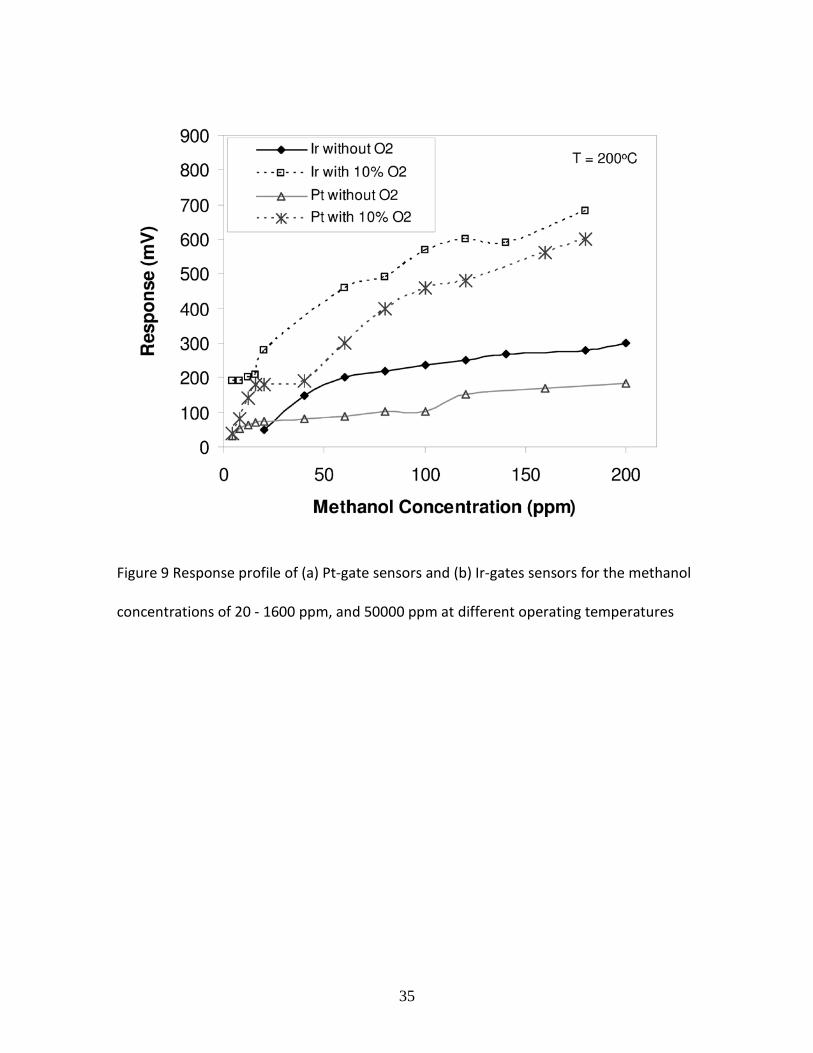
Fig. 9 shows the responses at methanol concentration of 20, 400, 800, 1600, and 50000
ppm in 10% or 20% oxygen, which reveals a shift in the temperature for optimum
response. The results for 50000 (5%) of methanol are taken from reference [9]. In the
presence of oxygen for Pt-gate sensors in Fig. 9 a, there is a tendency that the higher the
concentration of methanol, the lower the temperature for the maximum response.
These phenomena also occur in the case of CO [18] and NH3 [19] detection with Pt-gate
sensors. A comparison of Ir gate results in Fig.9 b indicates a more complicated chemistry
on the Ir surface as compared to the Pt surface.
14
3.2.2 Hydrogen, propene, and humidity
CO2 reduction into methanol via hydrogenation might yield several by-products such as
small hydrocarbons, hydrogen, carbon monoxide, and water. Therefore studies on the
cross sensitivity of hydrogen and propene, and also the influence of humidity, were
performed.
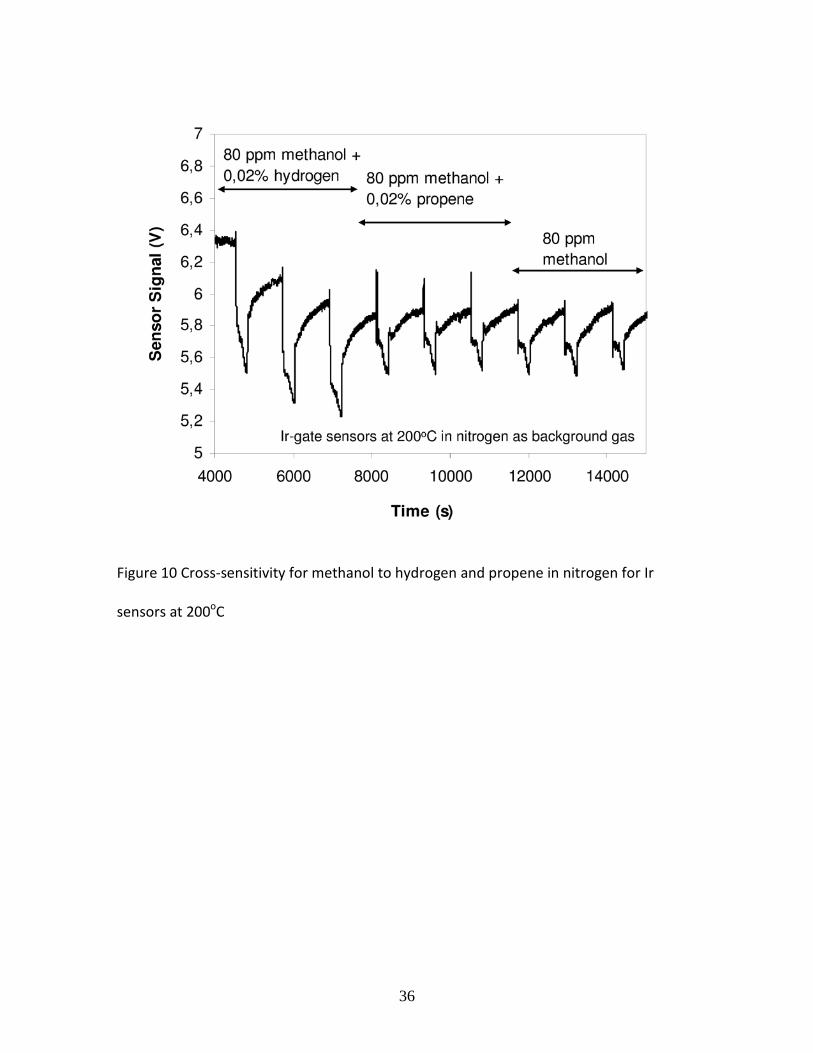
For hydrogen and propene, the experiment was carried out with 80 ppm of methanol in
N2 at 200oC for the Ir sensor, see Fig. 10. In the first 3 pulses, 200 ppm hydrogen was
introduced into the gas mixture followed by 3 pulses of 200 ppm propene. The last 3
pulses contained only 80 ppm methanol. As shown in Fig. 10, 200 ppm hydrogen in the
gas mixture gives around 80% increase of the response to methanol as compared to the
original value for the Ir sensors. On the other hand, propene does not have much
influence on the magnitude of the methanol response, which agrees with our previous
study at a higher methanol concentration [9]. The same tendency is observed for Pt
sensors at 200oC, where 200 ppm of hydrogen increases the response by about 30%.
Apparently, it is necessary to use additional sensors in the applications of the methanol
sensor to compensate for the cross sensitivity caused by the presence of H2.
For the purpose of methanol purification in the process line, it is expected that the water
vapor will be separated from methanol downstream of the reactor. However, there is
still a possibility that the methanol reaching the sensor is not completely dry. This is likely
also the case for leak detection applications, since the ambient air is never completely
15
dry. Therefore, it is important to study how humidity affects the sensor signal. It should
be noted that in this study, it was not possible to adjust the humidity level. The operating
temperature is 300oC because below this temperature the results are shaky and difficult
to evaluate. The reason for this may be unstable reaction species on the sensor surface
but may also be poor electrical contact due to condensation of water, e.g on bonding
wires which were not heated during these experiments. This should be clarified in future
studies.
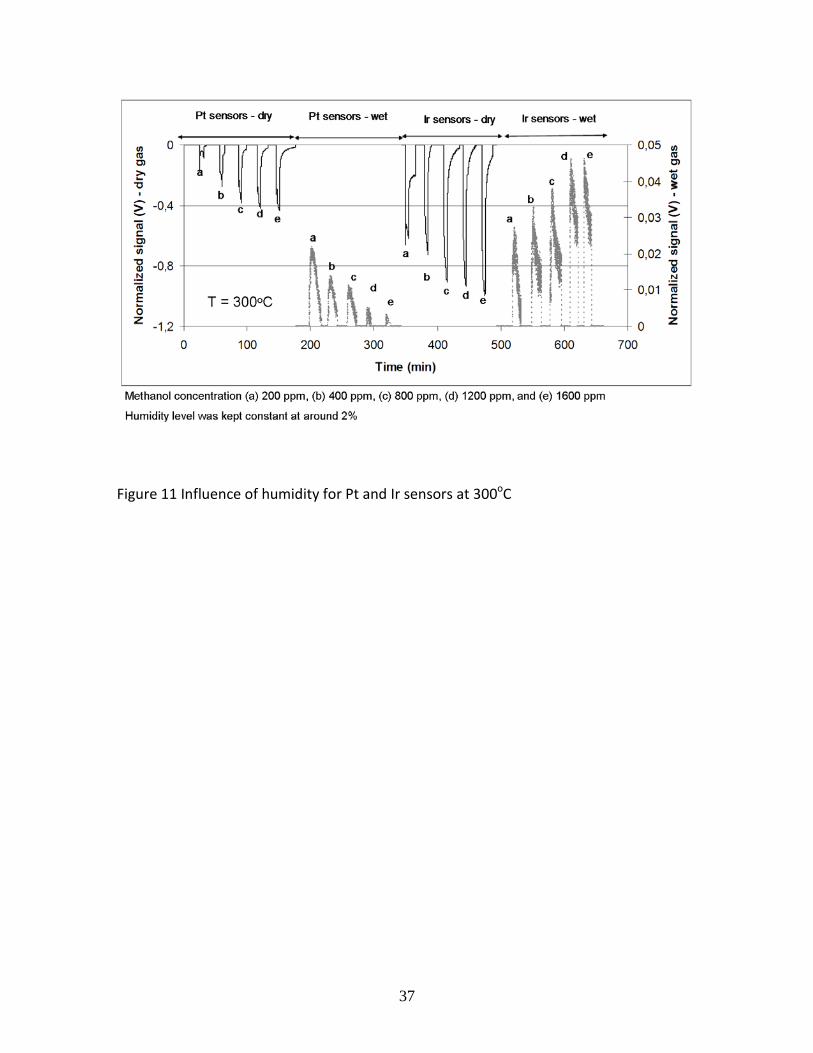
Fig. 11 shows the preliminary results for the influence of water vapor on the sensor
response. For both the Pt and Ir sensors, the presence of water vapor changes the
direction of the response, which also decreases by a factor of 20. Smaller response might
for example be due to a competition between the methanol and the water molecules for
the available adsorption sites on the metal surface[20]. It is surprising that the influence
of humidity in this study is much larger than in the previous studies for SiC FET devices
[19], [20], [21], [22] for other gases. Different from hydrogen or ammonia, methanol
might also react with water vapor and undergo partial oxidation or create complex
molecules which give less response when adsorbed on the sensor surface. Further
studies are therefore needed to fully understand the reason for this discrepancy.
However, the result for the Pt sensors is even more special because when humidity is
present, the sensor response becomes smaller with higher concentration of methanol.
The same phenomena, regarding the change of the response direction and the tendency
16
of reduced response when the gas concentration increases, are also observed for some
metal oxide sensors [23]. It might be related to changes in the formation and coverage of
the OH groups on the sensor surface and consequently the electric field, which is
reflected in the change of the source-drain current of the transistor. There is also the
possibility of competing reactions taking place in the gas phase, resulting in the
formation of complex molecular species which poison the sensor surface. One can
speculate that different reactions become dominant when water vapor is present
compared to the dry conditions.
Studies on how humidity can influence the sensor response are not only very interesting
from a theoretical and scientific point of view but may also have important practical
implications. To ensure that the sensors measure the methanol properly in a humid
environment, it is also possible to consider the design of the sensor packaging. Since the
test gas in both leakage detection and process control applications is clean, introduction
of desiccant upstream the sensor in the packaging should make the data evaluation
easier.
3.3 Computational studies of surface reactions
Two cases of methanol decomposition on the sensor surface were studied: with and
without oxygen present. Without the presence of oxygen, methanol decomposes into CO
and H2 [17]. While in the presence of oxygen methanol is oxidized to CO2 and H2O. The
17
reaction mechanisms for both cases are described in Section 2.2. The optimized
structures of the reaction mechanism for the reactions both with and without oxygen are
presented in Fig. 3.
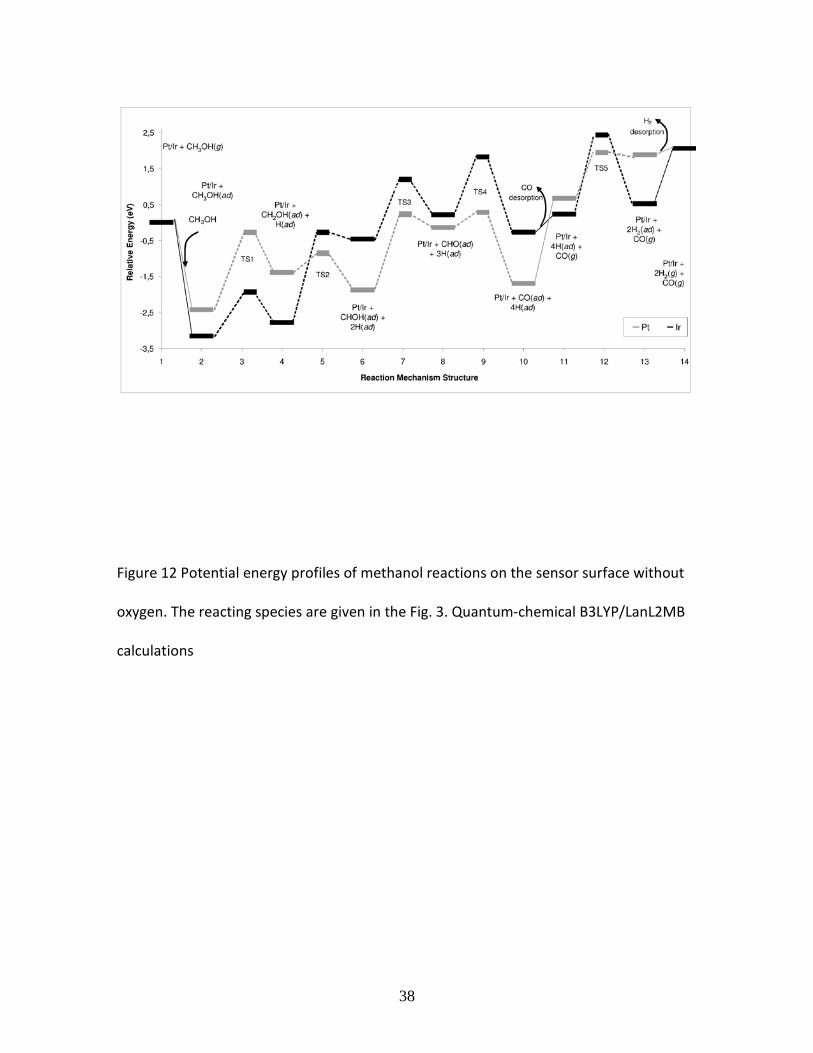
The computational results for methanol decomposition without oxygen present are
visualized in Fig. 12. Solid lines connect intermediate species and dashed lines connect
intermediates to transition states (TS). The Ir surface has a higher adsorption energy for
methanol (3,15 eV for Ir and 2,44 eV for Pt) and higher desorption energy for H2 (1,54 eV
for Ir and 0,18 eV for Pt) than the Pt surface. The higher energies for adsorption and
desorption influences the response and recovery time. These results agree with the
experimental observations that Ir has slower response and recovery times below 350oC.
However, the activation energy for some of the reaction steps during methanol
decomposition seems to be higher for the Pt surface.
In our study methanol decomposes as follows:
CH3OH(ad) CH2OH(ad) + H(ad) CHOH(ad) + 2H(ad) COH(ad) + 3H(ad)
CO (ad) + 4H (ad)
18
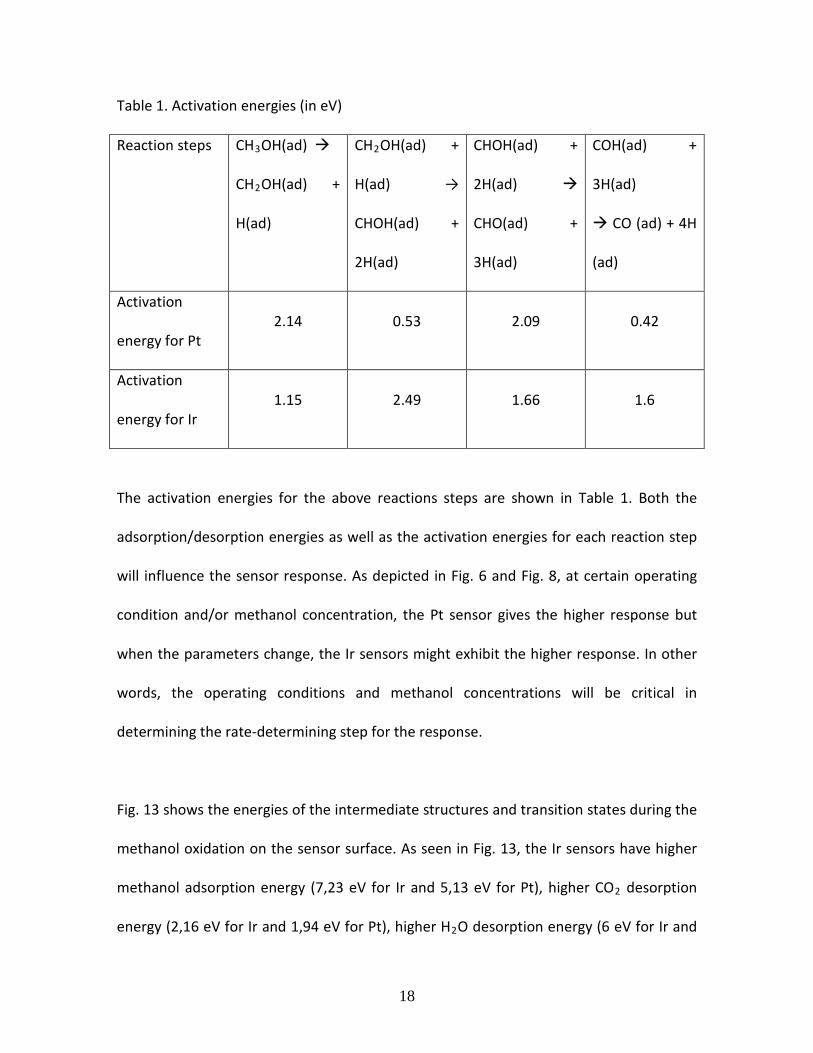
Table 1. Activation energies (in eV)
Reaction steps CH3OH(ad)
CH2OH(ad) +
H(ad)
CH2OH(ad) +
H(ad) →
CHOH(ad) +
2H(ad)
CHOH(ad) +
2H(ad)
CHO(ad) +
3H(ad)
COH(ad) +
3H(ad)
CO (ad) + 4H
(ad)
Activation
energy for Pt 2.14 0.53 2.09 0.42
Activation
energy for Ir 1.15 2.49 1.66 1.6
The activation energies for the above reactions steps are shown in Table 1. Both the
adsorption/desorption energies as well as the activation energies for each reaction step
will influence the sensor response. As depicted in Fig. 6 and Fig. 8, at certain operating
condition and/or methanol concentration, the Pt sensor gives the higher response but
when the parameters change, the Ir sensors might exhibit the higher response. In other
words, the operating conditions and methanol concentrations will be critical in
determining the rate-determining step for the response.
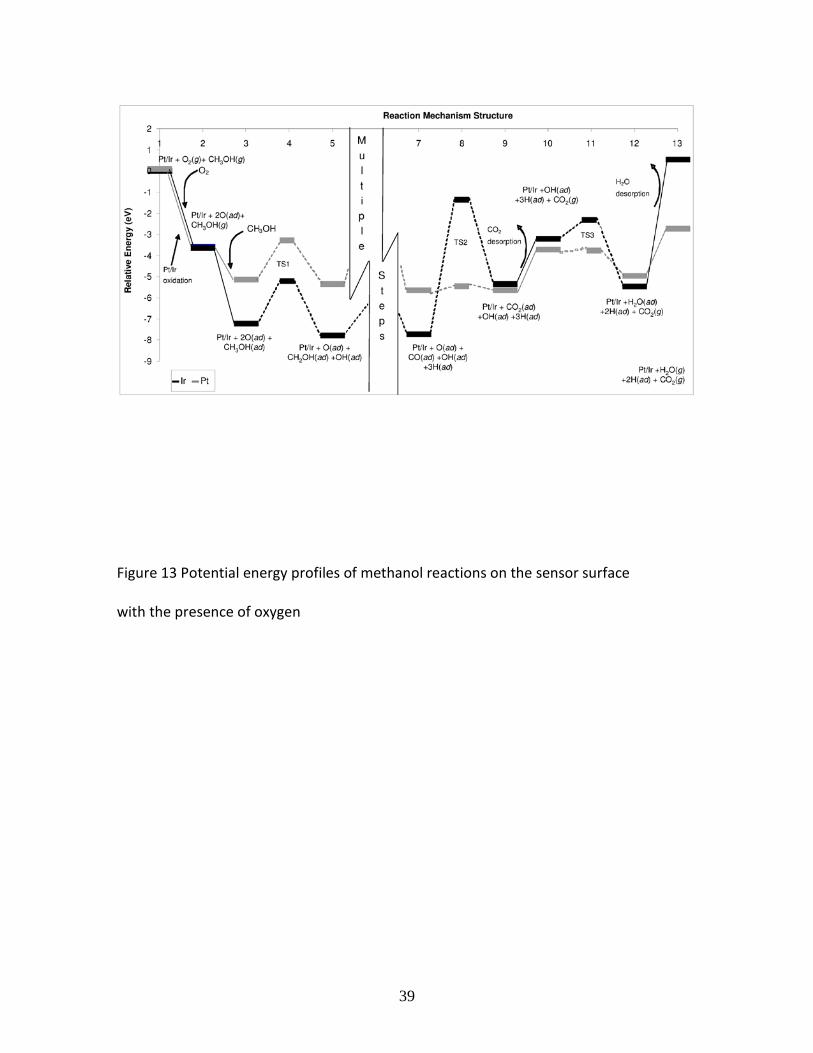
Fig. 13 shows the energies of the intermediate structures and transition states during the
methanol oxidation on the sensor surface. As seen in Fig. 13, the Ir sensors have higher
methanol adsorption energy (7,23 eV for Ir and 5,13 eV for Pt), higher CO2 desorption
energy (2,16 eV for Ir and 1,94 eV for Pt), higher H2O desorption energy (6 eV for Ir and
19
2,24 eV for Pt), and higher activation energies. As the case without the presence of
oxygen, high adsorption and desorption energies lead to slower response and recovery
times of the Ir sensors compared to those of the Pt sensors, but also larger response.
Fig. 13 shows that the energy needed to desorb water is less for Pt than for Ir. When the
effect of blocking of adsorption sites is negligible, Ir and Pt sensors behave differently in
the presence of water vapor. For hydrogen exposure in Ref. [24], the Ir sensors give
higher response when the humidity increases while the Pt sensors give smaller response.
Yamaguchi et al [25] also mentioned that the dominant mechanism in hydrogen sensing
is due to the water formation on the sensor surface, and this is likely to have a large
influence on hydrogen-containing species like methanol. References [24] and [25] relate
to SGFETs such that the response reactions take place on the gate contact layer while for
the SiC- FETs the response emanates from the gate insulator surface. The comparison is
still very interesting but may not be totally relevant. In the case here, the difference in
desorption energy might be one of the causes for the different sensing behavior of Ir and
Pt when water vapor is produced.
Fig. 12 and Fig. 13 show that the adsorption energy for the system without oxygen is
lower for both Pt and Ir which might explain the smaller sensor response. The other point
to be noted here is that in the end of the reaction the relative energy of the end products
is smaller in the case where oxygen is present, which might explain the faster recovery
time.
20
As mentioned in Section 3.2.2 when discussing the influence of humidity, it is also
important to perform computational studies on how the water vapor influences on the
interaction between the catalytic metal and the test gas. In future work, there are
several possibilities that might be considered. Water might for example be co-adsorbed
on the sensor surface with methanol, or it might form a water network on the surface, or
it might also be partly ionized due to the presence of the electrical field on the sensing
devices. The computed reaction profiles can help to decide which scenario is most likely
to occur.
4. Future Outlook
The observation that humidity influences the characteristics of Pt-gate and Ir-gate SiC-
FET sensor responses raises many fundamental questions that cannot yet be answered in
the present report. It would be very interesting to find out what actually occurs on the
sensor surface, since that may cause the anomalies in the sensing behavior. Our next
work will therefore be an investigation of the surface reactions by analyzing the residual
gas by mass spectrometry. Furthermore, the adsorbates on the sensor surface will be
studied by DRIFT, diffuse reflectance infrared Fourier transform, spectroscopy. The
combined information, eventually together with theoretical modeling, may give
suggestions of the surface reactions and possibly identify some of the intermediate
products. It is important to do more theoretical calculation on the surface reactions in
addition to the experimental work, for example in the presence of water molecules.
21
These calculations might help to explain the influence of water vapor to the particular
behavior of the sensors, especially the inverted signal.
As previously stated, it is necessary to have additional hydrogen and humidity sensors on
the process line to overcome the selectivity challenge. These sensors are actually needed
for the process control as well. Besides the possibility to run sensor arrays, it is also
possible to improve the sensitivity of the sensors with temperature cycling operation
[26]. This method has shown promising results for detecting the target gases, even in a
background of changing gas mixture. Further work with the combination of sensor arrays
and temperature cycling operation will likely be an advantage over the existing solutions,
with large potential for powerful sensor systems both for process control and methanol
leak detection.
5. Conclusions
SiC-FET sensors with Pt gate at 200oC are superior to sensors with Ir gate as methanol
sensors for process control applications especially because of the fast response time (less
than 20s) in the concentration regime (0-1600ppm) as well as the consideration that low
temperature operation (below 300oC) is favorable for long term stability concern of the
sensor. Among other interfering gases, which might co-exist in the mixture, oxygen
improved the performance by increasing the size of the response around 20% and
reducing the recovery time by 50%, hydrogen showed cross-sensitivity by up to 80%
22
increase of the response, while propene did not influence the methanol sensing. An
interesting phenomenon was observed when water vapor was added to the gas mixture.
There was a change in the direction of response for both the Pt and Ir gate FET sensors.
In addition to that, in case of the Pt gate sensors the response magnitude decreased with
increasing gas concentrations. Overall, Ir-gate sensors are better for the methanol
concentration between 0-1600 ppm, especially when humidity is present. Different
sensing behavior of Pt and Ir was studied by quantum-chemical computations of the
energy profiles for the reactions on the metal surface. Without oxygen, the Ir surface has
a higher adsorption energy for methanol (3,15 eV for Ir and 2,44 eV for Pt) and
desorption energy for H2 (1,54 eV for Ir and 0,18 eV for Pt) than the Pt surface. In the
presence of oxygen, Ir sensors have higher methanol adsorption energy (7,23 eV for Ir
and 5,13 eV for Pt), higher CO2 desorption energy (2,16 eV for Ir and 1,94 eV for Pt),
higher H2O desorption energy (6 eV for Ir and 2,24 eV for Pt), and higher activation
energies.
Acknowledgements
The authors acknowledge the Swedish Research Council for grants, NSC for the
computing resources and Sensic AB for supplying sensors and other resources. Last but
not least Peter Möller is acknowledged for all the help in setting up the laboratory
equipment.
23
References
[1] G.A. Olah, After Oil and Gas: Methanol Economy, Catal. Lett. 93 (2004) 1-2.
[2] Y. Yang , J. Evans , J. A. Rodriguez , M. G. White and P. Liu, Fundamental studies of
methanol synthesis from CO2 hydrogenation on Cu(111), Cu clusters, and
Cu/ZnO(001), Phys. Chem. Chem. Phys. 12 (2010) 9909-9917.
[3] X. Liu, G. Q. Lu, Z. Yan, and J. Beltramini, Recent Advances in Catalysts for Methanol
Synthesis via Hydrogenation of CO and CO, Ind. Eng. Chem. Res., 42 (25), (2003)
6518–6530.
[4] Detcon Model DM-100-CH3OH methanol sensor. Detcon Inc. www.detcon.com
[5] S. Wei, M. Zhou, and W. Du, Methanol Sensing Properties of Electrospun SnO2-ZnO
Nanofibers, Advanced Materials Research, 2012, Vol. 356-360.
[6] TGS 822 Figaro alcohol sensor, Figaro USA Inc., www.figarosensor.com
[7] M. Andersson, P. Ljung, M. Mattsson, M. Lofdahl and A. Lloyd Spetz, Investigations
on the possibilities of a MISiCFET sensor system for OBD and combustion control
utilizing different catalytic gate materials, Topics in Catalysis 30/31 (2004) 365-368.
[8] I. Lundström, H. Sundgren, F. Winquist, M. Eriksson, C. Krantz-Rülcker, A. Lloyd
Spetz, Twenty-five years of field effect gas sensor research in Linköping, Sensors
and Actuators B, 121 (2007) 247-262.
[9] J. Kanungo, M. Anderson, Z. Darmastuti, S. Basu, P.O. Kall, L. Ojamae, and A.L.
Spetz, Development of SiC-FET methanol sensor, Sensors and Actuators B-Chemical
(2011) pp. 72-78.
24
[10] M.J. Frisch, G.W. Trucks, H.B. Schlegel, G.E. Scuseria, M.A. Robb, J.R. Cheeseman, J.
Montgomery, J. A., T. Vreven, K.N. Kudin, J.C. Burant, J.M. Millam, S.S. Iyengar, J.
Tomasi, V. Barone, B. Mennucci, M. Cossi, G. Scalmani, N. Rega, G.A. Petersson, H.
Nakatsuji, M. Hada, M. Ehara, K. Toyota, R. Fukuda, J. Hasegawa, M. Ishida, T.
Nakajima, Y. Honda, O. Kitao, H. Nakai, M. Klene, X. Li, J.E. Knox, H.P. Hratchian, J.B.
Cross, V. Bakken, C. Adamo, J. Jaramillo, R. Gomperts, R.E. Stratmann, O. Yazyev,
A.J. Austin, R. Cammi, C. Pomelli, J.W. Ochterski, P.Y. Ayala, K. Morokuma, G.A.
Voth, P. Salvador, J.J. Dannenberg, V.G. Zakrzewski, S. Dapprich, A.D. Daniels, M.C.
Strain, O. Farkas, D.K. Malick, A.D. Rabuck, K. Raghavachari, J.B. Foresman, J.V.
Ortiz, Q. Cui, A.G. Baboul, S. Clifford, J. Cioslowski, B.B. Stefanov, G. Liu, A.
Liashenko, P. Piskorz, I. Komaromi, R.L. Martin, D.J. Fox, T. Keith, M.A. Al-Laham,
C.Y. Peng, A. Nanayakkara, M. Challacombe, P.M.W. Gill, B. Johnson, W. Chen,
M.W. Wong, C. Gonzalez, and J.A. Pople, Gaussian 03, Revision C.02, Gaussian, Inc.,
Wallingford CT (2004).
[11] A. D. Becke, Density-functional exchange-energy approximation with correct
asymptotic-behavior, Phys. Rev. A, 38 (1988) 3098-3100.
[12] C. Lee, W. Yang, and R. G. Parr, Development of the Colle-Salvetti correlation-
energy formula into a functional of the electron density, Phys. Rev. B, 37 (1988)
785-89.
[13] P. J. Hay and W. R. Wadt, Ab initio effective core potentials for molecular
calculations - potentials for the transition-metal atoms Sc to Hg, J. Chem. Phys., 82
(1985) 270-83.
25
[14] I.A. Erikat, B.A. Hamad, J.M. Khalifeh, A density functional study on adsorption and
dissociation of O2 on Ir(100) surface, Chemical Physics 385 (2011) 35–40.
[15] H. Amandusson, L.-G. Ekedahl, H. Dannetun, Methanol-induced hydrogen
permeation through a palladium membrane, Surface Science 442 (1999) 199–205
[16] M. Eriksson, and L.G. Petersson, Spillover of hydrogen, oxygen, and carbon
monoxide in oxidation reaction on SiO2 supported Pd, Surface Science (1994) pp.
139-152.
[17] B.A. Sexton, Methanol decomposition on platinum (111), Surface Science (1981) pp.
271-281.
[18] M. Andersson, H. Wingbrant, A. Lloyd Spetz, Study of the CO Response of SiC based
Field Effect Gas Sensors, Proc. IEEE Sensors 2005, Irvine, USA, October 31-
November 2, 2005, pp. 105-108.
[19] H. Wingbrant, H. Svenningstorp, P. Salomonsson, D. Kubinski, J. H. Visser, M.
Löfdahl, A. Lloyd Spetz, Using a MISiC-FET Sensor for Detecting NH3 in SCR Systems,
IEEE Sensors Journal, Vol. 5, No. 5 (2005) pp. 1099-1105.
[20] C. F. Lo, C. Y. Chang, B. H. Chu, S. J. Pearton, A. Dabiran, P. P. Chow, and F. Ren,
Effect of humidity on hydrogen sensitivity of Pt-gated AlGaN/GaN high electron
mobility transistor based sensors, Applied Physics Letters 96 (2010) 232106.
[21] Lampe U, Simon E, Pohle R, Fleischer M, Meixner H, Frerichs H-, Lehmann M, Kiss G.
GasFET for the detection of reducing gases. Sensors and Actuators, B: Chemical
(2005);111-112(SUPPL.):106-10.
26
[22] S. Nakagomi, P. Tobias, A. Baranzahi, I. Lundström, P. Mårtensson, and A. Lloyd
Spetz, Influence of carbon monoxide, water, and oxygen on high temperature
catlaytic metal - oxide - silicon carbide structures, Sensors and Actuators B, 45/3
(1997) 183-191.
[23] Ruth Pearce, Alexander Hagelin, Per-Olov Käll, Rositza Yakimona, Anita Lloyd Spetz,
Elin Becker, Magnus Skoglundh, Effect of Water Vapour on Ga Doped ZnO
Nanoparticle Sensor Gas Response, Proc. IEEE Sensors 2009, Christchurch, New
Zealand, Oct 26-28 (2009) pp. 2039-2044
[24] K. Scharnagl, A. Karthigeyan, M. Burgmair, M. Zimmer, T. Doll, I. Eisele, Low
temperature hydrogen detection at high concentrations: comparison of platinum
and iridium, Sensors and Actuators B 80 (2001) 163-168.
[25] T. Yamaguchi, T. Kiwa, K. Tsukada, and K. Yokosawa, Oxygen interference
mechanism of platinum-FET hydrogen gas sensor. Sensors and Actuators A: Physical
(2007) pp. 244-248.
[26] C. Bur, P. Reimann, M. Andersson et al., “Increasing the Selectivity of Pt-Gate SiC
Field Effect Gas Sensors by Dynamic Temperature Modulation” IEEE Sensors
Journal, vol. 12, no. 6, Jun, 2012.
27
Figure Captions
Figure 1 Methanol Cycle
28
29
Figure 3 Optimized structures for methanol decomposition on Pt clusters
(a) without oxygen (b) with oxygen
30
31
Figure 5 Comparison of the transient signal of Pt sensors at low methanol concentration
at 200oC and 350oC
32
Figure 6 Response vs. methanol concentration in N2 at the optimum operating
temperature
33
Figure 7 Response and Recovery Time profile of 400 ppm methanol in N2 at different
operating temperatures
34
Figure 8 Influence of oxygen at the low concentration (0-200ppm) of methanol at 200oC
35
Figure 9 Response profile of (a) Pt-gate sensors and (b) Ir-gates sensors for the methanol
concentrations of 20 - 1600 ppm, and 50000 ppm at different operating temperatures
36
Figure 10 Cross-sensitivity for methanol to hydrogen and propene in nitrogen for Ir
sensors at 200oC
37
Figure 11 Influence of humidity for Pt and Ir sensors at 300oC
38
Figure 12 Potential energy profiles of methanol reactions on the sensor surface without
oxygen. The reacting species are given in the Fig. 3. Quantum-chemical B3LYP/LanL2MB
calculations
39
Figure 13 Potential energy profiles of methanol reactions on the sensor surface
with the presence of oxygen


![Novel Concept of Gas Sensitivity Characterization of Materials … · 2018. 1. 2. · suspended gate-FET (SG-FET)-based gas sensors [1, 2]. Since adsorbed species are in a dynamic](https://img.pdfslide.net/doc/110x75/60d7cb0cbe6d9975fe75919b/novel-concept-of-gas-sensitivity-characterization-of-materials-2018-1-2-suspended.jpg)