Embed Size (px)
Citation preview
IN IN
DIA Side-by-Side
A Slice of Micro Finance OperationsSeptember 2004
New Delhi Office12 & 13, 2nd Floor, MPTCD Building, Special Institutional Area,Shaheed Jeet Singh Marg, New Delhi -110 067Tel: +91-11-55650787/26518276 Fax: +91-11-26518276
E-mail: [email protected] Site: www.sa-dhan.org
Registered Office404, Nirmal Towers, Dwarkapuri Colony, Punjagutta,Hyderabad - 500082Tel: +91-40-6782780 Fax: +91-40-3358846

Index
List of Participating MFIs............................................................................................................................................i
Glossary of terms...................................................................................................................................................... iii
Set of Financial Performance Standards1 Recommended by Sa-Dhan ..................................................iv
Preface....................................................................................................................................................................... v
1 Introduction...................................................................................................................................................... 1
1.1 Classification of Participating MFIs by Microfinance Models................................................................................2
1.2 Classification of Participating MFIs by Legal Form......................................................................................................3
1.3 Classification of Participating MFIs by Their Number of Years of Microfinance Operations.......4
1.4 Classification of Participating MFIs by their Working Methodology...................................................................5
2 Outreach.......................................................................................................................................................... 6
3 Active Clients................................................................................................................................................... 9
4 Creating Access of the Poor to Credit Services ...................................................................................11
5 Creating Access of the Poor to Insurance Services ............................................................................11
6 Creating Access of the Poor to Savings Services.................................................................................13
7 Other services................................................................................................................................................14
8 Sa-Dhan Endeavour in Setting Financial Performance Standards..................................................16
8.1 Snap shot on MFI Financial Performance Standards............................................................................................17
8.2 Analysis of MFI data on Sa-Dhan recommended Financial Performance Standards (FPS):.............18
8.2.1 Operational Self Sufficiency (OSS):.........................................................................21 8.2.2 Portfolio At Risk >60 Days:.........................................................................................21 8.2.3 Current Repayment Rate (CRR): ............................................................................22 8.2.4 Total Cost Ratio (TCR): ..............................................................................................23 8.2.5 Operating Cost Ratio (OCR): ..................................................................................24 8.2.6 Active Borrowers per Credit Officer: ......................................................................25
9 Final Words .....................................................................................................................................................26

Side-by-Side A Slice of Micro Finance Operations in India - Sep’04
September, 2004 i
List of Participating MFIs
S. No Name Headquarters
1 A Society for Integrated Rural Development (ASSIST)
Guntur, A.P.
2 Amber Ashraye Mahila Benefit Association Rajkot, Gujarat 3 Bandhan * Kolkatta, West Bengal
4 Bharat Integrated Social Welfare Agency(BISWA) *
Sambalpur, Orissa
5 Bharatha Swamukti Samsthe * Bangalore, Karnataka 6 Bharati Integrated Rural Development Society * Nandyal, A.P. 7 Bhartiya Samrudhi Finance Ltd. (BASIX) * Hyderabad, A.P.
8 Bullock-cart Workers Development Association (BWDA) *
Villupuram, Tamil Nadu
9 Cashpor Micro Credit * Varanasi, UP 10 Center for Youth and Social Development * Bhubaneshwar, Orissa 11 Darbara Sahitya Sansad * Arapada, Orissa 12 Evangelical Social Action Forum (ESAF) * Trichur, Kerala 13 Friends of Women's World Banking, India * Ahmedabad, Gujarat 14 Gram Swaraj Sewa Trust Dattapur, Maharashtra 15 Gram Vikas Berhampur, Orissa 16 Gram Vikas Samarthan Kendra Mehsana, Gujarat 17 Grameen Development Services (GDS) * Lucknow, UP 18 Grameen Mahila Swayamsiddha Sangha Pune, Maharashtra 19 GRAM-Utthan * Pimpuri, Orissa 20 Holy Cross Social Service Center * Hazaribag, Jarkhand 21 Janodaya Trust * Bangalore, Karnataka 22 Krishna Bhima Samruddhi Local Area Bank * Mahboobnagar, A.P. 23 League for Education and Development (LEAD)* Trichirapalli, Tamil Nadu 24 Mahasemam Trust* Madurai, Tamil Nadu 25 Modern Architects for Rural India (MARI) Hanamkonda, A.P. 26 Nav Bharat Jagriti Kendra * Hazaribag, Jarkhand 27 New Life * Trichy, Tamil Nadu 28 NIDAN * Patna, Bihar 29 Pragathi Seva Samithi Hanumakonda, A.P. 30 PREM Berhampur, Orissa 31 Prochesta * Guwahati, Assam
32 Rajasthan Forest Produce Collector's and Processor's Group Support Society
Udaipur, Rajasthan
33 Rajpur Seva Niketan Rajapur, West Bengal 34 Rashtriya Gramin Vikas Nidhi * Guwahati, Assam 35 Rural Aid Service (RAIDS) Churachandpur, Manipur
Side-by-Side A Slice of Micro Finance Operations in India - Sep’04
September, 2004 ii
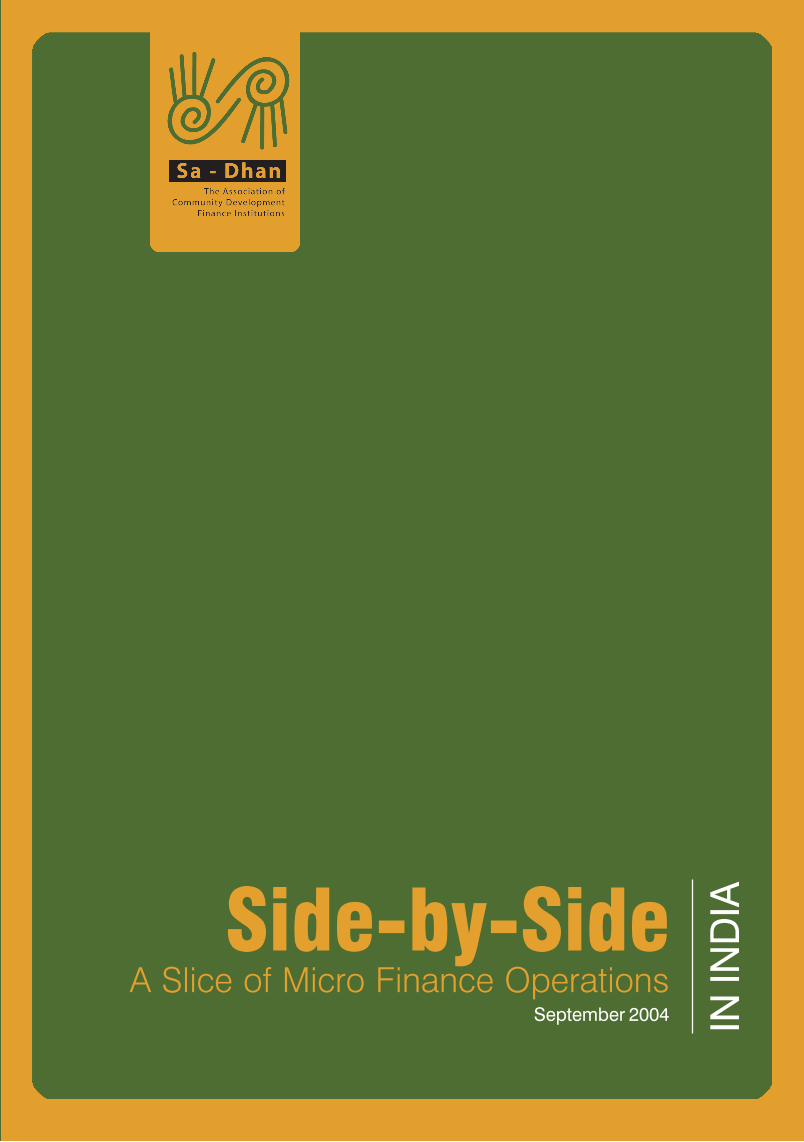
List of Participating MFIs (Continuation)
S.No Name Headquarters
36 Rural Education and Action for Change - Manipur
Manipur
37 Sanghamithra Rural Financial Services * Mysore, Karnataka 38 Sarva Jana Seva Kosh Limited * Chennai, Tamil Nadu 39 Sarvodaya Nano Finance Limited * Chennai, Tamil Nadu 40 Sewa Mandir * Udaipur, Rajasthan 41 SHARE Microfin Limited * Hyderabad, A.P. 42 Shramik Bharti * Kanpur, UP
43 Shree Junagadh Mahila Sharafi Sahakari Mandali Ltd
Junagadh, Gujarat
44 Social Education & Voluntary Action Warangal, A.P. 45 Spandana * Guntur, A.P. 46 Star Youth Association * Velgode, A.P. 47 Swayam Krishi Sangam * Hyderabad, A.P. 48 Swayanshree Cuttack, Orissa 49 Tha Activists for Social Alternatives * Trichirapalli, Tamil Nadu 50 Thirumalai Charity Trust (TCT) * Ranipet, Tamil Nadu 51 Vikas Center for Development Ahmedabad, Gujarat 52 Vikasana * Tarikera, Karnataka 53 Village Welfare Society * Kolkatta, West Bengal
* The MFIs are members of Sa-Dhan
Side-by-Side A Slice of Micro Finance Operations in India - Sep’04
September, 2004 iii
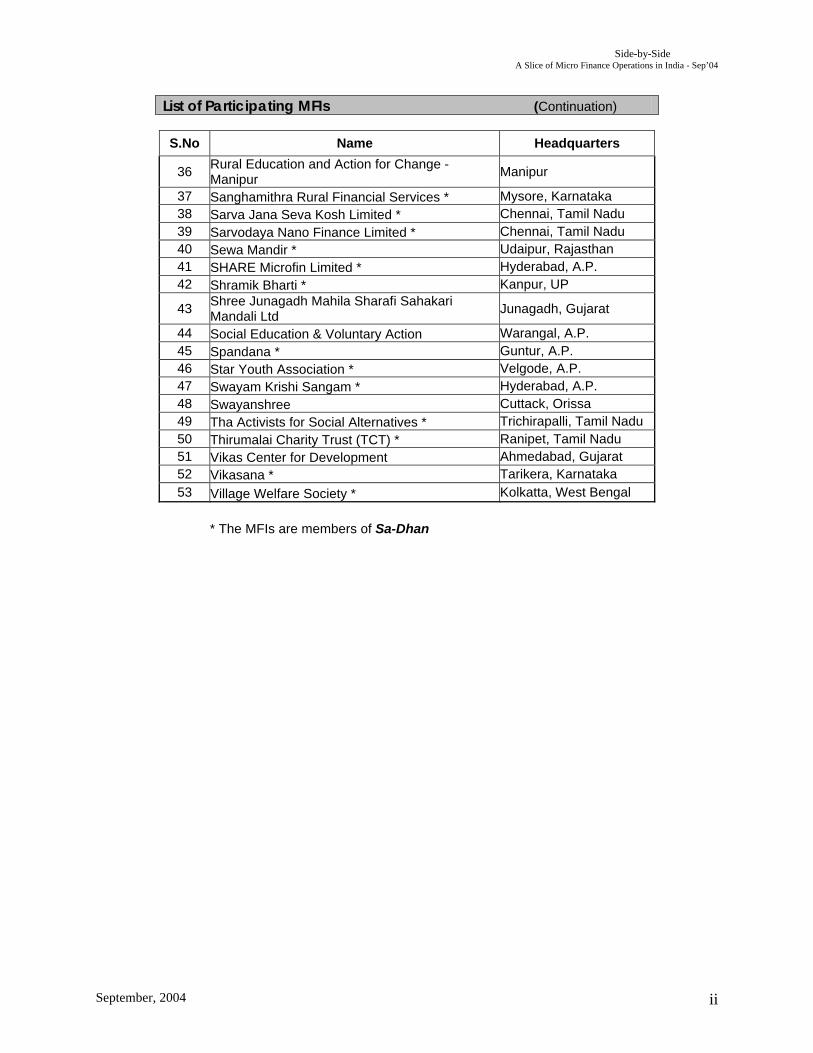
Glossary of terms
Active Clients Clients regularly availing service(s) provided by MFI
Avg. Average
CBFI Community Based Financial Institutions
Co-Op Co-operative Societies
CRR Current Repayment Rate
EDP Entrepreneurship Development Program
FPS Financial Performance Standards
GB Grameen Bank (Refers to microfinance operating methodology)
JLG Joint Liability Group
I Individual (Refers to microfinance operating methodology)
INR/ Rs. Indian Rupees
LAB Local Area Bank
M.F. Microfinance
MFI Microfinance Institution (In the report MFI refers to both MFIs as well as NGOs involved in MF)
NRM Natural Resource Management
OCR Operating Cost Ratio
OSS Operating Self Sufficiency
PAR Portfolio At Risk
Sec.25 Comp. Companies registered under Section 25 of Indian Companies Act
S. No. Serial Number
SHG Self- Help Group
SIDBI Small Industries Development Bank of India
TCR Total Cost Ratio
USD United States Dollars
w/w Within which

Side-by-Side A Slice of Micro Finance Operations in India - Sep’04
September, 2004 iv
Set of Financial Performance Standards1 Recommended by Sa-Dhan
S. No. Indicator Benchmark Formula
1. SUSTAINABILITY PERFORMANCE STANDARDS
Operating Income [2]
1 Operational Self-
Sufficiency At least 100%
Operating Costs + Loan Loss Provisions + Financing Costs
2. ASSET QUALITY PERFORMANCE STANDARD
Unpaid Principal Balance of Past Due Loans (with Overdue
> 60 days of age) Total Gross Outstanding
Portfolio
2 Portfolio at Risk > 60
Days Past Due Less than 10%
Total Amount (Principal) Collected for the Period –
Prepayments 3 Current Repayment
Rate Greater than 90%
Total Amount (Principal) Due (to be collected during period)
3. EFFICIENCY PERFORMANCE STANDARDS
Total Operating Costs Average Outstanding Portfolio 4 Operating Cost Ratio [3] Less than 20%
Total Costs [4]
Average Outstanding Portfolio 5 Total Cost Ratio Less than 30%
Average Number of Active Borrowers
Average Number of Credit Officers
6 Active Borrowers Per Credit Officers [5] Between 250-350
[1] The Sa-Dhan Sub-Group on Standards finalized the indicators proposed here. [2] Operating Income is income from Loans and Investments [3] Sometimes called as Administrative Efficiency Ratio [4] Total Costs = Operational Costs + Loan Loss Provision + Cost of Funds [5] Sometimes, also called as client to staff ratio with staff being loan officers/ Field officer primarily
Side-by-Side A Slice of Micro Finance Operations in India - Sep’04
September, 2004
v
Preface Fundamental to the growth of any sector, is its ability to define clearly the parameters that enable the understanding of its work. Microfinance, in India, as it goes forward will need to define its parameters of performance. Such performance should clearly define its client base; what it does with them and how the relationships with the clients are working out. Sa-Dhan, in setting out to build the sector, has struggled with communicating the complete face of what microfinance practitioners are and how they do it. In sequence, we started the exercise, by describing the different models and the different institutions that are delivering the services to poor clients. In doing so, we have brought out detailed study on SHG federations and perspective papers describing the different models. With this study, we have sought to examine the experience of practitioners across the spectrum, drawn from different segments and have included even organisations who are not members of Sa-Dhan. Such a description, will serve to set the foundation for building a greater appreciation and recognition of the sector, its activities and its promise!! Clearly, for a start, that we have data of this kind available for both explaining and for debate; is extremely commendable for the sector. It not only is indication of the state of the sector, but also its potential. This is extremely commendable given the fact that this data has been generated inspite of low-levels of public funding that popular and widely used MIS systems require. We, at Sa-Dhan believe that if we can build on this discipline, it is not only improvement in performance that will mark us out, but in addition the ability to be transparent. The data has essentially been analysed using the performance-standards recommendations that were set out by the Sa-Dhan sub-group on Standards. The sub-group, in its debate and in its conclusions had recommended three broad parameters, within which we look at understanding and categorising the portfolio of microfinance work in India. These are: Sustainability Performance Standards; Asset Quality Performance Standards and Efficiency Performance Standards. We believe that over time as we progress towards getting more data, over time we will be able to develop and sharpen not only our interventions at Sa-Dhan but also that of our members as we seek to build the sector in India. Congratulations to the team led by Mr. R.K. Mukherjee and Mr. Lakshminarayana, who were ably assisted by Mr. Rupaal Singh in bringing out this report to meet the deadlines that we had set out for ourselves. Mathew Titus Executive Director October 20, 2004
Side-by-Side A Slice of Micro Finance Operations in India - Sep’04
September, 2004
1
1 Introduction
In its deliberations on defining strategy for building the sector, the Sa-Dhan board strongly recommended the development and production of a Sector Report. It was also decided that the reports should not be confined to data of MFIs that are members of Sa-Dhan but efforts to include non-member MFIs should also be made.
Taking the decision of the Board forward, Sa-Dhan prepared a list of MFIs in India that included its member-MFIs and other MFIs that were drawn from sources such as other networks, microfinance partners of Small Industries Development Bank of India (SIDBI) and references from Sa-Dhan members.
The focus of the report was to collect financial and operational data of MFIs for the financial year 2003-04; across the country, spread over the dominant microfinance models and legal forms. The data was analysed by peer-groups with the above three parameters, in the background of the set of six financial standards that Sa-Dhan has developed. The report therefore gives a snap shot of the financial performance of participating MFIs for the FY 2003-04, on the core six financial performance indicators. In order to take the task forward, a simplified data form was devised. This was based on the form that members of Sa-Dhan have been using to report their performance data to Sa-Dhan.
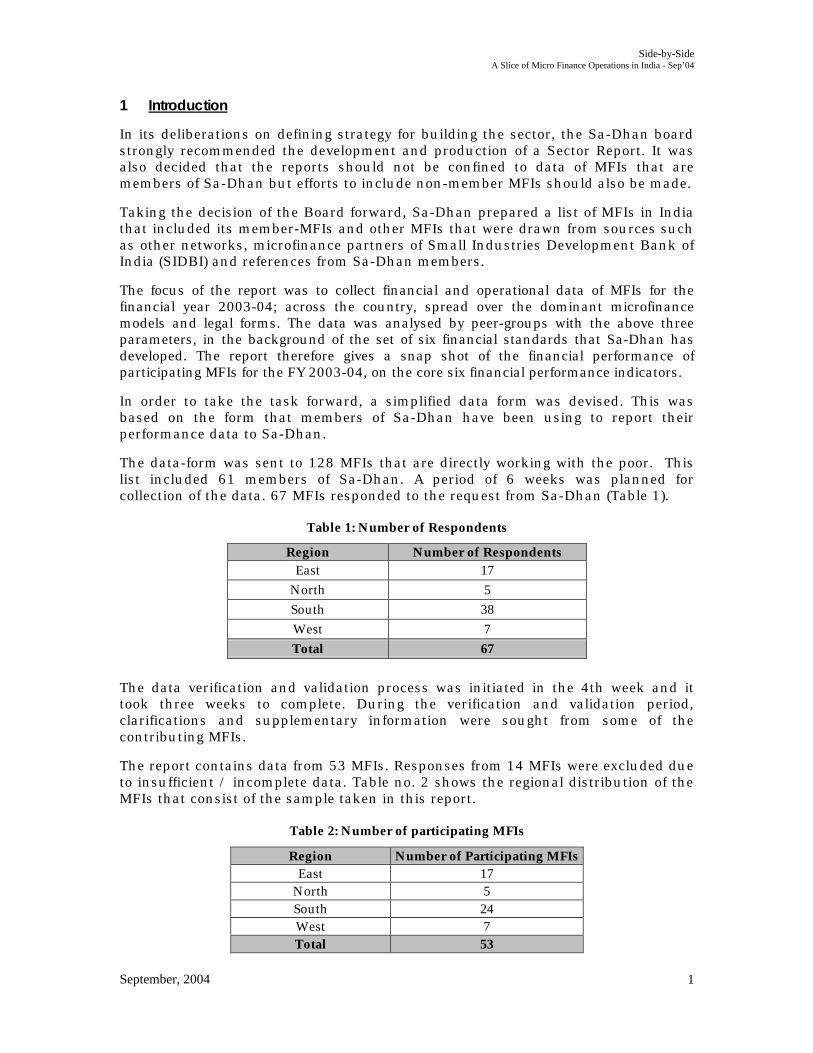
The data-form was sent to 128 MFIs that are directly working with the poor. This list included 61 members of Sa-Dhan. A period of 6 weeks was planned for collection of the data. 67 MFIs responded to the request from Sa-Dhan (Table 1).
Table 1: Number of Respondents
Region Number of Respondents East 17
North 5 South 38 West 7 Total 67
The data verification and validation process was initiated in the 4th week and it took three weeks to complete. During the verification and validation period, clarifications and supplementary information were sought from some of the contributing MFIs.
The report contains data from 53 MFIs. Responses from 14 MFIs were excluded due to insufficient / incomplete data. Table no. 2 shows the regional distribution of the MFIs that consist of the sample taken in this report.
Table 2: Number of participating MFIs
Region Number of Participating MFIs East 17
North 5 South 24 West 7 Total 53
Side-by-Side A Slice of Micro Finance Operations in India - Sep’04
September, 2004
2
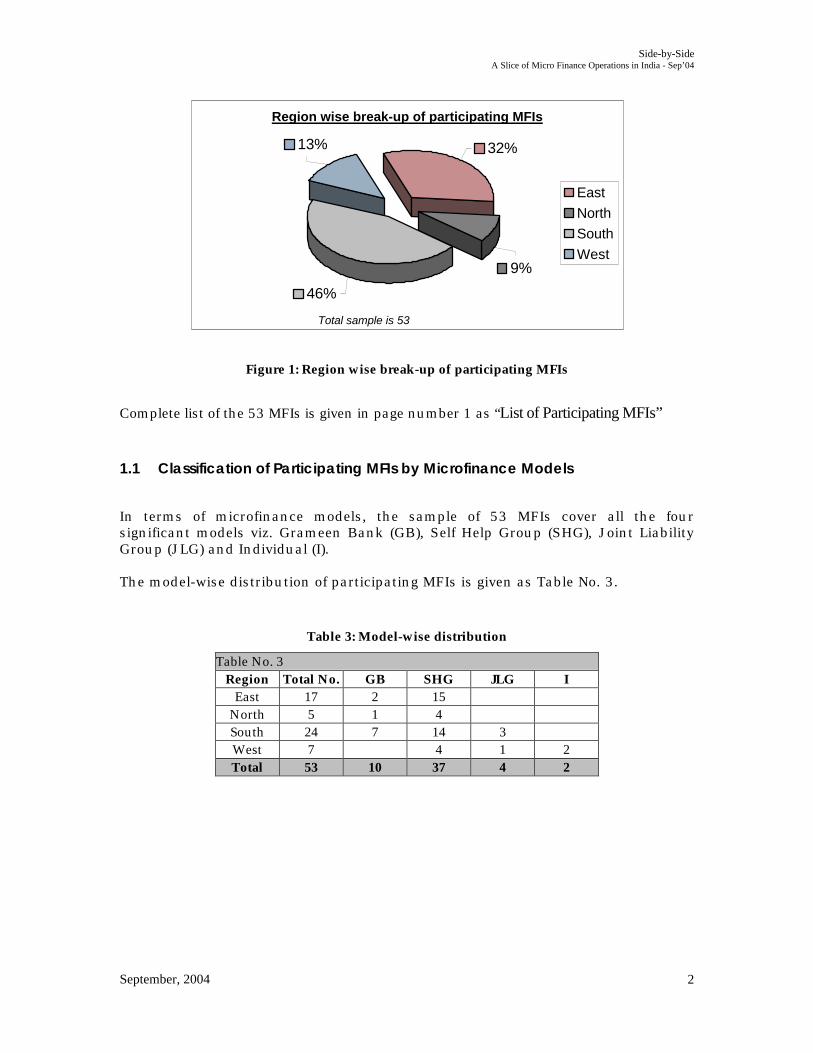
Figure 1: Region wise break-up of participating MFIs
Complete list of the 53 MFIs is given in page number 1 as “List of Participating MFIs” 1.1 Classification of Participating MFIs by Microfinance Models
In terms of microfinance models, the sample of 53 MFIs cover all the four significant models viz. Grameen Bank (GB), Self Help Group (SHG), Joint Liability Group (JLG) and Individual (I). The model-wise distribution of participating MFIs is given as Table No. 3.
Table 3: Model-wise distribution
Table No. 3 Region Total No. GB SHG JLG I
East 17 2 15 North 5 1 4 South 24 7 14 3 West 7 4 1 2 Total 53 10 37 4 2
Region wise break-up of participating MFIs
9%
32%13%
46%
East
North
South
West
Total sample is 53

Side-by-Side A Slice of Micro Finance Operations in India - Sep’04
September, 2004
3
Figure 2: Region and Operating Model wise Distribution
Some of the MFIs work on multiple models of microfinance delivery such as SHG and Individuals, SHG and JLG. Some MFIs operate under more than one model, for example GB and JLG, JLG and ‘I’. While classifying such MFIs, the predominant model practised by the MFI has been considered. 1.2 Classification of Participating MFIs by Legal Form
In terms of legal forms that MFIs are incorporated as, Table No. 4 reveals that Society/Trust forms are most significant.
Table 4: Classification by Legal Form
Table 4:
Region Total No. Company Sec.25 Comp.
LAB (Local
Area Bank)
Co- Operative
Society/ Trust
East 17 17 North 5 1 4 South 24 4 1 1 18 West 7 1 6 Total 53 4 2 1 1 45
2
15
1
4 7
14
3
41
2
0
5
10
15
20
25
No.
Of
MF
Is
East North South West
Region-wise and MF Model-wise Distribution of Participating MFIs
GB SHG JLG I

Side-by-Side A Slice of Micro Finance Operations in India - Sep’04
September, 2004
4
Region-wise Distribution of Participating MFIs based on Legal Forms
7
24
5
17
0 5 10 15 20 25 30
East
North
South
West
No.Of MFIs
Company Sec.25 Comp. LAB Co- Operative Society+ Trust
Figure 3: Distribution based on Legal Forms and Region
1.3 Classification of Participating MFIs by Their Number of Years of Microfinance
Operations
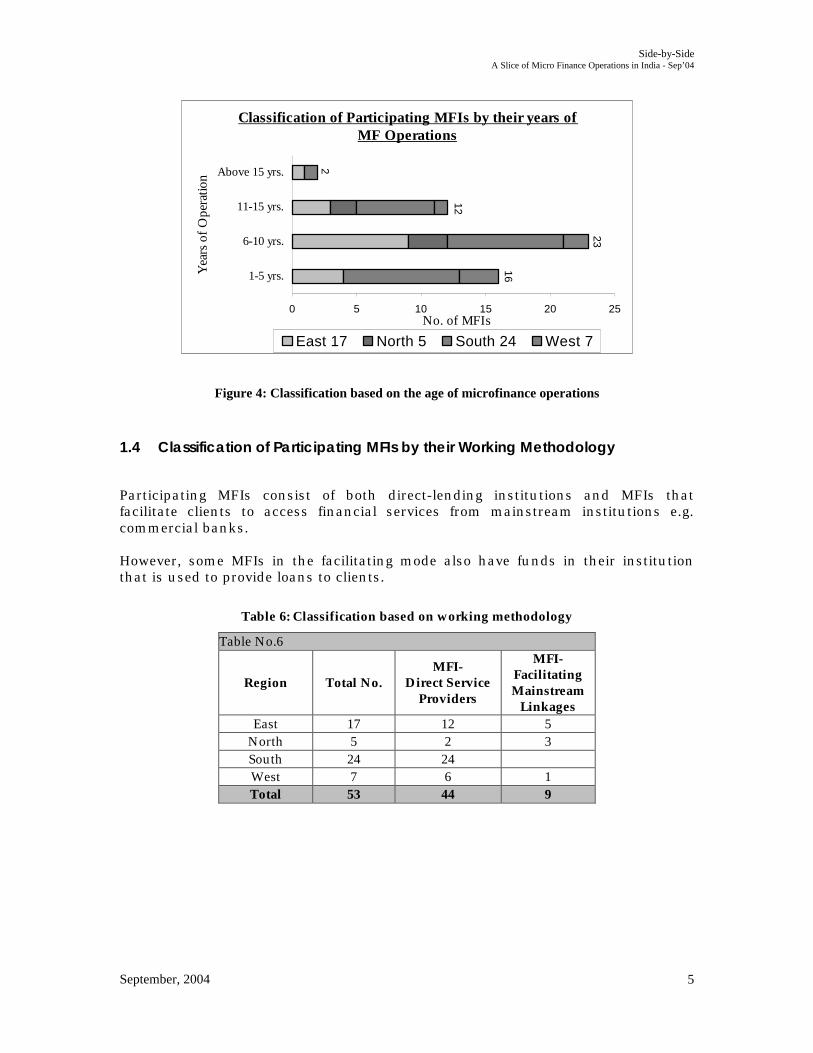
Age-wise the participating MFIs are widely distributed between groups of 1 - 5 years and 11-15 years. Two organisations have more than 15 years in microfinance operations. The age distribution is based on number of years the MFI has been in microfinance operations. The age of the institutions may therefore be more than the indicated classification.
Table 5: Classification based on the age of microfinance operations
Table No.5
Region Total No. 1-5 Years 6-10 Years 11-15 Years Above 15
Years East 17 4 9 3 1
North 5 3 2 South 24 9 9 6 West 7 3 2 1 1 Total 53 16 23 12 2
Side-by-Side A Slice of Micro Finance Operations in India - Sep’04
September, 2004
5
Figure 4: Classification based on the age of microfinance operations
1.4 Classification of Participating MFIs by their Working Methodology
Participating MFIs consist of both direct-lending institutions and MFIs that facilitate clients to access financial services from mainstream institutions e.g. commercial banks. However, some MFIs in the facilitating mode also have funds in their institution that is used to provide loans to clients.
Table 6: Classification based on working methodology
Table No.6
Region Total No. MFI-
Direct Service Providers
MFI- Facilitating Mainstream
Linkages East 17 12 5
North 5 2 3 South 24 24 West 7 6 1 Total 53 44 9
Classification of Participating MFIs by their years of MF Operations
16
23
12
2
0 5 10 15 20 25
1-5 yrs.
6-10 yrs.
11-15 yrs.
Above 15 yrs.
Yea
rs o
f O
pera
tion
No. of MFIs
East 17 North 5 South 24 West 7
Side-by-Side A Slice of Micro Finance Operations in India - Sep’04
September, 2004
6
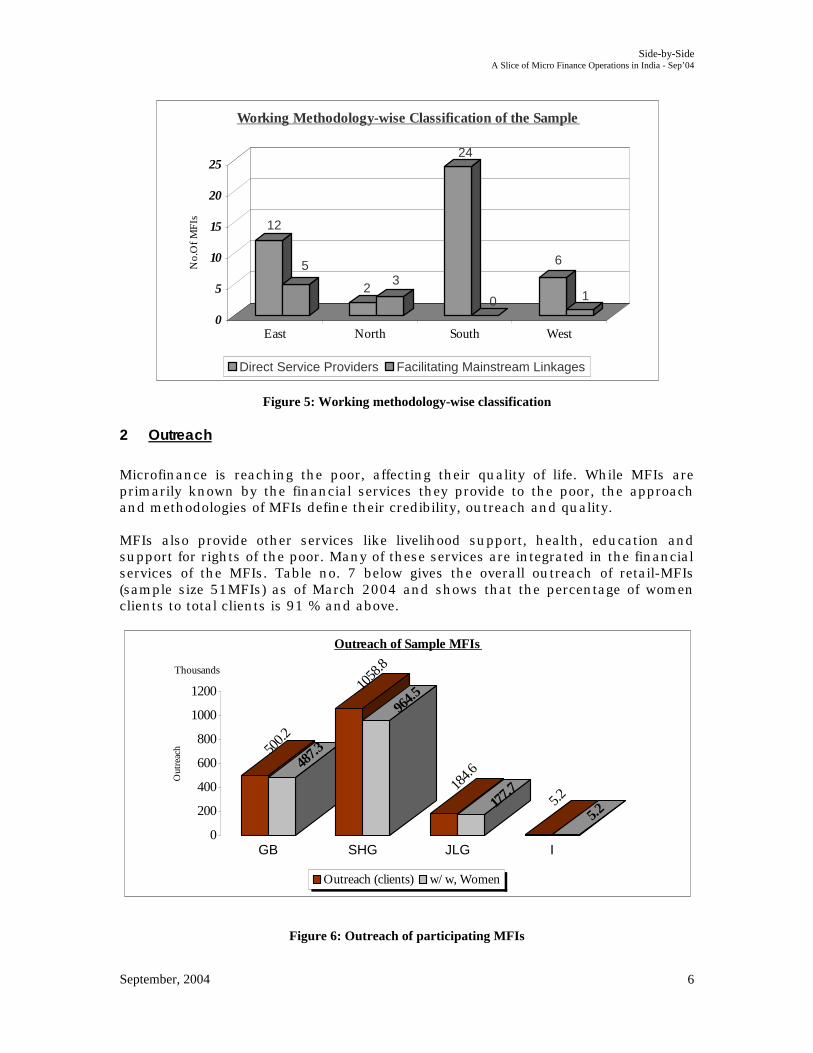
Figure 5: Working methodology-wise classification
2 Outreach
Microfinance is reaching the poor, affecting their quality of life. While MFIs are primarily known by the financial services they provide to the poor, the approach and methodologies of MFIs define their credibility, outreach and quality. MFIs also provide other services like livelihood support, health, education and support for rights of the poor. Many of these services are integrated in the financial services of the MFIs. Table no. 7 below gives the overall outreach of retail-MFIs (sample size 51MFIs) as of March 2004 and shows that the percentage of women clients to total clients is 91 % and above.
Figure 6: Outreach of participating MFIs
12
5
23
24
0
6
1
0
5
10
15
20
25
No.
Of
MF
Is
East North South West
Working Methodology-wise Classification of the Sample
Direct Service Providers Facilitating Mainstream Linkages
500.2
487.3
1058
.8
964.5
184.6
177.7 5.2
5.2
0
200
400
600
800
1000
1200
Out
reac
h
Thousands
GB SHG JLG I
Outreach of Sample MFIs
Outreach (clients) w/w, Women
Side-by-Side A Slice of Micro Finance Operations in India - Sep’04
September, 2004
7
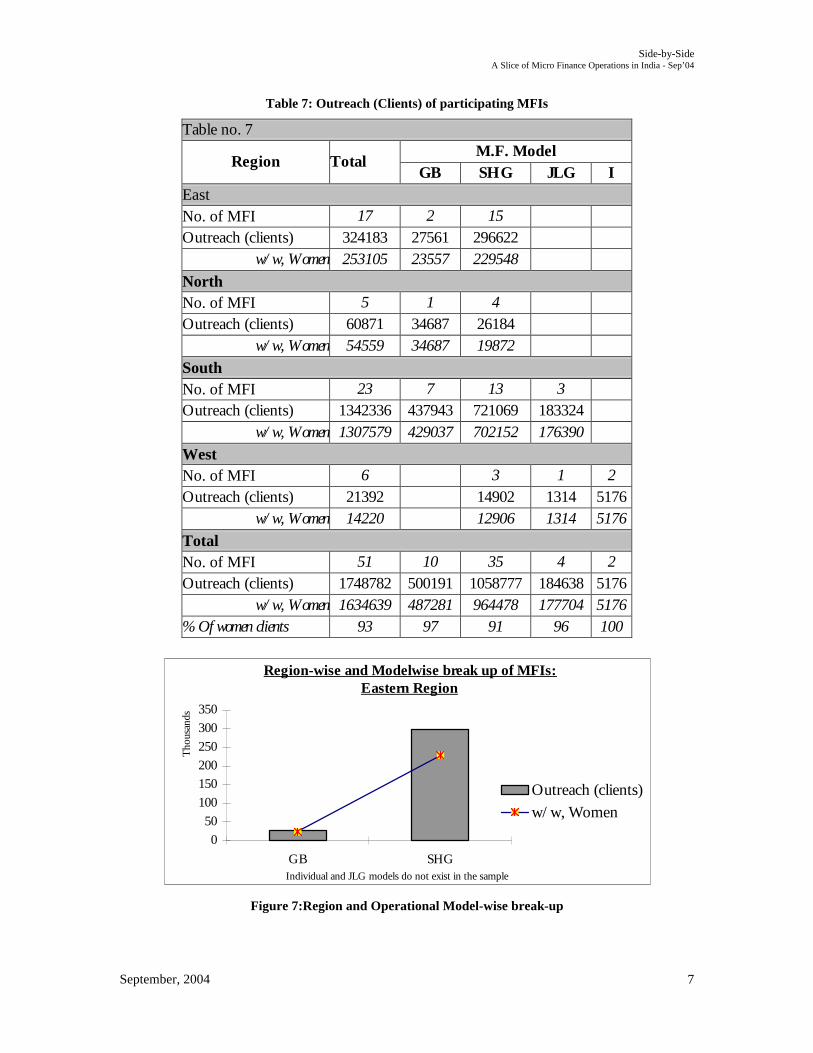
Table 7: Outreach (Clients) of participating MFIs
Table no. 7 M.F. Model
Region Total GB SHG JLG I
East No. of MFI 17 2 15 Outreach (clients) 324183 27561 296622
w/w, Women 253105 23557 229548
North No. of MFI 5 1 4 Outreach (clients) 60871 34687 26184
w/w, Women 54559 34687 19872
South No. of MFI 23 7 13 3 Outreach (clients) 1342336 437943 721069 183324
w/w, Women 1307579 429037 702152 176390
West No. of MFI 6 3 1 2 Outreach (clients) 21392 14902 1314 5176
w/w, Women 14220 12906 1314 5176
Total No. of MFI 51 10 35 4 2 Outreach (clients) 1748782 500191 1058777 184638 5176
w/w, Women 1634639 487281 964478 177704 5176 % Of women clients 93 97 91 96 100
Figure 7:Region and Operational Model-wise break-up
Region-wise and Modelwise break up of MFIs: Eastern Region
0
50
100
150
200
250
300
350
GB SHG
Tho
usan
ds
Outreach (clients)
w/w, Women
Individual and JLG models do not exist in the sample
Side-by-Side A Slice of Micro Finance Operations in India - Sep’04
September, 2004
8
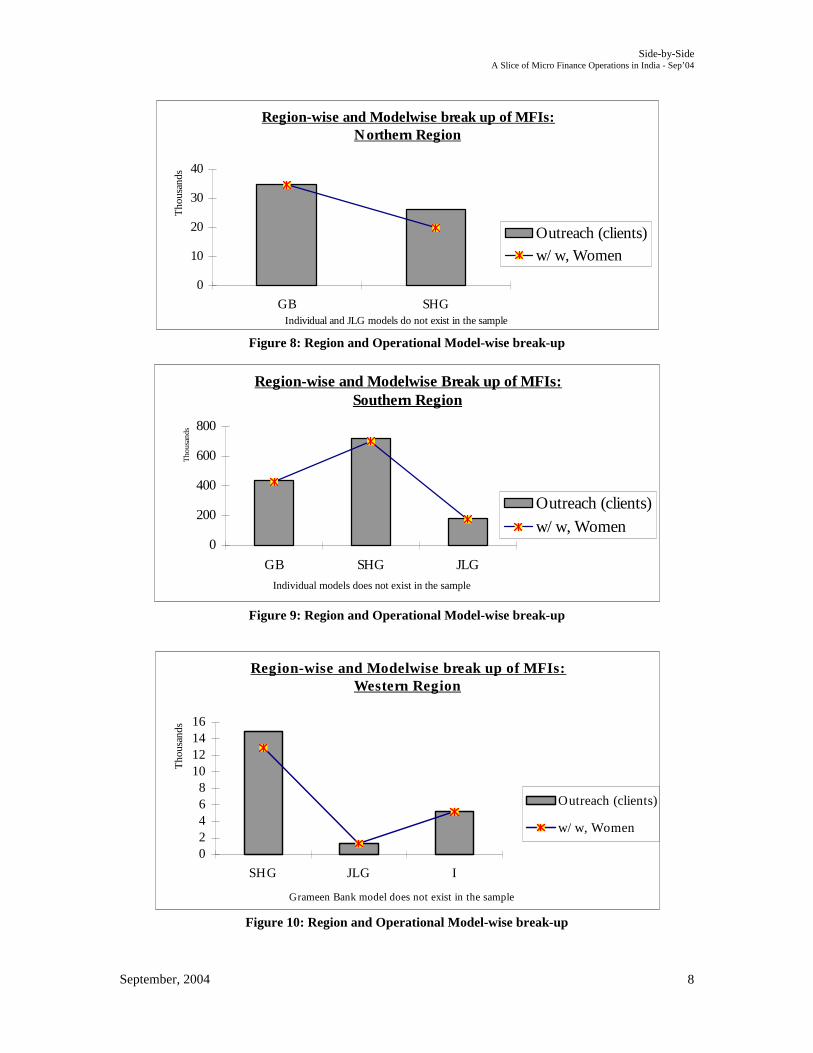
Figure 8: Region and Operational Model-wise break-up
Figure 9: Region and Operational Model-wise break-up
Figure 10: Region and Operational Model-wise break-up
Individual model does not exist in the sample
Region-wise and Modelwise break up of MFIs: Northern Region
0
10
20
30
40
GB SHG
Tho
usan
ds
Outreach (clients)
w/w, Women
Individual and JLG models do not exist in the sample
Region-wise and Modelwise Break up of MFIs: Southern Region
0
200
400
600
800
GB SHG JLG
Tho
usan
ds
Outreach (clients)
w/w, Women
Region-wise and Modelwise break up of MFIs: Western Region
02468
10121416
SHG JLG I
Tho
usan
ds
Outreach (clients)
w/w, Women
Grameen Bank model does not exist in the sample
Individual models does not exist in the sample
Side-by-Side A Slice of Micro Finance Operations in India - Sep’04
September, 2004
9
3 Active Clients In terms of active clients, within the total outreach of Retail-MFIs, as of March 2004 the number of active clients of credit outstrips the number of active clients for other services (savings and insurance). This is prominent in the MFIs working on GB model that is designed around credit.
Table 8: Microfinance Products and Outreach
Table No.8 M.F. Model
GB SHG JLG Active Clients Active Clients Active Clients
Reg
ion
Savings Credit Insurance Savings Credit Insurance SavingsCredit Insurance
East 27561 16872 7727 286591 296622 28435 North 34687 17896 26184 20141 593 South 121181 350434 79923 214730 298359 25275 124409 64680 65584 West 18381 14902 1092 1314 Total 148742 401993 105546 545886 630024 55395 124409 65994 65584
Figure 11: Region-wise break-up of coverage of services
In terms of regions, Table no. 9 below, shows the distribution of retail-MFIs by their intervention methodology (Direct / facilitating) and in terms of their outreach as of March 2004.
Region-wise Break up of Coverage of Services
656660124
554
630545.9
105.5
402
148.7
0
100
200
300
400
500
600
700
Savings Credit Insurance Savings Credit Insurance Savings Credit Insurance
GB SHG JLG
Thousands
Out
reac
h (C
lient
s)
East North South West
Side-by-Side A Slice of Micro Finance Operations in India - Sep’04
September, 2004
10
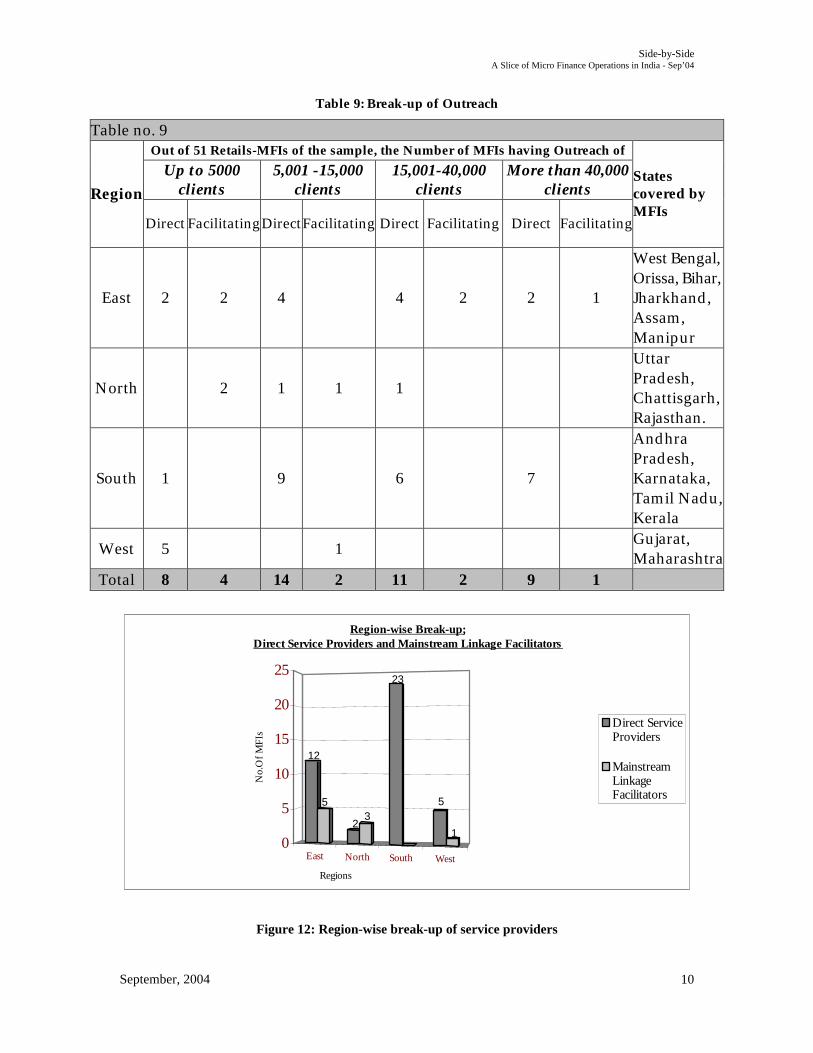
Table 9: Break-up of Outreach
Table no. 9 Out of 51 Retails-MFIs of the sample, the Number of MFIs having Outreach of
Up to 5000 clients
5,001 -15,000 clients
15,001-40,000 clients
More than 40,000 clients Region
Direct FacilitatingDirect Facilitating Direct Facilitating Direct Facilitating
States covered by MFIs
East 2 2 4 4 2 2 1
West Bengal, Orissa, Bihar, Jharkhand, Assam, Manipur
North 2 1 1 1
Uttar Pradesh, Chattisgarh, Rajasthan.
South 1 9 6 7
Andhra Pradesh, Karnataka, Tamil Nadu, Kerala
West 5 1 Gujarat, Maharashtra
Total 8 4 14 2 11 2 9 1
Figure 12: Region-wise break-up of service providers
East North South West
12
5
23
23
5
10
5
10
15
20
25
No.
Of
MF
Is
Regions
Region-wise Break-up;Direct Service Providers and Mainstream Linkage Facilitators
Direct ServiceProviders
MainstreamLinkageFacilitators

Side-by-Side A Slice of Micro Finance Operations in India - Sep’04
September, 2004
11
Overall, the number of MFIs working directly with the poor goes up with the outreach. At the size of up to 5000 clients, the number of retail-MFIs in the 'direct' mode is double the number of MFIs in 'facilitating' mode. The co-relation between number of direct and facilitating MFIs is wider as the outreach size goes up. Regionally, the sample shows that in North India, the number of direct and facilitating MFIs are considerably balanced; in West and East India it is skewed towards direct MFIs and in South India all MFIs are in direct mode of services only. 4 Creating Access of the Poor to Credit Services Credit has emerged as the main service that MFIs are providing to their clients. Across microfinance models, credit services are common. The exact design and nature of credit services varies widely from model to model and MFI to MFI.
Table 10: MFI Services - Credit
Table No. 10
Region Total of Retail-
MFI
Number of MFIs that engaged providing in
credit services East 17 15
North 5 5 South 23 23 West 6 6 Total 51 49
The two MFIs that are not providing credit services, are located in North-East region and are concentrating on building the poor communities with savings services.
As of March 2004, the sample of retail-MFIs that are providing credit services to the clients directly (49 MFIs) had credit portfolio outstanding at Rs.374, 26 lakhs (77.97 million USD).
5 Creating Access of the Poor to Insurance Services
Insurance service is a nascent area of intervention of MFIs. The penetration of insurance services in relation to active clients for savings and credit is very low. Insurance services within MFIs are also selective, as depicted by Table no. 10 below. The three large segments of microfinance models, GB, SHG and JLG have been taken for this analysis.
Side-by-Side A Slice of Micro Finance Operations in India - Sep’04
September, 2004
12
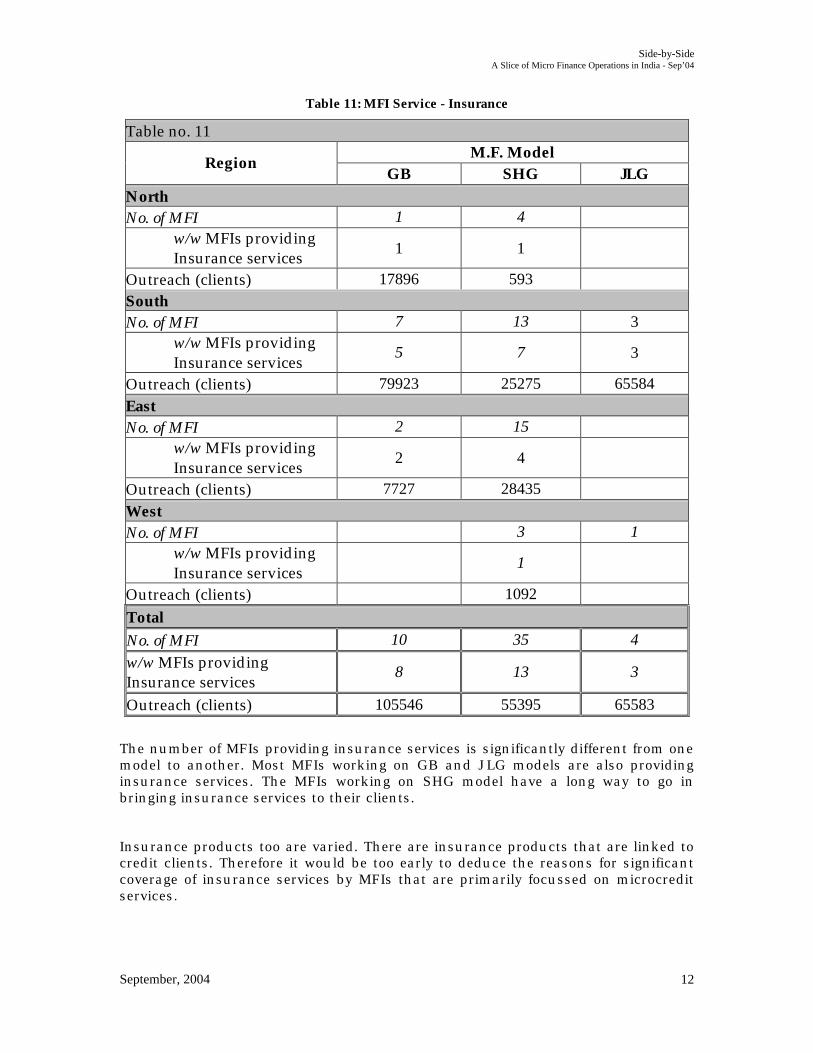
Table 11: MFI Service - Insurance
Table no. 11 M.F. Model
Region GB SHG JLG
North No. of MFI 1 4
w/w MFIs providing Insurance services
1 1
Outreach (clients) 17896 593 South No. of MFI 7 13 3
w/w MFIs providing Insurance services
5 7 3
Outreach (clients) 79923 25275 65584 East No. of MFI 2 15
w/w MFIs providing Insurance services
2 4
Outreach (clients) 7727 28435 West No. of MFI 3 1
w/w MFIs providing Insurance services
1
Outreach (clients) 1092 Total No. of MFI 10 35 4 w/w MFIs providing Insurance services
8 13 3
Outreach (clients) 105546 55395 65583
The number of MFIs providing insurance services is significantly different from one model to another. Most MFIs working on GB and JLG models are also providing insurance services. The MFIs working on SHG model have a long way to go in bringing insurance services to their clients.
Insurance products too are varied. There are insurance products that are linked to credit clients. Therefore it would be too early to deduce the reasons for significant coverage of insurance services by MFIs that are primarily focussed on microcredit services.
Side-by-Side A Slice of Micro Finance Operations in India - Sep’04
September, 2004
13
6 Creating Access of the Poor to Savings Services
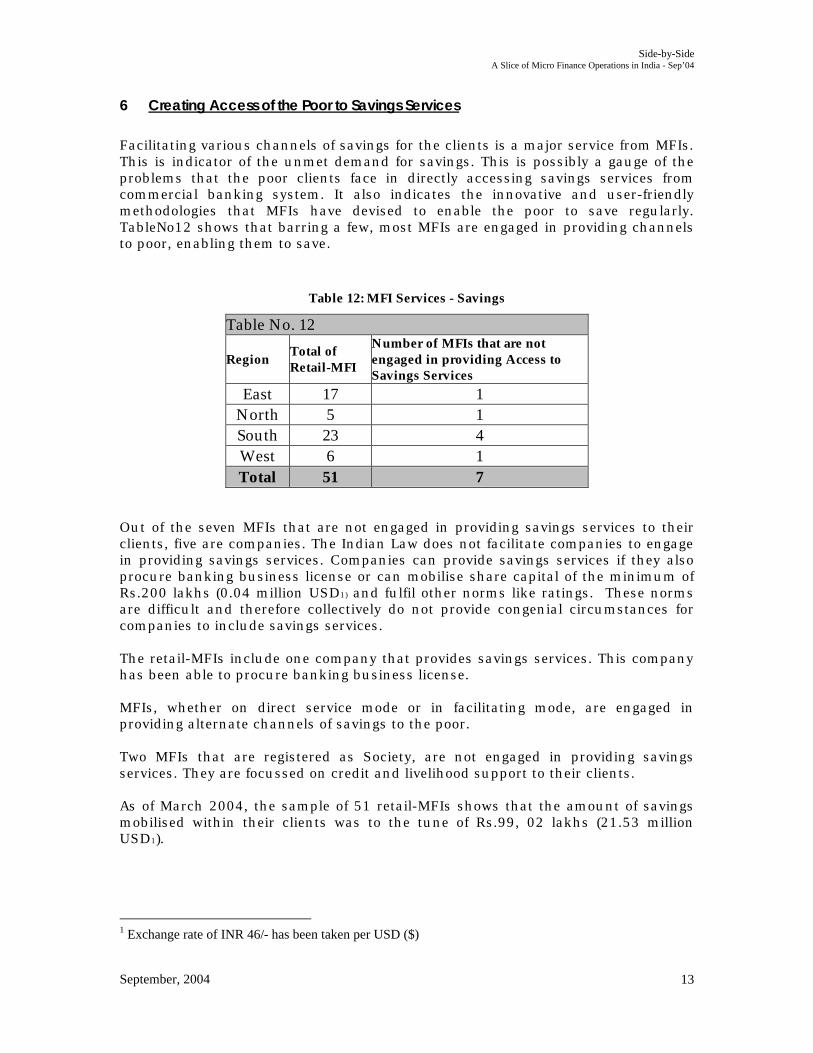
Facilitating various channels of savings for the clients is a major service from MFIs. This is indicator of the unmet demand for savings. This is possibly a gauge of the problems that the poor clients face in directly accessing savings services from commercial banking system. It also indicates the innovative and user-friendly methodologies that MFIs have devised to enable the poor to save regularly. TableNo12 shows that barring a few, most MFIs are engaged in providing channels to poor, enabling them to save.
Table 12: MFI Services - Savings
Table No. 12
Region Total of Retail-MFI
Number of MFIs that are not engaged in providing Access to Savings Services
East 17 1 North 5 1 South 23 4 West 6 1 Total 51 7
Out of the seven MFIs that are not engaged in providing savings services to their clients, five are companies. The Indian Law does not facilitate companies to engage in providing savings services. Companies can provide savings services if they also procure banking business license or can mobilise share capital of the minimum of Rs.200 lakhs (0.04 million USD1) and fulfil other norms like ratings. These norms are difficult and therefore collectively do not provide congenial circumstances for companies to include savings services. The retail-MFIs include one company that provides savings services. This company has been able to procure banking business license. MFIs, whether on direct service mode or in facilitating mode, are engaged in providing alternate channels of savings to the poor. Two MFIs that are registered as Society, are not engaged in providing savings services. They are focussed on credit and livelihood support to their clients. As of March 2004, the sample of 51 retail-MFIs shows that the amount of savings mobilised within their clients was to the tune of Rs.99, 02 lakhs (21.53 million USD1).
1 Exchange rate of INR 46/- has been taken per USD ($)
Side-by-Side A Slice of Micro Finance Operations in India - Sep’04
September, 2004
14
7 Other services
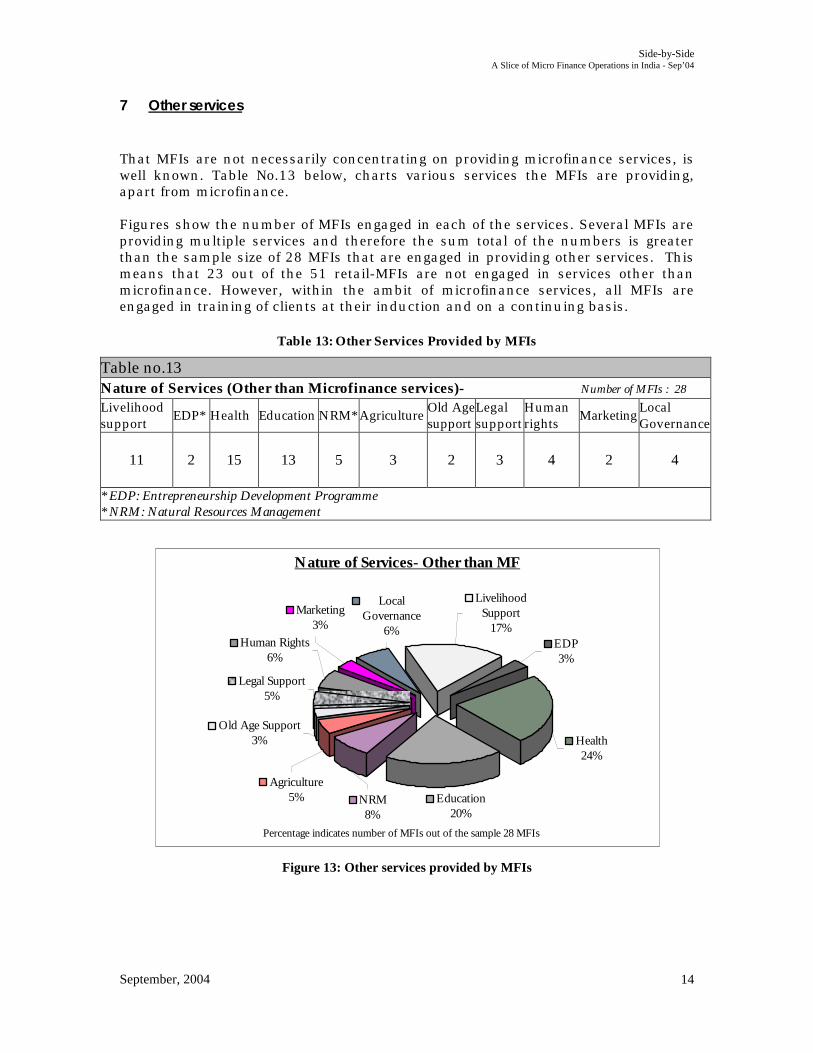
That MFIs are not necessarily concentrating on providing microfinance services, is well known. Table No.13 below, charts various services the MFIs are providing, apart from microfinance. Figures show the number of MFIs engaged in each of the services. Several MFIs are providing multiple services and therefore the sum total of the numbers is greater than the sample size of 28 MFIs that are engaged in providing other services. This means that 23 out of the 51 retail-MFIs are not engaged in services other than microfinance. However, within the ambit of microfinance services, all MFIs are engaged in training of clients at their induction and on a continuing basis.
Table 13: Other Services Provided by MFIs
Table no.13 Nature of Services (Other than Microfinance services)- Number of MFIs : 28 Livelihood support
EDP* Health Education NRM* Agriculture Old Age support
Legal support
Human rights
Marketing Local Governance
11 2 15 13 5 3
2
3 4 2 4
* EDP: Entrepreneurship Development Programme * NRM: Natural Resources Management
Figure 13: Other services provided by MFIs
Nature of Services- Other than MF
Education20%
Health24%
EDP3%
Livelihood Support
17%
Legal Support5%
Old Age Support3%
Agriculture5% NRM
8%
Human Rights6%
Marketing3%
Local Governance
6%
Percentage indicates number of MFIs out of the sample 28 MFIs
FFiinnaanncciiaall PPeerrffoorrmmaannccee ooff SSaammppllee MMFFIIss:: SSttaattuuss RReeppoorrtt
Side-by-Side A Slice of Micro Finance Operations in India - Sep’04
September, 2004
16
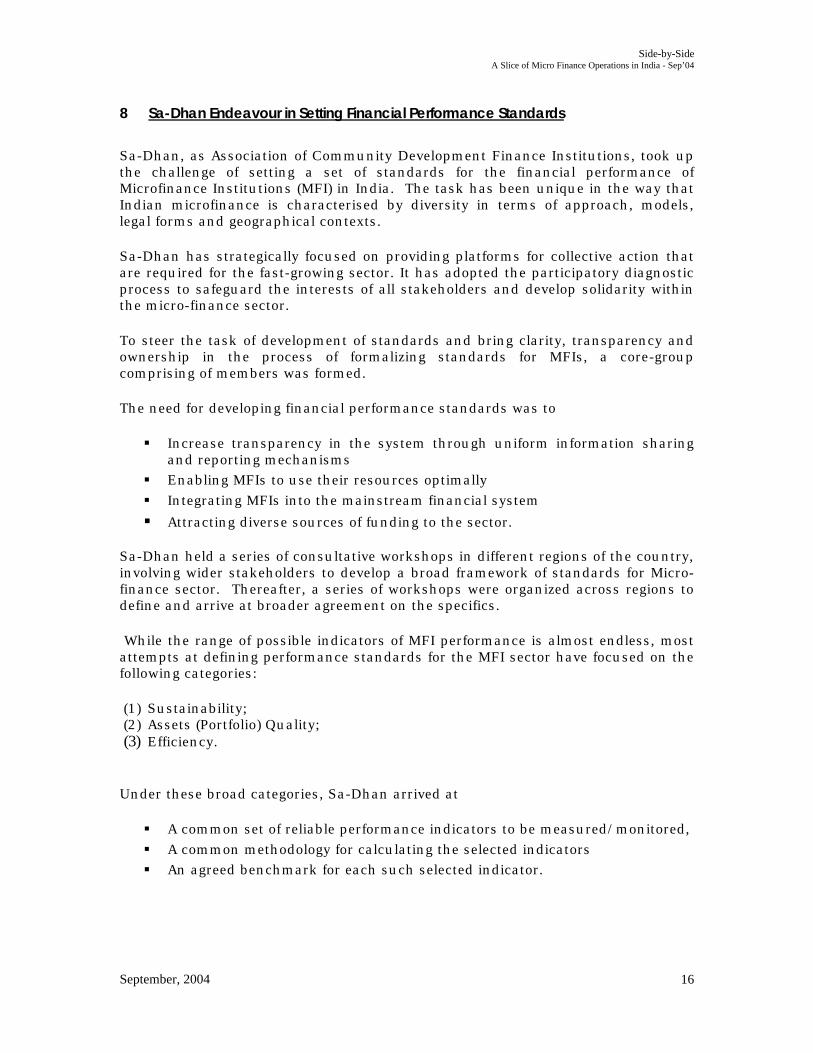
8 Sa-Dhan Endeavour in Setting Financial Performance Standards
Sa-Dhan, as Association of Community Development Finance Institutions, took up the challenge of setting a set of standards for the financial performance of Microfinance Institutions (MFI) in India. The task has been unique in the way that Indian microfinance is characterised by diversity in terms of approach, models, legal forms and geographical contexts.
Sa-Dhan has strategically focused on providing platforms for collective action that are required for the fast-growing sector. It has adopted the participatory diagnostic process to safeguard the interests of all stakeholders and develop solidarity within the micro-finance sector.
To steer the task of development of standards and bring clarity, transparency and ownership in the process of formalizing standards for MFIs, a core-group comprising of members was formed.
The need for developing financial performance standards was to
§ Increase transparency in the system through uniform information sharing and reporting mechanisms
§ Enabling MFIs to use their resources optimally
§ Integrating MFIs into the mainstream financial system
§ Attracting diverse sources of funding to the sector. Sa-Dhan held a series of consultative workshops in different regions of the country, involving wider stakeholders to develop a broad framework of standards for Micro-finance sector. Thereafter, a series of workshops were organized across regions to define and arrive at broader agreement on the specifics.
While the range of possible indicators of MFI performance is almost endless, most attempts at defining performance standards for the MFI sector have focused on the following categories:
(1) Sustainability; (2) Assets (Portfolio) Quality; (3) Efficiency.
Under these broad categories, Sa-Dhan arrived at
§ A common set of reliable performance indicators to be measured/monitored,
§ A common methodology for calculating the selected indicators
§ An agreed benchmark for each such selected indicator.
Side-by-Side A Slice of Micro Finance Operations in India - Sep’04
September, 2004
17
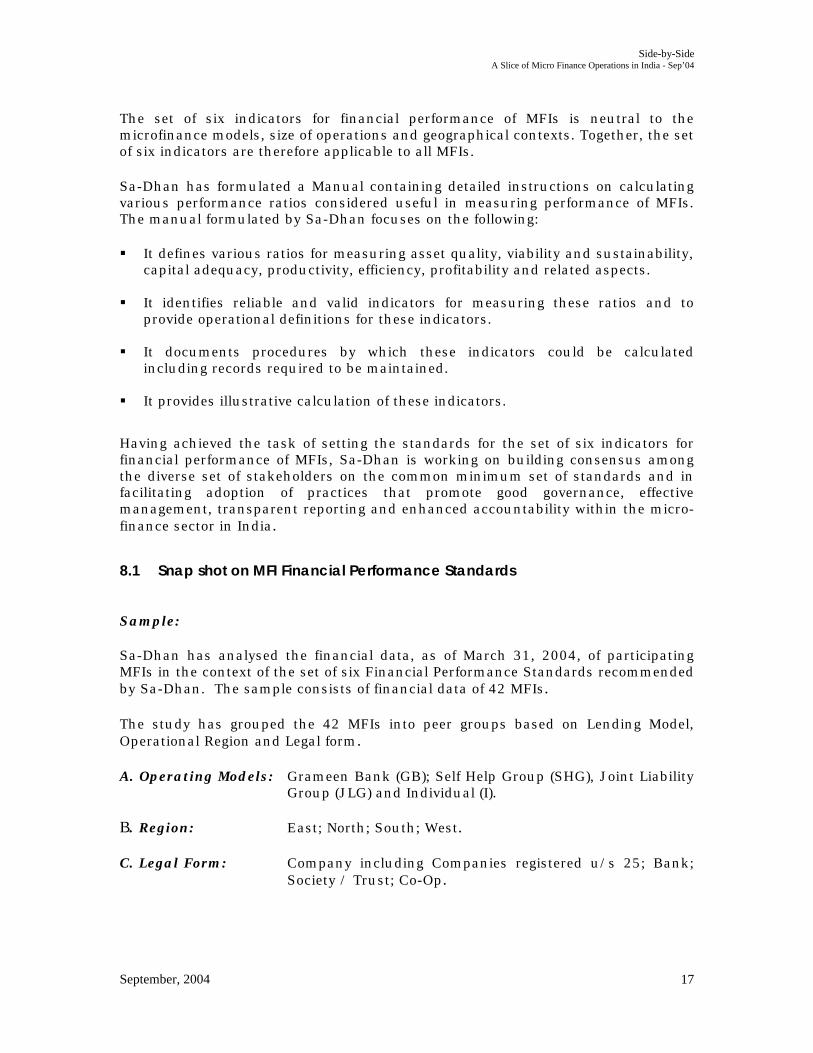
The set of six indicators for financial performance of MFIs is neutral to the microfinance models, size of operations and geographical contexts. Together, the set of six indicators are therefore applicable to all MFIs.
Sa-Dhan has formulated a Manual containing detailed instructions on calculating various performance ratios considered useful in measuring performance of MFIs. The manual formulated by Sa-Dhan focuses on the following: § It defines various ratios for measuring asset quality, viability and sustainability,
capital adequacy, productivity, efficiency, profitability and related aspects.
§ It identifies reliable and valid indicators for measuring these ratios and to provide operational definitions for these indicators.
§ It documents procedures by which these indicators could be calculated including records required to be maintained.
§ It provides illustrative calculation of these indicators.
Having achieved the task of setting the standards for the set of six indicators for financial performance of MFIs, Sa-Dhan is working on building consensus among the diverse set of stakeholders on the common minimum set of standards and in facilitating adoption of practices that promote good governance, effective management, transparent reporting and enhanced accountability within the micro-finance sector in India.
8.1 Snap shot on MFI Financial Performance Standards
Sample: Sa-Dhan has analysed the financial data, as of March 31, 2004, of participating MFIs in the context of the set of six Financial Performance Standards recommended by Sa-Dhan. The sample consists of financial data of 42 MFIs. The study has grouped the 42 MFIs into peer groups based on Lending Model, Operational Region and Legal form. A. Operating Models: Grameen Bank (GB); Self Help Group (SHG), Joint Liability
Group (JLG) and Individual (I). B. Region: East; North; South; West. C. Legal Form: Company including Companies registered u/s 25; Bank;
Society / Trust; Co-Op.
Side-by-Side A Slice of Micro Finance Operations in India - Sep’04
September, 2004
18
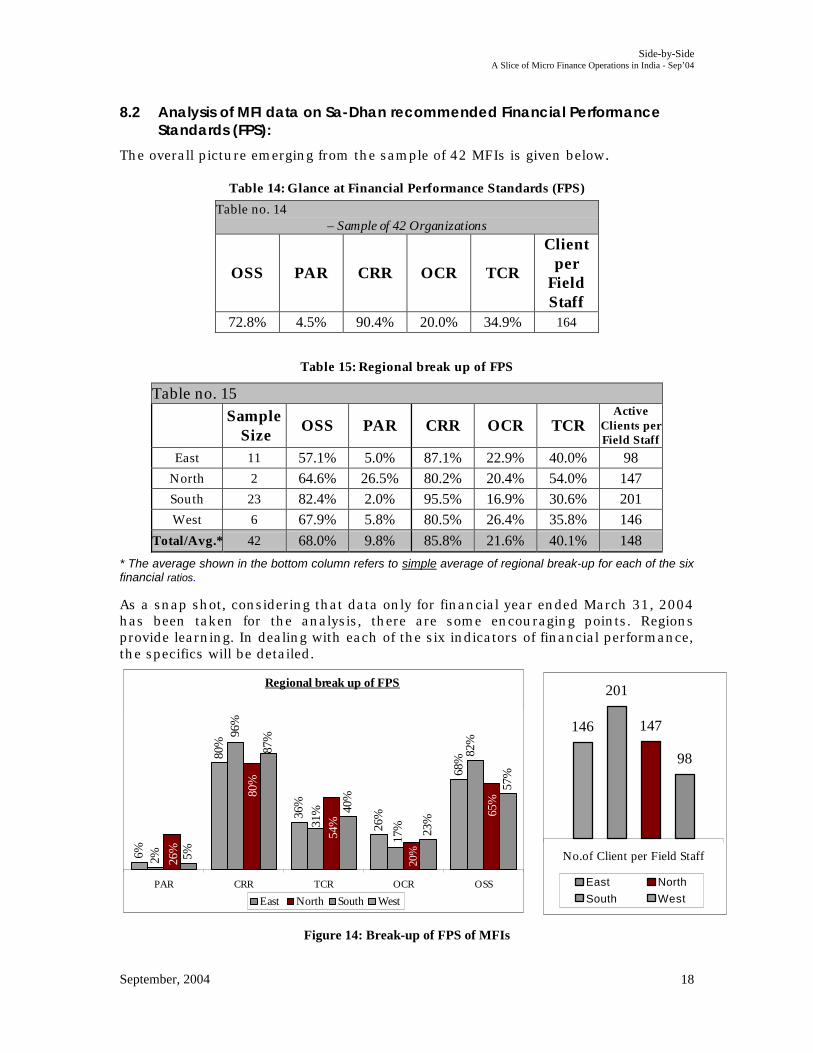
8.2 Analysis of MFI data on Sa-Dhan recommended Financial Performance Standards (FPS):
The overall picture emerging from the sample of 42 MFIs is given below.
Table 14: Glance at Financial Performance Standards (FPS)
Table no. 14 – Sample of 42 Organizations
OSS PAR CRR OCR TCR
Client per
Field Staff
72.8% 4.5% 90.4% 20.0% 34.9% 164
Table 15: Regional break up of FPS
Table no. 15
Sample
Size OSS PAR CRR OCR TCR
Active Clients per Field Staff
East 11 57.1% 5.0% 87.1% 22.9% 40.0% 98 North 2 64.6% 26.5% 80.2% 20.4% 54.0% 147 South 23 82.4% 2.0% 95.5% 16.9% 30.6% 201 West 6 67.9% 5.8% 80.5% 26.4% 35.8% 146
Total/Avg.* 42 68.0% 9.8% 85.8% 21.6% 40.1% 148 * The average shown in the bottom column refers to simple average of regional break-up for each of the six financial ratios.
As a snap shot, considering that data only for financial year ended March 31, 2004 has been taken for the analysis, there are some encouraging points. Regions provide learning. In dealing with each of the six indicators of financial performance, the specifics will be detailed.
Figure 14: Break-up of FPS of MFIs
Regional break up of FPS
57%
23%
40%
5%2%
68%
26%36
%
80%
6%
87%
26%
54%
80%
20%
65%
31%
17%
82%
96%
OSSOCRTCRCRRPAR
East North South West
98
147
201
146
No.of Client per Field Staff
East North
South West
Side-by-Side A Slice of Micro Finance Operations in India - Sep’04
September, 2004
19
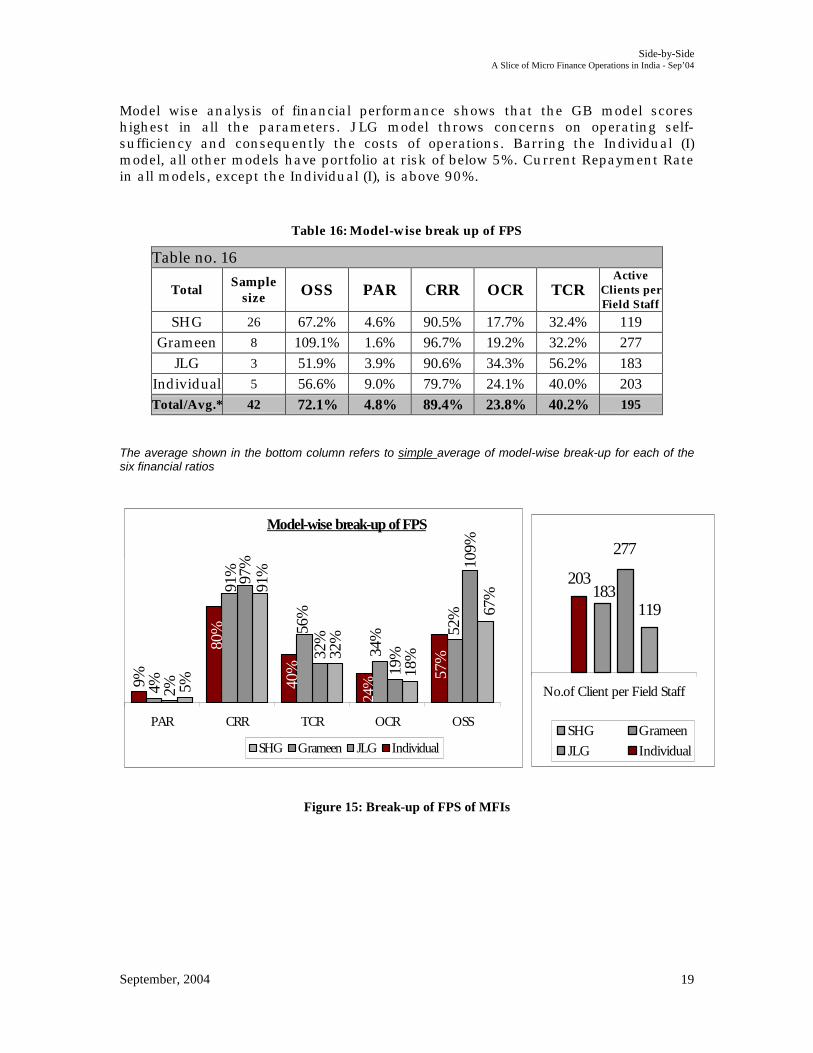
Model wise analysis of financial performance shows that the GB model scores highest in all the parameters. JLG model throws concerns on operating self-sufficiency and consequently the costs of operations. Barring the Individual (I) model, all other models have portfolio at risk of below 5%. Current Repayment Rate in all models, except the Individual (I), is above 90%.
Table 16: Model-wise break up of FPS
Table no. 16
Total Sample
size OSS PAR CRR OCR TCR Active
Clients per Field Staff
SHG 26 67.2% 4.6% 90.5% 17.7% 32.4% 119 Grameen 8 109.1% 1.6% 96.7% 19.2% 32.2% 277
JLG 3 51.9% 3.9% 90.6% 34.3% 56.2% 183 Individual 5 56.6% 9.0% 79.7% 24.1% 40.0% 203 Total/Avg.* 42 72.1% 4.8% 89.4% 23.8% 40.2% 195
The average shown in the bottom column refers to simple average of model-wise break-up for each of the six financial ratios
Figure 15: Break-up of FPS of MFIs
Model-wise break-up of FPS
18%32
%
5%
19%32
%
2%4%
67%91
%97% 10
9%
91%
52%
34%56
%
57%
24%
80%
40%
9%
OSSOCRTCRCRRPAR
SHG Grameen JLG Individual
119
203
277
183
No.of Client per Field Staff
SHG Grameen
JLG Individual
Side-by-Side A Slice of Micro Finance Operations in India - Sep’04
September, 2004
20
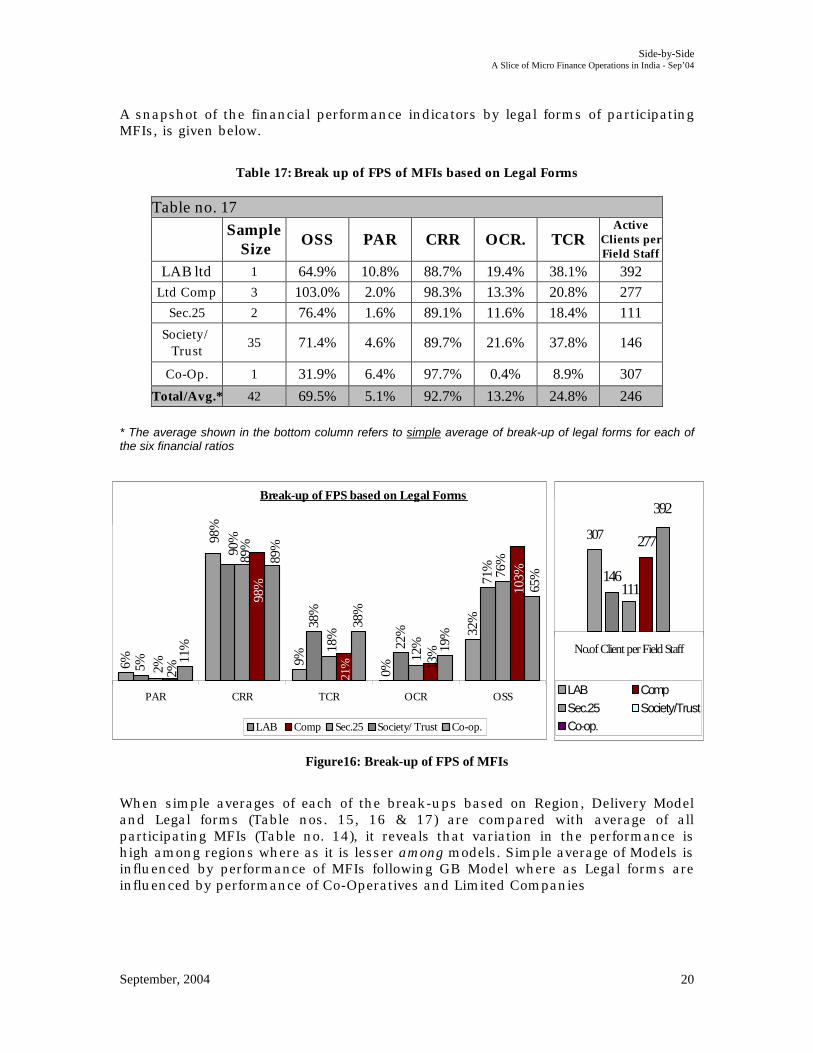
A snapshot of the financial performance indicators by legal forms of participating MFIs, is given below.
Table 17: Break up of FPS of MFIs based on Legal Forms
Table no. 17
Sample
Size OSS PAR CRR OCR. TCR
Active Clients per Field Staff
LAB ltd 1 64.9% 10.8% 88.7% 19.4% 38.1% 392 Ltd Comp 3 103.0% 2.0% 98.3% 13.3% 20.8% 277
Sec.25 2 76.4% 1.6% 89.1% 11.6% 18.4% 111 Society/
Trust 35 71.4% 4.6% 89.7% 21.6% 37.8% 146
Co-Op. 1 31.9% 6.4% 97.7% 0.4% 8.9% 307 Total/Avg.* 42 69.5% 5.1% 92.7% 13.2% 24.8% 246
* The average shown in the bottom column refers to simple average of break-up of legal forms for each of the six financial ratios
Figure16: Break-up of FPS of MFIs
When simple averages of each of the break-ups based on Region, Delivery Model and Legal forms (Table nos. 15, 16 & 17) are compared with average of all participating MFIs (Table no. 14), it reveals that variation in the performance is high among regions where as it is lesser among models. Simple average of Models is influenced by performance of MFIs following GB Model where as Legal forms are influenced by performance of Co-Operatives and Limited Companies
Break-up of FPS based on Legal Forms
19%
38%
11%
71%
22%
5%
32%
0%
9%6%
65%
89%
2%
103%
13%
98%
21%2%
89%
76%
12%18
%
90%
38%
98%
OSSOCRTCRCRRPAR
LAB Comp Sec.25 Society/Trust Co-op.
277
146
307
392
111
No.of Client per Field Staff
LAB Comp
Sec.25 Society/Trust
Co-op.
Side-by-Side A Slice of Micro Finance Operations in India - Sep’04
September, 2004
21
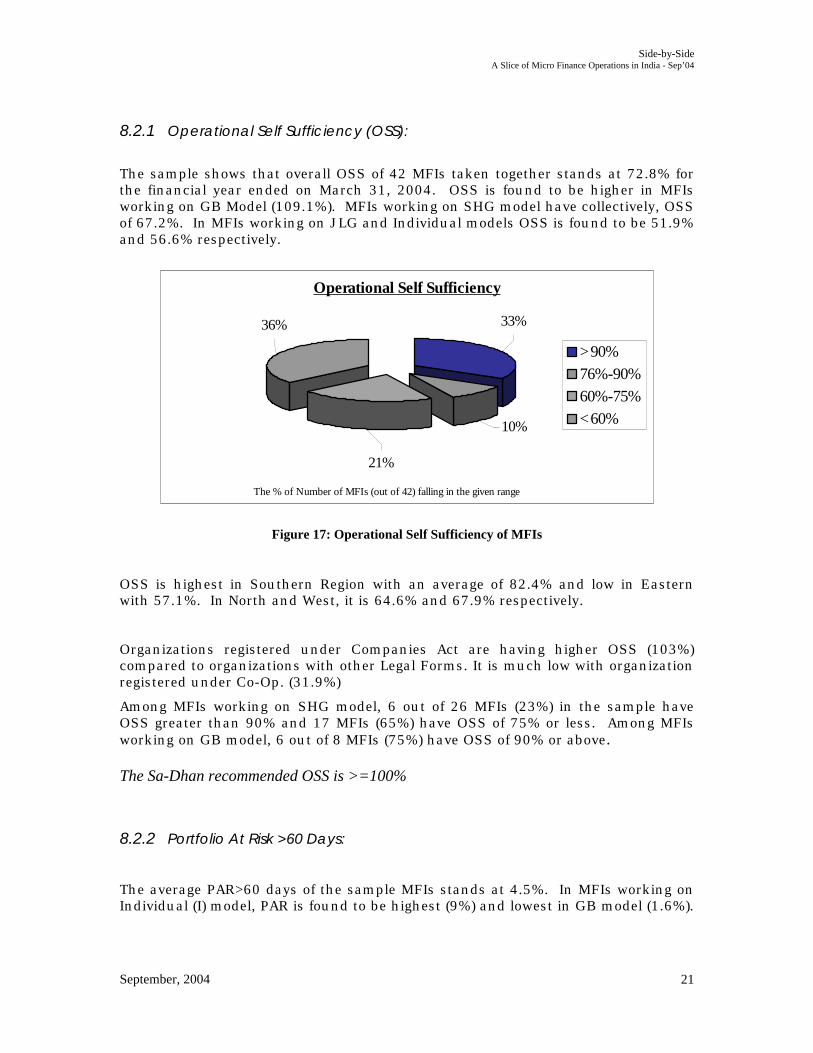
8.2.1 Operational Self Sufficiency (OSS):
The sample shows that overall OSS of 42 MFIs taken together stands at 72.8% for the financial year ended on March 31, 2004. OSS is found to be higher in MFIs working on GB Model (109.1%). MFIs working on SHG model have collectively, OSS of 67.2%. In MFIs working on JLG and Individual models OSS is found to be 51.9% and 56.6% respectively.
Figure 17: Operational Self Sufficiency of MFIs
OSS is highest in Southern Region with an average of 82.4% and low in Eastern with 57.1%. In North and West, it is 64.6% and 67.9% respectively.
Organizations registered under Companies Act are having higher OSS (103%) compared to organizations with other Legal Forms. It is much low with organization registered under Co-Op. (31.9%)
Among MFIs working on SHG model, 6 out of 26 MFIs (23%) in the sample have OSS greater than 90% and 17 MFIs (65%) have OSS of 75% or less. Among MFIs working on GB model, 6 out of 8 MFIs (75%) have OSS of 90% or above. The Sa-Dhan recommended OSS is >=100%
8.2.2 Portfolio At Risk >60 Days:
The average PAR>60 days of the sample MFIs stands at 4.5%. In MFIs working on Individual (I) model, PAR is found to be highest (9%) and lowest in GB model (1.6%).
Operational Self Sufficiency
21%
10%
36% 33%
>90%
76%-90%
60%-75%
<60%
The % of Number of MFIs (out of 42) falling in the given range
Side-by-Side A Slice of Micro Finance Operations in India - Sep’04
September, 2004
22
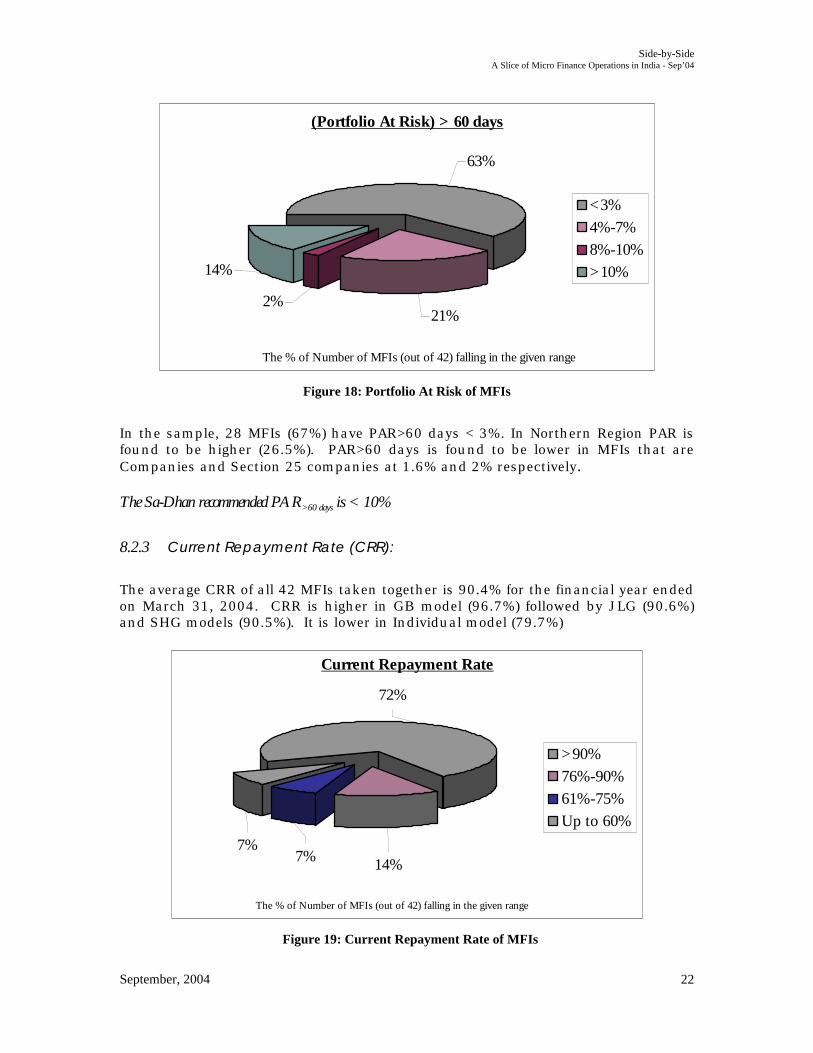
Figure 18: Portfolio At Risk of MFIs
In the sample, 28 MFIs (67%) have PAR>60 days < 3%. In Northern Region PAR is found to be higher (26.5%). PAR>60 days is found to be lower in MFIs that are Companies and Section 25 companies at 1.6% and 2% respectively. The Sa-Dhan recommended PAR>60 days is < 10%
8.2.3 Current Repayment Rate (CRR):
The average CRR of all 42 MFIs taken together is 90.4% for the financial year ended on March 31, 2004. CRR is higher in GB model (96.7%) followed by JLG (90.6%) and SHG models (90.5%). It is lower in Individual model (79.7%)
Figure 19: Current Repayment Rate of MFIs
(Portfolio At Risk) > 60 days
63%
14%
21%2%
<3%
4%-7%
8%-10%
>10%
The % of Number of MFIs (out of 42) falling in the given range
Current Repayment Rate
7% 14%7%
72%
>90%
76%-90%
61%-75%
Up to 60%
The % of Number of MFIs (out of 42) falling in the given range

Side-by-Side A Slice of Micro Finance Operations in India - Sep’04
September, 2004
23
The Southern region has higher CRR (95.5%) compared to other regions. CRR in Eastern and Western Regions is at 87.1% and 80.5% respectively. MFIs registered under Companies and Co-Op. Act are found to have higher CRR (98.3% & 97.7%) where as it is lower with LAB (88.7%) and Sec.25 Companies (89.1%). Out of the total sample, 71.4% of the MFIs have CRR of 90% or more and only 14% (6 MFIs) have CRR of less than 75%. The Sa-Dhan recommended CRR > 90%
8.2.4 Total Cost Ratio (TCR):
Average TCR of the sample MFIs stands at 34.9%. The TCR is higher in JLG model (56.2%) and lower in SHG (32.4%) and GB models (32.2%)
Figure 20: Total Cost Ratio of MFIs
TCR is higher in Northern Region (54%) and lower in Southern Region (30.6%). In Eastern and Western regions TCR is 40% and 35.8% respectively. The study shows that TCR is lower in Co-Op. (8.9%) and Sec.25 Companies (18.4%), and higher in LAB and Societies/Trusts, 38% & 37.8%, respectively. It is interestingly found that 60% of the sample MFIs has TCR of greater than 30%. Particularly in JLG model 67% of the MFIs have more than 30% TCR. The Sa-Dhan recommended TCR < 30%
Total Cost Ratio
14%
60%
12%
14%
Up to 15%
16%-25%
26%-30%>30%
The % of Number of MFIs (out of 42) falling in the given range

Side-by-Side A Slice of Micro Finance Operations in India - Sep’04
September, 2004
24
8.2.5 Operating Cost Ratio (OCR):
The average OCR of 42 MFIs is found to be 20%. OCR is high in JLG (34.3%) and Individual (24.1%) models. In GB and SHG models OCR is 19.2% and 17.7% respectively.
Figure 21: Operating Cost Ratio of MFIs
OCR is lower in Southern Region (16.9%) and higher in Western Region (26.4%). In Northern and Eastern Regions it is 20.4% and 22.9% respectively. OCR is lower in Co-Op. (0.4%) and Sec.25 Companies (11.6%). 19 MFIs (46%) have OCR higher than 20%.
The Sa-Dhan recommended OCR < 20%
Operating Cost Ratio
21%46%
14%19%
Up to 10%
11%-15%
16%-20%
>20%
The % of Number of MFIs (out of 42) falling in the given range
Side-by-Side A Slice of Micro Finance Operations in India - Sep’04
September, 2004
25
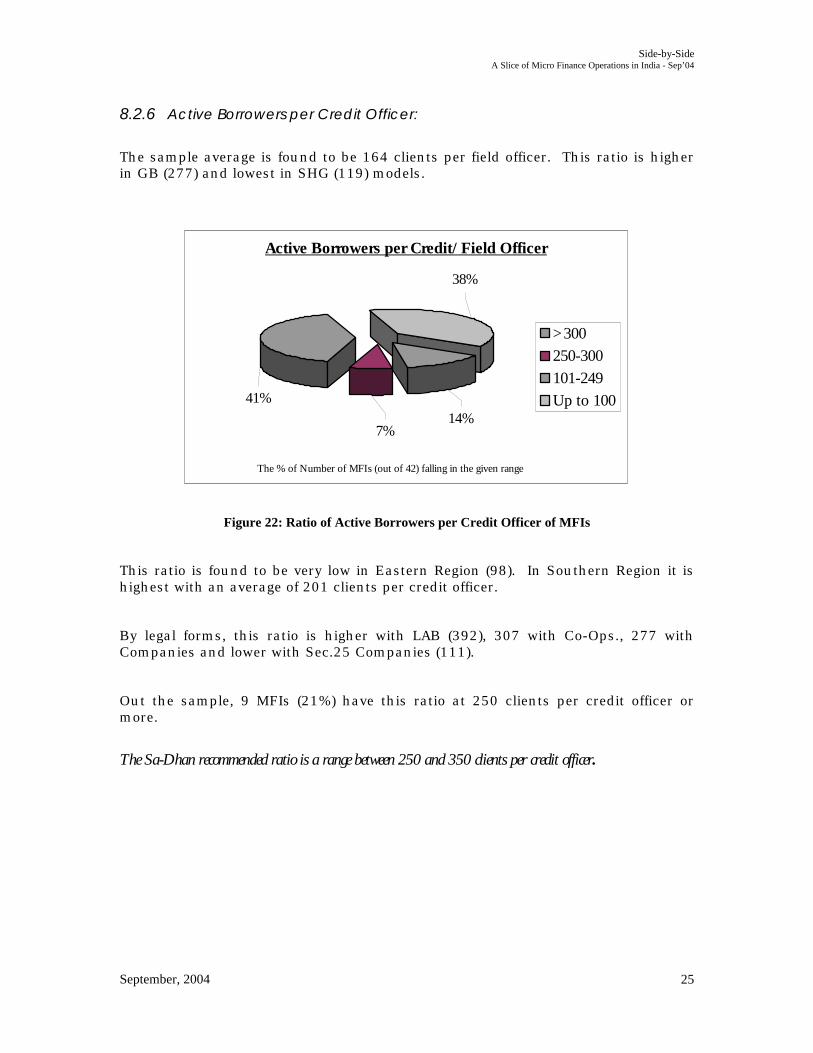
8.2.6 Active Borrowers per Credit Officer:
The sample average is found to be 164 clients per field officer. This ratio is higher in GB (277) and lowest in SHG (119) models.
Figure 22: Ratio of Active Borrowers per Credit Officer of MFIs
This ratio is found to be very low in Eastern Region (98). In Southern Region it is highest with an average of 201 clients per credit officer.
By legal forms, this ratio is higher with LAB (392), 307 with Co-Ops., 277 with Companies and lower with Sec.25 Companies (111).
Out the sample, 9 MFIs (21%) have this ratio at 250 clients per credit officer or more.
The Sa-Dhan recommended ratio is a range between 250 and 350 clients per credit officer.
Active Borrowers per Credit/Field Officer
14%
38%
7%
41%
>300
250-300
101-249
Up to 100
The % of Number of MFIs (out of 42) falling in the given range
Side-by-Side A Slice of Micro Finance Operations in India - Sep’04
September, 2004
26
9 Final Words This report on MFIs has tried to present a snapshot of microfinance in India. This is a beginning. Sa-Dhan will endeavour to expand the scope of the subsequent reports to present the status of microfinance in India. As a snapshot, the report has not delved into the MF growth patterns; however certain issues have emerged from the report. Primarily, the tasks of data compilation and analysis have been achieved in a period of eight weeks. This indicates the transparency and readiness among MFIs to share their operational and financial details. The outreach figures are encouraging. Given that microfinance is a nascent sub-sector, the outreach proves that MF is not about financial products only. The preparedness and professional inputs that MFIs bring in, is sublime but apparent. The financial performance indicators, as a snap shot, are a mix of achievements. As financial data gets compared over successive periods, the performance of MFIs will be more pronounced. Regional features of MFIs convince that the inroads made in southern region provide substantial learning for MFIs in other regions. The presence of companies and SHGs has emerged as features of microfinance in India; these will provide impetus to the movement that aims at providing the poor with financial services on their terms.
**********
IN IN
DIA Side-by-Side
A Slice of Micro Finance OperationsSeptember 2004
New Delhi Office12 & 13, 2nd Floor, MPTCD Building, Special Institutional Area,Shaheed Jeet Singh Marg, New Delhi -110 067Tel: +91-11-55650787/26518276 Fax: +91-11-26518276
E-mail: [email protected] Site: www.sa-dhan.org
Registered Office404, Nirmal Towers, Dwarkapuri Colony, Punjagutta,Hyderabad - 500082Tel: +91-40-6782780 Fax: +91-40-3358846


![MICRO SWITCH™ Compact Limit Switches, NGC Series · 4 sensing.honeywell.com MICRO SWITC Compact Limit Switches NGC Series Figure 3. Side Rotary A1A/A1B Dimensions Side Exit 12 [0.47]](https://img.pdfslide.net/doc/110x75/612a1d738f4a40428a55bbfd/micro-switcha-compact-limit-switches-ngc-series-4-sensinghoneywellcom-micro.jpg)