Embed Size (px)
Citation preview

Algebra – 2008 Copyright © 2008 by Noyce Foundation All rights reserved.
55
Sidewalk Patterns This problem gives you the chance to: • work with patterns • work out the nth term of a sequence In Prague some sidewalks are made of small square blocks of stone. The blocks are in different shades to make patterns that are in various sizes.
1. Draw the next pattern in this series.
Pattern number 1
Pattern number 2
Pattern number 3
Pattern number 4
You may not need to use all of the squares on this grid.
Algebra – 2008 Copyright © 2008 by Noyce Foundation All rights reserved.
56
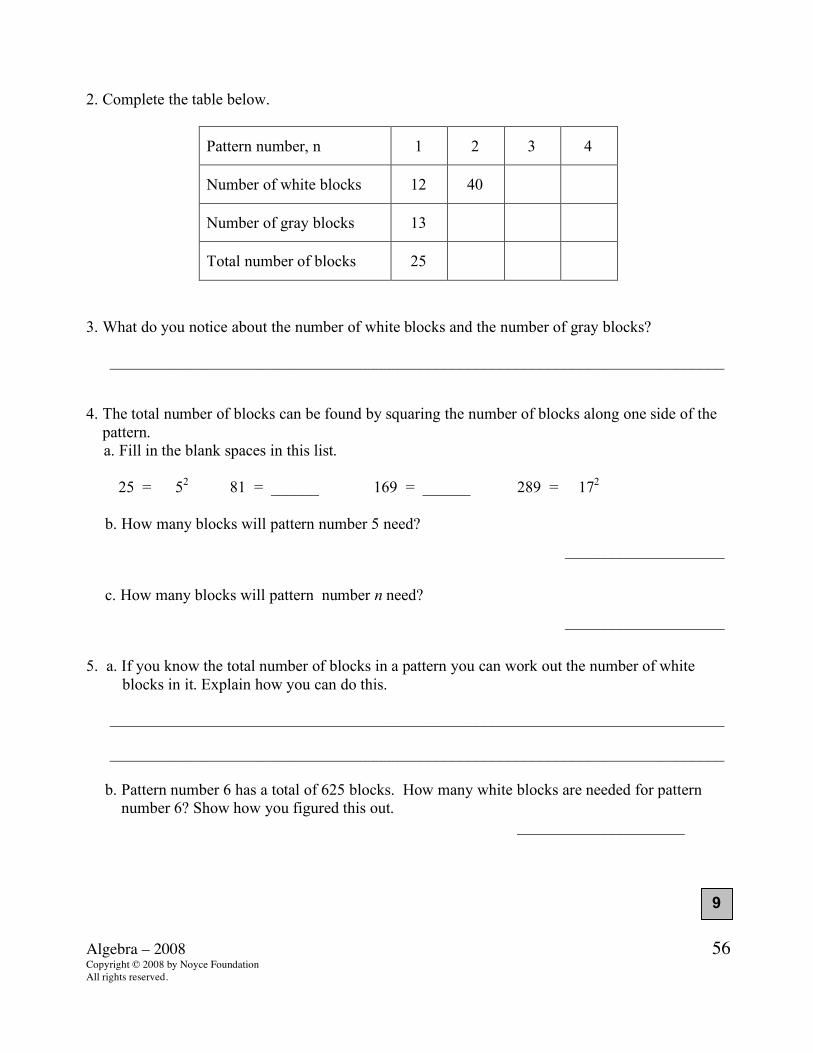
2. Complete the table below.
Pattern number, n 1 2 3 4
Number of white blocks 12 40
Number of gray blocks 13
Total number of blocks 25
3. What do you notice about the number of white blocks and the number of gray blocks?
_____________________________________________________________________________
4. The total number of blocks can be found by squaring the number of blocks along one side of the pattern.
a. Fill in the blank spaces in this list.
25 = 52 81 = ______ 169 = ______ 289 = 172
b. How many blocks will pattern number 5 need?
____________________
c. How many blocks will pattern number n need? ____________________
5. a. If you know the total number of blocks in a pattern you can work out the number of white blocks in it. Explain how you can do this.
_____________________________________________________________________________
_____________________________________________________________________________ b. Pattern number 6 has a total of 625 blocks. How many white blocks are needed for pattern number 6? Show how you figured this out.
_____________________
9

Algebra – 2008 Copyright © 2008 by Noyce Foundation All rights reserved.
57
Sidewalk Patterns Rubric The core elements of performance required by this task are: • work with patterns • work out the nth term of a sequence Based on these, credit for specific aspects of performance should be assigned as follows
points
section points
1. Draws correct pattern:
1
1
2. Gives correct answers: Pattern number, n 1 2 3 4
Number of white blocks 12 40 84 144 Number of gray blocks 13 41 85 145 Total number of blocks 25 81 169 289
Partial credit: 5, 6 or 7 correct..
2
(1)
2 3. Gives a correct answer such as: there is one more gray than white blocks 1
1 4.a. b. c.
Gives correct answers: 92 and 132 Gives correct answer: 212 and/or 441 Gives correct answer: (4n +1)2 or equivalent
1 1 2
4
5.a. b.
Gives a correct answer such as: Subtract 1 from the total and divide by 2. and Gives correct answer: 312 and Shows work such as: (625 – 1) / 2
1
1
Total Points 9
Algebra – 2008 Copyright © 2008 by Noyce Foundation All rights reserved.
58
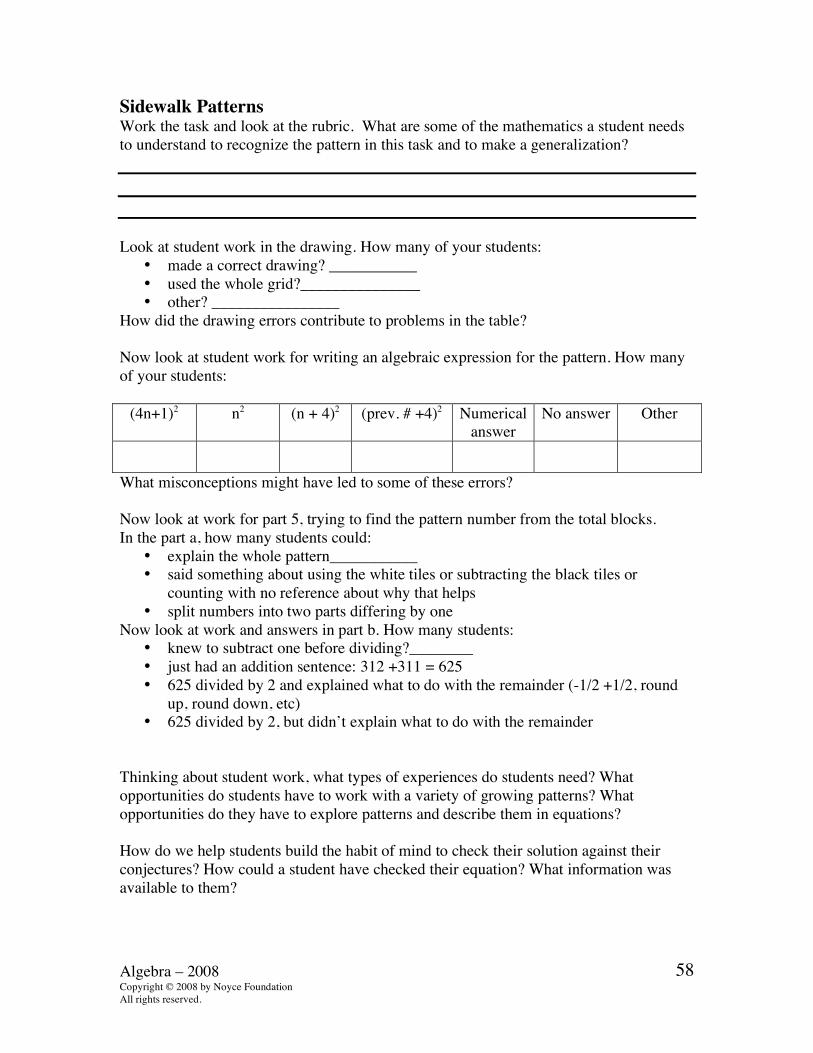
Sidewalk Patterns Work the task and look at the rubric. What are some of the mathematics a student needs to understand to recognize the pattern in this task and to make a generalization? Look at student work in the drawing. How many of your students:
• made a correct drawing? ___________ • used the whole grid?_______________ • other? ________________
How did the drawing errors contribute to problems in the table? Now look at student work for writing an algebraic expression for the pattern. How many of your students:
(4n+1)2 n2 (n + 4)2 (prev. # +4)2 Numerical answer
No answer Other
What misconceptions might have led to some of these errors? Now look at work for part 5, trying to find the pattern number from the total blocks. In the part a, how many students could:
• explain the whole pattern___________ • said something about using the white tiles or subtracting the black tiles or
counting with no reference about why that helps • split numbers into two parts differing by one
Now look at work and answers in part b. How many students: • knew to subtract one before dividing?________ • just had an addition sentence: 312 +311 = 625 • 625 divided by 2 and explained what to do with the remainder (-1/2 +1/2, round
up, round down, etc) • 625 divided by 2, but didn’t explain what to do with the remainder
Thinking about student work, what types of experiences do students need? What opportunities do students have to work with a variety of growing patterns? What opportunities do they have to explore patterns and describe them in equations? How do we help students build the habit of mind to check their solution against their conjectures? How could a student have checked their equation? What information was available to them?

Algebra – 2008 Copyright © 2008 by Noyce Foundation All rights reserved.
59
Looking at Student Work on Sidewalk Patterns Student A draws the correct picture for pattern 4, is able to complete the table, write the correct formula for total tiles anywhere in the pattern, gives a thorough explanation with calculations for find the number of white blocks in pattern number 6. Student A
Algebra – 2008 Copyright © 2008 by Noyce Foundation All rights reserved.
60
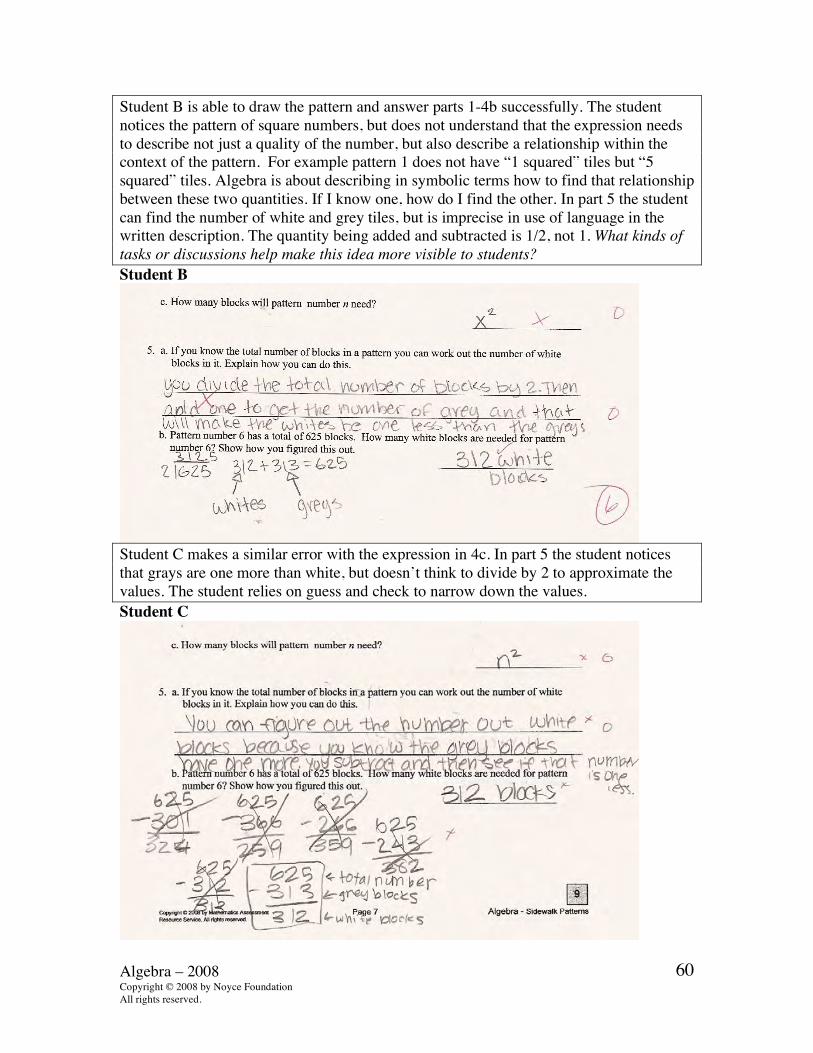
Student B is able to draw the pattern and answer parts 1-4b successfully. The student notices the pattern of square numbers, but does not understand that the expression needs to describe not just a quality of the number, but also describe a relationship within the context of the pattern. For example pattern 1 does not have “1 squared” tiles but “5 squared” tiles. Algebra is about describing in symbolic terms how to find that relationship between these two quantities. If I know one, how do I find the other. In part 5 the student can find the number of white and grey tiles, but is imprecise in use of language in the written description. The quantity being added and subtracted is 1/2, not 1. What kinds of tasks or discussions help make this idea more visible to students? Student B
Student C makes a similar error with the expression in 4c. In part 5 the student notices that grays are one more than white, but doesn’t think to divide by 2 to approximate the values. The student relies on guess and check to narrow down the values. Student C

Algebra – 2008 Copyright © 2008 by Noyce Foundation All rights reserved.
61
In looking at 4 a, the student sees a pattern in the answers. Student D uses this pattern to write a recursive rule to find for the nth term rather than a generalizable pattern. Student D
Student E has noticed some interesting relationships within the pattern. If you add 52 + 22, you will get the total black tiles for stage 2. If you add 72 + 62, you will get the total black tiles for stage 3. Play around with this idea. How might it help you write a correct equation for 4c? Now look at the work for Student D. What is wrong with the way he has tried to quantify the pattern? What is he forgetting? Student E

Algebra – 2008 Copyright © 2008 by Noyce Foundation All rights reserved.
62
Student F makes some common errors. In 4a, the student notices that the number squared goes up by 4 each time. However this does not lead to the expression (n+4)2. In part 5 the student gives a verbal rule for finding white that only works for pattern 1, where there is only 1 row of white tiles on each side. Can you write a verbal rule that will describe the growth of the white tiles based on the visual pattern and multiplying by 4? How do you think the student would explain how to draw the “one side” for any pattern number? Look at the 25- 12. This is not a random pattern. How does this relate to the students pattern? Where do the numbers come from? When you finish with the mathematics the student is using, what questions would help push the student’s thinking? Student F
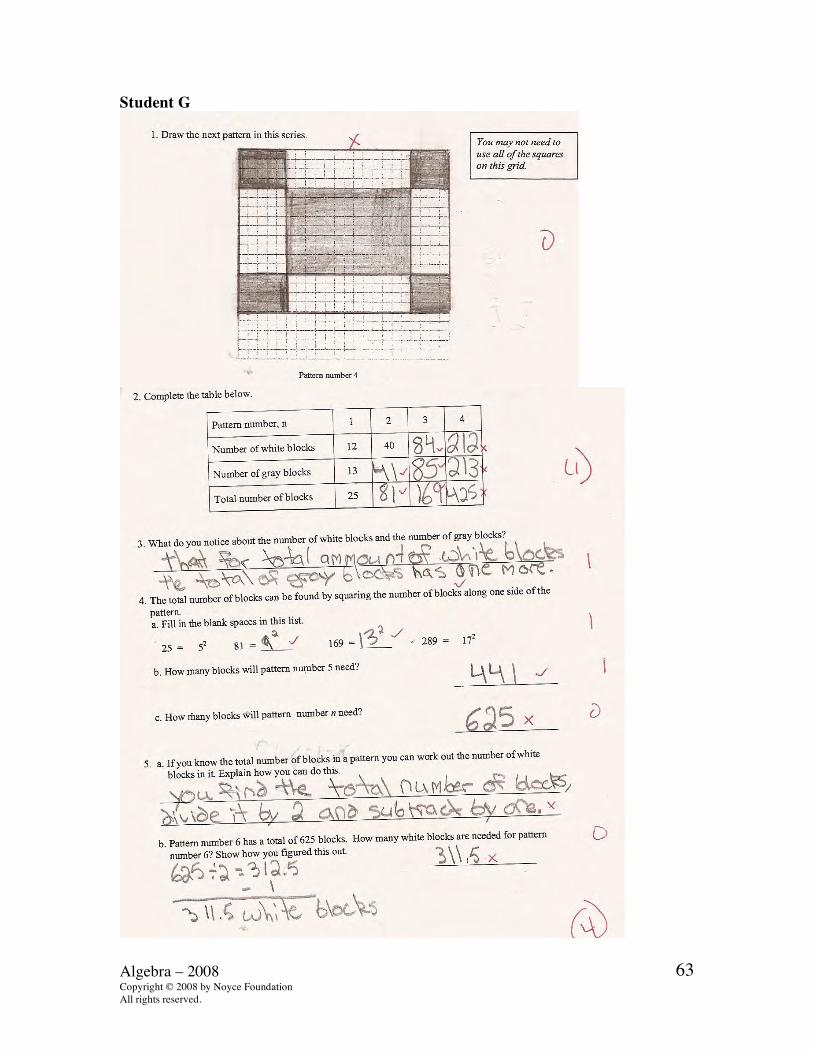
Student G is unable to draw the next picture in the pattern. Notice that the figure is distorted. While the student makes a statement similar to that of Student B, Student G uses the rule exactly to get an incorrect value for white blocks. The student is not bothered by the idea of a “half” block. Student G also uses a number value instead of an expression for part 4c. 17% of all students gave numerical answers for 4c, ranging from as low as 18 to a high of 968.
Algebra – 2008 Copyright © 2008 by Noyce Foundation All rights reserved.
63
Student G
Algebra – 2008 Copyright © 2008 by Noyce Foundation All rights reserved.
64
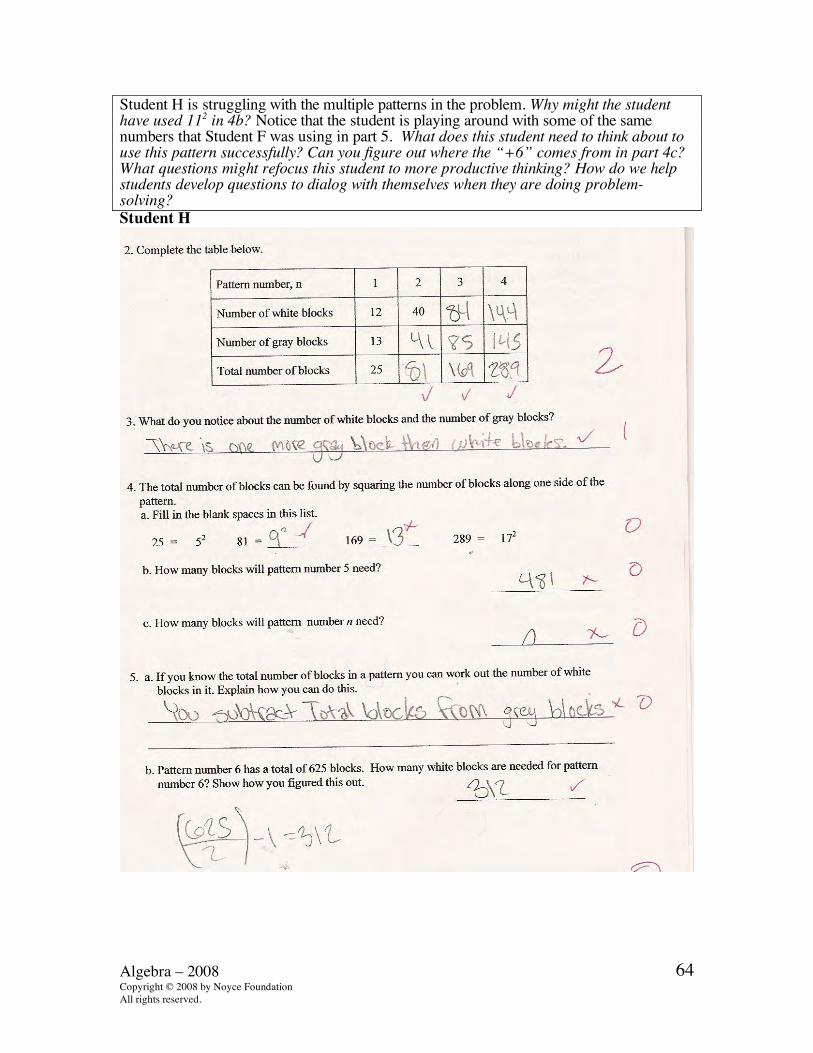
Student H is struggling with the multiple patterns in the problem. Why might the student have used 112 in 4b? Notice that the student is playing around with some of the same numbers that Student F was using in part 5. What does this student need to think about to use this pattern successfully? Can you figure out where the “+6” comes from in part 4c? What questions might refocus this student to more productive thinking? How do we help students develop questions to dialog with themselves when they are doing problem-solving? Student H
Algebra – 2008 Copyright © 2008 by Noyce Foundation All rights reserved.
65
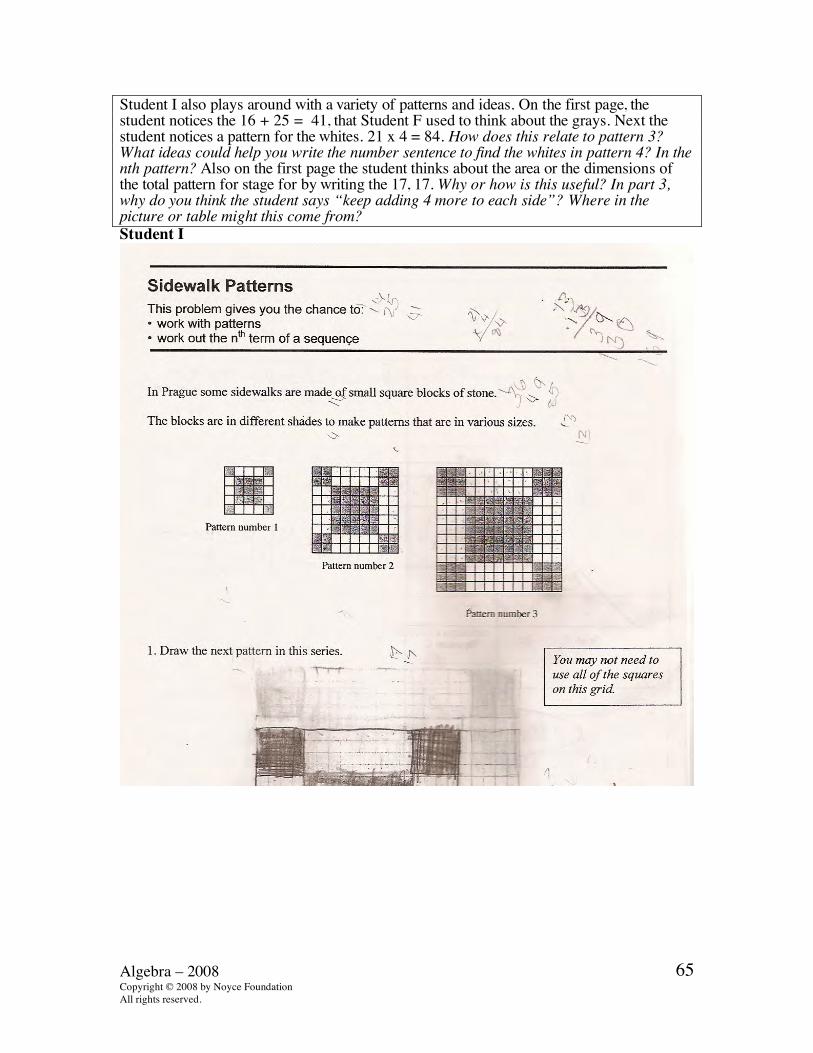
Student I also plays around with a variety of patterns and ideas. On the first page, the student notices the 16 + 25 = 41, that Student F used to think about the grays. Next the student notices a pattern for the whites. 21 x 4 = 84. How does this relate to pattern 3? What ideas could help you write the number sentence to find the whites in pattern 4? In the nth pattern? Also on the first page the student thinks about the area or the dimensions of the total pattern for stage for by writing the 17, 17. Why or how is this useful? In part 3, why do you think the student says “keep adding 4 more to each side”? Where in the picture or table might this come from? Student I

Algebra – 2008 Copyright © 2008 by Noyce Foundation All rights reserved.
66
Student I, part 2
Algebra – 2008 Copyright © 2008 by Noyce Foundation All rights reserved.
67
Algebra Task 4 Sidewalk Patterns Student Task Work with patterns. Work out the nth term of a sequence. Core Idea 1 Functions and Relations
Understand patterns, relations, and functions. • Understand relations and functions and select, convert flexibly
among, and use various representations for them. Core Idea 3 Algebraic Properties and Representations
Represent and analyze mathematical situations and structures using algebraic symbols.
• Use symbolic algebra to represent and explain mathematical relationships.
• Judge the meaning, utility, and reasonableness of results of symbolic manipulation.
Mathematics of the task:
• Drawing and extending a visual pattern • Using a table to extend a pattern • Noticing relationships and number patterns, such as perfect squares • Writing an expression to give the nth term in a sequence • Working backwards, being able to “do and undo” a computational procedure
Based on teacher observations, this is what algebra students know and are able to do:
• Recognize squares, square numbers • Draw and extend a visual pattern • Extend a pattern by completing a table • Compare the relationship between white and gray blocks by making observations
from the table • Find square roots of numbers
Areas of difficulty for algebra students:
• Writing an equation or making a generalized rule • Considering all the relationships in the pattern • How to algebraically express an even number • How to define the “added” number • How to explain the difference in the blocks given the total, what to do with the 1/2

Algebra – 2008 Copyright © 2008 by Noyce Foundation All rights reserved.
68
The maximum score available on this task is 9 points. The minimum score for a level 3 response, meeting standards, is 5 points.
Most students, 90%, could either extend the visual pattern or give the square roots of numbers. Some students, about 62%, could fill in most of the table, explain the relationship between the white and gray tiles, find square roots and extend the total number of tiles to stage 5 by noticing a pattern in the squared numbers. About half the students could also extend the pattern by drawing and counting. About 24% could extend the pattern in drawings and in numbers using the table, describe the relationship between white and gray tiles, find square roots, extend the total to stage 5, and explain how to find the number of white tiles from a given total. 7% could also write an equation to find the total number of tiles for any number in the sequence. 10% of the students scored no points on this task. 88% of the students with this score attempted the task.

Algebra – 2008 Copyright © 2008 by Noyce Foundation All rights reserved.
69
Sidewalk Patterns Points Understandings Misunderstandings
0 88% of the students with this score attempted the task.
Some students had difficulty with the pattern in 4a. About 5% of the students did not attempt this part of the task. About 5% forgot to write the exponent by the 9 and/or 13.
1 Students could either find the square roots in 4a or extend the pattern in a drawing.
About 16 % of the students used the full grid for the pattern, rather than drawing the next stage of the pattern.
4 Students could complete most of the table, note the relationship between the number of white and gray tiles, and find the square roots.
About 17% of the students did not attempt part 3 of the task. 18% did not attempt part 4b.
5 Students could draw the next figure in the pattern, fill in the table, note the relationship between gray and white and find the square roots.
Students had difficulty finding the white tiles from the gray. The errors were more likely to be in the explanation: 10% said that 311 + 312 = 625 with no further comments about where the 311 comes from. About 6% just divided 625 by 2 without explaining the remainder or 0.5. 17% did not attempt this part of the task. Many talked about subtracting 1 after dividing rather than 1/2.
7 Students could complete the entire task except the equation. 25% of the students did not attempt this part of the task. 25% used n2 for the equation. 5% used (n+4) 2. 13% gave numerical answers instead of a formula.
9 Students could extend a pattern visually and numerically using a table. Students could recognize square numbers and find their roots. Students were able to find relationships in the pattern between gray and white tiles, between the total number of tiles and the place in the sequence. Students could work backward from a total to find the number of gray and white tiles and explain why it made sense. Students could write a generalized rule for finding the total tiles for any pattern number.

Algebra – 2008 Copyright © 2008 by Noyce Foundation All rights reserved.
70
Implications for Instruction Students at this level are able to recognize geometric patterns, describe them in words, and express them in algebraic terms. Students should be able to represent numerical and geometrical relationships in algebraic form. Asking students questions, like, “How does this pattern grow? What stays the same? What changes?” build in ways of “seeing” that help students identify and generalize about the pattern. While many students are visual thinkers and derive their patterns from the structural elements of the pattern, other students like playing around with the number patterns in tables to find their equations. How do we help these students to work with and explore their patterns? What are productive questions to ask them? Do we offer students enough rich tasks to have a variety of ways of “seeing” or exploring the pattern. How do we turn student answers into rich tasks? Students need to develop a repertoire of self-talk to help them identify the relationships between variable and to name and explain all the parts of the numerical pattern. Students would also benefit from a habit of mind of checking their rules or expressions with known values. This can help them identify possible errors in the pattern and learn to making editing changes to their rules. They need to recognize that they don’t need to get the rule perfect on the first attempt. Ideas for Action Research – Re-engagement One useful strategy when student work does meet your expectations is to use sample work to promote deeper thinking about the mathematical issues in the task. In planning for re-engagement it is important to think about what is the story of the task, what are the common errors and what are the mathematical ideas that students need to think about more deeply. Then look through student work to pick key pieces of student work to use to pose questions for class discussion. Often students will need to have time to rework part of the task or engage in a pair/share discussion before they are ready to discuss the issue with the whole class. This reworking of the mathematics with a new eye or new perspective is the key to this strategy. To plan a follow-up lesson using this task, pick some interesting pieces of student work that will help students confront and grapple with some of the major misconceptions. Make the misconceptions explicit and up for public debate. During the discussion, it is important for students to notice and point out the errors in their thinking. I might start the lesson, by trying to develop specific details about the geometric pattern to help with complexities of generalizations later on. I might start by posing the question: How many patterns can you find in the geometric design? Try to find as many as possible. The purpose of the first question is to get students to look beyond the simplest patterns. The story of this task is students not digging deeply enough, but stopping after they notice one or two things. I am hoping the students will even notice the obvious, that all the patterns are squares. Students may need to be pushed to explain how many columns of the colored tiles to make in the middle or how do they know the size of the tiny squares at each corner of the design. Then I want to see if they can use these patterns to
Algebra – 2008 Copyright © 2008 by Noyce Foundation All rights reserved.
71
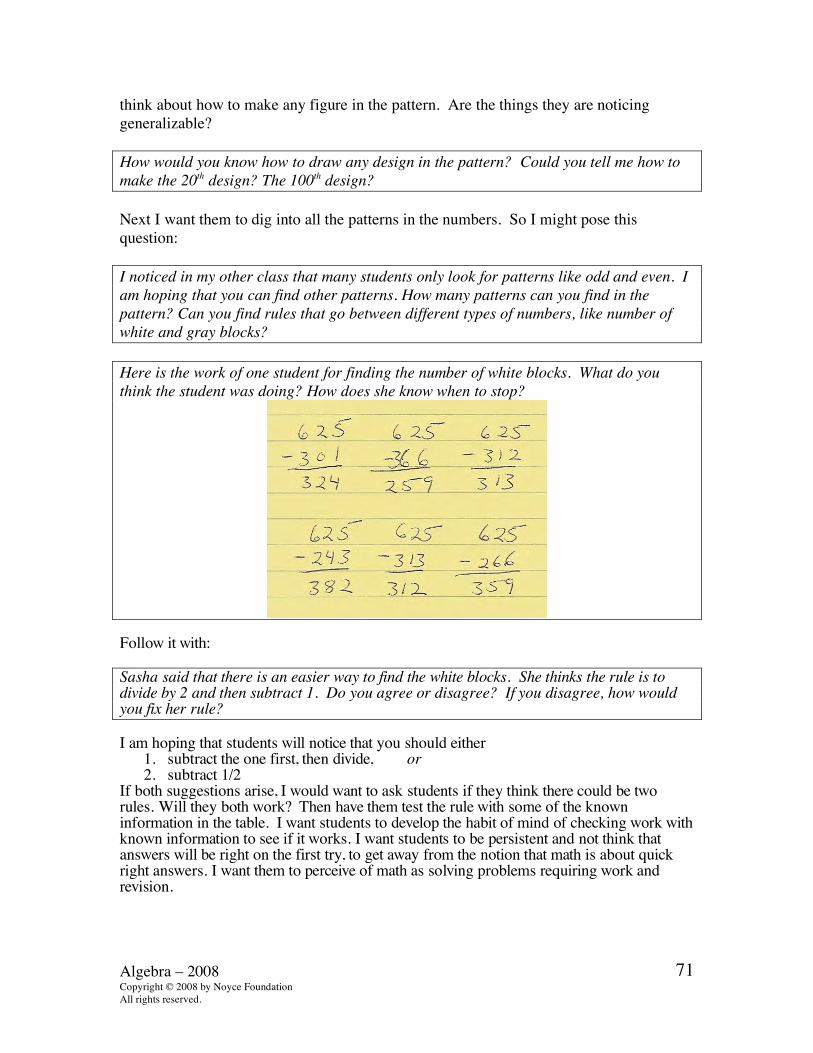
think about how to make any figure in the pattern. Are the things they are noticing generalizable? How would you know how to draw any design in the pattern? Could you tell me how to make the 20th design? The 100th design? Next I want them to dig into all the patterns in the numbers. So I might pose this question: I noticed in my other class that many students only look for patterns like odd and even. I am hoping that you can find other patterns. How many patterns can you find in the pattern? Can you find rules that go between different types of numbers, like number of white and gray blocks? Here is the work of one student for finding the number of white blocks. What do you think the student was doing? How does she know when to stop?
Follow it with: Sasha said that there is an easier way to find the white blocks. She thinks the rule is to divide by 2 and then subtract 1. Do you agree or disagree? If you disagree, how would you fix her rule? I am hoping that students will notice that you should either
1. subtract the one first, then divide, or 2. subtract 1/2
If both suggestions arise, I would want to ask students if they think there could be two rules. Will they both work? Then have them test the rule with some of the known information in the table. I want students to develop the habit of mind of checking work with known information to see if it works. I want students to be persistent and not think that answers will be right on the first try, to get away from the notion that math is about quick right answers. I want them to perceive of math as solving problems requiring work and revision.
Algebra – 2008 Copyright © 2008 by Noyce Foundation All rights reserved.
72
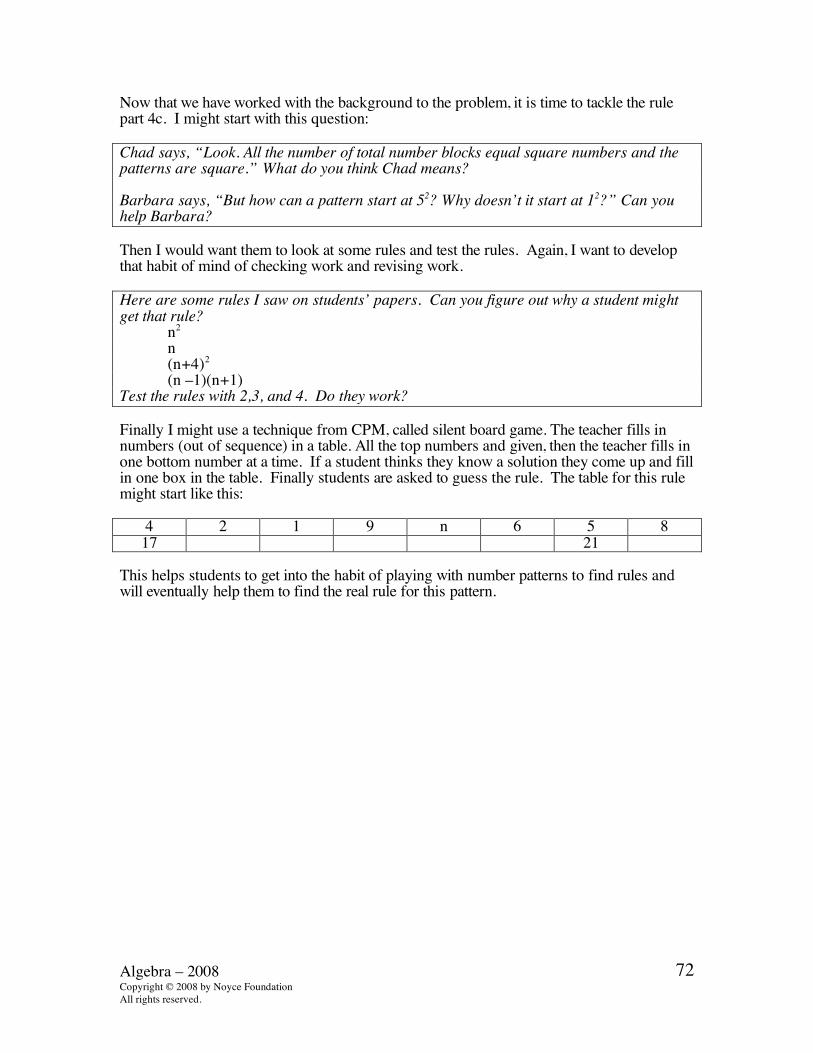
Now that we have worked with the background to the problem, it is time to tackle the rule part 4c. I might start with this question: Chad says, “Look. All the number of total number blocks equal square numbers and the patterns are square.” What do you think Chad means? Barbara says, “But how can a pattern start at 52? Why doesn’t it start at 12?” Can you help Barbara? Then I would want them to look at some rules and test the rules. Again, I want to develop that habit of mind of checking work and revising work. Here are some rules I saw on students’ papers. Can you figure out why a student might get that rule?
n2 n (n+4)2 (n –1)(n+1)
Test the rules with 2,3, and 4. Do they work? Finally I might use a technique from CPM, called silent board game. The teacher fills in numbers (out of sequence) in a table. All the top numbers and given, then the teacher fills in one bottom number at a time. If a student thinks they know a solution they come up and fill in one box in the table. Finally students are asked to guess the rule. The table for this rule might start like this:
4 2 1 9 n 6 5 8 17 21
This helps students to get into the habit of playing with number patterns to find rules and will eventually help them to find the real rule for this pattern.

Algebra – 2008 Copyright © 2008 by Mathematics Assessment Resource Service All rights reserved.
73
Functions This problem gives you the chance to: • work with graphs and equations of linear and non-linear functions On the grid are eight points from two different functions. • four points fit a linear function • the other four points fit a non-linear function. For the linear function: 1.Write the coordinate pairs of its four points.
_____________________ ____________________ ____________________ ____________________ Draw the line on the grid. 2.Write an equation for the function. Show your work. ___________________________________________ For the non-linear function: 3. Write the coordinate pairs of its four points. ________________ ________________ ________________ ________________
0 1 2 3 4 5 6 7 8 9
10
9
8
7
6
5
4
3
2
1
0
y
x

Algebra – 2008 Copyright © 2008 by Mathematics Assessment Resource Service All rights reserved.
74
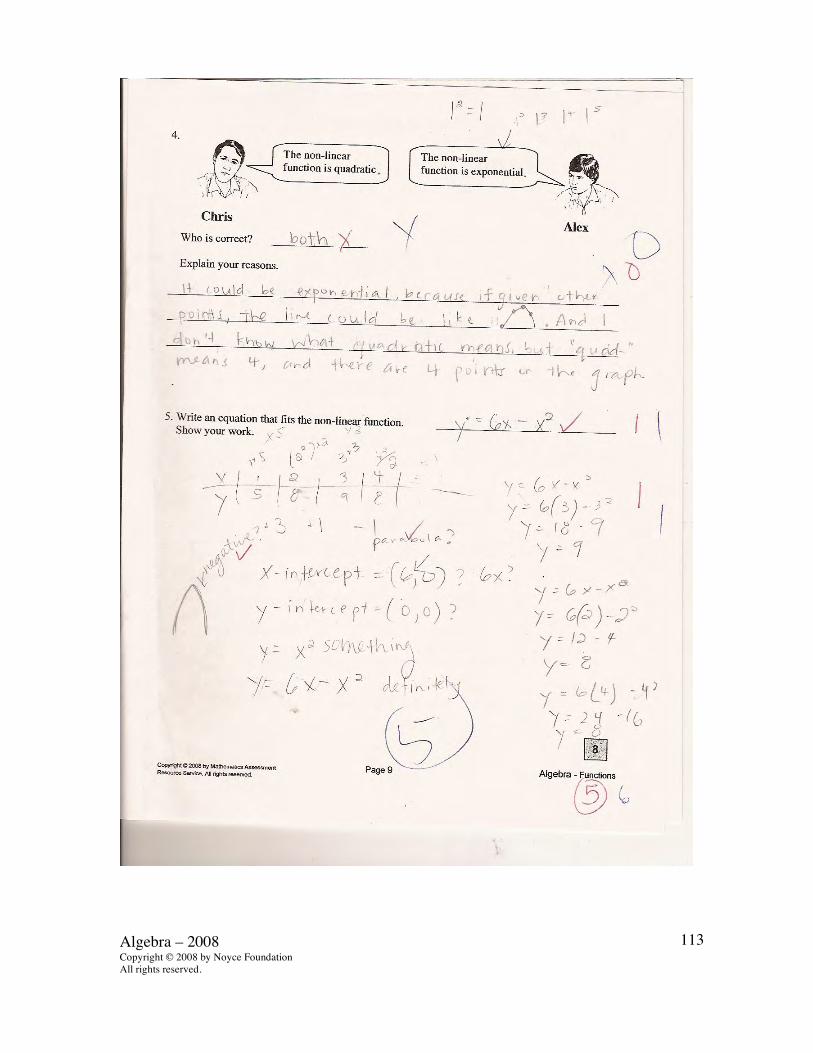
Draw the graph of the function on the grid. 4. Who is correct? _________________ Explain your reasons. ________________________________________________________________________________ ________________________________________________________________________________ ________________________________________________________________________________ 5. Write an equation that fits the non-linear function. ________________________________ Show your work.
The non-linear function is quadratic
The non-linear function is exponential
Chris Alex

Algebra – 2008 Copyright © 2008 by Mathematics Assessment Resource Service All rights reserved.
75
Functions Rubric The core elements of performance required by this task are: • work with graphs and equations of linear and non-linear functions Based on these, credit for specific aspects of performance should be assigned as follows
points
section points
1. Gives correct answers: (2, 9), (3, 7), (4, 5), (5, 3) and Draws a correct line on the grid.
1
1
2. Gives correct answer: y = 13 –2x
2
2
3. Gives correct answers: (1, 5), (2, 8), (3, 9), (4, 8) Draws a correct curved graph or equivalent
1
1
2
4. Gives correct answer: Chris and Gives a correct explanation such as: The graph has a turning point. or It is part of a parabola.
1
1
5. Gives correct answer: y = 6x – x2 or equivalent such as – (x – 3)2 + 9
Shows some correct work such as: Substitutes coordinates in y = ax2 + bx + c
1 1
2 Total Points 8

Algebra – 2008 Copyright © 2008 by Mathematics Assessment Resource Service All rights reserved.
75
Functions Work the task and look at the rubric. What strategies or big mathematical ideas might students use to help them find the formulas for part 2 and 5?
Look at student work for part one. How many of them were able to pick the correct points? _______ How many put (2,8) instead of (2,9)? ________ What other misconceptions or errors did you notice for this part? Now look at student work for part 2. How many of your students: y= 13 –
2x y =
mx+b An expression with
– 2x, incorrect constant
Numerical expression, no
variable
Table or list of points
Other
What does each answer show about that students understand about equations? Variables? Checking more than one set of points? Connecting algebraic and graphic representations? How many of your students were unwilling to attempt an equation?___________ Make a list of the types of strategies students used to solve this part of the task. Were there strategies that you might have expected them to use that you didn’t see? Which strategies most consistently gave the correct answers? Now look at the graphs for part 3. How many of your students selected the correct 4 points?______ How many could visualize the points as a parabola?_______________ How many connected the points in a pointy shape?__________ How many tried to make a quadrilateral?__________ How many made a square shape?_____________ What experiences have your students had with graphing parabolas? Do students get an opportunity to explore how differ parts of the equation effect the shape of the graph? Now look at the explanations for quadratic and exponential equations. How many of your students could give:
• a reasonable explanation?___________ • were unwilling to answer?___________ • thought exponential meant exponents in the equation?___________ • thought quadratic meant 4 points or a 4-sided figure?____________

Algebra – 2008 Copyright © 2008 by Mathematics Assessment Resource Service All rights reserved.
76
• the graph isn’t square, so it can’t have square numbers?___________ • thought both answers were correct?______________
How do we help students develop academic language? How often do students have discussions in class where they need to use these words to help express their ideas? How do we help orchestrate or foster their experiences? Finally look at student work for part 5. How many of your students put:
• y = 6x-x2 ? ____________ • an equation with x2 ? ____________ • a linear equation, that would fit one of the points? ____________ • attempted to use a table? ____________ • tried ax2+ bx + c, but couldn’t get to a final answer? ____________ • a numerical expression? ____________ • no attempt? ____________ • other? ____________
What thinking did you see, whether successful or not, that could be built upon in future lessons? In what way could you use some partial student work to push students to do more investigation around this idea? Were there any problem solving strategies that were worth talking about?

Algebra – 2008 Copyright © 2008 by Mathematics Assessment Resource Service All rights reserved.
77
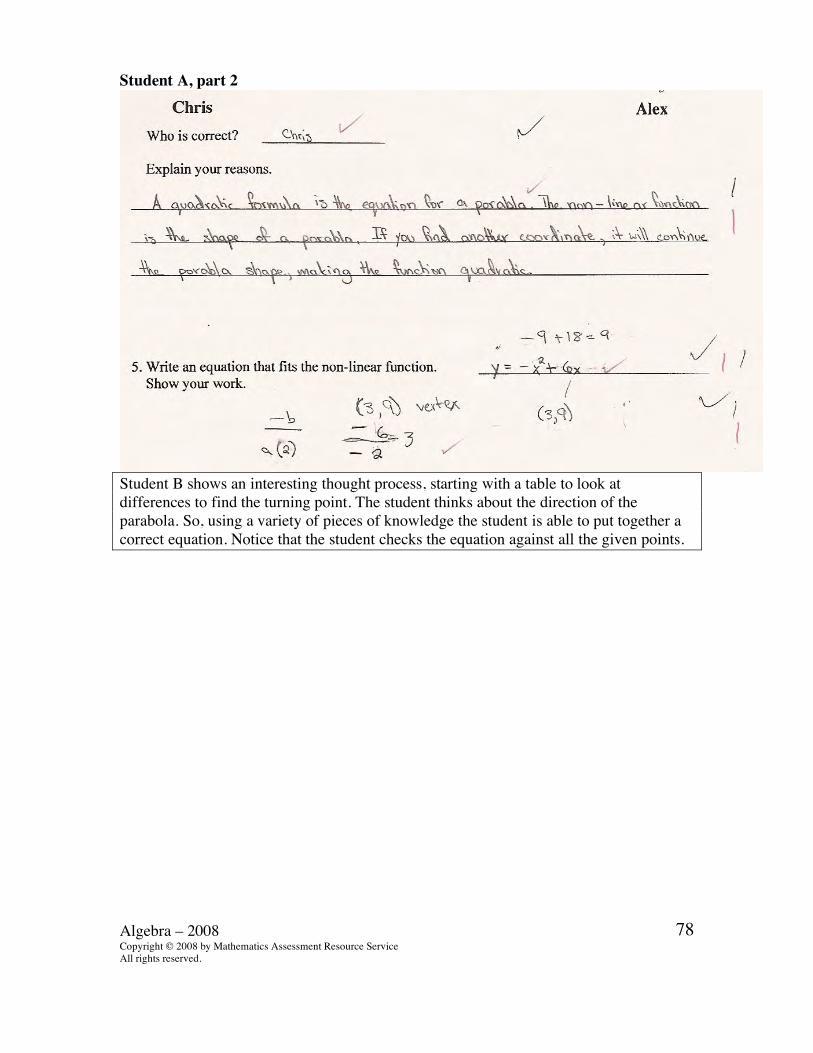
Looking at Student Work on Functions Student A is able to think about the equation of a line and use it to find the equation in part 2. Notice how the student calculates the slope and then extends the graph to think about the y-intercept. In part 4 the student has the language to talk about quadratic functions. Notice that the student has added an additional point on the graph to make the parabola symmetrical. In part 5 the student uses the formula for the turning point of a parabola to check that the equation is correct. Student A
Algebra – 2008 Copyright © 2008 by Mathematics Assessment Resource Service All rights reserved.
78
Student A, part 2
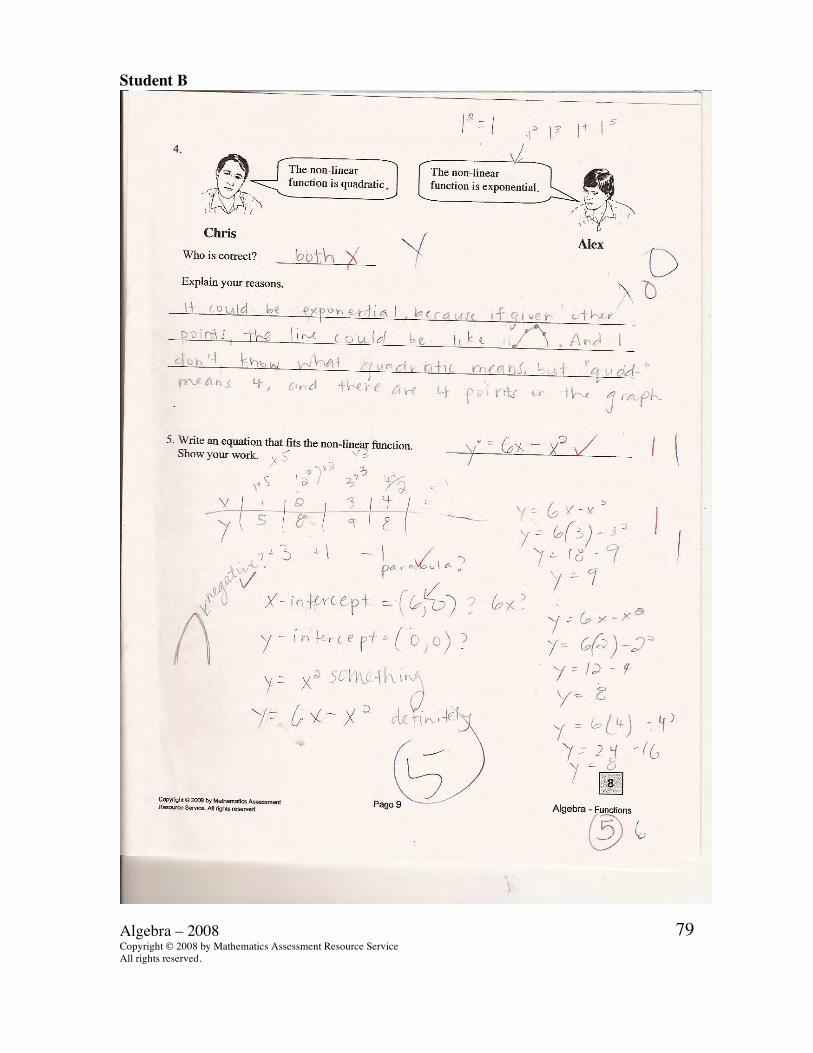
Student B shows an interesting thought process, starting with a table to look at differences to find the turning point. The student thinks about the direction of the parabola. So, using a variety of pieces of knowledge the student is able to put together a correct equation. Notice that the student checks the equation against all the given points.
Algebra – 2008 Copyright © 2008 by Mathematics Assessment Resource Service All rights reserved.
79
Student B

Algebra – 2008 Copyright © 2008 by Mathematics Assessment Resource Service All rights reserved.
80
Student C comes up with an alternative equation for the parabola. What clues can you find about the student’s though process? Student C

Algebra – 2008 Copyright © 2008 by Mathematics Assessment Resource Service All rights reserved.
81
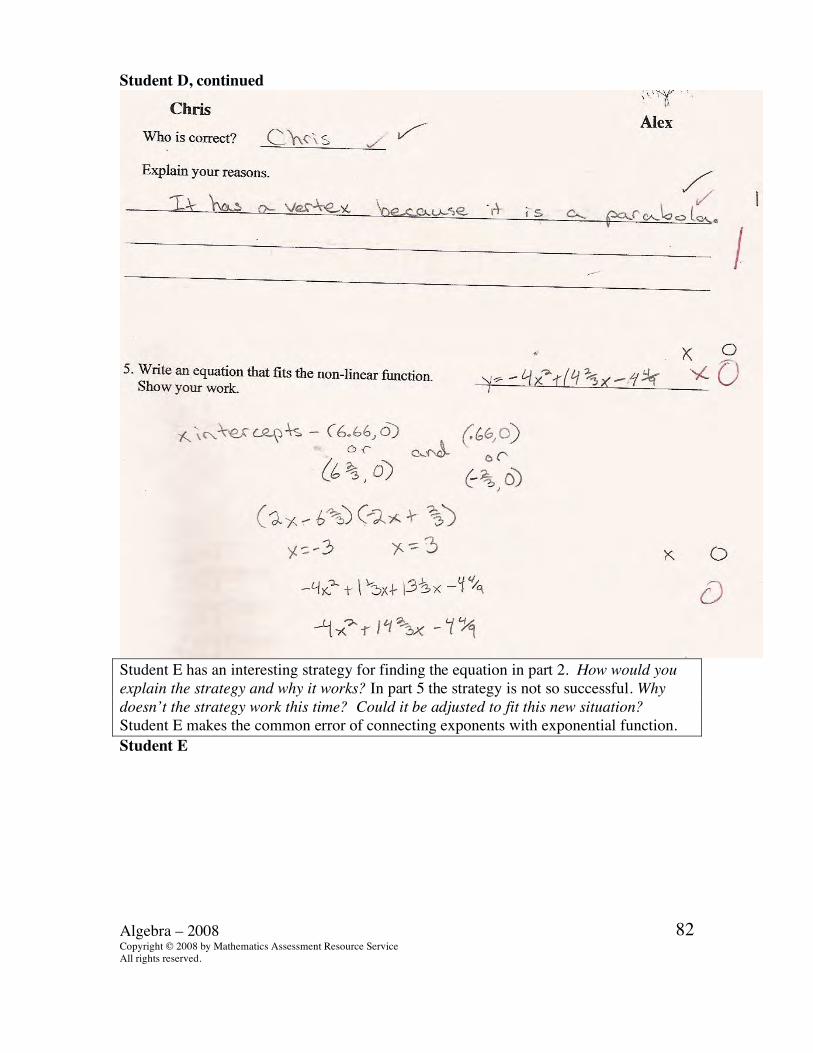
Student D is able to use slope to find the formula for part 2. In part 5 the student makes an attempt to use the x-intercepts or roots to find the equation. Due to inaccuracy in the graph the student’s formula is a little off. What do you need to know to find the correct roots? What could help the student see that the roots are incorrect? Student D
Algebra – 2008 Copyright © 2008 by Mathematics Assessment Resource Service All rights reserved.
82
Student D, continued
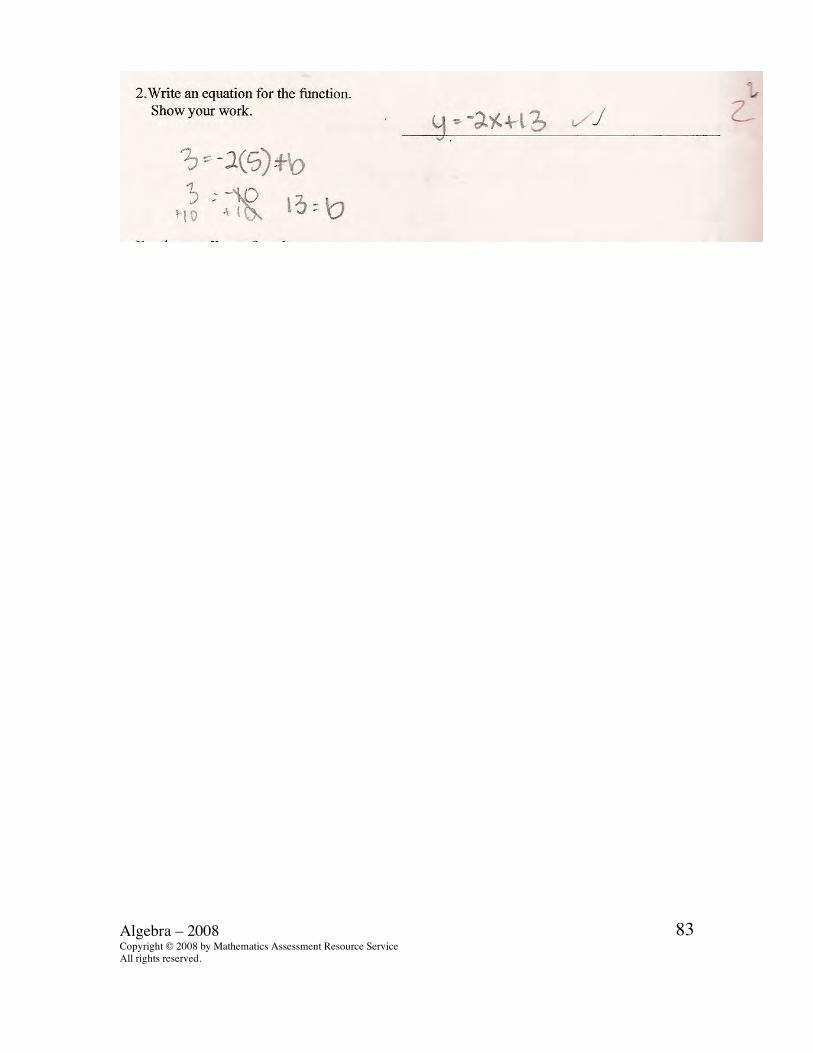
Student E has an interesting strategy for finding the equation in part 2. How would you explain the strategy and why it works? In part 5 the strategy is not so successful. Why doesn’t the strategy work this time? Could it be adjusted to fit this new situation? Student E makes the common error of connecting exponents with exponential function. Student E
Algebra – 2008 Copyright © 2008 by Mathematics Assessment Resource Service All rights reserved.
83

Algebra – 2008 Copyright © 2008 by Mathematics Assessment Resource Service All rights reserved.
84
Student E, part 2
Student F tries to use the slope to find the equation in part 5. How would you describe the misconception of the student? Why is this equation incorrect? What question could you pose to help the student see his misconception? Student F

Algebra – 2008 Copyright © 2008 by Mathematics Assessment Resource Service All rights reserved.
85

Algebra – 2008 Copyright © 2008 by Mathematics Assessment Resource Service All rights reserved.
86
Student G is able to complete correctly parts 1,2, and 3 of the task. In part four the student seems to see quadratic and exponential as describing the same function. In part 4 the student doesn’t think about the writing an equation for the parabola in the first graph, but gives a general example complete with graph. Student G
Many students tried to use something about slope or substitution to find the formula for the quadratic. Student H uses the y=mx +b for all the points to find the constant in part 2. In part 4 the student states that quadratic equations can be factored. So the student tries the same strategy for the linear equation to find the constant in the quadratic. Notice the guess and check show factored expressions but the final answer is a linear equation. What might be next steps for this student?

Algebra – 2008 Copyright © 2008 by Mathematics Assessment Resource Service All rights reserved.
87
Student H
Algebra – 2008 Copyright © 2008 by Mathematics Assessment Resource Service All rights reserved.
88
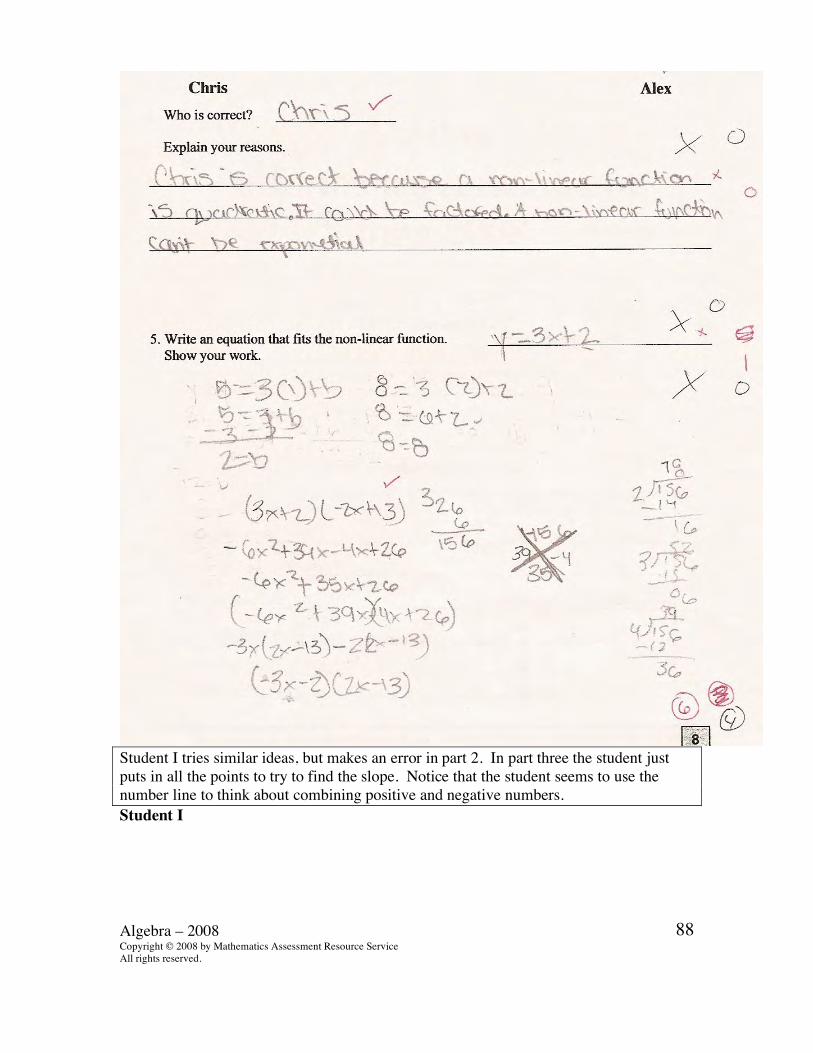
Student I tries similar ideas, but makes an error in part 2. In part three the student just puts in all the points to try to find the slope. Notice that the student seems to use the number line to think about combining positive and negative numbers. Student I

Algebra – 2008 Copyright © 2008 by Mathematics Assessment Resource Service All rights reserved.
89
Student J is able to pick out the correct points in part 3 but draws the parabola at an angle. This leads to confusion on part 4. The student does have the habit of mind to test out formulas and check them. Notice all the work in part 5. How could you help the student investigate quadratics more? How could you pose a whole class investigation to explore the idea of how parts of the equation effect the shape of the graph?

Algebra – 2008 Copyright © 2008 by Mathematics Assessment Resource Service All rights reserved.
90
Student J

Algebra – 2008 Copyright © 2008 by Mathematics Assessment Resource Service All rights reserved.
91
Student K attempts to find the formula in part 5 by looking at the table of values. The student finds a different formula for each set of points on the graph but doesn’t know where to go from there. What question might you pose to push the students thinking? Student K

Algebra – 2008 Copyright © 2008 by Mathematics Assessment Resource Service All rights reserved.
92
Student L understands the general equation for a quadratic and attempts to substitute points into the equation. The student does not know how to solve from there. Is there a way of building on this idea to get a solution? Student L

Algebra – 2008 Copyright © 2008 by Mathematics Assessment Resource Service All rights reserved.
93
Student L, part 2

Algebra – 2008 Copyright © 2008 by Mathematics Assessment Resource Service All rights reserved.
94
Algebra Task 5 Functions
Student Task Work with graphs and equations of linear and non-linear functions. Core Idea 1 Functions and Relations
Understand patterns, relations, and functions. • Understand relations and functions and select, convert flexibly
among, and use various representations for them. Core Idea 3 Algebraic Properties and Representations
Represent and analyze mathematical situations and structures using algebraic symbols.
• Use symbolic algebra to represent and explain mathematical relationships.
• Judge the meaning, utility, and reasonableness of results of symbolic manipulation.
The mathematics of this task:
• Identify linear points on a coordinate grid and name them • Write an equation for a linear function from a graph or from
coordinates • Recognize non-linear points that form a parabola and estimate the
graph of the curve • Distinguish between features of a linear, quadratic and exponential
graph and their equations • Find the equation for a parabola given some of the coordinate points
Based on teacher observations, this is what algebra students knew and were able to do:
• Understand that a linear graph is a straight line • Know that a non-linear graph is a parabola • Identifying points on a graph
Areas of difficulty for algebra students:
• Finding a linear equation from a graph • Finding a quadratic equation • Drawing a parabola • Difficulty in knowing difference between quadratic and quadrilateral
(four points/four sides) • Confusion about quadratic and exponential equations(x2 has an
exponent so it was exponential) Strategies used by successful students:
• Knowing the generic formula for a line: y = mx + b and using slope and substitution
• Looking for the y-intercept for the linear equation • Finding slope • Knowing the generic formula for a quadratic: y=a x2+bx + c • Knowing mathematical vocabulary: quadratic, exponential
Algebra – 2008 Copyright © 2008 by Mathematics Assessment Resource Service All rights reserved.
95
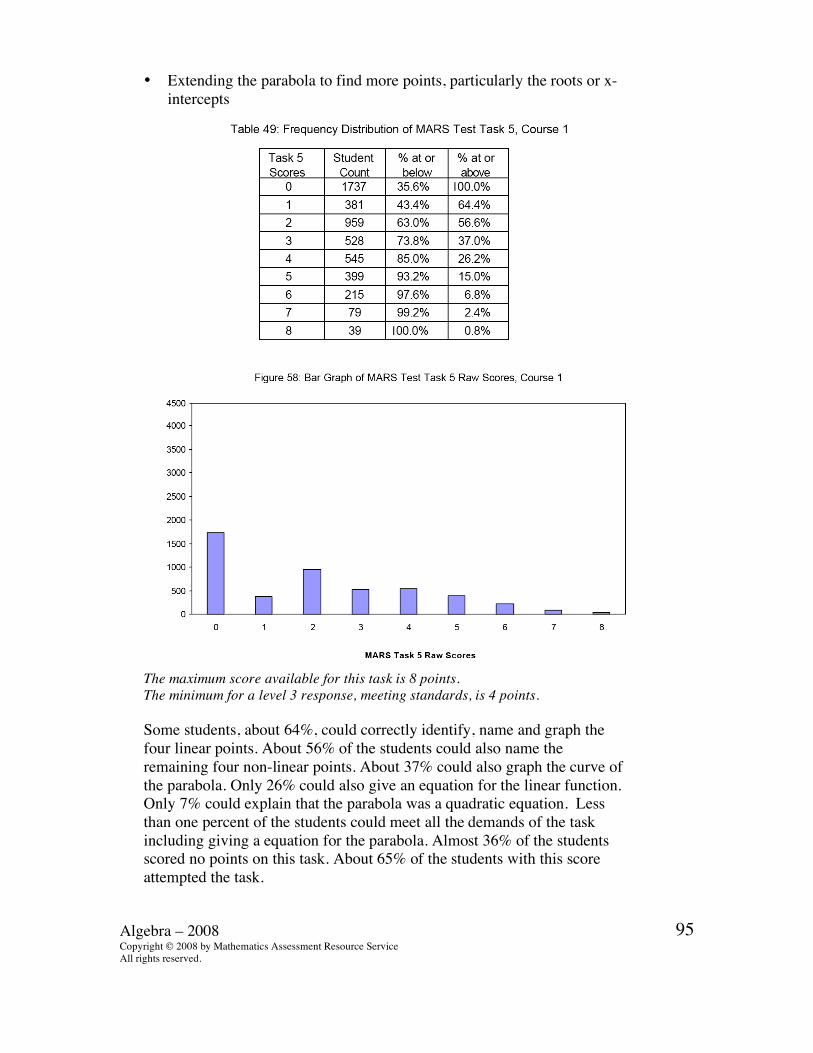
• Extending the parabola to find more points, particularly the roots or x-intercepts
The maximum score available for this task is 8 points. The minimum for a level 3 response, meeting standards, is 4 points. Some students, about 64%, could correctly identify, name and graph the four linear points. About 56% of the students could also name the remaining four non-linear points. About 37% could also graph the curve of the parabola. Only 26% could also give an equation for the linear function. Only 7% could explain that the parabola was a quadratic equation. Less than one percent of the students could meet all the demands of the task including giving a equation for the parabola. Almost 36% of the students scored no points on this task. About 65% of the students with this score attempted the task.

Algebra – 2008 Copyright © 2008 by Mathematics Assessment Resource Service All rights reserved.
96
Functions
Points Understandings Misunderstandings 0 65% of the students with this
score attempted the task. Students usually knew how to order coordinate points but misread one of the points or put (2,8) for (2,9). Less than 3% choose all the wrong points. Less than 2% reversed the x- and y-coordinates.
1 Students could name points on a coordinate graph, identify the ones that were linear and draw the graph.
About 6% misnamed one of the coordinate pairs for the parabola. About 9% did not attempt to name the non-linear points.
3 Students could name the linear and non-linear points and graph a straight line and a parabola.
Almost 20% of the students made parabolas that were 4 line segments. 12% of the students did not attempt to graph these points.
4 Students could name and graph points in a linear function, give the equation of the line, and name the non-linear points.
17% of the students did not attempt to write an equation for the line. About 12% of the students had equations with –2x but the incorrect constant. About 5% just wrote y=mx +b. 5% gave numeric expressions or discrete values for x and y.
5 Students could identify and graph points for linear functions and quadratics. They could write equations for a linear function from the graph.
Students could not distinguish between quadratic and exponential equations.25% of the students did not attempt part 4. About 12% knew that parabolas have exponents, so it should be exponential. About 5 % confused quadratic with 4 sides. About 4% thought both words were the same.
6 Students could distinguish between quadratic and exponential functions.
Students struggled with the equation for the parabola. 36% of the students did not attempt this part of the task. About 5% attempted to look at a table of values, but couldn’t figure out what to do with the information. About 3% knew the general formula, ax2+bx +c=y, but couldn’t figure out what to do next. About 10% wrote linear equations. About 12% wrote incorrect equations with exponents.
8 Students could identify and graph linear and quadratic points and give their equations.

Algebra – 2008 Copyright © 2008 by Mathematics Assessment Resource Service All rights reserved.
97
Implications for Instruction Students at this grade level should be able to make connections between equations and the shape of a graph. Students should be able to recognize proportional functions (y = mx) with linear equations going through the origin. Students should also be able to explain how the constant, the added portion of the equation y=mx+ b, effects the graph by raising or lowering the equation without changing the slope and also indicates the y-intercept. Students should also understand that equations with exponents will not be linear. The most common form y=mx2+bx + c will form a parabola. Students should be able to make predictions about the equation from looking at a graph or predictions about the graph from looking at the equation. Some students will start to move beyond this to think about quadratic equations and exponential equations or be able to write an equation for parabolas, but that is the ramp of this task. Students should be familiar with multiple representations and knowing how they connect to each other. Students should know how the parts of the equation relate to the shape of the graph knowing general form of the equations Action Research – Investigations- Linking Equations to Graphs Relationships cannot be given to students, but must be discovered through practice and exploration. In order to learn to think like a mathematician students at this grade level need opportunities to investigate relationships. They need big rich tasks that give them opportunities to work with longer reasoning chains, learn to organize information, make systematic changes to observe the effects, and start to think about types of numbers and how they might effect outcomes. Exploring this relationship between graphs and their equations is an excellent context for investigation. Pose a dilemma or question. For example: I overheard two students in another class discussing graphs. Barbara said, “All equations without exponents make straight lines.” Fred added, “And they also go through zero.” Don disagreed. He said that some equations without exponents don’t go through zero and some are not lines.” Who do you think is correct? How can you tell just by looking at an equation what a graph will look like? Can you tell how each part of the equation contributes to the shape of the graph? Organize some information that would help Barbara, Fred, and Don correct their thinking.
After students have worked with this prompt, they should make posters to share with the class or make some equations that they think might stump their classmates.
A further challenge might be to look at equations with exponents. The new prompt might be:

Algebra – 2008 Copyright © 2008 by Mathematics Assessment Resource Service All rights reserved.
98
Find an equation that will go through (0,0) and (0, -1).
To find this solution some students will be able to apply knowledge from factoring equations. Others may be led into a rich investigation in how the numbers in equations with exponents effect the shape of the graphs.
In learning a new field of study, like algebra, students need to acquire vocabulary and procedural knowledge. But students also need the challenge and cognitive demand to work within the discipline to solve problems and make discoveries. They need to view the procedures and knowledge they are gaining as tools to make and test conjectures. It is the richness of exploring ideas that makes the mathematics of algebra interesting and engaging for students. It is the personal aha’s that make the learning satisfying and personal. Reflecting on the Results for Algebra as a Whole: Think about student work through the collection of tasks and the implications for instruction. What are some of the big misconceptions or difficulties that really hit home for you?
If you were to describe one or two big ides to take away and use for planning for next year, what would they be?
What are some of the qualities that you saw in good work or strategies used by good students that you would like to help other students develop?
Four areas that stand out for the Collaborative as a whole for Algebra are: • Moving Between Multiple Representations - Students had difficulty moving from
graphs to equations. Students did not recognize how the structure of the equation would effect features of the graph. This was evident in both Functions and Sorting Functions.
Algebra – 2008 Copyright © 2008 by Mathematics Assessment Resource Service All rights reserved.
99
• Generalizations – Students had difficulty using algebraic expressions to present an argument or justification in the task Expressions. Students did not understand how the formulas for area related to the figure and therefore could not connect the pieces of information together to make a complete justification. In the task Sidewalk Patterns students did not look at enough relevant features of the pattern to make a generalization or rule for finding the any term in the sequence. In Buying Chips and Candies, students would have benefited from understanding the reasons behind strategies like solving two equations using substitution or multiplication and subtraction, because that conceptual understanding or generalization of the process gives them tools to help them remember all the steps in the process.
• Habits of Mind – In Algebra students should develop some basic habits of mind or self-talk to guide them through solving a problem. In Buying Chips and Candy, students did not look at the two equations and ask themselves questions, such as which variable would be easier to solve for or which equation might be easier to use if I want to apply the substitution method. Another question might be, “Would it be easier to use substitution to solve this pair of equations or would it be easier to use multiplication and subtraction strategy?” Students did not have a habit of mind for verifying their solution to make sure it works for both equations. They would have benefited from this habit of mind by checking their solution with their rule in Sidewalk Patterns.
• Learning Skills in Context – Students might know how to do various algebraic manipulations in a problem set, but struggled with which procedures to pull out when solving problems in context. In Expressions students did not think to use factoring to move from the area of the triangles to making the generalized statement. In Buying Chips and Candy, students were not sure about which procedures to choose to solve the two equations. Some students did not know how to interpret the variables in the context and so did not make sense of the equations.

Algebra – 2008 Copyright © 2008 by Noyce Foundation All rights reserved.
100
Examining the Ramp: Looking at Responses of the Early 4’s (30-33) The ramps for the algebra test: Expressions–
• Part 2 – Making a complete argument o Finding the area of each small triangle using symbolic notation o Combining the areas of the small triangles o Factoring the total areas to show how it matches back to the original
statement or what is being proved Buying Chips and Candy
• Part 3 – Using Algebra to solve 2 equations with 2 unknowns o Picking a solution strategy: substitution or addition/multiplication o Manipulating the equations to solve for the unknowns o Testing the solution with both equations
Sorting Functions • Part 2 – Understanding how the shape of the graph relates to the equation
o Knowing the general form for a linear equations and understanding slope o Understanding the general formula for parabolas
Sidewalk Patterns– • Part 4c – Giving the equation for the pattern
o Thinking about the structural elements of the visual pattern and quantifying them algebraically
o Thinking about the structural elements of the numerical pattern and being able to quantify them algebraically
o Seeing relations between elements instead of thinking about how each element grows individually
• Part 5ab- Being able to work backwards from a total to a part of the pattern o Thinking about order of operations and how to undo a process o Accounting for a remainder or decimal o Being able to account for your numbers (not just here are the answers but
how and where they came from) Functions
• Part 3 – Writing a linear equation from a graph or points on a graph o Using the slope and y-intercepts o Using the general equation for a line and slope
Part 5 – Writing a quadratic equation from a graph or points on a graph Using the general equation of a quadratic and substituting points on the graph Looking at the vertex of the parabola
With a group of colleagues look at student work around 30 – 33 points. Use the papers provided or pick some from your own students.
How are students performing on the ramp? What things impressed you about their performance?
What are skills or ideas they still need to work on?

Algebra – 2008 Copyright © 2008 by Noyce Foundation All rights reserved.
101
Are students relying on previous arithmetic skills rather than moving up to more grade level strategies? What was missing that you would hope to see from students working at this level? When you read their words, do you have a sense of understanding from them personally or does it sound more like parroting things they’ve heard the teacher say? How do you help students at this level step up their performance or see a standard to aim for in explaining their thinking? Are our expectations high enough for these students? For each response, can you think of some way that it could be improved? How do we provide models to help these students see how their work can be improved or what they are striving for? Do you think errors were caused by lack of exposure to ideas or misconceptions? What would a student need to fix or correct their errors? What is missing to make it a top-notch response? What concerns you about their work? What strategies did you see that might be useful to show to the whole class?

Algebra – 2008 Copyright © 2008 by Noyce Foundation All rights reserved.
102
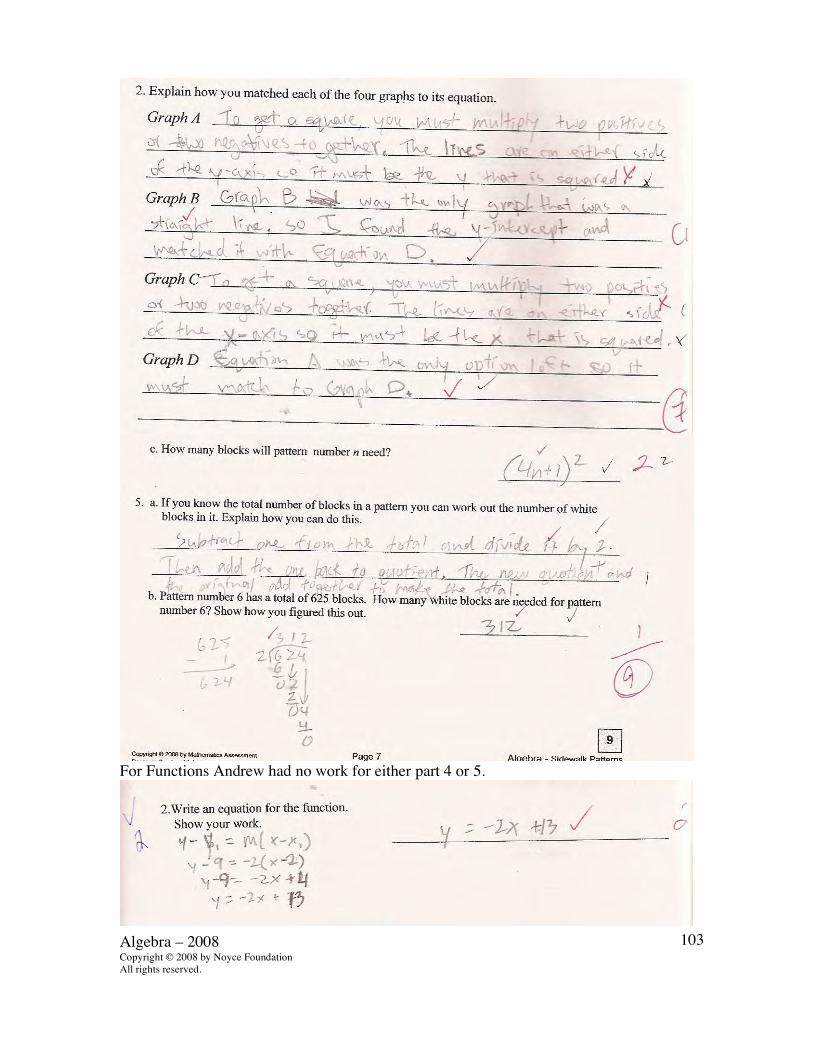
Andrew
Algebra – 2008 Copyright © 2008 by Noyce Foundation All rights reserved.
103
For Functions Andrew had no work for either part 4 or 5.
Algebra – 2008 Copyright © 2008 by Noyce Foundation All rights reserved.
104
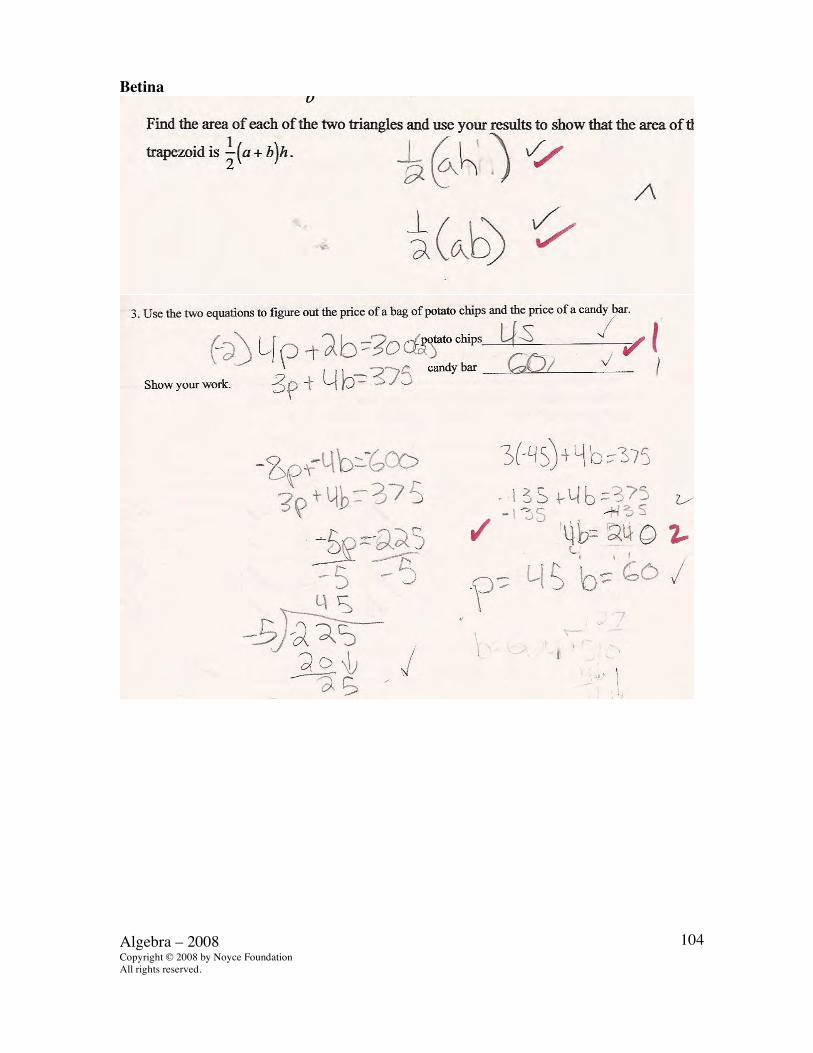
Betina

Algebra – 2008 Copyright © 2008 by Noyce Foundation All rights reserved.
105

Algebra – 2008 Copyright © 2008 by Noyce Foundation All rights reserved.
106
Betina answer part 4 of functions correctly, but had no work for part 5.
Colin

Algebra – 2008 Copyright © 2008 by Noyce Foundation All rights reserved.
107

Algebra – 2008 Copyright © 2008 by Noyce Foundation All rights reserved.
108
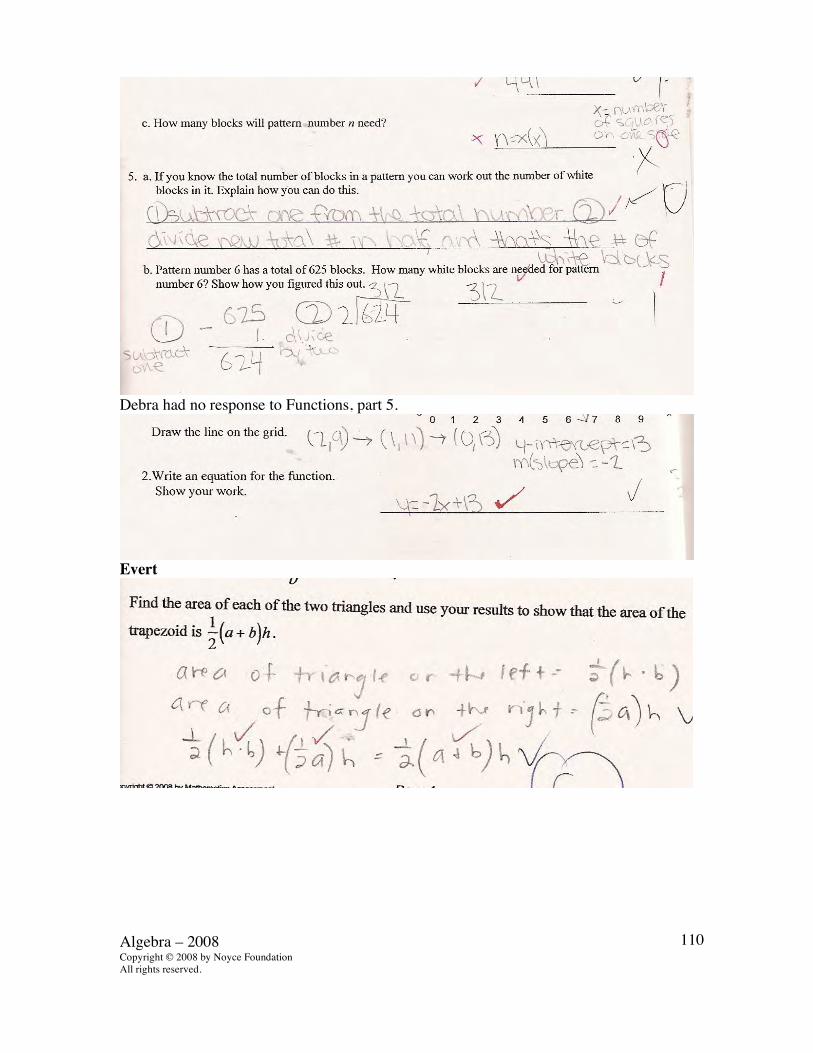
Debra

Algebra – 2008 Copyright © 2008 by Noyce Foundation All rights reserved.
109
Algebra – 2008 Copyright © 2008 by Noyce Foundation All rights reserved.
110
Debra had no response to Functions, part 5.
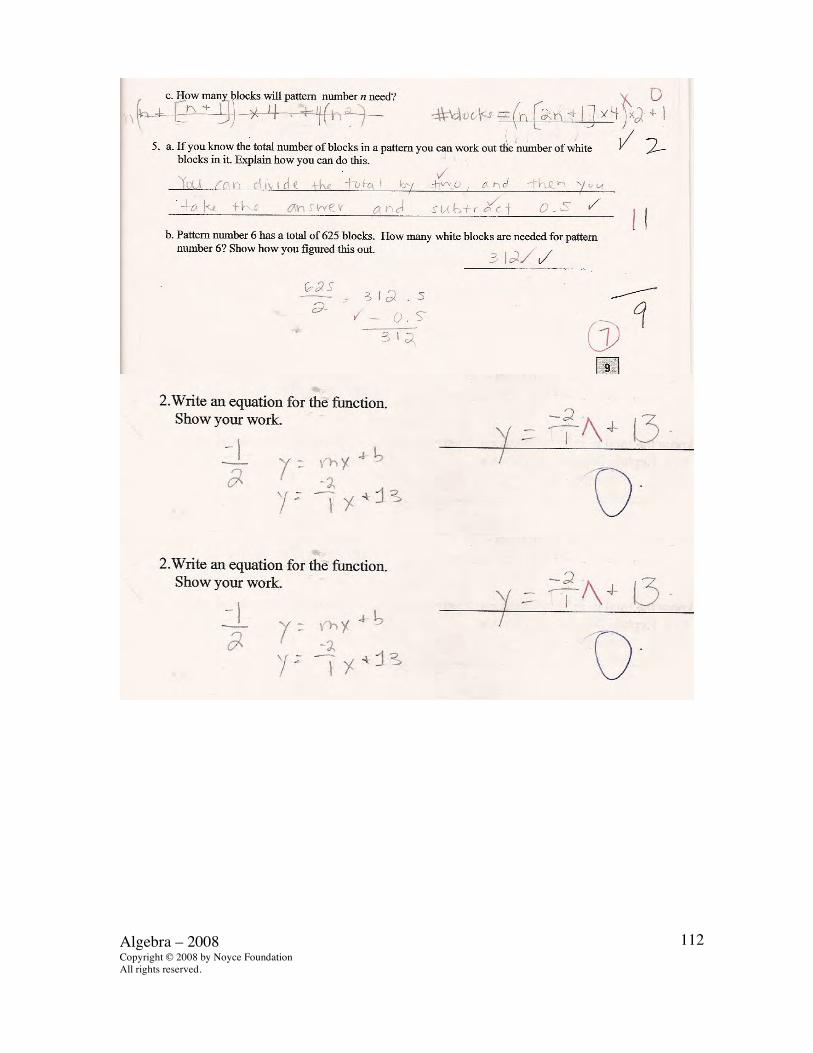
Evert

Algebra – 2008 Copyright © 2008 by Noyce Foundation All rights reserved.
111
Algebra – 2008 Copyright © 2008 by Noyce Foundation All rights reserved.
112
Algebra – 2008 Copyright © 2008 by Noyce Foundation All rights reserved.
113