Embed Size (px)
Citation preview

Figure 3. Mesoscale analysis at 1302 universal coordinated time 18February (same time as figure 2) using the automatic weather sta-tion data recorded by the NOAA 9 satellite. Numbered dots areautomatic weather station sites. The automatic weather stationwind data are plotted as described in the caption for figure 1. Solidlines are isobars in hectopascals with 92[F0]992 hectopascals, anddashed lines are isotherms in degrees Celsius. Large arrows jointhe satellite-observed positions of the mesoscale vortices, oneoriginating around Franklin Island and the other near Byrd Glacier.A: 1251 universal coordinated time 19 February; B: 1438 universalcoordinated time 20 February; C: 1057 universal coordinated time21 February; D: 1732 universal coordinated time 21 February; andE: 0532 universal coordinated time 22 February.
conditions for the formation of a mesoscale cyclone near ByrdGlacier around 0900 universal coordinated time 17 February.The cyclonic surface circulation could have advected moisture
from the open Ross Sea onto the ice shelf and generated cloudswhich made the vortex visible on satellite imagery. The generalmidtropospheric flow caused the eastward movement of thevortex across the Ross Ice Shelf, while the passage of a mid-tropospheric trough gave synoptic support for its development.It seems to have merged with another mesoscale cyclone whichdeveloped around Franklin Island. Although this combinedsystem did not develop beyond subsynoptic size, and arrivedat Marie Byrd Land in its dissipating stage, consideration ofthis example in conjunction with the case examined by Brom-wich (1989b) suggests that these types of mesoscale systemsmay contribute significantly to the annual snowfall accumula-tion over West Antarctica.
This research was supported by National Science Foundationgrant DPP 88-16792 to David Bromwich. The satellite imagerywas recorded by U.S. Navy personnel at McMurdo Station, andobtained from Robert Whritner of the Antarctic Research Cen-ter at Scripps Institution of Oceanography (National ScienceFoundation grant DPP 88-15818).
References
Bromwich, D.H. 1989a. Satellite analyses of Antarctic katabatic windbehavior. Bulletin of the American Meteorological Society, 70(7), 738-749.
Bromwich, D.H. 1989b. Subsynoptic-scale cyclone developments in theRoss Sea sector of the Antarctic. In P.F. Twitchell, E.A. Rasmussenand K.L. Davidson (Eds.), Polar and arctic lows. Hampton, Virginia:A. Deepak.
Bromwich, D.H. 1989c. An extraordinary katabatic wind regime atTerra Nova Bay, Antarctica. Monthly Weather Review, 117, 688-695.
Bromwich, D.H. 1991. Mesoscale cyclogenesis over the southwesternRoss Sea linked to strong katabatic winds. Monthly Weather Review,119, 1736-1752.
Bromwich, D.H., and T.R. Parish. 1988. Mesoscale cyclone interactionswith the surface windfield near Terra Nova Bay, Antarctica. AntarcticJournal of the U.S., 23(5), 172-175.
Parish, T.R., and D.H. Bromwich. 1987 The surface windfield over theantarctic ice sheets. Nature, 328, 51-54.
Numerical simulationof the katabatic windsover West Antarctica
DAVID H. BROMWICH and YANG Du
Byrd Polar Research CenterOhio State UniversityColumbus, Ohio 43210
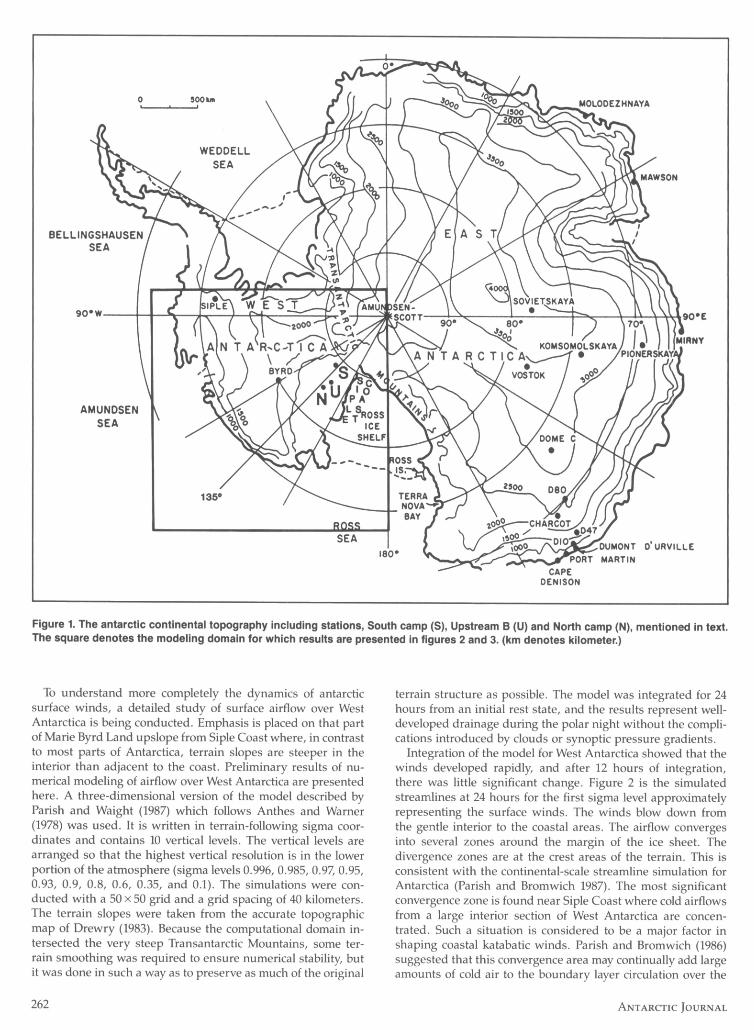
Surface wind observations taken both at the few interior sta-tions and by traverse party members have shown that katabaticwinds are the most significant climatological feature of thelower portion of the atmosphere over Antarctica. Schwerdtfeger
(1970) indicated the dominant influence of antarctic topography(figure 1) in shaping the surface windfield. Parish and Brom-wich (1986) simulated the directional near-surface airflow char-acteristics over West Antarctica and showed that the most sig-nificant features are a small number of confluence zones wherecold drainage currents from a large interior area converge to-ward the coast. The continental-scale drainage streamline sim-ulation performed by Parish and Bromwich (1987) suggests thatnumerous confluence zones may be found over the antarcticcontinent. Parish and Bromwich (1991) modeled the directionsand speeds of surface airflow over Antarctica. The intensity ofthe drainage flow is generally proportional to the steepness ofthe terrain. The winds are relatively weak over the interior andgradually increase during descent to sea level in response tosteeper ice terrain near the coast. This near-coastal pattern ismodulated by the impact of lateral convergence associated withthe confluence zones.
1991 REVIEW 261
BELLINGSHAUSENSEA
90,W 90E
AMUNDSEN
SEA
D' URVILLE
CAPEDEN IS ON
Figure 1. The antarctic continental topography including stations, South camp (S), Upstream B (U) and North camp (N), mentioned in text.The square denotes the modeling domain for which results are presented in figures 2 and 3. (km denotes kilometer.)
To understand more completely the dynamics of antarcticsurface winds, a detailed study of surface airflow over WestAntarctica is being conducted. Emphasis is placed on that partof Marie Byrd Land upslope from Siple Coast where, in contrastto most parts of Antarctica, terrain slopes are steeper in theinterior than adjacent to the coast. Preliminary results of nu-merical modeling of airflow over West Antarctica are presentedhere. A three-dimensional version of the model described byParish and Waight (1987) which follows Anthes and Warner(1978) was used. It is written in terrain-following sigma coor-dinates and contains 10 vertical levels. The vertical levels arearranged so that the highest vertical resolution is in the lowerportion of the atmosphere (sigma levels 0.996, 0.985, 0.97, 0.95,0.93, 0.9, 0.8, 0.6, 0.35, and 0.1). The simulations were con-ducted with a 50 x 50 grid and a grid spacing of 40 kilometers.The terrain slopes were taken from the accurate topographicmap of Drewry (1983). Because the computational domain in-tersected the very steep Transantarctic Mountains, some ter-rain smoothing was required to ensure numerical stability, butit was done in such a way as to preserve as much of the original
terrain structure as possible. The model was integrated for 24hours from an initial rest state, and the results represent well-developed drainage during the polar night without the compli-cations introduced by clouds or synoptic pressure gradients.
Integration of the model for West Antarctica showed that thewinds developed rapidly, and after 12 hours of integration,there was little significant change. Figure 2 is the simulatedstreamlines at 24 hours for the first sigma level approximatelyrepresenting the surface winds. The winds blow down fromthe gentle interior to the coastal areas. The airflow convergesinto several zones around the margin of the ice sheet. Thedivergence zones are at the crest areas of the terrain. This isconsistent with the continental-scale streamline simulation forAntarctica (Parish and Bromwich 1987). The most significantconvergence zone is found near Siple Coast where cold airflowsfrom a large interior section of West Antarctica are concen-trated. Such a situation is considered to be a major factor inshaping coastal katabatic winds. Parish and Bromwich (1986)suggested that this convergence area may continually add largeamounts of cold air to the boundary layer circulation over the
262 ANTARCTIC JOURNAL

Ross Ice Shelf. Bromwich, Carrasco, and Stearns (in press) haverecently presented extensive satellite evidence to support thiscontention.
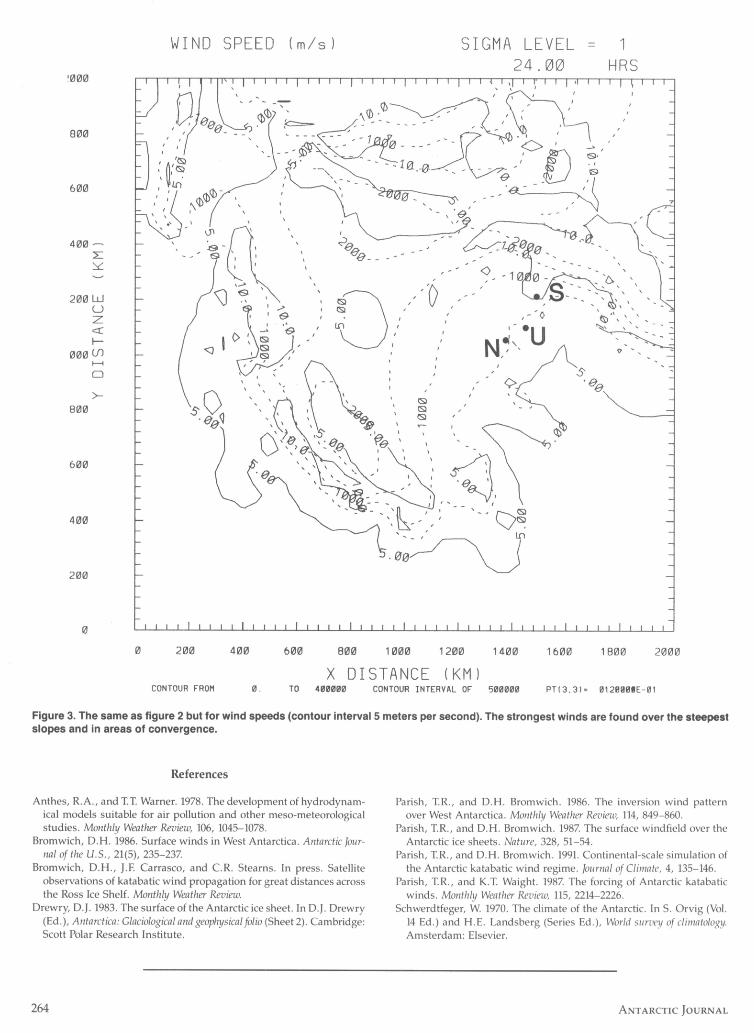
Figure 3 is the same as figure 2 but for wind speeds. Thestrongest wind speeds, enclosed by the 10-meter-per-secondisopleths, are found over the steep coastal slopes. In the inte-rior, the winds are weaker with the lowest speeds coincidingwith the highest points of the terrain. The model results alsoshow a 10-meter-per-second isopleth, which encloses Southcamp location. Two other locations north of this site, known asUpstream B and North camps, have lower simulated windspeeds. This is generally in agreement with the winds observedat these stations during summer. Bromwich (1986) analyzedwind observations from these three temporary camps taken
STREAMLINES
during the 1984-1985 and 1985-1986 austral summers as partof the Siple Coast glaciology project. Going from north tosouth, the observed winds were found consistently to increasein speed and become less variable in direction. This was in-ferred to be due to the greater influence of the airflow conver-gence at South camp. The limited area occupied by the 10meter-per-second isopleth near South camp requires furtherexplanation. The opposing acceleration effects of lateral con-vergence and slackening terrain slopes probably leads to thissituation. Thus, the observational and modeling analyses forthe Siple Coast area are mutually consistent.
This research was supported by National Science Foundationgrant DPP 89-16921 to David H. Bromwich. T.R. Parish providedvaluable assistance with the modeling.
SIGMA LEVEL = 1
24.00 HRS'000
800
600
400
200 LiiUzF-
000 (.1)'ID>-
800
600
400
200
00200400600800100012001400160018002000
X DISTANCE (KM)CONTOUR FROM0.TO4000.0CONTOUR INTERVAL OF500.00PT(3.3)=1.0000
Figure 2. The streamlines from results of 24-hour simulation over West Antarctica. The prominent airflow convergence is located aroundSiple Coast. Terrain contour lines are dashed and are drawn for 500, 1,000, 1,500, and 2,000 meters only. S, U, and N same as defined infigure 1. (km denotes kilometer.)
1991 REVIEW 263
'000
egg
600
400
200 UJUz
F-000 (J•)
D
>-800
600
400
200
0
WIND SPEED (m/s) SIGMA LEVEL = 124.00HRS
/ Its :'
Ln
:'N5U
II 1'
0200400600800100012001400160018002000
X DISTANCE (KM)CONTOUR FROM0.TO400000CONTOUR INTERVAL OF500000PT(3.3)= 0120001E-01
Figure 3. The same as figure 2 but for wind speeds (contour interval 5 meters per second). The strongest winds are found over the steepestslopes and in areas of convergence.
References
Anthes, R.A., and T.T. Warner. 1978. The development of hydrodynam-ical models suitable for air pollution and other meso-meteorologicalstudies. Monthly Weather Review, 106, 1045-1078.
Bromwich, D.H. 1986. Surface winds in West Antarctica. Antarctic Jour-nal of the U.S., 21(5), 235-237
Bromwich, D.H., J.F. Carrasco, and C.R. Stearns. In press. Satelliteobservations of katabatic wind propagation for great distances acrossthe Ross Ice Shelf. Monthly Weather Review.
Drewry, D.J. 1983. The surface of the Antarctic ice sheet. In D.J. Drewry(Ed.), Antarctica: Glaciological and geophysical folio (Sheet 2). Cambridge:Scott Polar Research Institute.
Parish, T.R., and D.H. Bromwich. 1986. The inversion wind patternover West Antarctica. Monthly Weather Review, 114, 849-860.
Parish, TR., and D.H. Bromwich. 1987 The surface windfield over theAntarctic ice sheets. Nature, 328, 51-54.
Parish, T.R., and D.H. Bromwich. 1991. Continental-scale simulation ofthe Antarctic katabatic wind regime. Journal of Climate, 4, 135-146.
Parish, IR., and K.T. Waight. 1987 The forcing of Antarctic katabaticwinds. Monthly Weather Review, 115, 2214-2226.
Schwerdtfeger, W. 1970. The climate of the Antarctic. In S. Orvig (Vol.14 Ed.) and H.E. Landsberg (Series Ed.), World survey of climatology.Amsterdam: Elsevier.
264 ANTARCTIC JOURNAL


![SmB - arXiv · SmB 6, which has been con rmed by a couple of theoret-ical studies,[9, 11] arouse great curiosity about the char-acteristics of the metallic surface states in SmB 6.[16]](https://img.pdfslide.net/doc/110x75/5b95cee409d3f2ea5c8c7497/smb-arxiv-smb-6-which-has-been-con-rmed-by-a-couple-of-theoret-ical-studies9.jpg)