Embed Size (px)
Citation preview
SIGN LANGUAGE WORD LIST COMPARISONS:
TOWARD A REPLICABLE CODING AND SCORING METHODOLOGY
by
Jason Parks
Bachelor of Arts, Bethel University, 2000
A Thesis
Submitted to the Graduate Faculty
of the
University of North Dakota
in partial fulfillment of the requirements
for the degree of
Master of Arts
Grand Forks, North Dakota
December
2011

ii
Copyright 2011 Jason Parks
iii
This thesis, submitted by Jason Parks in partial fulfillment of the requirements for the
Degree of Master of Arts from the University of North Dakota, has been read by the Faculty
Advisory Committee under whom the work has been done and is hereby approved.
_____________________________________
Chairperson
_____________________________________
_____________________________________
This thesis meets the standards for appearance, conforms to the style and format
requirements of the Graduate School of the University of North Dakota, and is hereby approved.
_______________________________
Dean of the Graduate School
_______________________________
Date

iv
PERMISSION
Title Sign Language Word List Comparisons: Toward a Replicable Coding and
Scoring Methodology
Department Linguistics
Degree Master of Arts
In presenting this thesis in partial fulfillment of the requirements for a graduate degree
from the University of North Dakota, I agree that the library of this University shall make it freely
available for inspection. I further agree that permission for extensive copying for scholarly
purposes may be granted by the professor who supervised my thesis work or, in his absence, by
the chairperson of the department or the dean of the Graduate School. It is understood that any
copying or publication or other use of this thesis or part thereof for financial gain shall not be
allowed without my written permission. It is also understood that due recognition shall be given
to me and to the University of North Dakota in any scholarly use which may be made of any
material in my thesis.
Signature ___________________________
Date ___________________________
v
TABLE OF CONTENTS
LIST OF FIGURES ...................................................................................................................... viii
LIST OF TABLES .......................................................................................................................... ix
ACKNOWLEDGMENTS .............................................................................................................. xi
ABSTRACT ...................................................................................................................................xii
CHAPTER
1 INTRODUCTION ............................................................................................................... 1
1.1 Analyzing word lists for lexical similarity ............................................................... 2
1.2 Previous sign language word list comparison studies .............................................. 3
1.3 The problem ............................................................................................................. 6
2 HYPOTHESIS AND METHODOLOGY PROPOSAL ...................................................... 8
2.1 Methodology proposal for the coding system .......................................................... 9
2.1.1 Synchronic analysis ...................................................................................... 9
2.1.2 Phonological basis of coding system ............................................................ 9
2.1.3 Identifying a sign token for coding ............................................................. 11
2.2 Handshape parameter values .................................................................................. 12
2.2.1 Description of codes used for handshape values ........................................ 15
2.2.2 Identifying variants of a handshape parameter value ................................. 17
2.3 Location parameter values ...................................................................................... 18
2.4 Joint movement parameter values .......................................................................... 23
2.5 Palm orientation parameter values ......................................................................... 27
3 PROCEDURE................. ................................................................................................... 28
3.1 Participants ............................................................................................................. 28
vi
3.2 Elicitation procedure .............................................................................................. 31
3.3 Word list video data coding procedure ................................................................... 32
3.4 Assessing similarity using Levenshtein distance.................................................... 34
3.4.1 Calculating Levenshtein distance ............................................................... 34
3.4.2 Levenshtein distance applied to sign language word list comparisons ....... 36
4 RESULTS......... ................................................................................................................. 40
4.1 Identifying similarity groupings based on Levenshtein distance results ................ 40
4.2 Validity of Levenshtein distance results ................................................................. 44
4.3 Evaluation of parameters ........................................................................................ 48
4.3.1 Individual parameters ................................................................................. 48
4.3.2 Parameter sets ............................................................................................. 53
4.4 Evaluation of handshape parameter values ............................................................ 56
4.5 Evaluation of word list items .................................................................................. 58
4.5.1 Comparison of item subsets ........................................................................ 58
4.5.2 Items with elicitation problems .................................................................. 61
4.6 Similarity results using refined parameters, values, and word list items................ 63
5 CONCLUSION...... ............................................................................................................ 66
5.1 Refining the parameters for comparison ................................................................ 67
5.2 Refining parameter values ...................................................................................... 68
5.3 Refining the word list items ................................................................................... 69
5.4 Final methodology proposal ................................................................................... 69
5.5 Areas and considerations for future research ......................................................... 70
APPENDICES ................................................................................................................................72
Appendix A Word list items ................................................................................................. 73
Appendix B Rank and frequency of parameter values.......................................................... 75
Appendix C Levenshtein distances between each variety pairing ........................................ 81

vii
REFERENCES .............................................................................................................................. 83
viii
LIST OF FIGURES
Figure Page
1. Signs that would be considered similar—identical in two out of three parameters ................. 4
2. Handshape parameter value inventory—99 values with codes and images ........................... 14
3. Location parameter value inventory—25 body and 6 spatial location values ....................... 20
4. Examples of body contact coded as initial or final location parameter ................................. 22
5. Location coding examples where non-dominant hand contact is disregarded ....................... 23
6. Joint movement parameter coding example for "Fingers" value ........................................... 25
7. Joint movement parameter coding example for "Wrist" value .............................................. 25
8. Joint movement parameter coding example for "Elbow" value ............................................. 26
9. Joint movement parameter coding example for "Shoulder" value ......................................... 26
10. Annotating word list videos using ELAN .............................................................................. 33
11. Calculating the Levenshtein distance between two signs for “cat” ....................................... 37
12. Dendrogram of Levenshtein distance similarity groupings based on six parameters ............ 41
13. Correlation of mean Levenshtein distance to mean RTT-R intelligibility score between
countries ................................................................................................................................. 47
14. Visual comparison of Levenshtein results of individual parameters for variety groupings ... 50
15. Levenshtein distances of variety groupings for parameter sets ............................................. 55
16. Levenshtein distances of variety groupings for four sets of word list items .......................... 59
17. Dendrogram of Levenshtein distance similarity groupings for 4P-215-74 data set ............... 65

ix
LIST OF TABLES
Table Page
1. Similarity grouping example based on Blair’s lexical similarity criteria................................. 3
2. Handshape coding suffixes for finger variations ................................................................... 16
3. Handshape coding suffixes for thumb variations ................................................................... 16
4. Unique code suffixes for handshapes..................................................................................... 17
5. Handshape values with variants ............................................................................................. 18
6. Participant metadata ............................................................................................................... 30
7. Levenshtein distance between two pronunciations of "afternoon" ........................................ 35
8. Levenshtein distance between two signs for "cat" ................................................................. 37
9. Levenshtein distances of variety groupings based on the six parameters of the initial coding
system .................................................................................................................................... 42
10. Levenshtein distances and RTT-R intelligibility scores for three country comparisons ....... 46
11. Levenshtein distances of variety groupings based on individual parameters ........................ 49
12. General statistics of individual parameter Levenshtein distance results ................................ 52
13. Levenshtein distances of variety groupings based on parameter sets .................................... 54
14. Handshape values that occur least frequently to combine with similar values ...................... 57
15. Handshape values to merge because they are hard to distinguish ......................................... 57
16. Levenshtein distance results for four sets of word list items ................................................. 59
17. 12 word list items with the most missing data entries ........................................................... 61
x
18. 14 word list items that elicit the most sign tokens ................................................................. 62
19. Levenshtein distance results of sets with reduced word list items and handshape parameter
values ..................................................................................................................................... 63
20. Word list items ....................................................................................................................... 74
21. Rank and frequency of the combined initial and final handshape parameter values ............. 76
22. Rank and frequency of initial handshape parameter values ................................................... 77
23. Rank and frequency of final handshape parameter values ..................................................... 78
24. Rank and frequency of the combined initial and final location parameter values ................. 79
25. Rank and frequency of initial and final location parameter values ........................................ 80
26. Rank and frequency of the two palm orientation parameter values ....................................... 80
27. Rank and frequency of the five joint movement parameter values ........................................ 80
28. Levenshtein distances between each pair of sign language varieties ..................................... 82
xi
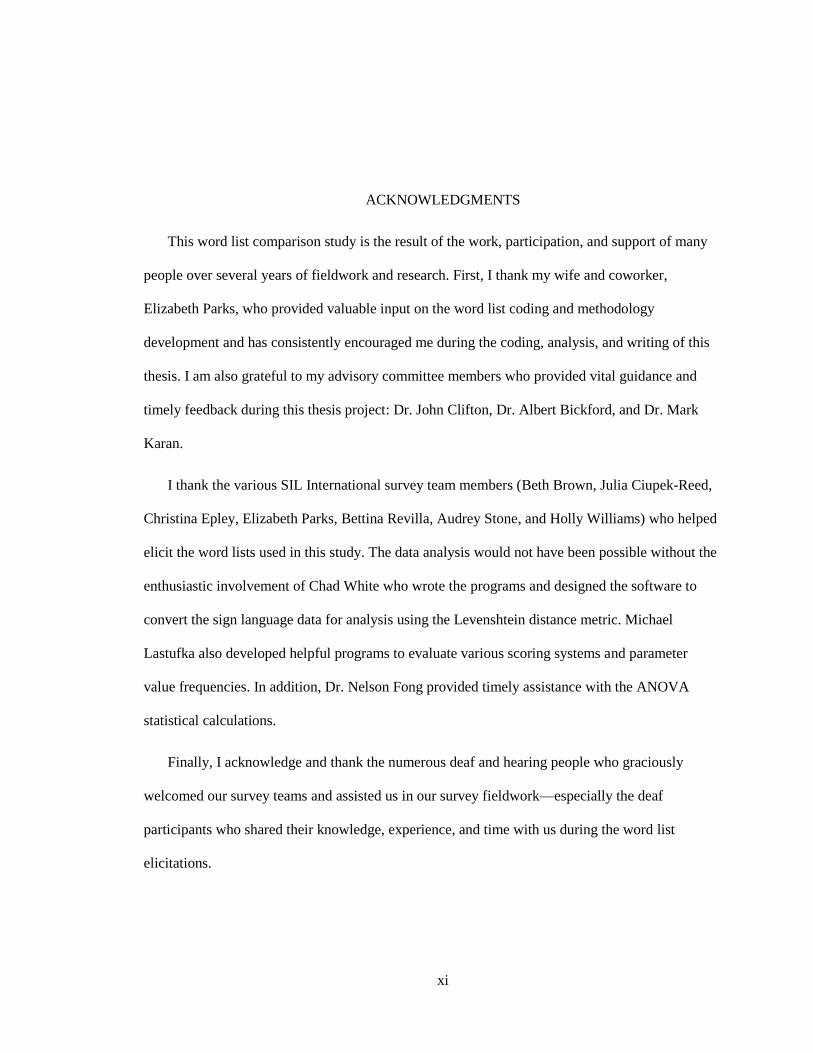
ACKNOWLEDGMENTS
This word list comparison study is the result of the work, participation, and support of many
people over several years of fieldwork and research. First, I thank my wife and coworker,
Elizabeth Parks, who provided valuable input on the word list coding and methodology
development and has consistently encouraged me during the coding, analysis, and writing of this
thesis. I am also grateful to my advisory committee members who provided vital guidance and
timely feedback during this thesis project: Dr. John Clifton, Dr. Albert Bickford, and Dr. Mark
Karan.
I thank the various SIL International survey team members (Beth Brown, Julia Ciupek-Reed,
Christina Epley, Elizabeth Parks, Bettina Revilla, Audrey Stone, and Holly Williams) who helped
elicit the word lists used in this study. The data analysis would not have been possible without the
enthusiastic involvement of Chad White who wrote the programs and designed the software to
convert the sign language data for analysis using the Levenshtein distance metric. Michael
Lastufka also developed helpful programs to evaluate various scoring systems and parameter
value frequencies. In addition, Dr. Nelson Fong provided timely assistance with the ANOVA
statistical calculations.
Finally, I acknowledge and thank the numerous deaf and hearing people who graciously
welcomed our survey teams and assisted us in our survey fieldwork—especially the deaf
participants who shared their knowledge, experience, and time with us during the word list
elicitations.
xii
ABSTRACT
This study describes and evaluates a methodology for sign language word list comparisons.
The purpose of this sociolinguistic research tool is to identify similarity relationships among sign
language varieties by assessing similarities of lexical items. Similarities are calculated using the
Levenshtein distance metric which measures the number of differences between signs.
In this study, the methodology was refined for optimal efficiency through an analysis of:
which parameters of a sign should be compared, which values should be included in each
parameter value inventory, and which items should be used in the word list. As a result of the
study, I propose both an efficient coding system and a methodology that is replicable and
relatively objective, easily merges multiple data sets, and identifies similarities among sign
language varieties. The validity of the methodology is supported by similarity grouping results
that highly correlate with intelligibility testing results of other studies.
The word list data for this study comes from video data archived with SIL International that
represents 50 sign language varieties from 13 countries, mostly in Latin America and the
Caribbean.
1
CHAPTER 1
INTRODUCTION
Research in language variation can offer helpful insights to organizations and individuals
involved in education planning, language policy, and language development. In language
variation studies, the use of multiple research instruments that explore a broad range of
sociolinguistic and linguistic factors in variation can reinforce conclusions by describing the
language situation from a variety of perspectives. One relatively straightforward research
instrument used to assess language relatedness is comparison of word lists. There are two general
methodological approaches that have been applied to word list comparisons of spoken languages:
comparing cognates (forms that have descended from a common historical form) and comparing
similar forms regardless of the historical relationships.
Within the approach comparing cognates, the historical-comparative method (Campbell 2004,
16-27, 188-197) compares language varieties to identify shared innovations and groups the
varieties based on these shared innovations. In the absence of a historical-comparative analysis of
the varieties, phonostatistic and lexicostatistic methods can be used to determine the relatedness
of the varieties being studied. Phonostatistic methods do this by measuring phonological
differences between forms (Simons 1977). Early practitioners of lexicostatistics identified
apparent/probable cognates based on phonetic similarity, and cognate percentages were used to
determine language relatedness (similarity groups were based on both shared innovations and
shared retentions) (Gudschinsky 1956, 180-81). More recently, some practitioners have proposed
that related forms should be identified purely on the basis of phonetic similarity, regardless of the
actual historical relationship between the forms (Sanders 1977, 32-37).
2
A variety of methods have been used to calculate the phonetic similarity of forms.
McElhannon (1967) judged forms as similar if 50% or more of the phonemes corresponded.
Deibler and Trefry (1963) calculated similarity by scoring comparisons on a scale of zero to four
based on the number of phoneme differences between the two forms. Blair (1990) outlined what
has become a common methodology to assess lexical similarity. When comparing two forms, all
pairs of phones are classified into one of three categories; and forms are considered as similar or
non-similar depending on the number of phone pairs in each category and the word length. Using
this method, language varieties are grouped based on the overall percentage of similar forms. For
a rough simplification of the scoring criteria, two forms are considered similar if at least half of
the phones are identical or very similar, another 25% are at least somewhat similar, and only 25%
of the phones can be different (Blair 1990, 31-33). In the past decade, the Levenshtein distance
metric (minimum number of edits required to convert one form into another) has been used to
calculate similarities between forms on a gradient scale using a more nuanced measurement than
the similar vs. non-similar categorization (Heeringa et al. 2006).
Sign language researchers using word list comparisons have generally followed the lexical
similarity tradition since the early research from the late 1970's to the present. In the following
three sections, I will briefly describe: an example of lexical similarity analysis in spoken
languages, how previous studies have analyzed lexical similarities among sign languages, and a
problem in previous studies that will be the focus of this study.
1.1 Analyzing word lists for lexical similarity
For an example of a lexical similarity analysis in spoken languages, Kluge (2000; 2005)
describes a study of 49 Gbe language varieties in West Africa. For one set of similarity judgment
criteria, Kluge followed Blair’s methodology (1990) with a few modifications based on a
comparison approach by Schooling (1981) that ignores reduplication and apparently affixed
3
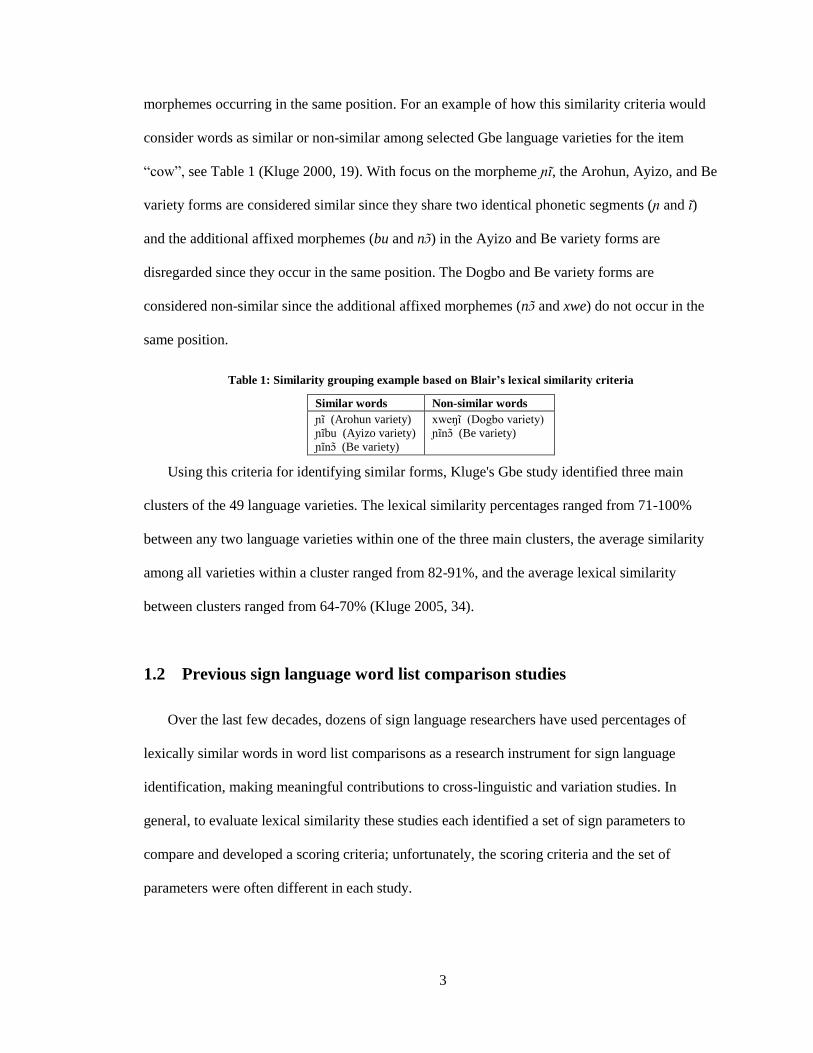
morphemes occurring in the same position. For an example of how this similarity criteria would
consider words as similar or non-similar among selected Gbe language varieties for the item
“cow”, see Table 1 (Kluge 2000, 19). With focus on the morpheme ɲĩ, the Arohun, Ayizo, and Be
variety forms are considered similar since they share two identical phonetic segments (ɲ and ĩ)
and the additional affixed morphemes (bu and n ) in the Ayizo and Be variety forms are
disregarded since they occur in the same position. The Dogbo and Be variety forms are
considered non-similar since the additional affixed morphemes (n and xwe) do not occur in the
same position.
Table 1: Similarity grouping example based on Blair’s lexical similarity criteria
Similar words Non-similar words
ɲĩ (Arohun variety)
ɲĩbu (Ayizo variety)
ɲĩn (Be variety)
xweŋĩ (Dogbo variety)
ɲĩn (Be variety)
Using this criteria for identifying similar forms, Kluge's Gbe study identified three main
clusters of the 49 language varieties. The lexical similarity percentages ranged from 71-100%
between any two language varieties within one of the three main clusters, the average similarity
among all varieties within a cluster ranged from 82-91%, and the average lexical similarity
between clusters ranged from 64-70% (Kluge 2005, 34).
1.2 Previous sign language word list comparison studies
Over the last few decades, dozens of sign language researchers have used percentages of
lexically similar words in word list comparisons as a research instrument for sign language
identification, making meaningful contributions to cross-linguistic and variation studies. In
general, to evaluate lexical similarity these studies each identified a set of sign parameters to
compare and developed a scoring criteria; unfortunately, the scoring criteria and the set of
parameters were often different in each study.
4
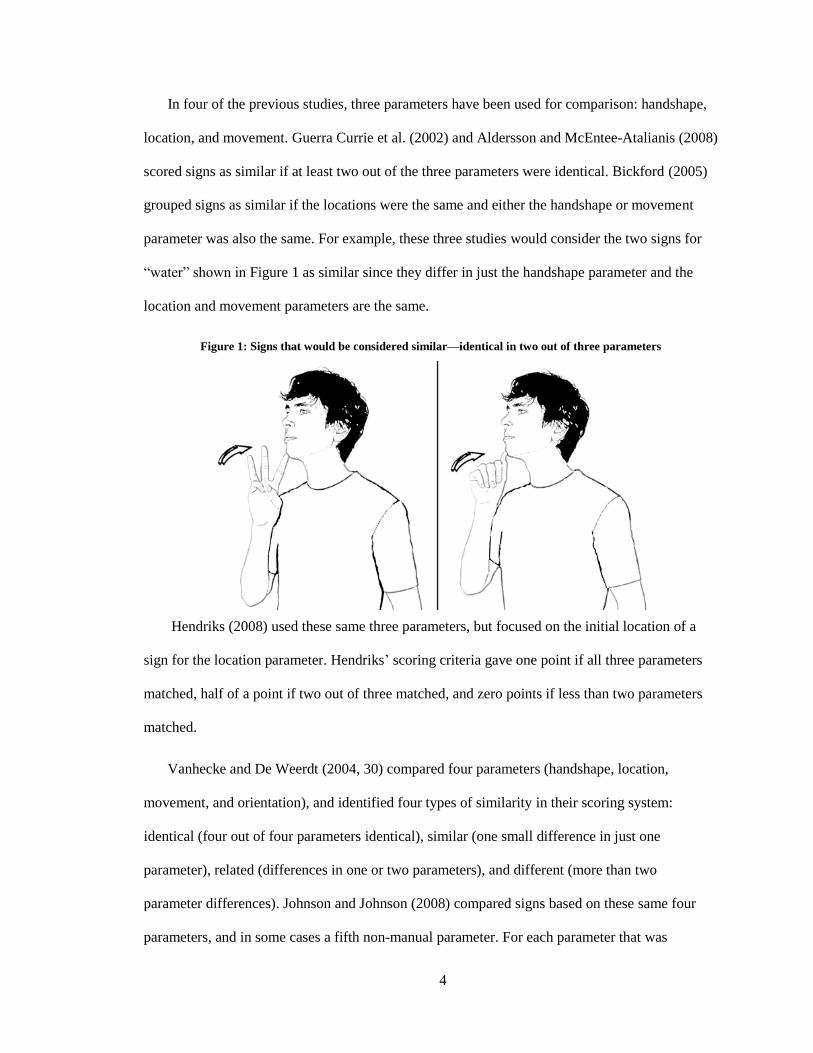
In four of the previous studies, three parameters have been used for comparison: handshape,
location, and movement. Guerra Currie et al. (2002) and Aldersson and McEntee-Atalianis (2008)
scored signs as similar if at least two out of the three parameters were identical. Bickford (2005)
grouped signs as similar if the locations were the same and either the handshape or movement
parameter was also the same. For example, these three studies would consider the two signs for
“water” shown in Figure 1 as similar since they differ in just the handshape parameter and the
location and movement parameters are the same.
Figure 1: Signs that would be considered similar—identical in two out of three parameters
Hendriks (2008) used these same three parameters, but focused on the initial location of a
sign for the location parameter. Hendriks’ scoring criteria gave one point if all three parameters
matched, half of a point if two out of three matched, and zero points if less than two parameters
matched.
Vanhecke and De Weerdt (2004, 30) compared four parameters (handshape, location,
movement, and orientation), and identified four types of similarity in their scoring system:
identical (four out of four parameters identical), similar (one small difference in just one
parameter), related (differences in one or two parameters), and different (more than two
parameter differences). Johnson and Johnson (2008) compared signs based on these same four
parameters, and in some cases a fifth non-manual parameter. For each parameter that was
5
identical they gave one-fourth or one-fifth of a point depending on whether four or five
parameters were compared. Sasaki (2007) evaluated word lists based on five parameters:
handshape, location, movement, orientation, and one/two hands. Sasaki used scoring criteria that
categorized signs into three groups: identical, similar (four out of five parameters identical), and
distinct. Xu (2006) compared signs based on the following five parameters: handshape, location,
movement, palm orientation, and iconic motivation. In Xu's scoring criteria, at least three out of
the five parameters needed to be identical to be scored as similar. In addition to the five
parameters, Xu also considered iconicity and handedness when evaluating similarity. Hurlbut
(2007) compared signs based on seven parameters, and weighted more heavily certain parameters
considered to be of extra importance. Hurlbut scored signs as similar if at least two parameters
were identical.
Woodward (1977, 337-340; 1993) calculated lexical similarity and listed the percentage of
similar forms between word list items of sign varieties. However, Woodward describes no
scoring criteria used to identify similar forms or what if any parameters were identified for
comparison. Parkhurst and Parkhurst (2007, 12) used a scoring criteria where one point was given
if signs were identical, half of a point if judged as similar, and zero points if judged as completely
different, but did not identify specific parameters used for comparison.
In the first word list comparison study using data gathered by our SIL International survey
team during fieldwork in Guatemala in 2007, E. Parks and I (with input from Bickford), identified
four parameters and developed parameter inventories to explore various scoring systems (Parks
and Parks 2008). In that preliminary study, we chose scoring criteria that required an identical
handshape in either the initial or final sign positions and an identical location in either the initial
or final sign positions for lexical items to be considered as similar. We coded signs using an
inventory of 48 handshape parameter values and 23 location parameter values (2008, 24-25). The
6
word list comparison analysis of the Guatemala sign varieties provided a catalyst for the
methodology proposal of this study.
1.3 The problem
In general, previous sign language word list comparison studies lack a detailed description of
any parameter values that were used to code sign parameters, and in some studies the criteria for
similarity judgments were largely subjective (or not made explicit). Consequently, it would not be
possible to accurately replicate the results of these studies given the methodology description
available in the reports. The difficulty of evaluating and comparing various similarity criteria sets
is accentuated by the lack of reporting of the raw data. Nor is it currently possible to compare the
similarity percentage results between studies since the studies do not share a common similarity
criteria set, the number of parameter values and possible distinctions within a sign parameter have
never been described, and the sets of word list items have been different. Also, it is not possible
to add any additional word list data from other sign varieties to an existing study and obtain
results for the combined data set since the similarity criteria set is not sufficiently described and
the raw data used to make similarity judgments is not reported. Any of these factors could
conceivably affect the similarity percentages that are calculated by a study, and thus the
percentages from different studies are not comparable.
In response to the problems identified from previous sign language word list comparison
research, in this study I propose a word list comparison methodology that justifies which
parameters should be used, clearly defines a set of possible parameter values for each parameter
being coded and compared, and uses a scoring system based on Levenshtein distances rather than
lexical similarity judgments. With the use of a computer software package developed for
Levenshtein distance analysis of word lists, and another program written specifically to convert
sign language word list data for Levenshtein distance analysis, the proposed methodology is less

7
subjective and requires much less time to analyze, is replicable by other researchers, is relatively
easy to learn, and allows results to be compared among various studies that follow the proposed
methodology.
With this research focus, in the next chapter I will describe my research hypothesis, a sign
language coding system methodology including a description of sign parameters and possible
parameter values, and the Levenshtein distance similarity metric. In the third chapter, I will
discuss the procedure used for eliciting and coding sign language word lists. The fourth chapter
will present the comparison results and an assessment of their validity, based on wordlist data that
has been archived with SIL International. In the final two chapters, I discuss my interpretation of
the results and propose a refined methodology for sign language word list comparisons followed
by a conclusion and suggestions for future research.
8
CHAPTER 2
HYPOTHESIS AND METHODOLOGY PROPOSAL
The main research goal for this study is to find an appropriate selection of parameters for
comparison, possible values that may be assigned for each parameter, and lexical items to include
in an optimal word list, so that word list data can be efficiently analyzed to produce a similarity
matrix and a dendrogram (a tree diagram) that reflect relationships between pairs of language
varieties and among clusters of language varieties. In order to determine an appropriate word list
comparison methodology to meet my research goal, I worked to adapt previous coding and
scoring systems. The coding system of this study had two stages of development. In the first
stage, I developed an initial coding system and applied it to the data set. In the second stage,
based on observations of the results using the initial coding system, I propose a final refined
coding system for application in future sign language word list comparison studies.
In the initial coding system, I identified six parameters of a sign for comparison: initial
handshape, final handshape, initial location, final location, palm orientation change, and joint
movement. Signs were coded for each of the six parameters using a detailed inventory of unique
values with descriptions of how to consistently apply the coding system. These sign parameters
and the parameter coding values were not meant to be an exhaustive inventory of every possible
phonetic component of a sign, but rather an easy-to-follow coding system that was sufficiently
detailed to provide valid similarity grouping results for word list comparisons. This coding
system was tested on a video data set of 50 word lists (most lists contained 241 lexical items)
representing sign language varieties from 13 countries. Then, similarities among the language
varieties were evaluated using the Levenshtein distance metric which calculates the similarities of

9
lexical items. In this chapter I discuss the methodological basis for the coding system, and then
give a description of the values developed for each parameter of the initial coding system.
2.1 Methodology proposal for the coding system
This section describes the basis for the proposed methodology: it is a synchronic, not a
diachronic, analysis (section 2.1.1), sign parameters are selected that reflect both the simultaneity
and sequentiality of sign language phonology (section 2.1.2), and criteria are developed to
identify sign tokens (or utterances) in the word list video data in a consistent manner (section
2.1.3).
2.1.1 Synchronic analysis
The proposed methodology is a synchronic analysis of the elicited items—the analysis
compares sign language varieties at one point in time without reference to historical development.
In contrast, a diachronic analysis would determine whether items share a common historical form.
Therefore, this synchronic analysis does not claim to identify signs that can be traced back to a
common ancestral form (cognates). In addition, it makes no claims of genetic relationships and
does not distinguish between inherited or borrowed signs (loans). Kessler (2001, 5) states,
"whether language elements share certain properties because they are inherited from a common
ancestor language, or whether they share them through borrowing, the language and the elements
in question can be said to be historically connected." So despite not making these distinctions, the
results of this type of synchronic analysis could prompt questions and suggest areas of focus for
future studies of historical relationships among sign language varieties.
2.1.2 Phonological basis of coding system
The sign language coding system for word list comparisons that I recommend is based on a
phonological framework that includes both the simultaneity and sequentiality of sign language. In
10
early sign language linguistics, Stokoe et al. (1965) identified three parameters of a sign that they
regarded for analytical purposes as occurring simultaneously: place of articulation or location,
handshape, and movement. The sequentiality of sign language is described in the Move-Hold
phonological model of Liddell and Johnson (1989, 208-210). In this model, signs are regarded as
consisting of sequences of segments. The coding system I propose presupposes this richer
conception of sign language phonology, which recognizes both simultaneity and sequentiality in
the structure of a sign—an assumption that is held in most subsequent theorizing about sign
language phonology (Brentari 1998; Sandler 1989).
In the initial coding system for this study, six parameters were chosen to describe both the
sequential and simultaneous phonetic components of a sign. To represent simultaneity, both the
handshape and location features were identified. To represent sequentiality, the handshapes and
locations were each identified twice, once at the initial position of the sign, and once at the final
position of the sign. These parameters of handshape and location are two of the most common
parameters identified for transcription and analysis in previous word list comparisons and have
been the focus of many other sign language linguistic studies. Another common parameter that I
wanted to include in the coding system was movement, but previous transcription systems for
movement have varied widely and some aspects of movement can be captured by identifying
changes in handshape and location. In an effort to focus on only a few easily distinguishable
aspects of movement, I chose two parameters to represent various movements throughout the
duration of a sign token: palm orientation change (marking if the palm orientation changes by at
least 45 degrees or not) and joint movement (fingers, wrist, elbow, or shoulder). For the
handshape, location, and two movement parameters, a set of phonetic value inventories was
created with the goal of developing a well-defined and user-friendly coding system that also
described enough phonetic values to provide clear distinctions when comparing sign language
varieties.
11
Signs were coded based on phonetic not phonemic contrast. I took this coding approach for
two reasons: sign language linguists have not developed a standard methodology for identifying
phonemic contrast, and elicitation sessions during fieldwork often took place under time
constraints that would not have allowed a thorough investigation of phonemic contrast.
Non-manual mouthing features of a sign were not included for comparison because written
words were used during elicitation and participants’ exposure to oral training varied (some
participants mouthed almost every written word, while others used much less mouthing), and in
some cases hearing people were present during elicitation and participants may have mouthed
words for the hearing audience even if the mouthing was not natural to their sign language. Due
to these factors, mouth movements in the data appear to have been strongly influenced by spoken
languages in idiosyncratic ways that make them unreliable for lexical comparison.
Distinctions were not made between one-handed and two-handed signs. This approach
follows the argument made by Johnston (2003, 61) that variation that is not likely to be
phonemically different should be disregarded. For example, during fieldwork in many
communities it appeared that the difference between one-handed signs and two-handed signs was
often only a contrast between citational and non-citational forms without a change in meaning.
Some participants signed very formally during the elicitation sessions (preferring two-handed
signs) while others were much more casual and tended to prefer one-handed signs. Disregarding
this type of variation in the coding system, I also only coded the handshape of the dominant hand.
The non-dominant hand was only represented in the coding system if it was a point of contact
(location parameter value) for the dominant hand.
2.1.3 Identifying a sign token for coding
In order for other researchers to easily add to the existing word list corpus or replicate the
results of the study, I developed the following criteria to identify and consistently code sign

12
tokens in the video data. Some signs had one easily recognizable token and the parameter coding
was straightforward. However, in some cases, signs appeared to be multimorphemic forms with
more than one distinct sign token. For these situations, if there was a quick and smooth transition
between just two locations, the sign was coded as one token. Other signs that appeared to be
multimorphemic signs were coded into two separate sign tokens if the participant made a
significant pause between locations. To determine if a pause was long enough to separate a sign
into more than one token, the pause duration was compared to the participant's usual signing
speed and tempo for other elicited items. If a sign contained three distinct locations for what
appeared to be one sign, the sign was coded into separate tokens so that there would be at most
two locations in one token: one initial and one final. For example, several sign varieties in Latin
America have the signs for man or male, and woman or female used as an affix for many
concepts relating to people or kinship (e.g. boy, girl, son, daughter, grandfather, grandmother,
brother, sister, and others). In other cases, participants may fingerspell the letter "o" or "a" at the
end of a sign corresponding to the last letter in the written Spanish word. These additional sign
components were coded as separate tokens representing the item, unless there was a total of only
two distinct locations in the sign with a quick and smooth transition movement - in which case
the sign would be coded as one token.
A fingerspelled sign was included in comparisons and coded as one token. The first manual
alphabet form was coded as the initial handshape and the last manual alphabet form was coded as
the final handshape. The intermediary manual alphabet forms were disregarded since many forms
in fast fingerspelling were blurred and difficult to distinguish in the video data.
2.2 Handshape parameter values
In their study of American Sign Language, Liddell and Johnson identified over 150 hand
configurations (Liddell and Robert E. Johnson 1989, 223). This amount of distinction in a coding
13
system seemed overly detailed for the purpose of word list comparisons. Instead, I based my
selection of handshape parameter values on a study of four distinct sign languages by Rozelle
(2003). Rozelle identified an inventory of 68 handshapes among the data set; 22 of these
handshapes were identified in all four languages. Each sign language had a handshape inventory
ranging in size from 34-49 handshapes (Rozelle 2003, 80).
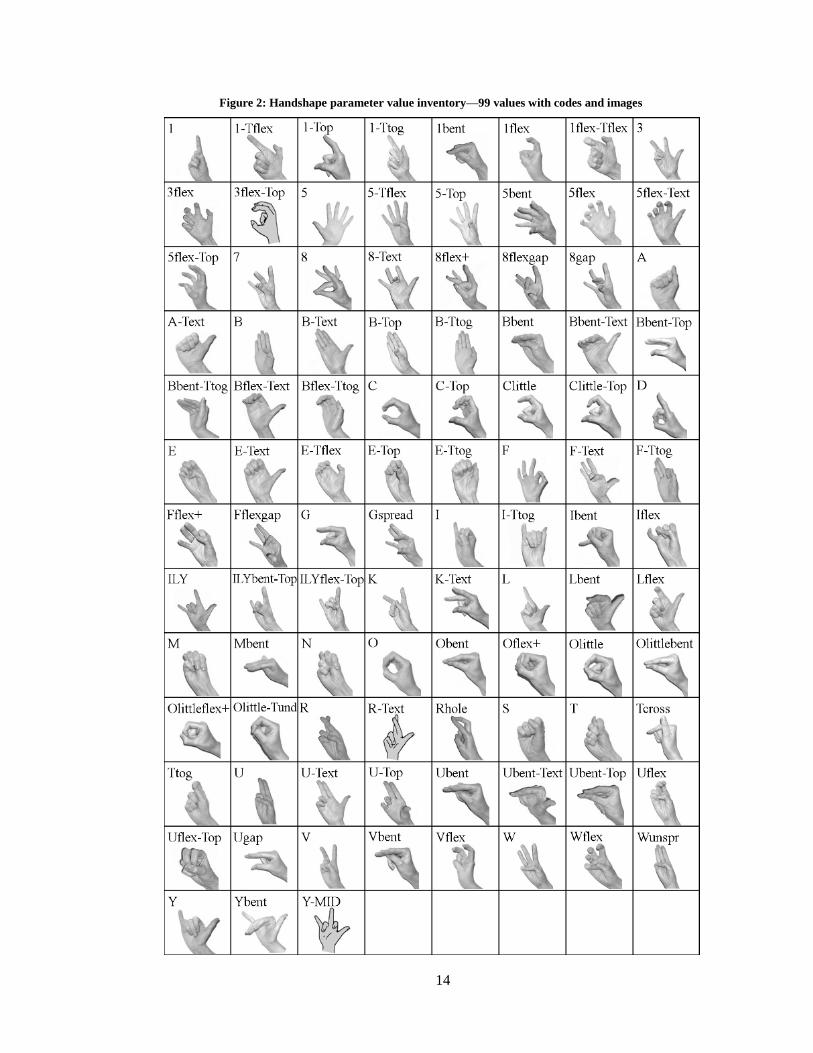
The initial list of handshape values included 102 handshapes listed in the appendix of
Rozelle's dissertation and three other fairly common handshapes our survey team had identified in
the Guatemala sign variety comparison, for a total inventory of 105 handshape values. Six of
these 105 handshapes were never observed in the video data. These six handshapes were
combined with other handshape values to increase the simplicity of the coding system by not
including values that only rarely occur and consequently do not have a significant influence on
similarity calculations. The resulting inventory of 99 handshape values is listed in Figure 2
alphabetically by the handshape value code along with an image representation of the handshape
value. (Handshape images are used with permission and slightly modified from Rozelle (2003)).
14
Figure 2: Handshape parameter value inventory—99 values with codes and images
15
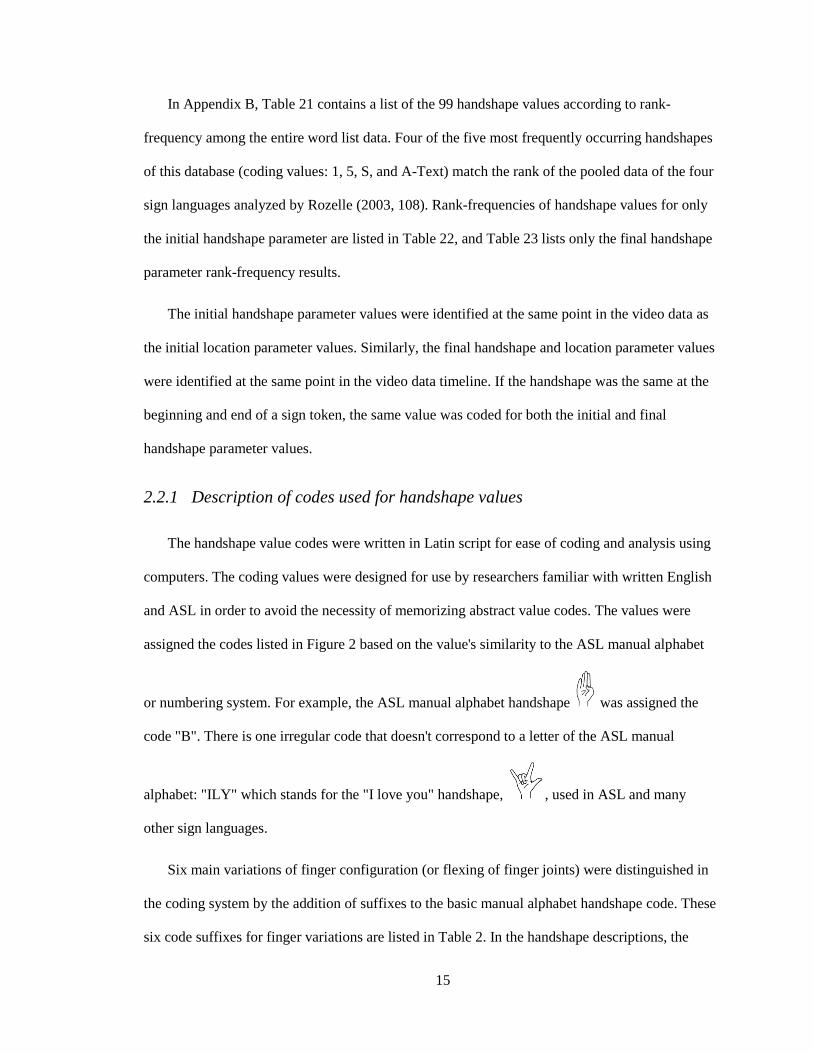
In Appendix B, Table 21 contains a list of the 99 handshape values according to rank-
frequency among the entire word list data. Four of the five most frequently occurring handshapes
of this database (coding values: 1, 5, S, and A-Text) match the rank of the pooled data of the four
sign languages analyzed by Rozelle (2003, 108). Rank-frequencies of handshape values for only
the initial handshape parameter are listed in Table 22, and Table 23 lists only the final handshape
parameter rank-frequency results.
The initial handshape parameter values were identified at the same point in the video data as
the initial location parameter values. Similarly, the final handshape and location parameter values
were identified at the same point in the video data timeline. If the handshape was the same at the
beginning and end of a sign token, the same value was coded for both the initial and final
handshape parameter values.
2.2.1 Description of codes used for handshape values
The handshape value codes were written in Latin script for ease of coding and analysis using
computers. The coding values were designed for use by researchers familiar with written English
and ASL in order to avoid the necessity of memorizing abstract value codes. The values were
assigned the codes listed in Figure 2 based on the value's similarity to the ASL manual alphabet
or numbering system. For example, the ASL manual alphabet handshape was assigned the
code "B". There is one irregular code that doesn't correspond to a letter of the ASL manual
alphabet: "ILY" which stands for the "I love you" handshape, , used in ASL and many
other sign languages.
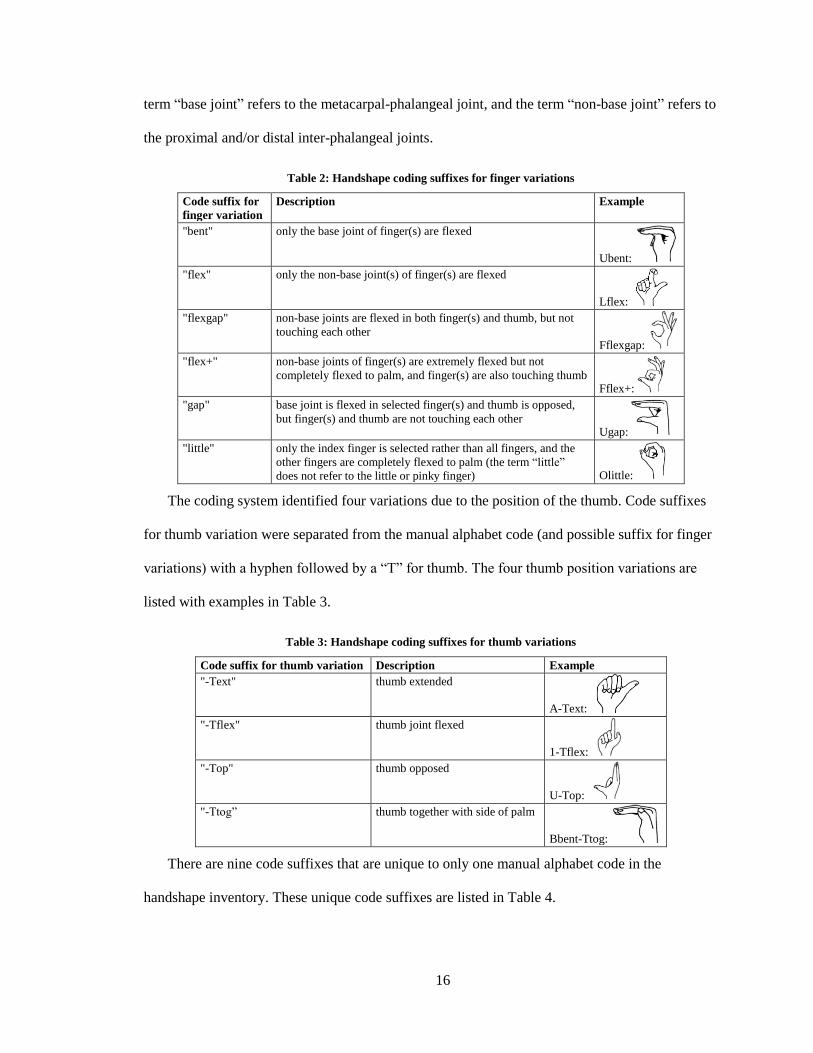
Six main variations of finger configuration (or flexing of finger joints) were distinguished in
the coding system by the addition of suffixes to the basic manual alphabet handshape code. These
six code suffixes for finger variations are listed in Table 2. In the handshape descriptions, the
16
term “base joint” refers to the metacarpal-phalangeal joint, and the term “non-base joint” refers to
the proximal and/or distal inter-phalangeal joints.
Table 2: Handshape coding suffixes for finger variations
Code suffix for
finger variation
Description Example
"bent" only the base joint of finger(s) are flexed
Ubent:
"flex" only the non-base joint(s) of finger(s) are flexed
Lflex:
"flexgap" non-base joints are flexed in both finger(s) and thumb, but not
touching each other Fflexgap:
"flex+" non-base joints of finger(s) are extremely flexed but not
completely flexed to palm, and finger(s) are also touching thumb Fflex+:
"gap" base joint is flexed in selected finger(s) and thumb is opposed,
but finger(s) and thumb are not touching each other Ugap:
"little" only the index finger is selected rather than all fingers, and the
other fingers are completely flexed to palm (the term “little”
does not refer to the little or pinky finger) Olittle:
The coding system identified four variations due to the position of the thumb. Code suffixes
for thumb variation were separated from the manual alphabet code (and possible suffix for finger
variations) with a hyphen followed by a “T” for thumb. The four thumb position variations are
listed with examples in Table 3.
Table 3: Handshape coding suffixes for thumb variations
Code suffix for thumb variation Description Example
"-Text" thumb extended
A-Text:
"-Tflex" thumb joint flexed
1-Tflex:
"-Top" thumb opposed
U-Top:
"-Ttog” thumb together with side of palm
Bbent-Ttog:
There are nine code suffixes that are unique to only one manual alphabet code in the
handshape inventory. These unique code suffixes are listed in Table 4.

17
Table 4: Unique code suffixes for handshapes
Unique code suffixes Description Image
"Gspread" middle, ring, and pinky fingers are extended and spread, rather
than completely flexed to palm as in "G"
"Olittlebent" only index finger is flexed at base joint, all other fingers' joints
are completely flexed to palm
"Olittleflex+" only index finger is extremely flexed and touching thumb, all
other fingers' joints are completely flexed to palm
"Olittle-Tund" thumb tucked under flexed index finger, all other fingers' joints
are completely flexed to palm
"Rhole" index and middle fingers are touching, and either the index or
middle finger is flexed to form a hole between them
"Tcross" thumb and index finger are touching and crossing each other,
base joint of index finger is flexed
"Wunspr" index, middle, and ring fingers are unspread and touching each
other, rather than spread as in "W"
"Y-MID" middle finger is fully extended, rather than flexed as in "Y"
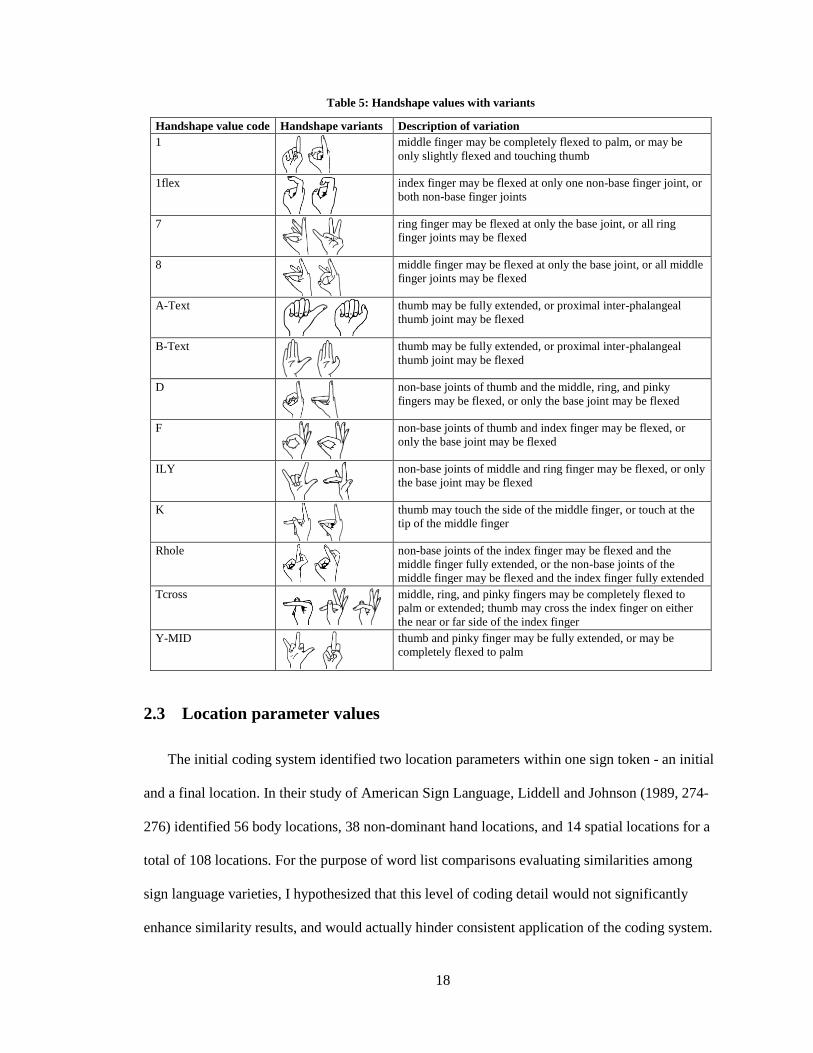
2.2.2 Identifying variants of a handshape parameter value
For some handshape values, one value may be used to code a variety of slight handshape
variations. In most of these cases, the variations were either not distinct enough to be clearly and
accurately distinguished in the video data (due to low video quality, poor lighting and
backgrounds, and only one camera angle perspective) or the handshape variation only occurred a
few times in the entire dataset and the value inventory would have been unnecessarily complex if
separate handshape values were identified and coded. Another reason for combining certain
handshape variations was that many participants appeared to have different physical variations in
the degree of flexing or extension possible in the thumb and finger joints. If the handshape
observed in the video data did not exactly match one of the handshape values in the inventory, the
most similar handshape value existing in the inventory was chosen to represent it. See Table 5 for
examples of how slight variations in handshapes were coded as one handshape value according to
the handshape value inventory.
18
Table 5: Handshape values with variants
Handshape value code Handshape variants Description of variation
1
middle finger may be completely flexed to palm, or may be
only slightly flexed and touching thumb
1flex
index finger may be flexed at only one non-base finger joint, or
both non-base finger joints
7
ring finger may be flexed at only the base joint, or all ring
finger joints may be flexed
8
middle finger may be flexed at only the base joint, or all middle
finger joints may be flexed
A-Text
thumb may be fully extended, or proximal inter-phalangeal
thumb joint may be flexed
B-Text
thumb may be fully extended, or proximal inter-phalangeal
thumb joint may be flexed
D
non-base joints of thumb and the middle, ring, and pinky
fingers may be flexed, or only the base joint may be flexed
F
non-base joints of thumb and index finger may be flexed, or
only the base joint may be flexed
ILY
non-base joints of middle and ring finger may be flexed, or only
the base joint may be flexed
K
thumb may touch the side of the middle finger, or touch at the
tip of the middle finger
Rhole
non-base joints of the index finger may be flexed and the
middle finger fully extended, or the non-base joints of the
middle finger may be flexed and the index finger fully extended
Tcross
middle, ring, and pinky fingers may be completely flexed to
palm or extended; thumb may cross the index finger on either
the near or far side of the index finger
Y-MID
thumb and pinky finger may be fully extended, or may be
completely flexed to palm
2.3 Location parameter values
The initial coding system identified two location parameters within one sign token - an initial
and a final location. In their study of American Sign Language, Liddell and Johnson (1989, 274-
276) identified 56 body locations, 38 non-dominant hand locations, and 14 spatial locations for a
total of 108 locations. For the purpose of word list comparisons evaluating similarities among
sign language varieties, I hypothesized that this level of coding detail would not significantly
enhance similarity results, and would actually hinder consistent application of the coding system.
19
At a lower level of distinction, a total of 62 locations were identified in Rozelle's study of four
distinct sign languages. Rozelle found 18 body locations and six spatial locations that were
common to all four languages. The location inventory sizes of each language ranged from 34 to
46 locations (Rozelle 2003).
The initial coding system of this study contained 31 values for the location parameters: 25
body locations, and six spatial locations. See Figure 3 for a diagram of the location values and
brief coding value descriptions written in parentheses.

20
Figure 3: Location parameter value inventory—25 body and 6 spatial location values
In Appendix B, Table 24 lists the 31 location values by the rank-frequency occurrence results
from the entire database, and Table 25 contains the rank-frequency results for both the initial and
final location parameters separately.
Location parameter values were based on the position of the dominant hand at the beginning
and end of a sign token. While coding location values, I focused on identifying where changes in

21
the speed of movement occurred. Word list items were usually elicited a few seconds apart so that
the participant's hands would come to a resting position between signs and the initial and final
locations would be easily observed. If the dominant hand remained in only one location
throughout a sign token, the same location parameter value was coded for both initial and final
location parameters. If a multimorphemic form was given for a particular item, or if several
variant forms were given in quick succession, and the dominant hand did not return to a resting
position between signs, coding judgments were made to predict the natural initial or final location
parameter value of each sign token. In some cases, due to video quality or camera angles, it was
difficult to determine if the dominant hand made contact with a body location. If the dominant
hand appeared to be near a body location, but the video data was not conclusive on whether
contact was made or not, I coded the body location rather than the spatial location.
In some cases, when the dominant hand made contact with only one body location and the
movement was repetitive, it was difficult to decide if the body location value should be coded as
the initial or final location parameter. See Figure 4 for two examples of this situation. In the sign
for “church”, “SHand” (the side of the non-dominant hand) would be coded as a final location; in
the sign for “paper”, “Palm” (the palm of the non-dominant hand) would be coded as the initial
location.

22
Figure 4: Examples of body contact coded as initial or final location parameter
To differentiate the body contact location as the initial or final location between these two
examples, the acceleration of the dominant hand movement before and after contact with the
body location was observed to determine the parameter choice. In the sign for “church”, the
dominant hand accelerated just prior to body contact, so the body contact location value “SHand”
(side of hand) was coded in the final location parameter and “SN” (neutral space) was coded in
the initial location parameter. In the sign for “paper”, the dominant hand began to accelerate just
after making contact with the body location, so the body location “Palm” was coded in the initial
location parameter and “SN” (neutral space) in the final location parameter. The assumption
underlying both judgments is that motion normally accelerates during the course of a sign’s
movement: movements that decelerate or are slower are regarded as transitional movements, not
part of the lexical specification of the sign.
In a two-handed sign, if the hands made contact, the body location value at the point of
contact on the non-dominant hand was coded for the location parameter. However, in two
situations, contact with the non-dominant hand was not considered the most salient location value
of the sign token. In the first situation, the non-dominant hand was not coded as a location
parameter if it made contact with the arm of the dominant hand at a point closer to the body than

23
the wrist area. In the second situation, the dominant hand made contact with the non-dominant
hand while the non-dominant hand was lying against a head or torso body location. Figure 5
shows examples of these situations.
Figure 5: Location coding examples where non-dominant hand contact is disregarded
In the sign for "tree", the location parameters would not be coded as “Palm” (palm of non-
dominant hand), even though the palm of the non-dominant hand touch the elbow of the arm of
the dominant hand. Instead, both the initial and final location parameter values would be coded as
"SN" (neutral space) - the location of the dominant hand. In the sign for "sleep", the body location
“Cheek” would be coded rather than the location of contact with the non-dominant hand “Palm”.
In both of these examples, the non-dominant hand was not judged as the most salient location
value: the non-dominant hand was relatively distant from the location of the dominant hand, or
contact was made with a more central body location value.
2.4 Joint movement parameter values
According to Sandler and Lillo-Martin (2006, 197), path and internal movements are "the
main kinds of movement found in lexical signs." Path movements can be characterized into one
of four main types: straight, arc, "7", and circle movements; and internal movements come from
24
changes in the handshape or palm orientation (Sandler and Lillo-Martin 2006, 197). In the initial
coding system, I did not categorize these two movement types directly, but they were represented
indirectly by the combination of two movement parameters: the joint movement parameter and
the palm orientation change parameter. In addition, some aspects of movement were represented
indirectly by coding both the initial and final positions of the handshape and location parameters.
This section focuses on the joint movement parameter, and in section 2.5 I discuss the palm
orientation change parameter.
Five joint movement parameter values were identified for the initial coding system: Fingers,
Wrist, Elbow, Shoulder, and Hold (no movement at all). Hand-internal movements would usually
be coded as "Fingers" or "Wrist", and path movements would be coded as "Elbow" or "Shoulder".
When more than one joint was moving, the smallest (most distal) joint was encoded. This resulted
in the following parameter value sequence based on coding priority: Fingers > Wrist > Elbow >
Shoulder. In Appendix B, Table 27 lists the five joint movement features according to rank-
frequency from the entire database.
The joint movement parameter value would automatically be coded as "Fingers" if the initial
and final handshape parameter values had been coded with different values. However, joint
movement would also be coded as "Fingers" if the fingers only slightly wiggled or trilled while
maintaining the same handshape value. See the sign for "colors" in Figure 6 for an example.

25
Figure 6: Joint movement parameter coding example for "Fingers" value
The sign for "yes" shown in Figure 7 is an example of a sign where the joint movement
parameter would be coded as "Wrist".
Figure 7: Joint movement parameter coding example for "Wrist" value
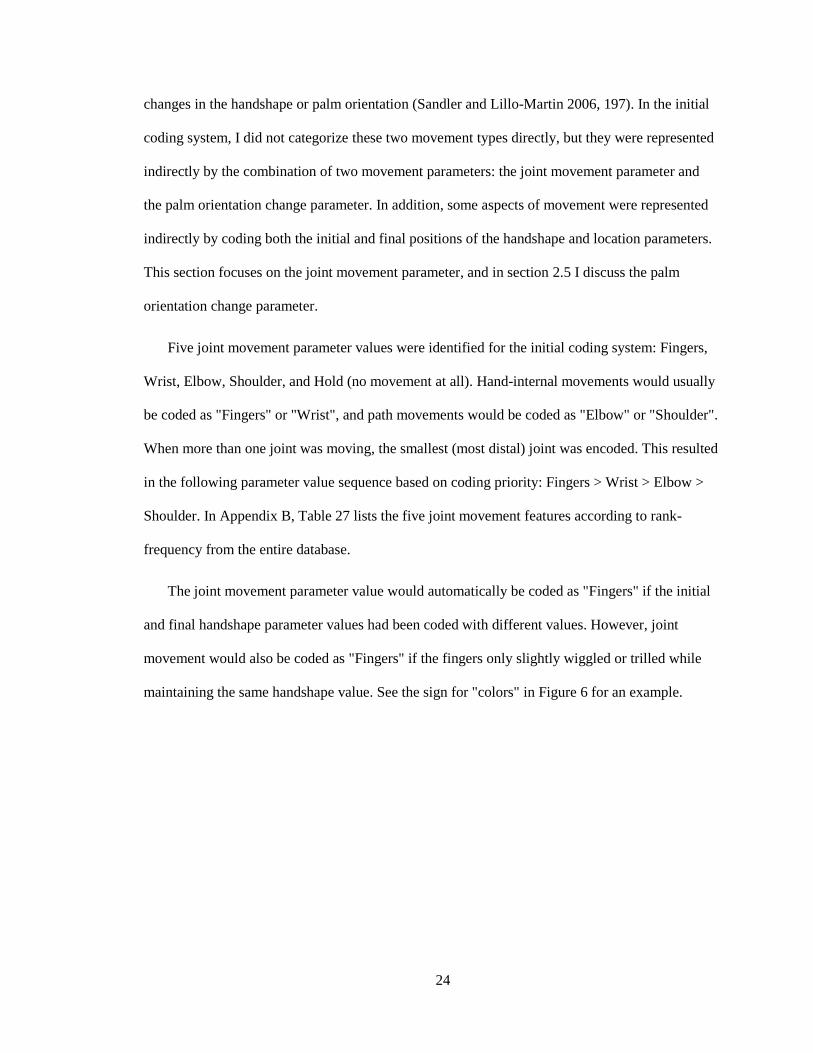
The sign for "never" shown in Figure 8 is an example of a sign where the joint movement
parameter would be coded as "Elbow".
26
Figure 8: Joint movement parameter coding example for "Elbow" value
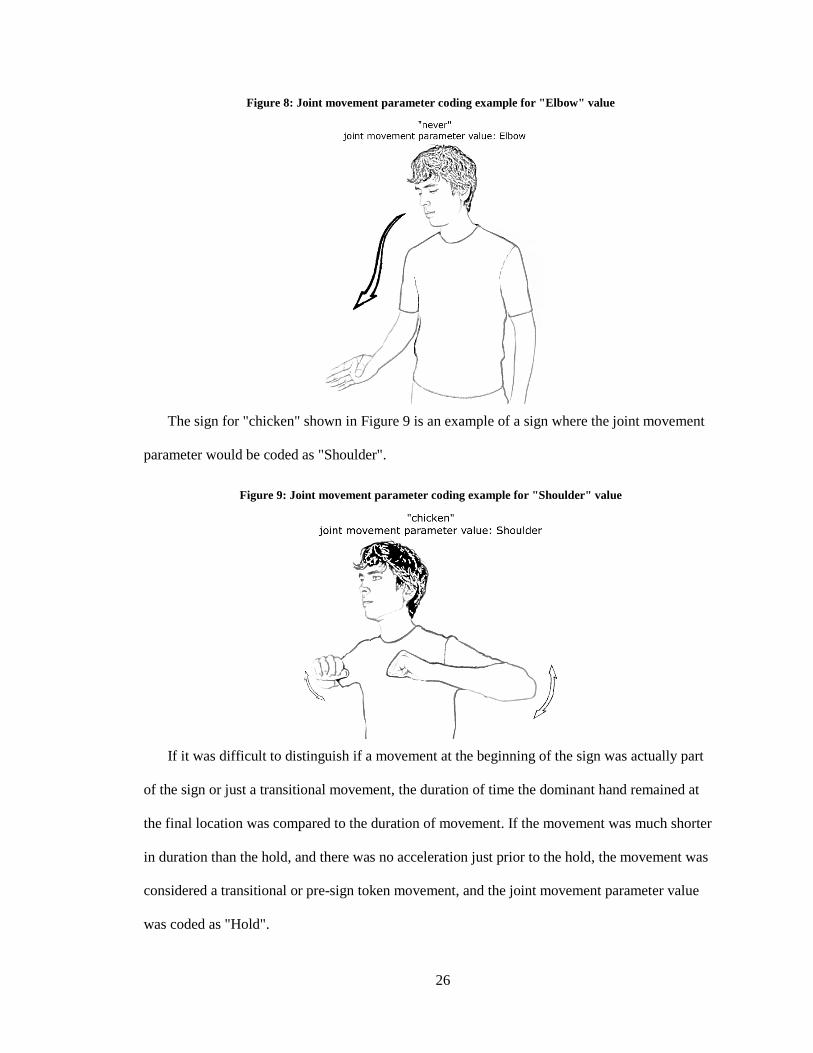
The sign for "chicken" shown in Figure 9 is an example of a sign where the joint movement
parameter would be coded as "Shoulder".
Figure 9: Joint movement parameter coding example for "Shoulder" value
If it was difficult to distinguish if a movement at the beginning of the sign was actually part
of the sign or just a transitional movement, the duration of time the dominant hand remained at
the final location was compared to the duration of movement. If the movement was much shorter
in duration than the hold, and there was no acceleration just prior to the hold, the movement was
considered a transitional or pre-sign token movement, and the joint movement parameter value
was coded as "Hold".
27
2.5 Palm orientation parameter values
The palm orientation parameter categorized movement as one of two parameter values. If the
palm orientation of the dominant hand changed by 45 degrees or more among any two positions
in the entire sign token, the parameter was coded with the "P+" value. If the dominant hand palm
orientation did not change by at least 45 degrees, the parameter was coded with the "P-" value. In
Appendix B, Table 26 shows the two palm orientation change values in order of rank-frequency
from the entire database.
28
CHAPTER 3
PROCEDURE
The coding system described in the previous chapter was applied to word list video data that
was collected and archived by SIL International sign language survey teams between November
2007 and January 2010. The video data set represents 50 sign language varieties from 13
countries, mostly in Latin America and the Caribbean. Most word lists contained 241 lexical
items. In this section, I discuss the participants, word list elicitation procedure, coding procedure,
and how similarities among language varieties were calculated using the Levenshtein distance
metric.
3.1 Participants
In various regions of each country, deaf community members encountered at deaf association
or club gatherings, schools, and religious meetings volunteered to participate in the study. As
much as possible, the survey teams screened participants to elicit word lists from people who
were active members of the deaf community, were deaf or hard of hearing, had grown up in the
elicitation city region, and had not traveled internationally. Within a country or region, the survey
team tried to include an equal representation of both males and females and younger and older
generations. Using these guidelines, the participants of this study are fairly reliable
representatives of their sign language communities. Although most of the word lists represent
sign language varieties from Latin America and the Caribbean, word lists from the United States
were included since American Sign Language has had a wide influence in much of the Americas.
Word lists from Ireland and Northern Ireland were also included since I wanted to see what type
29
of similarity scores would be calculated between sign language varieties that were generally
considered to be quite different and had relatively less historical connections with varieties in the
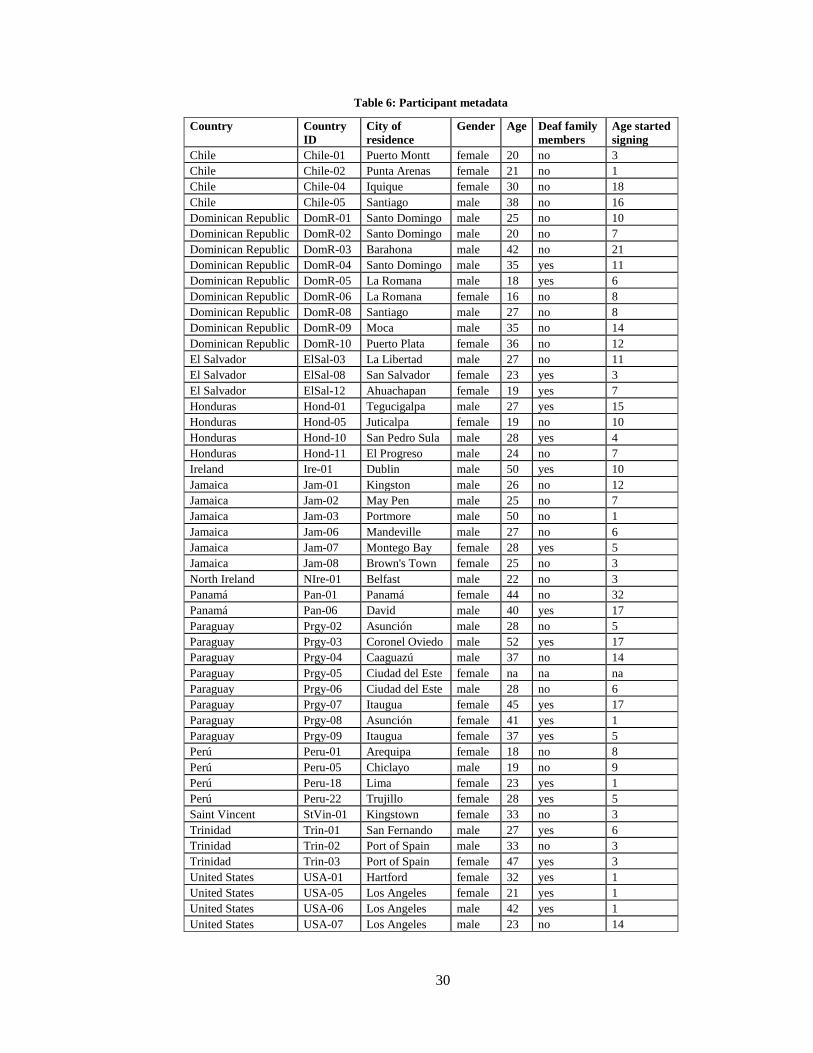
Americas. Some basic metadata of the 50 participants representing 13 countries are listed
alphabetically by country in
Table 6.
30
Table 6: Participant metadata
Country Country
ID
City of
residence
Gender Age Deaf family
members
Age started
signing
Chile Chile-01 Puerto Montt female 20 no 3
Chile Chile-02 Punta Arenas female 21 no 1
Chile Chile-04 Iquique female 30 no 18
Chile Chile-05 Santiago male 38 no 16
Dominican Republic DomR-01 Santo Domingo male 25 no 10
Dominican Republic DomR-02 Santo Domingo male 20 no 7
Dominican Republic DomR-03 Barahona male 42 no 21
Dominican Republic DomR-04 Santo Domingo male 35 yes 11
Dominican Republic DomR-05 La Romana male 18 yes 6
Dominican Republic DomR-06 La Romana female 16 no 8
Dominican Republic DomR-08 Santiago male 27 no 8
Dominican Republic DomR-09 Moca male 35 no 14
Dominican Republic DomR-10 Puerto Plata female 36 no 12
El Salvador ElSal-03 La Libertad male 27 no 11
El Salvador ElSal-08 San Salvador female 23 yes 3
El Salvador ElSal-12 Ahuachapan female 19 yes 7
Honduras Hond-01 Tegucigalpa male 27 yes 15
Honduras Hond-05 Juticalpa female 19 no 10
Honduras Hond-10 San Pedro Sula male 28 yes 4
Honduras Hond-11 El Progreso male 24 no 7
Ireland Ire-01 Dublin male 50 yes 10
Jamaica Jam-01 Kingston male 26 no 12
Jamaica Jam-02 May Pen male 25 no 7
Jamaica Jam-03 Portmore male 50 no 1
Jamaica Jam-06 Mandeville male 27 no 6
Jamaica Jam-07 Montego Bay female 28 yes 5
Jamaica Jam-08 Brown's Town female 25 no 3
North Ireland NIre-01 Belfast male 22 no 3
Panamá Pan-01 Panamá female 44 no 32
Panamá Pan-06 David male 40 yes 17
Paraguay Prgy-02 Asunción male 28 no 5
Paraguay Prgy-03 Coronel Oviedo male 52 yes 17
Paraguay Prgy-04 Caaguazú male 37 no 14
Paraguay Prgy-05 Ciudad del Este female na na na
Paraguay Prgy-06 Ciudad del Este male 28 no 6
Paraguay Prgy-07 Itaugua female 45 yes 17
Paraguay Prgy-08 Asunción female 41 yes 1
Paraguay Prgy-09 Itaugua female 37 yes 5
Perú Peru-01 Arequipa female 18 no 8
Perú Peru-05 Chiclayo male 19 no 9
Perú Peru-18 Lima female 23 yes 1
Perú Peru-22 Trujillo female 28 yes 5
Saint Vincent StVin-01 Kingstown female 33 no 3
Trinidad Trin-01 San Fernando male 27 yes 6
Trinidad Trin-02 Port of Spain male 33 no 3
Trinidad Trin-03 Port of Spain female 47 yes 3
United States USA-01 Hartford female 32 yes 1
United States USA-05 Los Angeles female 21 yes 1
United States USA-06 Los Angeles male 42 yes 1
United States USA-07 Los Angeles male 23 no 14
31
3.2 Elicitation procedure
With each of these participants, a word list containing up to 243 items was elicited using a
Powerpoint presentation on a notebook computer. One video camera was set up directly in front
of the participant, and index cards were inserted into the camera view between each Powerpoint
slide to visually identify each word list item in the video. The elicitation slides for each item
usually contained both written spoken language words (either in English or Spanish depending on
the most common spoken language of the region) and an image. For all but 41 items that were
difficult to accurately represent visually, the slides included images since the visual
representations tended to help facilitate accurate elicitations, and written English or Spanish
literacy was often low in the deaf communities. For 40 items that had clearly opposite or
contrasting concepts, two contrasting images were included in the slide with an arrow to identify
which item was being elicited. As in the study by Osugi et al. (1999, 92), the survey teams found
this comparison technique of contrasting concepts to be effective and easily understood by
participants during elicitations. Similar to the approach of Parkhurst and Parkhurst (2007, 11),
participants were encouraged to include any variants or synonyms for each item to try to avoid
the problem outlined by Rensch (1992, 13) where similar forms actually existed among sign
varieties, but the similar forms did not happen to be elicited.
A basic set of 241 items were included in most word lists in this study. The list contained
lexical items from a variety of grammatical word classes (nouns, verbs, adjectives, quantifiers,
interrogatives, and others) and semantic domains (animals, food, household items, weather, time,
family, numbers, physical characteristics, religious items, emotions, physical activities, and
others). In comparison to previous word list comparison studies, the items of this study most
closely resemble the items used by Bickford (2005, 34-37). Two additional items were included
in the four Peru word lists. For two of the 50 word lists not all of the items were elicited: the
Prgy-07 word list contains only the first 112 items, and the Hond-01 word list contains only the
32
first 215 items from the 241-item list. One United States word list (USA-01) contains 210 items
elicited in a slightly different order than the others. See Table 20 in Appendix A for a list of the
word list items in the order that they were typically elicited.
From all 50 participants, a combined total of 15,720 sign tokens were elicited from 11,831
item elicitations. For 73% of the item elicitations, only one sign token was elicited; due to
multimorphemic forms or multiple variants for one item, two sign tokens were elicited for 22% of
the items, and 5% of the items prompted three or more sign tokens.
3.3 Word list video data coding procedure
The word list videos were annotated using the ELAN media annotation software (Max Planck
Institute for Psycholinguistics 2011). An ELAN template was used with eight tiers. The first tier
labeled “gloss” was created as a parent tier with a controlled vocabulary containing the word list
items. Six dependent tiers were created corresponding to the six parameters to be coded: initial
handshape, final handshape, initial location, final location, palm orientation change, and joint
movement. Controlled vocabularies containing the parameter values were created for each of
these tiers so that coding errors due to typing or spelling would be avoided, and the parameter
values could be easily accessed from a drop-down menu. An eighth tier was created for
comments to mark items that may be of interest in future studies: fingerspelling, notes on
elicitation misunderstandings (homonyms, copying or describing the elicitation image), and
marking variants for sociolinguistic variables if an explanation was given (variants based on
region, gender, age, etc.). A screenshot of coding sign token parameters in ELAN is shown in
Figure 10.

33
Figure 10: Annotating word list videos using ELAN
If the participant did not recognize the item being elicited and gave no sign, the sign was
coded as “xxx” for all parameters. If a sign or phrase was elicited, but it was an obvious
misunderstanding of the item due to written language homonyms or an unclear elicitation image,
the sign was coded as “???”. If participants only described an item or the elicitation image, and
the explanatory signs were clearly not meant to represent the lexical item, these signs were coded
as "???". In the analysis, if parameters were coded as “xxx” or “???” that item was omitted from
comparisons.

34
3.4 Assessing similarity using Levenshtein distance
The algorithm used in this study to calculate similarity among sign language varieties is
called the Levenshtein distance (string edit distance) metric. In essence, it measures the amount of
difference between lexical items by calculating the differences in strings.
In contrast to Blair's approach of assessing lexical similarity in which pairs of words are
considered to be similar or not similar, Levenshtein distance measurements provide a more
nuanced assessment of how different the words are. In addition, Levenshtein distance calculations
can be rapidly and objectively calculated by computer programs without the need for a research
analyst to make pair by pair similarity judgments.
In this section, I describe how Levenshtein distance calculations are made, how they have
been applied to spoken language studies, and how they were applied in this study.
3.4.1 Calculating Levenshtein distance
In spoken languages, in preparation for Levenshtein distance calculations, each phonetic
segment of a word is assigned a unique character code, typically symbols in the International
Phonetic Alphabet. Depending on the level of distinction desired in the comparison, these codes
could include diacritics. Once each word is represented as a string of characters representing the
individual phonetic segments, pairs of character strings are compared to assess the difference (or
Levenshtein distance) between the lexical items. Levenshtein distances are calculations of the
minimum (most efficient) number of edits that would be necessary to make two character strings
identical. There are three possible types of edits that may be necessary: insertions, deletions, and
substitutions. The Levenshtein distance (sum of edits) is usually normalized by length to correct
skewing that would occur in the calculation of average Levenshtein distances based on word
length. If only the raw number of edits were averaged to calculate Levenshtein distance, longer
words would have larger influence on distances than shorter words. Normalization by length can

35
be done a variety of ways, Heeringa et al. (2006, 53) recommend dividing the number of edits by
the length of the longest alignment between the two words. Consequently, the normalized
Levenshtein distance between words from two different language varieties could range from zero
(identical character strings) to one (completely different strings) for each lexical item. If a word
list contains multiple variants for one lexical item, the Levenshtein distance would be the average
distance of all comparisons of variants for each word list pair. The Levenshtein distance between
two language varieties for an entire word list is the average of the distances calculated for each
word list item.
As an example of how Levenshtein distance would be calculated between two forms in a
spoken language, Table 7 shows the edits needed to change one pronunciation/form of
"afternoon" in English (æǝftǝnʉn) to another pronunciation/form (æftǝrnun) (White 2010, 4).
Table 7: Levenshtein distance between two pronunciations of "afternoon"
Beginning form Edit Resulting form
æǝftǝnʉn delete ǝ æftǝnʉn
insert r æftǝrnʉn
substitute ʉ /u æftǝrnun
Levenshtein distance (number of edits) = 3
Levenshtein distance (normalized) = 3/8 = 0.375
In contrast to this example where the Levenshtein distance between the two forms is 0.375, a
Blair style lexical similarity judgment would only have two possible values: similar or not
similar, and the two forms from Table 7 would be considered as similar since six of the eight
phones are identical.
Over the last decade, several studies have analyzed differences among language varieties
using Levenshtein distance. Investigating Nisu language varieties spoken in Yunnan, China, Yang
(2009) found that Levenshtein distance results complemented the findings of historical-
comparative analysis and had a high correlation with intelligibility testing results. According to
Yang (2009, 28), while comparative analysis identifies specific differences and intelligibility tests
36
reveal the effect of the differences on comprehension, Levenshtein distances "clarify the degrees
of difference between varieties”.
3.4.2 Levenshtein distance applied to sign language word list comparisons
To calculate Levenshtein distances for sign language data, the value for each of the six
parameters coded for a sign token is assigned a single character, and the six parameters are
treated as if they were a phonetic spelling by arranging them in a fixed sequence. For the initial
coding system of six parameters, each sign token was represented as a string of six characters.
Since all sign tokens were coded with the same number of parameters, there were no edits due to
insertions or deletions; the calculation of necessary edits to a character string were only based on
substitutions (when parameter values were not identical for a given pair of forms).
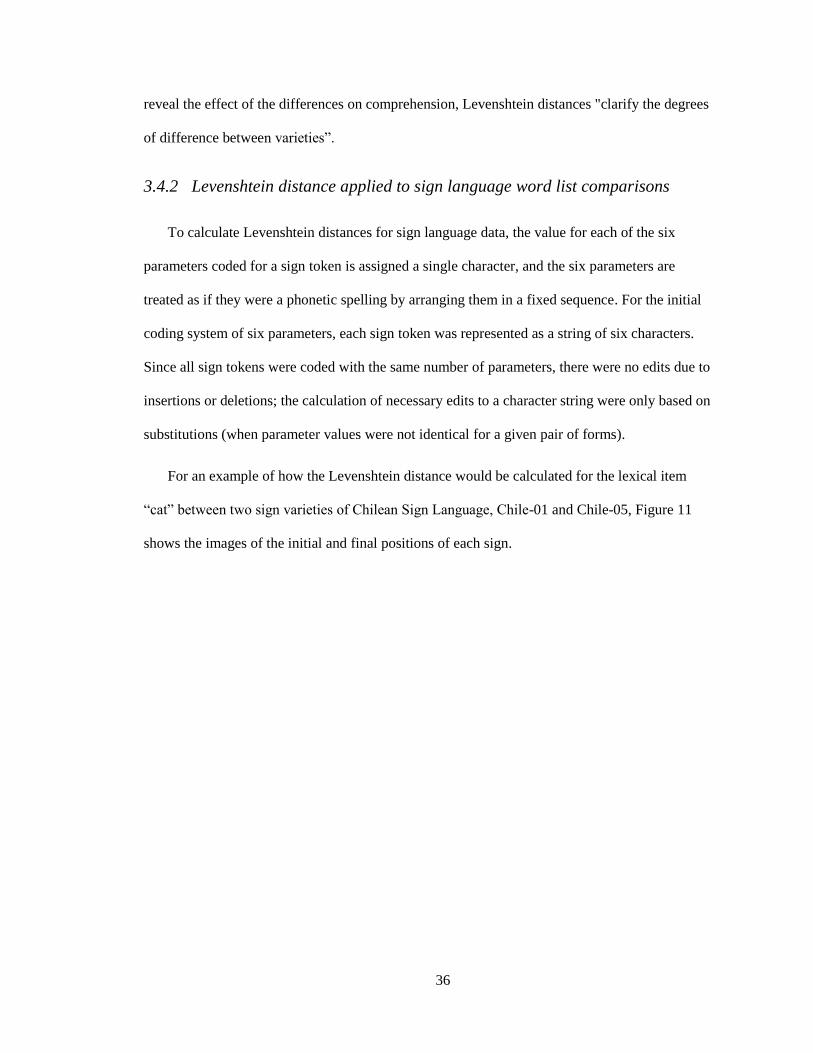
For an example of how the Levenshtein distance would be calculated for the lexical item
“cat” between two sign varieties of Chilean Sign Language, Chile-01 and Chile-05, Figure 11
shows the images of the initial and final positions of each sign.
37
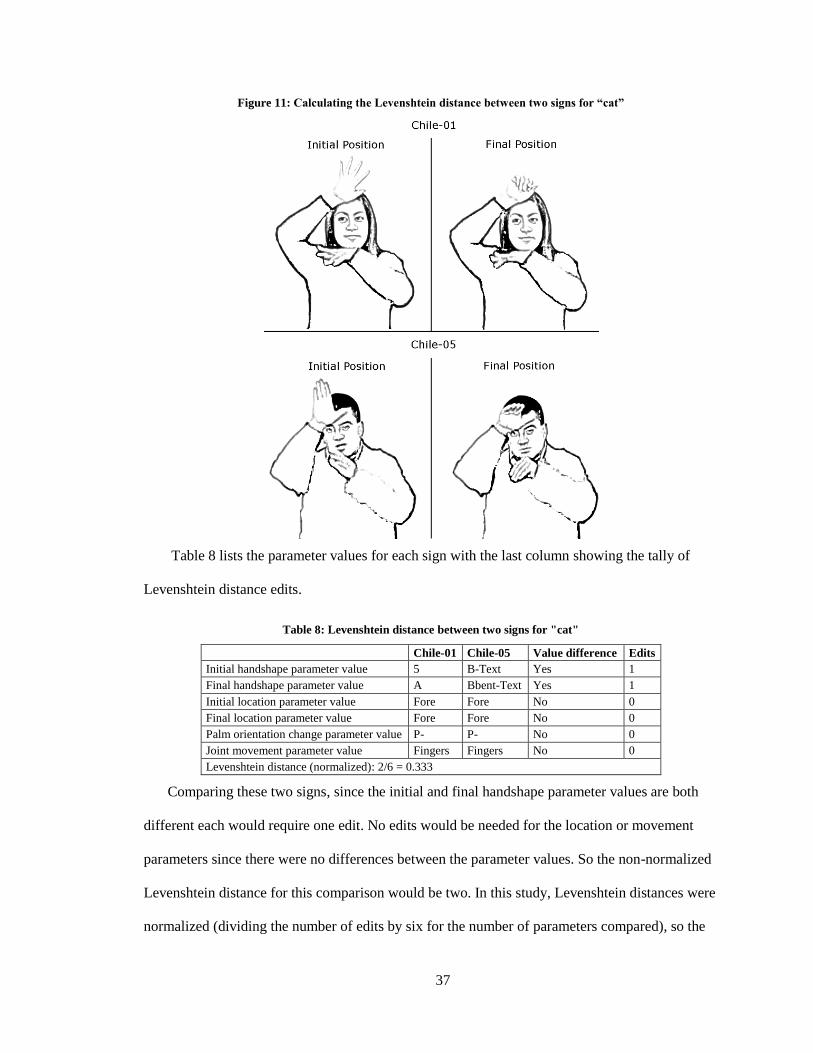
Figure 11: Calculating the Levenshtein distance between two signs for “cat”
Table 8 lists the parameter values for each sign with the last column showing the tally of
Levenshtein distance edits.
Table 8: Levenshtein distance between two signs for "cat"
Chile-01 Chile-05 Value difference Edits
Initial handshape parameter value 5 B-Text Yes 1
Final handshape parameter value A Bbent-Text Yes 1
Initial location parameter value Fore Fore No 0
Final location parameter value Fore Fore No 0
Palm orientation change parameter value P- P- No 0
Joint movement parameter value Fingers Fingers No 0
Levenshtein distance (normalized): 2/6 = 0.333
Comparing these two signs, since the initial and final handshape parameter values are both
different each would require one edit. No edits would be needed for the location or movement
parameters since there were no differences between the parameter values. So the non-normalized
Levenshtein distance for this comparison would be two. In this study, Levenshtein distances were
normalized (dividing the number of edits by six for the number of parameters compared), so the
38
normalized Levenshtein distance would be 2/6 = 0.333. In comparison, for a Blair style lexical
similarity criteria requiring at least two of three parameters (handshape, location, and movement)
to be identical for signs to be categorized as similar, these two signs for “cat” would be
considered as similar.
In Levenshtein distance calculations that involve more than one sign token per word list item,
the resulting Levenshtein distance is the mean of Levenshtein distances between every possible
combination of sign tokens. For example, if variety A is coded for two sign tokens (A1 and A2)
for word list item X, and variety B is coded for three sign tokens (B1, B2, and B3). The
Levenshtein distance between varieties A and B for item X would be the average of distances
between A1 and B1, A1 and B2, A1 and B3, A2 and B1, A2 and B2, and A2 and B3.
The Levenshtein distances of this study were calculated using the SLLED and Rugloafer
software programs developed by White (2011). The word list parameter data was first exported as
interlinear text from ELAN. Then, the SLLED software served as a converter program where
parameter values for an item were assigned a single character and arranged in a fixed sequence.
The SLLED software allows the user to select which of the six parameters are to be included in a
comparison if a subset of the six parameters is desired. The SLLED software outputs the
converted word list data as an XML file which is the input format required by Rugloafer. The
Rugloafer software acts as a front end for the various features of the RuG/L04 software suite for
dialectometrics and cartography primarily developed by Kleiweg (2011) which includes the
calculations of the Levenshtein distance between variety pairs.
While Levenshtein distance can calculate similarities between pairs of language varieties, the
results can also be used to group many language varieties into clusters based on similarities. In
the "Preferences" menu of the Rugloafer software, there are several clustering algorithm options
available for selection. For this study, I used the agglomerative clustering method called the
unweighted pair-group method using the average approach (UPGMA) which uses a proximity
39
matrix to cluster varieties and calculate the Levenshtein distances between clusters. In the
UPGMA method, the distance between language variety clusters is the "average distance between
pairs of objects, one in one cluster, one in the other", and "tends to join clusters with small
variances" and be "relatively robust" (Everitt, Landau, and Leese 2001, 60). For example, if two
varieties (X1 and X2) are grouped together at a Levenshtein distance of 0.40, and two varieties
(Y1 and Y2) are grouped together at a Levenshtein distance of 0.45, and the four varieties are
grouped together as a cluster at a larger Levenshtein distance (e.g. 0.53), this Levenshtein
distance for the grouping of X and Y would be calculated as follows: calculate the average
distance between varieties X1 and Y1, and X1 and Y2 (e.g. mean Levenshtein distance of X1 to
Y = 0.50), then calculate the average distance between varieties X2 and Y1, and X2 and Y2 (e.g.
mean Levenshtein distance of X2 to Y = 0.56). The Levenshtein distance of the cluster of X and
Y would be the average of the two distances: 0.50 + 0.56, divided by 2 = 0.53.
40
CHAPTER 4
RESULTS
While analyzing the results, I had a four-point research focus: 1) to calculate the degrees of
difference among the sign language varieties and produce a dendrogram showing these
relationships, 2) to assess the validity of the results by determining the correlation between word
list comparison and intelligibility testing results, 3) to evaluate the coding system parameters and
value inventories in order to refine and optimize the comparison methodology, and 4) to evaluate
and refine the set of word list items to elicit for comparisons. In this chapter, I present the results
of each of the four points in the analysis.
4.1 Identifying similarity groupings based on Levenshtein distance results
The dendrogram in
Figure 12 displays the Levenshtein distance similarity groupings for all 50 sign language
varieties comparing the six parameters and parameter value inventories of the initial coding
system. In the dendrogram, an output of the Rugloafer software, word list pairs and groupings are
linked by vertical lines—the position of these lines in the horizontal x-axis correspond to the
average Levenshtein distance among the varieties in the cluster. The number of shades for
clusters in the dendrogram is based on a number chosen in the Rugloafer software preferences
prior to similarity calculations to help distinguish the similarity groupings.

41
Figure 12: Dendrogram of Levenshtein distance similarity groupings based on six parameters
In general, the formation of sign language variety similarity clusters based on Levenshtein
distances groups varieties most clearly by countries. This general grouping pattern confirms the
Levenshtein distance results. One would expect sign language varieties from the same country to
be more similar to each other than to sign varieties from other countries (due to increased

42
language contact, shared deaf educational settings and places of learning sign language, and
shared historical influences). As expected based on known historical connections, the varieties
from Ireland and Northern Ireland are the most different from any of the varieties in the
Americas.
The Levenshtein distance numerical results corresponding to the vertical lines that connect
varieties in the dendrogram are listed in Table 9. The variety groupings are listed from top to
bottom from most to least similarity. The Levenshtein distances listed in the right column
correspond to the average Levenshtein distance among the varieties included in the cluster as
calculated by the unweighted pair-group method clustering algorithm. These same Levenshtein
distances are used to create the dendrogram shown in
Figure 12 and correspond to the positions on the x-axis where varieties are linked by a
vertical line.
Table 9: Levenshtein distances of variety groupings based on the six parameters of the initial coding system
Variety groupings Levenshtein distance
Honduras (H) 0.341
United States (U) 0.348
Jamaica (J) + St. Vincent (S) 0.383
U + JS 0.401
Chile (C) 0.417
Trinidad (T) 0.419
Panama (Pan) 0.426
UJS + T 0.438
Peru (Pe) 0.442
El Salvador (E) 0.458
Dominican Republic (D) 0.464
H + Pan 0.476
UJST + D 0.492
Paraguay (Par) 0.506
UJSTD + HPan 0.513
UJSTDHPan + Pe 0.536
UJSTDHPanPe + E 0.552
C + Par 0.572
UJSTDHPanPeE + CPar 0.626
Northern Ireland (NI) + Republic of Ireland (RI) 0.643
UJSTDHPanPeECPar + NIRI 0.666

43
The purpose for the different shades of similarity clusters is not to identify or classify distinct
sign languages but rather to visually separate and distinguish sign variety groupings. Defining the
difference between languages and dialects is a bold and complicated endeavor that is beyond the
scope of this study. Consequently, although the Jamaica, Saint Vincent, Trinidad, and United
States sign varieties are all in the same shaded cluster and the Levenshtein distance of this group
is less than the Levenshtein distance within the groups for most of the other countries, the
Levenshtein distance grouping results do not alone prove that these language varieties should all
be considered dialects of one sign language without agreement from other sociolinguistic research
tools. Even so, these similarity results could be used as a basis for preliminary grouping of
varieties into languages as long as there is a full awareness that they are only based on the
similarities of lexical items. In combination with other sociolinguistic research tools, this study
could contribute to the discussion of identifying sign languages and dialects that should also
include other factors such as historical influences, language attitudes and identity, and
intelligibility. Intelligibility testing results of Jamaican and Dominican Republic participants
towards a United States sign language variety are discussed in more detail in section 4.2. In
support of making preliminary language groupings based on Levenshtein distances, a study of
spoken language varieties in Central Asia found that similarity groupings “perform well in the
preliminary classification of varieties even when the dataset includes unrelated varieties” (van der
Ark et al. 2007, 7).
Following the pattern of many lexical similarity studies, it may be tempting to propose
thresholds of Levenshtein distances among sign varieties that would predict intelligibility or
language groupings. However, thresholds may not be consistently applicable. Hendriks (2008,
37) found that lexical similarity scores among what were considered to be similar sign languages
were lower than the common thresholds used to predict language groupings for spoken languages.
In another word list comparison study evaluating how changes in scoring criteria effect similarity

44
results, Kluge (2008) recommends focusing more on the relative relationships rather than
absolute scores and thresholds when making conclusions about language similarities and
proposing directions for future research. Without including other related research findings, it is
difficult at this point to propose an accurate Levenshtein distance threshold that could be used to
predict language groupings. First, Levenshtein distance results would need to be calibrated
against known situations, and then the proposed thresholds would need to be adjusted based on
the scoring criteria used.
4.2 Validity of Levenshtein distance results
The Levenshtein distance results seem to produce a distinct representation of the similarities
among the 50 sign language varieties. To assess the validity of these results, I will discuss a few
observations with corresponding factors that reinforce the accuracy of the similarity groupings. I
will also compare the Levenshtein distances with intelligibility testing results between speakers of
sign languages in the United States, Jamaica, and the Dominican Republic.
In examining the results, there are anecdotal factors that support the similarity groupings.
First, there is a relatively large difference between one Paraguayan sign language variety (Prgy-
07) and the other seven Paraguayan varieties. Actually, the Prgy-07 participant represented a deaf
community that was perceived by others in the country to use a unique sign variety. If we
excluded Prgy-07 from the comparison, the Paraguayan varieties would be grouped at a
Levenshtein distance of 0.420 rather than 0.506. In another observation, three Jamaica sign
varieties are more similar to the St. Vincent variety than to other three varieties from Jamaica. As
an explanation, during fieldwork in St. Vincent, the survey team was told that deaf people from
St. Vincent (including the word list participant) have had frequent contact with deaf people from
Jamaica. The Levenshtein distance results suggest that this contact was with only a subset of the
Jamaican deaf population. The grouping of the Honduras varieties (0.341) and the grouping of the
45
United States varieties (0.348) show the least amount of variation of any grouping of language
varieties within a country. This may reflect the use of a more highly standardized sign language
in these two countries than in the other countries in this study. At least in the United States, there
are by far the most published materials relating to sign languages of any of the countries of this
study. This would contribute to standardization despite the relatively large deaf population and
land area of the country. The dendrogram placed the sign varieties from Chile and Paraguay as
the most different from the other varieties in the Americas. From a subjective perspective, the
survey team members fluent in American Sign Language had more difficulty negotiating meaning
with deaf people in Chile and Paraguay than with deaf people from the other countries
represented in this study from the Caribbean, Central America, and South America.
The groupings of varieties within a country that have the largest Levenshtein distances (the
Dominican Republic: 0.464, El Salvador: 0.458, and Peru: 0.442 - excluding Prgy-07 from the
Paraguay varieties) may be a result of one or more of the following three factors: 1) deaf
educational institutions that are relatively less integrated on a national level than other countries,
2) historical influences that have caused greater diversity in sign varieties, and 3) less mobility
and interaction among regional deaf communities. Each of these factors was observed to some
extent by the survey teams during fieldwork in these three countries. The Dominican Republic, El
Salvador, and Peru all had a few deaf schools that were run by the government and at least one
deaf school that was privately run by a mission organization from the United States - usually
using a sign variety more similar to ASL than the sign varieties of the government run schools
(Williams and Parks 2010; Parks and Parks 2010a).
A limited set of intelligibility testing results also correlate with the Levenshtein distance
results. Intelligibility testing is intended to determine the degree to which users of one language
variety will understand users of another variety. Intelligibility is often assessed by a methodology
called Recorded Text Testing (RTT). In the traditional RTT methodology described by Casad

46
(1974), after listening to a portion of a recorded text, participants responded to questions about
the text which were evaluated to assess how much was understood. A modification to this
methodology using the retelling method (RTT-R) rather than asking questions is described by
Kluge (2007). In an RTT-R, a text is played for participants and the participants are asked to
retell the text. RTT-R scores are determined based on the percentage of pre-selected data points
from the text that were included in the retelling by the participant.
Intelligibility of an American Sign Language narrative video text was evaluated in the
Dominican Republic and Jamaica using a methodology similar to a recorded text test retelling
method (RTT-R) (Parks and Parks 2010b). The text was elicited and hometown tested in Tucson,
Arizona. Testing of this text was conducted by the SIL Americas Area sign language survey team
in three locations: Los Angeles, California (to approximate the higher end of scores we might
expect from similar language varieties from the same country as the storyteller), Jamaica, and the
Dominican Republic. The mean RTT-R score from each of the three locations was compared to
the mean Levenshtein distance among all word list pairs between each country. The number of
data points for each research instrument, the mean Levenshtein distances and RTT-R scores, and
the standard deviations from the mean are shown in Table 10.
Table 10: Levenshtein distances and RTT-R intelligibility scores for three country comparisons
RTT-R and
Levenshtein distance results
Within
United States
Jamaica to
United States
Dominican Republic
to United States
RTT-R data points 7 9 11
Mean RTT-R score 87.4% 74.6% 55.9%
RTT-R standard deviation 7.1% 17.6% 15.8%
Levenshtein distance data points 6 24 36
Mean Levenshtein distance 0.337 0.415 0.520
Levenshtein distance standard deviation 0.025 0.040 0.039
The correlation results show a linear negative relationship (r = -1.000, p = 0.014) between
RTT-R intelligibility testing results and Levenshtein distances (a negative or positive correlation
coefficient near 1.00 shows a strong relationship between the results). These results must be
interpreted with caution since the intelligibility results only go in one direction (understanding of
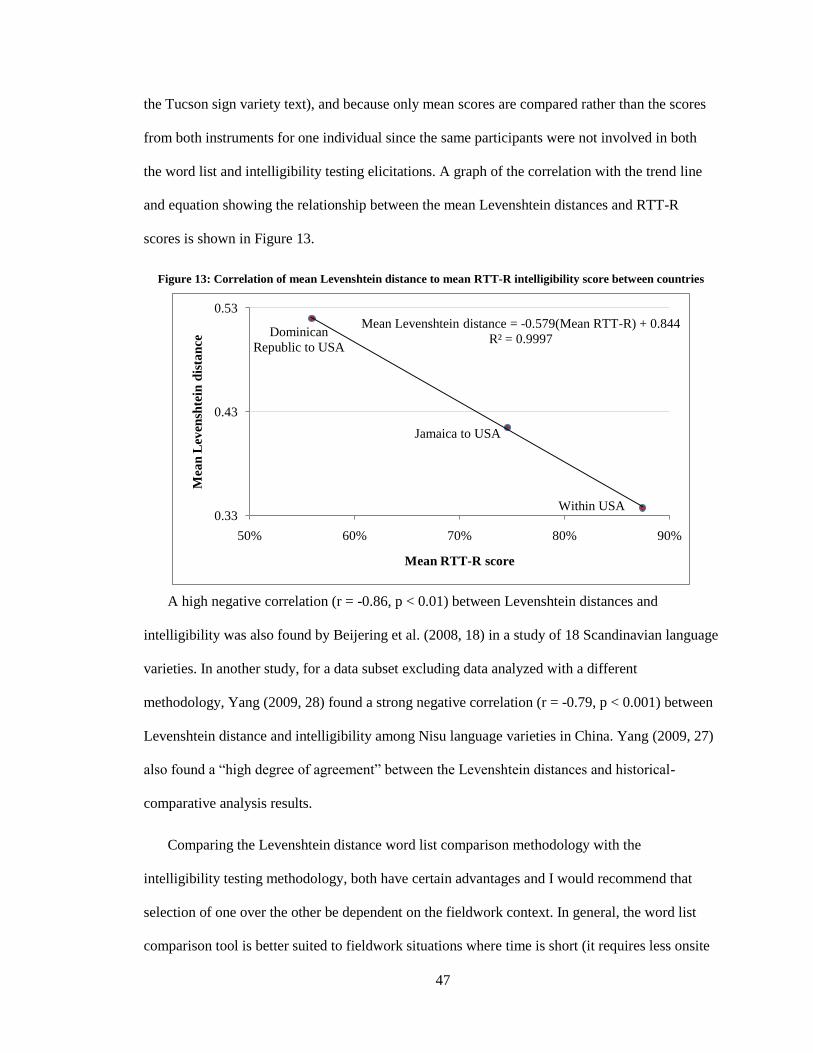
47
the Tucson sign variety text), and because only mean scores are compared rather than the scores
from both instruments for one individual since the same participants were not involved in both
the word list and intelligibility testing elicitations. A graph of the correlation with the trend line
and equation showing the relationship between the mean Levenshtein distances and RTT-R
scores is shown in Figure 13.
Figure 13: Correlation of mean Levenshtein distance to mean RTT-R intelligibility score between countries
A high negative correlation (r = -0.86, p < 0.01) between Levenshtein distances and
intelligibility was also found by Beijering et al. (2008, 18) in a study of 18 Scandinavian language
varieties. In another study, for a data subset excluding data analyzed with a different
methodology, Yang (2009, 28) found a strong negative correlation (r = -0.79, p < 0.001) between
Levenshtein distance and intelligibility among Nisu language varieties in China. Yang (2009, 27)
also found a “high degree of agreement” between the Levenshtein distances and historical-
comparative analysis results.
Comparing the Levenshtein distance word list comparison methodology with the
intelligibility testing methodology, both have certain advantages and I would recommend that
selection of one over the other be dependent on the fieldwork context. In general, the word list
comparison tool is better suited to fieldwork situations where time is short (it requires less onsite
Dominican
Republic to USA
Jamaica to USA
Within USA
Mean Levenshtein distance = -0.579(Mean RTT-R) + 0.844
R² = 0.9997
0.33
0.43
0.53
50% 60% 70% 80% 90%
Mea
n L
even
shte
in d
ista
nce
Mean RTT-R score
48
fieldwork time) and potential participants may have had little formal education or exposure to
testing methods (the elicitation procedure is much easier to explain). The RTT-R methodology
requires much more onsite preparation including the elicitation of an appropriate narrative text
and hometown testing to calibrate the results. On the other hand, the word list comparison
methodology requires more time to analyze than the RTT-R. Even though the results appear to be
highly correlated, where feasible, I would advise that both be used since multiple perspectives can
strengthen the research conclusions and recommendations.
4.3 Evaluation of parameters
I evaluated each of the six parameters of the initial coding system individually, and then in
sets of two, four, and five parameters in contrast to all six parameters to determine which
parameters or parameter combinations most clearly grouped the varieties based on similarities
and differences. These comparisons in combination with ANOVA statistical evaluations helped to
identify which parameters were most efficient in assessing similarity among sign varieties. In
section 4.3.1, I compare the Levenshtein distance results of each parameter individually to
evaluate if any of the six parameters of the initial coding system are obscuring similarity results.
Then based on the weaknesses observed in certain parameters, in section 4.3.2 I evaluate various
subsets of the six parameters in order to omit unclear parameters which would simplify the
coding system and improve the similarity distinctions shown in the results.
4.3.1 Individual parameters
As shown in section 4.1, the Levenshtein distance results show there are 12 groupings of sign
varieties based on country groupings. In this section, I use Levenshtein distance similarity scores
of these 12 groupings (instead of all 1,225 variety pairings) to show relative differences among
the parameter sets. Table 11 shows the Levenshtein distance results of these sign variety
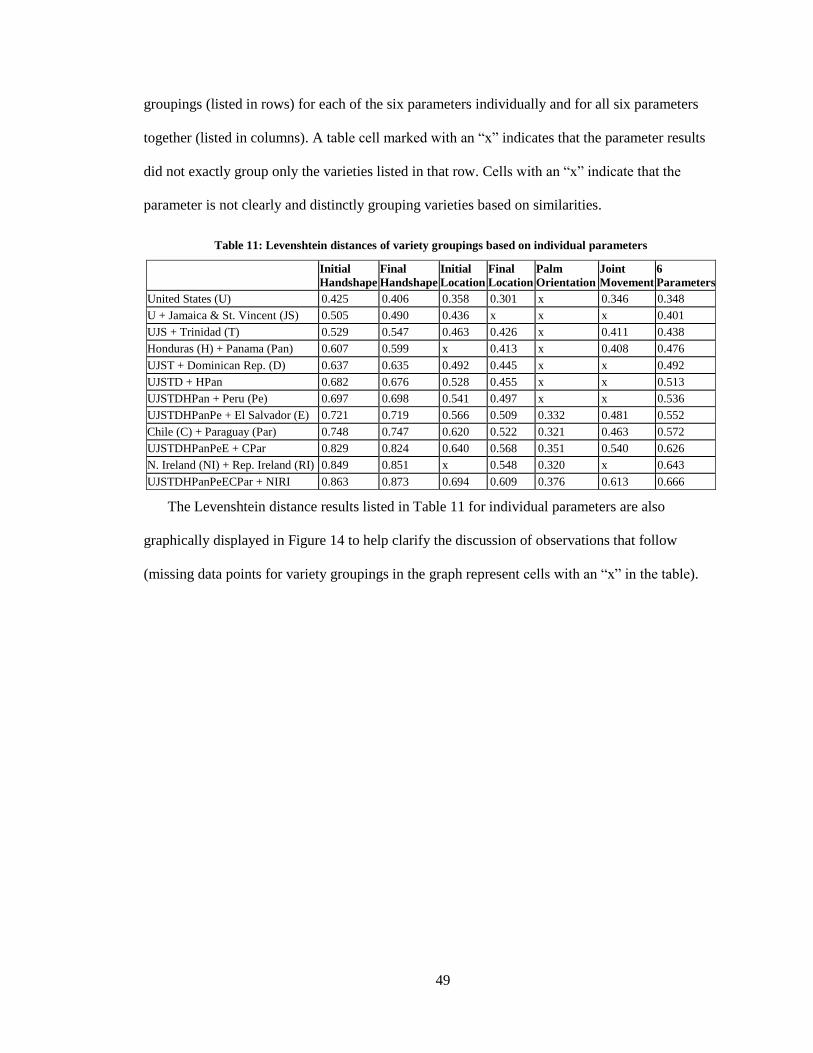
49
groupings (listed in rows) for each of the six parameters individually and for all six parameters
together (listed in columns). A table cell marked with an “x” indicates that the parameter results
did not exactly group only the varieties listed in that row. Cells with an “x” indicate that the
parameter is not clearly and distinctly grouping varieties based on similarities.
Table 11: Levenshtein distances of variety groupings based on individual parameters
Initial
Handshape
Final
Handshape
Initial
Location
Final
Location
Palm
Orientation
Joint
Movement
6
Parameters
United States (U) 0.425 0.406 0.358 0.301 x 0.346 0.348
U + Jamaica & St. Vincent (JS) 0.505 0.490 0.436 x x x 0.401
UJS + Trinidad (T) 0.529 0.547 0.463 0.426 x 0.411 0.438
Honduras (H) + Panama (Pan) 0.607 0.599 x 0.413 x 0.408 0.476
UJST + Dominican Rep. (D) 0.637 0.635 0.492 0.445 x x 0.492
UJSTD + HPan 0.682 0.676 0.528 0.455 x x 0.513
UJSTDHPan + Peru (Pe) 0.697 0.698 0.541 0.497 x x 0.536
UJSTDHPanPe + El Salvador (E) 0.721 0.719 0.566 0.509 0.332 0.481 0.552
Chile (C) + Paraguay (Par) 0.748 0.747 0.620 0.522 0.321 0.463 0.572
UJSTDHPanPeE + CPar 0.829 0.824 0.640 0.568 0.351 0.540 0.626
N. Ireland (NI) + Rep. Ireland (RI) 0.849 0.851 x 0.548 0.320 x 0.643
UJSTDHPanPeECPar + NIRI 0.863 0.873 0.694 0.609 0.376 0.613 0.666
The Levenshtein distance results listed in Table 11 for individual parameters are also
graphically displayed in Figure 14 to help clarify the discussion of observations that follow
(missing data points for variety groupings in the graph represent cells with an “x” in the table).

50
Figure 14: Visual comparison of Levenshtein results of individual parameters for variety groupings
The initial and final handshape parameters consistently identified the 12 groupings that were
also apparent in the results based on all six parameters. The initial location parameter missed two
groupings, and the final location parameter missed just one grouping. The two movement
parameters had the most divergence from clearly identifying the 12 groupings: the palm
orientation change parameter was the most divergent missing seven groupings, and the joint
movement parameter missed five groupings. The groupings that were identified by the palm
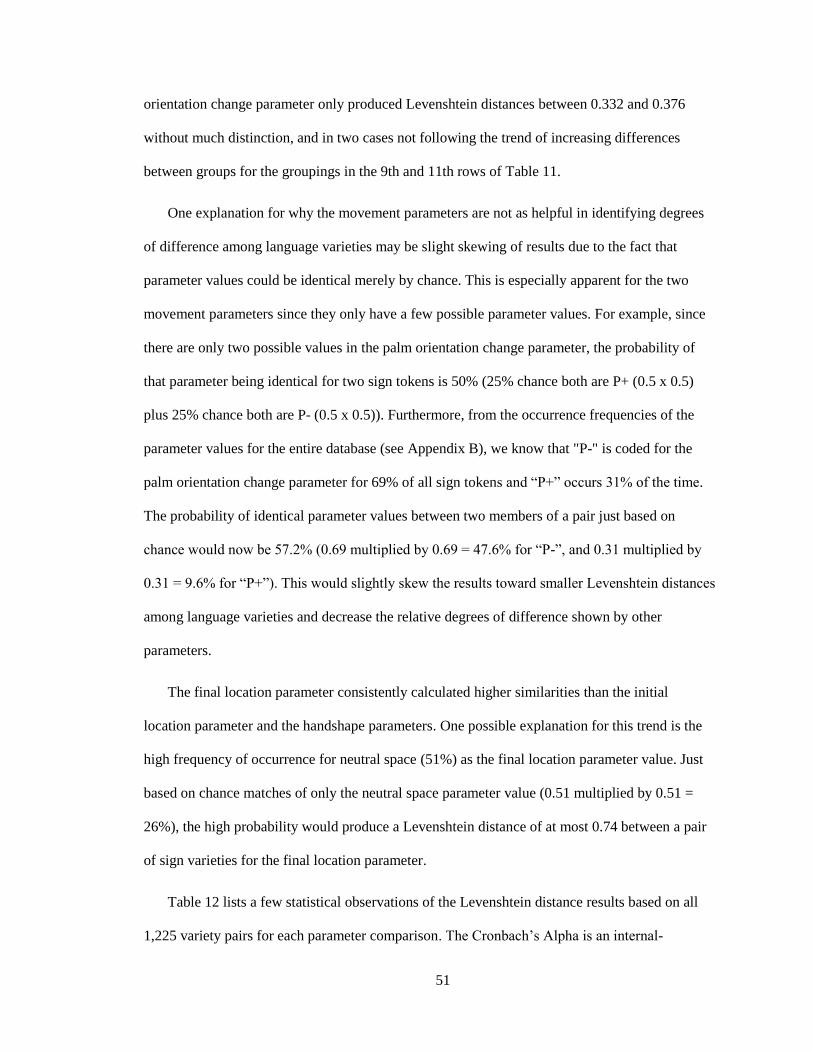
51
orientation change parameter only produced Levenshtein distances between 0.332 and 0.376
without much distinction, and in two cases not following the trend of increasing differences
between groups for the groupings in the 9th and 11th rows of Table 11.
One explanation for why the movement parameters are not as helpful in identifying degrees
of difference among language varieties may be slight skewing of results due to the fact that
parameter values could be identical merely by chance. This is especially apparent for the two
movement parameters since they only have a few possible parameter values. For example, since
there are only two possible values in the palm orientation change parameter, the probability of
that parameter being identical for two sign tokens is 50% (25% chance both are P+ (0.5 x 0.5)
plus 25% chance both are P- (0.5 x 0.5)). Furthermore, from the occurrence frequencies of the
parameter values for the entire database (see Appendix B), we know that "P-" is coded for the
palm orientation change parameter for 69% of all sign tokens and “P+” occurs 31% of the time.
The probability of identical parameter values between two members of a pair just based on
chance would now be 57.2% (0.69 multiplied by 0.69 = 47.6% for “P-”, and 0.31 multiplied by
0.31 = 9.6% for “P+”). This would slightly skew the results toward smaller Levenshtein distances
among language varieties and decrease the relative degrees of difference shown by other
parameters.
The final location parameter consistently calculated higher similarities than the initial
location parameter and the handshape parameters. One possible explanation for this trend is the
high frequency of occurrence for neutral space (51%) as the final location parameter value. Just
based on chance matches of only the neutral space parameter value (0.51 multiplied by 0.51 =
26%), the high probability would produce a Levenshtein distance of at most 0.74 between a pair
of sign varieties for the final location parameter.
Table 12 lists a few statistical observations of the Levenshtein distance results based on all
1,225 variety pairs for each parameter comparison. The Cronbach’s Alpha is an internal-
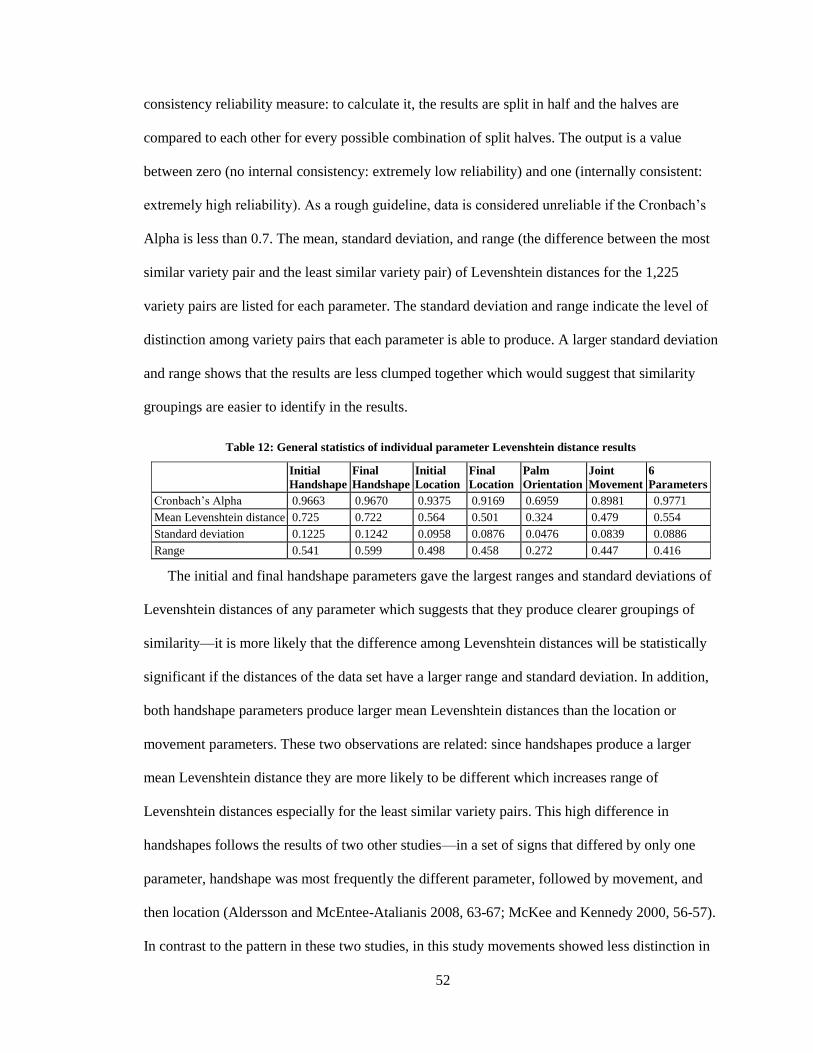
52
consistency reliability measure: to calculate it, the results are split in half and the halves are
compared to each other for every possible combination of split halves. The output is a value
between zero (no internal consistency: extremely low reliability) and one (internally consistent:
extremely high reliability). As a rough guideline, data is considered unreliable if the Cronbach’s
Alpha is less than 0.7. The mean, standard deviation, and range (the difference between the most
similar variety pair and the least similar variety pair) of Levenshtein distances for the 1,225
variety pairs are listed for each parameter. The standard deviation and range indicate the level of
distinction among variety pairs that each parameter is able to produce. A larger standard deviation
and range shows that the results are less clumped together which would suggest that similarity
groupings are easier to identify in the results.
Table 12: General statistics of individual parameter Levenshtein distance results
Initial
Handshape
Final
Handshape
Initial
Location
Final
Location
Palm
Orientation
Joint
Movement
6
Parameters
Cronbach’s Alpha 0.9663 0.9670 0.9375 0.9169 0.6959 0.8981 0.9771
Mean Levenshtein distance 0.725 0.722 0.564 0.501 0.324 0.479 0.554
Standard deviation 0.1225 0.1242 0.0958 0.0876 0.0476 0.0839 0.0886
Range 0.541 0.599 0.498 0.458 0.272 0.447 0.416
The initial and final handshape parameters gave the largest ranges and standard deviations of
Levenshtein distances of any parameter which suggests that they produce clearer groupings of
similarity—it is more likely that the difference among Levenshtein distances will be statistically
significant if the distances of the data set have a larger range and standard deviation. In addition,
both handshape parameters produce larger mean Levenshtein distances than the location or
movement parameters. These two observations are related: since handshapes produce a larger
mean Levenshtein distance they are more likely to be different which increases range of
Levenshtein distances especially for the least similar variety pairs. This high difference in
handshapes follows the results of two other studies—in a set of signs that differed by only one
parameter, handshape was most frequently the different parameter, followed by movement, and
then location (Aldersson and McEntee-Atalianis 2008, 63-67; McKee and Kennedy 2000, 56-57).
In contrast to the pattern in these two studies, in this study movements showed less distinction in

53
differences than locations. One explanation may be due to the lower number of possible
parameter values for movements than locations in the coding system of this study. The large
number of parameter values for handshapes in this coding system may also explain the tendency
for these parameters to show more differences among variety pairs.
The Cronbach’s Alpha internal-consistency reliability measure shows that the handshape
parameters have the highest reliability of the individual parameters (initial handshape parameter:
0.9663, final handshape parameter: 0.9670) - only slightly lower than the reliability of all six
parameters combined (0.9771). The palm orientation change movement parameter had the lowest
reliability (0.6959) which is under the 0.7 threshold for recommended reliability.
4.3.2 Parameter sets
Based on the observations of the performance of individual parameters in section 4.3.1, I
explored possible simplifications of the coding system. Various sets of parameters are compared
to see if similar or even enhanced results can be obtained by excluding certain parameters from
the analysis. Table 13 shows the Levenshtein distance results of 12 groupings of varieties (listed
in rows) for four sets of parameters (listed in columns): all six parameters, five parameters—all
parameters except palm orientation change (labeled as 5P-NoPO), four parameters—the
handshapes and locations not including the two movement parameters (labeled as 4P-NoMove),
and the initial handshape and location parameters (labeled as 2P-Initial). The statistical values of
Cronbach’s Alpha (internal-consistency reliability measure), standard deviation and range
(difference between most similar and least similar variety pair Levenshtein distances), and the
mean Levenshtein distance are also given to help compare the effectiveness of various parameter
sets in distinguishing similarity groupings.
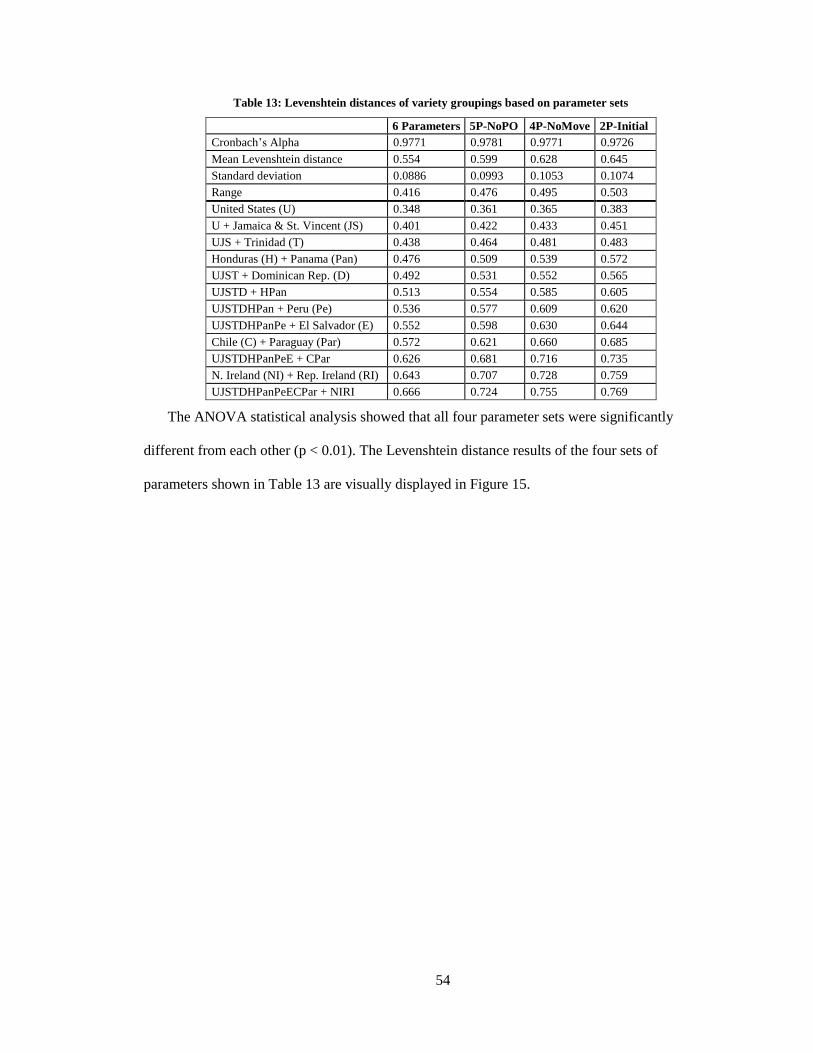
54
Table 13: Levenshtein distances of variety groupings based on parameter sets
6 Parameters 5P-NoPO 4P-NoMove 2P-Initial
Cronbach’s Alpha 0.9771 0.9781 0.9771 0.9726
Mean Levenshtein distance 0.554 0.599 0.628 0.645
Standard deviation 0.0886 0.0993 0.1053 0.1074
Range 0.416 0.476 0.495 0.503
United States (U) 0.348 0.361 0.365 0.383
U + Jamaica & St. Vincent (JS) 0.401 0.422 0.433 0.451
UJS + Trinidad (T) 0.438 0.464 0.481 0.483
Honduras (H) + Panama (Pan) 0.476 0.509 0.539 0.572
UJST + Dominican Rep. (D) 0.492 0.531 0.552 0.565
UJSTD + HPan 0.513 0.554 0.585 0.605
UJSTDHPan + Peru (Pe) 0.536 0.577 0.609 0.620
UJSTDHPanPe + El Salvador (E) 0.552 0.598 0.630 0.644
Chile (C) + Paraguay (Par) 0.572 0.621 0.660 0.685
UJSTDHPanPeE + CPar 0.626 0.681 0.716 0.735
N. Ireland (NI) + Rep. Ireland (RI) 0.643 0.707 0.728 0.759
UJSTDHPanPeECPar + NIRI 0.666 0.724 0.755 0.769
The ANOVA statistical analysis showed that all four parameter sets were significantly
different from each other (p < 0.01). The Levenshtein distance results of the four sets of
parameters shown in Table 13 are visually displayed in Figure 15.

55
Figure 15: Levenshtein distances of variety groupings for parameter sets
The combination of parameters that seems to show distinctions between similar and different
groupings most efficiently while still maintaining a high internal consistency is the four-
parameter combination of initial and final handshapes and locations (labeled as 4P-NoMove).
These results have a high internal-consistency reliability based on the Cronbach’s Alpha value of
0.9771 (equal value to the six parameter set, and only slightly less than the five parameter set
(0.9781)). The range of Levenshtein distances from the most to least similar variety pair for these
four parameters (0.495) and the standard deviation (0.1053) are larger than the ranges and
standard deviations of the five and six parameter combinations which suggests that the
distinctions between similarity groups are clearer in the four parameter set. A study of
56
Guatemalan sign varieties also found that inclusion of the palm orientation and movement
parameters in the comparison resulted in a smaller range among similarity scores (Parks and
Parks 2008, 27).
The relative relationships of the variety groupings (increasing Levenshtein distance while
progressing through the variety groupings) are similar among all the parameter sets with one
exception: the 2P-Initial parameter set comparison calculates the grouping of the Dominican
Republic varieties with the varieties from the United States, Jamaica, Trinidad, and St. Vincent at
a smaller Levenshtein distance than the grouping of all Honduras and Panama varieties. This
observation combined with a smaller Cronbach’s Alpha value (0.9726) suggests that the 2P-
Initial set is not optimal. Since the 4P-NoMove set yields similar results to the initial six
parameter set with even more distinction between similarity groups, and the two movement
parameters require more time to code consistently than the other parameters, the 4P-NoMove set
is the optimal choice of parameters to evaluate during comparisons.
4.4 Evaluation of handshape parameter values
For the initial and final handshape parameters, the initial coding system identified 99 distinct
handshape values. Two small subsets of these handshape values either occurred very infrequently
or were difficult to distinguish during coding. I combined or merged these values in order to
propose a coding system with improved efficiency and consistency without sacrificing clear
similarity groupings. There were 19 values that occurred less than 0.10% of the time; I combined
17 of them with one of the other 80 handshape values with similar features, and two of them with
each other ("U-Top" and "Ugap" were both coded as "U-Top"). I also combined the infrequent
values “ILYbent-Top” and “7” with “ILYflex-Top”, and used a new code name, “ILY-Top” for
the resulting value. These 19 least frequently occurring values are shown in Table 14.

57
Table 14: Handshape values that occur least frequently to combine with similar values
Rank Code name
to be merged
Occurrences Frequency Code with the following similar value
81 U-Top 23 0.08% U-Top (merged with Ugap)
82 Rhole 21 0.07% R
83 Ybent 19 0.06% Y
84 F-Text 18 0.06% Lbent
85 E-Top 16 0.05% C
86 Ugap 14 0.05% U-Top
87 7 13 0.04% ILYflex-Top, ILYbent-Top = ILY-Top
88 Olittle-Tund 11 0.04% T
89 1flex-Tflex 10 0.03% Lflex
90 ILYbent-Top 10 0.03% ILYflex-Top, 7 = ILY-Top
91 E-Ttog 8 0.03% E-Text
92 1-Ttog 6 0.02% 1
93 F-Ttog 6 0.02% F
94 Iflex 6 0.02% Ibent
95 Wflex 6 0.02% W
96 E-Tflex 5 0.02% E-Text
97 I-Ttog 5 0.02% I
98 1-Tflex 3 0.01% L
99 Y-MID 2 0.01% Y (or Wunspr for middle finger variant)
There were seven pairs of handshape parameter values that were difficult to distinguish in the
word list videos. I merged each of these pairs, reducing the handshape parameter inventory by
seven values. These seven merged values are listed in Table 15. I used a new code name "Fgap"
for the initial coding system values of "Fflexgap" and "Gspread".
Table 15: Handshape values to merge because they are hard to distinguish
Code name to be merged Remaining code with similar features
5bent 5-Top
5flex-Text 5flex
8flexgap 8gap
B-Ttog B-Text
C-Top C
Clittle-Top Clittle
Gspread and Fflexgap Fgap (new code)
By merging the sets of handshape values representing infrequently occurring values and those
representing features that were difficult to distinguish in the videos, the handshape parameter
value inventory was reduced from 99 to 74 values. After evaluating word list items in section 4.5,
I examine the effects of these refinements in addition to word list item refinements in section 4.6.
58
4.5 Evaluation of word list items
In order to determine an optimal set of word list items to use in comparisons, I analyzed the
results with two foci: to compare different subsets of items to determine if certain subsets may
enhance or obscure the clarity of similarity relationships, and to identify specific items that may
tend to skew results or cause missing data due to unclear elicitations.
4.5.1 Comparison of item subsets
Levenshtein distances (using the 4P-NoMove parameter set, labeled in this section as 4P-All)
for the complete set of 243 word list items were compared to Levenshtein distances for three
subsets of items to determine if certain subsets produced more distinctions in similarity
groupings. One subset included 67 items containing animals, foods, and other basic nouns
(labeled as 4P-AnimalFoodNoun) that were relatively easy to represent with images during
elicitation—45 items from this set are the same items as used in a 50-item noun list described as
highly iconic by Parkhurst and Parkhurst (2003, 14). Another subset consisted of all the
remaining 176 items not included in 4P-AnimalFoodNoun, which may be considered to be a list
of items less easily represented by images during elicitation (labeled as 4P-NoAnimalFoodNoun).
The third subset of only 25 items contained colors, days, and months (labeled as 4P-
ColorDayMonth). This small subset was chosen based on intuitive observations during coding
(high similarities within a country and low similarities between countries), and I was curious to
see the resulting Levenshtein distance similarity groupings this relatively small subset of items
would produce. Table 16 shows the Levenshtein distances for the four sets of word list items
(listed in columns) including the Cronbach’s Alpha internal-consistency reliability evaluation,
mean, standard deviation, and range.
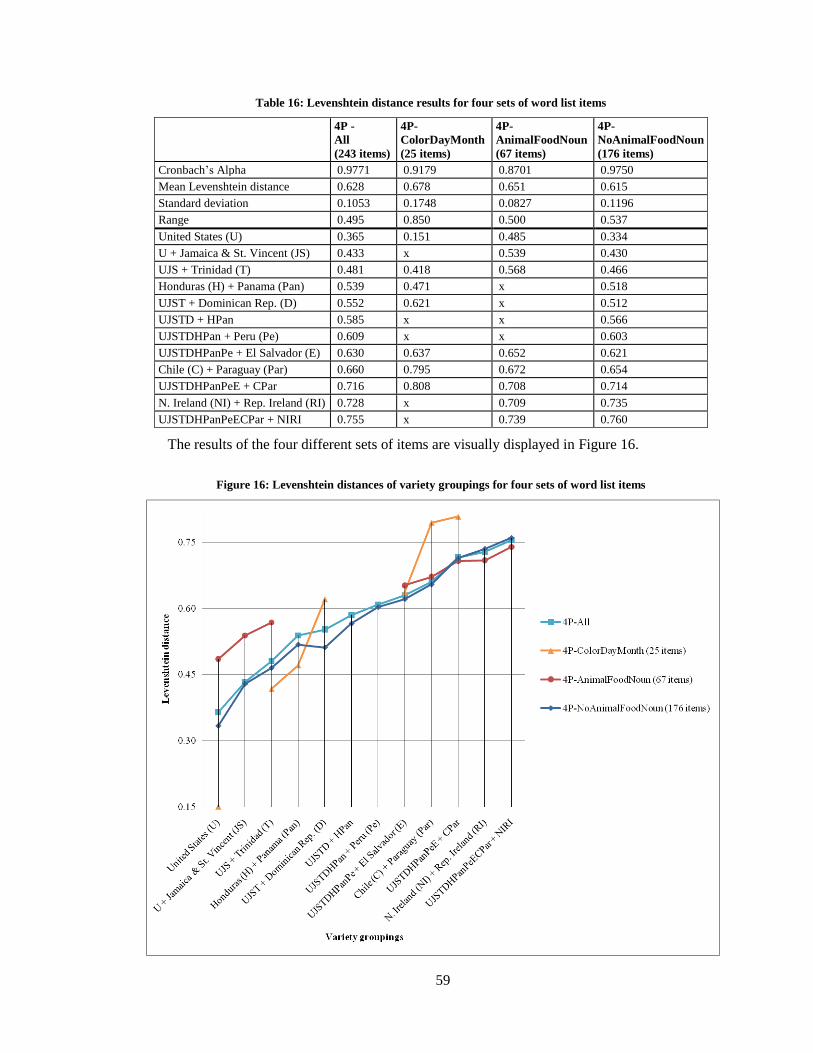
59
Table 16: Levenshtein distance results for four sets of word list items
4P -
All
(243 items)
4P-
ColorDayMonth
(25 items)
4P-
AnimalFoodNoun
(67 items)
4P-
NoAnimalFoodNoun
(176 items)
Cronbach’s Alpha 0.9771 0.9179 0.8701 0.9750
Mean Levenshtein distance 0.628 0.678 0.651 0.615
Standard deviation 0.1053 0.1748 0.0827 0.1196
Range 0.495 0.850 0.500 0.537
United States (U) 0.365 0.151 0.485 0.334
U + Jamaica & St. Vincent (JS) 0.433 x 0.539 0.430
UJS + Trinidad (T) 0.481 0.418 0.568 0.466
Honduras (H) + Panama (Pan) 0.539 0.471 x 0.518
UJST + Dominican Rep. (D) 0.552 0.621 x 0.512
UJSTD + HPan 0.585 x x 0.566
UJSTDHPan + Peru (Pe) 0.609 x x 0.603
UJSTDHPanPe + El Salvador (E) 0.630 0.637 0.652 0.621
Chile (C) + Paraguay (Par) 0.660 0.795 0.672 0.654
UJSTDHPanPeE + CPar 0.716 0.808 0.708 0.714
N. Ireland (NI) + Rep. Ireland (RI) 0.728 x 0.709 0.735
UJSTDHPanPeECPar + NIRI 0.755 x 0.739 0.760
The results of the four different sets of items are visually displayed in Figure 16.
Figure 16: Levenshtein distances of variety groupings for four sets of word list items
60
Compared to the 4P-All set, the 4P-AnimalFoodNoun subset produced slightly larger
Levenshtein distances in the more similar variety groupings and slightly smaller Levenshtein
distances in the less similar variety groupings. The Cronbach’s Alpha internal-consistency
reliability measure was the lowest (0.8701) among this set of items, and four variety groupings
were not clearly identified (shown by an "x" in Table 16). In comparison, Bickford (2005, 23)
found that a smaller 84-item list that was elicited with pictures and that contained potentially
more iconic concepts produced 7.5% higher similarity scores compared to a 240-item list that
included an additional 156 items that were only elicited with written words and not images.
In the contrasting 4P-NoAnimalFoodNoun item subset, the Levenshtein distances are very
similar in absolute distances and relative relationships to the 4P-All set. The 4P-
NoAnimalFoodNoun subset calculated a slightly larger range (0.537) than the 4P-All set (0.495).
Similarly, in two other studies, word lists containing items that were judged as less-iconic have
produced a greater level of distinction among language varieties (Parkhurst and Parkhurst 2003;
Johnson and Johnson 2008, 37). The ANOVA statistical analysis showed that 4P-All and 4P-
NoAnimalFoodNoun were not significantly different from each other (p < 0.01). From these
observations, the exclusion of items that are elicited with pictures and that may be judged by
some standards as "more iconic", only results in minor changes to both the absolute Levenshtein
distances and the relative relationships of similarity grouping results.
Interestingly, the 4P-ColorDayMonth item subset showed extremely high distinction (a range
of 0.850), maintained similar relative relationships across most of the selected groupings (not
distinguishing five groupings; shown by an "x" in Table 16), and had quite a high Cronbach’s
Alpha (0.918) for a small set of items. Vanhecke and De Weerdt (2004, 34-35) also found a
higher than expected number of identical signs from a list that included colors, days, and months
among five regions in Flanders. From all five regions, they calculated 72.3% of 1,401 concepts to
be similar or related. Their finding complements the trend found in this data: among groupings of
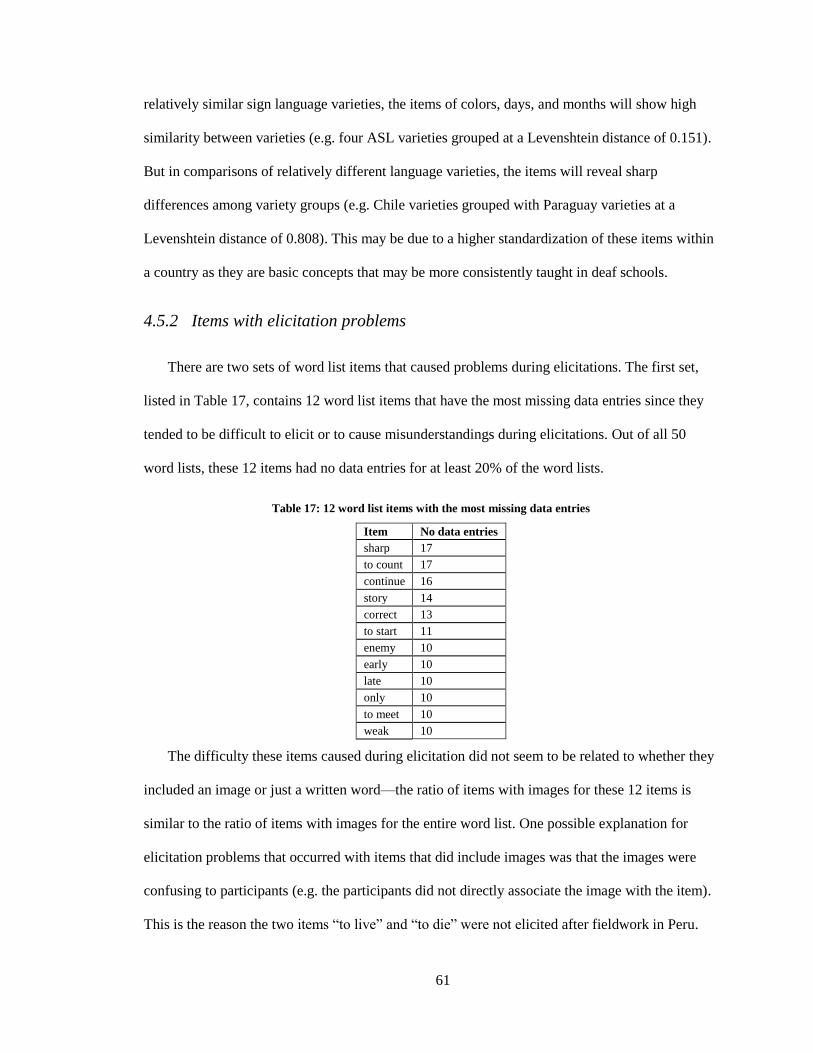
61
relatively similar sign language varieties, the items of colors, days, and months will show high
similarity between varieties (e.g. four ASL varieties grouped at a Levenshtein distance of 0.151).
But in comparisons of relatively different language varieties, the items will reveal sharp
differences among variety groups (e.g. Chile varieties grouped with Paraguay varieties at a
Levenshtein distance of 0.808). This may be due to a higher standardization of these items within
a country as they are basic concepts that may be more consistently taught in deaf schools.
4.5.2 Items with elicitation problems
There are two sets of word list items that caused problems during elicitations. The first set,
listed in Table 17, contains 12 word list items that have the most missing data entries since they
tended to be difficult to elicit or to cause misunderstandings during elicitations. Out of all 50
word lists, these 12 items had no data entries for at least 20% of the word lists.
Table 17: 12 word list items with the most missing data entries
Item No data entries
sharp 17
to count 17
continue 16
story 14
correct 13
to start 11
enemy 10
early 10
late 10
only 10
to meet 10
weak 10
The difficulty these items caused during elicitation did not seem to be related to whether they
included an image or just a written word—the ratio of items with images for these 12 items is
similar to the ratio of items with images for the entire word list. One possible explanation for
elicitation problems that occurred with items that did include images was that the images were
confusing to participants (e.g. the participants did not directly associate the image with the item).
This is the reason the two items “to live” and “to die” were not elicited after fieldwork in Peru.
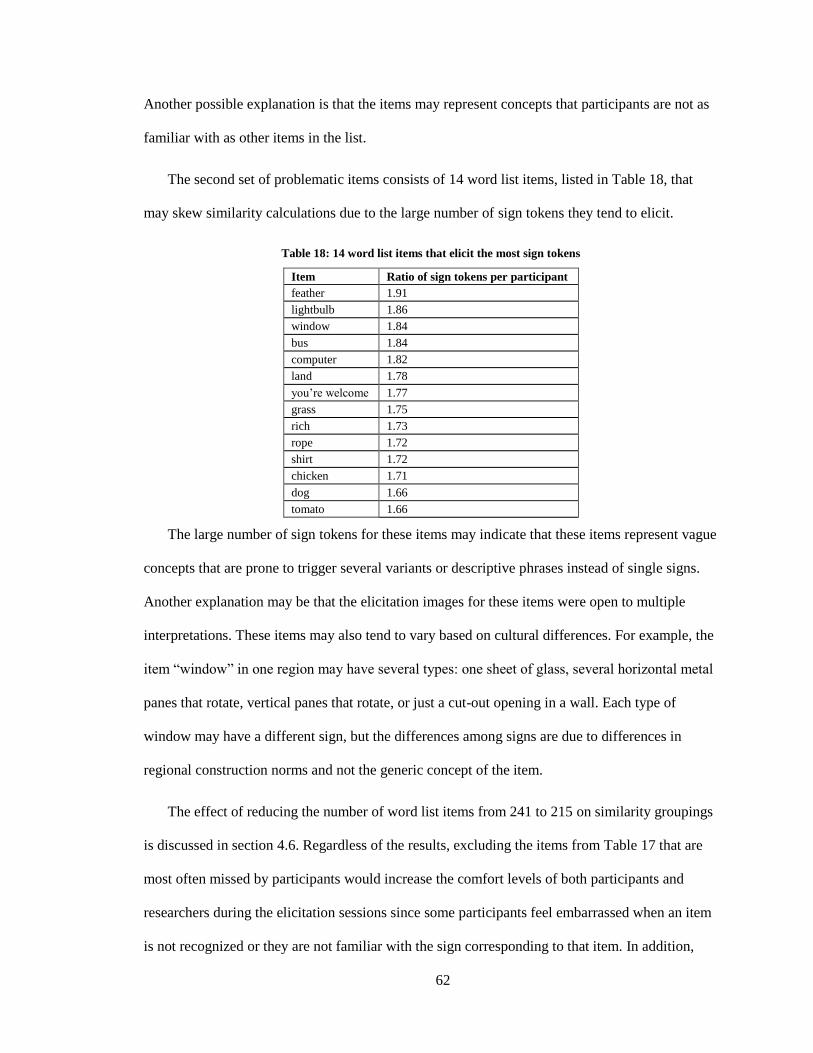
62
Another possible explanation is that the items may represent concepts that participants are not as
familiar with as other items in the list.
The second set of problematic items consists of 14 word list items, listed in Table 18, that
may skew similarity calculations due to the large number of sign tokens they tend to elicit.
Table 18: 14 word list items that elicit the most sign tokens
Item Ratio of sign tokens per participant
feather 1.91
lightbulb 1.86
window 1.84
bus 1.84
computer 1.82
land 1.78
you’re welcome 1.77
grass 1.75
rich 1.73
rope 1.72
shirt 1.72
chicken 1.71
dog 1.66
tomato 1.66
The large number of sign tokens for these items may indicate that these items represent vague
concepts that are prone to trigger several variants or descriptive phrases instead of single signs.
Another explanation may be that the elicitation images for these items were open to multiple
interpretations. These items may also tend to vary based on cultural differences. For example, the
item “window” in one region may have several types: one sheet of glass, several horizontal metal
panes that rotate, vertical panes that rotate, or just a cut-out opening in a wall. Each type of
window may have a different sign, but the differences among signs are due to differences in
regional construction norms and not the generic concept of the item.
The effect of reducing the number of word list items from 241 to 215 on similarity groupings
is discussed in section 4.6. Regardless of the results, excluding the items from Table 17 that are
most often missed by participants would increase the comfort levels of both participants and
researchers during the elicitation sessions since some participants feel embarrassed when an item
is not recognized or they are not familiar with the sign corresponding to that item. In addition,
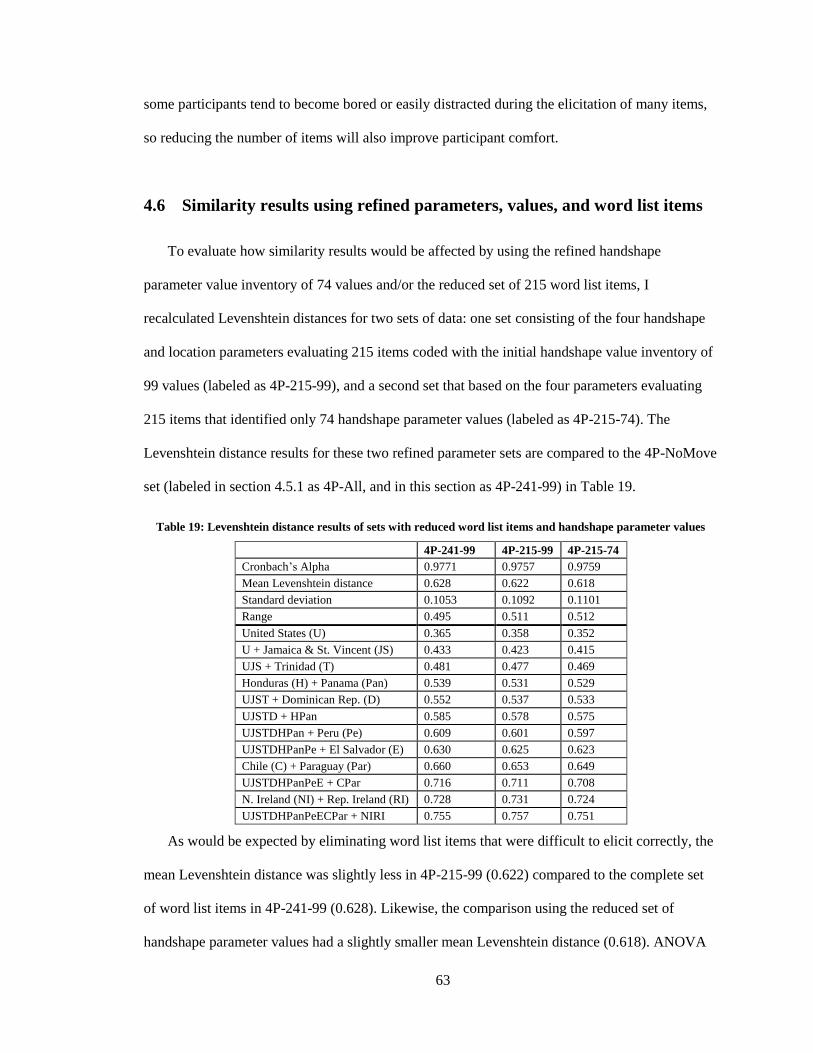
63
some participants tend to become bored or easily distracted during the elicitation of many items,
so reducing the number of items will also improve participant comfort.
4.6 Similarity results using refined parameters, values, and word list items
To evaluate how similarity results would be affected by using the refined handshape
parameter value inventory of 74 values and/or the reduced set of 215 word list items, I
recalculated Levenshtein distances for two sets of data: one set consisting of the four handshape
and location parameters evaluating 215 items coded with the initial handshape value inventory of
99 values (labeled as 4P-215-99), and a second set that based on the four parameters evaluating
215 items that identified only 74 handshape parameter values (labeled as 4P-215-74). The
Levenshtein distance results for these two refined parameter sets are compared to the 4P-NoMove
set (labeled in section 4.5.1 as 4P-All, and in this section as 4P-241-99) in Table 19.
Table 19: Levenshtein distance results of sets with reduced word list items and handshape parameter values
4P-241-99 4P-215-99 4P-215-74
Cronbach’s Alpha 0.9771 0.9757 0.9759
Mean Levenshtein distance 0.628 0.622 0.618
Standard deviation 0.1053 0.1092 0.1101
Range 0.495 0.511 0.512
United States (U) 0.365 0.358 0.352
U + Jamaica & St. Vincent (JS) 0.433 0.423 0.415
UJS + Trinidad (T) 0.481 0.477 0.469
Honduras (H) + Panama (Pan) 0.539 0.531 0.529
UJST + Dominican Rep. (D) 0.552 0.537 0.533
UJSTD + HPan 0.585 0.578 0.575
UJSTDHPan + Peru (Pe) 0.609 0.601 0.597
UJSTDHPanPe + El Salvador (E) 0.630 0.625 0.623
Chile (C) + Paraguay (Par) 0.660 0.653 0.649
UJSTDHPanPeE + CPar 0.716 0.711 0.708
N. Ireland (NI) + Rep. Ireland (RI) 0.728 0.731 0.724
UJSTDHPanPeECPar + NIRI 0.755 0.757 0.751
As would be expected by eliminating word list items that were difficult to elicit correctly, the
mean Levenshtein distance was slightly less in 4P-215-99 (0.622) compared to the complete set
of word list items in 4P-241-99 (0.628). Likewise, the comparison using the reduced set of
handshape parameter values had a slightly smaller mean Levenshtein distance (0.618). ANOVA
64
statistical analysis showed that 4P-241-99, 4P-215-99, and 4P-215-74 were not significantly
different from each other (p < 0.01). The Cronbach’s Alpha is also very similar among all three
data sets. This statistical analysis indicates that using the reduced sets of word list items and
handshape parameter values (improving elicitations of word lists, and the efficiency and accuracy
of coding) does not negatively impact the similarity distinctions of the Levenshtein distance
results among sign language varieties. In fact, the standard deviation and range of 4P-215-74 is
actually larger than the other two sets which would suggest that it shows more distinctions
between similar and different sign language varieties.
The dendrogram in Figure 17 displays the Levenshtein distance similarity groupings for all
50 sign language varieties comparing the four parameters of handshapes and locations using the
refined word list of 215 items and the reduced handshape parameter value inventory of 74 values.
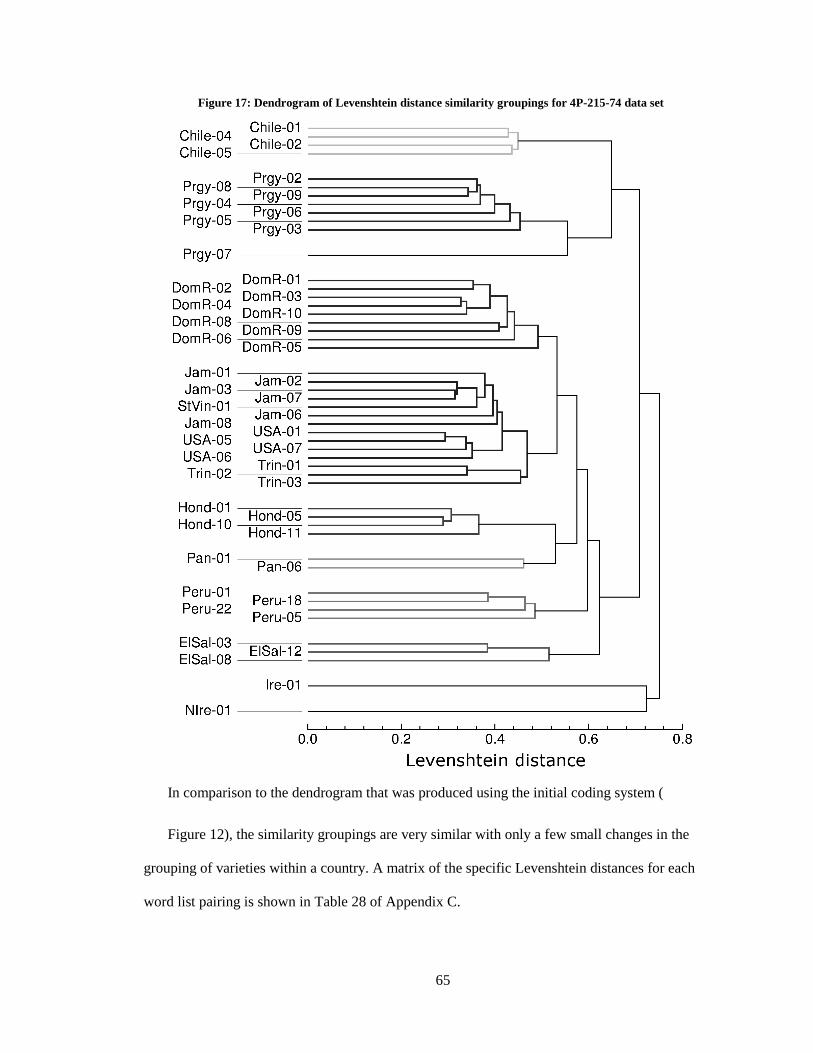
65
Figure 17: Dendrogram of Levenshtein distance similarity groupings for 4P-215-74 data set
In comparison to the dendrogram that was produced using the initial coding system (
Figure 12), the similarity groupings are very similar with only a few small changes in the
grouping of varieties within a country. A matrix of the specific Levenshtein distances for each
word list pairing is shown in Table 28 of Appendix C.

66
CHAPTER 5
CONCLUSION
Given the results of the evaluation of the coding methodology and of the Levenshtein
distance similarity results, in this chapter I summarize my interpretations of the results and
present a final proposal for an efficient and effective coding methodology for sign language word
list comparisons. First, I propose a set of parameters to use for comparisons and explain why
certain parameters of the initial methodology should be excluded from future word list
comparisons. Second, I propose a reduced inventory of possible parameter values to be used for
the handshape parameters. Third, I propose a reduced set of items for word list elicitations.
A refined set of 215 word list items is recommended for optimal similarity calculations and
participant comfort during elicitation sessions. Using the proposed coding methodology, this
preliminary word list comparison evaluating the similarity of lexical items using the Levenshtein
distance metric appears to produce both reliable and valid degrees of difference among sign
language varieties. The Levenshtein distance results had a Cronbach's Alpha of 0.9759 (internal
reliability rating), and their validity is supported by a high negative correlation with intelligibility
testing results (r = -1.000, p = 0.014).
Since word lists are relatively quick to elicit during fieldwork, the proposed coding system is
straightforward with well-defined parameter values, the Levenshtein distance calculations can be
performed rapidly and objectively, and the SLLED and Rugloafer analysis software is user-
friendly with many helpful outputs, word list comparisons using this methodology can effectively
contribute toward sign language identification, documentation, and language development project
planning.
67
5.1 Refining the parameters for comparison
I recommend basing word list comparisons on four phonetic parameters of a sign token:
initial handshape, final handshape, initial location, and final location. Analysis of the results using
the six parameters of the original methodology indicates that the two parameters coding
movement have low internal-consistency reliability and do not produce similarity groupings as
clearly as do the handshape and location parameters. The palm orientation change parameter had
a low Cronbach's Alpha of 0.6959 and did not group seven of the 12 common similarity
groupings of varieties calculated by the other parameters. Likewise, the joint movement
parameter had a Cronbach's Alpha of 0.8981 and did not group five of the 12 common similar
variety groupings. In comparison, the Cronbach's Alpha of the handshape and location parameters
was higher, ranging from 0.9169 to 0.9670 which shows that the comparison results of these
parameters have more internal-consistency reliability. Both initial and final handshape parameters
calculated all 12 of the common similarity groupings; and the initial location parameter only
missed two while the final location parameter missed just one grouping. Since the movement
parameters produce less clarity and distinctions in the similarity groupings, have a low internal-
consistency reliability, and certain aspects of movement are represented indirectly through the
coding of the initial and final positions of handshapes and locations, I do not recommend
including the two movement parameters in the final proposed methodology. In addition, they
require more time and are more difficult to code than the handshapes and locations.
Relative similarity groupings and Levenshtein distance ranges calculated by the four-
parameter set and either of the handshape parameters alone are quite similar. It could be argued
that only the final handshape parameter should be used to assess similarity since it has the highest
Cronbach's Alpha of any single parameter and has the largest range of Levenshtein distances
between the most similar and least similar language varieties. However, locations tend to have
fewer errors in articulation than handshapes since they require less detailed motor movements
68
(Siedlecki Jr. and Bonvillian 1993; Meier et al. 1998), thus coding only for handshape may
introduce noise in the analysis due to production errors. Finally, since the Cronbach’s Alpha is
higher when four parameters are compared than when just one handshape parameter is compared,
and the locations are relatively easy and quick to code, I recommend keeping the location
parameters in the coding system.
5.2 Refining parameter values
Sign tokens were coded for each of the four parameters using an inventory of unique values
with descriptions of how to consistently apply the coding system and combine minor feature
differences. The initial and final location inventory contained 31 possible values in the initial
methodology and I do not propose making any changes to the number of values. Although they
did not cause problems, for clarity and consistency with other location value codes, I would
recommend modifying the code names of four location values that were unnecessarily
abbreviated in the initial coding system: changing "Should" to "Shoulder", "Fing" to "Finger",
"Fore" to "Forehead", and "Hip" to "HipLeg".
For the initial and final handshape parameters, the initial coding system identified 99 distinct
handshape parameter values. As described in section 4.4, two sets of handshape parameter values
were merged to make the coding system more efficient and accurate - reducing the total inventory
from 99 to 74 values. Since using the reduced handshape value inventory produced similarity
results that were not significantly different from the initial handshape value inventory (p < 0.01),
I recommend using the refined inventory of 74 handshape values. This will decrease the time
required to learn the coding system and become consistent in applying it. In future studies, if one
of these 74 values appears to combine contrastive features among the language varieties being
compared, additional parameter values can be added to the coding and scoring system (the
SLLED software was designed with “empty” spaces for additional values).

69
5.3 Refining the word list items
There were 26 items highlighted in section 4.5.1 that tended to be difficult to elicit or that
tended to trigger several variants or descriptions that may skew similarity calculations. I
recommend excluding these two sets of problematic items to reduce the total number of items
from 241 to 215 items. Excluding the 12 items listed in Table 17 will increase participant comfort
during elicitation sessions and reduce missing data entries. In addition, excluding the 14 items
from Table 18 that tend to elicit the largest number of sign tokens will reduce the skewing of
similarity results due to potentially vague concepts. In general, comparing more word list items
improves the reliability of the results, yet there is a tension between this advantage and the
potential negative effect of participants becoming bored or tired with long elicitation sessions.
Reducing the number of items as recommended will maintain the advantage of good reliability
resulting from a longer list while improving participant comfort during elicitations.
Since the difference between the results from the complete set of items and the results from
the subset of items "4P-NoAnimalFoodNoun" with items that some might consider "less iconic"
was small, I do not propose excluding the "more iconic" items. In addition, I recommend
including these items at the beginning of elicitation sessions since the participants usually become
more comfortable with the elicitation procedure when the first items are very familiar and easily
triggered.
5.4 Final methodology proposal
The final proposed word list comparison methodology includes 215 word list items and uses
four parameters to code sign tokens: initial handshape, final handshape, initial location, and final
location. The handshape parameter value inventory contains 74 values, and the location inventory
contains 31 values. Sign tokens are coded for these parameters and values using ELAN software.

70
This ELAN data is converted by SLLED software in order to calculate Levenshtein distances and
degrees of difference among sign language varieties using the Rugloafer software.
5.5 Areas and considerations for future research
Many areas remain for future research due to the exploratory nature of this study of word list
comparison methodology. First, it may be possible to enhance Levenshtein distance calculations
by assigning weights to parameter values - producing a smaller distance for similar values and
larger distance for different values instead of a binary score. For example, when comparing the
initial location parameter, the values “Cheek”, “Chin”, and “Wrist”, are currently considered
equally different from each other and one edit would be tallied in the Levenshtein distance
calculations for any difference. By assigning weights to values, relatively similar location
parameter values like “Cheek” and “Chin” would calculate a smaller Levenshtein distance than
the comparison of two values like "Cheek" and "Wrist". But further research is needed to
determine what weights should be assigned to parameter value pairings, how weighted value
pairings would affect similarity calculations, and whether there would be noticeable differences
in the relative relationships of sign varieties.
A second area for further research would be to expand and refine the analysis of the
correlation between Levenshtein distances and intelligibility testing results. For example, Ciupek-
Reed (2011) reports intelligibility testing results of an ASL text in El Salvador that could be
compared to the Levenshtein distances among the sign varieties of these two countries as reported
in this study.
Third, other sign language sociolinguistic research methodologies could be used to support or
contradict this word list comparison methodology and the Levenshtein distance results. For
example, the data from a previous study that used a Blair-style lexical similarity method could be

71
reanalyzed using the methodology of this study. The results of the two methodologies could then
be compared and the pros and cons of each method could be evaluated.
Fourth, it will be important to evaluate the proposed word list comparison methodology
among sign varieties from more distinct regions of the world. It is possible that articulatory
feature distinctions would be observed while coding word lists from a larger sign language
variety database that would require a modification of the current parameter value inventories. A
more complete understanding of the limits of the smallest and largest Levenshtein distances
expected between very similar and very different sign language varieties might improve the
interpretation of Levenshtein distances and relative similarity relationships.
As a final consideration for future research, although one of the primary goals of this word
list comparison methodology was to develop a more objective process to assess sign language
variety similarities, in some cases it was difficult to consistently and accurately code the
parameter values for each sign token. Difficulties coding handshapes were mainly due to poor
video quality resulting from less than ideal lighting conditions and backgrounds during fieldwork.
Since only one video camera was used, signs were only viewable from one perspective and it was
difficult to determine some locations and movements in three dimensions. If sufficient resources
of time and equipment were available, coding accuracy would be improved by using multiple
video cameras, adequate lighting, and a standard background material.
While I hope that this study provides a quick, efficient, and accurate tool to be used on a
broad scale in future sociolinguistic research of sign languages, additional research is needed to
strengthen the claims that can be made from the results. I encourage future sign language
sociolinguistic researchers to continue to modify and refine this methodology in order to
appropriately apply it to their specific contexts.

72
APPENDICES
73
Appendix A
Word list items
The word list items are listed in their elicitation order grouped by topic and/or semantic
domain in Table 20. The last two items were only elicited from five participants near the middle
of the elicitation.
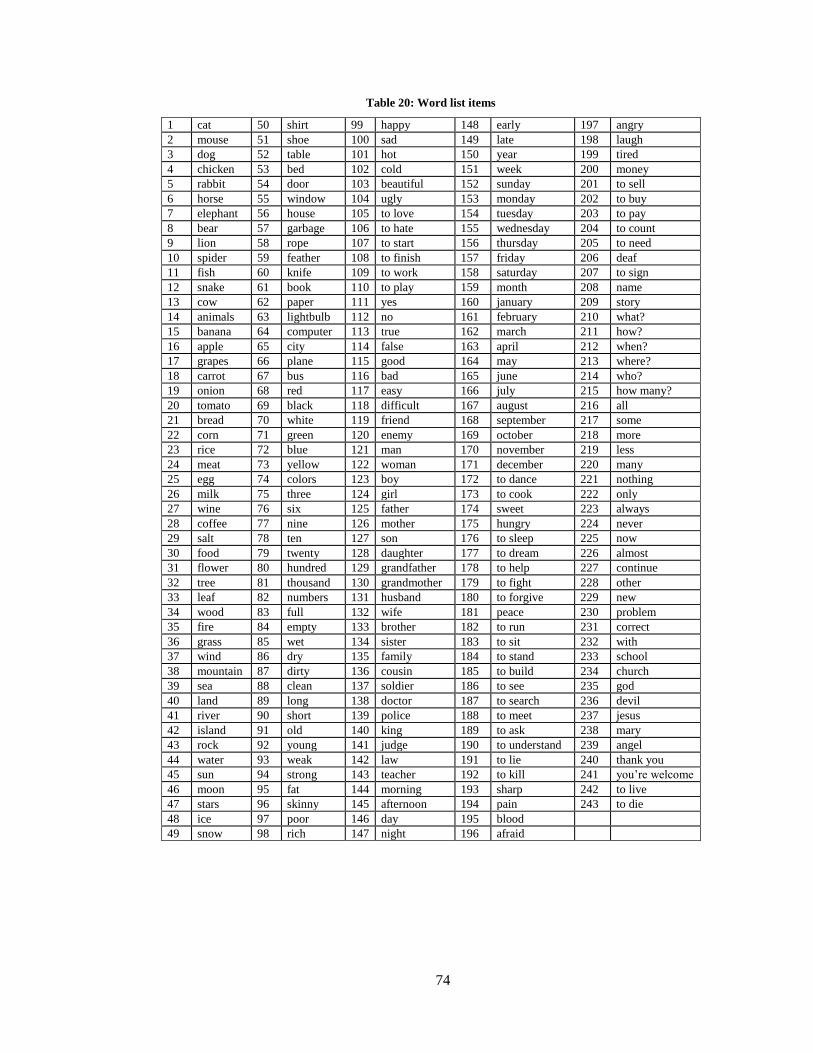
74
Table 20: Word list items
1 cat 50 shirt 99 happy 148 early 197 angry
2 mouse 51 shoe 100 sad 149 late 198 laugh
3 dog 52 table 101 hot 150 year 199 tired
4 chicken 53 bed 102 cold 151 week 200 money
5 rabbit 54 door 103 beautiful 152 sunday 201 to sell
6 horse 55 window 104 ugly 153 monday 202 to buy
7 elephant 56 house 105 to love 154 tuesday 203 to pay
8 bear 57 garbage 106 to hate 155 wednesday 204 to count
9 lion 58 rope 107 to start 156 thursday 205 to need
10 spider 59 feather 108 to finish 157 friday 206 deaf
11 fish 60 knife 109 to work 158 saturday 207 to sign
12 snake 61 book 110 to play 159 month 208 name
13 cow 62 paper 111 yes 160 january 209 story
14 animals 63 lightbulb 112 no 161 february 210 what?
15 banana 64 computer 113 true 162 march 211 how?
16 apple 65 city 114 false 163 april 212 when?
17 grapes 66 plane 115 good 164 may 213 where?
18 carrot 67 bus 116 bad 165 june 214 who?
19 onion 68 red 117 easy 166 july 215 how many?
20 tomato 69 black 118 difficult 167 august 216 all
21 bread 70 white 119 friend 168 september 217 some
22 corn 71 green 120 enemy 169 october 218 more
23 rice 72 blue 121 man 170 november 219 less
24 meat 73 yellow 122 woman 171 december 220 many
25 egg 74 colors 123 boy 172 to dance 221 nothing
26 milk 75 three 124 girl 173 to cook 222 only
27 wine 76 six 125 father 174 sweet 223 always
28 coffee 77 nine 126 mother 175 hungry 224 never
29 salt 78 ten 127 son 176 to sleep 225 now
30 food 79 twenty 128 daughter 177 to dream 226 almost
31 flower 80 hundred 129 grandfather 178 to help 227 continue
32 tree 81 thousand 130 grandmother 179 to fight 228 other
33 leaf 82 numbers 131 husband 180 to forgive 229 new
34 wood 83 full 132 wife 181 peace 230 problem
35 fire 84 empty 133 brother 182 to run 231 correct
36 grass 85 wet 134 sister 183 to sit 232 with
37 wind 86 dry 135 family 184 to stand 233 school
38 mountain 87 dirty 136 cousin 185 to build 234 church
39 sea 88 clean 137 soldier 186 to see 235 god
40 land 89 long 138 doctor 187 to search 236 devil
41 river 90 short 139 police 188 to meet 237 jesus
42 island 91 old 140 king 189 to ask 238 mary
43 rock 92 young 141 judge 190 to understand 239 angel
44 water 93 weak 142 law 191 to lie 240 thank you
45 sun 94 strong 143 teacher 192 to kill 241 you’re welcome
46 moon 95 fat 144 morning 193 sharp 242 to live
47 stars 96 skinny 145 afternoon 194 pain 243 to die
48 ice 97 poor 146 day 195 blood
49 snow 98 rich 147 night 196 afraid
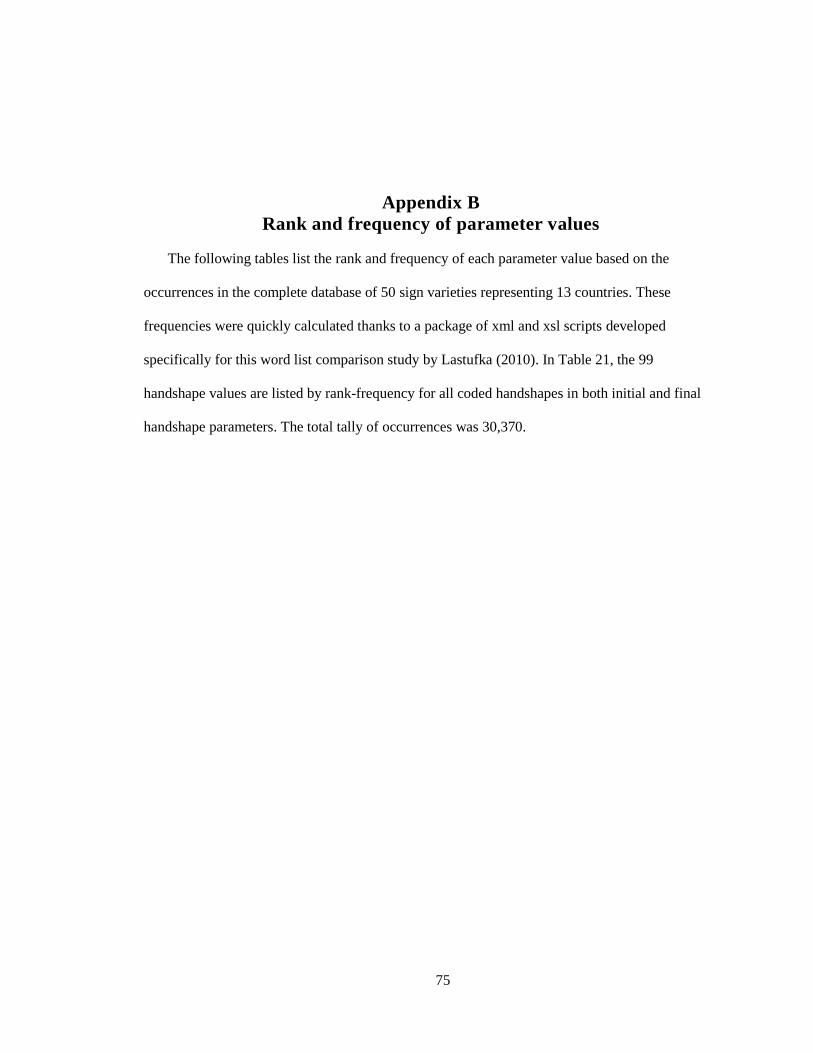
75
Appendix B
Rank and frequency of parameter values
The following tables list the rank and frequency of each parameter value based on the
occurrences in the complete database of 50 sign varieties representing 13 countries. These
frequencies were quickly calculated thanks to a package of xml and xsl scripts developed
specifically for this word list comparison study by Lastufka (2010). In Table 21, the 99
handshape values are listed by rank-frequency for all coded handshapes in both initial and final
handshape parameters. The total tally of occurrences was 30,370.
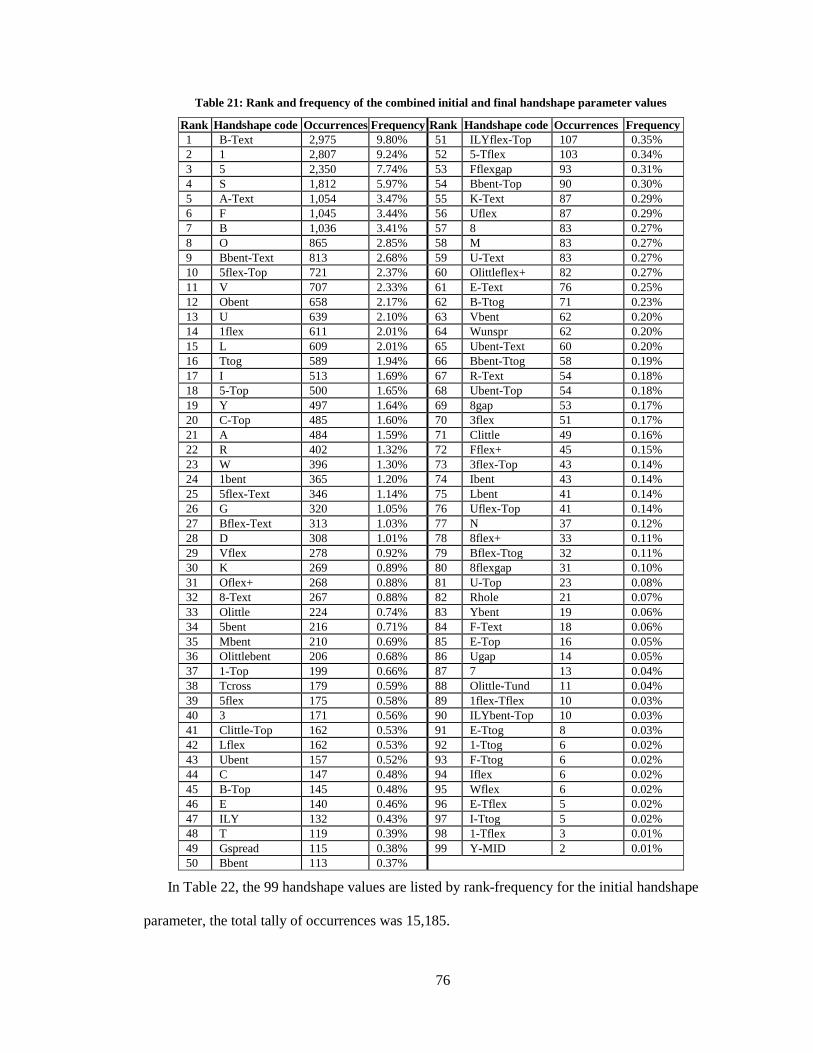
76
Table 21: Rank and frequency of the combined initial and final handshape parameter values
Rank Handshape code Occurrences Frequency Rank Handshape code Occurrences Frequency
1 B-Text 2,975 9.80% 51 ILYflex-Top 107 0.35%
2 1 2,807 9.24% 52 5-Tflex 103 0.34%
3 5 2,350 7.74% 53 Fflexgap 93 0.31%
4 S 1,812 5.97% 54 Bbent-Top 90 0.30%
5 A-Text 1,054 3.47% 55 K-Text 87 0.29%
6 F 1,045 3.44% 56 Uflex 87 0.29%
7 B 1,036 3.41% 57 8 83 0.27%
8 O 865 2.85% 58 M 83 0.27%
9 Bbent-Text 813 2.68% 59 U-Text 83 0.27%
10 5flex-Top 721 2.37% 60 Olittleflex+ 82 0.27%
11 V 707 2.33% 61 E-Text 76 0.25%
12 Obent 658 2.17% 62 B-Ttog 71 0.23%
13 U 639 2.10% 63 Vbent 62 0.20%
14 1flex 611 2.01% 64 Wunspr 62 0.20%
15 L 609 2.01% 65 Ubent-Text 60 0.20%
16 Ttog 589 1.94% 66 Bbent-Ttog 58 0.19%
17 I 513 1.69% 67 R-Text 54 0.18%
18 5-Top 500 1.65% 68 Ubent-Top 54 0.18%
19 Y 497 1.64% 69 8gap 53 0.17%
20 C-Top 485 1.60% 70 3flex 51 0.17%
21 A 484 1.59% 71 Clittle 49 0.16%
22 R 402 1.32% 72 Fflex+ 45 0.15%
23 W 396 1.30% 73 3flex-Top 43 0.14%
24 1bent 365 1.20% 74 Ibent 43 0.14%
25 5flex-Text 346 1.14% 75 Lbent 41 0.14%
26 G 320 1.05% 76 Uflex-Top 41 0.14%
27 Bflex-Text 313 1.03% 77 N 37 0.12%
28 D 308 1.01% 78 8flex+ 33 0.11%
29 Vflex 278 0.92% 79 Bflex-Ttog 32 0.11%
30 K 269 0.89% 80 8flexgap 31 0.10%
31 Oflex+ 268 0.88% 81 U-Top 23 0.08%
32 8-Text 267 0.88% 82 Rhole 21 0.07%
33 Olittle 224 0.74% 83 Ybent 19 0.06%
34 5bent 216 0.71% 84 F-Text 18 0.06%
35 Mbent 210 0.69% 85 E-Top 16 0.05%
36 Olittlebent 206 0.68% 86 Ugap 14 0.05%
37 1-Top 199 0.66% 87 7 13 0.04%
38 Tcross 179 0.59% 88 Olittle-Tund 11 0.04%
39 5flex 175 0.58% 89 1flex-Tflex 10 0.03%
40 3 171 0.56% 90 ILYbent-Top 10 0.03%
41 Clittle-Top 162 0.53% 91 E-Ttog 8 0.03%
42 Lflex 162 0.53% 92 1-Ttog 6 0.02%
43 Ubent 157 0.52% 93 F-Ttog 6 0.02%
44 C 147 0.48% 94 Iflex 6 0.02%
45 B-Top 145 0.48% 95 Wflex 6 0.02%
46 E 140 0.46% 96 E-Tflex 5 0.02%
47 ILY 132 0.43% 97 I-Ttog 5 0.02%
48 T 119 0.39% 98 1-Tflex 3 0.01%
49 Gspread 115 0.38% 99 Y-MID 2 0.01%
50 Bbent 113 0.37%
In Table 22, the 99 handshape values are listed by rank-frequency for the initial handshape
parameter, the total tally of occurrences was 15,185.

77
Table 22: Rank and frequency of initial handshape parameter values
Rank Handshape code Occurrences Frequency Rank Handshape code Occurrences Frequency
1 1 1,586 10.44% 51 M 58 0.38%
2 B-Text 1,522 10.02% 52 ILYflex-Top 55 0.36%
3 5 1,085 7.15% 53 Ubent 54 0.36%
4 S 868 5.72% 54 T 53 0.35%
5 A-Text 552 3.64% 55 E 51 0.34%
6 B 530 3.49% 56 Bbent 50 0.33%
7 O 480 3.16% 57 8 47 0.31%
8 F 467 3.08% 58 5-Tflex 46 0.30%
9 V 375 2.47% 59 Uflex 38 0.25%
10 Bbent-Text 370 2.44% 60 B-Ttog 35 0.23%
11 5flex-Top 334 2.20% 61 E-Text 35 0.23%
12 U 331 2.18% 62 8flex+ 33 0.22%
13 I 298 1.96% 63 Wunspr 33 0.22%
14 L 293 1.93% 64 8gap 32 0.21%
15 Ttog 290 1.91% 65 Clittle 29 0.19%
16 Oflex+ 249 1.64% 66 Vbent 29 0.19%
17 A 247 1.63% 67 Olittlebent 27 0.18%
18 Obent 233 1.53% 68 R-Text 27 0.18%
19 C-Top 230 1.51% 69 Bbent-Ttog 26 0.17%
20 Y 229 1.51% 70 Fflex+ 24 0.16%
21 1flex 220 1.45% 71 U-Top 21 0.14%
22 W 212 1.40% 72 3flex-Top 20 0.13%
23 R 205 1.35% 73 8flexgap 17 0.11%
24 5-Top 192 1.26% 74 Ibent 17 0.11%
25 G 187 1.23% 75 3flex 16 0.11%
26 D 167 1.10% 76 N 16 0.11%
27 5flex-Text 166 1.09% 77 Uflex-Top 16 0.11%
28 1-Top 149 0.98% 78 Bflex-Ttog 15 0.10%
29 K 146 0.96% 79 E-Top 14 0.09%
30 8-Text 145 0.95% 80 Rhole 12 0.08%
31 5bent 135 0.89% 81 F-Text 10 0.07%
32 1bent 133 0.88% 82 Olittle-Tund 10 0.07%
33 Bflex-Text 125 0.82% 83 Ybent 10 0.07%
34 Vflex 124 0.82% 84 Ugap 9 0.06%
35 Mbent 113 0.74% 85 Lbent 8 0.05%
36 B-Top 108 0.71% 86 Ubent-Text 8 0.05%
37 3 95 0.63% 87 7 6 0.04%
38 Olittle 92 0.61% 88 E-Ttog 5 0.03%
39 Gspread 89 0.59% 89 ILYbent-Top 5 0.03%
40 Clittle-Top 87 0.57% 90 1flex-Tflex 4 0.03%
41 C 85 0.56% 91 I-Ttog 4 0.03%
42 5flex 77 0.51% 92 Ubent-Top 4 0.03%
43 Tcross 73 0.48% 93 E-Tflex 3 0.02%
44 Olittleflex+ 71 0.47% 94 F-Ttog 3 0.02%
45 U-Text 66 0.43% 95 1-Ttog 2 0.01%
46 Lflex 65 0.43% 96 Iflex 2 0.01%
47 ILY 63 0.41% 97 Wflex 2 0.01%
48 Fflexgap 62 0.41% 98 1-Tflex 1 0.01%
49 K-Text 61 0.40% 99 Y-MID 1 0.01%
50 Bbent-Top 60 0.40%
In Table 23, the 99 handshape values are listed by rank-frequency for the final handshape
parameter, the total tally of occurrences was 15,185.
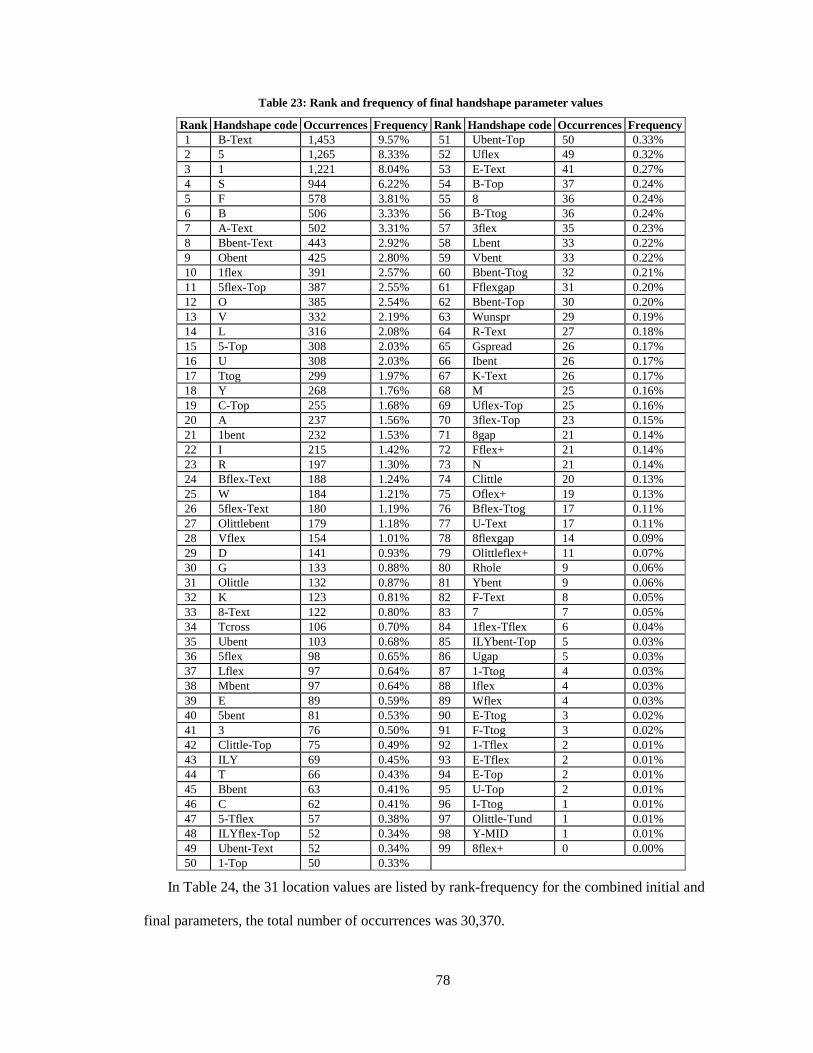
78
Table 23: Rank and frequency of final handshape parameter values
Rank Handshape code Occurrences Frequency Rank Handshape code Occurrences Frequency
1 B-Text 1,453 9.57% 51 Ubent-Top 50 0.33%
2 5 1,265 8.33% 52 Uflex 49 0.32%
3 1 1,221 8.04% 53 E-Text 41 0.27%
4 S 944 6.22% 54 B-Top 37 0.24%
5 F 578 3.81% 55 8 36 0.24%
6 B 506 3.33% 56 B-Ttog 36 0.24%
7 A-Text 502 3.31% 57 3flex 35 0.23%
8 Bbent-Text 443 2.92% 58 Lbent 33 0.22%
9 Obent 425 2.80% 59 Vbent 33 0.22%
10 1flex 391 2.57% 60 Bbent-Ttog 32 0.21%
11 5flex-Top 387 2.55% 61 Fflexgap 31 0.20%
12 O 385 2.54% 62 Bbent-Top 30 0.20%
13 V 332 2.19% 63 Wunspr 29 0.19%
14 L 316 2.08% 64 R-Text 27 0.18%
15 5-Top 308 2.03% 65 Gspread 26 0.17%
16 U 308 2.03% 66 Ibent 26 0.17%
17 Ttog 299 1.97% 67 K-Text 26 0.17%
18 Y 268 1.76% 68 M 25 0.16%
19 C-Top 255 1.68% 69 Uflex-Top 25 0.16%
20 A 237 1.56% 70 3flex-Top 23 0.15%
21 1bent 232 1.53% 71 8gap 21 0.14%
22 I 215 1.42% 72 Fflex+ 21 0.14%
23 R 197 1.30% 73 N 21 0.14%
24 Bflex-Text 188 1.24% 74 Clittle 20 0.13%
25 W 184 1.21% 75 Oflex+ 19 0.13%
26 5flex-Text 180 1.19% 76 Bflex-Ttog 17 0.11%
27 Olittlebent 179 1.18% 77 U-Text 17 0.11%
28 Vflex 154 1.01% 78 8flexgap 14 0.09%
29 D 141 0.93% 79 Olittleflex+ 11 0.07%
30 G 133 0.88% 80 Rhole 9 0.06%
31 Olittle 132 0.87% 81 Ybent 9 0.06%
32 K 123 0.81% 82 F-Text 8 0.05%
33 8-Text 122 0.80% 83 7 7 0.05%
34 Tcross 106 0.70% 84 1flex-Tflex 6 0.04%
35 Ubent 103 0.68% 85 ILYbent-Top 5 0.03%
36 5flex 98 0.65% 86 Ugap 5 0.03%
37 Lflex 97 0.64% 87 1-Ttog 4 0.03%
38 Mbent 97 0.64% 88 Iflex 4 0.03%
39 E 89 0.59% 89 Wflex 4 0.03%
40 5bent 81 0.53% 90 E-Ttog 3 0.02%
41 3 76 0.50% 91 F-Ttog 3 0.02%
42 Clittle-Top 75 0.49% 92 1-Tflex 2 0.01%
43 ILY 69 0.45% 93 E-Tflex 2 0.01%
44 T 66 0.43% 94 E-Top 2 0.01%
45 Bbent 63 0.41% 95 U-Top 2 0.01%
46 C 62 0.41% 96 I-Ttog 1 0.01%
47 5-Tflex 57 0.38% 97 Olittle-Tund 1 0.01%
48 ILYflex-Top 52 0.34% 98 Y-MID 1 0.01%
49 Ubent-Text 52 0.34% 99 8flex+ 0 0.00%
50 1-Top 50 0.33%
In Table 24, the 31 location values are listed by rank-frequency for the combined initial and
final parameters, the total number of occurrences was 30,370.
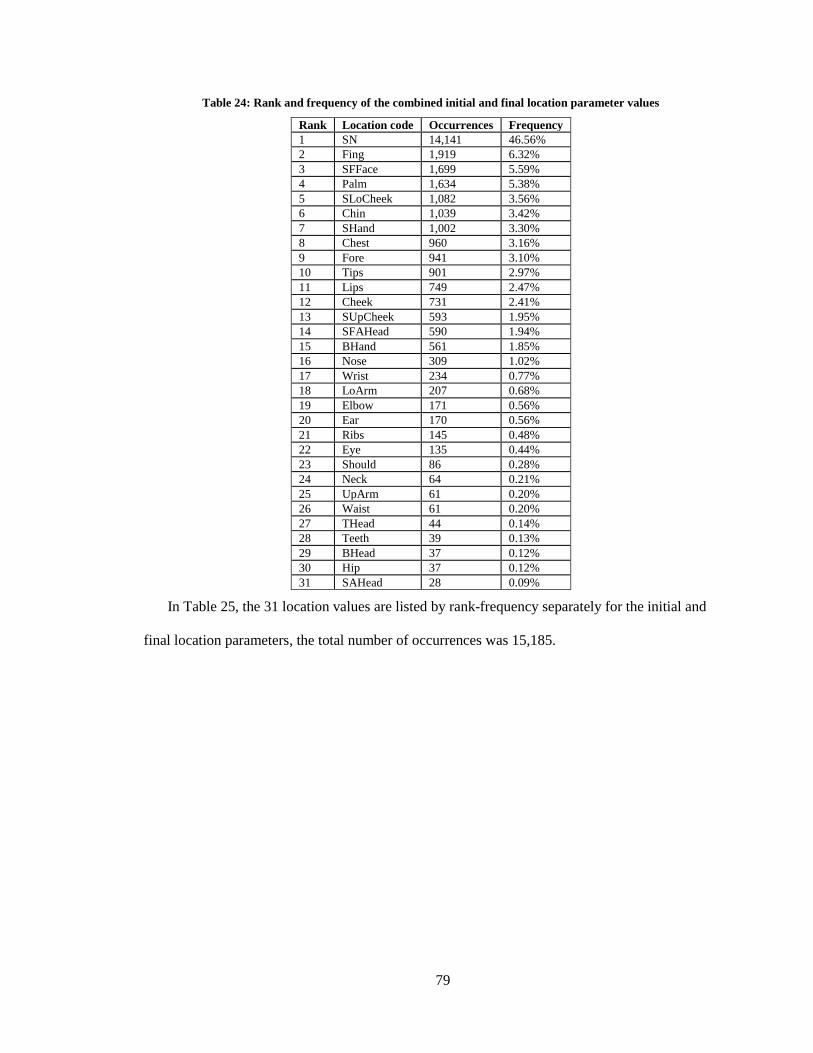
79
Table 24: Rank and frequency of the combined initial and final location parameter values
Rank Location code Occurrences Frequency
1 SN 14,141 46.56%
2 Fing 1,919 6.32%
3 SFFace 1,699 5.59%
4 Palm 1,634 5.38%
5 SLoCheek 1,082 3.56%
6 Chin 1,039 3.42%
7 SHand 1,002 3.30%
8 Chest 960 3.16%
9 Fore 941 3.10%
10 Tips 901 2.97%
11 Lips 749 2.47%
12 Cheek 731 2.41%
13 SUpCheek 593 1.95%
14 SFAHead 590 1.94%
15 BHand 561 1.85%
16 Nose 309 1.02%
17 Wrist 234 0.77%
18 LoArm 207 0.68%
19 Elbow 171 0.56%
20 Ear 170 0.56%
21 Ribs 145 0.48%
22 Eye 135 0.44%
23 Should 86 0.28%
24 Neck 64 0.21%
25 UpArm 61 0.20%
26 Waist 61 0.20%
27 THead 44 0.14%
28 Teeth 39 0.13%
29 BHead 37 0.12%
30 Hip 37 0.12%
31 SAHead 28 0.09%
In Table 25, the 31 location values are listed by rank-frequency separately for the initial and
final location parameters, the total number of occurrences was 15,185.

80
Table 25: Rank and frequency of initial and final location parameter values
Initial Location Final Location
Rank Code Occurrences Frequency Rank Code Occurrences Frequency
1 SN 6,413 42.23% 1 SN 7,728 50.89%
2 Fing 1,085 7.15% 2 Fing 834 5.49%
3 SFFace 926 6.10% 3 SFFace 773 5.09%
4 Palm 908 5.98% 4 Palm 726 4.78%
5 Chin 656 4.32% 5 SHand 613 4.04%
6 Fore 597 3.93% 6 SLoCheek 610 4.02%
7 Tips 550 3.62% 7 Chest 465 3.06%
8 Chest 495 3.26% 8 Chin 383 2.52%
9 Lips 481 3.17% 9 Tips 351 2.31%
10 SLoCheek 472 3.11% 10 Fore 344 2.27%
11 Cheek 398 2.62% 11 Cheek 333 2.19%
12 SHand 389 2.56% 12 BHand 298 1.96%
13 SFAHead 340 2.24% 13 SUpCheek 282 1.86%
14 SUpCheek 311 2.05% 14 Lips 268 1.76%
15 BHand 263 1.73% 15 SFAHead 250 1.65%
16 Nose 213 1.40% 16 Wrist 140 0.92%
17 Ear 94 0.62% 17 Elbow 115 0.76%
18 Eye 94 0.62% 18 LoArm 113 0.74%
19 LoArm 94 0.62% 19 Ribs 101 0.67%
20 Wrist 94 0.62% 20 Nose 96 0.63%
21 Elbow 56 0.37% 21 Ear 76 0.50%
22 Should 48 0.32% 22 Waist 49 0.32%
23 Ribs 44 0.29% 23 Eye 41 0.27%
24 Neck 37 0.24% 24 Should 38 0.25%
25 UpArm 34 0.22% 25 BHead 35 0.23%
26 Hip 23 0.15% 26 Neck 27 0.18%
27 SAHead 22 0.14% 27 UpArm 27 0.18%
28 THead 18 0.12% 28 THead 26 0.17%
29 Teeth 16 0.11% 29 Teeth 23 0.15%
30 Waist 12 0.08% 30 Hip 14 0.09%
31 BHead 2 0.01% 31 SAHead 6 0.04%
In Table 26, the two palm orientation values are listed from most to least frequently occurring
out of 15,185 total occurrences.
Table 26: Rank and frequency of the two palm orientation parameter values
Rank Palm orientation code Occurrences Frequency
1 P- 10,508 69.20%
2 P+ 4,677 30.80%
In Table 27, the five joint movement values are listed from most to least frequently occurring
out of 15,185 total occurrences.
Table 27: Rank and frequency of the five joint movement parameter values
Rank Joint movement code Occurrences Frequency
1 Elbow 7,551 49.73%
2 Fingers 4,847 31.92%
3 Wrist 1,552 10.22%
4 Shoulder 1,026 6.76%
5 Hold 209 1.38%
81
Appendix C
Levenshtein distances between each variety pairing
Table 28 lists the Levenshtein distances between each pairing of the 50 sign language
varieties (1,225 pairs) using the four parameter coding system of initial and final handshapes and
initial and final locations. This data set uses the refined word list of 215 items and the refined
handshape parameter value inventory of 74 values.
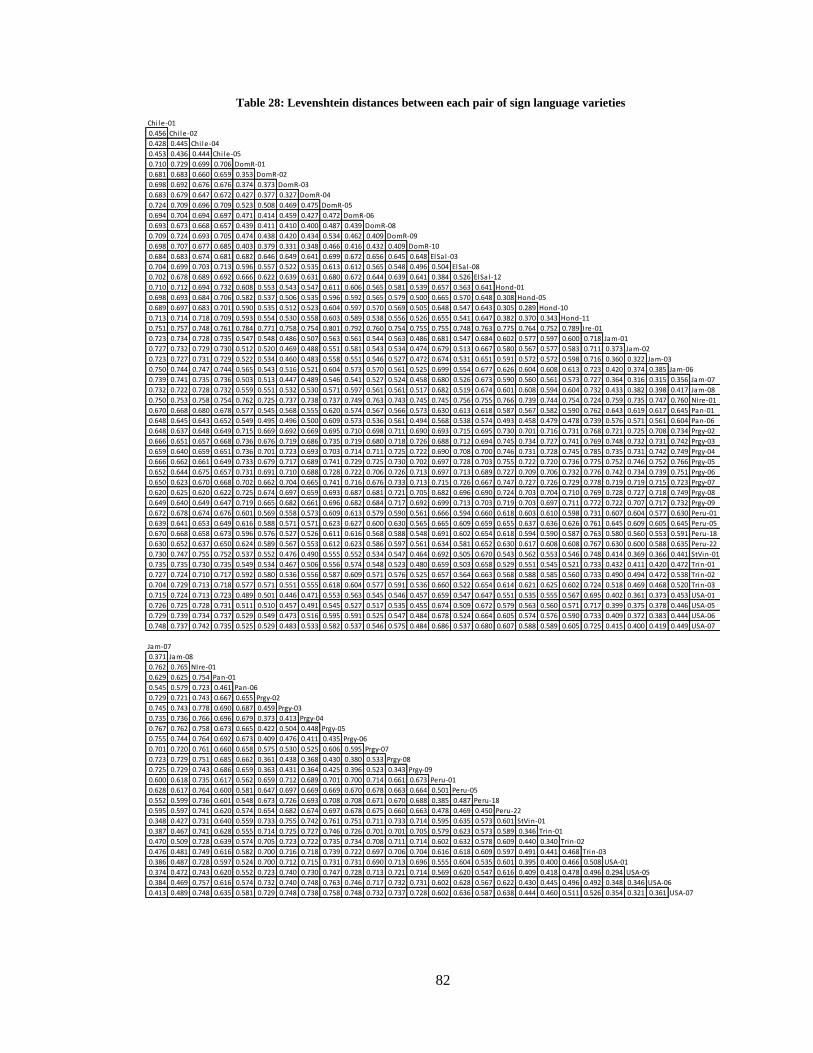
82
Table 28: Levenshtein distances between each pair of sign language varieties
Chi le-01
0.456 Chi le-02
0.428 0.445 Chi le-04
0.453 0.436 0.444 Chi le-05
0.710 0.729 0.699 0.706 DomR-01
0.681 0.683 0.660 0.659 0.353 DomR-02
0.698 0.692 0.676 0.676 0.374 0.373 DomR-03
0.683 0.679 0.647 0.672 0.427 0.377 0.327 DomR-04
0.724 0.709 0.696 0.709 0.523 0.508 0.469 0.475 DomR-05
0.694 0.704 0.694 0.697 0.471 0.414 0.459 0.427 0.472 DomR-06
0.693 0.673 0.668 0.657 0.439 0.411 0.410 0.400 0.487 0.439 DomR-08
0.709 0.724 0.693 0.705 0.474 0.438 0.420 0.434 0.534 0.462 0.409 DomR-09
0.698 0.707 0.677 0.685 0.403 0.379 0.331 0.348 0.466 0.416 0.432 0.409 DomR-10
0.684 0.683 0.674 0.681 0.682 0.646 0.649 0.641 0.699 0.672 0.656 0.645 0.648 ElSa l -03
0.704 0.699 0.703 0.713 0.596 0.557 0.522 0.535 0.613 0.612 0.565 0.548 0.496 0.504 ElSa l -08
0.702 0.678 0.689 0.692 0.666 0.622 0.639 0.631 0.680 0.672 0.644 0.639 0.641 0.384 0.526 ElSa l -12
0.710 0.712 0.694 0.732 0.608 0.553 0.543 0.547 0.611 0.606 0.565 0.581 0.539 0.657 0.563 0.641 Hond-01
0.698 0.693 0.684 0.706 0.582 0.537 0.506 0.535 0.596 0.592 0.565 0.579 0.500 0.665 0.570 0.648 0.308 Hond-05
0.689 0.697 0.683 0.701 0.590 0.535 0.512 0.523 0.604 0.597 0.570 0.569 0.505 0.648 0.547 0.643 0.305 0.289 Hond-10
0.713 0.714 0.718 0.709 0.593 0.554 0.530 0.558 0.603 0.589 0.538 0.556 0.526 0.655 0.541 0.647 0.382 0.370 0.343 Hond-11
0.751 0.757 0.748 0.761 0.784 0.771 0.758 0.754 0.801 0.792 0.760 0.754 0.755 0.755 0.748 0.763 0.775 0.764 0.752 0.789 Ire-01
0.723 0.734 0.728 0.735 0.547 0.548 0.486 0.507 0.563 0.561 0.544 0.563 0.486 0.681 0.547 0.684 0.602 0.577 0.597 0.600 0.718 Jam-01
0.727 0.732 0.729 0.730 0.512 0.520 0.469 0.488 0.551 0.581 0.543 0.534 0.474 0.679 0.513 0.667 0.580 0.567 0.577 0.583 0.711 0.373 Jam-02
0.723 0.727 0.731 0.729 0.522 0.534 0.460 0.483 0.558 0.551 0.546 0.527 0.472 0.674 0.531 0.651 0.591 0.572 0.572 0.598 0.716 0.360 0.322 Jam-03
0.750 0.744 0.747 0.744 0.565 0.543 0.516 0.521 0.604 0.573 0.570 0.561 0.525 0.699 0.554 0.677 0.626 0.604 0.608 0.613 0.723 0.420 0.374 0.385 Jam-06
0.739 0.741 0.735 0.736 0.503 0.513 0.447 0.489 0.546 0.541 0.527 0.524 0.458 0.680 0.526 0.673 0.590 0.560 0.561 0.573 0.727 0.364 0.316 0.315 0.356 Jam-07
0.732 0.722 0.728 0.732 0.559 0.551 0.532 0.530 0.571 0.597 0.561 0.561 0.517 0.682 0.519 0.674 0.601 0.608 0.594 0.604 0.732 0.433 0.382 0.398 0.417 Jam-08
0.750 0.753 0.758 0.754 0.762 0.725 0.737 0.738 0.737 0.749 0.763 0.743 0.745 0.745 0.756 0.755 0.766 0.739 0.744 0.754 0.724 0.759 0.735 0.747 0.760 NIre-01
0.670 0.668 0.680 0.678 0.577 0.545 0.568 0.555 0.620 0.574 0.567 0.566 0.573 0.630 0.613 0.618 0.587 0.567 0.582 0.590 0.762 0.643 0.619 0.617 0.645 Pan-01
0.648 0.645 0.643 0.652 0.549 0.495 0.496 0.500 0.609 0.573 0.536 0.561 0.494 0.568 0.538 0.574 0.493 0.458 0.479 0.478 0.739 0.576 0.571 0.561 0.604 Pan-06
0.648 0.637 0.648 0.649 0.715 0.669 0.692 0.669 0.695 0.710 0.698 0.711 0.690 0.693 0.715 0.695 0.730 0.701 0.716 0.731 0.768 0.721 0.725 0.708 0.734 Prgy-02
0.666 0.651 0.657 0.668 0.736 0.676 0.719 0.686 0.735 0.719 0.680 0.718 0.726 0.688 0.712 0.694 0.745 0.734 0.727 0.741 0.769 0.748 0.732 0.731 0.742 Prgy-03
0.659 0.640 0.659 0.651 0.736 0.701 0.723 0.693 0.703 0.714 0.711 0.725 0.722 0.690 0.708 0.700 0.746 0.731 0.728 0.745 0.785 0.735 0.731 0.742 0.749 Prgy-04
0.666 0.662 0.661 0.649 0.733 0.679 0.717 0.689 0.741 0.729 0.725 0.730 0.702 0.697 0.728 0.703 0.755 0.722 0.720 0.736 0.775 0.752 0.746 0.752 0.766 Prgy-05
0.652 0.644 0.675 0.657 0.731 0.691 0.710 0.688 0.728 0.722 0.706 0.726 0.713 0.697 0.713 0.689 0.727 0.709 0.706 0.732 0.776 0.742 0.734 0.739 0.751 Prgy-06
0.650 0.623 0.670 0.668 0.702 0.662 0.704 0.665 0.741 0.716 0.676 0.733 0.713 0.715 0.726 0.667 0.747 0.727 0.726 0.729 0.778 0.719 0.719 0.715 0.723 Prgy-07
0.620 0.625 0.620 0.622 0.725 0.674 0.697 0.659 0.693 0.687 0.681 0.721 0.705 0.682 0.696 0.690 0.724 0.703 0.704 0.710 0.769 0.728 0.727 0.718 0.749 Prgy-08
0.649 0.640 0.649 0.647 0.719 0.665 0.682 0.661 0.696 0.682 0.684 0.717 0.692 0.699 0.713 0.703 0.719 0.703 0.697 0.711 0.772 0.722 0.707 0.717 0.732 Prgy-09
0.672 0.678 0.674 0.676 0.601 0.569 0.558 0.573 0.609 0.613 0.579 0.590 0.561 0.666 0.594 0.660 0.618 0.603 0.610 0.598 0.731 0.607 0.604 0.577 0.630 Peru-01
0.639 0.641 0.653 0.649 0.616 0.588 0.571 0.571 0.623 0.627 0.600 0.630 0.565 0.665 0.609 0.659 0.655 0.637 0.636 0.626 0.761 0.645 0.609 0.605 0.645 Peru-05
0.670 0.668 0.658 0.673 0.596 0.576 0.527 0.526 0.611 0.616 0.568 0.588 0.548 0.691 0.602 0.654 0.618 0.594 0.590 0.587 0.763 0.580 0.560 0.553 0.591 Peru-18
0.630 0.652 0.637 0.650 0.624 0.589 0.567 0.553 0.612 0.623 0.586 0.597 0.561 0.634 0.581 0.652 0.630 0.617 0.608 0.608 0.767 0.630 0.600 0.588 0.635 Peru-22
0.730 0.747 0.755 0.752 0.537 0.552 0.476 0.490 0.555 0.552 0.534 0.547 0.464 0.692 0.505 0.670 0.543 0.562 0.553 0.546 0.748 0.414 0.369 0.366 0.441 StVin-01
0.735 0.735 0.730 0.735 0.549 0.534 0.467 0.506 0.556 0.574 0.548 0.523 0.480 0.659 0.503 0.658 0.529 0.551 0.545 0.521 0.733 0.432 0.411 0.420 0.472 Trin-01
0.727 0.724 0.710 0.717 0.592 0.580 0.536 0.556 0.587 0.609 0.571 0.576 0.525 0.657 0.564 0.663 0.568 0.588 0.585 0.560 0.733 0.490 0.494 0.472 0.538 Trin-02
0.704 0.729 0.713 0.718 0.577 0.571 0.551 0.555 0.618 0.604 0.577 0.591 0.536 0.660 0.522 0.654 0.614 0.621 0.625 0.602 0.724 0.518 0.469 0.468 0.520 Trin-03
0.715 0.724 0.713 0.723 0.489 0.501 0.446 0.471 0.553 0.563 0.545 0.546 0.457 0.659 0.547 0.647 0.551 0.535 0.555 0.567 0.695 0.402 0.361 0.373 0.453 USA-01
0.726 0.725 0.728 0.731 0.511 0.510 0.457 0.491 0.545 0.527 0.517 0.535 0.455 0.674 0.509 0.672 0.579 0.563 0.560 0.571 0.717 0.399 0.375 0.378 0.446 USA-05
0.729 0.739 0.734 0.737 0.529 0.549 0.473 0.516 0.595 0.591 0.525 0.547 0.484 0.678 0.524 0.664 0.605 0.574 0.576 0.590 0.733 0.409 0.372 0.383 0.444 USA-06
0.748 0.737 0.742 0.735 0.525 0.529 0.483 0.533 0.582 0.537 0.546 0.575 0.484 0.686 0.537 0.680 0.607 0.588 0.589 0.605 0.725 0.415 0.400 0.419 0.449 USA-07
Jam-07
0.371 Jam-08
0.762 0.765 NIre-01
0.629 0.625 0.754 Pan-01
0.545 0.579 0.723 0.461 Pan-06
0.729 0.721 0.743 0.667 0.655 Prgy-02
0.745 0.743 0.778 0.690 0.687 0.459 Prgy-03
0.735 0.736 0.766 0.696 0.679 0.373 0.413 Prgy-04
0.767 0.762 0.758 0.673 0.665 0.422 0.504 0.448 Prgy-05
0.755 0.744 0.764 0.692 0.673 0.409 0.476 0.411 0.435 Prgy-06
0.701 0.720 0.761 0.660 0.658 0.575 0.530 0.525 0.606 0.595 Prgy-07
0.723 0.729 0.751 0.685 0.662 0.361 0.438 0.368 0.430 0.380 0.533 Prgy-08
0.725 0.729 0.743 0.686 0.659 0.363 0.431 0.364 0.425 0.396 0.523 0.343 Prgy-09
0.600 0.618 0.735 0.617 0.562 0.659 0.712 0.689 0.701 0.700 0.714 0.661 0.673 Peru-01
0.628 0.617 0.764 0.600 0.581 0.647 0.697 0.669 0.669 0.670 0.678 0.663 0.664 0.501 Peru-05
0.552 0.599 0.736 0.601 0.548 0.673 0.726 0.693 0.708 0.708 0.671 0.670 0.688 0.385 0.487 Peru-18
0.595 0.597 0.741 0.620 0.574 0.654 0.682 0.674 0.697 0.678 0.675 0.660 0.663 0.478 0.469 0.450 Peru-22
0.348 0.427 0.731 0.640 0.559 0.733 0.755 0.742 0.761 0.751 0.711 0.733 0.714 0.595 0.635 0.573 0.601 StVin-01
0.387 0.467 0.741 0.628 0.555 0.714 0.725 0.727 0.746 0.726 0.701 0.701 0.705 0.579 0.623 0.573 0.589 0.346 Trin-01
0.470 0.509 0.728 0.639 0.574 0.705 0.723 0.722 0.735 0.734 0.708 0.711 0.714 0.602 0.632 0.578 0.609 0.440 0.340 Trin-02
0.476 0.481 0.749 0.616 0.582 0.700 0.716 0.718 0.739 0.722 0.697 0.706 0.704 0.616 0.618 0.609 0.597 0.491 0.441 0.468 Trin-03
0.386 0.487 0.728 0.597 0.524 0.700 0.712 0.715 0.731 0.731 0.690 0.713 0.696 0.555 0.604 0.535 0.601 0.395 0.400 0.466 0.508 USA-01
0.374 0.472 0.743 0.620 0.552 0.723 0.740 0.730 0.747 0.728 0.713 0.721 0.714 0.569 0.620 0.547 0.616 0.409 0.418 0.478 0.496 0.294 USA-05
0.384 0.469 0.757 0.616 0.574 0.732 0.740 0.748 0.763 0.746 0.717 0.732 0.731 0.602 0.628 0.567 0.622 0.430 0.445 0.496 0.492 0.348 0.346 USA-06
0.413 0.489 0.748 0.635 0.581 0.729 0.748 0.738 0.758 0.748 0.732 0.737 0.728 0.602 0.636 0.587 0.638 0.444 0.460 0.511 0.526 0.354 0.321 0.361 USA-07
83
REFERENCES
Aldersson, Russell R., and Lisa J. McEntee-Atalianis. 2008. “A lexical comparison of signs from
Icelandic and Danish sign languages.” Sign Language Studies 9: 45-87.
van der Ark, René, Philippe Mennecier, John Nerbonne, and Franz Manni. 2007. Preliminary
identification of language groups and loan words in central Asia. In Proceedings of the
RANLP Workshop on Computational Phonology, ed. Petya Osenova, 13-20. Borovets,
Bulgaria. http://www.let.rug.nl/~nerbonne/papers/Ark-et-al-Central-Asia-2007.pdf.
Beijering, Karin, Charlotte Gooskens, and Wilbert Heeringa. 2008. “Predicting intelligibility and
perceived linguistic distance by means of the levenshtein algorithm.” Linguistics in the
Netherlands 25 (1): 13-24.
Bickford, J. Albert. 2005. “The sign languages of eastern Europe.” SIL Electronic Survey Reports
2005 (026): 45.
Blair, Frank. 1990. Survey on a shoestring: a manual for small-scale language surveys.
Publications in Linguistics 96. Dallas, TX: Summer Institute of Linguistics and the
University of Texas at Arlington.
Brentari, Diane. 1998. A prosodic model of sign language phonology. Cambridge, MA: MIT
Press.
Campbell, Lyle. 2004. Historical linguistics: An introduction. 2nd ed. Cambridge, MA: MIT
Press.
Casad, Eugene H. 1974. Dialect Intelligibility Testing. Summer Institute of Linguistics
Publications in Linguistics and Related Fields 38. Dallas, TX: Summer Institute of
Linguistics.
Ciupek-Reed, Julia. 2011. Participatory methods in sociolinguistic sign language survey: A case
study in El Salvador. M.A. Thesis, Grand Forks, ND: University of North Dakota.
Deibler, Ellis W., and David Trefry. 1963. Languages of the Chimbu sub-district. Port Moresby:
Department of Information and Extension Services.
Everitt, Brian S., Sabine Landau, and Morven Leese. 2001. Cluster Analysis. 4th ed. New York:
Oxford University Press.
Gudschinsky, Sarah C. 1956. “The abc’s of lexicostatistics (glottochronology).” Word 12 (2):
175-210.
Guerra Currie, Anne-Marie P., Richard P. Meier, and Keith Walters. 2002. A crosslinguistic
examination of the lexicons of four signed languages. In Modality and structure in signed
84
and spoken languages, ed. Richard P. Meier, Kearsy Cormier, and David Quinto-Pozos,
224-236. New York: Cambridge University Press.
Heeringa, Wilbert, Peter Kleiweg, Charlotte Gooskens, and John Nerbonne. 2006. Evaluation of
string distance algorithms for dialectology. In Proceedings of the Workshop on Linguistic
Distances, 51-62. Sydney.
Hendriks, Bernadet. 2008. Jordanian Sign Language: Aspects of grammar from a cross-linguistic
perspective. LOT Dissertation Series 193. Utrecht, the Netherlands: Netherlands
Graduate School of Linguistics.
http://www.lotpublications.nl/publish/articles/003014/bookpart.pdf.
Hurlbut, Hope M. 2007. “A survey of sign language in Taiwan.” SIL Electronic Survey Reports
2008 (001): 117.
Johnson, Jane E., and Russell J. Johnson. 2008. “Assessment of regional language varieties in
Indian Sign Language.” SIL Electronic Survey Reports 2008 (006): 121.
Johnston, Trevor. 2003. BSL, AUSLAN and NZSL: Three signed languages or one? In Cross-
linguistic perspectives in sign language research: selected papers from TISLR 2000, ed.
Anne Baker, B. van den Bogaerde, and O. Crasborn, 47-70. Hamburg: Signum.
Kessler, Brett. 2001. The significance of word lists. Dissertations in Linguistics. Stanford, CA:
Center for the Study of Language and Information Press.
Kleiweg, Peter. 2011. RuG/L04: software for dialectometrics and cartography.
http://www.let.rug.nl/~kleiweg/indexs.html.
Kluge, Angela. 2000. The Gbe language varieties of West Africa: A quantitative analysis of
lexical and grammatical features. Unpublished M.A. Thesis, Cardiff: University of
Wales, College of Cardiff. http://www.sil.org/silesr/2008/silesr2008-023.pdf.
———. 2005. “A Synchronic Lexical Study of Gbe Language Varieties: The Effects of Different
Similarity Judgment Criteria.” Linguistic Discovery 3 (1): 22-53.
———. 2007. “RTT retelling method: An alternative approach to intelligibility testing.” SIL
Electronic Survey Reports 2007: 14.
———. 2008. “A synchronic lexical study of the Ede language continuum of West Africa: The
effects of different similarity judgment criteria.” Afrikanistik online 2007 (4).
http://www.afrikanistik-online.de/archiv/2007/1328.
Lastufka, Michael. 2010. ParamValueUseFreq.xsl. Dallas, TX: SIL International.
Liddell, Scott K., and Robert E. Johnson. 1989. “American Sign Language: The phonological
base.” Sign Language Studies 64: 195-277.
Max Planck Institute for Psycholinguistics. 2011. ELAN - Language Archiving Technology.
Nijmegen, The Netherlands. http://www.lat-mpi.eu/tools/elan/.
85
McElhanon, Kenneth A. 1967. “Preliminary observations on Huon Peninsula languages.”
Oceanic Linguistics 6: 1-45.
McKee, David, and Graeme Kennedy. 2000. Lexical comparison of signs from American,
Australian, British, and New Zealand Sign Languages. In The signs of language
revisited: An anthology to honour Ursula Bellugi and Edward Klima, ed. Karen
Emmorey and Harlan Lane, 49-76. Mahwah, NJ: Lawrence Erlbaum Associates, Inc.
Meier, Richard P., Claude Mauk, Gene R. Mirus, and Kimberly E. Conlin. 1998. Motoric
constraints on early sign acquisition. In The proceedings of the twenty-ninth annual child
language research forum, ed. Eve V. Clark, 63-72. Stanford, CA: Center for the Study of
Language and Information Press.
Osugi, Yutaka, Ted Supalla, and Rebecca Webb. 1999. “The use of word elicitation to identify
distinctive gestural systems on Amami Island.” Sign Language & Linguistics 2 (1): 87-
112.
Parkhurst, Stephen, and Dianne Parkhurst. 2003. “Lexical comparisons of signed languages and
the effects of iconicity.” Work Papers of the Summer Institute of Linguistics, University
of North Dakota Session 47: 17.
———. 2007. “Spanish Sign Language survey.” SIL Electronic Survey Reports 2007 (008): 85.
Parks, Elizabeth, and Jason Parks. 2008. “Sociolinguistic survey report of the deaf community of
Guatemala.” SIL Electronic Survey Reports 2008 (016): 30.
———. 2010a. “A Sociolinguistic Profile of the Peruvian Deaf Community.” Sign Language
Studies 10 (4): 33.
———. 2010b. Investigating sign language variation through intelligibility testing: The recorded
text test retelling method. In TISLR 2010 Posters. West Lafayette, IN.
http://www.purdue.edu/tislr10/pdfs/Parks Parks.pdf.
Rensch, Calvin R. 1992. Calculating lexical similarity. In Windows on bilingualism, ed. Eugene
H. Casad, 13-15. Summer Institute of Linguistics and the University of Texas at
Arlington Publications in Linguistics 110. Dallas, TX: The Summer Institute of
Linguistics and The University of Texas at Arlington.
Rozelle, Lorna. 2003. The structure of sign language lexicons: Inventory and distribution of
handshape and location. Doctoral dissertation, University of Washington.
Sanders, Arden G. 1977. Guidelines for conducting a lexicostatistic survey in Papua New Guinea.
In Language variation and survey techniques, ed. Richard Loving, 21:21-43. Workpapers
in Papua New Guinea languages. Ukarumpa, Papua New Guinea: Summer Institute of
Linguistics.
Sandler, Wendy. 1989. Phonological representation of the sign: Linearity and nonlinearity in
American Sign Language. Dordrecht: Foris.
Sandler, Wendy, and Diane Lillo-Martin. 2006. Sign language and linguistic universals. New
York: Cambridge University Press.
86
Sasaki, Daisuke. 2007. Comparing the lexicons of Japanese Sign Language and Taiwan Sign
Language: A preliminary study focusing on the difference in the handshape parameter. In
Sign languages in contact, ed. David Quinto-Pozos, 123-150. Sociolinguistics in Deaf
Communities 13. Washington, D.C.: Gallaudet University Press.
Schooling, Stephen J. 1981. A linguistic and sociolinguistic survey of French Polynesia.
Hamilton, N.Z.: Summer Institute of Linguistics.
Siedlecki Jr., Theodore, and John D. Bonvillian. 1993. “Location, handshape & movement:
Young children’s acquisition of the formational aspects of American Sign Language.”
Sign Language Studies 78: 31-52.
Simons, Gary F. 1977. Phonostatistic methods. In Language variation and survey techniques, ed.
Richard Loving, 155-184. Workpapers in Papua New Guinea Languages 21. Ukarumpa,
Papua New Guinea: Summer Institute of Linguistics.
Stokoe, William C., Dorethy Casterline, and Carl Croneberg. 1965. A dictionary of American
Sign Language on linguistic principles. Washington, D.C.: Gallaudet College Press.
Vanhecke, Eline, and Kristof De Weerdt. 2004. Regional variation in Flemish Sign Language. In
To the lexicon and beyond: Sociolinguistics in European deaf communities, ed. Mieke
van Herreweghe and M. Vermeerbergen, 27-38. Sociolinguistics in Deaf Communities
10. Washington, D.C.: Gallaudet University Press.
White, Chad. 2010. An evaluation of Levenshtein distance calculation. In Paper presented at the
International Language Assessment Conference, 41. Penang, Malaysia.
———. 2011. Rugloafer. Website. https://sites.google.com/site/rugloafer/home.
Williams, Holly, and Elizabeth Parks. 2010. “A Sociolinguistic Survey Report of the Dominican
Republic Deaf Community.” SIL Electronic Survey Reports 2010 (005): 20.
Woodward, James C. 1977. Historical bases of American Sign Language. In Understanding
language through sign language research, ed. P. Siple, 333-348. New York: Academic
Press.
———. 1993. “The relationship of sign language varieties in India, Pakistan and Nepal.” Sign
Language Studies 78: 15-22.
Xu, Wang. 2006. A comparison of Chinese and Taiwan Sign Languages: Towards a new model
for sign language comparison. M.A. Thesis, Columbus, OH: Ohio State University.
http://people.cohums.ohio-state.edu/chan9/ling/theses/xu-wang_2006_MA.pdf.
Yang, Cathryn. 2009. “Nisu dialect geography.” SIL Electronic Survey Reports 2009 (007): 40.