Embed Size (px)
Citation preview
SIGNALING CORPORATE STRATEGYIN IPO COMMUNICATION
A Study of Biotechnology IPOs on the NASDAQ
Hongzhi GaoUniversity of Otago
Jenny DarrochClaremont Graduate University
Damien MatherAlan MacGregor
University of Otago
A clear corporate strategy communication can be a signal to financial analysts and public investorsat the time of an initial public offering (IPO). This study examines IPO prospectuses of 57 biotech-nology firms listed on the NASDAQ between 1997 and 2002. Using regression analysis, this articleshows that the clarity, intensity, and consistency of the corporate strategy signal are not strong enoughto affect the 1st-day initial returns. However, consistent communication of a prospector strategy neg-atively impacts 30-day initial returns, whereas consistent communication of a defender strategy pos-itively impacts 30-day initial returns.
Keywords: corporate strategy; communication; IPO; market signal
Uncertainty characterizes the time surrounding an initial public offering(IPO). It is difficult to predict how the market will perform following theIPO date (Ibbotson, 1975). Similarly, determining a fair market value ofthe firm is complex because of the newness of the firm to the market(Certo, 2003) and the entrepreneurial nature of some IPO firms (Certo,
Hongzhi Gao is a teaching fellow in the marketing department at the Otago School of Business,University of Otago. Jenny Darroch is a professor of marketing at the Peter F. Drucker and MasatoshiIto Graduate School of Management, Claremont Graduate University, California. Damien Matherholds a senior CRM position with Vodafone New Zealand and an adjunct position in the marketingdepartment at the University of Otago. Alan MacGregor retired last year as the dean of the School ofBusiness at the University of Otago and is now a professor emeritus of that university.Correspondence concerning this article should be addressed to Hongzhi Gao, Department ofMarketing, University of Otago, P.O. Box 56, Dunedin, New Zealand; phone: 0064-3-4798195; fax:0064-3-4798172; e-mail: [email protected].
Journal of Business Communication, Volume 45, Number 1, January 2008 3-30DOI: 10.1177/0021943607309349© 2008 by the Association for Business Communication
at SAGE Publications on March 24, 2015job.sagepub.comDownloaded from
Daily, & Dalton, 2001; Daily, Certo, Dalton, & Roengpitya, 2003).Researchers attribute this uncertainty to information asymmetry or knowl-edge gaps between informed and uninformed investors (Ibbotson, 1975;Ibbotson, Sindelar, & Ritter, 1988; Rock, 1986). Although some debateexists about which investors are more informed, this article takes the posi-tions that (a) IPO issuers are more informed than public investors and (b)institutional investors are more informed than small investors (Daily et al.,2003; Ritter & Welch, 2002).
Extant research has applied signaling theory widely to address thisinformation asymmetry dilemma (Daily et al., 2003). Signaling theorysuggests that certain indicators provide signals to potential investors aboutthe capabilities of the IPO firm and therefore the likely future value of thefirm (Deeds, DeCarolis, & Coombs, 1997). Research reports that crediblecommunication outlining important information at the time of an IPO canreduce the information asymmetry between IPO issuers and investors. Sofar, the types of information included in research are (a) the compositionof the board; (b) the reputation of the underwriter; (c) the source andamount of venture capital; (d) the nature of the firm’s intellectual capital;and (e) the ability of those within the firm to manage knowledge. Crediblecommunication also helps IPO issuers reduce the information asymmetrybetween informed and uninformed investors and maximize the value ofgoing public (Azarmi, 2002; Bukh, Nielsen, Gormsen, & Mouritsen,2002; Carter, Dark, & Singh, 1998; Certo et al., 2001; Megginson &Weiss, 1991; Neck, Welbourne, & Meyer, 2000; Rosenstein & Wyatt,1997). One possible explanation for the link between credible communi-cation and the value of an IPO is that shareholders increasingly seekstrategic information (such as the information described above) in order toexplain an investment opportunity (Brown, 1997; Desai, 2000; Higgins &Diffenbach, 1989; Neck et al., 2000).
A group of studies reports that communication on corporate strategyreceived by the stock market has a significant impact on the value ofshares in the market (Day & Fahey, 1990; Higgins & Bannister, 1992;Higgins & Diffenbach, 1985; Parnell & Wright, 1993). However, we arenot aware of any published studies that empirically examine the relationshipbetween corporate strategy communication and returns to IPO investors onboth the 1st day and in the short-term after-IPO market (e.g., 30-day returns).This oversight is surprising because the communication of corporate strat-egy has been extensively argued to affect the market price and shareholdervalue in the long after-IPO market (e.g., a year or more after the event;Day & Fahey, 1990; Desai, 2000; Higgins & Bannister, 1992; Higgins &
4 JOURNAL OF BUSINESS COMMUNICATION
at SAGE Publications on March 24, 2015job.sagepub.comDownloaded from
Diffenbach, 1985). This article proposes that the communication of cor-porate strategy at the time of an IPO provides cues to assist analysts andinvestors in deciding whether or not to invest in an IPO firm. This viewbecomes particularly important when the IPO firm first goes publicbecause IPO managers must find a mechanism to communicate theirfirm’s quality in order to reduce the ex ante uncertainty and thus reducethe need to discount the stock price to attract less-informed investors(Daily et al., 2003). Through the credible communication of corporatestrategy, investors and analysts will better understand a firm’s strategicposture, activities, and plans and then be able to assess the fit betweeninternal resources, the firm’s corporate strategy, and the external environ-ment in which the firm operates. Thus, by obtaining strategic information,investors and analysts are in a better position to infer the potential valueof the firm (Day & Fahey, 1990). This article proposes a significant advan-tage for an IPO firm that provides as part of IPO documentation anoverview of the firm’s corporate strategy as “information cue” (Miles &Snow, 1978).
This article proposes that the commu-nication of corporate strategy at thetime of an IPO provides cues to assistanalysts and investors in decidingwhether or not to invest in an IPO firm.
Underpricing is generally defined as the difference between the price atwhich the firm’s stock was initially offered and the stock’s closing priceon the 1st day of trading (Ibbotson, 1975; Ibbotson et al., 1988; Ritter, 1998).Although a number of theoretical explanations (e.g., risk-averse underwriter,information asymmetry, and bandwagon) exist for IPO underpricing, this arti-cle adopts the information asymmetry approach. Therefore, we assert that ifIPO communication is credible, then underpricing will be minimized and sothe 1st-day returns will be close to expected returns (Certo et al., 2001;Ritter, 1998).
Of the studies that examine the relationship between an IPO event andinvestor returns, most focus on the returns on the 1st day of an IPO eventas an indicator of information asymmetry in the market (Bukh et al., 2002;Certo, 2003; Certo et al., 2001; Durukan, 2002; Megginson & Weiss,
Gao et al. / A STUDY OF BIOTECHNOLOGY IPOs 5
at SAGE Publications on March 24, 2015job.sagepub.comDownloaded from
1991; Neck et al., 2000; Rosenstein & Wyatt, 1997). However, we alsopropose that returns at some stage after an IPO event should be examinedbecause of market instability and opportunistic behavior surrounding theIPO event. By taking a slightly longer term view (in this case, 30 daysafter an IPO event), this research controls for the effect of opportunisticinvestors who order stocks before the 1st day and then on-sell these stockssoon after (Finkle & Lamb, 2002; Ritter, 1991, 1998). Accordingly, thisresearch includes both investor returns on the 1st day and 30 days after anIPO event to examine the effect of the strategy signal.
This article is structured as follows: We begin by presenting a theoret-ical framework, based on market signal and corporate strategy theory,before presenting research hypotheses. Next, the population of biotech-nology IPO firms used in the nominated time period is described and anoverview of the content analysis method used for data analysis is pro-vided. Finally, we discuss our findings and the implications of these forboth research and practice.
LITERATURE REVIEW
Corporate Strategy and Shareholder Value
Corporate strategy can influence the performance of an organization(Mintzberg, Lampel, Quinn, & Ghoshal, 2003). With a sound corporatestrategy, a firm can consistently create high value through its integratedbusiness activities; with a weak corporate strategy, the value of a firm’sbusiness activities deteriorates (Goold, Campbell, & Alexander, 1994).Thus, shareholders see corporate strategy as an important proxy for thelikely value of the firm (Day & Fahey, 1990).
Corporate strategy provides a navigation map to the investors and analysts(Desai, 2000). The effective communication of corporate strategy is impor-tant because it builds relationships with and encourages the involvementof investors and analysts (Bukh et al., 2002; Desai, 2000). Effective com-munication of corporate strategy can also enhance shareholder satisfaction(Higgins & Bannister, 1992) and build employee morale (Burgi & Roos,2003). Credible communication further enables managers within the firmto crystallize and clearly articulate corporate strategy to employees andinvestors alike. This, in turn, helps managers reinforce or redevelop strategicchoices (Burgi & Roos, 2003) and increases the confidence stakeholdersplace upon the strategic ability of management (Mintzberg et al., 2003).
6 JOURNAL OF BUSINESS COMMUNICATION
at SAGE Publications on March 24, 2015job.sagepub.comDownloaded from

Although those within the firm endeavor to better communicate corporatestrategy, evidence suggests that shareholders also seek to better understandthe strategic posture of the firm (Day & Fahey, 1990; Rapport, 1981).Possible explanations for this phenomenon are as follows: (a) The environ-ment in which many firms operate is ever more dynamic and competitive(Brown, 1997; Lynch, 2000; Mintzberg et al., 2003; Rapport, 1981); or (b)traditional financial measures are no longer comprehensive indicators ofinternal management capabilities (Beattie, 1999; Eccles, Hertz, Keegan, &Philips, 2001). This second point is especially relevant with IPO firms, whichoften lack financial history; furthermore, any history might be distorted by along R&D stage and negative profit (Cumby & Conrod, 2001).
Corporate Strategy as an IPO Market Signal
Spence (1973, 1974) introduces the concept of a market signal whenstudying the labor market to explain an observable proxy that can be used topredict unobservable attributes of the issue under examination (Spence,1973). As an example, Spence (1973) argues that employers could use theeducation level of a job applicant as a signal of the likely productive capa-bility of that applicant (Spence, 1973). Thus, market signals reduce theamount of information asymmetry between buyers and sellers and, accord-ingly, improve the effectiveness and efficiency of a market (Engers, 1987).For a market signal to work, the key requirements are that information (a) isobservable, (b) is difficult to alter, (c) is costly to produce and change, (d) isdifficult to imitate, (e) reduces asymmetry between signal senders andreceivers, and (f) is persistent (Riley, 1975; Spence, 1973, 1974).
This study classifies IPO prospectuses as a market signaling activitybecause the IPO prospectus attempts to reduce information asymmetrybetween those buying and selling stocks in the IPO firm. Based on marketsignaling literature, the following observations are made to support thepositioning of corporate strategy communicated from IPO prospectuses asa market signal. First, the corporate strategy of an IPO company is anobservable and easy-to-notice piece of information from an IPO prospec-tus (Marino, Castaldi, & Dollinger, 1989). The IPO prospectus providesgreater detail about a company’s strategic planning, products/markets, andmanagement structure than any other form of communication (e.g., pressreleases, road shows, advertisements) and so has the potential to captureinvestors’ attention at the time of the IPO event. Prospectuses are widelyused by investors and their reference groups (e.g., analysts) to understand
Gao et al. / A STUDY OF BIOTECHNOLOGY IPOs 7
at SAGE Publications on March 24, 2015job.sagepub.comDownloaded from
the likely value of the firm (Cumby & Conrod, 2001; Marino et al., 1989;Song, Rhee, & Adams, 2001).
This study classifies IPO prospectusesas a market signaling activity becausethe IPO prospectus attempts toreduce information asymmetrybetween those buying and sellingstocks in the IPO firm.
Second, prior to publication, the strategic information communicated inan IPO prospectus can be altered by managers (Meek, Roberts, & Gray,1995). Once published, however, managers need to implement thosestrategies in order to win the ongoing trust from investors and analysts.
Third, the establishment and communication of a firm’s corporate strategyare costly, risky (Porter, 1980), and difficult to imitate. Due to the nature ofthe corporate strategy in addressing multiple dimensions of a business, its for-mulation and implementation are a gradual and costly process (Doty, Glick,& Huber, 1993; Miles & Snow, 1978; Parnell & Wright, 1993). A strategy willbe seen as credible when there is a perceived fit between the strategy itself andthe context within which the firm operates, for example, the product/marketenvironment, technology environment, and management structure (Dotyet al., 1993; Miles & Snow, 1978). The requirement for fit makes imitationby competitors difficult. A “hurried” announcement of a corporate strategymay lead to a negative reaction from the market because investors and theirreference groups will evaluate the firm’s performance based on theannounced strategic plan (Day & Fahey, 1990; Higgins & Bannister, 1992;Higgins & Diffenbach, 1985, 1989).
Fourth, strategic information asymmetry exists between the managementteam in an IPO firm and outside investors in the IPO market (Beatty & Ritter,1986; Rock, 1986). This information asymmetry can be reduced wheninvestors accept corporate strategy as a cue. Through the clear identificationof corporate strategy, investors and analysts can better understand a firm’sstrategic posture, activities, and plans and assess the fit between internalresources and the external environment in which the firm operates. Investorsand analysts are therefore in a better position to infer the potential value ofthe firm, taking into account other financial performance data (Day &
8 JOURNAL OF BUSINESS COMMUNICATION
at SAGE Publications on March 24, 2015job.sagepub.comDownloaded from

Fahey, 1990). In addition, the information disclosure of a public firm fol-lowing an IPO is persistent (Baruch, 1992) and either reinforces or dimin-ishes the signal. This article proposes a significant advantage for an IPOissuer that provides an overview of the firm’s corporate strategy as infor-mation cue (Miles & Snow, 1978) as part of the IPO documentation.
Miles and Snow Strategy Typology
Having established the importance of corporate strategy as a marketsignal, this article now considers types of strategy. In this study, the Milesand Snow strategy typology is used to classify the corporate strategy com-municated during an IPO event. Compared with other typologies (Ansoff,1965; Mintzberg, 1987; Porter, 1980), the Miles and Snow typologyfocuses more on the strategic intentions of the firm rather than actualstrategic performance. This typology is particularly useful at predictingthe likely future strategic behaviors and performance of the firm (Dotyet al., 1993; Segev, 1989; Shortell & Zajac, 1990) and so is appropriate forIPO firms. The Miles and Snow strategy typology also enables an inte-grated and systematic examination of the strategic patterns of the firm(McDaniel & Kolari, 1987; Zahra, 1987).
The Miles and Snow (1978) typology addresses three problems a firmmight confront: entrepreneurial (product/market) problems, technological(engineering) problems, and administrative problems. The classification offirms into one of four strategy types—prospectors, defenders, analyzers, andreactors—depends on how a firm addresses these three basic problems.
Prospectors perceive a dynamic, uncertain environment and maintainflexibility in order to compete in the market (Parnell & Wright, 1993). Assuch, prospectors usually target broad markets and continually search fornew market opportunities. Prospectors are creators of change and uncer-tainty, to which their competitors must respond (Shoham, Evangelista, &Albaum, 2002). To maintain the advantage of innovation, prospectors tendto possess a loose structure, low division of labor, and low formalizationand centralization (Parnell & Wright, 1993).
Defenders perceive a stable and certain environment and thus seek stabil-ity and control in their operations in order to achieve maximum efficiency(Parnell & Wright, 1993). Defenders have narrow product/market domains(Miles & Snow, 1978) and defend them aggressively (Shoham et al., 2002).New product development primarily relates to existing products and markets(Miles & Snow, 1978). Because of this narrow focus, defenders improvethe efficiency of their existing operations with a cost-efficient, single-core
Gao et al. / A STUDY OF BIOTECHNOLOGY IPOs 9
at SAGE Publications on March 24, 2015job.sagepub.comDownloaded from
10 JOURNAL OF BUSINESS COMMUNICATION
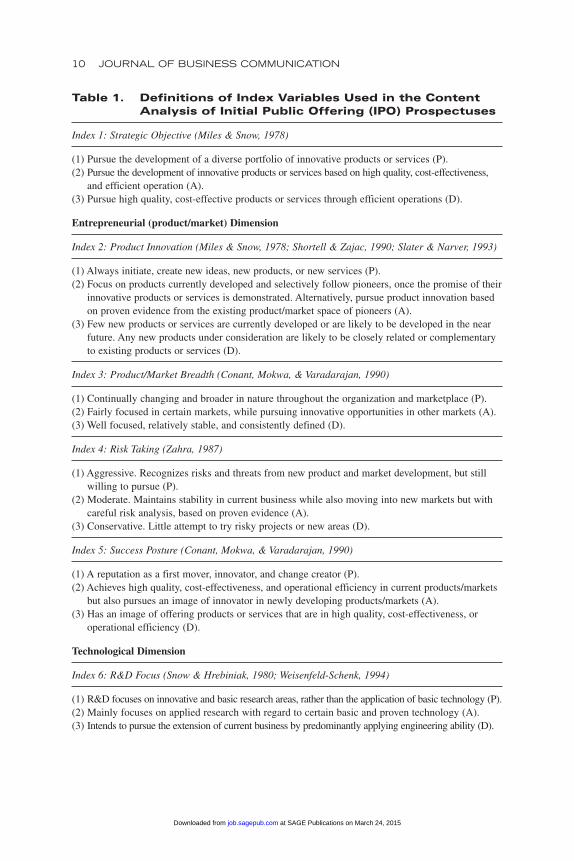
Table 1. Definitions of Index Variables Used in the ContentAnalysis of Initial Public Offering (IPO) Prospectuses
Index 1: Strategic Objective (Miles & Snow, 1978)
(1) Pursue the development of a diverse portfolio of innovative products or services (P).(2) Pursue the development of innovative products or services based on high quality, cost-effectiveness,
and efficient operation (A).(3) Pursue high quality, cost-effective products or services through efficient operations (D).
Entrepreneurial (product/market) Dimension
Index 2: Product Innovation (Miles & Snow, 1978; Shortell & Zajac, 1990; Slater & Narver, 1993)
(1) Always initiate, create new ideas, new products, or new services (P).(2) Focus on products currently developed and selectively follow pioneers, once the promise of their
innovative products or services is demonstrated. Alternatively, pursue product innovation basedon proven evidence from the existing product/market space of pioneers (A).
(3) Few new products or services are currently developed or are likely to be developed in the nearfuture. Any new products under consideration are likely to be closely related or complementaryto existing products or services (D).
Index 3: Product/Market Breadth (Conant, Mokwa, & Varadarajan, 1990)
(1) Continually changing and broader in nature throughout the organization and marketplace (P).(2) Fairly focused in certain markets, while pursuing innovative opportunities in other markets (A).(3) Well focused, relatively stable, and consistently defined (D).
Index 4: Risk Taking (Zahra, 1987)
(1) Aggressive. Recognizes risks and threats from new product and market development, but stillwilling to pursue (P).
(2) Moderate. Maintains stability in current business while also moving into new markets but withcareful risk analysis, based on proven evidence (A).
(3) Conservative. Little attempt to try risky projects or new areas (D).
Index 5: Success Posture (Conant, Mokwa, & Varadarajan, 1990)
(1) A reputation as a first mover, innovator, and change creator (P).(2) Achieves high quality, cost-effectiveness, and operational efficiency in current products/markets
but also pursues an image of innovator in newly developing products/markets (A).(3) Has an image of offering products or services that are in high quality, cost-effectiveness, or
operational efficiency (D).
Technological Dimension
Index 6: R&D Focus (Snow & Hrebiniak, 1980; Weisenfeld-Schenk, 1994)
(1) R&D focuses on innovative and basic research areas, rather than the application of basic technology (P).(2) Mainly focuses on applied research with regard to certain basic and proven technology (A).(3) Intends to pursue the extension of current business by predominantly applying engineering ability (D).
at SAGE Publications on March 24, 2015job.sagepub.comDownloaded from

Gao et al. / A STUDY OF BIOTECHNOLOGY IPOs 11
Index 7: Production Capacity (Miles & Snow, 1978)
(1) Enters into an agreement with a third-party manufacturer for the supply and production of prod-ucts, and intends to outsource the production rather than develop production capacity (P).
(2) Develops own production capacity; will also outsource some production to a third party (A).(3) Develops own competitive production capacity (D).
Index 8: Technological Adaptation (Conant, Mokwa, & Varadarajan, 1990)
(1) Adoptions prototypical, flexible technologies to adapt to the dynamic environment (P).(2) Dual focus on technological improvement in currently developed products and technological
synergism by using a set of interrelated technologies, or technology alteration (rebuilding) todevelop new products (A).
(3) Focuses on technological efficiency, process improvement or product standardization, cost-efficiency, technical performance, in pursuit of applied engineering solution (D).
Index 9: Technological Breadth (Conant, Mokwa, & Varadarajan, 1990)
(1) Diverse, multiple technologies, no obvious focus on single technology (P).(2) One core technology or technology platform, but also involved in some other innovative
technologies (A).(3) One core technology or technology platform (D).
Administrative Dimension
Index 10: Recruitment of CEO (Thomas & Ramaswamy, 1996)
(1) Recruits the CEO from outside sources (P).(2) CEO is promoted from within (D).
Index 11: Background of CEO (Hambrick, 1983; Smith, Guthrie, & Chen, 1986; Snow & Hrebiniak, 1980)
(1) Mostly from a marketing or product development background (P).(2) Mostly from a production or finance background (D).
Index 12: R&D Team (Miles & Snow, 1978; Snow & Hrebiniak, 1980)
(1) A large and fully dedicated R&D team engaging in new product or service development (P).(2) A large group of applied engineers to modify product innovations (A).(3) A moderate R&D team is built up for product extension or development closely related to cur-
rent products or services (D).
Index 13: Structure (Conant, Mokwa, & Varadarajan, 1990)
(1) Product or market oriented. Top management mainly from marketing, R&D, or businessdevelopment (P).
(2) Balanced structure, with top managements from functional sectors, i.e., engineering, operations,production, financial, as well as output-driven sectors, such as marketing, R&D, or businessdevelopment (A).
(3) Functional in nature, top management team mainly from operations (engineering or production)or finance (D).
Note: D = defender; A = analyzer; P = prospector.
at SAGE Publications on March 24, 2015job.sagepub.comDownloaded from
12 JOURNAL OF BUSINESS COMMUNICATION
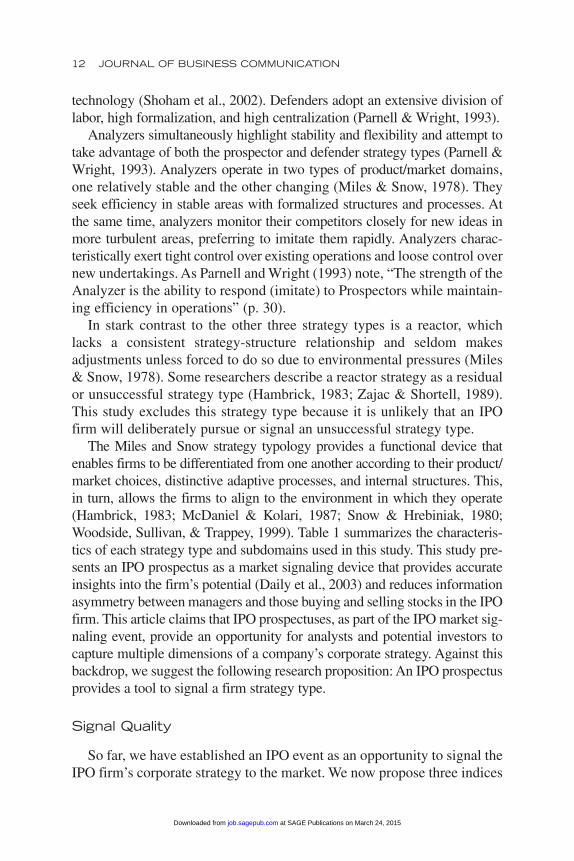
technology (Shoham et al., 2002). Defenders adopt an extensive division oflabor, high formalization, and high centralization (Parnell & Wright, 1993).
Analyzers simultaneously highlight stability and flexibility and attempt totake advantage of both the prospector and defender strategy types (Parnell &Wright, 1993). Analyzers operate in two types of product/market domains,one relatively stable and the other changing (Miles & Snow, 1978). Theyseek efficiency in stable areas with formalized structures and processes. Atthe same time, analyzers monitor their competitors closely for new ideas inmore turbulent areas, preferring to imitate them rapidly. Analyzers charac-teristically exert tight control over existing operations and loose control overnew undertakings. As Parnell and Wright (1993) note, “The strength of theAnalyzer is the ability to respond (imitate) to Prospectors while maintain-ing efficiency in operations” (p. 30).
In stark contrast to the other three strategy types is a reactor, whichlacks a consistent strategy-structure relationship and seldom makesadjustments unless forced to do so due to environmental pressures (Miles& Snow, 1978). Some researchers describe a reactor strategy as a residualor unsuccessful strategy type (Hambrick, 1983; Zajac & Shortell, 1989).This study excludes this strategy type because it is unlikely that an IPOfirm will deliberately pursue or signal an unsuccessful strategy type.
The Miles and Snow strategy typology provides a functional device thatenables firms to be differentiated from one another according to their product/market choices, distinctive adaptive processes, and internal structures. This,in turn, allows the firms to align to the environment in which they operate(Hambrick, 1983; McDaniel & Kolari, 1987; Snow & Hrebiniak, 1980;Woodside, Sullivan, & Trappey, 1999). Table 1 summarizes the characteris-tics of each strategy type and subdomains used in this study. This study pre-sents an IPO prospectus as a market signaling device that provides accurateinsights into the firm’s potential (Daily et al., 2003) and reduces informationasymmetry between managers and those buying and selling stocks in the IPOfirm. This article claims that IPO prospectuses, as part of the IPO market sig-naling event, provide an opportunity for analysts and potential investors tocapture multiple dimensions of a company’s corporate strategy. Against thisbackdrop, we suggest the following research proposition: An IPO prospectusprovides a tool to signal a firm strategy type.
Signal Quality
So far, we have established an IPO event as an opportunity to signal theIPO firm’s corporate strategy to the market. We now propose three indices
at SAGE Publications on March 24, 2015job.sagepub.comDownloaded from
that can be used to understand the quality of the strategy signal, namely,clarity, intensity, and consistency.
Signal clarity. Extant research finds that an effective signal should beobservable and clear (Certo et al., 2001) so that market participants caneasily capture the signal (Eliashberg & Robertson, 1988; Spence, 1973,1974). This article proposes that IPO prospectuses allow IPO firms to pre-sent a corporate strategy type by stating their intention to favor one strat-egy type over another. If the IPO prospectus clearly states the firm’scorporate strategy, the prospectus reader will quickly grasp and under-stand the intended corporate strategy (Heil & Robertson, 1991). Clearunderstanding of the firm’s strategy will then encourage the investors oranalysts to assess other strategic information, such as the structure of thefirm and its adaptive processes (Baruch, 1992).
Signal intensity. Scholars suggest that frequently communicated sig-nals are likely to capture the audience’s attention (Riley, 1975; Spence,1974, 2002). The audience will grasp the signals and subsequently usethem to infer the firm’s intended strategy type.
Signal consistency. Signal effectiveness also depends on signal consis-tency (Riley, 1975), which means that firms need to consistently communi-cate multiple signals from different dimensions and show little contradictionacross dimensions. However, past IPO communication research has notinvestigated this aspect of signal quality; signals under investigation are typ-ically simple, unidimensional, and focused (Certo et al., 2001; Megginson& Weiss, 1991; Neck et al., 2000). A clear and intense articulation of thefirm’s strategy type alone will not enhance strategy credibility; a firm alsoneeds to show consistent evidence of a fit between strategy dimensions inorder to establish strategy credibility (Miles & Snow, 1978). Therefore, thisarticle further employs signal consistency across the dimensions of corpo-rate strategy to examine the overall quality of corporate strategy signals—something not done in other IPO studies.
Having identified the characteristics of a credible market signal, howcan a firm determine whether it has been successful in signaling corporatestrategy from an IPO event? To date, a small number of studies apply sig-naling perspective to understand an IPO event and its performance (e.g.,Carter et al., 1998; Certo et al., 2001; Megginson & Weiss, 1991; Necket al., 2000; Rosenstein & Wyatt, 1997). Most of these studies examine theeffect of IPO signals on the 1st day of initial returns (i.e., underpricing) as
Gao et al. / A STUDY OF BIOTECHNOLOGY IPOs 13
at SAGE Publications on March 24, 2015job.sagepub.comDownloaded from
an indicator of whether or not market signaling has reduced informationasymmetry between informed and uninformed investors (Carter et al.,1998; Certo et al., 2001; Megginson & Weiss, 1991). These studies justifythe 1st-day returns based upon market efficiency theory, which suggeststhat the market responds immediately to information.
These studies justify the 1st-dayreturns based upon market efficiencytheory, which suggests that the marketresponds immediately to information.
In this study, we work with both the 1st-day and 30-day market returns. Wepropose that the credible communication of corporate strategy will result in avery small gap between the offer and 1st-day price and, therefore, very littleunderpricing. We also propose that the three components we have identifiedas indicating a credible market strategy signal (clarity, intensity, and consis-tency) will have a negative impact on underpricing because they work toreduce information asymmetry between informed and uninformed investors.Accordingly, this study suggests the following research hypotheses:
Hypothesis 1a: The clarity of the firm’s communication of its corporatestrategy relates negatively to IPO underpricing on the 1st day of the IPO.
Hypothesis 1b: The intensity of the firm’s communication of its corporatestrategy relates negatively to IPO underpricing on the 1st day of the IPO.
Hypothesis 1c: The consistency of the firm’s communication of its cor-porate strategy relates negatively to IPO underpricing on the 1st day ofthe IPO.
As previously mentioned, this study also includes the signaling effectsof corporate strategy communication on returns 30 days after an IPO eventfor two reasons. First, opportunistic investors, who are more attracted bythe potential for underpricing, might not be affected by the corporate strat-egy communicated in the IPO prospectus. This is especially the case forbiotechnology IPOs where faddish purchasing behavior, due to overopti-mism of the likely “abnormal return” from IPOs, is frequently present(Finkle & Lamb, 2002; Ritter, 1991, 1998). Second, analysts and investors
14 JOURNAL OF BUSINESS COMMUNICATION
at SAGE Publications on March 24, 2015job.sagepub.comDownloaded from
may need time to read, understand, and evaluate the corporate strategycommunicated in IPO prospectuses (Baruch, 1992; Bukh et al., 2002), sothey will have a better understanding of the IPO value after a period oftime. Therefore, the effective communication of corporate strategy mightreduce 30-day initial returns by taking a slightly longer term view ofunderpricing. This article also investigates 30-day returns after the IPOevent. This backdrop informs the following hypotheses:
Hypothesis 2a: The clarity of the firm’s communication of its corporatestrategy relates negatively to 30-day IPO returns.
Hypothesis 2b: The intensity of the firm’s communication of its corporatestrategy relates negatively to 30-day IPO returns.
Hypothesis 2c: The consistency of the firm’s communication of its corpo-rate strategy relates negatively to 30-day IPO returns.
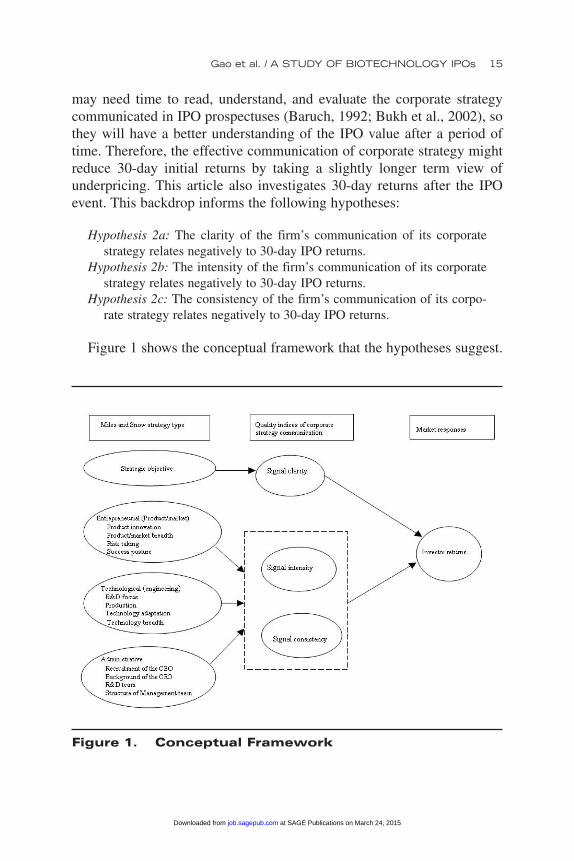
Figure 1 shows the conceptual framework that the hypotheses suggest.
Gao et al. / A STUDY OF BIOTECHNOLOGY IPOs 15
Figure 1. Conceptual Framework
at SAGE Publications on March 24, 2015job.sagepub.comDownloaded from
METHOD
This article reports the findings of a single industry study: the biotech-nology industry. The biotechnology industry is characterized by emerg-ing, diverse, fast-moving, and hard-to-value products (Ranchhod, Gurau,& Lace, 2002; Weisenfeld-Schenk, 1994). Accordingly, these characteris-tics are likely to drive biotechnology IPO firms to employ signals in orderto reduce uncertainty for investors. This research analyzes the prospec-tuses of 57 biotechnology IPOs, representing the entire population ofbiotechnology IPOs listed on the NASDAQ between 1997 and 2002.
Bhabra and Pettway (2003) find that prospectus information is moreuseful for predicting survival/failure compared with subsequent informa-tion. Thus, the vast majority of IPO signal studies rely on informationavailable from prospectuses (Cohen & Dean, 2001; Daily et al., 2003;Neck et al., 2000).
The analysis includes two stages. The first stage applies content analy-sis, which allows us to test our research proposition that an IPO prospec-tus can be used to identify corporate strategy communication signals. Thestudy applies a three-phase approach to content analysis. Phase 1 estab-lishes 13 index variables using the Miles and Snow (1978) typology of strat-egy and develops operational definitions for these variables (see Table 1).This phase also includes the construction of a coding scheme (i.e., codingbook, coding category table, and coding sheet). We provided a separatecolumn in the coding sheet that allowed recording of a fourth, ambiguoussignal class besides D (defender), A (analyzer), and P (prospector) for thethree signal characteristics of clarity, intensity, and consistency. This cod-ing allows for the three levels of class variables for each of the three charac-teristic types to be explicitly specified and tested for significance in aregression model. The fourth class, ambiguous, is appropriately confoundedwith the intercept, thereby eliminating unwanted linear dependenceamong the variables of interest.
Phase 2 includes a pilot study with two independent coders working ona subsample of IPO prospectuses to test the validity and reliability of thecoding scheme developed in Phase 1. The first author of the article and anindependent coder participated in the pilot coding process. The indepen-dent coder was experienced in the method of content analysis and famil-iar with the Miles and Snow strategy typology. The coders placed “+” onthe coding sheet and entered this as “1” in the database when the codersidentified an index variable from a case; otherwise, they used “–” andentered “0.” Our research used the Perreault and Leigh (1989) index of
16 JOURNAL OF BUSINESS COMMUNICATION
at SAGE Publications on March 24, 2015job.sagepub.comDownloaded from
reliability to test for intercoder reliability. In the first pretest, the reliabil-ity indices for the coding of two prospectuses were 62% and 73%, respec-tively. By comparing the coding notes, the disagreements were mainlyattributed to ambiguous descriptions of operational definitions of indexvariables. Subsequently, the coding scheme was revised to improve theclarity of the definitions. A second pretest was then conducted to confirmthe improvement in coder reliability. The reliability index was increasedto 80%, which met recommended norms (Neuendorf, 2002; Perreault &Leigh, 1989). After establishing an acceptable reliability index, the codersworked independently (Perreault & Leigh, 1989).
Phase 3 applies the final coding scheme against the full sample of IPOfirms. During the coding process, we focused on examining the commu-nication of strategy in terms of quality of the content of strategic infor-mation. The coders gave particular attention to the standardized section ofthe IPO prospectus “business strategy” but also considered other parts ofthe prospectus related to strategic information. The coders searched for allrelevant information associated with the Miles and Snow typology typesthroughout the prospectuses and filled out the coding sheet, referring tothe coding book for guidance.
The second stage applies multiple regression analysis to examine therelationship between the quality of signals—clarity (CLA), intensity (IN),and consistency (CON)—and initial returns (IR) of the 1st day (IR1) and30 days (IR30) after the IPO event. The initial regression model anddescription of measures follows:
IRt = α + β1 CLAD + β2 CLAA + β3 CLAP + β4 IND + β5 INA + β6 INP
+ β7 COND + β8 CONA + β9 CONP + ε (1)
where IRt stands for initial returns from Day 1 (IR1) or on Day 30 (IR30)IR1 = (P1 – P0) / P0
IR30 = (P30 – P0) / P0
P0 represents the offer priceP1 represents the closing price at the 1st dayP30 represents the closing price at the 30th dayCLAj: 1 if the firm’s statement of “strategic objective”
otherwise 0INj stands for the degree of intensity for signaling strategy j from IPO
prospectuses, measured by the number of index variables for strategy j.CONj stands for the degree of consistency for signaling strategy j from IPO
prospectuses, measured1 by “sum (INkj2)/3 – (sum (INkj)/3)2”
j ∈ (D, A, P) where D = defender; A = analyzer; P = prospector.
Gao et al. / A STUDY OF BIOTECHNOLOGY IPOs 17
at SAGE Publications on March 24, 2015job.sagepub.comDownloaded from
This study also added control variables to the above models: firm size(FS), firm age (FA), venture capital back up (VC), and underwriter reputa-tion (UV), where the fixed variables were significant. Firm size and age haveserved as surrogates for uncertainty for potential investors because largefirms are perceived as having access to a greater pool of resources requiredfor survival and growth; more established firms have provided more pub-lished data from which investors can base expectations on (Daily et al.,2003). Therefore, we proposed that the size of the firm, as measured by themarket value of equity, and the age of the firm, as measured by the numberof years, be used as control variables. We expected that larger firms and moreestablished firms would have a negative impact on underpricing.
Because of the active role of venture capital in financing and advisingan IPO firm’s strategy and management, and providing access to other keystakeholders such as customers and suppliers, the presence of venture cap-ital might signal the stronger performance prospects of the IPO firm(Daily et al., 2003; Megginson & Weiss, 1991). In this study, we used abinary variable to indicate whether or not venture capital was present. Weproposed that the presence of venture capital would have a negativeimpact on underpricing.
Prestigious underwriters with reputations for effectively taking firmspublic and protecting them can also signal less uncertainty for potentialinvestors (Carter et al., 1998; Daily et al., 2003). We proposed that astrong underwriter reputation will have a negative impact on underpricing.
Past research has examined the negative impacts of FS, FA, VC, andUV on the initial returns on the 1st day. We are not aware of any study thatexamines these factors on initial returns after 30 days (Carter et al., 1998;Certo et al., 2001; Daily et al., 2003; Megginson & Weiss, 1991; Necket al., 2000; Ritter, 1998). Thus, the extended model specifications withthe above four control variables included are stated as follows:
IRt = α + β1 CLAD + β2 CLAA + β3 CLAP + β4 IND + β5 INA + β6 INP
+ β 7 COND + β8 CONA + β9 CONP + β10 FS + β11 FA + β12 VC + β13 UV + ε (2)
Due to the very small sample sizes, 49 and 41, respectively, for the1-day and 30-day responses, and relatively high multicollinearity, addi-tional data reduction measures were employed to simultaneously reducethe risk of Type II, or false positive, errors in the inferences and the riskof both Type I and Type II errors due to model bias and multicollinearityand heteroscedasticity (Hair, Anderson, Tatham, & Black, 1998). There-fore, tables of correlation between the response variable and all predictorvariables were inspected, and only the predictor variables with the highest
18 JOURNAL OF BUSINESS COMMUNICATION
at SAGE Publications on March 24, 2015job.sagepub.comDownloaded from
correlations were included directly in the final models. All other variableswere dimensionally reduced using principal components analysis andvarimax rotation. The number of principal components included in therotated solution was determined by both unit communality and scree plotslope considerations. This simultaneously reduced the number of predic-tor variables in the models to a maximum of five per observation, mini-mized the number of sequential model inferences and the associatedcumulative Type II error, decreased the heteroscedasticity from 20:1 to anacceptable variance ratio of 3:1, and reduced the multicollinearity of thefinal models from Condition Index values of much greater than 30 toacceptable levels of less than 5 (Hair et al., 1998). Because there is noclosed form solution for estimating the cumulative Type II errors associ-ated with sequential model F tests and parameter t tests over multiplemodels and datasets, the cumulative Type II error of all final inferenceswas estimated using a bootstrap resampling technique (Efron, 1982). Onlysequential sets of models and inferences that constrained the Type II errorrate to below 0.5 were considered reliable enough to report here.
The final models selected were as follows:
IR1 = α + β1 FIX1 + β2 FIX2 + β3 FIX3 + β4 FIX4 + ε (3)IR30 = α + β1 ALLBUT1 + β2 ALLBUT2 + β3 ALLBUT3 + β4 ALLBUT4
+ β5 ALLBUT5 + ε (4)andIR30 = α + β1 COND + β2 CONP + ε (5)
where FIXi stands for the ith principal component formed from all thefixed effects specified in Model Specification (1) above for the 1-dayresponse IR1; ALLBUTk stands for the kth. Principal components formedfrom all of the fixed (hypothesis) and random (control) effects in ModelSpecification (2) above but for the two fixed effects specified separatelyin Model Specification (5) above.
RESULTS AND CONCLUSIONS
To help the readers understand how we interpreted signal clarity and con-sistency2 in our coding process, we now present some examples taken fromthis study. An example of a clearly communicated prospector strategy follows:
Our principal objective is to build a leading biopharmaceutical companythat discovers, develops, and commercializes new and superior drugproducts.
Gao et al. / A STUDY OF BIOTECHNOLOGY IPOs 19
at SAGE Publications on March 24, 2015job.sagepub.comDownloaded from
By contrast, an ambiguous presentation of the intended strategy adds alevel of difficulty for the investors or analysts who endeavor to interpretthe firm’s strategic reasons for movements and plans. For example,
Our principal objective is to commercialize products and technologies inthe field of human health care as we establish a leadership position inproteomics and functional genomics.
This statement of strategic objective does not clearly specify whether theleadership position is in R&D (prospector), technology application (ana-lyzer), or manufacturing (defender). Therefore, we consider this anambiguous presentation of the intended strategy.
The following examples present consistent communication of a firm’sprospector strategy on the product/market dimension.
We are a pioneer in the new field of industrial genomics.We currently have six product development programs targeted at a wide
range of diseases.
However, further on in the prospectus,
By providing research tools, we participate in the revolutions in genomics,the study of genes, and proteomics, the study of proteins, without bear-ing the risks inherent in attempting to discover new drugs.
The above statement shows that the company is presenting itself as con-servative and one that attempts to avoid risky projects. We coded thisstatement as indicative of a defender rather than a prospector. However,the first two statements were coded as that of a prospector. Hence, thecompany has an inconsistent presentation of product/market dimension.
By including other dimensions, communication of the prospector strat-egy should be consistent to establish the credibility. An exemplar prospec-tor firm would show (a) a strong focus on innovative and basic research,(b) the wide application of technologies, and (c) the multiple diverse tech-nologies on the technological dimension. The following are illustrationsfrom exemplar firms’ prospectuses:
Our innovative technology and corporate collaborations enable us to createvalue through the discovery of novel drug targets.
Our technologies are applicable across a broad range of diseases and disorders.We have developed two core technologies that we believe enhance our abil-
ity to simultaneously identify and initially validate new drug targets forfurther development.
20 JOURNAL OF BUSINESS COMMUNICATION
at SAGE Publications on March 24, 2015job.sagepub.comDownloaded from
Contrasting examples are as follows:
We pursue opportunistic acquisitions of complementary technologies andleverage our technologies into other value-added businesses.
We have focused our discovery efforts on our core technology.We believe that our core technology is substantially more cost-effective and
provides higher throughput than available commercial alternatives.
The above statements indicate the firm’s focus on core technology, tech-nology improvement, and cost-effectiveness rather than discovery ofdiverse innovative technologies and innovation. We coded these contrast-ing examples as an analyzer or defender rather than a prospector.
An exemplar prospector firm wouldshow (a) a strong focus on innovativeand basic research, (b) the wideapplication of technologies, and(c) the multiple diverse technologies onthe technological dimension.
The following examples show the difference between consistent com-munication and inconsistent communication on the administrative dimen-sion. A consistent communication highlights the high percentage of R&Dstaff, and the R&D or marketing background of the CEO and the focus oftop management on R&D and marketing. For example,
As of June 30, 2000, we had 128 full-time employees, 98 of whom com-prise the research staff and are engaged in research, development, andscale-up activities.
Our top management team members are mainly from R&D, marketing, andbusiness development sectors.
Our president, chief executive officer, and a member of our board of direc-tors, Dr. . . ., joined us in January 1997. . . . During his 10 years at. . ., he was responsible for business development, sales, and marketingfunctions.
By contrast, inconsistent communication on the same dimension mayindicate the low percentage of R&D staff, the engineering background ofthe CEO, and the focus of the top management on operations and finan-cial management. Specific examples are as follows:
Gao et al. / A STUDY OF BIOTECHNOLOGY IPOs 21
at SAGE Publications on March 24, 2015job.sagepub.comDownloaded from
As of December 31, 2000, we employed approximately 247 persons, ofwhom . . . approximately 43 employees are engaged in research anddevelopment, 21 in business development, sales, and marketing, 162 inoperations and manufacturing, and 21 in intellectual property, finance,and other administrative functions.
. . . has served as our president, chief executive officer, and a directorsince October 1999. Prior to joining us, Mr. . . . was vice presidentof engineering.
Our top management team is composed of the president, chief financialofficer, and chief operating officer.
The above sets of examples show how we interpreted signal clarity andsignal consistency. These have some practical implications for the IPOcommunication of strategic management. The IPO firms should placeimportance on the clear, multiple, and consistent strategy signals throughall three dimensions: (a) product/market dimension, (b) technologicaldimension, and (c) administrative dimension. These three dimensionsestablish the credibility of the strategy communication in the IPO processand reduce the confusion among the investors and analysts toward thestrategy and potential value of the firm.
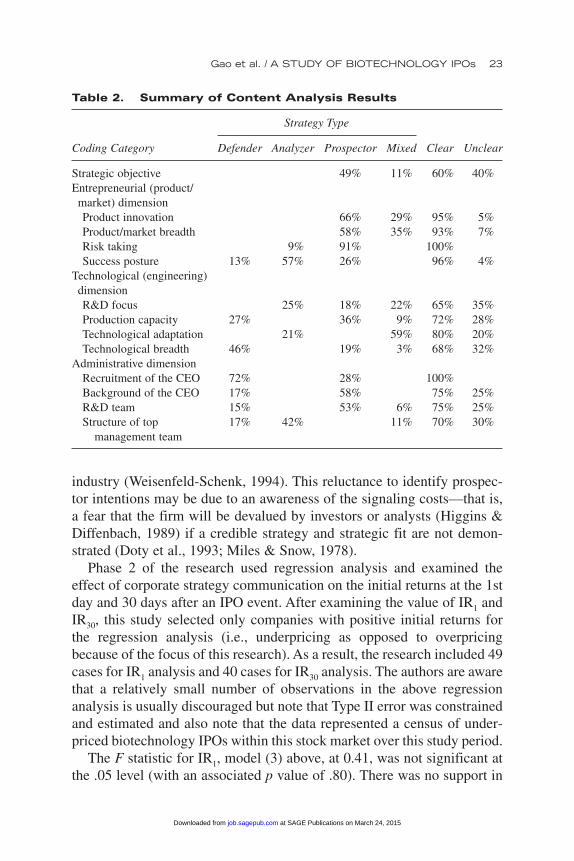
Table 2 provides the results for the content analysis. Line 1 shows that60% of IPO cases clearly identified their overall strategic objectives. Morespecifically, 49% of IPO firms communicated a prospector strategy,whereas none of them clearly claimed an analyzer or defender strategy.Another 11% communicated a mixed strategy. Prospector signals domi-nated all three dimensions. This result appeared consistent with the char-acteristics of the biotechnology industry in which prospectors dominate(Weisenfeld-Schenk, 1994).
Table 2 also shows that the most common index signals were risk tak-ing (100% of the IPO firms), recruitment of the CEO (100%), successposture (96%), product innovation (95%), and product/market breadth(93%). It is interesting that 57% of firms described an analyzer successposture, whereas only 26% described a prospector posture and 13% adefender posture. In addition, 46% of firms indicated their technologyfocus as a defender, whereas 42% indicated an analyzer managementstructure. This analysis clearly demonstrates that an IPO prospectus con-tains multiple signals to communicate strategy.
However, only 49% of firms clearly articulated an overall prospector strat-egy from their statement of “strategic objective.” This finding reveals that asignificant portion of IPO biotechnology firms were not deliberately labelingthemselves as “prospector,” even though they are in a prospector-dominated
22 JOURNAL OF BUSINESS COMMUNICATION
at SAGE Publications on March 24, 2015job.sagepub.comDownloaded from
industry (Weisenfeld-Schenk, 1994). This reluctance to identify prospec-tor intentions may be due to an awareness of the signaling costs—that is,a fear that the firm will be devalued by investors or analysts (Higgins &Diffenbach, 1989) if a credible strategy and strategic fit are not demon-strated (Doty et al., 1993; Miles & Snow, 1978).
Phase 2 of the research used regression analysis and examined theeffect of corporate strategy communication on the initial returns at the 1stday and 30 days after an IPO event. After examining the value of IR1 andIR30, this study selected only companies with positive initial returns forthe regression analysis (i.e., underpricing as opposed to overpricingbecause of the focus of this research). As a result, the research included 49cases for IR1 analysis and 40 cases for IR30 analysis. The authors are awarethat a relatively small number of observations in the above regressionanalysis is usually discouraged but note that Type II error was constrainedand estimated and also note that the data represented a census of under-priced biotechnology IPOs within this stock market over this study period.
The F statistic for IR1, model (3) above, at 0.41, was not significant atthe .05 level (with an associated p value of .80). There was no support in
Gao et al. / A STUDY OF BIOTECHNOLOGY IPOs 23
Table 2. Summary of Content Analysis Results
Strategy Type
Coding Category Defender Analyzer Prospector Mixed Clear Unclear
Strategic objective 49% 11% 60% 40%Entrepreneurial (product/market) dimensionProduct innovation 66% 29% 95% 5%Product/market breadth 58% 35% 93% 7%Risk taking 9% 91% 100%Success posture 13% 57% 26% 96% 4%
Technological (engineering)dimensionR&D focus 25% 18% 22% 65% 35%Production capacity 27% 36% 9% 72% 28%Technological adaptation 21% 59% 80% 20%Technological breadth 46% 19% 3% 68% 32%
Administrative dimensionRecruitment of the CEO 72% 28% 100%Background of the CEO 17% 58% 75% 25%R&D team 15% 53% 6% 75% 25%Structure of top 17% 42% 11% 70% 30%
management team
at SAGE Publications on March 24, 2015job.sagepub.comDownloaded from
this study for significant relationships to exist between any of the pre-dictor variables (i.e., the clarity, intensity, and consistency of strategicsignals), represented in a parsimonious and noncollinear way by theirprincipal components, and IR1. Thus, there was no evidence to supportHypotheses 1a through 1c, and so this research cannot conclude thateffective communication of corporate strategy signal plays a role inreducing information asymmetry at the 1st day of an IPO event andtherefore reducing underpricing.
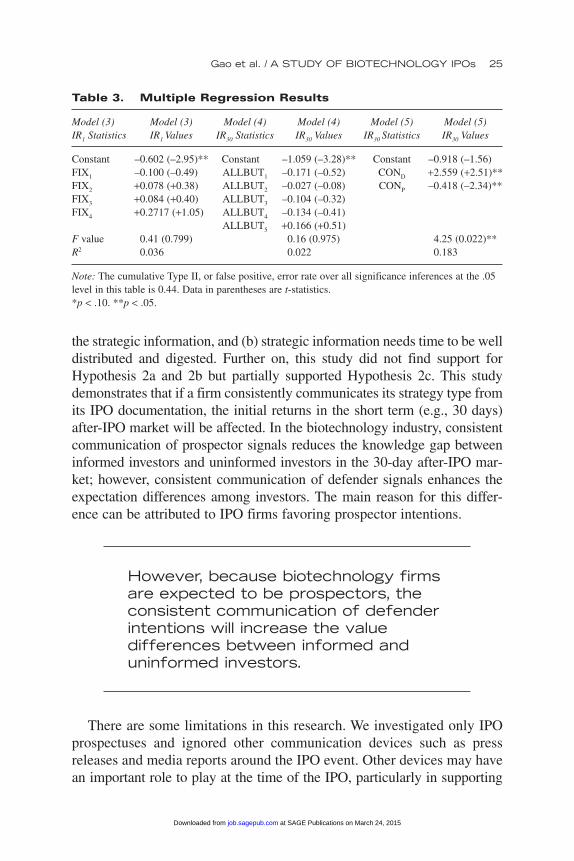
Model F statistics for IR30, Models (4), at 0.16 (p value = .97), and (5), at4.25 (p value = .02), show support for the statement that the consistency ofdefender and prospector signals significantly impacts the 30-day initialreturns, with an R2 statistic of 0.18 (see Table 3). Clarity and intensity ofstrategic signals impacts on IR30 were not supported. Hypotheses 2a and 2bare therefore rejected. In addition, no support for the prediction by any con-trol variables of firm size, firm age, the presence of a venture capital, and thereputation of the underwriter was found in this study for the 30-day under-pricing response, IR30. Subsequent Type II error analysis indicates that theoverall Type II error of the sequential inferences reported from the F statis-tics of Models (3), (4), and (5) and the t statistics for the prospector anddefender consistency signals in Table 3 was limited to less than 0.44 at the.05 significance level for the F and t tests, based on 200 random resamples.
Note that, in this study, due to the need for model specification parsimonyto control for Type II errors, the significance of control variables on the 1-dayunderpricing response, IR1, was not explored, as their exclusion from Model(3) above does not contribute to model misspecification bias if none of theeffects of interest are significant, as was the case in this study.
It is interesting that Table 3 shows that a consistent signal of a prospectorstrategy had a negative impact on the 30-day initial returns and this resultsupported Hypothesis 2c, whereas consistent signals for a defender strategyhad a positive impact on the 30-day returns, and so we partially rejectedHypothesis 2c. One possible explanation is that biotechnology firms areexpected to be prospectors (Weisenfeld-Schenk, 1994). Therefore, the con-sistent communication of prospector intentions successfully reduces theknowledge gap about the IPO firm between informed investors and unin-formed investors. However, because biotechnology firms are expected to beprospectors, the consistent communication of defender intentions will increasethe value differences between informed and uninformed investors.
Summarizing the above results, Hypotheses 1a through 1c wererejected in this study. The failure to identify the relationships betweenstrategy-based signals and the 1st-day initial returns may be attributed to(a) faddish behaviors of the 1st-day investors who may pay less attention to
24 JOURNAL OF BUSINESS COMMUNICATION
at SAGE Publications on March 24, 2015job.sagepub.comDownloaded from
the strategic information, and (b) strategic information needs time to be welldistributed and digested. Further on, this study did not find support forHypothesis 2a and 2b but partially supported Hypothesis 2c. This studydemonstrates that if a firm consistently communicates its strategy type fromits IPO documentation, the initial returns in the short term (e.g., 30 days)after-IPO market will be affected. In the biotechnology industry, consistentcommunication of prospector signals reduces the knowledge gap betweeninformed investors and uninformed investors in the 30-day after-IPO mar-ket; however, consistent communication of defender signals enhances theexpectation differences among investors. The main reason for this differ-ence can be attributed to IPO firms favoring prospector intentions.
However, because biotechnology firmsare expected to be prospectors, theconsistent communication of defenderintentions will increase the valuedifferences between informed anduninformed investors.
There are some limitations in this research. We investigated only IPOprospectuses and ignored other communication devices such as pressreleases and media reports around the IPO event. Other devices may havean important role to play at the time of the IPO, particularly in supporting
Gao et al. / A STUDY OF BIOTECHNOLOGY IPOs 25
Table 3. Multiple Regression Results
Model (3) Model (3) Model (4) Model (4) Model (5) Model (5) IR1 Statistics IR1 Values IR30 Statistics IR30 Values IR30 Statistics IR30 Values
Constant –0.602 (–2.95)** Constant –1.059 (–3.28)** Constant –0.918 (–1.56)FIX1 –0.100 (–0.49) ALLBUT1 –0.171 (–0.52) COND +2.559 (+2.51)**FIX2 +0.078 (+0.38) ALLBUT2 –0.027 (–0.08) CONP –0.418 (–2.34)**FIX3 +0.084 (+0.40) ALLBUT3 –0.104 (–0.32)FIX4 +0.2717 (+1.05) ALLBUT4 –0.134 (–0.41)
ALLBUT5 +0.166 (+0.51)F value 0.41 (0.799) 0.16 (0.975) 4.25 (0.022)**R2 0.036 0.022 0.183
Note: The cumulative Type II, or false positive, error rate over all significance inferences at the .05level in this table is 0.44. Data in parentheses are t-statistics.*p < .10. **p < .05.
at SAGE Publications on March 24, 2015job.sagepub.comDownloaded from
the strategic information communicated in IPO prospectuses. Furthermore,we chose the Miles and Snow typology; other strategy frameworks such asthe Ansoff typology, Porter typology, or Mintzberg typology might also pro-vide promising insights. In addition, although a single industry study(biotechnology) over a 6-year period allows for a thorough examination inone context, it also limits the generalization of the results from this research.Measures of all three dimensions—clarity, intensity, and consistency—arenarrowly defined with respect to content and specifically do not address for-mat characteristics, such as color, heading styles, and the graphic designaesthetics. Finally, the relatively low R2 of the best model, Model (5), at0.18, indicates that there may be other important explanatory variables notincluded in our model specifications. These limitations can be addressedand accommodated in further research on this topic.
Notwithstanding these limitations, this research makes several importantcontributions for both academics and practitioners. The research appliesmarket-signaling theory, combined with a corporate strategy typology, toidentify important strategic information for reducing the market uncertaintyand IPO underpricing. This article establishes and operationalizes multipleindices based on the Miles and Snow typology to capture corporate strategyfrom the content analysis of public documents. This may provide someinsights for further studies on corporate strategy. Furthermore, the researchalso assesses the quality of strategy signals with measures of clarity, inten-sity, and consistency and particularly highlights the importance of signalconsistency when assessing the quality of multidimensional signals. Thisapproach can be useful for future communication studies.
This study also distinguishes 1st-day and 30-day initial returns (under-pricing). By taking a slightly longer term view, 30-day underpricing maybe a useful indicator of a credible strategic communication in the IPOcommunication process.
This research suggests that those charged with IPO communicationsplace importance on the consistent disclosure in relation to the firm’sstrategy intentions (e.g., prospector, analyzer, and defender). Specifically,in the biotechnology industry, if the firm attempts to reduce the 30-dayunderpricing (i.e., reduce the need to discount the offer price to attractprospector-centered investors before an IPO communication), they mayneed to consistently communicate their prospector intentions across allthree important dimensions—product/market, technology, and adminis-tration. By contrast, if the firm attempts to increase the 30-day underpric-ing (i.e., attract the defender strategy-centered investors before an IPOcommunication), firms may need to consistently indicate their defenderstrategic intentions across dimensions in their public documents.
26 JOURNAL OF BUSINESS COMMUNICATION
at SAGE Publications on March 24, 2015job.sagepub.comDownloaded from

NOTES
1. This measure of the signal consistency from multiple dimensions borrows the con-cept of “variance” from statistics (i.e., the high consistency of signals for strategy j acrossthree dimensions can be indicated by the low variance of signals across three dimensionsas shown in the formula).
2. The meaning of signal intensity is self-evident. It can only be evaluated by a quanti-tative measure.
REFERENCES
Ansoff, H. I. (1965). Corporate strategy: An analytical approach to business policy forgrowth and expansion. New York: McGraw-Hill.
Azarmi, T. (2002). Corporate put strategy. Journal of American Academy of Business, 1(2),215-216.
Baruch, L. (1992). Information disclosure strategy. California Management Review, 34(4), 9-30.Beattie, V. (1999). Business reporting: The inevitable change. Edinburgh: Institute of
Charter Accountant of Scotland.Beatty, R. P., & Ritter, J. R. (1986). Investment banking, reputation, and the under-pricing
of initial public offerings. Journal of Financial Economics, 15, 213-232.Bhabra, H. S., & Pettway, R. H. (2003). IPO prospectus information and subsequent per-
formance. Financial Review, 38(3), 369-397.Brown, L. (1997). Competitive marketing strategy: Dynamic and maneuvering for com-
petitive position. Melbourne: Thomas Nelson Australia.Bukh, P. N., Nielsen, C., Gormsen, P., & Mouritsen, J. (2002). Disclosure of intellectual
capital indicators in Danish IPO prospectuses. Denmark: Aarhus School of Businessand Copenhagen Business School.
Burgi, P., & Roos, J. (2003). Images of strategy. European Management Journal, 21(1),69-78.
Carter, R. B., Dark, F. H., & Singh, A. K. (1998). Underwriter reputation, initial returns,and the long-run performance of IPO stocks. Journal of Finance, 53(1), 285-311.
Certo, S. T. (2003). Influencing initial public offering investors with prestige: Signalingwith board structures. Academy of Management Review, 28, 432-446.
Certo, S. T., Daily, C. M., & Dalton, D. R. (2001). Signaling firm value through boardstructure: An investigation of initial public offerings. Entrepreneurship Theory andPractice, 26(2), 33-50.
Cohen, B. D., & Dean, T. J. (2001). Top management teams and investors’valuation of initial pub-lic offerings: An examination of web-based and non-web-based new ventures. Frontiers ofEntrepreneurship Research. Retrieved from http://www.babson.edu/entrep/fer/Babson2001/XX/XXA/XXA.htm
Conant, J. S., Mokwa, M. P., & Varadarajan, P. R. (1990). Strategy types, distinctive mar-keting competencies and organizational performance: A multiple measures-basedstudy. Strategic Management Journal, 11, 365-383.
Cumby, J., & Conrod, J. (2001). Non-financial performance measures in the Canadianbiotechnology industry. Journal of Intellectual Capital, 2(3), 261-272.
Gao et al. / A STUDY OF BIOTECHNOLOGY IPOs 27
at SAGE Publications on March 24, 2015job.sagepub.comDownloaded from

Daily, C. M., Certo, S. T., Dalton, D. R., & Roengpitya, R. (2003). IPO underpricing: A meta-analysis and research synthesis. Entrepreneurship Theory and Practice, 28, 271-295.
Day, G. S., & Fahey, L. (1990). Putting strategy into shareholder value analysis. HarvardBusiness Review, 68(2), 156-162.
Deeds, D. L., DeCarolis, D., & Coombs, J. E. (1997). The impact of firm-specific capa-bilities on the amount of capital raised in an initial public offering: Evidence from thebiotechnology industry. Journal of Business Venturing, 12, 31-46.
Desai, A. B. (2000). Does strategic planning create value? The stock market’s belief.Management Decision, 38(10), 685-693.
Doty, D. H., Glick, W. H., & Huber, G. P. (1993). Fit, equifinality, and organizational effec-tiveness: A test of two configurational theories. Academy of Management Journal,36(6), 1196-1250.
Durukan, M. B. (2002). The relationship between IPO returns and factors influencing IPOperformance: The case of Istanbul stock exchange. Managerial Finance, 28(2), 18-38.
Eccles, R. G., Hertz, R. H., Keegan, E. M., & Philips, D. M. (2001). The value reportingrevolution: Moving beyond the earning game. New York: John Wiley.
Efron, B. (Ed.). (1982). The jackknife, the bootstrap and other resampling plans (6th ed.,Vol. 38). Philadelphia: Society for Industrial and Applied Mathematics.
Eliashberg, J., & Robertson, T. S. (1988). New product preannouncing behavior: A marketsignaling study. Journal of Marketing Research, 25, 282-292.
Engers, M. (1987). Signaling with many signals. Econometrica, 55(3), 663-674.Finkle, T. A., & Lamb, R. P. (2002). A comparative analysis of the performance of emerg-
ing v. nonemerging industry initial public offerings. New England Journal ofEntrepreneurship, 5(1), 27.
Goold, M., Campbell, A., & Alexander, M. (1994). How corporate parents add value to thestand-alone performance of their businesses. Business Strategy Review, 5(4), 33-56.
Hair, J. F., Anderson, R. E., Tatham, R. L., & Black, W. C. (1998). Multivariate data analy-sis (5th ed.). Upper Saddle River, NJ: Prentice Hall.
Hambrick, D. C. (1983). Some tests of the effectiveness and functional attributes of Milesand Snow’s strategic types. Academy of Management Journal, 26, 5-26.
Heil, O., & Robertson, T. S. (1991). Towards a theory of competitive market signaling: Aresearch agenda. Strategic Management Journal, 12(6), 403-418.
Higgins, R. B., & Bannister, B. D. (1992). How corporate communication of strategyaffects share price. Long Range Planning, 25(3), 27-35.
Higgins, R. B., & Diffenbach, J. (1985). The impact of strategic planning on stock price.Journal of Business Strategy, 6(2), 64-72.
Higgins, R. B., & Diffenbach, J. (1989). Communicating corporate strategy: The payoffsand the risks. Long Range Planning, 22(3), 133-139.
Ibbotson, R. G. (1975). Price performance of common stock new issues. Journal ofFinancial Economics, 2(3), 235-272.
Ibbotson, R. G., Sindelar, J. L., & Ritter, J. R. (1988). Initial public offerings. Journal ofApplied Corporate Finance, 1(2), 37-45.
Lynch, R. (2000). Corporate strategy. London: Prentice Hall.Marino, K. E., Castaldi, R. M., & Dollinger, M. J. (1989). Content analysis in entrepre-
neurship research: The case of initial public offerings. Entrepreneurship Theory andPractice, 14(1), 51-66.
McDaniel, S. W., & Kolari, J. W. (1987). Marketing strategy implications of the Miles andSnow strategic typology. Journal of Marketing, 51(4), 19-30.
28 JOURNAL OF BUSINESS COMMUNICATION
at SAGE Publications on March 24, 2015job.sagepub.comDownloaded from

Meek, G. K., Roberts, C. B., & Gray, S. J. (1995). Factors influencing voluntary annualreport disclosures by U.S. and U.K. and continental European multinational corpora-tions. Journal of International Business Studies, 26, 555-572.
Megginson, W. L., & Weiss, K. A. (1991). Venture capitalist certification in initial publicofferings. Journal of Finance, 46(3), 879-903.
Miles, R. E., & Snow, C. C. (1978). Organizational strategy, structure and process. NewYork: McGraw-Hill.
Mintzberg, H. (1987). Crafting strategy. Harvard Business Review, 65(4), 66-75.Mintzberg, H., Lampel, J. B., Quinn, J. B., & Ghoshal, S. (2003). The strategy process:
Concepts, contexts, and cases. New York: Prentice Hall.Neck, H. M., Welbourne, T. M., & Meyer, G. D. (2000). Competing on knowledge:Young high-
technology initial public offerings build for growth. Frontiers of Entrepreneurship Research.Retrieved from http://www.babson.edu/entrep/fer/XXXIV/XXXIVA/html/xxxiv-a.htm
Neuendorf, K. A. (2002). Content analysis guidebook. Thousand Oaks, CA: Sage.Parnell, J. A., & Wright, P. (1993). Generic strategy and performance: An empirical test of
the Miles and Snow typology. British Journal of Management, 4, 29-36.Perreault, W. D., & Leigh, L. E. (1989). Reliability of normal data based on qualitative
judgment. Journal of Marketing Research, 26, 135-148.Porter, M. (1980). Competitive strategy. New York: Free Press.Ranchhod, A., Gurau, C., & Lace, J. (2002). On-line messages: Developing an integrated
communications model for biotechnology companies. Qualitative Market Research:An International Journal, 5(1), 6-18.
Rapport, A. (1981). Selecting strategies that create shareholder value. Harvard BusinessReview, 59(3), 139-149.
Riley, J. G. (1975). Competitive signaling. Journal of Economic Theory, 10, 174-186.Ritter, J. R. (1991). The long-run performance of initial public offerings. Journal of
Finance, 46(1), 3-27.Ritter, J. R. (1998). Initial public offerings. Contemporary Finance Digest, 2(1), 5-30.Ritter, J. R., & Welch, I. (2002). A review of IPO activity, pricing, and allocation. Journal
of Finance, 57(4), 1795-1828.Rock, K. (1986). Why new issues are under-priced. Journal of Financial Economics, 15(1-2),
187-212.Rosenstein, S., & Wyatt, J. G. (1997). Inside directors, board effectiveness, and share-
holder wealth. Journal of Financial Economics, 44, 229-250.Segev, E. (1989). A systematic comparative analysis and synthesis of two business-level
strategic typologies. Strategic Management Journal, 10, 487-505.Shoham, A., Evangelista, F., & Albaum, G. (2002). Strategic firm type and export perfor-
mance. International Marketing Review, 19(3), 236-258.Shortell, S. M., & Zajac, E. J. (1990). Perceptual and archival measures of Miles and
Snow’s strategic types: A comprehensive assessment of reliability and validity.Academy of Management Journal, 33(4), 817-832.
Slater, S. F., & Narver, J. C. (1993). Product-market strategy and performance: An analysis ofthe Miles and Snow strategy types. European Journal of Marketing, 27(10), 33-51.
Smith, K. G., Guthrie, J. P., & Chen, M. J. (1986). Miles and Snow’s typology of strategy,organizational size, organizational performance. Academy of Management Proceedings,pp. 45-49.
Snow, C. C., & Hrebiniak, L. G. (1980). Strategy, distinctive competence, and organiza-tional performance. Administrative Science Quarterly, 25, 317-335.
Gao et al. / A STUDY OF BIOTECHNOLOGY IPOs 29
at SAGE Publications on March 24, 2015job.sagepub.comDownloaded from
Song, J. H., Rhee, Y., & Adams, C. R. (2001). Maximizing the financial and product mar-ket values of the IPO opportunity. Business Horizons, 44(4), 49-54.
Spence, M. (1973). Job market signaling. Quarterly Journal of Economics, 87, 355-374.Spence, M. (1974). Competitive and optimal responses to signals: An analysis of effi-
ciency and distribution. Journal of Economic Theory, 7, 296-332.Spence, M. (2002). Signaling in retrospect and the informational structure of markets.
American Economic Review, 92(3), 434-459.Thomas, A. S., & Ramaswamy, K. (1996). Matching managers to strategy: Further tests of
the Miles and Snow typology. British Journal of Management, 7, 247-261.Weisenfeld-Schenk, U. (1994). Technology strategies and the Miles and Snow typology:
A study of biotechnology industry. R&D Management, 24(1), 57-64.Woodside, A. G., Sullivan, D. P., & Trappey, R. J. (1999). Assessing relationships among
strategic types, distinctive marketing competencies, and organizational performance.Journal of Business Research, 45, 135-146.
Zahra, S. A. (1987). Corporate strategic types, environmental perceptions, managerialphilosophies, and goals: An empirical study. Akron Business and Economic Review, 18,64-77.
Zajac, E. J., & Shortell, S. M. (1989). Changing generic strategies: Likelihood, directions,and performance implications. Strategic Management Journal, 10, 413-430.
30 JOURNAL OF BUSINESS COMMUNICATION
at SAGE Publications on March 24, 2015job.sagepub.comDownloaded from