Embed Size (px)
Citation preview
Signals & Systems for Speech & Hearing
Week VII
The peripheral auditory system:The ear as a signal processor
1
Think of this set of organs …
2
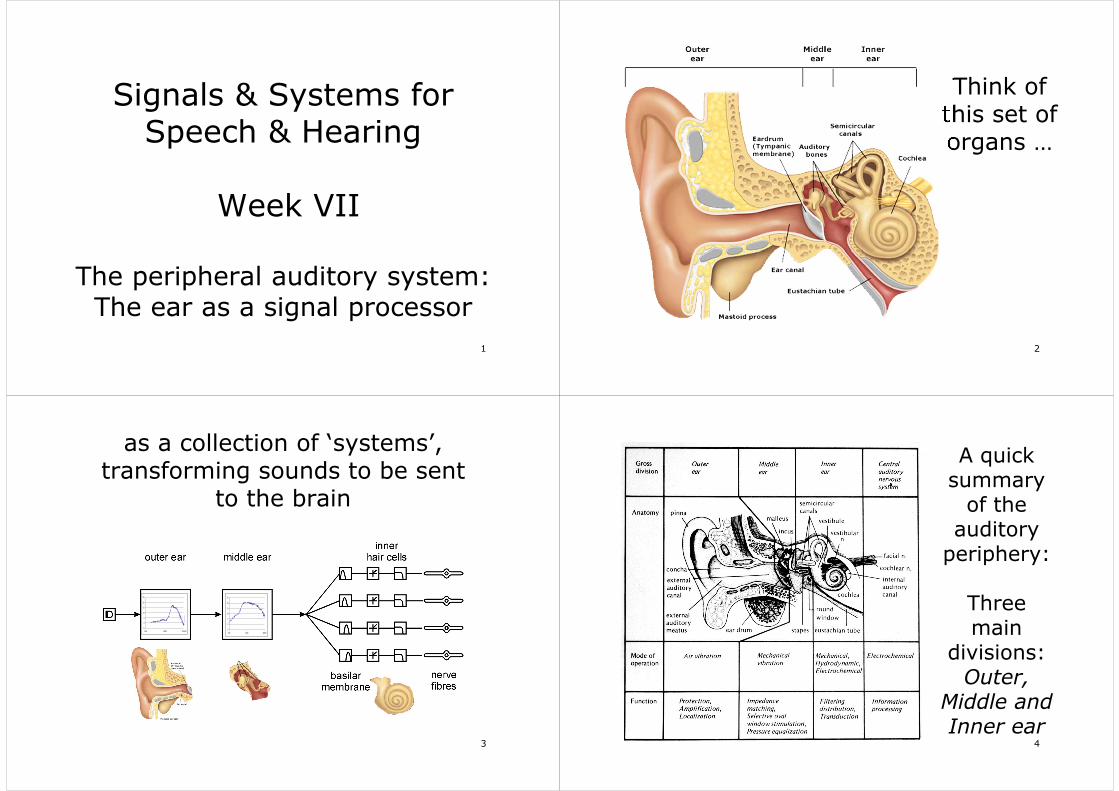
as a collection of ‘systems’, transforming sounds to be sent
to the brain
-5
0
5
10
15
20
25
100 1000 10000-5
0
5
10
15
20
25
100 1000 10000
3
A quick summary
of the auditory
periphery:
Three main
divisions:Outer,
Middle and Inner ear
4
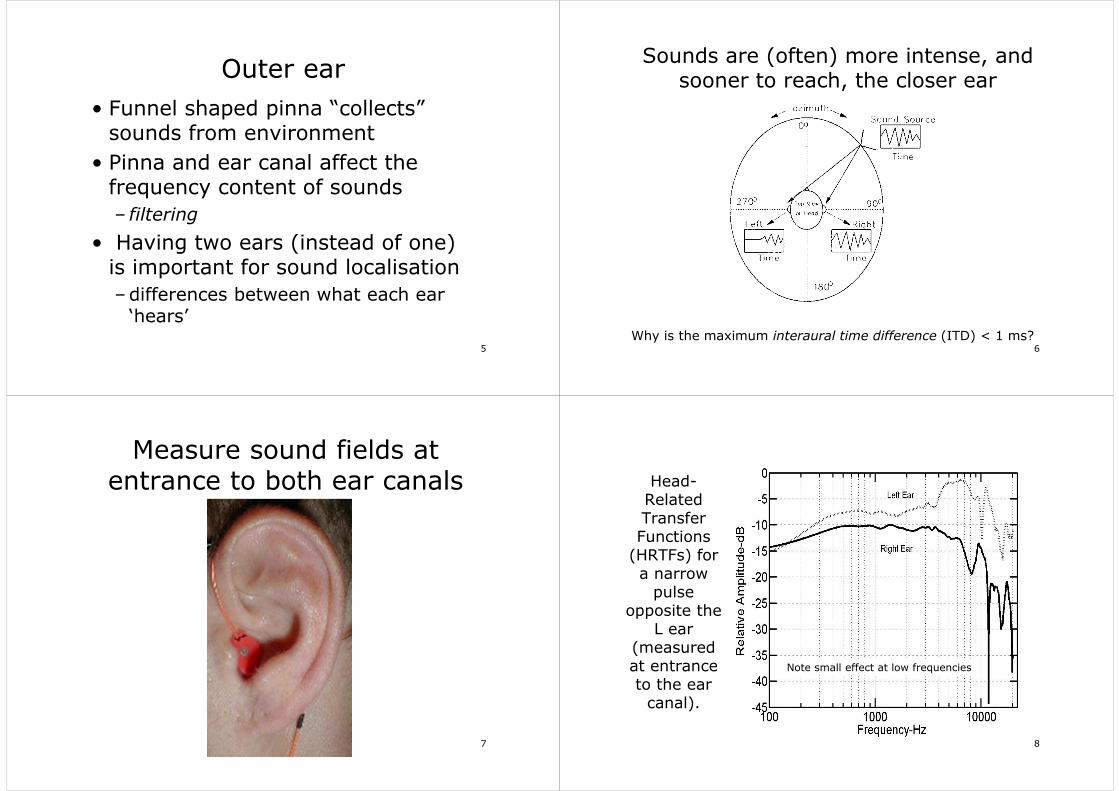
Outer ear
• Funnel shaped pinna “collects” sounds from environment
• Pinna and ear canal affect the frequency content of sounds
– filtering
• Having two ears (instead of one) is important for sound localisation
–differences between what each ear ‘hears’
5
Sounds are (often) more intense, and sooner to reach, the closer ear
Why is the maximum interaural time difference (ITD) < 1 ms?6
Measure sound fields at entrance to both ear canals
7
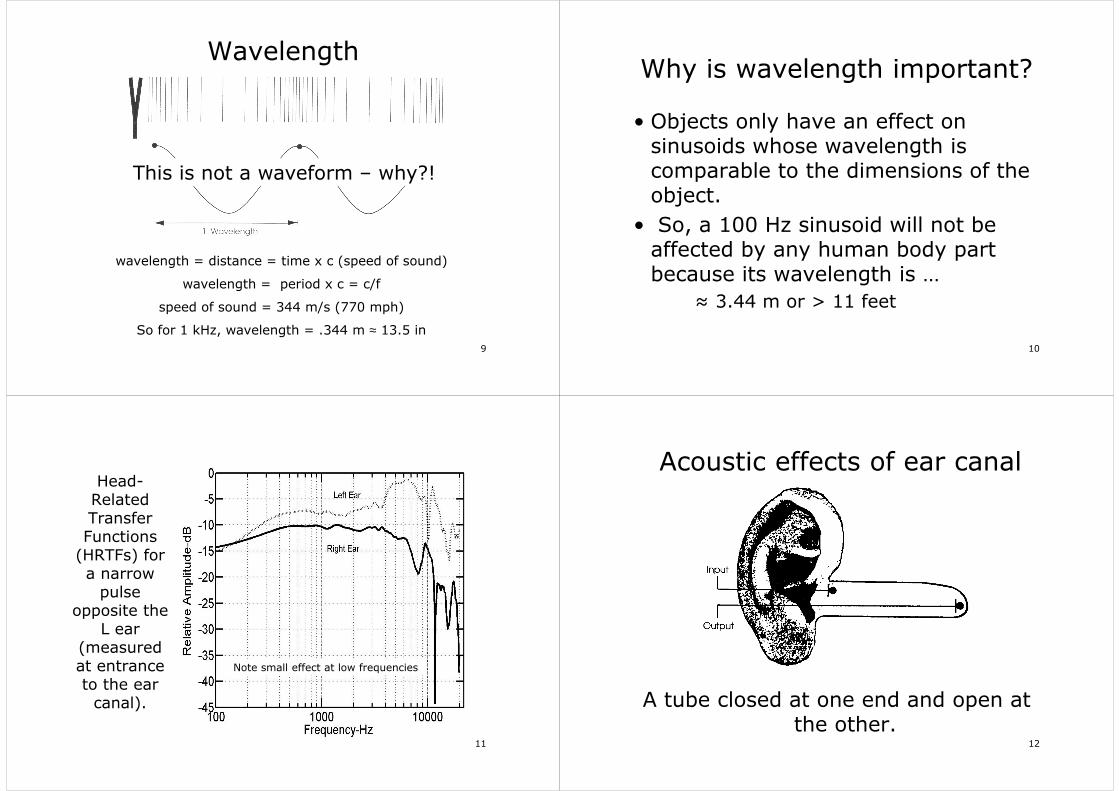
Head-Related Transfer Functions
(HRTFs) for a narrow
pulse opposite the
L ear (measured at entrance to the ear
canal).
Note small effect at low frequencies
8
Wavelength
wavelength = distance = time x c (speed of sound)
wavelength = period x c = c/f
speed of sound = 344 m/s (770 mph)
So for 1 kHz, wavelength = .344 m ≈ 13.5 in
This is not a waveform – why?!
9
Why is wavelength important?
• Objects only have an effect on sinusoids whose wavelength is comparable to the dimensions of the object.
• So, a 100 Hz sinusoid will not be affected by any human body part because its wavelength is …
≈ 3.44 m or > 11 feet
10
Head-Related Transfer Functions
(HRTFs) for a narrow
pulse opposite the
L ear (measured at entrance to the ear
canal).
Note small effect at low frequencies
11
Acoustic effects of ear canal
A tube closed at one end and open at the other.
12
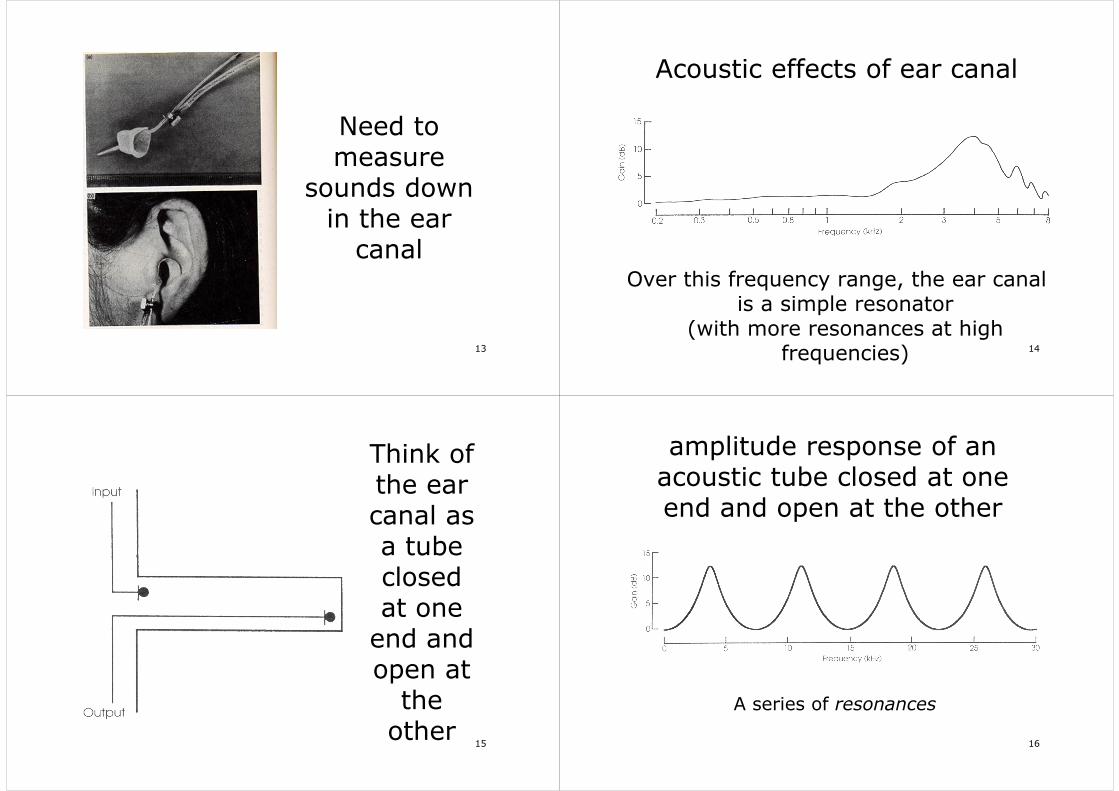
Need to measure
sounds down in the ear
canal
13
Acoustic effects of ear canal
Over this frequency range, the ear canal is a simple resonator
(with more resonances at high frequencies) 14
Think of the ear canal as a tube closed at one
end and open at
the other
15
amplitude response of an acoustic tube closed at one end and open at the other
A series of resonances
16
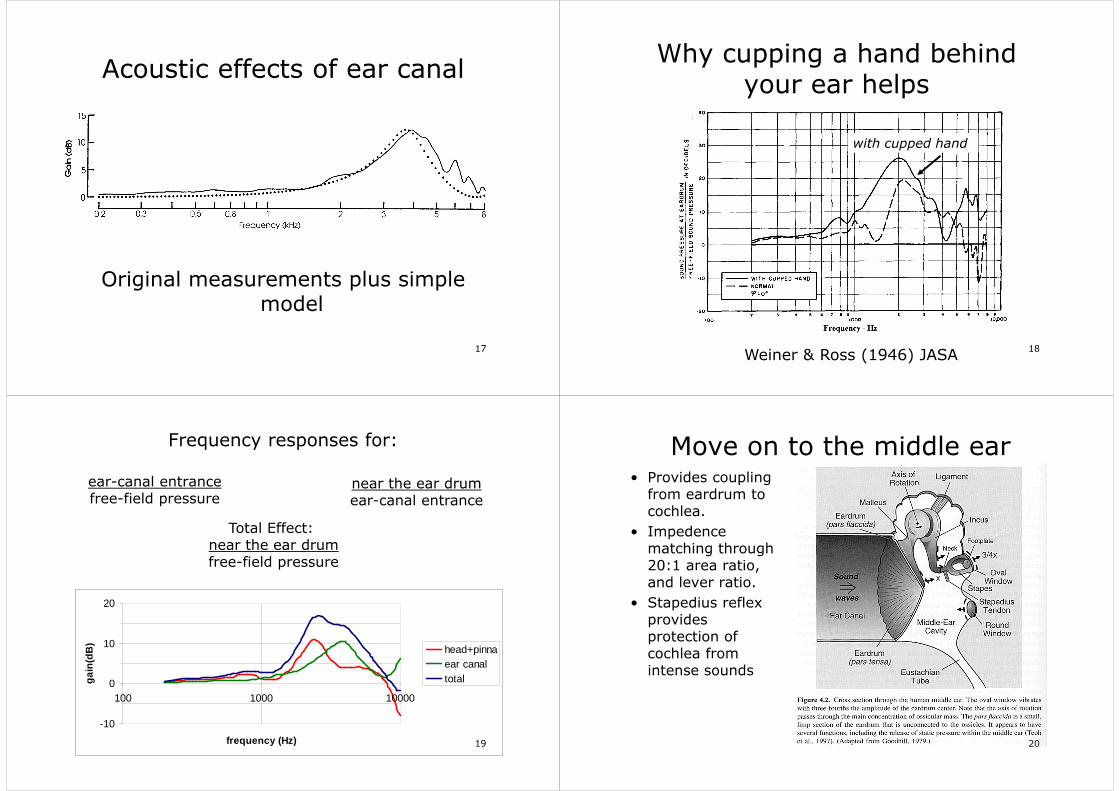
Acoustic effects of ear canal
Original measurements plus simple model
17
Why cupping a hand behind your ear helps
with cupped hand
Weiner & Ross (1946) JASA18
ear-canal entrancefree-field pressure
near the ear drumear-canal entrance
Total Effect:near the ear drumfree-field pressure
Frequency responses for:
-10
0
10
20
100 1000 10000
frequency (Hz)
gai
n(d
B)
head+pinnaear canaltotal
19
Move on to the middle ear• Provides coupling
from eardrum to cochlea.
• Impedence matching through 20:1 area ratio, and lever ratio.
• Stapedius reflex provides protection of cochlea from intense sounds
20
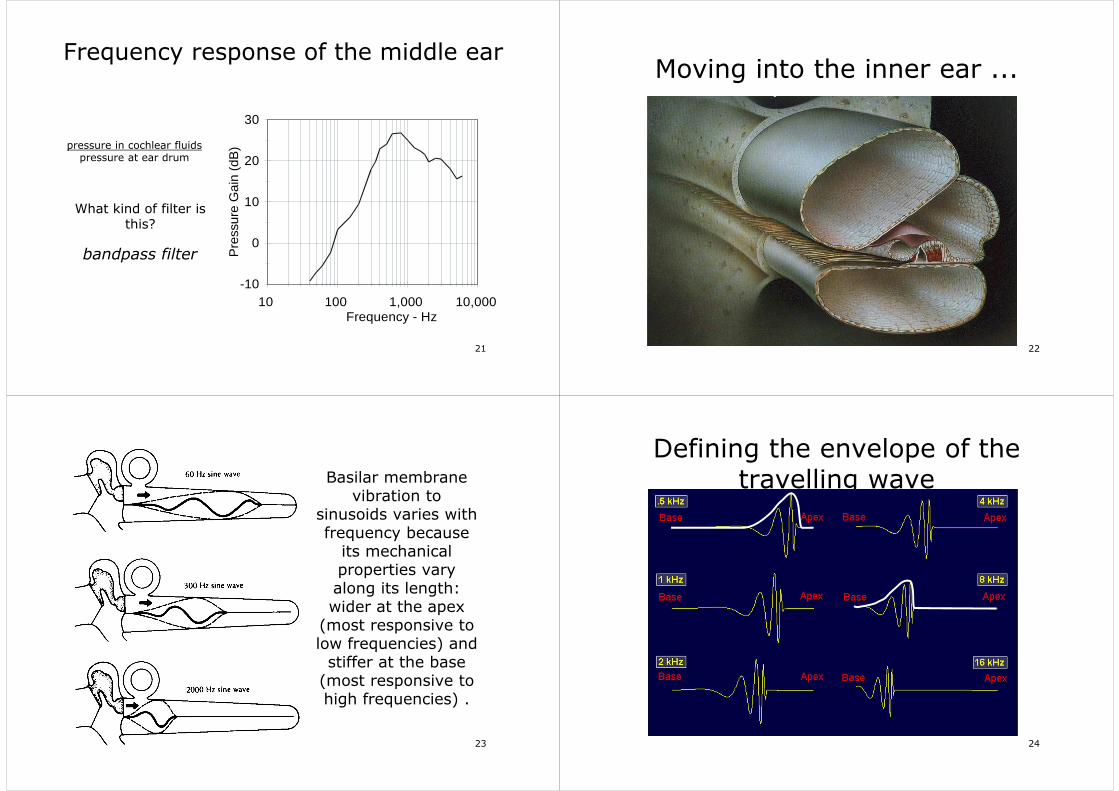
Frequency response of the middle ear
What kind of filter is this?
pressure in cochlear fluidspressure at ear drum
bandpass filter
-10
0
10
20
30
Pre
ssur
e G
ain
(dB
)
10 100 1,000 10,000 Frequency - Hz
21
Moving into the inner ear ...
22
Basilar membrane vibration to
sinusoids varies with frequency because
its mechanical properties vary along its length: wider at the apex
(most responsive to low frequencies) and
stiffer at the base (most responsive to high frequencies) .
23
Defining the envelope of the travelling wave
24
A crucial distinctionexcitation pattern vs frequency response
• Excitation pattern — the vibration pattern across the basilar membrane to a single sound.– Input = 1 sound.
– Measure at many places along the BM.
• Related to a spectrum (amplitude by frequency).
25
A crucial distinctionexcitation pattern vs frequency response
• Frequency response — the amount of vibration shown by a particular place on the BM to sinusoids of varying frequency.– Input = many sinusoids.– Measure at a single place on the BM.– Band-pass filters at each position along the basilar
membrane.
26
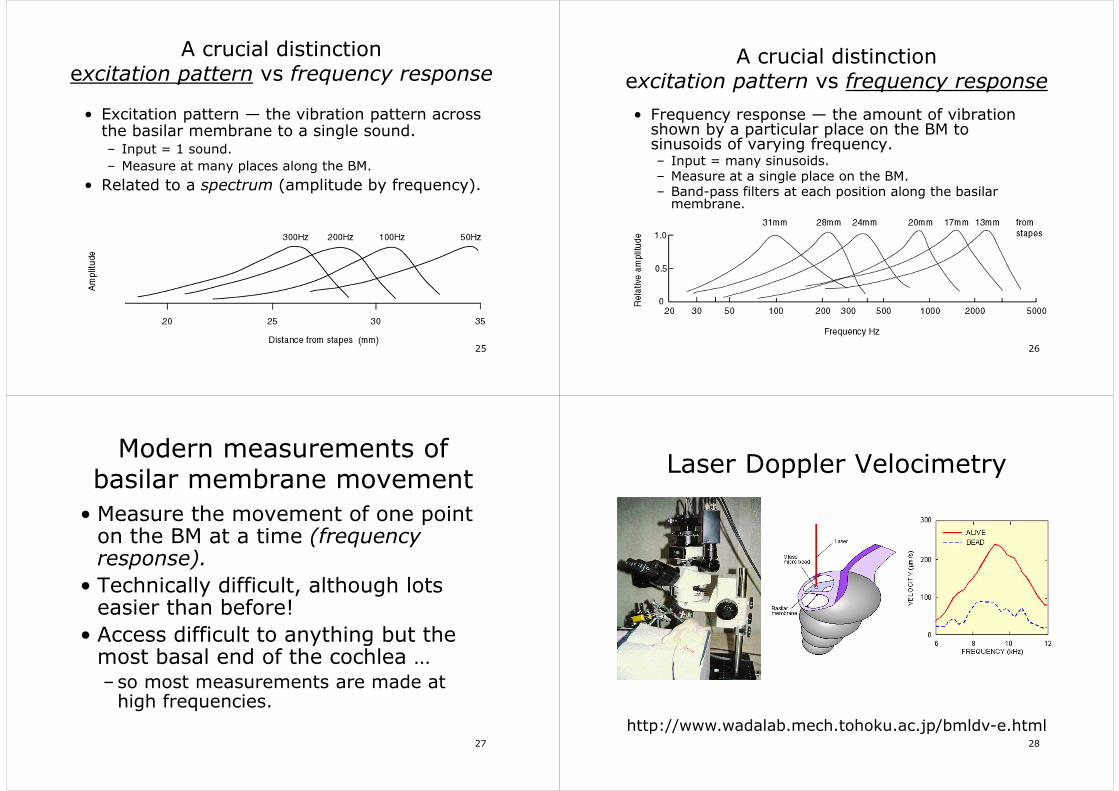
Modern measurements of basilar membrane movement
• Measure the movement of one point on the BM at a time (frequency response).
• Technically difficult, although lots easier than before!
• Access difficult to anything but the most basal end of the cochlea … –so most measurements are made at
high frequencies.
27
Laser Doppler Velocimetry
http://www.wadalab.mech.tohoku.ac.jp/bmldv-e.html28
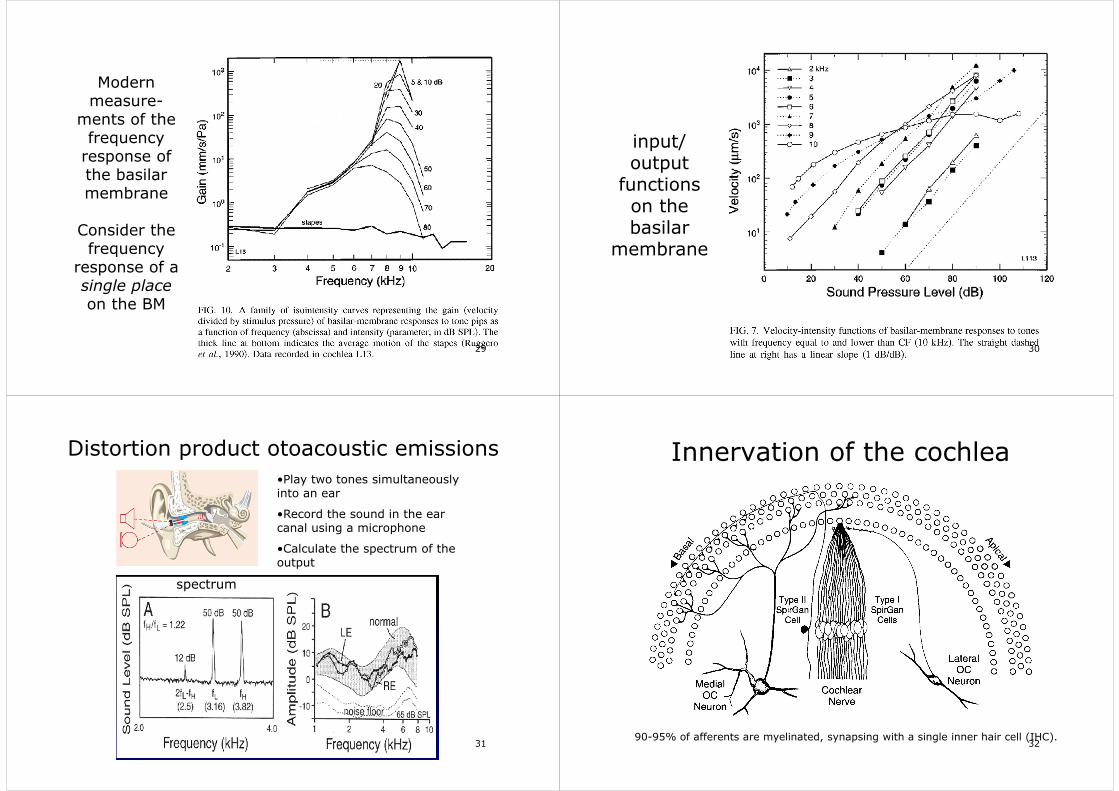
Modern measure-
ments of the frequency
response of the basilar membrane
Consider the frequency
response of a single placeon the BM
29
input/ output
functions on the basilar
membrane
30
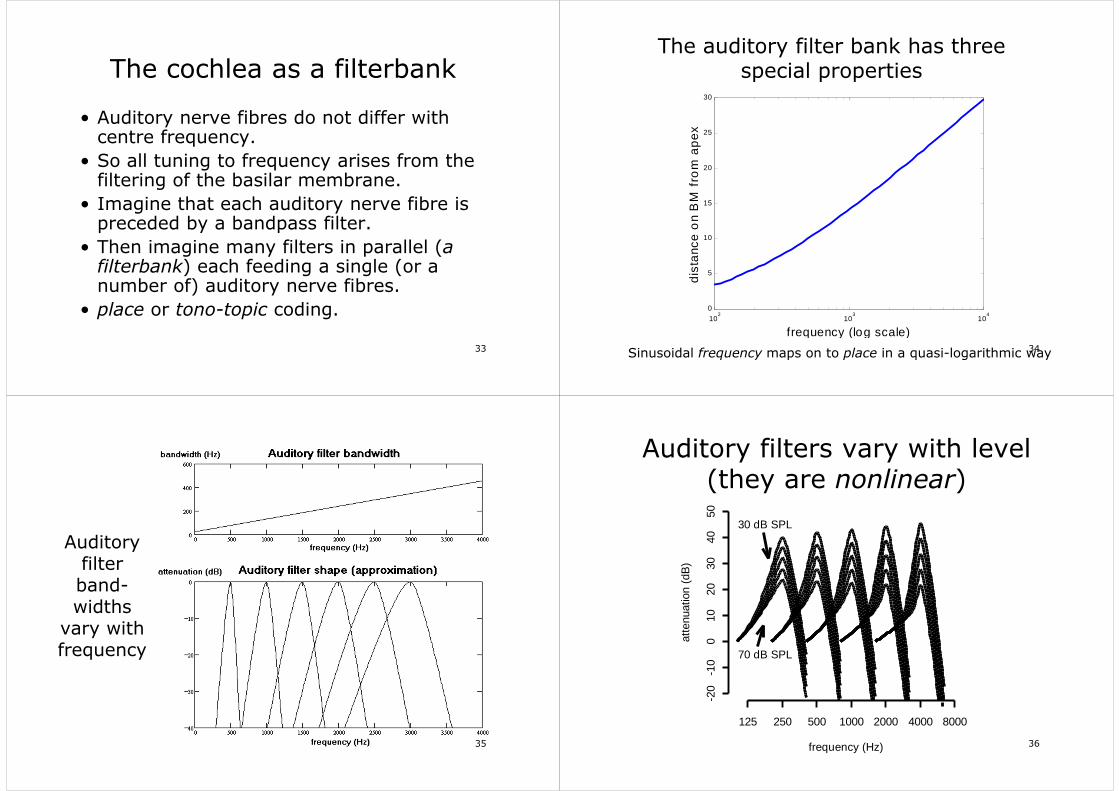
Distortion product otoacoustic emissions
spectrum
•Play two tones simultaneously into an ear
•Record the sound in the ear canal using a microphone
•Calculate the spectrum of the output
31
Innervation of the cochlea
90-95% of afferents are myelinated, synapsing with a single inner hair cell (IHC). 32
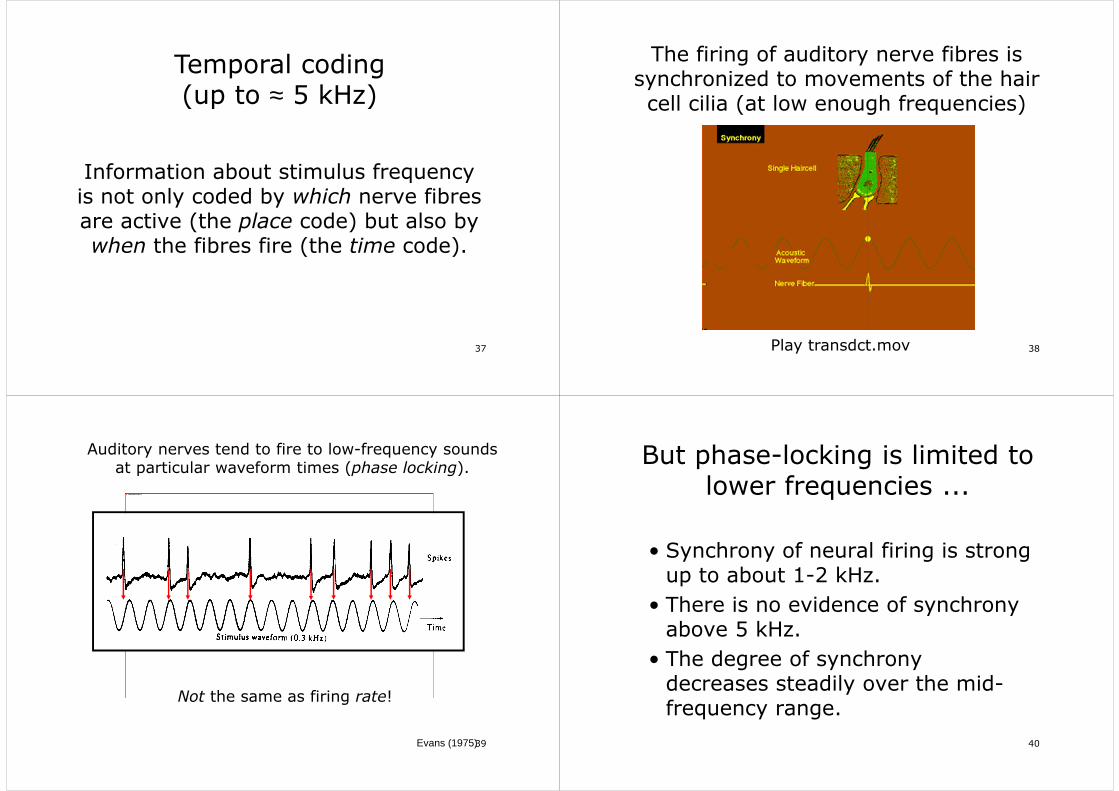
The cochlea as a filterbank
• Auditory nerve fibres do not differ with centre frequency.
• So all tuning to frequency arises from the filtering of the basilar membrane.
• Imagine that each auditory nerve fibre is preceded by a bandpass filter.
• Then imagine many filters in parallel (a filterbank) each feeding a single (or a number of) auditory nerve fibres.
• place or tono-topic coding.
33
The auditory filter bank has three special properties
Sinusoidal frequency maps on to place in a quasi-logarithmic way
102
103
104
0
5
10
15
20
25
30
frequency (log scale)
dis
tanc
e o
n B
M f
rom
ap
ex
34
Auditory filter band-widths
vary with frequency
35
Auditory filters vary with level (they are nonlinear)
frequency (Hz)
atte
nuat
ion
(dB
)
125 250 500 1000 2000 4000 8000-2
0-1
00
1020
3040
50
70 dB SPL
30 dB SPL
36
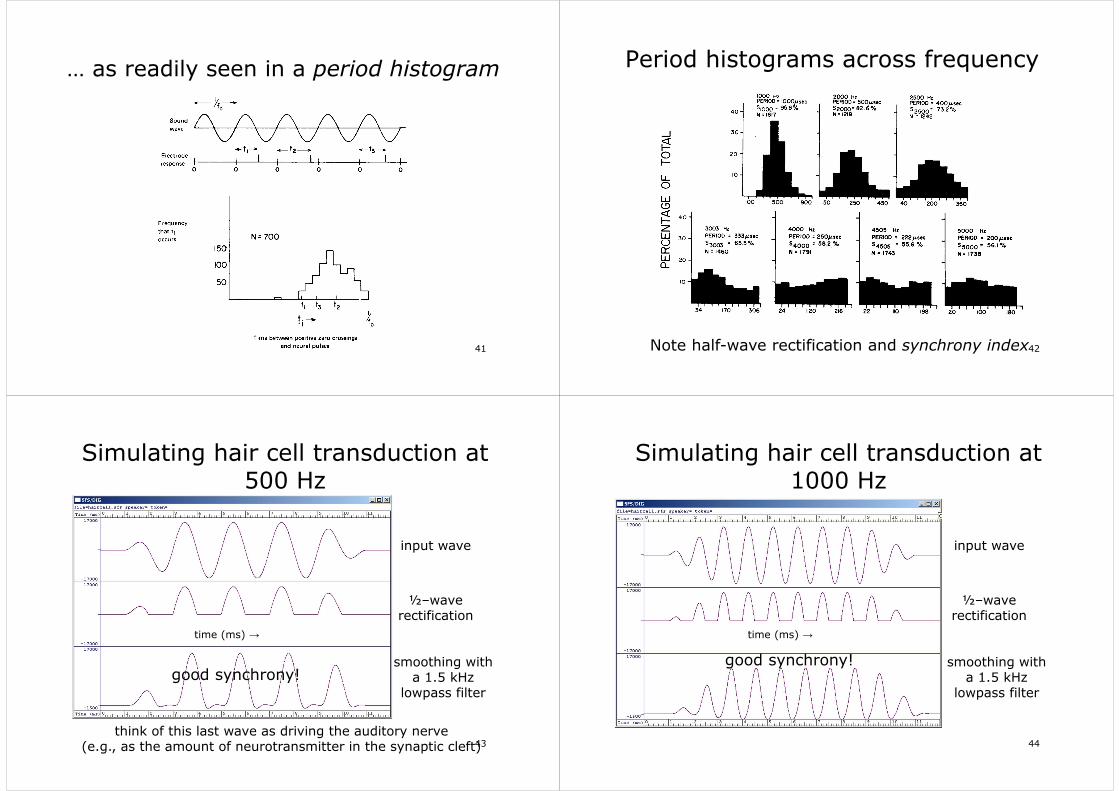
Information about stimulus frequency is not only coded by which nerve fibres are active (the place code) but also by when the fibres fire (the time code).
Temporal coding(up to ≈ 5 kHz)
37
The firing of auditory nerve fibres is synchronized to movements of the hair cell cilia (at low enough frequencies)
Play transdct.mov 38
Auditory nerves tend to fire to low-frequency sounds at particular waveform times (phase locking).
Evans (1975)
Not the same as firing rate!
39
But phase-locking is limited to lower frequencies ...
• Synchrony of neural firing is strong up to about 1-2 kHz.
• There is no evidence of synchrony above 5 kHz.
• The degree of synchrony decreases steadily over the mid-frequency range.
40
… as readily seen in a period histogram
41
Period histograms across frequency
Note half-wave rectification and synchrony index42
Simulating hair cell transduction at 500 Hz
input wave
½–wave rectification
smoothing with a 1.5 kHz
lowpass filter
think of this last wave as driving the auditory nerve(e.g., as the amount of neurotransmitter in the synaptic cleft)
time (ms) →
good synchrony!
43
Simulating hair cell transduction at 1000 Hz
input wave
½–wave rectification
smoothing with a 1.5 kHz
lowpass filter
time (ms) →
good synchrony!
44
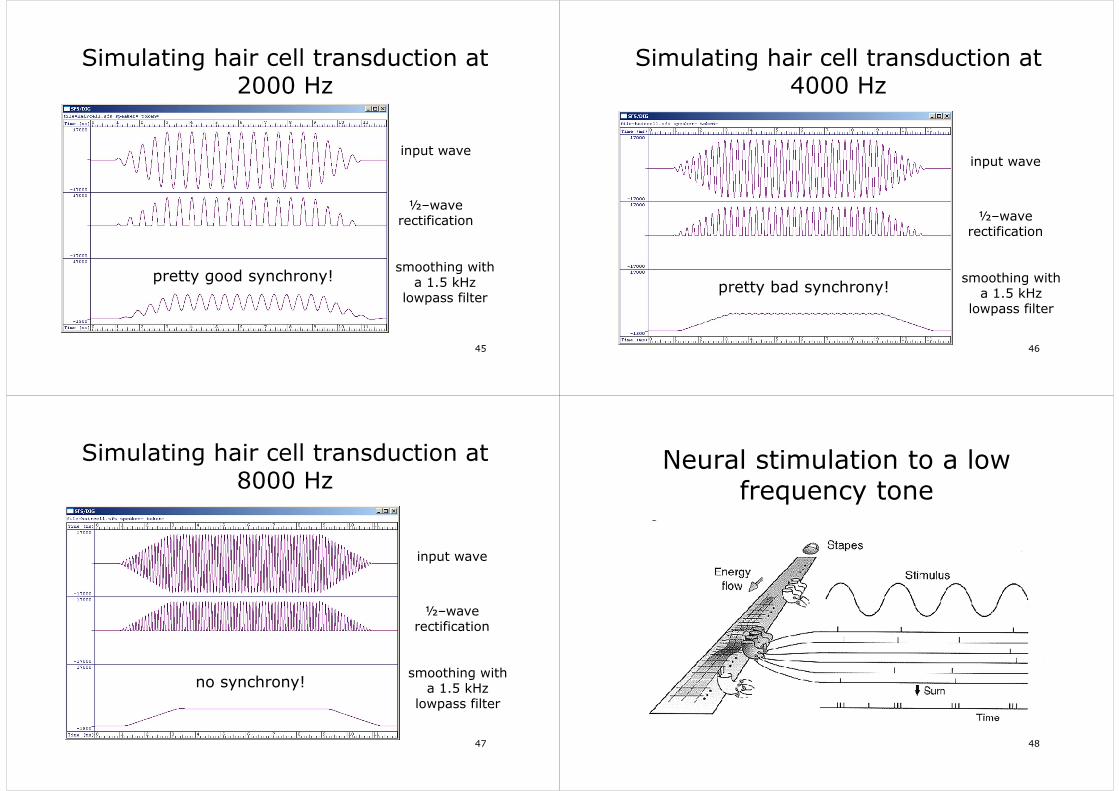
Simulating hair cell transduction at 2000 Hz
input wave
½–wave rectification
smoothing with a 1.5 kHz
lowpass filter
pretty good synchrony!
45
Simulating hair cell transduction at 4000 Hz
input wave
½–wave rectification
smoothing with a 1.5 kHz
lowpass filter
pretty bad synchrony!
46
Simulating hair cell transduction at 8000 Hz
input wave
½–wave rectification
smoothing with a 1.5 kHz
lowpass filter
no synchrony!
47
Neural stimulation to a low frequency tone
48