Embed Size (px)
Citation preview
MNRAS 492, 3553–3565 (2020) doi:10.1093/mnras/staa003Advance Access publication 2020 January 10
Signatures of bimodality in nebular phase Type Ia supernova spectra
P. J. Vallely ,1‹ M. A. Tucker,2 B. J. Shappee,2 J. S. Brown,1,3 K. Z. Stanek1,4
and C. S. Kochanek1,4
1Department of Astronomy, The Ohio State University, 140 West 18th Avenue, Columbus, OH 43210, USA2Institute for Astronomy, University of Hawai’i, 2680 Woodlawn Drive, Honolulu, HI 96822, USA3Department of Astronomy and Astrophysics, University of California, Santa Cruz, CA 95064, USA4Center for Cosmology and AstroParticle Physics, The Ohio State University, 191 W. Woodruff Ave., Columbus, OH 43210, USA
Accepted 2019 December 27. Received 2019 December 6; in original form 2019 January 31
ABSTRACTOne observational prediction for Type Ia supernovae (SNe Ia) explosions produced throughwhite dwarf–white dwarf collisions is the presence of bimodal velocity distributions for the56Ni decay products, although this signature can also be produced by an off-centre ignition ina delayed detonation explosion. These bimodal velocity distributions can manifest as double-peaked or flat-topped spectral features in late-time spectroscopic observations for favourableviewing angles. We present nebular-phase spectroscopic observations of 17 SNe Ia obtainedwith the Large Binocular Telescope. Combining these observations with an extensive search ofpublicly available archival data, we collect a total sample of 48 SNe Ia and classify them basedon whether they show compelling evidence for bimodal velocity profiles in three featuresassociated with 56Ni decay products: the [Fe II] and [Fe III] feature at ∼5300 Å, the [Co III]λ5891 feature, and the [Co III] and [Fe II] feature at ∼6600 Å. We identify nine bimodal SNe inour sample, and we find that these SNe have average peak MV about 0.3 mag fainter than thosethat do not. This is consistent with theoretical predictions for explosions created by nearlyhead-on collisions of white dwarfs due to viewing angle effects and 56Ni yields.
Key words: techniques: spectroscopic – supernovae: general.
1 INTRODUCTION
Type Ia supernovae (SNe Ia) are important objects in astronomy.With luminosities of ∼1043 erg s−1 at maximum light, they can bedetected and monitored out to considerable distances. SNe Ia arebest known for their use as cosmological standardizable candles,arising from the tight correlation discovered by Phillips (1993)between their peak MB and their rate of decline �m15(B). Riesset al. (1998) and Perlmutter et al. (1999) took advantage of thisrelationship to discover the accelerating expansion of the Universe.Beyond cosmology, SNe Ia also play an important role in our under-standing of nucleosynthesis, as they are one of the primary sourcesof iron-group and intermediate-mass elements, have a significantimpact on the gas dynamics and star formation characteristics ofgalaxies, and are likely sources of high-energy cosmic rays (see e.g.Maoz, Mannucci & Nelemans 2014).
Despite the importance of SNe Ia, our knowledge of the eventsthemselves is still far from complete. The most pressing questionssurround the nature of their progenitors and explosion mechanism.SN Ia explosions are the thermonuclear detonations of carbon–oxygen white dwarfs (CO WDs; Hoyle & Fowler 1960; Colgate &
� E-mail: [email protected]
McKee 1969), and a companion is required to trigger the explosion.The details of the explosion mechanism are unknown and remainan active topic of discussion. Possible progenitor scenarios can bebroadly divided into two channels: one involving a companion starstill undergoing thermonuclear burning (the single-degenerate orSD scenario), and one involving a WD companion (the double-degenerate or DD scenario).
In the canonical SD scenario, a CO WD accretes hydrogen-richor helium-rich material from a non-degenerate companion until itapproaches the Chandrasekhar limit, at which point it experiences athermonuclear runaway and explodes (Whelan & Iben 1973; Han &Podsiadlowski 2004). There has also been considerable work doneto study possible sub-Chandrasekhar (Woosley & Weaver 1994;Sim et al. 2010; Shen & Moore 2014) and super-Chandrasekhar(Yoon, Langer & Scheithauer 2004; Yoon & Langer 2005; Hachisu,Kato & Nomoto 2012) SD channel explosions. In the standard DDscenario, a tight WD binary loses energy and angular momentumto gravitational wave emission before undergoing tidal interactionsand subsequently exploding as a SN Ia (Iben & Tutukov 1984; Web-bink 1984; Shen et al. 2012). The complete theoretical landscape forSNe Ia is considerably more complex, including numerous proposedexplosion mechanisms for both scenarios. Popular mechanismsinclude the delayed detonation (Khokhlov 1991; Woosley & Weaver1994; Livne 1999) and double detonation (Woosley, Weaver & Taam
C© 2020 The Author(s)Published by Oxford University Press on behalf of the Royal Astronomical Society
Dow
nloaded from https://academ
ic.oup.com/m
nras/article-abstract/492/3/3553/5700293 by Serials Division user on 23 June 2020
3554 P. J. Vallely et al.
1980; Nomoto 1982; Bildsten et al. 2007; Shen & Moore 2014)models. More exotic mechanisms like the violent prompt mergerscenario, an SD variant where a WD merges with the degeneratecore of an asymptotic giant branch star, have also been considered(Livio & Riess 2003; Soker et al. 2013).
All of these progenitor channels have varying degrees of theo-retical and observational problems. For instance, most SD scenariochannels require finely tuned accretion rates in order for the WD tosuccessfully gain mass and explode (Starrfield et al. 1972; Nomoto1982; Iben & Tutukov 1984). Additionally, observational evidencefor such progenitor systems has proven to be elusive. The nearbySNe Ia 2011fe and 2014J were particularly well studied (Brownet al. 2012; Munari et al. 2013; Foley et al. 2014; Goobar et al.2014; Mazzali et al. 2014; Galbany et al. 2016; Vallely et al. 2016;Shappee et al. 2017; Yang et al. 2018), but no compelling evidencewas found for the existence of non-degenerate companions (Bloomet al. 2012; Chomiuk et al. 2012; Shappee et al. 2013; Margutti et al.2014; Lundqvist et al. 2015).
Extensive searches for hydrogen emission lines at late times asevidence for stripped companion material have largely failed (Mat-tila et al. 2005; Leonard 2007; Lundqvist et al. 2013; Maguire et al.2016; Graham et al. 2017; Sand et al. 2018; Holmbo et al. 2019; Sandet al. 2019; Tucker, Shappee & Wisniewski 2019). Indeed, in anunparalleled sample of over 100 SNe Ia, Tucker et al. (2019) foundno evidence for the predicted emission signatures. To date, onlytwo normal Type Ia SNe, ASASSN-18tb (Brimacombe et al. 2018)and ATLAS18qtd (Prieto et al. 2019), show compelling evidencefor strong H α emission (Kollmeier et al. 2019). However, Vallelyet al. (2019) showed that the hydrogen signature in ASASSN-18tbis likely a product of CSM interaction and not indicative of an SDprogenitor system. In contrast, Prieto et al. (2019) find that the H α
emission observed in ATLAS18qtd is broadly consistent with thesignatures expected for stripped companion material, although theynote that the inferred hydrogen mass of ∼ 10−3 M� is significantlybelow classical SD theoretical model predictions.
Fine-tuning is also generally required for DD scenario mergersto avoid off-centre ignitions and accretion-induced collapse toa neutron star (Nomoto & Iben 1985; Shen et al. 2012; Mollet al. 2014). Extensive discussion of SNe Ia progenitor systemsand explosion mechanisms and their respective theoretical andobservational challenges can be found in Hillebrandt et al. (2013),Maoz et al. (2014), Branch & Wheeler (2017), and Ashall et al.(2018).
Another possible progenitor scenario is the collisional WDchannel. In this variant of the DD scenario, rather than slowlyinspiralling due to gravitational wave emission, the two WDs collidenearly head-on – virtually guaranteeing explosion due to the strongshocks produced in the collision (Hawley, Athanassiadou & Timmes2012; Garcıa-Senz et al. 2013; Kushnir et al. 2013). This scenariowas first raised as a potential explanation for a small fraction ofobserved SNe Ia in dense stellar regions (Rosswog et al. 2009b;Raskin et al. 2009, 2010). The Kozai–Lidov effect (Kozai 1962;Lidov 1962) in triple systems may make this channel relativelygeneric (Thompson 2011; Antognini et al. 2014). Katz & Dong(2012) argue that the rate of direct WD collisions may nearly equalthat of observed SNe Ia, although the extent of this collision rate en-hancement is debated by Hamers et al. (2013) and Toonen, Perets &Hamers (2018).
The collisional WD channel provides fairly straightforwardobservable predictions. In particular, the velocity distribution ofthe 56Ni deposited in the ejecta of these explosions is intrinsicallybimodal (Dong et al. 2015). At appropriate viewing angles, these
bimodal velocity distributions will manifest as double-peaked orflat-topped spectral features in late-time spectroscopic observationsof 56Ni decay products. Upon examining archival nebular phasespectra of SNe Ia, Dong et al. (2015) confidently identified signa-tures of bimodality in 3 of the 18 SNe in their sample, indicating thatSNe Ia exhibiting this predicted characteristic are not uncommon.
This is not a unique observable of the collisional WD channel,however, as bimodal 56Ni distributions can also be produced byan off-centre delayed detonation (Fesen et al. 2007; Gerardy et al.2007). In this explosion mechanism, the supernova explosion beginsas a subsonic deflagration wave at the centre of the WD andpropagates outwards. The deflagration transitions into a supersonicdetonation front when the density at its leading edge crosses acritical transition density (Khokhlov 1991; Woosley & Weaver1994; Livne 1999). This transition is not perfectly understood, so thevalue of this critical density is chosen such that the model replicatesobserved characteristics of SNe Ia (Hoflich, Khokhlov & Wheeler1995; Hoflich et al. 2003). A significant quantity of off-centre 56Ni isproduced during the detonation phase (Hoflich et al. 2002; Gerardyet al. 2007). Off-centre delayed detonations are generally consideredin the context of SD progenitor systems, but they can also occur inthe DD case (Piersanti et al. 2003). The degeneracy between WDcollisions and off-centre delayed-detonations can be broken usingdetailed radiative transfer calculations to analyse the observations(Mazzali et al. 2018).
In this paper, we present nebular-phase spectroscopic observa-tions of 17 nearby SNe Ia obtained over the past few years usingthe Large Binocular Telescope (LBT; Hill, Green & Slagle 2006).Most of these spectra were obtained as part of a long-term effortto accumulate a complete volume-limited spectroscopic sample ofSNe Ia nebular phase observations out to z ∼ 0.2. Once complete,the nebular spectra for 100 SNe Ia (Dong et al. 2018) survey willbe an invaluable resource for our understanding of SNe Ia andtheir progenitors. Among the sample we present here, we identifytwo events that are consistent with an underlying bimodal velocitydistribution. We then combine these spectra with a sample of 31additional archival nebular phase SNe Ia observations presented inTucker et al. (2019), where we identify an additional seven eventsshowing evidence of bimodality. We show that these bimodal SNe Iaare systematically less luminous at peak than their single velocitycomponent counterparts, and we discuss how this may arise fromviewing angle dependent effects inherent to the collisional WDscenario or 56Ni production.
This paper is organized as follows. In Section 2.1, we describe theLBT observations we undertook to obtain 18 spectra of 17 nearbySNe Ia during the nebular phase. In Section 2.2, we describe thesources from which we obtained our archival sample of nebularphase spectra and near-peak photometry, and we also provide abrief description of the methods we used to convert the observedV-band observations into absolute magnitudes. In Section 3, wedescribe the classification methods we use to determine whetheror not spectra show evidence of a bimodal velocity distribution.Finally, in Section 4 we demonstrate that bimodal SNe Ia are lessluminous than SNe Ia in general, and we discuss our findings in thecontext of the SNe Ia progenitor problem.
2 THE SAMPLE
2.1 Previously unpublished observations
All of the new spectra we present here were obtained using theMULTIOBJECT DOUBLE SPECTROGRAPHs mounted on the twin 8.4m
MNRAS 492, 3553–3565 (2020)
Dow
nloaded from https://academ
ic.oup.com/m
nras/article-abstract/492/3/3553/5700293 by Serials Division user on 23 June 2020
Bimodality in nebular phase SNe Ia 3555
LBT (MODS1 and MODS2; Pogge et al. 2010). The MODS1spectra were reduced using a combination of the MODSCCDRED1
PYTHON package, and the MODSIDL pipeline.2 Unfortunately, someof the calibration data necessary to use the MODSIDL pipeline are notyet available for MODS2, so the MODS2 observations were reducedusing standard techniques in IRAF to extract and calibrate the 1Dspectra in wavelength and flux. Spectra of SNe 2016ehy, 2016ffh,2016fnr, and ASASSN-16lx were obtained using only MODS2 databecause MODS1 was not operational during those observations. Allother spectra were obtained using only MODS1 data. Due to therelatively high sky noise in the red channel, the spectrum of 2016brycould only be extracted in the blue channel and is excluded fromfuther analysis.
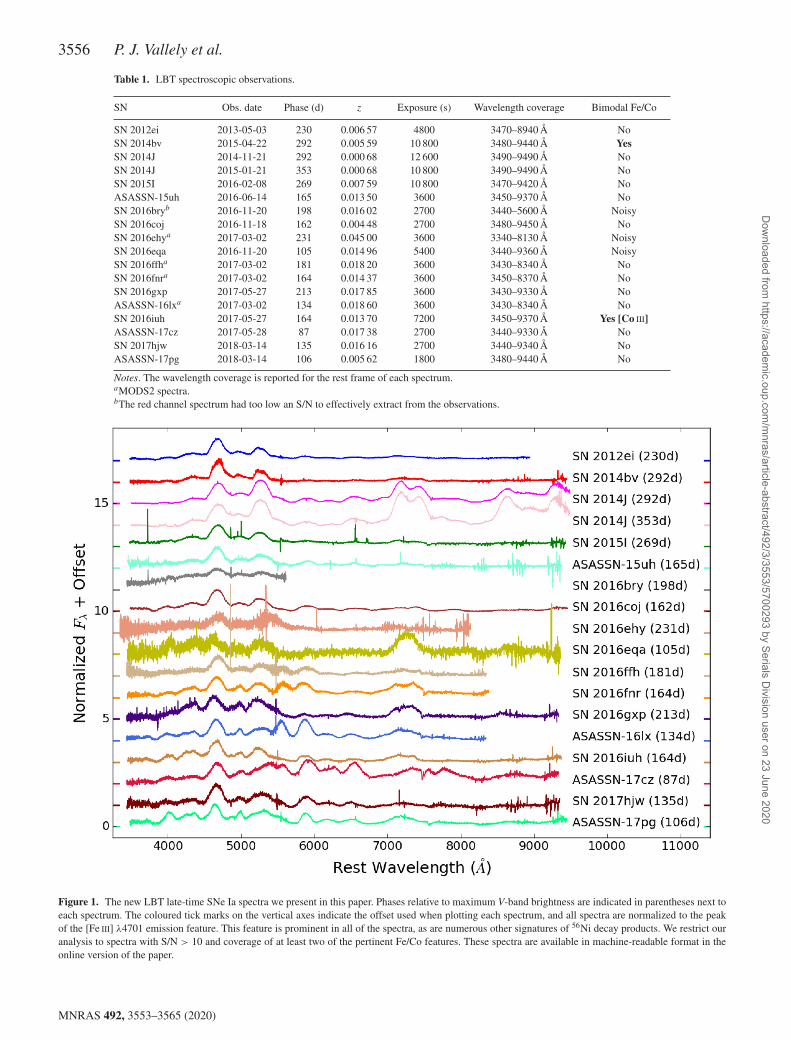
The properties of these spectroscopic observations are summa-rized in Table 1, and Fig. 1 shows the 18 LBT spectra we obtainedfor this paper. Broadly speaking, the spectroscopic properties ofour sample are comparable to the sample presented by Grahamet al. (2017). All of the spectra show prominent emission featuresin various 56Ni decay products, and the [Fe III] λ4701 emissionfeature is particularly strong in all of the spectra. In our analysis,we focus on three neighbouring Fe/Co emission features: the [Fe II]and [Fe III] blended feature at ∼5300 Å, the [Co III] λ5891 feature,and the [Fe II] and [Co III] blended feature at ∼6600 Å.
An in-depth discussion justifying the use of these features can befound in appendix B of Dong et al. (2015). In short, they are chosenbecause they are narrow, well characterized, and nearly identicalbetween the spectra of SNe 1991bg and SN 1999by. The structureof the [Fe III] λ4701 feature, on the other hand, differs significantlybetween the two SNe and appears to be strongly impacted bycomplicated blends of nearby lines, rendering it unsuitable for ouranalysis. We are limited to these optical features only due to thewavelength ranges of the spectra in our sample. In principle, anunderlying bimodal velocity distribution of 56Ni should manifest inall late-time Fe/Co features, and as we discuss in Section 3, thisallows us to verify our identifications using the results of studies atnon-optical wavelengths.
We restrict our analysis to spectra with S/N > 10 and coverageof at least two of the pertinent Fe/Co features. This leads to theexclusion of the spectra for SNe 2016bry, 2016ehy, and 2016eqa.As we discuss further in Section 3, the spectra of SNe 2014bv and2016iuh are particularly interesting, as they show fairly compellingevidence of bimodal velocity distributions in their 56Ni ejecta.
2.2 Archival data
We also utilize a subset of the exhaustive sample of spectroscopicarchival late-time SNe Ia observations we collected and presentin Tucker et al. (2019). To obtain this sample, we systematicallyextracted spectra from a number of archival data bases, includingthe Weizmann Interactive Supernova Data Repository (Yaron &Gal-Yam 2012), the Open Supernova Catalog (Guillochon et al.2017), the Berkeley SuperNova Ia Program (Silverman et al. 2009,2012), the Carnegie Supernova Project (CSP; Folatelli et al. 2013),and the Center for Astrophysics Supernova Program (Blondin et al.2012). We also present a number of previously unpublished spectrareduced from raw data available in other public archives. See Tuckeret al. (2019) for a detailed description of how we obtained the full
1http://www.astronomy.ohio-state.edu/MODS/Software/modsCCDRed/2http://www.astronomy.ohio-state.edu/MODS/Software/modsIDL/
sample. The spectroscopic properties of the SNe we utilize in ouranalysis are summarized in Table 2.
We restrict our sample to events with reasonably well-samplednear-peak V-band light curves, so that we can compare the peakluminosities of the bimodal events with the overall sample. Thephotometric properties of these archival SNe Ia are summarizedin Table 3. Only Swift UVOT observations were obtained for afew of these events, and in these instances we use UVOT V-bandobservations in lieu of Johnson V-band observations. We identifythese events in Table 3. In cases where both were obtained, we usethe Johnson V observations.
With the exception of the extreme cases of SNe 1986G, 2002er,and 2014J, we do not correct for host galaxy extinction. It seemsunlikely that there would be any preference for bimodal events tooccur along high or low extinction lines of sight, so for our relativecomparison of peak MV this should be of no major concern. Weaccount for Galactic foreground extinction using the Schlafly &Finkbeiner (2011) infrared-based dust map, and we use redshift-independent estimates of the distance modulus (μ) for SNe with z
< 0.01.
3 DETERMINING BIMODALITY
In the majority of cases, detecting signatures of bimodality in the56Ni velocity profiles of a spectrum can be performed fairly reliablyby inspection. For instance, one can visually identify double-peakedFe/Co features in the late-time spectra of SN 2007on and SN2014bv, indicating possible bimodal velocity profiles. Similarly,a cursory examination of the late-time spectra of SN 2011fe and SN2012cg shows no need to invoke anything beyond standard single-component velocity broadening. However, there are also eventssuch as SNe 2016iuh and 2012ei that do not fall cleanly into eithercategory. In order to handle the classification of these borderlineevents self-consistently, and to minimize the impact of any potentialbias, it is best to have an objective classification scheme.
We use the direct convolution technique described by Dong et al.(2015), although our implementation differs slightly. We construct abimodal velocity kernel using two quadratic components, and thenconvolve this kernel with a template SN Ia nebular phase spectrum.Due to its narrow emission features and particularly high S/N, weretain from Dong et al. (2015) the use of SN 1999by for this pre-convolution template. This phase + 180d SN 1999by templatespectrum is shown by the blue line in Fig. 2.
The velocity convolution kernel is described by
dM
dvLOS∝ P1 + r · P2, where (1)
P1 = max
(1 − (vLOS − vshift,1)2
σ 2mod,1
, 0
), (2)
vshift,1 = vshift − 1
2vsep, (3)
P2 = max
(1 − (vLOS − vshift,2)2
σ 2mod,2
, 0
), and (4)
vshift,2 = vshift + 1
2vsep. (5)
There are five free parameters: the shifts of the two com-ponents vshift,1 and vshift,2, the widths of the two componentsσ mod,1 and σ mod,2, and the peak ratio of the components r. Theshifts are described using the two parameters of velocity shift,vshift = 1
2 (σmod,1 + σmod,2), and velocity separation, vsep = vshift,2
− vshift,1.
MNRAS 492, 3553–3565 (2020)
Dow
nloaded from https://academ
ic.oup.com/m
nras/article-abstract/492/3/3553/5700293 by Serials Division user on 23 June 2020
3556 P. J. Vallely et al.
Table 1. LBT spectroscopic observations.
SN Obs. date Phase (d) z Exposure (s) Wavelength coverage Bimodal Fe/Co
SN 2012ei 2013-05-03 230 0.006 57 4800 3470–8940 Å NoSN 2014bv 2015-04-22 292 0.005 59 10 800 3480–9440 Å YesSN 2014J 2014-11-21 292 0.000 68 12 600 3490–9490 Å NoSN 2014J 2015-01-21 353 0.000 68 10 800 3490–9490 Å NoSN 2015I 2016-02-08 269 0.007 59 10 800 3470–9420 Å NoASASSN-15uh 2016-06-14 165 0.013 50 3600 3450–9370 Å NoSN 2016bryb 2016-11-20 198 0.016 02 2700 3440–5600 Å NoisySN 2016coj 2016-11-18 162 0.004 48 2700 3480–9450 Å NoSN 2016ehya 2017-03-02 231 0.045 00 3600 3340–8130 Å NoisySN 2016eqa 2016-11-20 105 0.014 96 5400 3440–9360 Å NoisySN 2016ffha 2017-03-02 181 0.018 20 3600 3430–8340 Å NoSN 2016fnra 2017-03-02 164 0.014 37 3600 3450–8370 Å NoSN 2016gxp 2017-05-27 213 0.017 85 3600 3430–9330 Å NoASASSN-16lxa 2017-03-02 134 0.018 60 3600 3430–8340 Å NoSN 2016iuh 2017-05-27 164 0.013 70 7200 3450–9370 Å Yes [Co III]ASASSN-17cz 2017-05-28 87 0.017 38 2700 3440–9330 Å NoSN 2017hjw 2018-03-14 135 0.016 16 2700 3440–9340 Å NoASASSN-17pg 2018-03-14 106 0.005 62 1800 3480–9440 Å No
Notes. The wavelength coverage is reported for the rest frame of each spectrum.aMODS2 spectra.bThe red channel spectrum had too low an S/N to effectively extract from the observations.
Figure 1. The new LBT late-time SNe Ia spectra we present in this paper. Phases relative to maximum V-band brightness are indicated in parentheses next toeach spectrum. The coloured tick marks on the vertical axes indicate the offset used when plotting each spectrum, and all spectra are normalized to the peakof the [Fe III] λ4701 emission feature. This feature is prominent in all of the spectra, as are numerous other signatures of 56Ni decay products. We restrict ouranalysis to spectra with S/N > 10 and coverage of at least two of the pertinent Fe/Co features. These spectra are available in machine-readable format in theonline version of the paper.
MNRAS 492, 3553–3565 (2020)
Dow
nloaded from https://academ
ic.oup.com/m
nras/article-abstract/492/3/3553/5700293 by Serials Division user on 23 June 2020
Bimodality in nebular phase SNe Ia 3557
Table 2. Spectroscopic properties.
SN z Type Phase (d) Bimodal Fe/Co Reference(s)
SN 2012cg 0.00146 Ia-Norm 284 No Shappee et al. (2018)SN 2014bv 0.00559 Ia-Norm 292 Yes This workSN 2014J 0.00068 Ia-Norm 292,353 No This workSN 2015I 0.00759 Ia-Norm 269 No This workSN 2016coj 0.00448 Ia-Norm 162 No This workSN 2016fnr 0.01437 Ia-Norm 164 No This workSN 2016gxp 0.01785 Ia-91T 213 No This workSN 2016iuh 0.01370 Ia-91bg 164 Yes [Co III] This workSN 2017hjw 0.01616 Ia-Norm 135 No This workASASSN-15uh 0.01350 Ia-91T 165 No This workASASSN-16lx 0.01860 Ia-Norm 134 No This workASASSN-17cz 0.01738 Ia-Norm 87 No This workASASSN-17pg 0.00562 Ia-Norm 106 No This workASASSN-14jg 0.01483 Ia-Norm 216 No Tucker et al. (2019)SN 1981B 0.00603 Ia-Norm 113,267 No Branch et al. (1983), Richardson et al. (2001)SN 1986G 0.00180 Ia-91bg 256 Yes Ruiz-Lapuente & Lucy (1992)SN 1989B 0.00243 Ia-Norm 150 No Wells et al. (1994)SN 1990N 0.00340 Ia-Norm 184,225,253,278 No Gomez & Lopez (1998)SN 1991T 0.00579 Ia-91T 1831, 2552, 2812, 3132, 3171 No 1Silverman et al. (2012); 2Gomez & Lopez (1998)SN 1998aq 0.00370 Ia-Norm 230,240 No Blondin et al. (2012)SN 1998bu 0.00299 Ia-Norm 1901, 2081, 2171, 2362, 2431, No 1Blondin et al. (2012); 2Silverman et al. (2012);
2802, 3293 3Cappellaro et al. (2001)SN 1999aa 0.01444 Ia-91T 256 No Silverman et al. (2012)SN 1999by 0.00213 Ia-91bg 181 No Silverman et al. (2012)SN 2000cx 0.00793 Ia-Pec 181 No Blondin et al. (2012)SN 2002dj 0.00939 Ia-Norm 218,271 No Pignata et al. (2008)SN 2002er 0.00857 Ia-Norm 214 Yes [Co III] Kotak et al. (2005)SN 2003du 0.00638 Ia-Norm 219 No Stanishev et al. (2007)SN 2003gs 0.00477 Ia-Pec 197 Yes Silverman et al. (2012)SN 2003hv 0.00560 Ia-Norm 319 Yes Leloudas et al. (2009)SN 2004bv 0.01061 Ia-Norm 159 No Silverman et al. (2012)SN 2004eo 0.01570 Ia-Norm 226 No Pastorello et al. (2007a)SN 2005am 0.00790 Ia-Norm 297,380 Yes Leonard (2007)SN 2005cf 0.00646 Ia-Norm 264 No Leonard (2007)SN 2007af 0.00546 Ia-Norm 301 No Blondin et al. (2012)SN 2007le 0.00672 Ia-Norm 304 No Silverman et al. (2012)SN 2007on 0.00649 Ia-Norm 284 Yes Folatelli et al. (2013)SN 2008A 0.01646 Ia-02cx 201,225 No McCully et al. (2014)SN 2008Q 0.00794 Ia-Norm 201 No Silverman et al. (2012)SN 2011by 0.00284 Ia-Norm 204,308 No Silverman, Ganeshalingam & Filippenko (2013)SN 2011fe 0.00080 Ia-Norm 2051, 2261, 2292, 2591, 3471 No 1Mazzali et al. (2015); 2Shappee et al. (2013)SN 2011iv 0.00649 Ia-Norm 244,261 Yes Gall et al. (2018)SN 2012fr 0.00540 Ia-Norm 220,259,338,365 No Childress et al. (2015)SN 2012hr 0.00756 Ia-Norm 281 No Childress et al. (2015)SN 2013aa 0.00400 Ia-Norm 188,205,345 No Childress et al. (2015)SN 2013dy 0.00389 Ia-Norm 332 No Pan et al. (2015)SN 2013gy 0.01402 Ia-Norm 271 No Childress et al. (2015)SN 2015F 0.00489 Ia-Norm 194,293 No Tucker et al. (2019)SN 2017cbv 0.00400 Ia-Norm 315 No Tucker et al. (2019)
Note. That phases are calculated in the observed frame relative to maximum V-band brightness.
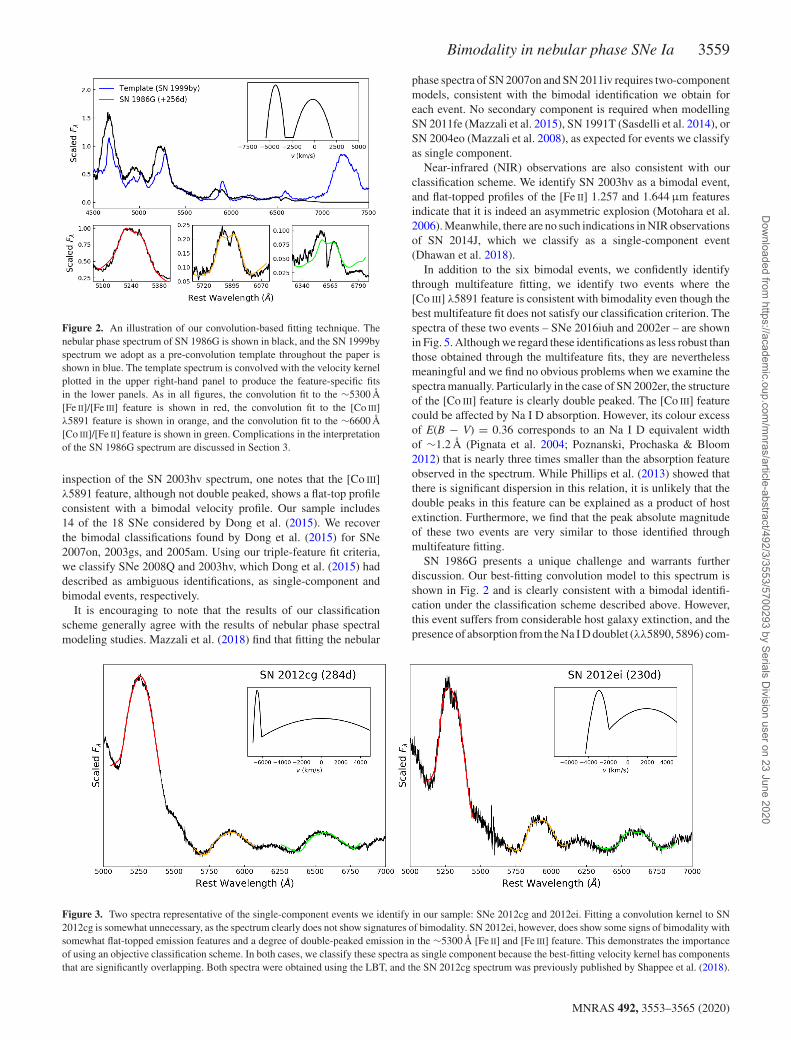
We limit our analysis to three features we can confidentlyassociate with 56Ni decay products: the [Fe II] and [Fe III] feature at∼5300 Å, the [Co III] λ5891 feature, and the [Co III] and [Fe II]feature at ∼6600 Å. The [Co III] λ5891 feature is particularlyvaluable due to its lack of multiline blending. We obtain fits foreach spectrum by varying the velocity kernel parameters (vshift,σ mod, 1, σ mod, 2, vsep, and r) to minimize χ2 for two cases – one fitusing only the [Co III] λ5891 feature, and one fit using all three ofthe pertinent 56Ni decay features. The fit parameters of the spectrawe show in Figs 2–5 are provided in Table 4. In all figures, theconvolution fit to the ∼5300 Å [Fe II]/[Fe III] feature is shown in
red, the convolution fit to the [Co III] λ5891 feature is shown inorange, and the convolution fit to the ∼6600 Å [Co III]/[Fe II] featureis shown in green.
We classify the spectral fits as being consistent with a bimodalvelocity profile if the two quadratic components of the velocitykernel do not significantly overlap – that is, vsep � σ mod,1 + σ mod,2.Two spectra representative of the single-component events which donot satisfy this criteria are shown in Fig. 3. While there are benefitsto using only the [Co III] feature – namely that it is not subject toblending concerns – we regard identifications made using all threefeatures as more robust. These identifications are shown in Fig.
MNRAS 492, 3553–3565 (2020)
Dow
nloaded from https://academ
ic.oup.com/m
nras/article-abstract/492/3/3553/5700293 by Serials Division user on 23 June 2020
3558 P. J. Vallely et al.
Table 3. Peak V-band brightness.
SN mV Dist. mod. (μ) Extinction (AV) MV Reference(s)
SN 2012cg 11.901 31.022 0.057 − 19.18 1Vinko et al. (2018); 2Munari et al. (2013)SN 2014bva 13.921 32.172 0.106 − 18.36 1Brown et al. (2014); 2Tully et al. (2013)SN 2014J 10.561 27.642 0.435 + 1.76b − 19.28 1Tsvetkov et al. (2014);
2Dalcanton et al. (2009); 2Marion et al. (2015)SN 2015Ia 13.991 32.642 0.182 − 18.83 1Brown et al. (2014); 2Tully et al. (2013)SN 2016coj 13.021 31.902 0.052 − 18.93 1Kochanek et al. (2017); 2Blakeslee et al. (2001)SN 2016fnr 15.281 33.98 0.128 − 18.83 1Kochanek et al. (2017)SN 2016gxp 14.841 34.55 0.338 − 20.05 1Chen & Dong (in preparation)SN 2016iuh 15.431 33.88 0.045 − 18.49 1Kochanek et al. (2017)SN 2017hjw 15.851 34.24 0.370 − 18.76 1Chen & Dong (in preparation)ASASSN-15uh 15.281 33.85 0.410 − 18.98 1Kochanek et al. (2017)ASASSN-16lx 15.471 34.55 0.115 − 19.20 1Kochanek et al. (2017)ASASSN-17cz 16.601 34.33 1.138 − 18.86 1Chen & Dong (in preparation)ASASSN-17pg 14.461 32.512 0.145 − 18.19 1Kochanek et al. (2017); 2Tully, Courtois & Sorce (2016)ASASSN-14jg 14.921 34.05 0.042 − 19.17 1Kochanek et al. (2017)SN 1981B 11.851 30.832 0.050 − 19.03 1Barbon, Ciatti & Rosino (1982); 2Tully et al. (2013)SN 1986G 11.441 27.822 1.95c − 18.33 1Phillips et al. (1987); 2Tully et al. (2013)SN 1989B 11.991 29.782 0.091 − 17.88 1Wells et al. (1994); 2Tully et al. (2013)SN 1990N 12.731 31.722 0.071 − 19.06 1Lira et al. (1998); 2Tully et al. (2013)SN 1991T 11.511 30.912 0.060 − 20.00 1Lira et al. (1998); 2Parodi et al. (2000)SN 1998aq 12.461 31.672 0.039 − 19.25 1Riess et al. (2005); 2Tully et al. (2013)SN 1998bu 11.861 30.112 0.069 − 18.32 1Jha et al. (1999); 2Tully et al. (2013)SN 1999aa 14.901 34.101 0.109 − 19.31 1Kowalski et al. (2008)SN 1999by 13.141 30.822 0.054 − 17.73 1Garnavich et al. (2004); 2Tully et al. (2013)SN 2000cx 13.231 32.402 0.224 − 19.39 1Li et al. (2001); 2Takanashi, Doi & Yasuda (2008)SN 2002dj 14.131 32.652 0.261 − 18.78 1Hicken et al. (2009); 2Tully et al. (2013)SN 2002er 14.591 32.512 1.12d − 19.04 1Pignata et al. (2004); 2Tully et al. (2013)SN 2003du 13.571 32.832 0.027 − 19.29 1Hicken et al. (2009); 2Tully et al. (2013)SN 2003gs 13.491 31.492 0.097 − 18.10 1Krisciunas et al. (2009); 2Blakeslee et al. (2001)SN 2003hv 12.551 31.552 0.042 − 19.04 1Leloudas et al. (2009); 2Tully et al. (2013)SN 2004bv 14.021 32.802 0.174 − 18.95 1Ganeshalingam et al. (2010); 2Tully et al. (2013)SN 2004eo 15.331 34.121 0.296 − 19.09 1Pastorello et al. (2007a)SN 2005am 13.761 32.242 0.147 − 18.63 1Ganeshalingam et al. (2010); 2Tully et al. (2013)SN 2005cf 13.501 32.322 0.267 − 19.09 1Pastorello et al. (2007b)SN 2007af 13.211 31.762 0.107 − 18.66 1Hicken et al. (2009); 2Tully et al. (2013)SN 2007le 13.661 31.732 0.092 − 18.16 1Hicken et al. (2012); 2Springob et al. (2009)SN 2007on 12.961 31.452 0.032 − 18.52 1Contreras et al. (2010); 2Tully et al. (2013)SN 2008A 16.091 34.05 0.149 − 18.11 1Ganeshalingam et al. (2010)SN 2008Q 13.751 32.30 0.227 − 18.78 1Ganeshalingam et al. (2010)SN 2011bya 12.921 32.012 0.038 − 19.13 1Brown et al. (2014); 2Maguire et al. (2012)SN 2011fe 9.971 29.052 0.024 − 19.10 1Munari et al. (2013); 2Vinko et al. (2012)SN 2011iv 12.381 31.452 0.031 − 19.10 1Gall et al. (2018); 2Tully et al. (2013)SN 2012fr 11.981 31.252 0.056 − 19.33 1Contreras et al. (2018); 2Tully et al. (2013)SN 2012hra 13.751 33.032 0.124 − 19.40 1Brown et al. (2014); 2Tully et al. (2013)SN 2013aaa 11.621 30.552 0.466 − 19.40 1Brown et al. (2014); 2Bottinelli et al. (1985)SN 2013dy 12.941 30.682 0.421 − 18.16 1Zhai et al. (2016); 2Tully et al. (2009)SN 2013gy 14.771 33.75 0.158 − 19.14 1Graham et al. (2017)SN 2015F 13.271 31.642 0.556 − 18.93 1Graham et al. (2017); 2Cartier et al. (2017)SN 2017cbv 11.641 30.132 0.463 − 18.95 1Chen & Dong (in preparation); 2Bottinelli et al. (1985)
Notes. The foreground Galactic extinction AV values are taken from Schlafly & Finkbeiner (2011).aJohnson V observations were not obtained, so Swift UVOT V observations are substituted.bSN 2014J exhibits considerable host galaxy extinction, so we adopt the AV = 1.76 host galaxy extinction value from Tsvetkov et al. (2014).cSN 1986G exhibits considerable host galaxy extinction, so we adopt E(B − V) = 0.63 from di Serego-Alighieri & Ponz (1987) and assume RV = 3.1 toobtain AV = 1.95.dSN 2002er exhibits considerable host galaxy extinction, so we adopt E(B − V) = 0.36 from Pignata et al. (2004) and assume RV = 3.1 to obtain AV =1.12.
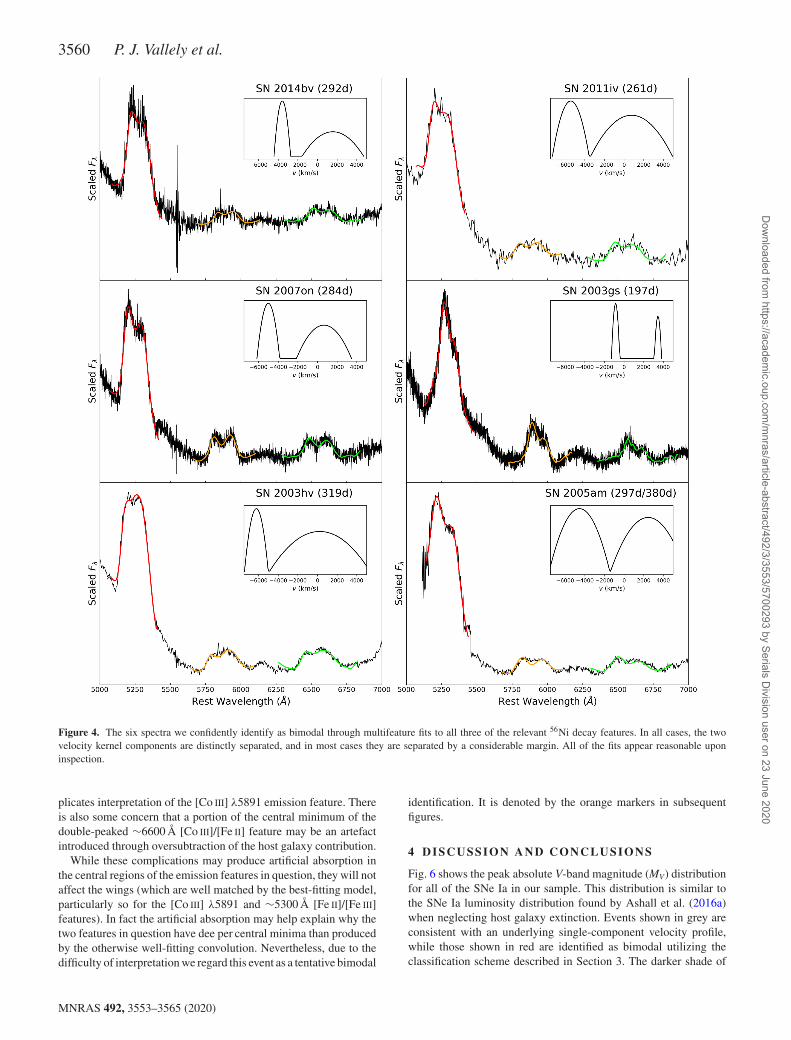
4. It is very unlikely that a single-component velocity distributioncan produce similarly spaced double-peaked profiles for the threewell-separated features. For robust identification using the triple-feature fit, we strictly require vsep > σ mod,1 + σ mod,2, while for themore tentative [Co III] feature identifications we allow for a smalloverlap of 500 km s−1 provided that the two kernel components are
still largely distinct from one another and satisfy σ mod,1 < vsep andσ mod,2 < vsep (see Fig. 5).
In nearly all cases where the three-feature fit produces a bimodalclassification, the single [Co III] feature fit does so as well. Of the sixevents classified as bimodal using the multifeature fit, only in thecase of SN 2003hv does the single [Co III] feature fit disagree. Upon
MNRAS 492, 3553–3565 (2020)
Dow
nloaded from https://academ
ic.oup.com/m
nras/article-abstract/492/3/3553/5700293 by Serials Division user on 23 June 2020
Bimodality in nebular phase SNe Ia 3559
Figure 2. An illustration of our convolution-based fitting technique. Thenebular phase spectrum of SN 1986G is shown in black, and the SN 1999byspectrum we adopt as a pre-convolution template throughout the paper isshown in blue. The template spectrum is convolved with the velocity kernelplotted in the upper right-hand panel to produce the feature-specific fitsin the lower panels. As in all figures, the convolution fit to the ∼5300 Å[Fe II]/[Fe III] feature is shown in red, the convolution fit to the [Co III]λ5891 feature is shown in orange, and the convolution fit to the ∼6600 Å[Co III]/[Fe II] feature is shown in green. Complications in the interpretationof the SN 1986G spectrum are discussed in Section 3.
inspection of the SN 2003hv spectrum, one notes that the [Co III]λ5891 feature, although not double peaked, shows a flat-top profileconsistent with a bimodal velocity profile. Our sample includes14 of the 18 SNe considered by Dong et al. (2015). We recoverthe bimodal classifications found by Dong et al. (2015) for SNe2007on, 2003gs, and 2005am. Using our triple-feature fit criteria,we classify SNe 2008Q and 2003hv, which Dong et al. (2015) haddescribed as ambiguous identifications, as single-component andbimodal events, respectively.
It is encouraging to note that the results of our classificationscheme generally agree with the results of nebular phase spectralmodeling studies. Mazzali et al. (2018) find that fitting the nebular
phase spectra of SN 2007on and SN 2011iv requires two-componentmodels, consistent with the bimodal identification we obtain foreach event. No secondary component is required when modellingSN 2011fe (Mazzali et al. 2015), SN 1991T (Sasdelli et al. 2014), orSN 2004eo (Mazzali et al. 2008), as expected for events we classifyas single component.
Near-infrared (NIR) observations are also consistent with ourclassification scheme. We identify SN 2003hv as a bimodal event,and flat-topped profiles of the [Fe II] 1.257 and 1.644μm featuresindicate that it is indeed an asymmetric explosion (Motohara et al.2006). Meanwhile, there are no such indications in NIR observationsof SN 2014J, which we classify as a single-component event(Dhawan et al. 2018).
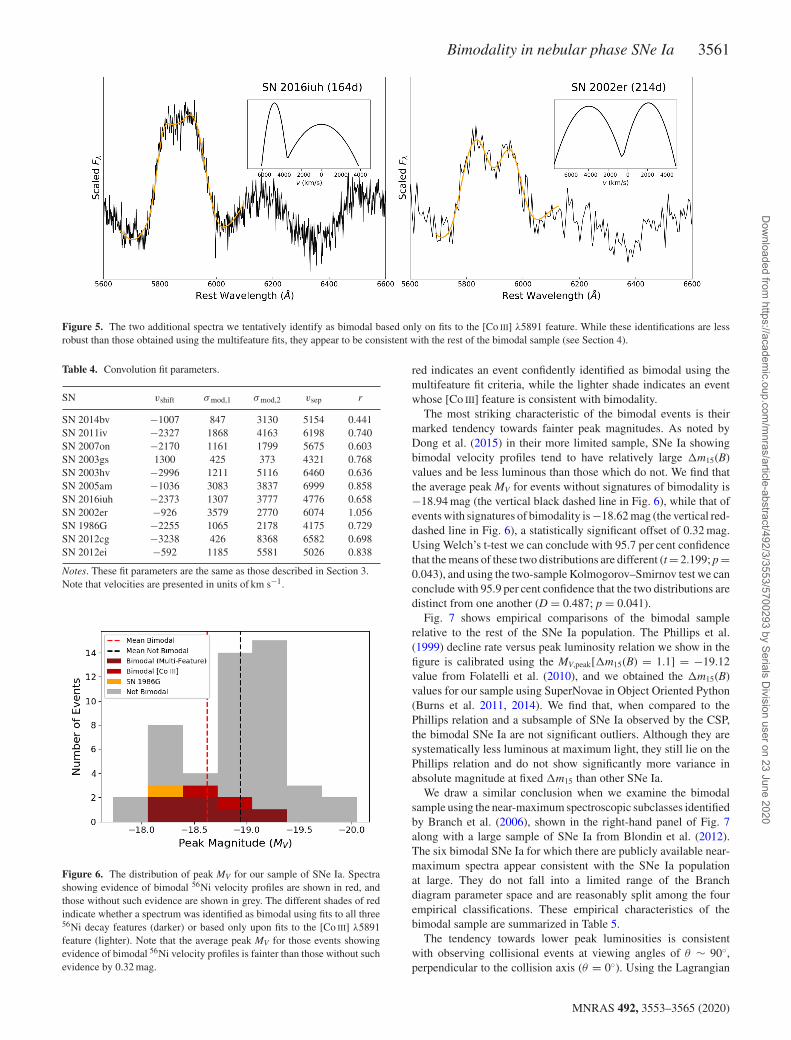
In addition to the six bimodal events, we confidently identifythrough multifeature fitting, we identify two events where the[Co III] λ5891 feature is consistent with bimodality even though thebest multifeature fit does not satisfy our classification criterion. Thespectra of these two events – SNe 2016iuh and 2002er – are shownin Fig. 5. Although we regard these identifications as less robust thanthose obtained through the multifeature fits, they are neverthelessmeaningful and we find no obvious problems when we examine thespectra manually. Particularly in the case of SN 2002er, the structureof the [Co III] feature is clearly double peaked. The [Co III] featurecould be affected by Na I D absorption. However, its colour excessof E(B − V) = 0.36 corresponds to an Na I D equivalent widthof ∼1.2 Å (Pignata et al. 2004; Poznanski, Prochaska & Bloom2012) that is nearly three times smaller than the absorption featureobserved in the spectrum. While Phillips et al. (2013) showed thatthere is significant dispersion in this relation, it is unlikely that thedouble peaks in this feature can be explained as a product of hostextinction. Furthermore, we find that the peak absolute magnitudeof these two events are very similar to those identified throughmultifeature fitting.
SN 1986G presents a unique challenge and warrants furtherdiscussion. Our best-fitting convolution model to this spectrum isshown in Fig. 2 and is clearly consistent with a bimodal identifi-cation under the classification scheme described above. However,this event suffers from considerable host galaxy extinction, and thepresence of absorption from the Na I D doublet (λλ5890, 5896) com-
Figure 3. Two spectra representative of the single-component events we identify in our sample: SNe 2012cg and 2012ei. Fitting a convolution kernel to SN2012cg is somewhat unnecessary, as the spectrum clearly does not show signatures of bimodality. SN 2012ei, however, does show some signs of bimodality withsomewhat flat-topped emission features and a degree of double-peaked emission in the ∼5300 Å [Fe II] and [Fe III] feature. This demonstrates the importanceof using an objective classification scheme. In both cases, we classify these spectra as single component because the best-fitting velocity kernel has componentsthat are significantly overlapping. Both spectra were obtained using the LBT, and the SN 2012cg spectrum was previously published by Shappee et al. (2018).
MNRAS 492, 3553–3565 (2020)
Dow
nloaded from https://academ
ic.oup.com/m
nras/article-abstract/492/3/3553/5700293 by Serials Division user on 23 June 2020
3560 P. J. Vallely et al.
Figure 4. The six spectra we confidently identify as bimodal through multifeature fits to all three of the relevant 56Ni decay features. In all cases, the twovelocity kernel components are distinctly separated, and in most cases they are separated by a considerable margin. All of the fits appear reasonable uponinspection.
plicates interpretation of the [Co III] λ5891 emission feature. Thereis also some concern that a portion of the central minimum of thedouble-peaked ∼6600 Å [Co III]/[Fe II] feature may be an artefactintroduced through oversubtraction of the host galaxy contribution.
While these complications may produce artificial absorption inthe central regions of the emission features in question, they will notaffect the wings (which are well matched by the best-fitting model,particularly so for the [Co III] λ5891 and ∼5300 Å [Fe II]/[Fe III]features). In fact the artificial absorption may help explain why thetwo features in question have dee per central minima than producedby the otherwise well-fitting convolution. Nevertheless, due to thedifficulty of interpretation we regard this event as a tentative bimodal
identification. It is denoted by the orange markers in subsequentfigures.
4 DISCUSSION AND CONCLUSIONS
Fig. 6 shows the peak absolute V-band magnitude (MV) distributionfor all of the SNe Ia in our sample. This distribution is similar tothe SNe Ia luminosity distribution found by Ashall et al. (2016a)when neglecting host galaxy extinction. Events shown in grey areconsistent with an underlying single-component velocity profile,while those shown in red are identified as bimodal utilizing theclassification scheme described in Section 3. The darker shade of
MNRAS 492, 3553–3565 (2020)
Dow
nloaded from https://academ
ic.oup.com/m
nras/article-abstract/492/3/3553/5700293 by Serials Division user on 23 June 2020
Bimodality in nebular phase SNe Ia 3561
Figure 5. The two additional spectra we tentatively identify as bimodal based only on fits to the [Co III] λ5891 feature. While these identifications are lessrobust than those obtained using the multifeature fits, they appear to be consistent with the rest of the bimodal sample (see Section 4).
Table 4. Convolution fit parameters.
SN vshift σmod,1 σmod,2 vsep r
SN 2014bv −1007 847 3130 5154 0.441SN 2011iv −2327 1868 4163 6198 0.740SN 2007on −2170 1161 1799 5675 0.603SN 2003gs 1300 425 373 4321 0.768SN 2003hv −2996 1211 5116 6460 0.636SN 2005am −1036 3083 3837 6999 0.858SN 2016iuh −2373 1307 3777 4776 0.658SN 2002er −926 3579 2770 6074 1.056SN 1986G −2255 1065 2178 4175 0.729SN 2012cg −3238 426 8368 6582 0.698SN 2012ei −592 1185 5581 5026 0.838
Notes. These fit parameters are the same as those described in Section 3.Note that velocities are presented in units of km s−1.
Figure 6. The distribution of peak MV for our sample of SNe Ia. Spectrashowing evidence of bimodal 56Ni velocity profiles are shown in red, andthose without such evidence are shown in grey. The different shades of redindicate whether a spectrum was identified as bimodal using fits to all three56Ni decay features (darker) or based only upon fits to the [Co III] λ5891feature (lighter). Note that the average peak MV for those events showingevidence of bimodal 56Ni velocity profiles is fainter than those without suchevidence by 0.32 mag.
red indicates an event confidently identified as bimodal using themultifeature fit criteria, while the lighter shade indicates an eventwhose [Co III] feature is consistent with bimodality.
The most striking characteristic of the bimodal events is theirmarked tendency towards fainter peak magnitudes. As noted byDong et al. (2015) in their more limited sample, SNe Ia showingbimodal velocity profiles tend to have relatively large �m15(B)values and be less luminous than those which do not. We find thatthe average peak MV for events without signatures of bimodality is−18.94 mag (the vertical black dashed line in Fig. 6), while that ofevents with signatures of bimodality is −18.62 mag (the vertical red-dashed line in Fig. 6), a statistically significant offset of 0.32 mag.Using Welch’s t-test we can conclude with 95.7 per cent confidencethat the means of these two distributions are different (t= 2.199; p=0.043), and using the two-sample Kolmogorov–Smirnov test we canconclude with 95.9 per cent confidence that the two distributions aredistinct from one another (D = 0.487; p = 0.041).
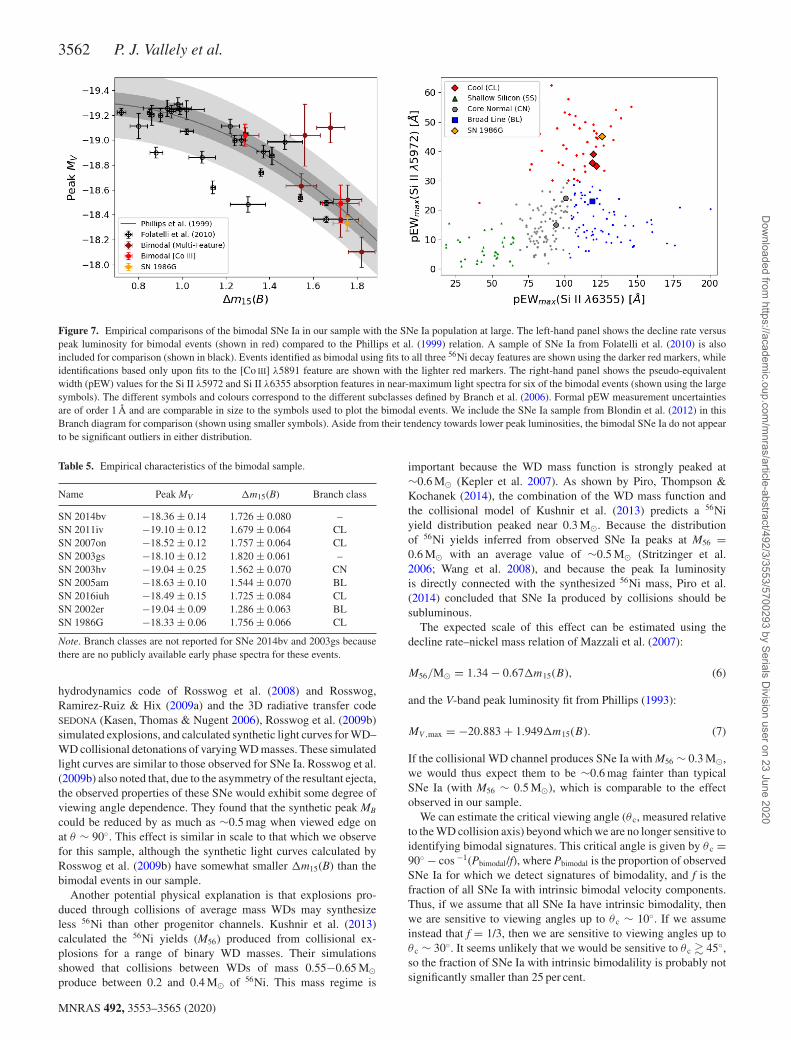
Fig. 7 shows empirical comparisons of the bimodal samplerelative to the rest of the SNe Ia population. The Phillips et al.(1999) decline rate versus peak luminosity relation we show in thefigure is calibrated using the MV,peak[�m15(B) = 1.1] = −19.12value from Folatelli et al. (2010), and we obtained the �m15(B)values for our sample using SuperNovae in Object Oriented Python(Burns et al. 2011, 2014). We find that, when compared to thePhillips relation and a subsample of SNe Ia observed by the CSP,the bimodal SNe Ia are not significant outliers. Although they aresystematically less luminous at maximum light, they still lie on thePhillips relation and do not show significantly more variance inabsolute magnitude at fixed �m15 than other SNe Ia.
We draw a similar conclusion when we examine the bimodalsample using the near-maximum spectroscopic subclasses identifiedby Branch et al. (2006), shown in the right-hand panel of Fig. 7along with a large sample of SNe Ia from Blondin et al. (2012).The six bimodal SNe Ia for which there are publicly available near-maximum spectra appear consistent with the SNe Ia populationat large. They do not fall into a limited range of the Branchdiagram parameter space and are reasonably split among the fourempirical classifications. These empirical characteristics of thebimodal sample are summarized in Table 5.
The tendency towards lower peak luminosities is consistentwith observing collisional events at viewing angles of θ ∼ 90◦,perpendicular to the collision axis (θ = 0◦). Using the Lagrangian
MNRAS 492, 3553–3565 (2020)
Dow
nloaded from https://academ
ic.oup.com/m
nras/article-abstract/492/3/3553/5700293 by Serials Division user on 23 June 2020
3562 P. J. Vallely et al.
Figure 7. Empirical comparisons of the bimodal SNe Ia in our sample with the SNe Ia population at large. The left-hand panel shows the decline rate versuspeak luminosity for bimodal events (shown in red) compared to the Phillips et al. (1999) relation. A sample of SNe Ia from Folatelli et al. (2010) is alsoincluded for comparison (shown in black). Events identified as bimodal using fits to all three 56Ni decay features are shown using the darker red markers, whileidentifications based only upon fits to the [Co III] λ5891 feature are shown with the lighter red markers. The right-hand panel shows the pseudo-equivalentwidth (pEW) values for the Si II λ5972 and Si II λ6355 absorption features in near-maximum light spectra for six of the bimodal events (shown using the largesymbols). The different symbols and colours correspond to the different subclasses defined by Branch et al. (2006). Formal pEW measurement uncertaintiesare of order 1 Å and are comparable in size to the symbols used to plot the bimodal events. We include the SNe Ia sample from Blondin et al. (2012) in thisBranch diagram for comparison (shown using smaller symbols). Aside from their tendency towards lower peak luminosities, the bimodal SNe Ia do not appearto be significant outliers in either distribution.
Table 5. Empirical characteristics of the bimodal sample.
Name Peak MV �m15(B) Branch class
SN 2014bv −18.36 ± 0.14 1.726 ± 0.080 –SN 2011iv −19.10 ± 0.12 1.679 ± 0.064 CLSN 2007on −18.52 ± 0.12 1.757 ± 0.064 CLSN 2003gs −18.10 ± 0.12 1.820 ± 0.061 –SN 2003hv −19.04 ± 0.25 1.562 ± 0.070 CNSN 2005am −18.63 ± 0.10 1.544 ± 0.070 BLSN 2016iuh −18.49 ± 0.15 1.725 ± 0.084 CLSN 2002er −19.04 ± 0.09 1.286 ± 0.063 BLSN 1986G −18.33 ± 0.06 1.756 ± 0.066 CL
Note. Branch classes are not reported for SNe 2014bv and 2003gs becausethere are no publicly available early phase spectra for these events.
hydrodynamics code of Rosswog et al. (2008) and Rosswog,Ramirez-Ruiz & Hix (2009a) and the 3D radiative transfer codeSEDONA (Kasen, Thomas & Nugent 2006), Rosswog et al. (2009b)simulated explosions, and calculated synthetic light curves for WD–WD collisional detonations of varying WD masses. These simulatedlight curves are similar to those observed for SNe Ia. Rosswog et al.(2009b) also noted that, due to the asymmetry of the resultant ejecta,the observed properties of these SNe would exhibit some degree ofviewing angle dependence. They found that the synthetic peak MB
could be reduced by as much as ∼0.5 mag when viewed edge onat θ ∼ 90◦. This effect is similar in scale to that which we observefor this sample, although the synthetic light curves calculated byRosswog et al. (2009b) have somewhat smaller �m15(B) than thebimodal events in our sample.
Another potential physical explanation is that explosions pro-duced through collisions of average mass WDs may synthesizeless 56Ni than other progenitor channels. Kushnir et al. (2013)calculated the 56Ni yields (M56) produced from collisional ex-plosions for a range of binary WD masses. Their simulationsshowed that collisions between WDs of mass 0.55−0.65 M�produce between 0.2 and 0.4 M� of 56Ni. This mass regime is
important because the WD mass function is strongly peaked at∼0.6 M� (Kepler et al. 2007). As shown by Piro, Thompson &Kochanek (2014), the combination of the WD mass function andthe collisional model of Kushnir et al. (2013) predicts a 56Niyield distribution peaked near 0.3 M�. Because the distributionof 56Ni yields inferred from observed SNe Ia peaks at M56 =0.6 M� with an average value of ∼0.5 M� (Stritzinger et al.2006; Wang et al. 2008), and because the peak Ia luminosityis directly connected with the synthesized 56Ni mass, Piro et al.(2014) concluded that SNe Ia produced by collisions should besubluminous.
The expected scale of this effect can be estimated using thedecline rate–nickel mass relation of Mazzali et al. (2007):
M56/M� = 1.34 − 0.67�m15(B), (6)
and the V-band peak luminosity fit from Phillips (1993):
MV ,max = −20.883 + 1.949�m15(B). (7)
If the collisional WD channel produces SNe Ia with M56 ∼ 0.3 M�,we would thus expect them to be ∼0.6 mag fainter than typicalSNe Ia (with M56 ∼ 0.5 M�), which is comparable to the effectobserved in our sample.
We can estimate the critical viewing angle (θ c, measured relativeto the WD collision axis) beyond which we are no longer sensitive toidentifying bimodal signatures. This critical angle is given by θ c =90◦ − cos −1(Pbimodal/f), where Pbimodal is the proportion of observedSNe Ia for which we detect signatures of bimodality, and f is thefraction of all SNe Ia with intrinsic bimodal velocity components.Thus, if we assume that all SNe Ia have intrinsic bimodality, thenwe are sensitive to viewing angles up to θ c ∼ 10◦. If we assumeinstead that f = 1/3, then we are sensitive to viewing angles up toθ c ∼ 30◦. It seems unlikely that we would be sensitive to θ c � 45◦,so the fraction of SNe Ia with intrinsic bimodalility is probably notsignificantly smaller than 25 per cent.
MNRAS 492, 3553–3565 (2020)
Dow
nloaded from https://academ
ic.oup.com/m
nras/article-abstract/492/3/3553/5700293 by Serials Division user on 23 June 2020
Bimodality in nebular phase SNe Ia 3563
A third potential explanation is that the method we use inthis paper may simply be biased towards detecting bimodalityin fainter SNe Ia. Abundance tomography studies indicate that56Ni is distributed out to considerably higher velocities in normalSNe Ia when compared to subluminous events. In the normal SN Ia2011fe, 56Ni is inferred to extend to velocities beyond 10 000 kms−1 (Mazzali et al. 2015), for example, while in the subluminousSN Ia 1986G it is inferred to extend only to about 6000 km s−1
(Ashall et al. 2016b). In order to observe signatures of bimodality,the two WDs need to collide with a velocity comparable to that ofthe 56Ni region, so slower moving 56Ni distributions would be morereadily detectable.
However, this potential bias seems unlikely to be a significanteffect. If this were a dominant effect one would expect to findnumerous events with slightly overlapping velocity componentsthat satisfy our single [Co III] feature fit criteria, and one wouldexpect those events to be considerably brighter than the rest ofthe bimodal sample. We observe neither of those outcomes. It isimportant to note that abundance tomography studies generallyassume a single-component model. When analyzing a spectrumthat is comprised of two components, such an assumption wouldinfer 56Ni distributions extending to artificially high velocities. Thiscan be seen clearly in the case of SN 2007on. When using asingle-component model, 56Ni in the ejecta is inferred to extend tovelocities beyond 12 500 km s−1 (Ashall et al. 2018). The presenceof 56Ni at such high velocities would smear out any signature ofbimodality, and yet we can clearly identify SN 2007on as a bimodalevent (See Fig. 4). Detailed modeling by Mazzali et al. (2018)further confirms that the event is better reproduced using a modelwith two narrow velocity components instead of a single broadcomponent.
It is now established that a non-negligible fraction of SNe Iaspectra exhibit features consistent with a bimodal 56Ni velocitydistribution. Dong et al. (2015) found that 3 of the 18 spectra theyexamined showed compelling evidence of bimodality. Here, wemore than double the sample and find that 8 of 47 spectra showevidence of bimodality. The collisional WD scenario provides apossible explanation for these observed spectral properties, and thetendency towards fainter peak luminosities that we report here isalso consistent with this theoretical picture. Further improvementswill require larger statistical samples and more attention to possibleselection effects as the statistical uncertainties on the bimodalfraction become smaller. Nevertheless, we can confidently assertthat bimodal events are not rare, and any proposed combination ofSNe Ia explosion scenarios must be able to produce a non-negligiblefraction of them.
ACKNOWLEDGEMENTS
We thank the referee for helpful comments. All of the previouslyunpublished spectra presented in this paper were obtained withthe MODS spectrographs built with funding from NSF grant AST-9987045 and the NSF Telescope System Instrumentation Program,with additional funds from the Ohio Board of Regents, and the OhioState University Office of Research. The LBT is an internationalcollaboration among institutions in the United States, Italy, andGermany. LBT Corporation partners are The Ohio State University,and The Research Corporation, on behalf of The University of NotreDame, University of Minnesota, and University of Virginia; TheUniversity of Arizona on behalf of the Arizona university system; Is-tituto Nazionale di Astrofisica, Italy; LBT Beteiligungsgesellschaft,
Germany, representing the Max-Planck Society, the AstrophysicalInstitute Potsdam, and Heidelberg University.
We thank Christa Gall for providing the data for SN 2011iv,and we are grateful to Todd Thompson for valuable comments. Wethank the Las Cumbres Observatory (LCOGT) and its staff for itscontinuing support of the ASAS–SN project. We thank Subo Dongand Ping Chen for providing us with reduced photometry fromLCOGT data for a number of events. ASAS–SN is supported by theGordon and Betty Moore Foundation through grant GBMF5490 tothe Ohio State University and NSF grant AST-1515927. Develop-ment of ASAS–SN has been supported by NSF grant AST-0908816,the Mt. Cuba Astronomical Foundation, the Center for Cosmologyand AstroParticle Physics at the Ohio State University, the ChineseAcademy of Sciences South America Center for Astronomy (CAS-SACA), the Villum Foundation, and George Skestos.
PJV is supported by the National Science Foundation GraduateResearch Fellowship Program under grant DGE-1343012. MATacknowledges support from the United States Department of Energythrough the Computational Sciences Graduate Fellowship (DOECSGF). KZS and CSK are supported by NSF grants AST-1515876,AST-1515927, and AST-1814440.
This research has used the NASA/IPAC Extragalactic Data base,which is operated by the Jet Propulsion Laboratory, California In-stitute of Technology, under contract with the National Aeronauticsand Space Administration. This research has used NASA’s Astro-physics Data System Bibliographic Services. IRAF is distributed bythe National Optical Astronomy Observatory, which is operated bythe Association of Universities for Research in Astronomy under acooperative agreement with the National Science Foundation.
REFERENCES
Antognini J. M., Shappee B. J., Thompson T. A., Amaro-Seoane P., 2014,MNRAS, 439, 1079
Ashall C., Mazzali P., Sasdelli M., Prentice S. J., 2016a, MNRAS, 460, 3529Ashall C., Mazzali P. A., Pian E., James P. A., 2016b, MNRAS, 463, 1891Ashall C. et al., 2018, MNRAS, 477, 153Barbon R., Ciatti F., Rosino L., 1982, A&A, 116, 35Bildsten L., Shen K. J., Weinberg N. N., Nelemans G., 2007, ApJ, 662, L95Blakeslee J. P., Lucey J. R., Barris B. J., Hudson M. J., Tonry J. L., 2001,
MNRAS, 327, 1004Blondin S. et al., 2012, AJ, 143, 126Bloom J. S. et al., 2012, ApJ, 744, L17Bottinelli L., Gouguenheim L., Paturel G., de Vaucouleurs G., 1985, A&AS,
59, 43Branch D., Wheeler J. C., 2017, Supernova Explosions: Astronomy and
Astrophysics Library. Springer-Verlag, GermanyBranch D., Lacy C. H., McCall M. L., Sutherland P. G., Uomoto A., Wheeler
J. C., Wills B. J., 1983, ApJ, 270, 123Branch D. et al., 2006, PASP, 118, 560Brimacombe J. et al., 2018, Astron. Telegram, 11976, 1Brown P. J. et al., 2012, ApJ, 753, 22Brown P. J., Breeveld A. A., Holland S., Kuin P., Pritchard T., 2014, Ap&SS,
354, 89Burns C. R. et al., 2011, AJ, 141, 19Burns C. R. et al., 2014, ApJ, 789, 32Cappellaro E. et al., 2001, ApJ, 549, L215Cartier R. et al., 2017, MNRAS, 464, 4476Childress M. J. et al., 2015, MNRAS, 454, 3816Chomiuk L. et al., 2012, ApJ, 750, 164Colgate S. A., McKee C., 1969, ApJ, 157, 623Contreras C. et al., 2010, AJ, 139, 519Contreras C. et al., 2018, ApJ, 859, 24Dalcanton J. J. et al., 2009, ApJS, 183, 67
MNRAS 492, 3553–3565 (2020)
Dow
nloaded from https://academ
ic.oup.com/m
nras/article-abstract/492/3/3553/5700293 by Serials Division user on 23 June 2020
3564 P. J. Vallely et al.
Dhawan S., Flors A., Leibundgut B., Maguire K., Kerzendorf W., Tauben-berger S., Van Kerkwijk M. H., Spyromilio J., 2018, A&A, 619,A102
di Serego-Alighieri S., Ponz J. D., 1987, in Danziger I. J., ed., EuropeanSouthern Observatory Conference and Workshop Proceedings, Vol. 26,European Southern Observatory Conference and Workshop Proceed-ings. European Southern Observatory, Garching bei Munchen, Germany,p. 545
Dong S., Katz B., Kushnir D., Prieto J. L., 2015, MNRAS, 454, L61Dong S. et al., 2018, MNRAS, 479, L70Fesen R. A., Hoflich P. A., Hamilton A. J. S., Hammell M. C., Gerardy C.
L., Khokhlov A. M., Wheeler J. C., 2007, ApJ, 658, 396Folatelli G. et al., 2010, AJ, 139, 120Folatelli G. et al., 2013, ApJ, 773, 53Foley R. J. et al., 2014, MNRAS, 443, 2887Galbany L. et al., 2016, MNRAS, 457, 525Gall C. et al., 2018, A&A, 611, A58Ganeshalingam M. et al., 2010, ApJS, 190, 418Garcıa-Senz D., Cabezon R. M., Arcones A., Relano A., Thielemann F. K.,
2013, MNRAS, 436, 3413Garnavich P. M. et al., 2004, ApJ, 613, 1120Gerardy C. L. et al., 2007, ApJ, 661, 995Gomez G., Lopez R., 1998, AJ, 115, 1096Goobar A. et al., 2014, ApJ, 784, L12Graham M. L. et al., 2017, MNRAS, 472, 3437Guillochon J., Parrent J., Kelley L. Z., Margutti R., 2017, ApJ, 835, 64Hachisu I., Kato M., Nomoto K., 2012, ApJ, 756, L4Hamers A. S., Pols O. R., Claeys J. S. W., Nelemans G., 2013, MNRAS,
430, 2262Han Z., Podsiadlowski P., 2004, MNRAS, 350, 1301Hawley W. P., Athanassiadou T., Timmes F. X., 2012, ApJ, 759, 39Hicken M. et al., 2009, ApJ, 700, 331Hicken M. et al., 2012, ApJS, 200, 12Hill J. M., Green R. F., Slagle J. H., 2006, in Stepp L. M., ed., Proc. SPIE
Conf. Ser. Vol. 6267, Ground-based and Airborne Telescopes. SPIE,Bellingham, p. 62670Y
Hillebrandt W., Kromer M., Ropke F. K., Ruiter A. J., 2013, Frontiers Phys.,8, 116
Hoflich P., Khokhlov A. M., Wheeler J. C., 1995, ApJ, 444, 831Hoflich P., Gerardy C. L., Fesen R. A., Sakai S., 2002, ApJ, 568, 791Hoflich P., Gerardy C., Linder E., Marion H., 2003, in Alloin D., Gieren
W., eds, Models for Type Ia Supernovae and Cosmology, Vol. 635.Springer-Verlag, Berlin, Heidelberg, p. 203
Holmbo S. et al., 2019, A&A, 627, A174Hoyle F., Fowler W. A., 1960, ApJ, 132, 565Iben I. Jr, Tutukov A. V., 1984, ApJS, 54, 335Jha S. et al., 1999, ApJS, 125, 73Kasen D., Thomas R. C., Nugent P., 2006, ApJ, 651, 366Katz B., Dong S., 2012, preprint (arXiv:1211.4584)Kepler S. O., Kleinman S. J., Nitta A., Koester D., Castanheira B. G.,
Giovannini O., Costa A. F. M., Althaus L., 2007, MNRAS, 375, 1315Khokhlov A. M., 1991, A&A, 245, 114Kochanek C. S. et al., 2017, PASP, 129, 104502Kollmeier J. A. et al., 2019, MNRAS, 486, 3041Kotak R. et al., 2005, A&A, 436, 1021Kowalski M. et al., 2008, ApJ, 686, 749Kozai Y., 1962, AJ, 67, 591Krisciunas K. et al., 2009, AJ, 138, 1584Kushnir D., Katz B., Dong S., Livne E., Fernandez R., 2013, ApJ, 778, L37Leloudas G. et al., 2009, A&A, 505, 265Leonard D. C., 2007, ApJ, 670, 1275Li W. et al., 2001, PASP, 113, 1178Lidov M. L., 1962, Planet. Space Sci., 9, 719Lira P. et al., 1998, AJ, 115, 234Livio M., Riess A. G., 2003, ApJ, 594, L93Livne E., 1999, ApJ, 527, L97Lundqvist P. et al., 2013, MNRAS, 435, 329Lundqvist P. et al., 2015, A&A, 577, A39
Maguire K. et al., 2012, MNRAS, 426, 2359Maguire K., Taubenberger S., Sullivan M., Mazzali P. A., 2016, MNRAS,
457, 3254Maoz D., Mannucci F., Nelemans G., 2014, ARA&A, 52, 107Margutti R., Parrent J., Kamble A., Soderberg A. M., Foley R. J., Milisavl-
jevic D., Drout M. R., Kirshner R., 2014, ApJ, 790, 52Marion G. H. et al., 2015, ApJ, 798, 39Mattila S., Lundqvist P., Sollerman J., Kozma C., Baron E., Fransson C.,
Leibundgut B., Nomoto K., 2005, A&A, 443, 649Mazzali P. A., Ropke F. K., Benetti S., Hillebrandt W., 2007, Science, 315,
825Mazzali P. A., Sauer D. N., Pastorello A., Benetti S., Hillebrandt W., 2008,
MNRAS, 386, 1897Mazzali P. A. et al., 2014, MNRAS, 439, 1959Mazzali P. A. et al., 2015, MNRAS, 450, 2631Mazzali P. A., Ashall C., Pian E., Stritzinger M. D., Gall C., Phillips M. M.,
Hoflich P., Hsiao E., 2018, MNRAS, 476, 2905McCully C. et al., 2014, ApJ, 786, 134Moll R., Raskin C., Kasen D., Woosley S. E., 2014, ApJ, 785, 105Motohara K. et al., 2006, ApJ, 652, L101Munari U., Henden A., Belligoli R., Castellani F., Cherini G., Righetti G.
L., Vagnozzi A., 2013, New Astron., 20, 30Nomoto K., 1982, ApJ, 253, 798Nomoto K., Iben I. Jr, 1985, ApJ, 297, 531Pan Y.-C. et al., 2015, MNRAS, 452, 4307Parodi B. R., Saha A., Sandage A., Tammann G. A., 2000, ApJ, 540, 634Pastorello A. et al., 2007a, MNRAS, 377, 1531Pastorello A. et al., 2007b, MNRAS, 376, 1301Perlmutter S. et al., 1999, ApJ, 517, 565Phillips M. M., 1993, ApJ, 413, L105Phillips M. M. et al., 1987, PASP, 99, 592Phillips M. M., Lira P., Suntzeff N. B., Schommer R. A., Hamuy M., Maza
J., 1999, AJ, 118, 1766Phillips M. M. et al., 2013, ApJ, 779, 38Piersanti L., Gagliardi S., Iben, Icko J., Tornambe A., 2003, ApJ, 598, 1229Pignata G. et al., 2004, MNRAS, 355, 178Pignata G. et al., 2008, MNRAS, 388, 971Piro A. L., Thompson T. A., Kochanek C. S., 2014, MNRAS, 438,
3456Pogge R. W. et al., 2010, in McLean I. S., Ramsay S. K., Takami H., eds, Proc.
SPIE Conf. Ser. Vol. 7735, Ground-based and Airborne Instrumentationfor Astronomy III. SPIE, Bellingham, p. 77350A
Poznanski D., Prochaska J. X., Bloom J. S., 2012, MNRAS, 426, 1465Prieto J. L. et al., 2019, preprint (arXiv:1909.05267)Raskin C., Timmes F. X., Scannapieco E., Diehl S., Fryer C., 2009, MNRAS,
399, L156Raskin C., Scannapieco E., Rockefeller G., Fryer C., Diehl S., Timmes F.
X., 2010, ApJ, 724, 111Richardson D., Thomas R. C., Casebeer D., Blankenship Z., Ratowt S.,
Baron E., Branch D., 2001, Bulletin of the American AstronomicalSociety, Vol. 33, American Astronomical Society Meeting Abstracts,119th AAS Meeting. American Astronomical Society, Washington,D.C., p. 1428
Riess A. G. et al., 1998, AJ, 116, 1009Riess A. G. et al., 2005, ApJ, 627, 579Rosswog S., Ramirez-Ruiz E., Hix W. R., Dan M., 2008, Comput. Phys.
Commun., 179, 184Rosswog S., Ramirez-Ruiz E., Hix W. R., 2009a, ApJ, 695, 404Rosswog S., Kasen D., Guillochon J., Ramirez-Ruiz E., 2009b, ApJ, 705,
L128Ruiz-Lapuente P., Lucy L. B., 1992, ApJ, 400, 127Sand D. J. et al., 2018, ApJ, 863, 24Sand D. J. et al., 2019, ApJ, 877, L4Sasdelli M., Mazzali P. A., Pian E., Nomoto K., Hachinger S., Cappellaro
E., Benetti S., 2014, MNRAS, 445, 711Schlafly E. F., Finkbeiner D. P., 2011, ApJ, 737, 103Shappee B. J., Stanek K. Z., Pogge R. W., Garnavich P. M., 2013, ApJ, 762,
L5
MNRAS 492, 3553–3565 (2020)
Dow
nloaded from https://academ
ic.oup.com/m
nras/article-abstract/492/3/3553/5700293 by Serials Division user on 23 June 2020
Bimodality in nebular phase SNe Ia 3565
Shappee B. J., Stanek K. Z., Kochanek C. S., Garnavich P. M., 2017, ApJ,841, 48
Shappee B. J., Piro A. L., Stanek K. Z., Patel S. G., Margutti R. A., LipunovV. M., Pogge R. W., 2018, ApJ, 855, 6
Shen K. J., Moore K., 2014, ApJ, 797, 46Shen K. J., Bildsten L., Kasen D., Quataert E., 2012, ApJ, 748, 35Silverman J., Foley R. J., Ganeshalingam M., Chornock R., Li W., Filippenko
A. V., 2009, 213th AAS Meeting, Bulletin of the American AstronomicalSociety, Vol. 41, American Astronomical Society Meeting Abstracts#213. American Astronomical Society, Washington, D.C., p. 312
Silverman J. M. et al., 2012, MNRAS, 425, 1789Silverman J. M., Ganeshalingam M., Filippenko A. V., 2013, MNRAS, 430,
1030Sim S. A., Ropke F. K., Hillebrandt W., Kromer M., Pakmor R., Fink M.,
Ruiter A. J., Seitenzahl I. R., 2010, ApJ, 714, L52Soker N., Kashi A., Garcıa-Berro E., Torres S., Camacho J., 2013, MNRAS,
431, 1541Springob C. M., Masters K. L., Haynes M. P., Giovanelli R., Marinoni C.,
2009, ApJS, 182, 474Stanishev V. et al., 2007, A&A, 469, 645Starrfield S., Truran J. W., Sparks W. M., Kutter G. S., 1972, ApJ, 176,
169Stritzinger M., Mazzali P. A., Sollerman J., Benetti S., 2006, A&A, 460,
793Takanashi N., Doi M., Yasuda N., 2008, MNRAS, 389, 1577Thompson T. A., 2011, ApJ, 741, 82Toonen S., Perets H. B., Hamers A. S., 2018, A&A, 610, A22Tsvetkov D. Y., Metlov V. G., Shugarov S. Y., Tarasova T. N., Pavlyuk N.
N., 2014, Contrib. Astron. Obs. Skalnate Pleso, 44, 67Tucker M. A. et al., 2019, MNRAS, 00, 00Tucker M. A., Shappee B. J., Wisniewski J. P., 2019, ApJ, 872, L22Tully R. B., Rizzi L., Shaya E. J., Courtois H. M., Makarov D. I., Jacobs B.
A., 2009, AJ, 138, 323Tully R. B. et al., 2013, AJ, 146, 86
Tully R. B., Courtois H. M., Sorce J. G., 2016, AJ, 152, 50Vallely P. et al., 2016, MNRAS, 460, 1614Vallely P. J. et al., 2019, MNRAS, 487, 2372Vinko J. et al., 2012, A&A, 546, A12Vinko J. et al., 2018, PASP, 130, 064101Wang B., Meng X.-C., Wang X.-F., Han Z.-W., 2008, Chin. J. Astron.
Astrophys., 8, 71Webbink R. F., 1984, ApJ, 277, 355Wells L. A. et al., 1994, AJ, 108, 2233Whelan J., Iben I. Jr, 1973, ApJ, 186, 1007Woosley S. E., Weaver T. A., 1994, ApJ, 423, 371Woosley S. E., Weaver T. A., Taam R. E., 1980, in Wheeler J. C., ed., Texas
Workshop on Type I Supernovae. University of Texas, Austin, p. 96Yang Y. et al., 2018, ApJ, 852, 89Yaron O., Gal-Yam A., 2012, PASP, 124, 668Yoon S. C., Langer N., 2005, A&A, 435, 967Yoon S. C., Langer N., Scheithauer S., 2004, A&A, 425, 217Zhai Q. et al., 2016, AJ, 151, 125
SUPPORTING INFORMATION
Supplementary data are available at MNRAS online.
Figure 1. The new LBT late-time SNe Ia spectra we present in thispaper.
Please note: Oxford University Press is not responsible for thecontent or functionality of any supporting materials supplied bythe authors. Any queries (other than missing material) should bedirected to the corresponding author for the article.
This paper has been typeset from a TEX/LATEX file prepared by the author.
MNRAS 492, 3553–3565 (2020)
Dow
nloaded from https://academ
ic.oup.com/m
nras/article-abstract/492/3/3553/5700293 by Serials Division user on 23 June 2020


![Scattered Nebular Lightin theExtended Orion Nebula · 2018-10-27 · arXiv:0909.0538v1 [astro-ph.GA] 2 Sep 2009 Scattered Nebular Lightin theExtended Orion Nebula 1 C. R. O’Dell](https://img.pdfslide.net/doc/110x75/5f92bc6e796fc824033aa576/scattered-nebular-lightin-theextended-orion-nebula-2018-10-27-arxiv09090538v1.jpg)