Embed Size (px)
Citation preview
©FUNPEC-RP www.funpecrp.com.brGenetics and Molecular Research 14 (4): 12168-12177 (2015)
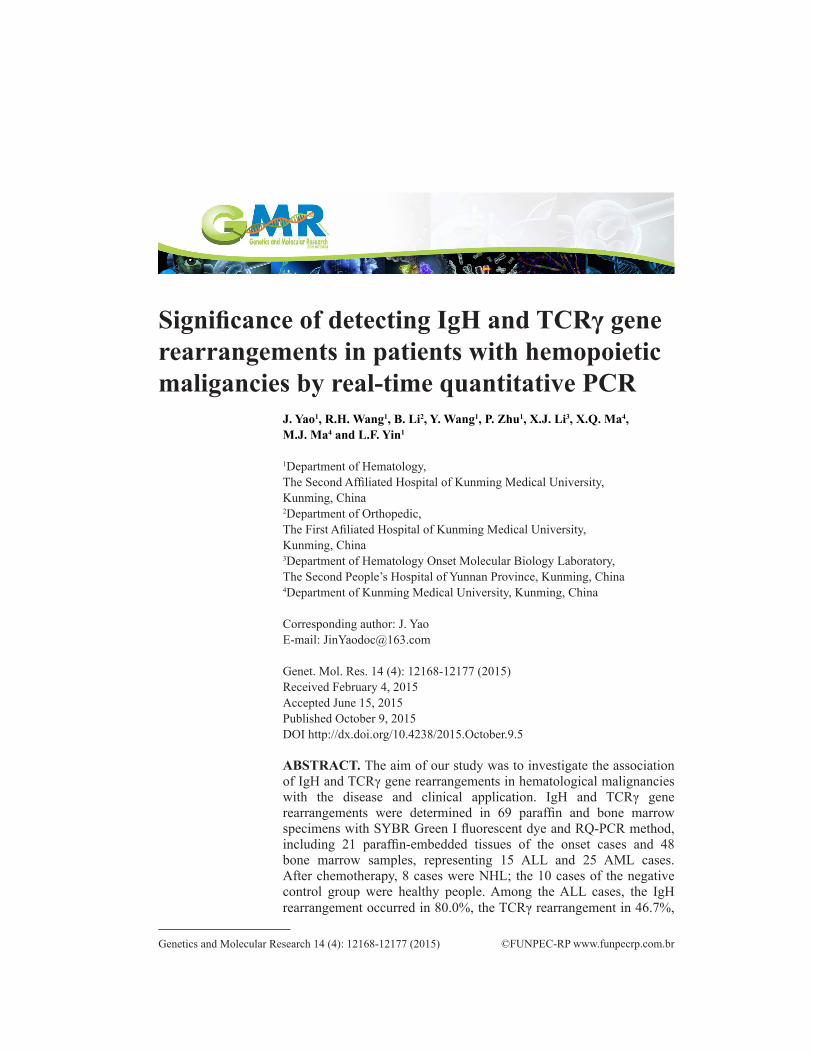
Significance of detecting IgH and TCRγ gene rearrangements in patients with hemopoietic maligancies by real-time quantitative PCR
J. Yao1, R.H. Wang1, B. Li2, Y. Wang1, P. Zhu1, X.J. Li3, X.Q. Ma4, M.J. Ma4 and L.F. Yin1
1Department of Hematology, The Second Affiliated Hospital of Kunming Medical University, Kunming, China2Department of Orthopedic, The First Afiliated Hospital of Kunming Medical University, Kunming, China3Department of Hematology Onset Molecular Biology Laboratory, The Second People’s Hospital of Yunnan Province, Kunming, China4Department of Kunming Medical University, Kunming, China
Corresponding author: J. YaoE-mail: [email protected]
Genet. Mol. Res. 14 (4): 12168-12177 (2015)Received February 4, 2015Accepted June 15, 2015Published October 9, 2015DOI http://dx.doi.org/10.4238/2015.October.9.5
ABSTRACT. The aim of our study was to investigate the association of IgH and TCRγ gene rearrangements in hematological malignancies with the disease and clinical application. IgH and TCRγ gene rearrangements were determined in 69 paraffin and bone marrow specimens with SYBR Green I fluorescent dye and RQ-PCR method, including 21 paraffin-embedded tissues of the onset cases and 48 bone marrow samples, representing 15 ALL and 25 AML cases. After chemotherapy, 8 cases were NHL; the 10 cases of the negative control group were healthy people. Among the ALL cases, the IgH rearrangement occurred in 80.0%, the TCRγ rearrangement in 46.7%,
12169Significance of detecting IgH and TCRγ gene
©FUNPEC-RP www.funpecrp.com.brGenetics and Molecular Research 14 (4): 12168-12177 (2015)
and both gene rearrangements in 46.7%. Among the AML cases, the IgH rearrangement occurred in 72.0%, the TCRγ rearrangement in 68.0%, and both gene rearrangements in 60.0%. In the lymphoma cases, the IgH rearrangement occurred in 93.1%, the TCRγ rearrangement in 51.7%, and both gene rearrangements in 44.8%. In the negative control group, the 10 cases were all negative. There was the phenomenon of “sequence-non-fidelity” in the hematologic malignancies; the detection rate of both genes was much higher than that of the single gene. The application of the RQ-PCR method in the detection of IgH and TCRγ gene rearrangements in hematologic malignancies has important clinical significance in MRD monitoring.
Key words: Real-time quantitative PCR; Fluorescent dye; Hematological malignancies; IgH gene; TCRγ gene; Gene rearrangement
INTRODUCTION
Hematologic malignancies (HM) include leukemia and malignant lymphoma. Generally, leukemia includes lymphocytic leukemia originating from the lymphatic series and non-lymphocytic leukemia not originating from the lymphatic series, while lympho-ma is a malignant tumor originating from the lymphatic system. Currently, it is considered that when pluripotent hematopoietic stem cells differentiate directly to lymphocytes, re-arrangements may occur in immunoglobulin heavy chain (IgH) and T cell receptor gene (TCRγ). Therefore, rearrangements of IgH and TCRγ gene could be used as markers of cell cloning (van der Velden et al., 2003). In this study, the SYBR Green I fluorescent dye and real-time quantitative PCR (RQ-PCR) method were used to quantitatively analyze the rearrangements of the IgH and TCRγ genes in bone marrow or peripheral blood collected after treatment, aiming to explore the relationship between MRD and the patients’ clinics and prognosis.
MATERIAL AND METHODS
Sourceof specimens
A total of 69 HM patients, confirmed by morphological, histochemical and immu-nological diagnosis, were selected from the Department of Hematology, the Second Affili-ated Hospital of Kunming Medical University, from June 2010 to December 2012, which included 52 males and 17 females, aged 15-84 years old. There were 21 paraffin-embedded tissue sections from patients at onset, including 17 cases of B-NHL, 3 cases of T-NHL, and 1 case of mantle cell lymphoma (MCL). There were 48 samples of bone marrow or peripheral blood, which included 8 NHL cases after 2-6 courses of chemotherapy, 15 cases of ALL (12 B-ALL and 3 T-ALL), and 25 cases of AML. The pathological tissues of 5 diagnosed chronic lymphadenitis cases and the bone marrows of 5 healthy individuals were taken as the negative control. Lymphoma diagnosis was based on the classification criteria of WHO hematopoietic and lymphoid tissue tumors (Jaffe et al., 2001).
J. Yao et al. 12170
©FUNPEC-RP www.funpecrp.com.brGenetics and Molecular Research 14 (4): 12168-12177 (2015)
DNA extraction
DNA was extracted from blood in accordance with the kit instructions (Qiagen Co., Ltd., Germany), and a UV spectrophotometer was used to determine the DNA content and purity. DNA samples were then cryopreserved at -20°C for future use.
DNA was extracted from paraffin-embedded tissue sections in accordance with the kit instructions (Aidlab Biotechnologies Co., Ltd.).
RQ-PCR
The primers were synthesized by Shanghai Sangon Biotech Engineering Co., Ltd., and the synthesized primer sequences are shown in Table 1.
Table 1. Synthesized primer sequences.
Targeted gene SequenceIgH Upstream primer: 5' ACA CGG CTC TGT ATT ACT GT 3' Downstream primer: 5' GTG ACC AGG GT (A\C\G\T) CCT TGG CCC CAG 3'β-actin Upstream primer: 5' AAC GGC TCC GGC ATG TGC AA 3' Downstream primer: 5' CTT CTG ACC CAT GCC CAC CA 3'TCRγ (Kido et al., 2003) Upstream primer: 5' TCT TCC AAC TGG GAA GGG AGA 3' Downstream primer: 5' CCC TCT ATT ACC TTG GAA ATG 3'
PCR
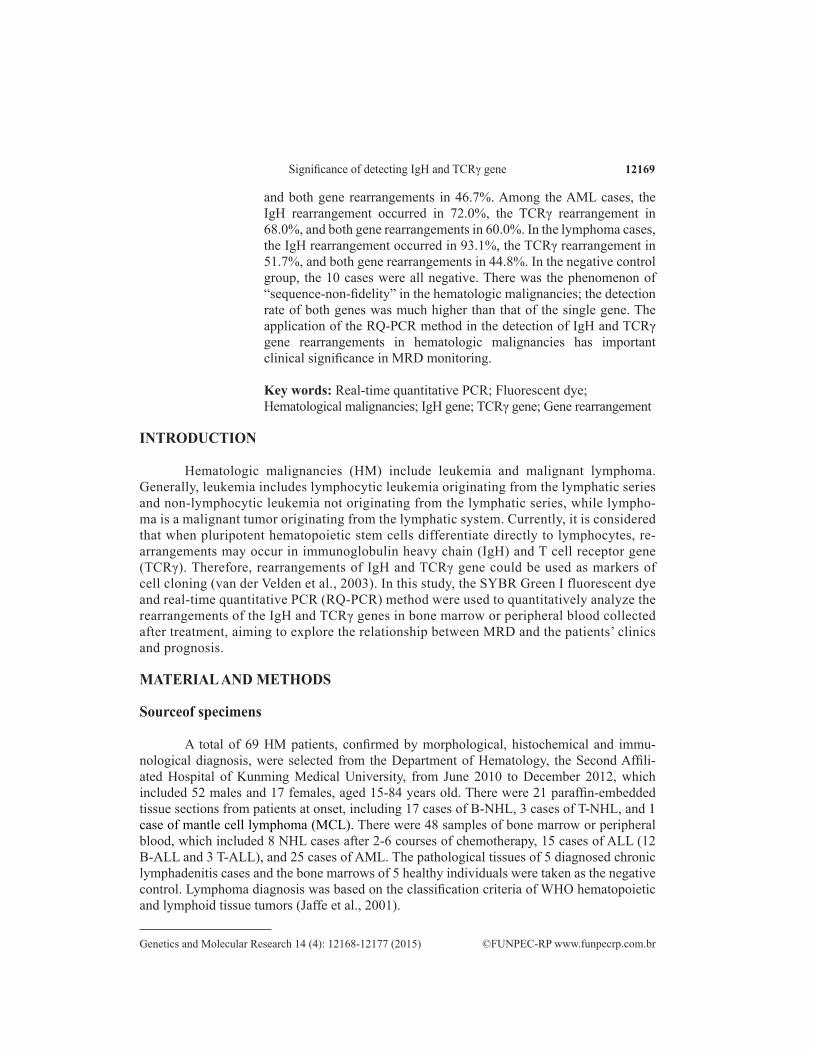
The reaction mixture included 2 µL DNA template, 23 µL prepared primer (formula-tion ratio: 3.0 µL 10X buffer, 1.6 µL Mg2+, 0.5 µL dNTPs, 1.5_U Taq_DNA polymerase, 0.35 µM primer, 5 µL template, and ionized water to a total volume of 25 µL). The above reaction system was added to the dedicated capillary of the RQ-PCR instrument, and the capillary was placed in an ABI 7300 PCR instrument, and β-actin was used as the internal reference to ensure the presence of DNA template and to eliminate false negatives. The above operation carried out at low temperatures as much as possible. The amplification was performed accord-ing to the following conditions: 1 cycle of 95°C for 10 min, followed by 40 cycles of 95°C for 15 s, 59.5°C for 25 s and 72°C for 1 min. The Dissociation Protocol program in the Gene Amp 5700 SDS software package was then used to analyze the temperature-solubility curves of the amplified-product fluorescence (Figures 1 and 2), at 95°C for 15 s, 60°C for 1 min, 95°C for 15 s and 60°C for 15 s.
Standard curve
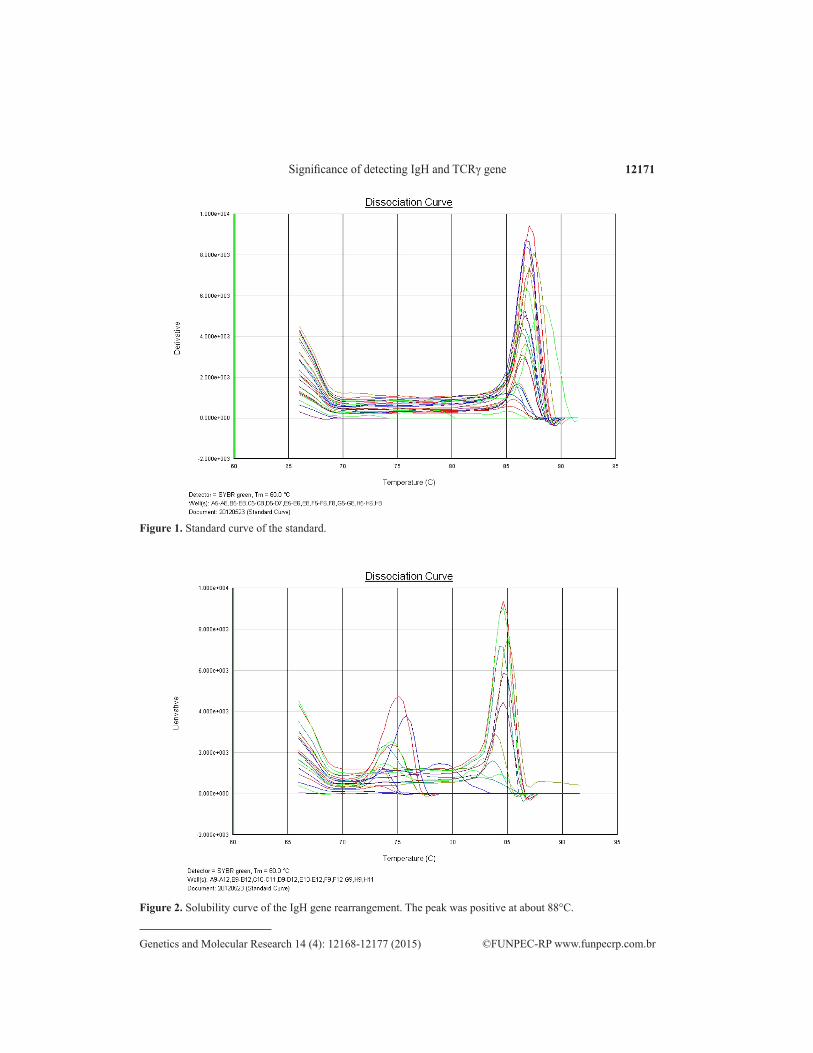
The RQ-PCR analysis results of the samples needed to be referred to the initial-copy-number-known standard to come to the final conclusion. In this experiment, the IgH-positive plasmid was used as the standard; after diluting 10-fold, its A260 value was determined with a spectrophotometer. RQ-PCR amplification was then performed and standard amplification curve obtained (Figure 3); the quantitative analysis of unknown samples could then be per-formed. As shown in the standard curve, the slope was good (-4.826779), with high correlation (r = -0.987939), indicating that quantitation would be accurate.
12171Significance of detecting IgH and TCRγ gene
©FUNPEC-RP www.funpecrp.com.brGenetics and Molecular Research 14 (4): 12168-12177 (2015)
Figure 1. Standard curve of the standard.
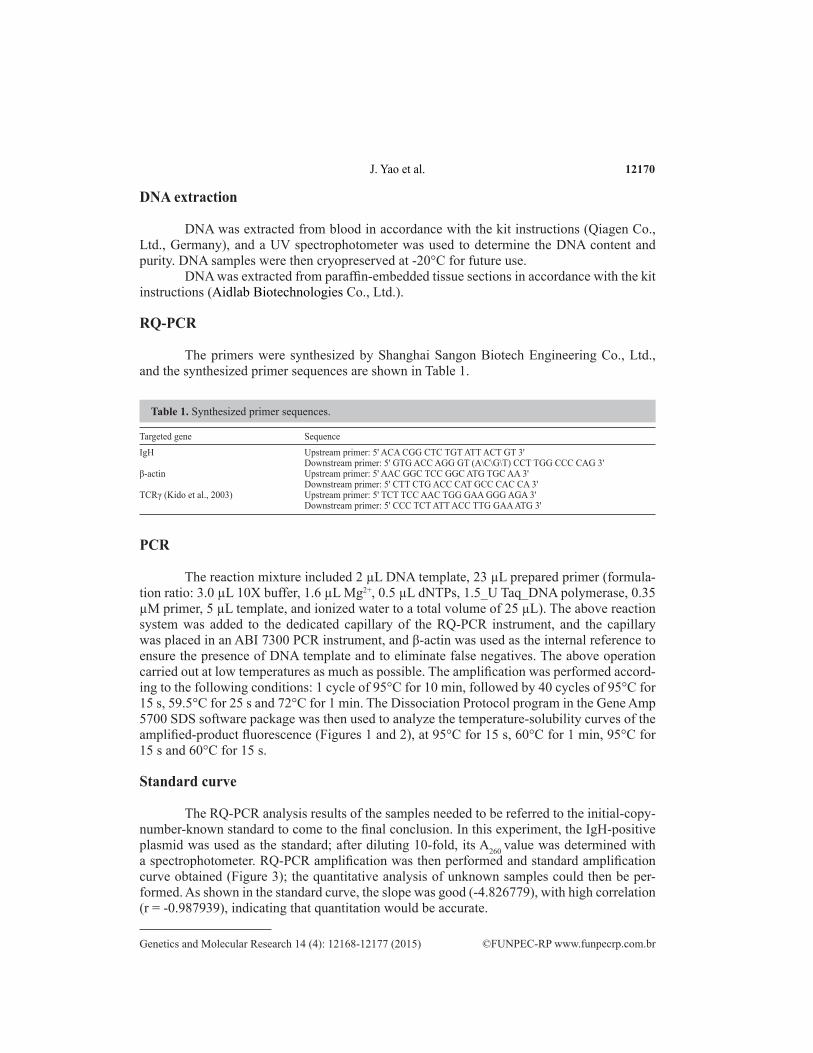
Figure 2. Solubility curve of the IgH gene rearrangement. The peak was positive at about 88°C.
J. Yao et al. 12172
©FUNPEC-RP www.funpecrp.com.brGenetics and Molecular Research 14 (4): 12168-12177 (2015)
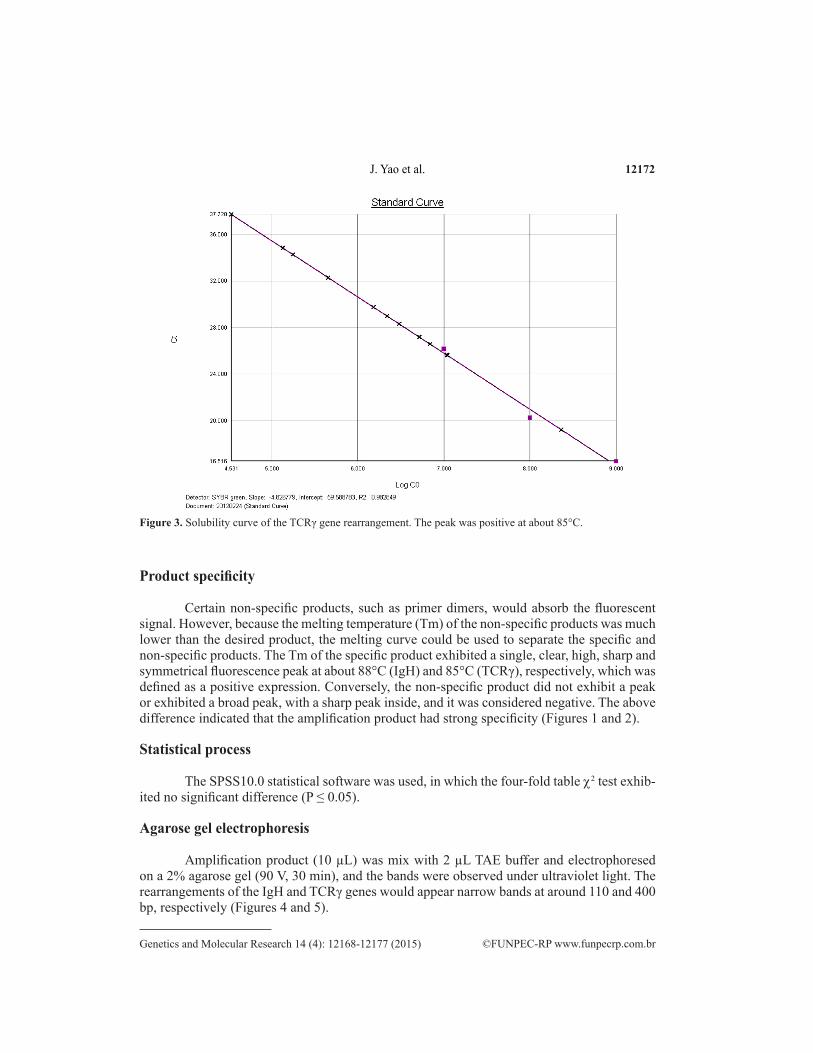
Figure 3. Solubility curve of the TCRγ gene rearrangement. The peak was positive at about 85°C.
Product specificity
Certain non-specific products, such as primer dimers, would absorb the fluorescent signal. However, because the melting temperature (Tm) of the non-specific products was much lower than the desired product, the melting curve could be used to separate the specific and non-specific products. The Tm of the specific product exhibited a single, clear, high, sharp and symmetrical fluorescence peak at about 88°C (IgH) and 85°C (TCRγ), respectively, which was defined as a positive expression. Conversely, the non-specific product did not exhibit a peak or exhibited a broad peak, with a sharp peak inside, and it was considered negative. The above difference indicated that the amplification product had strong specificity (Figures 1 and 2).
Statistical process
The SPSS10.0 statistical software was used, in which the four-fold table χ2 test exhib-ited no significant difference (P ≤ 0.05).
Agarose gel electrophoresis
Amplification product (10 µL) was mix with 2 µL TAE buffer and electrophoresed on a 2% agarose gel (90 V, 30 min), and the bands were observed under ultraviolet light. The rearrangements of the IgH and TCRγ genes would appear narrow bands at around 110 and 400 bp, respectively (Figures 4 and 5).
12173Significance of detecting IgH and TCRγ gene
©FUNPEC-RP www.funpecrp.com.brGenetics and Molecular Research 14 (4): 12168-12177 (2015)
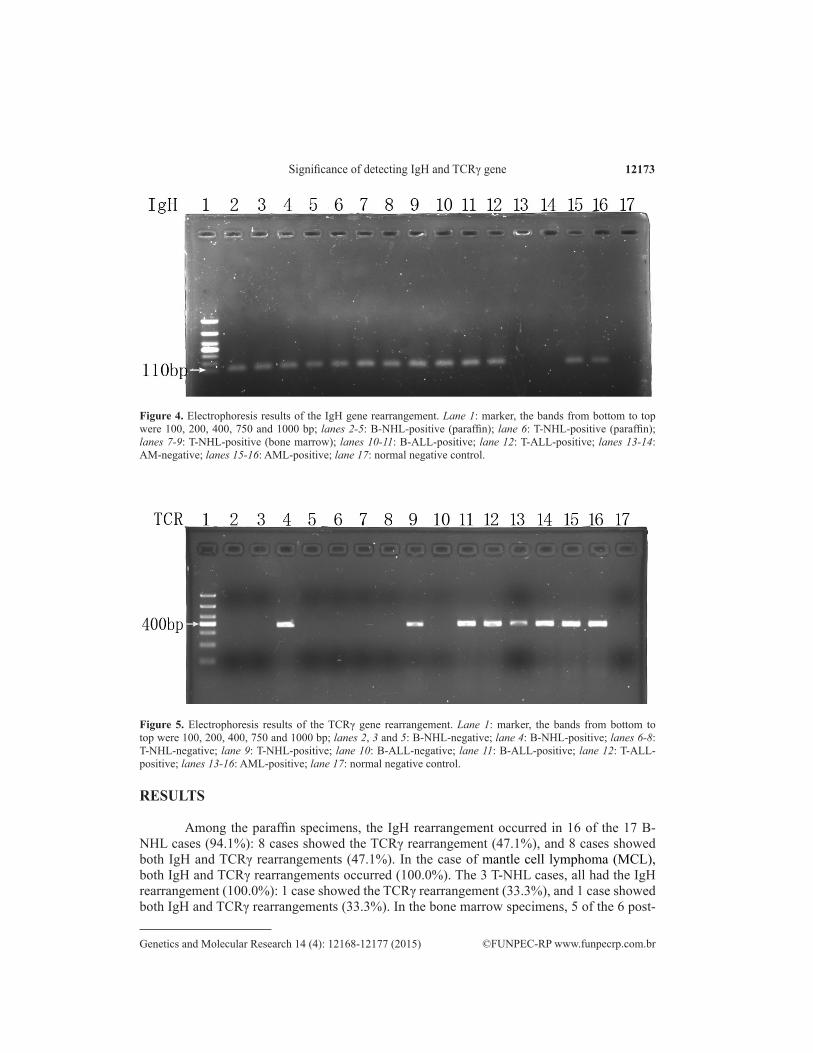
Figure 4. Electrophoresis results of the IgH gene rearrangement. Lane 1: marker, the bands from bottom to top were 100, 200, 400, 750 and 1000 bp; lanes 2-5: B-NHL-positive (paraffin); lane 6: T-NHL-positive (paraffin); lanes 7-9: T-NHL-positive (bone marrow); lanes 10-11: B-ALL-positive; lane 12: T-ALL-positive; lanes 13-14: AM-negative; lanes 15-16: AML-positive; lane 17: normal negative control.
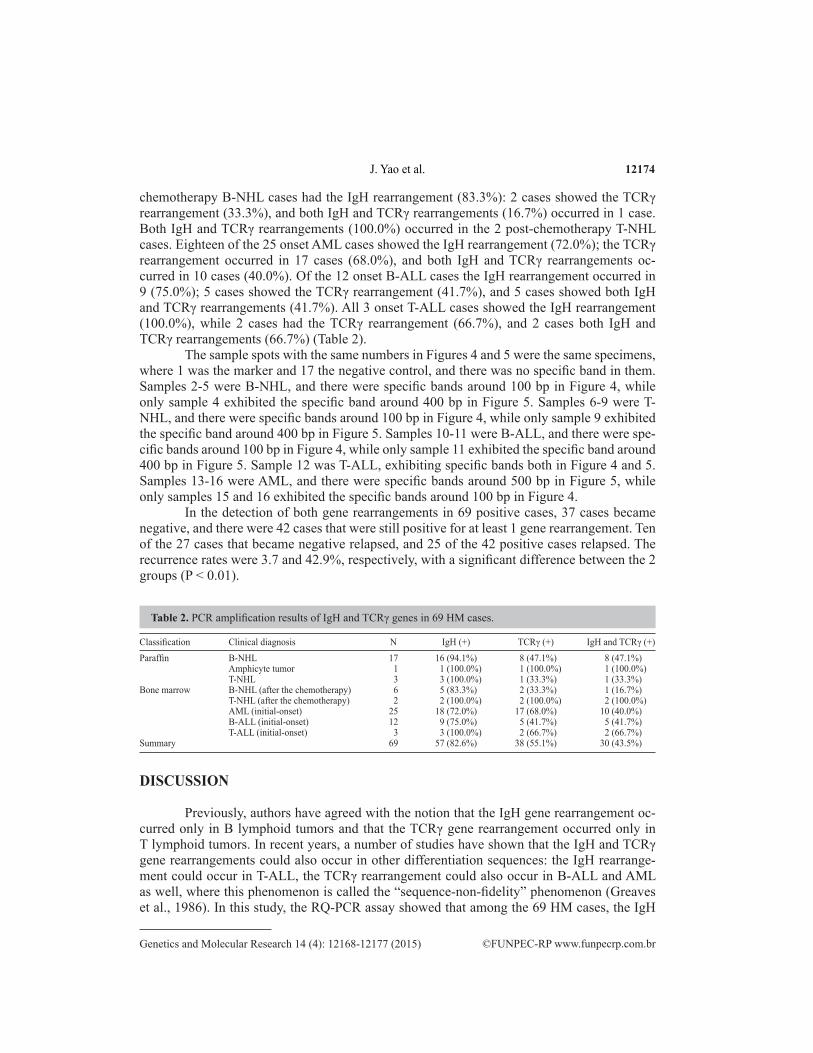
Figure 5. Electrophoresis results of the TCRγ gene rearrangement. Lane 1: marker, the bands from bottom to top were 100, 200, 400, 750 and 1000 bp; lanes 2, 3 and 5: B-NHL-negative; lane 4: B-NHL-positive; lanes 6-8: T-NHL-negative; lane 9: T-NHL-positive; lane 10: B-ALL-negative; lane 11: B-ALL-positive; lane 12: T-ALL-positive; lanes 13-16: AML-positive; lane 17: normal negative control.
RESULTS
Among the paraffin specimens, the IgH rearrangement occurred in 16 of the 17 B-NHL cases (94.1%): 8 cases showed the TCRγ rearrangement (47.1%), and 8 cases showed both IgH and TCRγ rearrangements (47.1%). In the case of mantle cell lymphoma (MCL), both IgH and TCRγ rearrangements occurred (100.0%). The 3 T-NHL cases, all had the IgH rearrangement (100.0%): 1 case showed the TCRγ rearrangement (33.3%), and 1 case showed both IgH and TCRγ rearrangements (33.3%). In the bone marrow specimens, 5 of the 6 post-
J. Yao et al. 12174
©FUNPEC-RP www.funpecrp.com.brGenetics and Molecular Research 14 (4): 12168-12177 (2015)
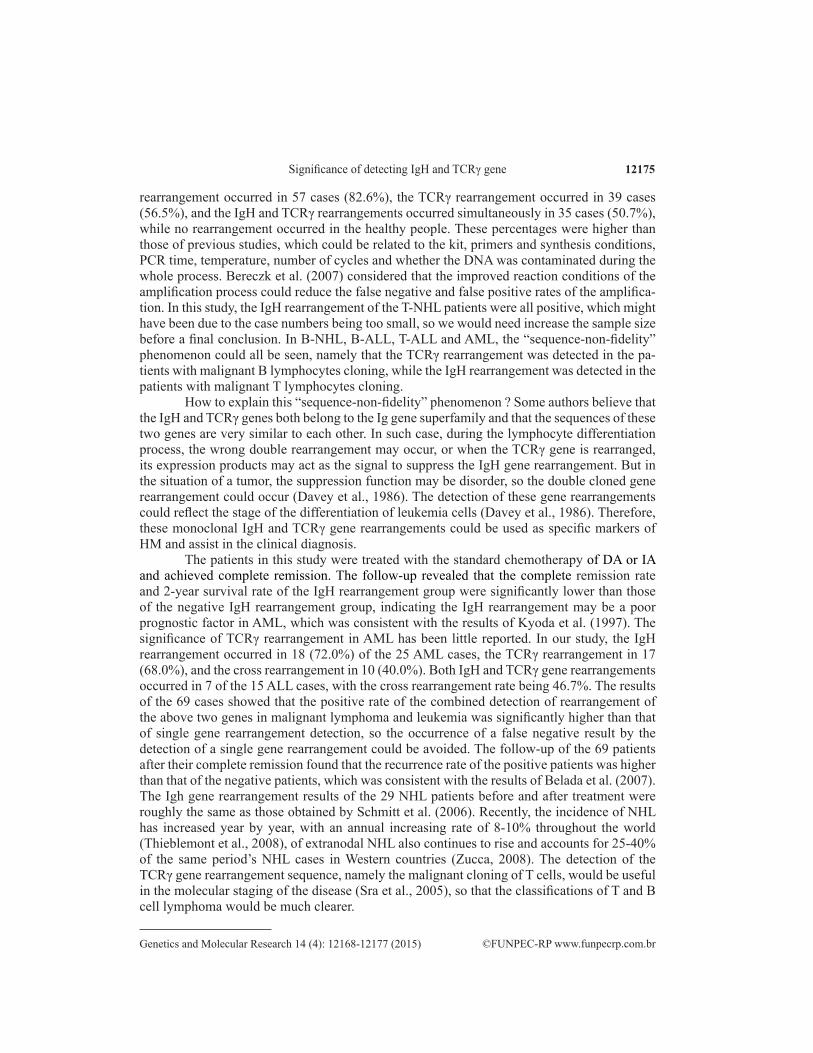
chemotherapy B-NHL cases had the IgH rearrangement (83.3%): 2 cases showed the TCRγ rearrangement (33.3%), and both IgH and TCRγ rearrangements (16.7%) occurred in 1 case. Both IgH and TCRγ rearrangements (100.0%) occurred in the 2 post-chemotherapy T-NHL cases. Eighteen of the 25 onset AML cases showed the IgH rearrangement (72.0%); the TCRγ rearrangement occurred in 17 cases (68.0%), and both IgH and TCRγ rearrangements oc-curred in 10 cases (40.0%). Of the 12 onset B-ALL cases the IgH rearrangement occurred in 9 (75.0%); 5 cases showed the TCRγ rearrangement (41.7%), and 5 cases showed both IgH and TCRγ rearrangements (41.7%). All 3 onset T-ALL cases showed the IgH rearrangement (100.0%), while 2 cases had the TCRγ rearrangement (66.7%), and 2 cases both IgH and TCRγ rearrangements (66.7%) (Table 2).
The sample spots with the same numbers in Figures 4 and 5 were the same specimens, where 1 was the marker and 17 the negative control, and there was no specific band in them. Samples 2-5 were B-NHL, and there were specific bands around 100 bp in Figure 4, while only sample 4 exhibited the specific band around 400 bp in Figure 5. Samples 6-9 were T-NHL, and there were specific bands around 100 bp in Figure 4, while only sample 9 exhibited the specific band around 400 bp in Figure 5. Samples 10-11 were B-ALL, and there were spe-cific bands around 100 bp in Figure 4, while only sample 11 exhibited the specific band around 400 bp in Figure 5. Sample 12 was T-ALL, exhibiting specific bands both in Figure 4 and 5. Samples 13-16 were AML, and there were specific bands around 500 bp in Figure 5, while only samples 15 and 16 exhibited the specific bands around 100 bp in Figure 4.
In the detection of both gene rearrangements in 69 positive cases, 37 cases became negative, and there were 42 cases that were still positive for at least 1 gene rearrangement. Ten of the 27 cases that became negative relapsed, and 25 of the 42 positive cases relapsed. The recurrence rates were 3.7 and 42.9%, respectively, with a significant difference between the 2 groups (P < 0.01).
Table 2. PCR amplification results of IgH and TCRγ genes in 69 HM cases.
Classification Clinical diagnosis N IgH (+) TCRγ (+) IgH and TCRγ (+)Paraffin B-NHL 17 16 (94.1%) 8 (47.1%) 8 (47.1%) Amphicyte tumor 1 1 (100.0%) 1 (100.0%) 1 (100.0%) T-NHL 3 3 (100.0%) 1 (33.3%) 1 (33.3%)Bone marrow B-NHL (after the chemotherapy) 6 5 (83.3%) 2 (33.3%) 1 (16.7%) T-NHL (after the chemotherapy) 2 2 (100.0%) 2 (100.0%) 2 (100.0%) AML (initial-onset) 25 18 (72.0%) 17 (68.0%) 10 (40.0%) B-ALL (initial-onset) 12 9 (75.0%) 5 (41.7%) 5 (41.7%) T-ALL (initial-onset) 3 3 (100.0%) 2 (66.7%) 2 (66.7%)Summary 69 57 (82.6%) 38 (55.1%) 30 (43.5%)
DISCUSSION
Previously, authors have agreed with the notion that the IgH gene rearrangement oc-curred only in B lymphoid tumors and that the TCRγ gene rearrangement occurred only in T lymphoid tumors. In recent years, a number of studies have shown that the IgH and TCRγ gene rearrangements could also occur in other differentiation sequences: the IgH rearrange-ment could occur in T-ALL, the TCRγ rearrangement could also occur in B-ALL and AML as well, where this phenomenon is called the “sequence-non-fidelity” phenomenon (Greaves et al., 1986). In this study, the RQ-PCR assay showed that among the 69 HM cases, the IgH
12175Significance of detecting IgH and TCRγ gene
©FUNPEC-RP www.funpecrp.com.brGenetics and Molecular Research 14 (4): 12168-12177 (2015)
rearrangement occurred in 57 cases (82.6%), the TCRγ rearrangement occurred in 39 cases (56.5%), and the IgH and TCRγ rearrangements occurred simultaneously in 35 cases (50.7%), while no rearrangement occurred in the healthy people. These percentages were higher than those of previous studies, which could be related to the kit, primers and synthesis conditions, PCR time, temperature, number of cycles and whether the DNA was contaminated during the whole process. Bereczk et al. (2007) considered that the improved reaction conditions of the amplification process could reduce the false negative and false positive rates of the amplifica-tion. In this study, the IgH rearrangement of the T-NHL patients were all positive, which might have been due to the case numbers being too small, so we would need increase the sample size before a final conclusion. In B-NHL, B-ALL, T-ALL and AML, the “sequence-non-fidelity” phenomenon could all be seen, namely that the TCRγ rearrangement was detected in the pa-tients with malignant B lymphocytes cloning, while the IgH rearrangement was detected in the patients with malignant T lymphocytes cloning.
How to explain this “sequence-non-fidelity” phenomenon ? Some authors believe that the IgH and TCRγ genes both belong to the Ig gene superfamily and that the sequences of these two genes are very similar to each other. In such case, during the lymphocyte differentiation process, the wrong double rearrangement may occur, or when the TCRγ gene is rearranged, its expression products may act as the signal to suppress the IgH gene rearrangement. But in the situation of a tumor, the suppression function may be disorder, so the double cloned gene rearrangement could occur (Davey et al., 1986). The detection of these gene rearrangements could reflect the stage of the differentiation of leukemia cells (Davey et al., 1986). Therefore, these monoclonal IgH and TCRγ gene rearrangements could be used as specific markers of HM and assist in the clinical diagnosis.
The patients in this study were treated with the standard chemotherapy of DA or IA and achieved complete remission. The follow-up revealed that the complete remission rate and 2-year survival rate of the IgH rearrangement group were significantly lower than those of the negative IgH rearrangement group, indicating the IgH rearrangement may be a poor prognostic factor in AML, which was consistent with the results of Kyoda et al. (1997). The significance of TCRγ rearrangement in AML has been little reported. In our study, the IgH rearrangement occurred in 18 (72.0%) of the 25 AML cases, the TCRγ rearrangement in 17 (68.0%), and the cross rearrangement in 10 (40.0%). Both IgH and TCRγ gene rearrangements occurred in 7 of the 15 ALL cases, with the cross rearrangement rate being 46.7%. The results of the 69 cases showed that the positive rate of the combined detection of rearrangement of the above two genes in malignant lymphoma and leukemia was significantly higher than that of single gene rearrangement detection, so the occurrence of a false negative result by the detection of a single gene rearrangement could be avoided. The follow-up of the 69 patients after their complete remission found that the recurrence rate of the positive patients was higher than that of the negative patients, which was consistent with the results of Belada et al. (2007). The Igh gene rearrangement results of the 29 NHL patients before and after treatment were roughly the same as those obtained by Schmitt et al. (2006). Recently, the incidence of NHL has increased year by year, with an annual increasing rate of 8-10% throughout the world (Thieblemont et al., 2008), of extranodal NHL also continues to rise and accounts for 25-40% of the same period’s NHL cases in Western countries (Zucca, 2008). The detection of the TCRγ gene rearrangement sequence, namely the malignant cloning of T cells, would be useful in the molecular staging of the disease (Sra et al., 2005), so that the classifications of T and B cell lymphoma would be much clearer.
J. Yao et al. 12176
©FUNPEC-RP www.funpecrp.com.brGenetics and Molecular Research 14 (4): 12168-12177 (2015)
Minimal residual disease (MRD) is the root of acute leukemia recurrence. If the status of MRD could be accurately assessed after chemotherapy, recurrence could be predicted in advance, and survival could be effectively prolonged. Farmer et al. (2006) believed that the persistence of MRD could indicate poor prognosis. Schuler and Dolken (2006) considered that RQ-PCR could be used to detect the MRD magnitude levels in lymphoma or leukemia patients before and after treatment, thereby to evaluate treatment effectiveness and predict recurrence and to provide effective treatments before the appearance of the clinical symptoms, so as to control disease progression. Nahas et al. (2007) studied and considered that there was some value in the molecular biological detection methods that treated gene rearrangement as a mo-lecular target. But there are still situations where the experimental test results do not appear consistent with clinical situation; positive cases have been stable, while negative cases have progressed, which still needs further study. Second, the conventional morphological examina-tion cannot confirm the presence of MRD in the complete remission situation of leukemia, and therefore, there is still a great need for much more sensitive prognostic indicators to predict recurrence. At different detection times, MRD would have different predictive ability (Free-man et al., 2008). Although the quick removal of the tumor is very important after the start of treatment (Lacombe et al., 2009; Rubnitz et al., 2010), some investigators have found that MRD levels in consolidation therapy have better predictive power (Kern et al., 2010; Buccisno et al., 2012).
The conventional single gene rearrangement detection method would restrict the deter-mination of MRD because of the specific problems in each gene rearrangement, we used the RQ-PCR method to perform a dynamic and combined detection of the IgH and TCRγ genes in HM. This greatly improved the specificity and sensitivity of MRD detection, allowing a significant understanding of the clinical situation, which would provide a guide for therapeutic intervention.
ACKNOWLEDGMENTS
Research supported by the Special Basic Research Project of Yunnan Social Develop-ment Science and Technology Application (#2009ZC114M) and the Kunming Medical Col-lege Students Innovation Experimental Program (#ID: CX201176).
REFERENCES
Belada D, Smolej L, Stepankova P, Beránek M, et al. (2007). Achieving BCL-2/IgH negativity in peripheral blood/bone marrow after therapy implies better prognosis for patients with follicular lymphoma. Vnitr. Lek. 53: 1029-1030.
Bereczk IL, Kis G, Bagdi E, Krenacs L, et al. (2007). Optimization of PCR amplification for B- and T-cell clonality analysis on formalin-fixed and paraffin-embedded samples. Pathol. Oncol. Res. 13: 209-214.
Buccisno F, Maurillo L, Principe MI, Del Poeta G, et al. (2012). Prognostic and therapeutic implications of minimal residual disease detection in acute myeloid leukemia. Blood 119: 332-341.
Davey MP, Bongiovanni KF, Kaulfersch W, Quertermous T, et al. (1986). Immunoglobulin and T2 cell receptor gene rearrangement and expression in human lymphoid leukemia cells at different stages of maturation. Proc. Natl. Acad. Sci. 83: 8759-8765.
Farmer JP, Lamba M, Merkur AB, Lamba WR, et al. (2006). Characterization of lymphoproliferative lesions of the conjunctiva: immunohistochemical and molecular genetic studies. Can. J. Ophthalmol. 41: 753-760.
Freeman SD, Jovanovic JV, and Grimwade D. (2008). Development of minimal residual disease-directed therapy in acute myeloid leukemia. Semin. Oncol. 35: 388-400.
Greaves MF, Chan LC, Furley JW, Watt SM, et al. (1986). Lineage promiscuity in hemopoietic differentiation and leukemia. Blood 67: 1-7.
12177Significance of detecting IgH and TCRγ gene
©FUNPEC-RP www.funpecrp.com.brGenetics and Molecular Research 14 (4): 12168-12177 (2015)
Jaffe HN, Stein H and Vardiman JW. (2001). World Health Organization classification of tumors. Pathology and genetics of tumors of haematopoietic and lymphoid tissues. Lyon: IARC Press.
Kern W, Bacher U, Haferlach C, Schnittger S, et al. (2010). The role of multiparameter flow cytometry for disease monitoring in AML. Best. Pract. Res. Clin. Haematol. 23: 379-390.
Kido S, Miyazaki K and Tokunaga O. (2003). The relationship between primary gastric B-call lymphoma and immunoglobulin heavy chain (IgH) gene rearrangement - a histopathological study of primary gastric lymphomas. Pathol. Res. Pract. 199: 647-658.
Kyoda K, Nakamura S, Matamo S, Ohtake S, et al. (1997). Prognostic significance of immunoglobulin heavy chain gene rearrangement in patients with acute myelogenous leukemia. Leukemia 11: 803-806.
Lacombe F, Arnoulet C, Maynadie M, Lippert E, et al. (2009). Early clearance of peripheral blasts measured by flow cytometry during the first week of AML induction therapy as a new independent prognostic factor : a GOELAMS study. Leukemia 23: 350-357.
Nahas A, Win Z, Sayed Y, Khan S, et al. (2007). Anatomic and functional imaging in the management of lymphoma. Nucl. Med. Mol. Imaging. 51: 251-259.
Rubnitz J, Inaba H, Dahl G, Ribeiro RC, et al. (2010). Minimal residual disease-directed therapy for childhood acute myeloid leukaemia: results of the AML02 multicentre trial. Lancet. Oncol. 11: 543-552.
Schmitt C, Grundt A, Buchholtz C, Scheuer L, et al. (2006). One single dose of rituximab added to a standard regimen of CHOP in primary treatment of follicular lymphoma appears to result in a high clearance rate from circulating BCL/Igh positive cells: Is the end of molecular monitoring near? Leuk. Res. 30: 1563-1568.
Schuler F and Dolken G. (2006). Detection and monitoring of minimal residual disease by quantitative real-time PCR. Clin. Chin. Acta 363: 147-156.
Sra KK, Babb-Tarbox M, Aboutalebi S, Rady P, et al. (2005). Molecular diagnosis of cutaneeous disease. Arch. Dermatol. 141: 225-141.
Thieblemont C, Grossoeuver A, Houot R, Broussais-Guillaumont F, et al. (2008). Non-Hodgkin, s in very elderly patients over 80 years: a descriptive analysis of clinical presentation and outcome (J). Ann. Oncol. 19: 774-779.
van der Velden, Hochhaus A, Cazzaniga G, Szczepanski T, et al. (2003). Detection of minimal residual disease in hematologic malignancies by real-time quantitative PCR: Principles, approaches, and laboratory aspects. Leukemia 17: 10-13.
Zucca E. (2008). Extranodal lymphomas: a reappraisal. Ann. Oncol. 19: 77-80.