Embed Size (px)
Citation preview
8202019 Significance of Dimensionality
httpslidepdfcomreaderfullsignificance-of-dimensionality 116
Signal amp Image Processing An International Journal (SIPIJ) Vol6 No3 June 2015
DOI 105121sipij20156303 27
SIGNIFICANCE OF DIMENSIONALITY
R EDUCTION IN IMAGE PROCESSING
Shereena V B1and Julie M David
2
12Asst Professor Dept of Computer Applications MES College Marampally
Aluva Cochin India
A BSTRACT
The aim of this paper is to present a comparative study of two linear dimension reduction methods namely
PCA (Principal Component Analysis) and LDA (Linear Discriminant Analysis) The main idea of PCA is to
transform the high dimensional input space onto the feature space where the maximal variance isdisplayed The feature selection in traditional LDA is obtained by maximizing the difference between
classes and minimizing the distance within classes PCA finds the axes with maximum variance for the
whole data set where LDA tries to find the axes for best class seperability The neural network is trained
about the reduced feature set (using PCA or LDA) of images in the database for fast searching of images
from the database using back propagation algorithm The proposed method is experimented over a general
image database using Matlab The performance of these systems has been evaluated by Precision and
Recall measures Experimental results show that PCA gives the better performance in terms of higher
precision and recall values with lesser computational complexity than LDA
K EYWORDS
Color histogram Feature Extraction Euclidean distance Principal Component Analysis Linear
Discriminant Analysis Eigen Values Eigen Vectors Neural network Back Propagation
1 INTRODUCTION
As we know human beings are predominantly visual creatures The visualisation of the images
which we see in real or imaginary make sense of the world around us to identify and
differentiate the things which we see at a quick glance We are bestowed with very precise visual
skills to identify an image by size and also by differentiating the colors We can process a large
amount of visual information very quickly
An image processing task consists of acquiring the image pre-processing segmentationrepresentation and description and finally recognition and interpretation There are four types of
digital images binary grey scale true color or RGB and indexed [1] Binary representation
images include text fingerprints or architectural plans where each pixel is black or white Grey
scale images consist of X-rays images of printed works etc where each pixel is a shade of grey
normally from 0 to 255 True color or RGB images are the color images where each pixel is
described by the amount of red green and blue in it Finally there are indexed images where the
8202019 Significance of Dimensionality
httpslidepdfcomreaderfullsignificance-of-dimensionality 216
Signal amp Image Processing An International Journal (SIPIJ) Vol6 No3 June 2015
28
image has an associated color map which is a list of all the colors used in that image Each pixelhas a value which does not give its color but an index to the color in the map
There has been a tremendous growth in the digital information over years This trend has
motivated research in image databases which were nearly ignored by traditional computer
systems due to the enormous amount of data necessary to represent images and the difficulty ofautomatically analyzing images Currently storage is less of an issue since huge storage capacity
is available at low cost Large image databases are used in many application areas such as
satellite imaging and biometric databases Crime prevention military Intellectual property
Architectural and engineering design Fashion and interior design Journalism and advertising
Medical diagnosis Geographical information and remote sensing systems Cultural heritage
Education and training Home entertainment Web searching where it is important to maintain a
high degree of precision [2] Thus an important issue was the fast image retrieval from large
databases This trend led to the development of research area known as Content Based Image
Retrieval CBIR systems retrieves features from the raw images themselves and calculate an
association measure between the query image and database images based on these features We
need to develop an efficient system for retrieving images since speed and precision are important
CBIR consists of different stages such as Image acquisition image Pre-Processing Feature
Extraction Similarity Matching and obtain the resultant images Image Acquisition is the process
of acquiring a digital image database which consists of n number of images The Pre-processing
stage involves filtering normalization segmentation and object identification The output of thisstage is a set of significant regions and objects In the Feature extraction stage visual information
such as color and texture is extracted from the images and saves them as feature vectors in a
feature vector database One of the major problems with Content Based image retrieval system is
the large number of features extracted which requires large amount of memory and computation
power To overcome this problem we have to construct a combination of features which bestdescribe the data with sufficient accuracy So in this stage we use dimension reduction
algorithms which extract only essential features from the feature vector database and store them
as reduced feature vector database Thus the output of feature extraction stage is a reduced set offeatures which best describes the image In the Similarity matching stage the reduced feature
vectors of query image calculated is matched with the feature vectors of reduced feature vectordatabase using any of the Distance methods available such as Euclidean distance City Block
Distance Canberra Distance [3]
The most popular among the Dimensionality Reduction Algorithms are Principal Component
Analysis and Linear Discriminant Analysis Principal Component Analysis defines new attributes(principal components or PCs) as mutually-orthogonal linear combinations of the original
attributes For many image datasets it is sufficient to consider only the first few PCs thus
reducing the dimension Linear Discriminant Analysis [4] easily handles the case where the
within-class frequencies are unequal and their performances have been examined on randomly
generated test data This method maximizes the ratio of between-class variance to the within-class variance in any particular data set thereby guaranteeing maximal separability The above
two methods show improvements in recognition rates when the neural network classifier is used
Neural network classification involves mapping the data to one of the predefined newly
discovered classes [30] Neural networks offer a number of advantages including requiring less
formal statistical training ability to implicitly detect complex nonlinear relationships between
dependent and independent variables ability to detect all possible interactions between predictor
8202019 Significance of Dimensionality
httpslidepdfcomreaderfullsignificance-of-dimensionality 316
Signal amp Image Processing An International Journal (SIPIJ) Vol6 No3 June 2015
29
variables and the availability of multiple training algorithms [27] Back-propagation techniquewhich is a supervised method for learning is used here for training the neural network
In this paper we compare the above two dimensionality reduction techniques by implementing
the algorithms on a given image data set The rest of this paper is organized as follows Section 2
deals with Literature Review In Section 3 we explain Proposed Methodology Section 4 consistsof Comparative study of PCA and LDA Conclusions are given in Section 5
2 LITERATURE REVIEW
HH Pavan Kumar Bhuravarjula and VNS Vijayakumar proposed in their paper ldquoA novel content
based image retrieval using variance color momentrdquo that color moments gives average high
precision and recall [2] In the paper of Manimala Singha and K Hemachandran [5] they
presented a novel approach for Content Based Image Retrieval by combining the color andtexture features called Wavelet-Based Color Histogram Image Retrieval (WBCHIR) The
experimental result shows that the proposed method outperforms the other retrieval methods in
terms of Average Precision Pranali Prakash Lokhande P A Tijare [6] concluded in theirpaper ldquo Feature Extraction Approach for Content Based Image Retrieval ldquothat the combination of
the color and texture features of an image in conjunction with the shape features will provide a
robust feature set for image retrieval S Mangijao Singh and K Hemachandran [7] in their paperldquoContent-Based Image Retrieval using Color Moment and Gabor Texture Featurerdquo proposed an
efficient image retrieval method based on color moments and Gabor texture features To improve
the discriminating power of color indexing techniques they encoded a minimal amount of
spatial information in the index Mohd Danish Ritika Rawat Ratika Sharma [3] in their paper
ldquoA Survey Content Based Image Retrieval Based On Color Texture Shape and Neuro Fuzzyrdquo
provides an overview of the functionality of content based image retrieval systems Most systems
use color and texture features and some systems use shape features
A Ramesh Kumar and D Saravanan in their paper ldquoContent Based Image Retrieval Using ColorHistogramrdquo [8] CBIR using color histograms technique is proposed with help of principal
component analysis technique to improve the image retrieval performance Swati V Sakhare
and Vrushali G Nasre [9] in their paper ldquoDesign of Feature Extraction in Content Based Image
Retrieval (CBIR) using Color and Texturerdquo designed an application which performs a simple
color-based search in an image database for an input query image using color texture and shapeto give the images which are similar to the input image as the output The number of search
results may vary depending on the number of similar images in the database In the paper ldquoA
Proposed Method for Image Retrieval using Histogram values and Texture Descriptor Analysisrdquo
[10] Wasim Khan Shiv Kumar Neetesh Gupta and Nilofar Khan proposed a method for image
retrieval using histogram values and texture descriptor analysis of image When a query image issubmitted its color and texture value is compared with the color and texture value of different
images stored in database The images having closest value compared to query image areretrieved from database are displayed on GUI as result
S Meenachi Sundaresan and Dr KG Srinivasagan [11] proposed in their paper ldquoDesign ofImage Retrieval Efficacy System Based on CBIRrdquo that the performance of a retrieval system can
be measured in terms of its recall (or sensitivity) and precision (or specificity) Recall measures
the ability of the system to retrieve all models that are relevant while precision measures the
ability of the system to retrieve only models that are relevant In the paper ldquo An Enhancement on
8202019 Significance of Dimensionality
httpslidepdfcomreaderfullsignificance-of-dimensionality 416
Signal amp Image Processing An International Journal (SIPIJ) Vol6 No3 June 2015
30
Content-Based Image Retrieval using Color and Texture Featuresrdquo [12] Tamer Mehyar JalalOmer Atoum proposed an enhancement on the use of color and texture visual features in Content-
Based Image Retrieval (CBIR) by adding a new color feature called Average Color Dominance
which tries to enhance color description using the dominant colors of an image
In the paper ldquoImplementation of Principal Component Analysis with Fuzzy Annotation for CADJewellery Imagesrdquo Pinderjeet Kaur [13] proposed that Principal Component Analysis (PCA) can
be used for dimension reduction to reduce the computation cost for the system of Content Based
Image Retrieval (CBIR) Arunasakthi K KamatchiPriya L [14] stated in their paper ldquoA Review
On Linear And Non-Linear Dimensionality Reduction Techniquesrdquo that Principal Component
Analysis (PCA) and Linear Discriminant Analysis (LDA) are regarded as the most fundamental
and powerful tools of dimensionality reduction for extracting effective features of high-
dimensional vectors in input data According to Julie M David and Kannan Balakrishanan
principal components are new set of variables which are generated by the application of
dimensionality reduction method [15] The basic procedures behind PCA are (i) the inputs data
are normalized so that each attribute falls within the same range This helps ensure that attributes
with large domains will not dominate attributes with smaller domains (ii) PCA computes k
orthonormal vectors that provides a basis for the normalized input data These are unit vectorsthat each point in a direction perpendicular to the others These vectors are referred to as the
principal components and (iii) The principal components are sorted in order of decreasing
strength [16]
Kresimir Delac Mislav Grgic and Sonja Grgic [17] in their paper ldquoIndependent Comparative
Study of PCA ICA and LDA on the FERET Data Setrdquo proposed that PCA finds a set of the most
representative projection vectors such that the projected samples retain most information about
original samples whereas LDA uses the class information and finds a set of vectors that maximize
the between-class scatter while minimizing the within-class scatter In the paper ldquoCBIR FeatureVector Dimension Reduction with Eigenvectors of Covariance Matrix using Row Column and
Diagonal Mean Sequencesrdquo [18] Dr HB Kekre Sudeep D Thepade and Akshay Maloo stated
that PCA can be used to transform each original image from database into its corresponding eigenimage
In the paper ldquoLinear Discriminant Analysis bit by bitrdquo Sebastian Raschka [19] stated that PCA
can be described as an unsupervised algorithm since it ignores class labels and its goal is to find
the directions (the so-called principal components) that maximize the variance in a dataset In
contrast to PCA LDA is supervised and computes the linear discriminants that will represent the
axes that maximize the separation between multiple classes
According to Aravind Nagathan Animozhi and Jithendra Mungara [28] the use of feed-forward
neural network has considerably improved the recall rate and also retrieval time due to its highly
efficient and accurate classification capability In their paper lsquoA genetic optimized neural
network for image retrieval in telemedicinersquo Mohandass Divya Jude Janet and RamadassSuguna [29] stated that the proposed method efficiently extracts features and retrieves relevant
images from compressed images Shamla Mantri Nikhil S Tarale and Sudip C Mahajan in their
paper rsquo Dimensionality Reduction technique using Neural Networks ndash A Surveyrsquo [30] different
dimensionality reduction techniques such as Principal component analysis Independent
component analysis and Self-Organizing Map are selected and applied in order to reduce the loss
of classification performance
8202019 Significance of Dimensionality
httpslidepdfcomreaderfullsignificance-of-dimensionality 516
Signal amp Image Processing An International Journal (SIPIJ) Vol6 No3 June 2015
31
The main motivation of this work is to compare the dimension reduction techniques PCA andLDA to find out which of them selects the best features from the feature set to reduce the
dimensions of the dataset with minimal loss of information Principal Component Analysis
(PCA) is a mathematical tool used to extract principal components of original image data These
principal components may also be referred as Eigen images Linear Discriminant Analysis seeks
to reduce dimensionality while preserving as much of the class discriminatory information aspossible In LDA we compute eigenvectors from our dataset and collect them in scatter matrices
In Neural Network classifier back propagation algorithm is used for the classification of input
images into different categories Here neural network is trained using the reduced feature set
obtained from PCA or LDA in order to obtain better results
3 PROPOSED METHODOLOGY
31 Prepare input data
In this paper a general image database consisting of 500 images is used for testing the
comparative study of PCA and LDA Principal Component Analysis defines new attributes asmutually-orthogonal linear combinations of the original attributes Linear Discriminant Analysis
computes the linear discriminants that will represent the axes that maximize the separation
between multiple classes Further Neural network can be used to classify images into variousclasses by taking as input features extracted by PCA or LDA Back-propagation technique which
is a supervised method for learning is used for training the neural network about the reduced
feature set of images in the database
In order to obtain better search results and to express more image information we consider the
dominant color and texture features combined These low level features are extracted using color
moments color histogram color autocorrelogram and wavelet The basis of color moments is
that the distribution of color in an image can be considered as a probability distribution which can
be characterized by various moments [20] The color histogram for an image is constructed by
quantizing the colors within the image and counting the number of pixels of each color The color
correlogram was proposed to characterize not only the color distributions of pixels but also the
spatial correlation of pairs of colors Wavelet Analysis is a popular method for extracting texture
from an image The discreet wavelet transform (DWT) of a signal is calculated by passing it
through a series of filters (high and low pass filters) and then down-sampled [21]
311 Color Moments
The first order color moment(Mean) Second order color moment(Standard deviation) and the
third order color moment(Skewness) have been used for color feature extraction [20] Since only
9 (three moments for each of the three color components R G B) numbers are used to represent
the color content of each image color moments are a very compact representation compared to
other color features
= 1
= (1 (( minus ))
8202019 Significance of Dimensionality
httpslidepdfcomreaderfullsignificance-of-dimensionality 616
Signal amp Image Processing An International Journal (SIPIJ) Vol6 No3 June 2015
32
= (1 (( minus ))
Where Pij is the value of the i- the color channel of image pixel j and N is the number of pixels in
the image
When a query image is submitted for image retrieval its color moments are extracted and added
to feature set for matching the image with the images stored in the database The following are
the steps for extracting color moments from an image
1
Extract the values of each plane R G B corresponding to the image
2
Find the mean standard deviation and skewness of each plane
3
Convert to column vector output of the moments
The following table gives the color moments of 5 images where M corresponds to mean Std
corresponds to standard deviation Skew corresponds to Skewness and R for Red G for Green
and B for Blue plane respectively
Table 1 Color Moments Table
M(R) Std(R) Skew(R) M(G) Std(G) Skew(G) M(B) Std(B) Skew(B)
04372 03659 02132 01925 01821 03083 00014 00013 00009
04385 03409 02389 02018 01928 03131 00011 00015 00010
04351 03572 02582 02521 02349 03069 00019 00033 00030
05061 04364 02362 02355 02283 04019 00008 00015 00011
03765 04012 02818 02850 02844 03319 00054 00064 00046
312 Color Histogram
A histogram is a graph that represents all the colors and the level of their occurrence in an image
irrespective of the type of the image [8] This technique describes the proportion of pixels of each
color in an image It has been used as one of the feature extraction attributes with the advantage
like robustness with respect to geometric changes of the objects in the image The color
histogram is obtained by quantizing image colors into discrete levels and then counting the
number of times each discrete color occurs in the image In a CBIR system a query image is
compared with the histograms of all the images in database [22]
A color histogram H for a given image is defined as a vector [26]
H = H[1] H[2] H[i] H[N]
where i represent a color in the color histogram H[i] is the number of pixels in color i in that
image and N is the number of bins in the color histogram ie the number of colors in the
adopted color model
In order to compare images of different sizes color histograms should be normalized The
normalized color histogram H prime is defined as
= 0 1 991270
where 983112983145 = XY is the total number of pixels in an image
8202019 Significance of Dimensionality
httpslidepdfcomreaderfullsignificance-of-dimensionality 716
Signal amp Image Processing An International Journal (SIPIJ) Vol6 No3 June 2015
33
From the query image submitted for image retrieval its color histogram features are extractedand added to feature set for matching the image with database images The following steps give a
method to calculate color histogram
1
Convert the image from RGB color space to HSV color space
2
Define number of clusters for each HSV plane3
Find the maximum value of each plane
4 Cluster each values after normalisation
5
Add each color to any one of the appropriate cluster
6
Find the probabilistic values and convert the values to the column vector
313 Color autocorrelogram
A color correlogram is a table indexed by color pairs where the k-th entry for (i j) specifies the
probability of finding a pixel of color j at a distance k from a pixel of color i in the image [20]
Let I represent the entire set of image pixels and Ic(i) represent the set of pixels whose colors are
c(i)Then the color correlogram is defined as
()() = isin()isin 2 isin ()1 minus 2 = Where i j isin 1 2 hellip N k isin 1 2 hellip d and | p1 ndash p2 | is the distance between pixels p1 andp2
The color auto correlogram of the query image is extracted and added to feature vector for the
extraction of similar database images The following are the steps for extracting correlogram
features from an image
1 Reduce the number of colors in the RGB image
2
Correlate each pixel with the neighbourhood pixels for getting the correlogram vector
314 Texture
Like color the texture is a powerful low-level feature for image search and retrieval applicationsThe texture measures try to retrieve the image or image parts characteristics with reference to the
changes in certain directions and the scale of the images This is most useful for images with
homogeneous texture [3] Wavelet analysis is an exciting new method for solving difficult
problems in mathematics physics and engineering with modern applications as wave
propagation data compression signal processing image processing pattern recognition
computer graphics the detection of aircraft and submarines and other medical image technology
A wavelet is a mathematical function used to divide a given function into different frequency
components [21] A wavelet transform is the representation of a function by wavelets which
represent scaled and translated copies of a finite length or fast-decaying oscillating waveform
(known as the mother wavelet) The Wavelet transform of a function is the improved version of
Fourier transform Wavelet transforms have advantages over traditional Fourier transforms
because local features can be described better with wavelets that have local extent Some motherwavelet families implemented in Matlab are Daubechies Symlet Coiflet Biortogonal and
Reverse biorthogonal wavelets) and the fractional B-spline functions are used to compute
different feature vectors Orthogonal wavelets with FIR filters can be defined through a scaling
filter Predefined families of such wavelets include Haar Daubechies Symlets and Coiflets In
this paper Coiflet wavelet function is used to extract texture features The following steps give a
method to calculate Texture of an image
8202019 Significance of Dimensionality
httpslidepdfcomreaderfullsignificance-of-dimensionality 816
Signal amp Image Processing An International Journal (SIPIJ) Vol6 No3 June 2015
34
1 Convert the image to grayscale2
Find the 4 stage Coif wavelet coefficients
3
Find the mean and standard deviation of the above coefficients and output to a column
vector
The following table gives the 4 stage coiflet texture values of 5 images
Table 2 Coiflet Texture values Table
59048 26054 01637 00979
55827 29509 02472 00167
62997 37201 02554 00405
71697 36297 02840 00528
65487 43823 00779 02445
The following table gives the first 10 features of 5 images in the database before applying
dimension reduction algorithms
Table3 Table of features before Dimension Reduction1 2 3 4 5 6 7 8 9 10
04372 03659 02132 01925 01821 03083 00014 00013 00009 59048
04385 03409 02389 02018 01928 03131 00011 00015 00010 55827
04351 03572 02582 02521 02349 03069 00019 00033 00030 62997
05061 04364 02362 02355 02283 04019 00008 00015 00011 71697
03765 04012 02818 02850 02844 03319 00054 00064 00046 65487
32 Principal Component Analysis (PCA) Vs Linear Discriminant Analysis (LDA)
Principal Component Analysis is a technique which uses sophisticated underlying mathematical
principles to transform a number of possibly correlated variables into a smaller number of
variables called principal components [13] It is one of the most important results from appliedlinear algebra The advantage of PCA is finding the patterns in the data and compressing data by
reducing the number of dimensions without loss of information The mathematical concepts that
are used for PCA are Standard Deviation Variance Condashvariance and Eigenvectors [23] The
database images belonging to same category may differ in lighting conditions noise etc but are
not completely random and in spite of their differences there may present some patterns Such
patterns could be referred as principal components PCA is a mathematical tool used to extract
principal components of original image data These principal components may also be referred as
Eigen images [18] An important feature of PCA is that any original image from the image
database can be reconstructed by combining the eigen images The algorithm to calculate
Principal Components is as follows
1
Represent the image as one dimensional vector of size N x NSuppose we have M vectors of size N (= rows of image times columns of image)
representing a set of sampled images Then the training set becomes Γ1 Γ2 Γ3ΓM
2
The Mean value of the pixels intensities in each image is calculated and subtracted from
the corresponding image The process is continued for all images in the database
3 The covariance matrix which is of the order N2 x N2 is calculated as given by C = AAT
8202019 Significance of Dimensionality
httpslidepdfcomreaderfullsignificance-of-dimensionality 916
Signal amp Image Processing An International Journal (SIPIJ) Vol6 No3 June 2015
35
4 Find the Eigen values of the covariance matrix C by solving the equation (Cλ - I) = 0 Tofind the eigenvector X repeat the procedure where Xi indicates corresponding Eigen
values
5
The Eigen vectors are sorted according to the corresponding Eigen values in descending
order
6
Choose the First lsquoKrsquo Eigen vectors and Eigen Values
The following table gives the first 10 features of 5 images after applying the dimension reduction
algorithm PCA and reducing the feature database
Table 4 Table of features after Dimension Reduction
Linear Discriminant Analysis (LDA) [24] is most commonly used as dimensionality reduction
technique in the pre-processing step for pattern-classification and machine learning applications
The feature selection in traditional LDA [14] is obtained by maximizing the difference between
classes and minimizing the distance within classes LDA finds the vectors in the underlying space
that best discriminate among classes The prime difference between LDA and PCA is that PCA
does more of feature classification and LDA does data classification [4]
1 Compute the d -dimensional mean vectors for the different classes from the dataset2
Compute the scatter matrices (between-class and within-class scatter matrix)
3
Compute the eigenvectors (e1 e2 ed) and corresponding eigen values (λ 1 λ 2 λ d) for
the scatter matrices
4
Sort the eigenvectors by decreasing eigenvalues and choose k eigenvectors with the
largest eigenvalues to form a d timesk -dimensional matrix W (where every column represents
an eigenvector)
5
Use this d timesk eigenvector matrix to transform the samples onto the new subspace This
can be summarized by the mathematical equation y = WT times x (where x is a dtimes1-
dimensional vector representing one sample and y is the transformed ktimes1-dimensional
sample in the new subspace)
The performance comparison of PCA and LDA can also be done using neural networks by giving
the reduced feature set obtained using PCA or LDA as input to the neural network Neuralnetwork is a network of neuron like units called nodes [29] This neural computing technique is
used in fields of classification optimization control theory and for solving regression problemsThey are very effective in case of classification problems where detection and recognition of
target is required The architecture of neural network consists of a large number of nodes and
interconnection of nodes The individual inputs P1 P2hellip PR are weighted by correspondingelements W11 W12hellipW1R of the weight matrix W [20]
The neuron also has a bias lsquobrsquo which is summed with the weighted inputs to form the net input
lsquonrsquo
8202019 Significance of Dimensionality
httpslidepdfcomreaderfullsignificance-of-dimensionality 1016
Signal amp Image Processing An International Journal (SIPIJ) Vol6 No3 June 2015
36
n = W11 P1 + W12 P2 + hellip W1R PR + b
In matrix form this can be rewritten as
n = W P + b
Now the neuron output is given as
a = f (W P + b)
The transfer function used above is a log-sigmoid transfer function This transfer function takes
the input (which may have any value between plus and minus infinity) and squashes the output in
between 0 to 1 range according to the expression
y = 1 (1+e-n
)
The nodes at a particular stage constitute a layer The first layer is called input layer and last layer
is called output layer The layers in between output and input layer are called hidden layers Asthe number of hidden layers in the network increases the performance of network increases Each
node in a network serves the purpose of summation of all its inputs The output of a node is
further applied to the next node
In this paper Levenberg-Marquardt backpropagation algorithm (trainlm) is used for
classification Trainlm is a network training function that updates weight and bias values
according to Levenberg-Marquardt optimization Trainlm is often the fastest back propagation
algorithm in the matlab toolbox and is highly recommended as a first-choice supervised
algorithm The training process include creation configuring a three-layered neural network andmaking it learn about the extracted color and texture features of training set images Here we use
the reduced feature set obtained from PCA or LDA for the training of images The learning
process is carried out using backpropagation algorithm The training makes the network store thelearnt knowledge in its knowledge base This knowledge base is used in later phase in
comparison and decision making tasks by network
33 Similarity Matching
If R be the dimensionality reduced feature database and R is the feature vector obtained from
query image then the retrieval system is based on a similarity measure defined between R and
R [25] In this paper Euclidean distance is used to measure the similarity between the feature
vectors of reduced query image and reduced database images in the case of PCA and LDA In
the case of Neural Network based PCALDA the matching and decision making is done by the
neural network
34 Performance Evaluation
The performance of retrieval of the system can be measured in terms of its Recall and Precision
Recall measures the ability of the system to retrieve all the models that are relevant while
Precision measures the ability of the system to retrieve only the models that are relevant [20]
8202019 Significance of Dimensionality
httpslidepdfcomreaderfullsignificance-of-dimensionality 1116
Signal amp Image Processing An International Journal (SIPIJ) Vol6 No3 June 2015
37
=
=
The number of relevant items retrieved is the number of the returned images that are similar to
the query image in this case The total number of images retrieved is the total number of images
that are returned by the retrieval system In precision and recall crossover is the point on the
graph where the both precision and recall curves meet The higher the number of crossover points
better will be the performance of the system
4 COMPARATIVE STUDY OF PCA AND LDA
The proposed method has been implemented using Matlab 13 and tested on a general-purpose
database containing 500 images in JPG format of size 256X384 resized to 286x340 The
database includes 500 color images categorized into five classes and each class includes 100images as follows African people Beach Building Bus Dinosaurs The search is based on the
similarity of feature vectors We have followed the image retrieval technique as described in the
section 3 on different feature extraction schemes such as color and texture This scheme
calculated 110 features by means of histogram moments correlogram and Coif wavelet FurtherPrincipal Component Analysis technique and Linear Discriminant Analysis technique is used to
extract the best features from the images By means of PCA and LDA the feature set is reduced
to 75Then the reduced query image is compared with the reduced database feature set using
Euclidean Distance and the top 6 nearer images are displayed In neural network classifier based
PCA or LDA We used Levenberg-Marquardt backpropagation algorithm (trainlm) with 3 hiddenlayers for classification Here the network is trained about the reduced feature set (using PCA
LDA) of all the images from the training dataset A given query image is feature extracted and
searched for similar images For each query image relevant images are considered to be thosewhich belong to the same category as the query image The performance of the training process
can be analysed using the Precision Recall plot
The quality of the image retrieval with different feature extraction schemes has been evaluated
by randomly selecting query images of each category from test image database Each query
returns the top 6 images from database To measure retrieval effectiveness for the image retrieval
system Precision and Recall values are used The Precision Recall rates and plots for PCA LDA
Neural Network based PCA Neural Network based LDA and without dimension reduction
methods are shown in figure1 The graphical user interface for the retrieval of images using
dimension reduction with PCA LDA and Neural Network based PCA and Neural Network
based LDA are shown in the figure 2 figure3 and figure4 and figure5 respectively
From the GUI the database is to be selected first using Select Database button ie the database
of 500 images Then the query image is selected from a set of test images using Select Query
button The query can be processed under 5 options- without dimension reduction Dimension
Reduction using PCA and Dimension Reduction using LDA Neural Network based PCA and
Neural Network based LDA The images are retrieved based on the option selected and top 6
images are displayed in the Returned images frame The Precision-Recall Plot gives the Precision
and Recall rates of the selected option The Performance Comparison button shows the Precision-
8202019 Significance of Dimensionality
httpslidepdfcomreaderfullsignificance-of-dimensionality 1216
Signal amp Image Processing An International Journal (SIPIJ) Vol6 No3 June 2015
38
Recall plots of all the methods of the selected query image From the Table 5 of Precision andRecall it is found that the rates are higher for PCA when compared to LDA This shows that
PCA is a better dimension reduction tool when compared to the other methods
Table 5 Table of Precision Recall Rates
Figure1 Precision ndashRecall Plot
8202019 Significance of Dimensionality
httpslidepdfcomreaderfullsignificance-of-dimensionality 1316
Signal amp Image Processing An International Journal (SIPIJ) Vol6 No3 June 2015
39
Figure 2Dimension Reduction using PCA
Figure 3 Dimension Reduction using LDA
Figure 4 Neural Network Based PCA
8202019 Significance of Dimensionality
httpslidepdfcomreaderfullsignificance-of-dimensionality 1416
Signal amp Image Processing An International Journal (SIPIJ) Vol6 No3 June 2015
40
Figure 5 Neural Network Based LDA
5 CONCLUSION
In this paper we presented a comparative study of dimension reduction methods namely
Principal Component Analysis and Linear Discriminant Analysis Dimensionality reductionmethods aim at revealing meaningful structures and unexpected relationships in multivariate data
PCA projects correlated variables into a lower number of uncorrelated variables called principal
components By using only the first few principal components or eigen vectors PCA makes it
possible to reduce the number of significant dimensions of the data while maintaining the
maximum possible variance The objective of LDA is to perform dimensionality reduction whilepreserving as much of the class discriminatory information as possible In LDA we will compute
eigenvectors from our dataset and collect them in scatter-matrices the between-class scatter
matrix and within-class scatter matrix In Neural Network based PCALDA the network is
trained about the reduced feature set (using PCA or LDA) of all the images from the training
dataset The training algorithm used in this paper is Levenberg-Marquardt backpropagationalgorithm (trainlm) with 3 hidden layers From the Precision and Recall rates calculated in the
table in the above section it can be found that the rates are high for all the cases of PCA when
compared to the LDA Thus it is concluded that PCA tends to outperform LDA in almost all
cases and hence PCA can be adopted as an effective tool for dimension reduction
REFERENCES
[1] Rafael Gonzalez and Richard E Woods lsquoDigital Image processingrsquo Addison Wesley 2nd Edn
2002
[2] HH Pavan Kumar Bhuravarjula And VNS Vijaya Kumar(2012) lsquoA Novel Content Based Image
Retrieval Using Variance Color Momentrsquo Int J Of Computer And Electronics ResearchVol 1
Issue 3 ISSN 2278-5795 pp93-99
[3] Mohd Danish Ritika Rawat and Ratika Sharma(2013) lsquoA Survey Content Based Image Retrieval
Based On Color Texture Shape amp Neuro Fuzzyrsquo Int Journal Of Engineering Research And
Applications ISSN 2248-9622 Vol 3 Issue 5 Sep-Oct 2013 pp839-844
8202019 Significance of Dimensionality
httpslidepdfcomreaderfullsignificance-of-dimensionality 1516
Signal amp Image Processing An International Journal (SIPIJ) Vol6 No3 June 2015
41
[4] S Balakrishnama and A Ganapathiraju lsquoLinear Discriminant Analysis - A Brief Tutorialrsquo Institute
for Signal and Information Processing Department of Electrical and Computer Engineering
Mississippi State University
[5] Manimala Singha and K Hemachandran (2012) lsquoContent based image retrieval using color and
texturersquo Signal amp Image Processing An Int J (SIPIJ) Vol3 No1 pp39-57
[6] Pranali Prakash Lokhande and P A Tijare(2012) lsquoFeature Extraction Approach for Content BasedImage Retrievalrsquo IntJournal of Advanced Research in Computer Science and Software Engineering
Vol 2 Issue 2 ISSN 2277 128X
[7] S Mangijao Singh K Hemachandran (2012) ldquoContent-Based Image Retrieval using Color Moment
and Gabor Texture Featurerdquo IntJ of Computer Science IssuesVol 9 Issue 5 No 1 pp299-309
[8] ARamesh Kumar and DSaravanan rsquo Content Based Image Retrieval Using Color Histogramrsquo Int J
of Computer Science and Information Technologies Vol 4 (2) 2013 242 ndash 245 ISSN0975-9646
[9] Swati V Sakhare amp Vrushali G Nasre(2011) lsquoDesign of Feature Extraction in Content Based Image
Retrieval (CBIR) using Color and Texturersquo Int J of Computer Science amp Informatics Vol-I Issue-
II pp57-61
[10] Wasim Khan Shiv Kumar Neetesh Gupta and Nilofar Khan(2011) lsquoA Proposed Method for Image
Retrieval using Histogram values and Texture Descriptor Analysisrsquo Int Jof Soft Computing and
Engineering (IJSCE) ISSN 2231-2307 Vol-I Issue-II pp33-36
[11] SMeenachi Sundaresan and Dr KGSrinivasagan(2013) lsquoDesign of Image Retrieval Efficacy
System Based on CBIRrsquo Int J of Advanced Research in Computer Science and Software
Engineering Vol 3 Issue 4 ISSN 2277 128X pp48-53
[12] Tamer Mehyar Jalal Omer Atoum(2012) lsquoAn Enhancement on Content-Based Image Retrieval using
Color and Texture Featuresrsquo Journal of Emerging Trends in Computing and Information Sciences
Vol 3 No 4ISSN 2079-8407 pp488-496
[13] Pinderjeet Kaur (2012) lsquoImplementation of Principle Component Analysis with Fuzzy Annotation
for CAD Jewellery Imagesrsquo Int J of Emerging Trends amp Technology in Computer ScienceVol 1
Issue 4 ISSN 2278-6856
[14] Arunasakthi K and Kamatchipriya L(2014) lsquoA Review On Linear And Non-Linear Dimensionality
Reduction Techniquesrsquo Machine Learning And Applications An Int J (Mlaij) Vol1 No1 Pp65-
76
[15] Julie M David Kannan Balakrishnan (2014) Learning Disability Prediction Tool using ANN and
ANFIS International Journal of Soft Computing Springer Verlag Berlin Heidelberg ISSN 1432-
7643 (online) ISSN 1433-7479 (print) DOI 101007s00500-013-1129-0 Vol 18 Issue 6 pp 1093-1112
[16] Julie M David Kannan Balakrishnan (2012) Attribute Reduction and Missing Value Imputing with
ANN Prediction of Learning Disabilities International Journal of Neural Computing amp Applications
Springer-Verlag London Limited DOI 101007s00521-011-0619 Vol 21 Issue 7 pp 1757-1763
[17] Kresimir Delac Mislav Grgic and Sonja Grgic (2006) lsquoIndependent Comparative Study of PCA
ICA and LDA on the FERET Data Setrsquo Wiley Periodicals Inc
[18] Dr HBKekre Sudeep D Thepade and Akshay Maloo (2010) lsquoCBIR Feature Vector Dimension
Reduction with Eigenvectors of Covariance Matrix using Row Column and Diagonal Mean
Sequencesrsquo Int J of Computer Applications (0975 ndash 8887)Vol 3 No12
[19] Sebastian Raschka (2014) rsquoLinear Discriminant Analysis bit by bitrsquo
[20] Shereena VB and Julie M David (2014) lsquoContent Based Image Retrieval Classification Using
Neural Networksrsquo The Int J of Multimedia amp Its Applications (IJMA) Vol6 No5 DOI
105121ijma20146503 31[21] Anca Apatean Alexandrina Rogozan Simina Emerich Abdelaziz Bensrhair lsquoWavelets As Features
For Objects Recognitionrsquo
[22] Prof C S Gode Ms A N Ganar(2014) lsquoImage Retrieval by Using Color Texture and Shape
Featuresrsquo IntJournal of Advanced Research in ElectricalElectronics and Instrumentation
Engineering Vol 3 Issue 4 ISSN (Print) 2320 ndash 3765ISSN (Online) 2278 ndash 8875
8202019 Significance of Dimensionality
httpslidepdfcomreaderfullsignificance-of-dimensionality 1616
Signal amp Image Processing An International Journal (SIPIJ) Vol6 No3 June 2015
42
[23] Hamed Fadaei and Thotsapon Sortrakul(2014) lsquoContent-Based Image Retrieval System with
Combining Color features and Gradient featurersquo Int Conference on Advanced Computational
Technologies amp Creative Media
[24] G Sasikala R Kowsalya and Dr M Punithavalli (2010) lsquoA Comparative Study Of Dimension
Reduction Techniques For Content-Based Image Retrievalrsquo The Int J of Multimedia amp Its
Applications Vol2 No3 Doi 105121Ijma20102303 40[25] RPriya DrVasantha Kalyani David(2012) lsquoEnhanced Content Based Image Retrieval Using
Multiple Feature Fusion Algorithmsrsquo Int J of Scientific amp Engineering Research Vol 3 Issue 2
ISSN 2229-5518
[26] Shereena VB and Julie M David (2014) lsquoContent Based Image Retrieval A Reviewrsquo First
International Conference on Computer Science amp Information Technology COSIT 2014 AIRCC
Publishing Corporation Banglore
[27] Jack V Tu (1996) lsquoAdvantages and disadvantages of using artificial neural networks versus logistic
regression for predicting medical outcomesrsquo Journal of clinical Epidemiology Volume 49 Issue 11
Pages 1207-1325
[28] Aravind Nagathan Animozhi and Jithendra Mungara (2014) lsquoContent-Based Image Retrieval System
using Feed-Forward Backpropagation Neural NetworkrsquoIJCSNS International Journal of Computer
Science and Network Security Vol14 No6pp 70-77
[29] Mohandass Divya Jude Janet and Ramadass Suguna (2014) lsquoA genetic optimized neural network for
image retrieval in telemedicinersquo Divya et al EURASIP Journal on Image and Video Processing
[30] Shamla Mantri Nikhil S Tarale and Sudip C Mahajan(2011)rsquo Dimensionality Reduction technique
using Neural Networks ndash A Surveyrsquo(IJACSA) International Journal of Advanced Computer Science
and ApplicationsVol 2 No 4
AUTHORS
Shereena VBreceived her MCA degree from Bharathidasan University Trichy India
in 2000 During 2000-2004 she was with Mahatma Gandhi University Kottayam
India as Lecturer in the Department of Computer Applications Currently she is
working as Asst Professor in the Department of Computer Applications with MES
College Aluva Cochin India She has published papers in International Journals and
International and National Conference Proceedings Her research interests include Data
Mining Machine Learning and Image Processing
Dr Julie M David completed her Masters Degree in Computer Applications and
Masters of Philosophy in Computer Science in the years 2000 and 2009 in Bharathiyar
University Coimbatore India and in Vinayaka Missions University Salem India
respectively She has also completed her Doctorate in the research area of Artificial
Intelligence from Cochin University of Science and Technology Cochin India in 2013
During 2000-2007 she was with Mahatma Gandhi University Kottayam India as
Lecturer in the Department of Computer Applications Currently she is working as an
Assistant Professor in the Department of Computer Applications with MES College
Aluva Cochin India She has published several papers in International Journals and
International and National Conference Proceedings Her research interests include Artificial Intelligence
Data Mining and Machine Learning She is a life member of International Association of Engineers
IAENG Societies of Artificial Intelligence amp Data Mining Computer Society of India etc and a Reviewerof Elsevier International Journal of Knowledge Based Systems Also she is an Editorial Board Member of
various other International Journals She has coordinated various International and National Conferences
8202019 Significance of Dimensionality
httpslidepdfcomreaderfullsignificance-of-dimensionality 416
Signal amp Image Processing An International Journal (SIPIJ) Vol6 No3 June 2015
30
Content-Based Image Retrieval using Color and Texture Featuresrdquo [12] Tamer Mehyar JalalOmer Atoum proposed an enhancement on the use of color and texture visual features in Content-
Based Image Retrieval (CBIR) by adding a new color feature called Average Color Dominance
which tries to enhance color description using the dominant colors of an image
In the paper ldquoImplementation of Principal Component Analysis with Fuzzy Annotation for CADJewellery Imagesrdquo Pinderjeet Kaur [13] proposed that Principal Component Analysis (PCA) can
be used for dimension reduction to reduce the computation cost for the system of Content Based
Image Retrieval (CBIR) Arunasakthi K KamatchiPriya L [14] stated in their paper ldquoA Review
On Linear And Non-Linear Dimensionality Reduction Techniquesrdquo that Principal Component
Analysis (PCA) and Linear Discriminant Analysis (LDA) are regarded as the most fundamental
and powerful tools of dimensionality reduction for extracting effective features of high-
dimensional vectors in input data According to Julie M David and Kannan Balakrishanan
principal components are new set of variables which are generated by the application of
dimensionality reduction method [15] The basic procedures behind PCA are (i) the inputs data
are normalized so that each attribute falls within the same range This helps ensure that attributes
with large domains will not dominate attributes with smaller domains (ii) PCA computes k
orthonormal vectors that provides a basis for the normalized input data These are unit vectorsthat each point in a direction perpendicular to the others These vectors are referred to as the
principal components and (iii) The principal components are sorted in order of decreasing
strength [16]
Kresimir Delac Mislav Grgic and Sonja Grgic [17] in their paper ldquoIndependent Comparative
Study of PCA ICA and LDA on the FERET Data Setrdquo proposed that PCA finds a set of the most
representative projection vectors such that the projected samples retain most information about
original samples whereas LDA uses the class information and finds a set of vectors that maximize
the between-class scatter while minimizing the within-class scatter In the paper ldquoCBIR FeatureVector Dimension Reduction with Eigenvectors of Covariance Matrix using Row Column and
Diagonal Mean Sequencesrdquo [18] Dr HB Kekre Sudeep D Thepade and Akshay Maloo stated
that PCA can be used to transform each original image from database into its corresponding eigenimage
In the paper ldquoLinear Discriminant Analysis bit by bitrdquo Sebastian Raschka [19] stated that PCA
can be described as an unsupervised algorithm since it ignores class labels and its goal is to find
the directions (the so-called principal components) that maximize the variance in a dataset In
contrast to PCA LDA is supervised and computes the linear discriminants that will represent the
axes that maximize the separation between multiple classes
According to Aravind Nagathan Animozhi and Jithendra Mungara [28] the use of feed-forward
neural network has considerably improved the recall rate and also retrieval time due to its highly
efficient and accurate classification capability In their paper lsquoA genetic optimized neural
network for image retrieval in telemedicinersquo Mohandass Divya Jude Janet and RamadassSuguna [29] stated that the proposed method efficiently extracts features and retrieves relevant
images from compressed images Shamla Mantri Nikhil S Tarale and Sudip C Mahajan in their
paper rsquo Dimensionality Reduction technique using Neural Networks ndash A Surveyrsquo [30] different
dimensionality reduction techniques such as Principal component analysis Independent
component analysis and Self-Organizing Map are selected and applied in order to reduce the loss
of classification performance
8202019 Significance of Dimensionality
httpslidepdfcomreaderfullsignificance-of-dimensionality 516
Signal amp Image Processing An International Journal (SIPIJ) Vol6 No3 June 2015
31
The main motivation of this work is to compare the dimension reduction techniques PCA andLDA to find out which of them selects the best features from the feature set to reduce the
dimensions of the dataset with minimal loss of information Principal Component Analysis
(PCA) is a mathematical tool used to extract principal components of original image data These
principal components may also be referred as Eigen images Linear Discriminant Analysis seeks
to reduce dimensionality while preserving as much of the class discriminatory information aspossible In LDA we compute eigenvectors from our dataset and collect them in scatter matrices
In Neural Network classifier back propagation algorithm is used for the classification of input
images into different categories Here neural network is trained using the reduced feature set
obtained from PCA or LDA in order to obtain better results
3 PROPOSED METHODOLOGY
31 Prepare input data
In this paper a general image database consisting of 500 images is used for testing the
comparative study of PCA and LDA Principal Component Analysis defines new attributes asmutually-orthogonal linear combinations of the original attributes Linear Discriminant Analysis
computes the linear discriminants that will represent the axes that maximize the separation
between multiple classes Further Neural network can be used to classify images into variousclasses by taking as input features extracted by PCA or LDA Back-propagation technique which
is a supervised method for learning is used for training the neural network about the reduced
feature set of images in the database
In order to obtain better search results and to express more image information we consider the
dominant color and texture features combined These low level features are extracted using color
moments color histogram color autocorrelogram and wavelet The basis of color moments is
that the distribution of color in an image can be considered as a probability distribution which can
be characterized by various moments [20] The color histogram for an image is constructed by
quantizing the colors within the image and counting the number of pixels of each color The color
correlogram was proposed to characterize not only the color distributions of pixels but also the
spatial correlation of pairs of colors Wavelet Analysis is a popular method for extracting texture
from an image The discreet wavelet transform (DWT) of a signal is calculated by passing it
through a series of filters (high and low pass filters) and then down-sampled [21]
311 Color Moments
The first order color moment(Mean) Second order color moment(Standard deviation) and the
third order color moment(Skewness) have been used for color feature extraction [20] Since only
9 (three moments for each of the three color components R G B) numbers are used to represent
the color content of each image color moments are a very compact representation compared to
other color features
= 1
= (1 (( minus ))
8202019 Significance of Dimensionality
httpslidepdfcomreaderfullsignificance-of-dimensionality 616
Signal amp Image Processing An International Journal (SIPIJ) Vol6 No3 June 2015
32
= (1 (( minus ))
Where Pij is the value of the i- the color channel of image pixel j and N is the number of pixels in
the image
When a query image is submitted for image retrieval its color moments are extracted and added
to feature set for matching the image with the images stored in the database The following are
the steps for extracting color moments from an image
1
Extract the values of each plane R G B corresponding to the image
2
Find the mean standard deviation and skewness of each plane
3
Convert to column vector output of the moments
The following table gives the color moments of 5 images where M corresponds to mean Std
corresponds to standard deviation Skew corresponds to Skewness and R for Red G for Green
and B for Blue plane respectively
Table 1 Color Moments Table
M(R) Std(R) Skew(R) M(G) Std(G) Skew(G) M(B) Std(B) Skew(B)
04372 03659 02132 01925 01821 03083 00014 00013 00009
04385 03409 02389 02018 01928 03131 00011 00015 00010
04351 03572 02582 02521 02349 03069 00019 00033 00030
05061 04364 02362 02355 02283 04019 00008 00015 00011
03765 04012 02818 02850 02844 03319 00054 00064 00046
312 Color Histogram
A histogram is a graph that represents all the colors and the level of their occurrence in an image
irrespective of the type of the image [8] This technique describes the proportion of pixels of each
color in an image It has been used as one of the feature extraction attributes with the advantage
like robustness with respect to geometric changes of the objects in the image The color
histogram is obtained by quantizing image colors into discrete levels and then counting the
number of times each discrete color occurs in the image In a CBIR system a query image is
compared with the histograms of all the images in database [22]
A color histogram H for a given image is defined as a vector [26]
H = H[1] H[2] H[i] H[N]
where i represent a color in the color histogram H[i] is the number of pixels in color i in that
image and N is the number of bins in the color histogram ie the number of colors in the
adopted color model
In order to compare images of different sizes color histograms should be normalized The
normalized color histogram H prime is defined as
= 0 1 991270
where 983112983145 = XY is the total number of pixels in an image
8202019 Significance of Dimensionality
httpslidepdfcomreaderfullsignificance-of-dimensionality 716
Signal amp Image Processing An International Journal (SIPIJ) Vol6 No3 June 2015
33
From the query image submitted for image retrieval its color histogram features are extractedand added to feature set for matching the image with database images The following steps give a
method to calculate color histogram
1
Convert the image from RGB color space to HSV color space
2
Define number of clusters for each HSV plane3
Find the maximum value of each plane
4 Cluster each values after normalisation
5
Add each color to any one of the appropriate cluster
6
Find the probabilistic values and convert the values to the column vector
313 Color autocorrelogram
A color correlogram is a table indexed by color pairs where the k-th entry for (i j) specifies the
probability of finding a pixel of color j at a distance k from a pixel of color i in the image [20]
Let I represent the entire set of image pixels and Ic(i) represent the set of pixels whose colors are
c(i)Then the color correlogram is defined as
()() = isin()isin 2 isin ()1 minus 2 = Where i j isin 1 2 hellip N k isin 1 2 hellip d and | p1 ndash p2 | is the distance between pixels p1 andp2
The color auto correlogram of the query image is extracted and added to feature vector for the
extraction of similar database images The following are the steps for extracting correlogram
features from an image
1 Reduce the number of colors in the RGB image
2
Correlate each pixel with the neighbourhood pixels for getting the correlogram vector
314 Texture
Like color the texture is a powerful low-level feature for image search and retrieval applicationsThe texture measures try to retrieve the image or image parts characteristics with reference to the
changes in certain directions and the scale of the images This is most useful for images with
homogeneous texture [3] Wavelet analysis is an exciting new method for solving difficult
problems in mathematics physics and engineering with modern applications as wave
propagation data compression signal processing image processing pattern recognition
computer graphics the detection of aircraft and submarines and other medical image technology
A wavelet is a mathematical function used to divide a given function into different frequency
components [21] A wavelet transform is the representation of a function by wavelets which
represent scaled and translated copies of a finite length or fast-decaying oscillating waveform
(known as the mother wavelet) The Wavelet transform of a function is the improved version of
Fourier transform Wavelet transforms have advantages over traditional Fourier transforms
because local features can be described better with wavelets that have local extent Some motherwavelet families implemented in Matlab are Daubechies Symlet Coiflet Biortogonal and
Reverse biorthogonal wavelets) and the fractional B-spline functions are used to compute
different feature vectors Orthogonal wavelets with FIR filters can be defined through a scaling
filter Predefined families of such wavelets include Haar Daubechies Symlets and Coiflets In
this paper Coiflet wavelet function is used to extract texture features The following steps give a
method to calculate Texture of an image
8202019 Significance of Dimensionality
httpslidepdfcomreaderfullsignificance-of-dimensionality 816
Signal amp Image Processing An International Journal (SIPIJ) Vol6 No3 June 2015
34
1 Convert the image to grayscale2
Find the 4 stage Coif wavelet coefficients
3
Find the mean and standard deviation of the above coefficients and output to a column
vector
The following table gives the 4 stage coiflet texture values of 5 images
Table 2 Coiflet Texture values Table
59048 26054 01637 00979
55827 29509 02472 00167
62997 37201 02554 00405
71697 36297 02840 00528
65487 43823 00779 02445
The following table gives the first 10 features of 5 images in the database before applying
dimension reduction algorithms
Table3 Table of features before Dimension Reduction1 2 3 4 5 6 7 8 9 10
04372 03659 02132 01925 01821 03083 00014 00013 00009 59048
04385 03409 02389 02018 01928 03131 00011 00015 00010 55827
04351 03572 02582 02521 02349 03069 00019 00033 00030 62997
05061 04364 02362 02355 02283 04019 00008 00015 00011 71697
03765 04012 02818 02850 02844 03319 00054 00064 00046 65487
32 Principal Component Analysis (PCA) Vs Linear Discriminant Analysis (LDA)
Principal Component Analysis is a technique which uses sophisticated underlying mathematical
principles to transform a number of possibly correlated variables into a smaller number of
variables called principal components [13] It is one of the most important results from appliedlinear algebra The advantage of PCA is finding the patterns in the data and compressing data by
reducing the number of dimensions without loss of information The mathematical concepts that
are used for PCA are Standard Deviation Variance Condashvariance and Eigenvectors [23] The
database images belonging to same category may differ in lighting conditions noise etc but are
not completely random and in spite of their differences there may present some patterns Such
patterns could be referred as principal components PCA is a mathematical tool used to extract
principal components of original image data These principal components may also be referred as
Eigen images [18] An important feature of PCA is that any original image from the image
database can be reconstructed by combining the eigen images The algorithm to calculate
Principal Components is as follows
1
Represent the image as one dimensional vector of size N x NSuppose we have M vectors of size N (= rows of image times columns of image)
representing a set of sampled images Then the training set becomes Γ1 Γ2 Γ3ΓM
2
The Mean value of the pixels intensities in each image is calculated and subtracted from
the corresponding image The process is continued for all images in the database
3 The covariance matrix which is of the order N2 x N2 is calculated as given by C = AAT
8202019 Significance of Dimensionality
httpslidepdfcomreaderfullsignificance-of-dimensionality 916
Signal amp Image Processing An International Journal (SIPIJ) Vol6 No3 June 2015
35
4 Find the Eigen values of the covariance matrix C by solving the equation (Cλ - I) = 0 Tofind the eigenvector X repeat the procedure where Xi indicates corresponding Eigen
values
5
The Eigen vectors are sorted according to the corresponding Eigen values in descending
order
6
Choose the First lsquoKrsquo Eigen vectors and Eigen Values
The following table gives the first 10 features of 5 images after applying the dimension reduction
algorithm PCA and reducing the feature database
Table 4 Table of features after Dimension Reduction
Linear Discriminant Analysis (LDA) [24] is most commonly used as dimensionality reduction
technique in the pre-processing step for pattern-classification and machine learning applications
The feature selection in traditional LDA [14] is obtained by maximizing the difference between
classes and minimizing the distance within classes LDA finds the vectors in the underlying space
that best discriminate among classes The prime difference between LDA and PCA is that PCA
does more of feature classification and LDA does data classification [4]
1 Compute the d -dimensional mean vectors for the different classes from the dataset2
Compute the scatter matrices (between-class and within-class scatter matrix)
3
Compute the eigenvectors (e1 e2 ed) and corresponding eigen values (λ 1 λ 2 λ d) for
the scatter matrices
4
Sort the eigenvectors by decreasing eigenvalues and choose k eigenvectors with the
largest eigenvalues to form a d timesk -dimensional matrix W (where every column represents
an eigenvector)
5
Use this d timesk eigenvector matrix to transform the samples onto the new subspace This
can be summarized by the mathematical equation y = WT times x (where x is a dtimes1-
dimensional vector representing one sample and y is the transformed ktimes1-dimensional
sample in the new subspace)
The performance comparison of PCA and LDA can also be done using neural networks by giving
the reduced feature set obtained using PCA or LDA as input to the neural network Neuralnetwork is a network of neuron like units called nodes [29] This neural computing technique is
used in fields of classification optimization control theory and for solving regression problemsThey are very effective in case of classification problems where detection and recognition of
target is required The architecture of neural network consists of a large number of nodes and
interconnection of nodes The individual inputs P1 P2hellip PR are weighted by correspondingelements W11 W12hellipW1R of the weight matrix W [20]
The neuron also has a bias lsquobrsquo which is summed with the weighted inputs to form the net input
lsquonrsquo
8202019 Significance of Dimensionality
httpslidepdfcomreaderfullsignificance-of-dimensionality 1016
Signal amp Image Processing An International Journal (SIPIJ) Vol6 No3 June 2015
36
n = W11 P1 + W12 P2 + hellip W1R PR + b
In matrix form this can be rewritten as
n = W P + b
Now the neuron output is given as
a = f (W P + b)
The transfer function used above is a log-sigmoid transfer function This transfer function takes
the input (which may have any value between plus and minus infinity) and squashes the output in
between 0 to 1 range according to the expression
y = 1 (1+e-n
)
The nodes at a particular stage constitute a layer The first layer is called input layer and last layer
is called output layer The layers in between output and input layer are called hidden layers Asthe number of hidden layers in the network increases the performance of network increases Each
node in a network serves the purpose of summation of all its inputs The output of a node is
further applied to the next node
In this paper Levenberg-Marquardt backpropagation algorithm (trainlm) is used for
classification Trainlm is a network training function that updates weight and bias values
according to Levenberg-Marquardt optimization Trainlm is often the fastest back propagation
algorithm in the matlab toolbox and is highly recommended as a first-choice supervised
algorithm The training process include creation configuring a three-layered neural network andmaking it learn about the extracted color and texture features of training set images Here we use
the reduced feature set obtained from PCA or LDA for the training of images The learning
process is carried out using backpropagation algorithm The training makes the network store thelearnt knowledge in its knowledge base This knowledge base is used in later phase in
comparison and decision making tasks by network
33 Similarity Matching
If R be the dimensionality reduced feature database and R is the feature vector obtained from
query image then the retrieval system is based on a similarity measure defined between R and
R [25] In this paper Euclidean distance is used to measure the similarity between the feature
vectors of reduced query image and reduced database images in the case of PCA and LDA In
the case of Neural Network based PCALDA the matching and decision making is done by the
neural network
34 Performance Evaluation
The performance of retrieval of the system can be measured in terms of its Recall and Precision
Recall measures the ability of the system to retrieve all the models that are relevant while
Precision measures the ability of the system to retrieve only the models that are relevant [20]
8202019 Significance of Dimensionality
httpslidepdfcomreaderfullsignificance-of-dimensionality 1116
Signal amp Image Processing An International Journal (SIPIJ) Vol6 No3 June 2015
37
=
=
The number of relevant items retrieved is the number of the returned images that are similar to
the query image in this case The total number of images retrieved is the total number of images
that are returned by the retrieval system In precision and recall crossover is the point on the
graph where the both precision and recall curves meet The higher the number of crossover points
better will be the performance of the system
4 COMPARATIVE STUDY OF PCA AND LDA
The proposed method has been implemented using Matlab 13 and tested on a general-purpose
database containing 500 images in JPG format of size 256X384 resized to 286x340 The
database includes 500 color images categorized into five classes and each class includes 100images as follows African people Beach Building Bus Dinosaurs The search is based on the
similarity of feature vectors We have followed the image retrieval technique as described in the
section 3 on different feature extraction schemes such as color and texture This scheme
calculated 110 features by means of histogram moments correlogram and Coif wavelet FurtherPrincipal Component Analysis technique and Linear Discriminant Analysis technique is used to
extract the best features from the images By means of PCA and LDA the feature set is reduced
to 75Then the reduced query image is compared with the reduced database feature set using
Euclidean Distance and the top 6 nearer images are displayed In neural network classifier based
PCA or LDA We used Levenberg-Marquardt backpropagation algorithm (trainlm) with 3 hiddenlayers for classification Here the network is trained about the reduced feature set (using PCA
LDA) of all the images from the training dataset A given query image is feature extracted and
searched for similar images For each query image relevant images are considered to be thosewhich belong to the same category as the query image The performance of the training process
can be analysed using the Precision Recall plot
The quality of the image retrieval with different feature extraction schemes has been evaluated
by randomly selecting query images of each category from test image database Each query
returns the top 6 images from database To measure retrieval effectiveness for the image retrieval
system Precision and Recall values are used The Precision Recall rates and plots for PCA LDA
Neural Network based PCA Neural Network based LDA and without dimension reduction
methods are shown in figure1 The graphical user interface for the retrieval of images using
dimension reduction with PCA LDA and Neural Network based PCA and Neural Network
based LDA are shown in the figure 2 figure3 and figure4 and figure5 respectively
From the GUI the database is to be selected first using Select Database button ie the database
of 500 images Then the query image is selected from a set of test images using Select Query
button The query can be processed under 5 options- without dimension reduction Dimension
Reduction using PCA and Dimension Reduction using LDA Neural Network based PCA and
Neural Network based LDA The images are retrieved based on the option selected and top 6
images are displayed in the Returned images frame The Precision-Recall Plot gives the Precision
and Recall rates of the selected option The Performance Comparison button shows the Precision-
8202019 Significance of Dimensionality
httpslidepdfcomreaderfullsignificance-of-dimensionality 1216
Signal amp Image Processing An International Journal (SIPIJ) Vol6 No3 June 2015
38
Recall plots of all the methods of the selected query image From the Table 5 of Precision andRecall it is found that the rates are higher for PCA when compared to LDA This shows that
PCA is a better dimension reduction tool when compared to the other methods
Table 5 Table of Precision Recall Rates
Figure1 Precision ndashRecall Plot
8202019 Significance of Dimensionality
httpslidepdfcomreaderfullsignificance-of-dimensionality 1316
Signal amp Image Processing An International Journal (SIPIJ) Vol6 No3 June 2015
39
Figure 2Dimension Reduction using PCA
Figure 3 Dimension Reduction using LDA
Figure 4 Neural Network Based PCA
8202019 Significance of Dimensionality
httpslidepdfcomreaderfullsignificance-of-dimensionality 1416
Signal amp Image Processing An International Journal (SIPIJ) Vol6 No3 June 2015
40
Figure 5 Neural Network Based LDA
5 CONCLUSION
In this paper we presented a comparative study of dimension reduction methods namely
Principal Component Analysis and Linear Discriminant Analysis Dimensionality reductionmethods aim at revealing meaningful structures and unexpected relationships in multivariate data
PCA projects correlated variables into a lower number of uncorrelated variables called principal
components By using only the first few principal components or eigen vectors PCA makes it
possible to reduce the number of significant dimensions of the data while maintaining the
maximum possible variance The objective of LDA is to perform dimensionality reduction whilepreserving as much of the class discriminatory information as possible In LDA we will compute
eigenvectors from our dataset and collect them in scatter-matrices the between-class scatter
matrix and within-class scatter matrix In Neural Network based PCALDA the network is
trained about the reduced feature set (using PCA or LDA) of all the images from the training
dataset The training algorithm used in this paper is Levenberg-Marquardt backpropagationalgorithm (trainlm) with 3 hidden layers From the Precision and Recall rates calculated in the
table in the above section it can be found that the rates are high for all the cases of PCA when
compared to the LDA Thus it is concluded that PCA tends to outperform LDA in almost all
cases and hence PCA can be adopted as an effective tool for dimension reduction
REFERENCES
[1] Rafael Gonzalez and Richard E Woods lsquoDigital Image processingrsquo Addison Wesley 2nd Edn
2002
[2] HH Pavan Kumar Bhuravarjula And VNS Vijaya Kumar(2012) lsquoA Novel Content Based Image
Retrieval Using Variance Color Momentrsquo Int J Of Computer And Electronics ResearchVol 1
Issue 3 ISSN 2278-5795 pp93-99
[3] Mohd Danish Ritika Rawat and Ratika Sharma(2013) lsquoA Survey Content Based Image Retrieval
Based On Color Texture Shape amp Neuro Fuzzyrsquo Int Journal Of Engineering Research And
Applications ISSN 2248-9622 Vol 3 Issue 5 Sep-Oct 2013 pp839-844
8202019 Significance of Dimensionality
httpslidepdfcomreaderfullsignificance-of-dimensionality 1516
Signal amp Image Processing An International Journal (SIPIJ) Vol6 No3 June 2015
41
[4] S Balakrishnama and A Ganapathiraju lsquoLinear Discriminant Analysis - A Brief Tutorialrsquo Institute
for Signal and Information Processing Department of Electrical and Computer Engineering
Mississippi State University
[5] Manimala Singha and K Hemachandran (2012) lsquoContent based image retrieval using color and
texturersquo Signal amp Image Processing An Int J (SIPIJ) Vol3 No1 pp39-57
[6] Pranali Prakash Lokhande and P A Tijare(2012) lsquoFeature Extraction Approach for Content BasedImage Retrievalrsquo IntJournal of Advanced Research in Computer Science and Software Engineering
Vol 2 Issue 2 ISSN 2277 128X
[7] S Mangijao Singh K Hemachandran (2012) ldquoContent-Based Image Retrieval using Color Moment
and Gabor Texture Featurerdquo IntJ of Computer Science IssuesVol 9 Issue 5 No 1 pp299-309
[8] ARamesh Kumar and DSaravanan rsquo Content Based Image Retrieval Using Color Histogramrsquo Int J
of Computer Science and Information Technologies Vol 4 (2) 2013 242 ndash 245 ISSN0975-9646
[9] Swati V Sakhare amp Vrushali G Nasre(2011) lsquoDesign of Feature Extraction in Content Based Image
Retrieval (CBIR) using Color and Texturersquo Int J of Computer Science amp Informatics Vol-I Issue-
II pp57-61
[10] Wasim Khan Shiv Kumar Neetesh Gupta and Nilofar Khan(2011) lsquoA Proposed Method for Image
Retrieval using Histogram values and Texture Descriptor Analysisrsquo Int Jof Soft Computing and
Engineering (IJSCE) ISSN 2231-2307 Vol-I Issue-II pp33-36
[11] SMeenachi Sundaresan and Dr KGSrinivasagan(2013) lsquoDesign of Image Retrieval Efficacy
System Based on CBIRrsquo Int J of Advanced Research in Computer Science and Software
Engineering Vol 3 Issue 4 ISSN 2277 128X pp48-53
[12] Tamer Mehyar Jalal Omer Atoum(2012) lsquoAn Enhancement on Content-Based Image Retrieval using
Color and Texture Featuresrsquo Journal of Emerging Trends in Computing and Information Sciences
Vol 3 No 4ISSN 2079-8407 pp488-496
[13] Pinderjeet Kaur (2012) lsquoImplementation of Principle Component Analysis with Fuzzy Annotation
for CAD Jewellery Imagesrsquo Int J of Emerging Trends amp Technology in Computer ScienceVol 1
Issue 4 ISSN 2278-6856
[14] Arunasakthi K and Kamatchipriya L(2014) lsquoA Review On Linear And Non-Linear Dimensionality
Reduction Techniquesrsquo Machine Learning And Applications An Int J (Mlaij) Vol1 No1 Pp65-
76
[15] Julie M David Kannan Balakrishnan (2014) Learning Disability Prediction Tool using ANN and
ANFIS International Journal of Soft Computing Springer Verlag Berlin Heidelberg ISSN 1432-
7643 (online) ISSN 1433-7479 (print) DOI 101007s00500-013-1129-0 Vol 18 Issue 6 pp 1093-1112
[16] Julie M David Kannan Balakrishnan (2012) Attribute Reduction and Missing Value Imputing with
ANN Prediction of Learning Disabilities International Journal of Neural Computing amp Applications
Springer-Verlag London Limited DOI 101007s00521-011-0619 Vol 21 Issue 7 pp 1757-1763
[17] Kresimir Delac Mislav Grgic and Sonja Grgic (2006) lsquoIndependent Comparative Study of PCA
ICA and LDA on the FERET Data Setrsquo Wiley Periodicals Inc
[18] Dr HBKekre Sudeep D Thepade and Akshay Maloo (2010) lsquoCBIR Feature Vector Dimension
Reduction with Eigenvectors of Covariance Matrix using Row Column and Diagonal Mean
Sequencesrsquo Int J of Computer Applications (0975 ndash 8887)Vol 3 No12
[19] Sebastian Raschka (2014) rsquoLinear Discriminant Analysis bit by bitrsquo
[20] Shereena VB and Julie M David (2014) lsquoContent Based Image Retrieval Classification Using
Neural Networksrsquo The Int J of Multimedia amp Its Applications (IJMA) Vol6 No5 DOI
105121ijma20146503 31[21] Anca Apatean Alexandrina Rogozan Simina Emerich Abdelaziz Bensrhair lsquoWavelets As Features
For Objects Recognitionrsquo
[22] Prof C S Gode Ms A N Ganar(2014) lsquoImage Retrieval by Using Color Texture and Shape
Featuresrsquo IntJournal of Advanced Research in ElectricalElectronics and Instrumentation
Engineering Vol 3 Issue 4 ISSN (Print) 2320 ndash 3765ISSN (Online) 2278 ndash 8875
8202019 Significance of Dimensionality
httpslidepdfcomreaderfullsignificance-of-dimensionality 1616
Signal amp Image Processing An International Journal (SIPIJ) Vol6 No3 June 2015
42
[23] Hamed Fadaei and Thotsapon Sortrakul(2014) lsquoContent-Based Image Retrieval System with
Combining Color features and Gradient featurersquo Int Conference on Advanced Computational
Technologies amp Creative Media
[24] G Sasikala R Kowsalya and Dr M Punithavalli (2010) lsquoA Comparative Study Of Dimension
Reduction Techniques For Content-Based Image Retrievalrsquo The Int J of Multimedia amp Its
Applications Vol2 No3 Doi 105121Ijma20102303 40[25] RPriya DrVasantha Kalyani David(2012) lsquoEnhanced Content Based Image Retrieval Using
Multiple Feature Fusion Algorithmsrsquo Int J of Scientific amp Engineering Research Vol 3 Issue 2
ISSN 2229-5518
[26] Shereena VB and Julie M David (2014) lsquoContent Based Image Retrieval A Reviewrsquo First
International Conference on Computer Science amp Information Technology COSIT 2014 AIRCC
Publishing Corporation Banglore
[27] Jack V Tu (1996) lsquoAdvantages and disadvantages of using artificial neural networks versus logistic
regression for predicting medical outcomesrsquo Journal of clinical Epidemiology Volume 49 Issue 11
Pages 1207-1325
[28] Aravind Nagathan Animozhi and Jithendra Mungara (2014) lsquoContent-Based Image Retrieval System
using Feed-Forward Backpropagation Neural NetworkrsquoIJCSNS International Journal of Computer
Science and Network Security Vol14 No6pp 70-77
[29] Mohandass Divya Jude Janet and Ramadass Suguna (2014) lsquoA genetic optimized neural network for
image retrieval in telemedicinersquo Divya et al EURASIP Journal on Image and Video Processing
[30] Shamla Mantri Nikhil S Tarale and Sudip C Mahajan(2011)rsquo Dimensionality Reduction technique
using Neural Networks ndash A Surveyrsquo(IJACSA) International Journal of Advanced Computer Science
and ApplicationsVol 2 No 4
AUTHORS
Shereena VBreceived her MCA degree from Bharathidasan University Trichy India
in 2000 During 2000-2004 she was with Mahatma Gandhi University Kottayam
India as Lecturer in the Department of Computer Applications Currently she is
working as Asst Professor in the Department of Computer Applications with MES
College Aluva Cochin India She has published papers in International Journals and
International and National Conference Proceedings Her research interests include Data
Mining Machine Learning and Image Processing
Dr Julie M David completed her Masters Degree in Computer Applications and
Masters of Philosophy in Computer Science in the years 2000 and 2009 in Bharathiyar
University Coimbatore India and in Vinayaka Missions University Salem India
respectively She has also completed her Doctorate in the research area of Artificial
Intelligence from Cochin University of Science and Technology Cochin India in 2013
During 2000-2007 she was with Mahatma Gandhi University Kottayam India as
Lecturer in the Department of Computer Applications Currently she is working as an
Assistant Professor in the Department of Computer Applications with MES College
Aluva Cochin India She has published several papers in International Journals and
International and National Conference Proceedings Her research interests include Artificial Intelligence
Data Mining and Machine Learning She is a life member of International Association of Engineers
IAENG Societies of Artificial Intelligence amp Data Mining Computer Society of India etc and a Reviewerof Elsevier International Journal of Knowledge Based Systems Also she is an Editorial Board Member of
various other International Journals She has coordinated various International and National Conferences
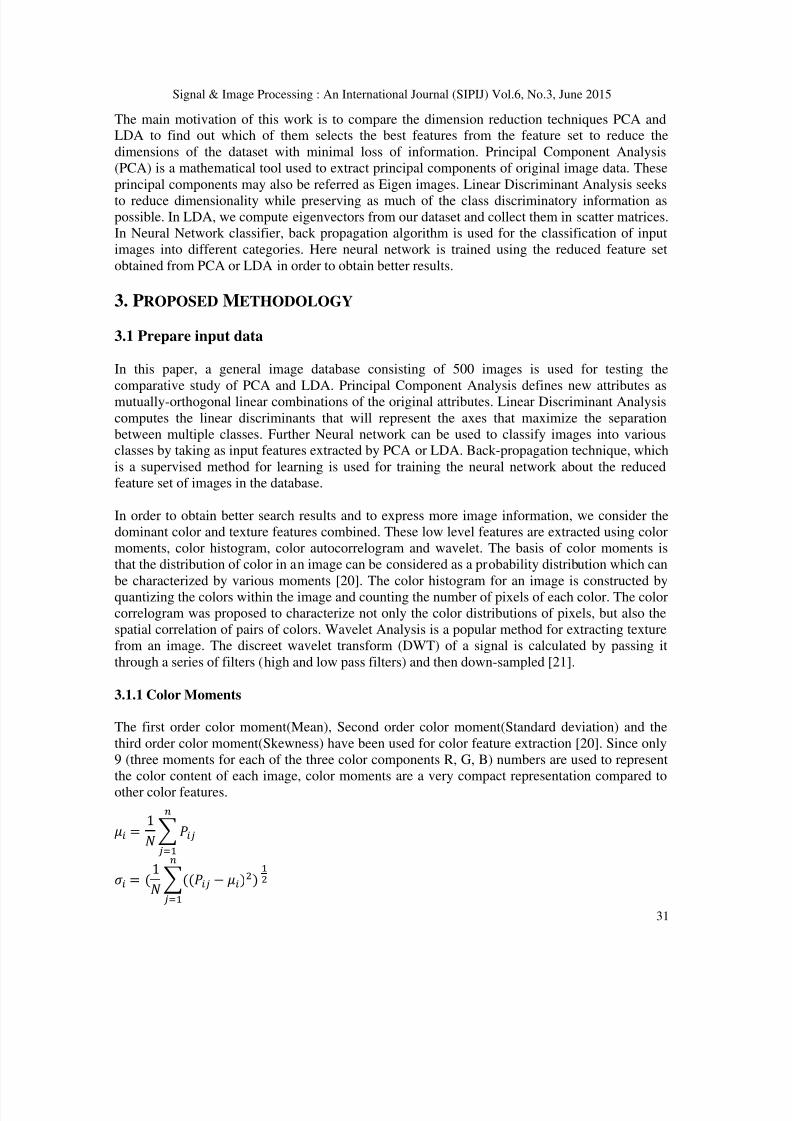
8202019 Significance of Dimensionality
httpslidepdfcomreaderfullsignificance-of-dimensionality 516
Signal amp Image Processing An International Journal (SIPIJ) Vol6 No3 June 2015
31
The main motivation of this work is to compare the dimension reduction techniques PCA andLDA to find out which of them selects the best features from the feature set to reduce the
dimensions of the dataset with minimal loss of information Principal Component Analysis
(PCA) is a mathematical tool used to extract principal components of original image data These
principal components may also be referred as Eigen images Linear Discriminant Analysis seeks
to reduce dimensionality while preserving as much of the class discriminatory information aspossible In LDA we compute eigenvectors from our dataset and collect them in scatter matrices
In Neural Network classifier back propagation algorithm is used for the classification of input
images into different categories Here neural network is trained using the reduced feature set
obtained from PCA or LDA in order to obtain better results
3 PROPOSED METHODOLOGY
31 Prepare input data
In this paper a general image database consisting of 500 images is used for testing the
comparative study of PCA and LDA Principal Component Analysis defines new attributes asmutually-orthogonal linear combinations of the original attributes Linear Discriminant Analysis
computes the linear discriminants that will represent the axes that maximize the separation
between multiple classes Further Neural network can be used to classify images into variousclasses by taking as input features extracted by PCA or LDA Back-propagation technique which
is a supervised method for learning is used for training the neural network about the reduced
feature set of images in the database
In order to obtain better search results and to express more image information we consider the
dominant color and texture features combined These low level features are extracted using color
moments color histogram color autocorrelogram and wavelet The basis of color moments is
that the distribution of color in an image can be considered as a probability distribution which can
be characterized by various moments [20] The color histogram for an image is constructed by
quantizing the colors within the image and counting the number of pixels of each color The color
correlogram was proposed to characterize not only the color distributions of pixels but also the
spatial correlation of pairs of colors Wavelet Analysis is a popular method for extracting texture
from an image The discreet wavelet transform (DWT) of a signal is calculated by passing it
through a series of filters (high and low pass filters) and then down-sampled [21]
311 Color Moments
The first order color moment(Mean) Second order color moment(Standard deviation) and the
third order color moment(Skewness) have been used for color feature extraction [20] Since only
9 (three moments for each of the three color components R G B) numbers are used to represent
the color content of each image color moments are a very compact representation compared to
other color features
= 1
= (1 (( minus ))
8202019 Significance of Dimensionality
httpslidepdfcomreaderfullsignificance-of-dimensionality 616
Signal amp Image Processing An International Journal (SIPIJ) Vol6 No3 June 2015
32
= (1 (( minus ))
Where Pij is the value of the i- the color channel of image pixel j and N is the number of pixels in
the image
When a query image is submitted for image retrieval its color moments are extracted and added
to feature set for matching the image with the images stored in the database The following are
the steps for extracting color moments from an image
1
Extract the values of each plane R G B corresponding to the image
2
Find the mean standard deviation and skewness of each plane
3
Convert to column vector output of the moments
The following table gives the color moments of 5 images where M corresponds to mean Std
corresponds to standard deviation Skew corresponds to Skewness and R for Red G for Green
and B for Blue plane respectively
Table 1 Color Moments Table
M(R) Std(R) Skew(R) M(G) Std(G) Skew(G) M(B) Std(B) Skew(B)
04372 03659 02132 01925 01821 03083 00014 00013 00009
04385 03409 02389 02018 01928 03131 00011 00015 00010
04351 03572 02582 02521 02349 03069 00019 00033 00030
05061 04364 02362 02355 02283 04019 00008 00015 00011
03765 04012 02818 02850 02844 03319 00054 00064 00046
312 Color Histogram
A histogram is a graph that represents all the colors and the level of their occurrence in an image
irrespective of the type of the image [8] This technique describes the proportion of pixels of each
color in an image It has been used as one of the feature extraction attributes with the advantage
like robustness with respect to geometric changes of the objects in the image The color
histogram is obtained by quantizing image colors into discrete levels and then counting the
number of times each discrete color occurs in the image In a CBIR system a query image is
compared with the histograms of all the images in database [22]
A color histogram H for a given image is defined as a vector [26]
H = H[1] H[2] H[i] H[N]
where i represent a color in the color histogram H[i] is the number of pixels in color i in that
image and N is the number of bins in the color histogram ie the number of colors in the
adopted color model
In order to compare images of different sizes color histograms should be normalized The
normalized color histogram H prime is defined as
= 0 1 991270
where 983112983145 = XY is the total number of pixels in an image
8202019 Significance of Dimensionality
httpslidepdfcomreaderfullsignificance-of-dimensionality 716
Signal amp Image Processing An International Journal (SIPIJ) Vol6 No3 June 2015
33
From the query image submitted for image retrieval its color histogram features are extractedand added to feature set for matching the image with database images The following steps give a
method to calculate color histogram
1
Convert the image from RGB color space to HSV color space
2
Define number of clusters for each HSV plane3
Find the maximum value of each plane
4 Cluster each values after normalisation
5
Add each color to any one of the appropriate cluster
6
Find the probabilistic values and convert the values to the column vector
313 Color autocorrelogram
A color correlogram is a table indexed by color pairs where the k-th entry for (i j) specifies the
probability of finding a pixel of color j at a distance k from a pixel of color i in the image [20]
Let I represent the entire set of image pixels and Ic(i) represent the set of pixels whose colors are
c(i)Then the color correlogram is defined as
()() = isin()isin 2 isin ()1 minus 2 = Where i j isin 1 2 hellip N k isin 1 2 hellip d and | p1 ndash p2 | is the distance between pixels p1 andp2
The color auto correlogram of the query image is extracted and added to feature vector for the
extraction of similar database images The following are the steps for extracting correlogram
features from an image
1 Reduce the number of colors in the RGB image
2
Correlate each pixel with the neighbourhood pixels for getting the correlogram vector
314 Texture
Like color the texture is a powerful low-level feature for image search and retrieval applicationsThe texture measures try to retrieve the image or image parts characteristics with reference to the
changes in certain directions and the scale of the images This is most useful for images with
homogeneous texture [3] Wavelet analysis is an exciting new method for solving difficult
problems in mathematics physics and engineering with modern applications as wave
propagation data compression signal processing image processing pattern recognition
computer graphics the detection of aircraft and submarines and other medical image technology
A wavelet is a mathematical function used to divide a given function into different frequency
components [21] A wavelet transform is the representation of a function by wavelets which
represent scaled and translated copies of a finite length or fast-decaying oscillating waveform
(known as the mother wavelet) The Wavelet transform of a function is the improved version of
Fourier transform Wavelet transforms have advantages over traditional Fourier transforms
because local features can be described better with wavelets that have local extent Some motherwavelet families implemented in Matlab are Daubechies Symlet Coiflet Biortogonal and
Reverse biorthogonal wavelets) and the fractional B-spline functions are used to compute
different feature vectors Orthogonal wavelets with FIR filters can be defined through a scaling
filter Predefined families of such wavelets include Haar Daubechies Symlets and Coiflets In
this paper Coiflet wavelet function is used to extract texture features The following steps give a
method to calculate Texture of an image
8202019 Significance of Dimensionality
httpslidepdfcomreaderfullsignificance-of-dimensionality 816
Signal amp Image Processing An International Journal (SIPIJ) Vol6 No3 June 2015
34
1 Convert the image to grayscale2
Find the 4 stage Coif wavelet coefficients
3
Find the mean and standard deviation of the above coefficients and output to a column
vector
The following table gives the 4 stage coiflet texture values of 5 images
Table 2 Coiflet Texture values Table
59048 26054 01637 00979
55827 29509 02472 00167
62997 37201 02554 00405
71697 36297 02840 00528
65487 43823 00779 02445
The following table gives the first 10 features of 5 images in the database before applying
dimension reduction algorithms
Table3 Table of features before Dimension Reduction1 2 3 4 5 6 7 8 9 10
04372 03659 02132 01925 01821 03083 00014 00013 00009 59048
04385 03409 02389 02018 01928 03131 00011 00015 00010 55827
04351 03572 02582 02521 02349 03069 00019 00033 00030 62997
05061 04364 02362 02355 02283 04019 00008 00015 00011 71697
03765 04012 02818 02850 02844 03319 00054 00064 00046 65487
32 Principal Component Analysis (PCA) Vs Linear Discriminant Analysis (LDA)
Principal Component Analysis is a technique which uses sophisticated underlying mathematical
principles to transform a number of possibly correlated variables into a smaller number of
variables called principal components [13] It is one of the most important results from appliedlinear algebra The advantage of PCA is finding the patterns in the data and compressing data by
reducing the number of dimensions without loss of information The mathematical concepts that
are used for PCA are Standard Deviation Variance Condashvariance and Eigenvectors [23] The
database images belonging to same category may differ in lighting conditions noise etc but are
not completely random and in spite of their differences there may present some patterns Such
patterns could be referred as principal components PCA is a mathematical tool used to extract
principal components of original image data These principal components may also be referred as
Eigen images [18] An important feature of PCA is that any original image from the image
database can be reconstructed by combining the eigen images The algorithm to calculate
Principal Components is as follows
1
Represent the image as one dimensional vector of size N x NSuppose we have M vectors of size N (= rows of image times columns of image)
representing a set of sampled images Then the training set becomes Γ1 Γ2 Γ3ΓM
2
The Mean value of the pixels intensities in each image is calculated and subtracted from
the corresponding image The process is continued for all images in the database
3 The covariance matrix which is of the order N2 x N2 is calculated as given by C = AAT
8202019 Significance of Dimensionality
httpslidepdfcomreaderfullsignificance-of-dimensionality 916
Signal amp Image Processing An International Journal (SIPIJ) Vol6 No3 June 2015
35
4 Find the Eigen values of the covariance matrix C by solving the equation (Cλ - I) = 0 Tofind the eigenvector X repeat the procedure where Xi indicates corresponding Eigen
values
5
The Eigen vectors are sorted according to the corresponding Eigen values in descending
order
6
Choose the First lsquoKrsquo Eigen vectors and Eigen Values
The following table gives the first 10 features of 5 images after applying the dimension reduction
algorithm PCA and reducing the feature database
Table 4 Table of features after Dimension Reduction
Linear Discriminant Analysis (LDA) [24] is most commonly used as dimensionality reduction
technique in the pre-processing step for pattern-classification and machine learning applications
The feature selection in traditional LDA [14] is obtained by maximizing the difference between
classes and minimizing the distance within classes LDA finds the vectors in the underlying space
that best discriminate among classes The prime difference between LDA and PCA is that PCA
does more of feature classification and LDA does data classification [4]
1 Compute the d -dimensional mean vectors for the different classes from the dataset2
Compute the scatter matrices (between-class and within-class scatter matrix)
3
Compute the eigenvectors (e1 e2 ed) and corresponding eigen values (λ 1 λ 2 λ d) for
the scatter matrices
4
Sort the eigenvectors by decreasing eigenvalues and choose k eigenvectors with the
largest eigenvalues to form a d timesk -dimensional matrix W (where every column represents
an eigenvector)
5
Use this d timesk eigenvector matrix to transform the samples onto the new subspace This
can be summarized by the mathematical equation y = WT times x (where x is a dtimes1-
dimensional vector representing one sample and y is the transformed ktimes1-dimensional
sample in the new subspace)
The performance comparison of PCA and LDA can also be done using neural networks by giving
the reduced feature set obtained using PCA or LDA as input to the neural network Neuralnetwork is a network of neuron like units called nodes [29] This neural computing technique is
used in fields of classification optimization control theory and for solving regression problemsThey are very effective in case of classification problems where detection and recognition of
target is required The architecture of neural network consists of a large number of nodes and
interconnection of nodes The individual inputs P1 P2hellip PR are weighted by correspondingelements W11 W12hellipW1R of the weight matrix W [20]
The neuron also has a bias lsquobrsquo which is summed with the weighted inputs to form the net input
lsquonrsquo
8202019 Significance of Dimensionality
httpslidepdfcomreaderfullsignificance-of-dimensionality 1016
Signal amp Image Processing An International Journal (SIPIJ) Vol6 No3 June 2015
36
n = W11 P1 + W12 P2 + hellip W1R PR + b
In matrix form this can be rewritten as
n = W P + b
Now the neuron output is given as
a = f (W P + b)
The transfer function used above is a log-sigmoid transfer function This transfer function takes
the input (which may have any value between plus and minus infinity) and squashes the output in
between 0 to 1 range according to the expression
y = 1 (1+e-n
)
The nodes at a particular stage constitute a layer The first layer is called input layer and last layer
is called output layer The layers in between output and input layer are called hidden layers Asthe number of hidden layers in the network increases the performance of network increases Each
node in a network serves the purpose of summation of all its inputs The output of a node is
further applied to the next node
In this paper Levenberg-Marquardt backpropagation algorithm (trainlm) is used for
classification Trainlm is a network training function that updates weight and bias values
according to Levenberg-Marquardt optimization Trainlm is often the fastest back propagation
algorithm in the matlab toolbox and is highly recommended as a first-choice supervised
algorithm The training process include creation configuring a three-layered neural network andmaking it learn about the extracted color and texture features of training set images Here we use
the reduced feature set obtained from PCA or LDA for the training of images The learning
process is carried out using backpropagation algorithm The training makes the network store thelearnt knowledge in its knowledge base This knowledge base is used in later phase in
comparison and decision making tasks by network
33 Similarity Matching
If R be the dimensionality reduced feature database and R is the feature vector obtained from
query image then the retrieval system is based on a similarity measure defined between R and
R [25] In this paper Euclidean distance is used to measure the similarity between the feature
vectors of reduced query image and reduced database images in the case of PCA and LDA In
the case of Neural Network based PCALDA the matching and decision making is done by the
neural network
34 Performance Evaluation
The performance of retrieval of the system can be measured in terms of its Recall and Precision
Recall measures the ability of the system to retrieve all the models that are relevant while
Precision measures the ability of the system to retrieve only the models that are relevant [20]
8202019 Significance of Dimensionality
httpslidepdfcomreaderfullsignificance-of-dimensionality 1116
Signal amp Image Processing An International Journal (SIPIJ) Vol6 No3 June 2015
37
=
=
The number of relevant items retrieved is the number of the returned images that are similar to
the query image in this case The total number of images retrieved is the total number of images
that are returned by the retrieval system In precision and recall crossover is the point on the
graph where the both precision and recall curves meet The higher the number of crossover points
better will be the performance of the system
4 COMPARATIVE STUDY OF PCA AND LDA
The proposed method has been implemented using Matlab 13 and tested on a general-purpose
database containing 500 images in JPG format of size 256X384 resized to 286x340 The
database includes 500 color images categorized into five classes and each class includes 100images as follows African people Beach Building Bus Dinosaurs The search is based on the
similarity of feature vectors We have followed the image retrieval technique as described in the
section 3 on different feature extraction schemes such as color and texture This scheme
calculated 110 features by means of histogram moments correlogram and Coif wavelet FurtherPrincipal Component Analysis technique and Linear Discriminant Analysis technique is used to
extract the best features from the images By means of PCA and LDA the feature set is reduced
to 75Then the reduced query image is compared with the reduced database feature set using
Euclidean Distance and the top 6 nearer images are displayed In neural network classifier based
PCA or LDA We used Levenberg-Marquardt backpropagation algorithm (trainlm) with 3 hiddenlayers for classification Here the network is trained about the reduced feature set (using PCA
LDA) of all the images from the training dataset A given query image is feature extracted and
searched for similar images For each query image relevant images are considered to be thosewhich belong to the same category as the query image The performance of the training process
can be analysed using the Precision Recall plot
The quality of the image retrieval with different feature extraction schemes has been evaluated
by randomly selecting query images of each category from test image database Each query
returns the top 6 images from database To measure retrieval effectiveness for the image retrieval
system Precision and Recall values are used The Precision Recall rates and plots for PCA LDA
Neural Network based PCA Neural Network based LDA and without dimension reduction
methods are shown in figure1 The graphical user interface for the retrieval of images using
dimension reduction with PCA LDA and Neural Network based PCA and Neural Network
based LDA are shown in the figure 2 figure3 and figure4 and figure5 respectively
From the GUI the database is to be selected first using Select Database button ie the database
of 500 images Then the query image is selected from a set of test images using Select Query
button The query can be processed under 5 options- without dimension reduction Dimension
Reduction using PCA and Dimension Reduction using LDA Neural Network based PCA and
Neural Network based LDA The images are retrieved based on the option selected and top 6
images are displayed in the Returned images frame The Precision-Recall Plot gives the Precision
and Recall rates of the selected option The Performance Comparison button shows the Precision-
8202019 Significance of Dimensionality
httpslidepdfcomreaderfullsignificance-of-dimensionality 1216
Signal amp Image Processing An International Journal (SIPIJ) Vol6 No3 June 2015
38
Recall plots of all the methods of the selected query image From the Table 5 of Precision andRecall it is found that the rates are higher for PCA when compared to LDA This shows that
PCA is a better dimension reduction tool when compared to the other methods
Table 5 Table of Precision Recall Rates
Figure1 Precision ndashRecall Plot
8202019 Significance of Dimensionality
httpslidepdfcomreaderfullsignificance-of-dimensionality 1316
Signal amp Image Processing An International Journal (SIPIJ) Vol6 No3 June 2015
39
Figure 2Dimension Reduction using PCA
Figure 3 Dimension Reduction using LDA
Figure 4 Neural Network Based PCA
8202019 Significance of Dimensionality
httpslidepdfcomreaderfullsignificance-of-dimensionality 1416
Signal amp Image Processing An International Journal (SIPIJ) Vol6 No3 June 2015
40
Figure 5 Neural Network Based LDA
5 CONCLUSION
In this paper we presented a comparative study of dimension reduction methods namely
Principal Component Analysis and Linear Discriminant Analysis Dimensionality reductionmethods aim at revealing meaningful structures and unexpected relationships in multivariate data
PCA projects correlated variables into a lower number of uncorrelated variables called principal
components By using only the first few principal components or eigen vectors PCA makes it
possible to reduce the number of significant dimensions of the data while maintaining the
maximum possible variance The objective of LDA is to perform dimensionality reduction whilepreserving as much of the class discriminatory information as possible In LDA we will compute
eigenvectors from our dataset and collect them in scatter-matrices the between-class scatter
matrix and within-class scatter matrix In Neural Network based PCALDA the network is
trained about the reduced feature set (using PCA or LDA) of all the images from the training
dataset The training algorithm used in this paper is Levenberg-Marquardt backpropagationalgorithm (trainlm) with 3 hidden layers From the Precision and Recall rates calculated in the
table in the above section it can be found that the rates are high for all the cases of PCA when
compared to the LDA Thus it is concluded that PCA tends to outperform LDA in almost all
cases and hence PCA can be adopted as an effective tool for dimension reduction
REFERENCES
[1] Rafael Gonzalez and Richard E Woods lsquoDigital Image processingrsquo Addison Wesley 2nd Edn
2002
[2] HH Pavan Kumar Bhuravarjula And VNS Vijaya Kumar(2012) lsquoA Novel Content Based Image
Retrieval Using Variance Color Momentrsquo Int J Of Computer And Electronics ResearchVol 1
Issue 3 ISSN 2278-5795 pp93-99
[3] Mohd Danish Ritika Rawat and Ratika Sharma(2013) lsquoA Survey Content Based Image Retrieval
Based On Color Texture Shape amp Neuro Fuzzyrsquo Int Journal Of Engineering Research And
Applications ISSN 2248-9622 Vol 3 Issue 5 Sep-Oct 2013 pp839-844
8202019 Significance of Dimensionality
httpslidepdfcomreaderfullsignificance-of-dimensionality 1516
Signal amp Image Processing An International Journal (SIPIJ) Vol6 No3 June 2015
41
[4] S Balakrishnama and A Ganapathiraju lsquoLinear Discriminant Analysis - A Brief Tutorialrsquo Institute
for Signal and Information Processing Department of Electrical and Computer Engineering
Mississippi State University
[5] Manimala Singha and K Hemachandran (2012) lsquoContent based image retrieval using color and
texturersquo Signal amp Image Processing An Int J (SIPIJ) Vol3 No1 pp39-57
[6] Pranali Prakash Lokhande and P A Tijare(2012) lsquoFeature Extraction Approach for Content BasedImage Retrievalrsquo IntJournal of Advanced Research in Computer Science and Software Engineering
Vol 2 Issue 2 ISSN 2277 128X
[7] S Mangijao Singh K Hemachandran (2012) ldquoContent-Based Image Retrieval using Color Moment
and Gabor Texture Featurerdquo IntJ of Computer Science IssuesVol 9 Issue 5 No 1 pp299-309
[8] ARamesh Kumar and DSaravanan rsquo Content Based Image Retrieval Using Color Histogramrsquo Int J
of Computer Science and Information Technologies Vol 4 (2) 2013 242 ndash 245 ISSN0975-9646
[9] Swati V Sakhare amp Vrushali G Nasre(2011) lsquoDesign of Feature Extraction in Content Based Image
Retrieval (CBIR) using Color and Texturersquo Int J of Computer Science amp Informatics Vol-I Issue-
II pp57-61
[10] Wasim Khan Shiv Kumar Neetesh Gupta and Nilofar Khan(2011) lsquoA Proposed Method for Image
Retrieval using Histogram values and Texture Descriptor Analysisrsquo Int Jof Soft Computing and
Engineering (IJSCE) ISSN 2231-2307 Vol-I Issue-II pp33-36
[11] SMeenachi Sundaresan and Dr KGSrinivasagan(2013) lsquoDesign of Image Retrieval Efficacy
System Based on CBIRrsquo Int J of Advanced Research in Computer Science and Software
Engineering Vol 3 Issue 4 ISSN 2277 128X pp48-53
[12] Tamer Mehyar Jalal Omer Atoum(2012) lsquoAn Enhancement on Content-Based Image Retrieval using
Color and Texture Featuresrsquo Journal of Emerging Trends in Computing and Information Sciences
Vol 3 No 4ISSN 2079-8407 pp488-496
[13] Pinderjeet Kaur (2012) lsquoImplementation of Principle Component Analysis with Fuzzy Annotation
for CAD Jewellery Imagesrsquo Int J of Emerging Trends amp Technology in Computer ScienceVol 1
Issue 4 ISSN 2278-6856
[14] Arunasakthi K and Kamatchipriya L(2014) lsquoA Review On Linear And Non-Linear Dimensionality
Reduction Techniquesrsquo Machine Learning And Applications An Int J (Mlaij) Vol1 No1 Pp65-
76
[15] Julie M David Kannan Balakrishnan (2014) Learning Disability Prediction Tool using ANN and
ANFIS International Journal of Soft Computing Springer Verlag Berlin Heidelberg ISSN 1432-
7643 (online) ISSN 1433-7479 (print) DOI 101007s00500-013-1129-0 Vol 18 Issue 6 pp 1093-1112
[16] Julie M David Kannan Balakrishnan (2012) Attribute Reduction and Missing Value Imputing with
ANN Prediction of Learning Disabilities International Journal of Neural Computing amp Applications
Springer-Verlag London Limited DOI 101007s00521-011-0619 Vol 21 Issue 7 pp 1757-1763
[17] Kresimir Delac Mislav Grgic and Sonja Grgic (2006) lsquoIndependent Comparative Study of PCA
ICA and LDA on the FERET Data Setrsquo Wiley Periodicals Inc
[18] Dr HBKekre Sudeep D Thepade and Akshay Maloo (2010) lsquoCBIR Feature Vector Dimension
Reduction with Eigenvectors of Covariance Matrix using Row Column and Diagonal Mean
Sequencesrsquo Int J of Computer Applications (0975 ndash 8887)Vol 3 No12
[19] Sebastian Raschka (2014) rsquoLinear Discriminant Analysis bit by bitrsquo
[20] Shereena VB and Julie M David (2014) lsquoContent Based Image Retrieval Classification Using
Neural Networksrsquo The Int J of Multimedia amp Its Applications (IJMA) Vol6 No5 DOI
105121ijma20146503 31[21] Anca Apatean Alexandrina Rogozan Simina Emerich Abdelaziz Bensrhair lsquoWavelets As Features
For Objects Recognitionrsquo
[22] Prof C S Gode Ms A N Ganar(2014) lsquoImage Retrieval by Using Color Texture and Shape
Featuresrsquo IntJournal of Advanced Research in ElectricalElectronics and Instrumentation
Engineering Vol 3 Issue 4 ISSN (Print) 2320 ndash 3765ISSN (Online) 2278 ndash 8875
8202019 Significance of Dimensionality
httpslidepdfcomreaderfullsignificance-of-dimensionality 1616
Signal amp Image Processing An International Journal (SIPIJ) Vol6 No3 June 2015
42
[23] Hamed Fadaei and Thotsapon Sortrakul(2014) lsquoContent-Based Image Retrieval System with
Combining Color features and Gradient featurersquo Int Conference on Advanced Computational
Technologies amp Creative Media
[24] G Sasikala R Kowsalya and Dr M Punithavalli (2010) lsquoA Comparative Study Of Dimension
Reduction Techniques For Content-Based Image Retrievalrsquo The Int J of Multimedia amp Its
Applications Vol2 No3 Doi 105121Ijma20102303 40[25] RPriya DrVasantha Kalyani David(2012) lsquoEnhanced Content Based Image Retrieval Using
Multiple Feature Fusion Algorithmsrsquo Int J of Scientific amp Engineering Research Vol 3 Issue 2
ISSN 2229-5518
[26] Shereena VB and Julie M David (2014) lsquoContent Based Image Retrieval A Reviewrsquo First
International Conference on Computer Science amp Information Technology COSIT 2014 AIRCC
Publishing Corporation Banglore
[27] Jack V Tu (1996) lsquoAdvantages and disadvantages of using artificial neural networks versus logistic
regression for predicting medical outcomesrsquo Journal of clinical Epidemiology Volume 49 Issue 11
Pages 1207-1325
[28] Aravind Nagathan Animozhi and Jithendra Mungara (2014) lsquoContent-Based Image Retrieval System
using Feed-Forward Backpropagation Neural NetworkrsquoIJCSNS International Journal of Computer
Science and Network Security Vol14 No6pp 70-77
[29] Mohandass Divya Jude Janet and Ramadass Suguna (2014) lsquoA genetic optimized neural network for
image retrieval in telemedicinersquo Divya et al EURASIP Journal on Image and Video Processing
[30] Shamla Mantri Nikhil S Tarale and Sudip C Mahajan(2011)rsquo Dimensionality Reduction technique
using Neural Networks ndash A Surveyrsquo(IJACSA) International Journal of Advanced Computer Science
and ApplicationsVol 2 No 4
AUTHORS
Shereena VBreceived her MCA degree from Bharathidasan University Trichy India
in 2000 During 2000-2004 she was with Mahatma Gandhi University Kottayam
India as Lecturer in the Department of Computer Applications Currently she is
working as Asst Professor in the Department of Computer Applications with MES
College Aluva Cochin India She has published papers in International Journals and
International and National Conference Proceedings Her research interests include Data
Mining Machine Learning and Image Processing
Dr Julie M David completed her Masters Degree in Computer Applications and
Masters of Philosophy in Computer Science in the years 2000 and 2009 in Bharathiyar
University Coimbatore India and in Vinayaka Missions University Salem India
respectively She has also completed her Doctorate in the research area of Artificial
Intelligence from Cochin University of Science and Technology Cochin India in 2013
During 2000-2007 she was with Mahatma Gandhi University Kottayam India as
Lecturer in the Department of Computer Applications Currently she is working as an
Assistant Professor in the Department of Computer Applications with MES College
Aluva Cochin India She has published several papers in International Journals and
International and National Conference Proceedings Her research interests include Artificial Intelligence
Data Mining and Machine Learning She is a life member of International Association of Engineers
IAENG Societies of Artificial Intelligence amp Data Mining Computer Society of India etc and a Reviewerof Elsevier International Journal of Knowledge Based Systems Also she is an Editorial Board Member of
various other International Journals She has coordinated various International and National Conferences
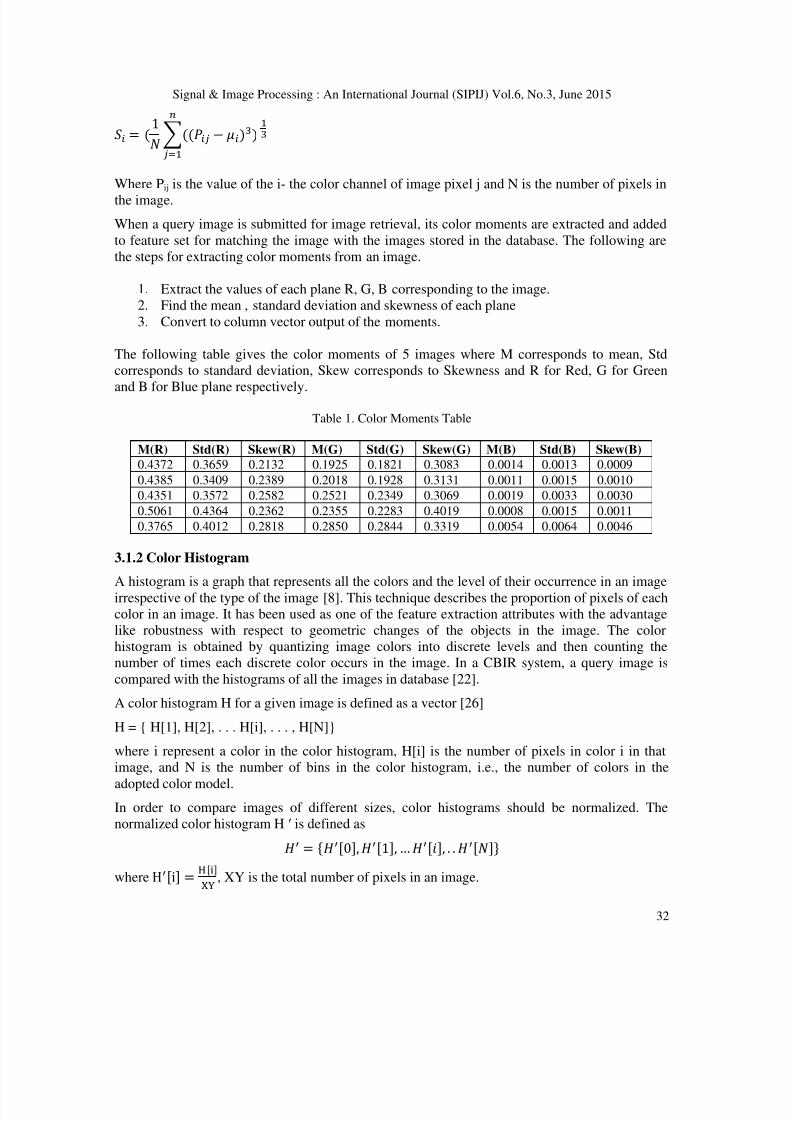
8202019 Significance of Dimensionality
httpslidepdfcomreaderfullsignificance-of-dimensionality 616
Signal amp Image Processing An International Journal (SIPIJ) Vol6 No3 June 2015
32
= (1 (( minus ))
Where Pij is the value of the i- the color channel of image pixel j and N is the number of pixels in
the image
When a query image is submitted for image retrieval its color moments are extracted and added
to feature set for matching the image with the images stored in the database The following are
the steps for extracting color moments from an image
1
Extract the values of each plane R G B corresponding to the image
2
Find the mean standard deviation and skewness of each plane
3
Convert to column vector output of the moments
The following table gives the color moments of 5 images where M corresponds to mean Std
corresponds to standard deviation Skew corresponds to Skewness and R for Red G for Green
and B for Blue plane respectively
Table 1 Color Moments Table
M(R) Std(R) Skew(R) M(G) Std(G) Skew(G) M(B) Std(B) Skew(B)
04372 03659 02132 01925 01821 03083 00014 00013 00009
04385 03409 02389 02018 01928 03131 00011 00015 00010
04351 03572 02582 02521 02349 03069 00019 00033 00030
05061 04364 02362 02355 02283 04019 00008 00015 00011
03765 04012 02818 02850 02844 03319 00054 00064 00046
312 Color Histogram
A histogram is a graph that represents all the colors and the level of their occurrence in an image
irrespective of the type of the image [8] This technique describes the proportion of pixels of each
color in an image It has been used as one of the feature extraction attributes with the advantage
like robustness with respect to geometric changes of the objects in the image The color
histogram is obtained by quantizing image colors into discrete levels and then counting the
number of times each discrete color occurs in the image In a CBIR system a query image is
compared with the histograms of all the images in database [22]
A color histogram H for a given image is defined as a vector [26]
H = H[1] H[2] H[i] H[N]
where i represent a color in the color histogram H[i] is the number of pixels in color i in that
image and N is the number of bins in the color histogram ie the number of colors in the
adopted color model
In order to compare images of different sizes color histograms should be normalized The
normalized color histogram H prime is defined as
= 0 1 991270
where 983112983145 = XY is the total number of pixels in an image
8202019 Significance of Dimensionality
httpslidepdfcomreaderfullsignificance-of-dimensionality 716
Signal amp Image Processing An International Journal (SIPIJ) Vol6 No3 June 2015
33
From the query image submitted for image retrieval its color histogram features are extractedand added to feature set for matching the image with database images The following steps give a
method to calculate color histogram
1
Convert the image from RGB color space to HSV color space
2
Define number of clusters for each HSV plane3
Find the maximum value of each plane
4 Cluster each values after normalisation
5
Add each color to any one of the appropriate cluster
6
Find the probabilistic values and convert the values to the column vector
313 Color autocorrelogram
A color correlogram is a table indexed by color pairs where the k-th entry for (i j) specifies the
probability of finding a pixel of color j at a distance k from a pixel of color i in the image [20]
Let I represent the entire set of image pixels and Ic(i) represent the set of pixels whose colors are
c(i)Then the color correlogram is defined as
()() = isin()isin 2 isin ()1 minus 2 = Where i j isin 1 2 hellip N k isin 1 2 hellip d and | p1 ndash p2 | is the distance between pixels p1 andp2
The color auto correlogram of the query image is extracted and added to feature vector for the
extraction of similar database images The following are the steps for extracting correlogram
features from an image
1 Reduce the number of colors in the RGB image
2
Correlate each pixel with the neighbourhood pixels for getting the correlogram vector
314 Texture
Like color the texture is a powerful low-level feature for image search and retrieval applicationsThe texture measures try to retrieve the image or image parts characteristics with reference to the
changes in certain directions and the scale of the images This is most useful for images with
homogeneous texture [3] Wavelet analysis is an exciting new method for solving difficult
problems in mathematics physics and engineering with modern applications as wave
propagation data compression signal processing image processing pattern recognition
computer graphics the detection of aircraft and submarines and other medical image technology
A wavelet is a mathematical function used to divide a given function into different frequency
components [21] A wavelet transform is the representation of a function by wavelets which
represent scaled and translated copies of a finite length or fast-decaying oscillating waveform
(known as the mother wavelet) The Wavelet transform of a function is the improved version of
Fourier transform Wavelet transforms have advantages over traditional Fourier transforms
because local features can be described better with wavelets that have local extent Some motherwavelet families implemented in Matlab are Daubechies Symlet Coiflet Biortogonal and
Reverse biorthogonal wavelets) and the fractional B-spline functions are used to compute
different feature vectors Orthogonal wavelets with FIR filters can be defined through a scaling
filter Predefined families of such wavelets include Haar Daubechies Symlets and Coiflets In
this paper Coiflet wavelet function is used to extract texture features The following steps give a
method to calculate Texture of an image
8202019 Significance of Dimensionality
httpslidepdfcomreaderfullsignificance-of-dimensionality 816
Signal amp Image Processing An International Journal (SIPIJ) Vol6 No3 June 2015
34
1 Convert the image to grayscale2
Find the 4 stage Coif wavelet coefficients
3
Find the mean and standard deviation of the above coefficients and output to a column
vector
The following table gives the 4 stage coiflet texture values of 5 images
Table 2 Coiflet Texture values Table
59048 26054 01637 00979
55827 29509 02472 00167
62997 37201 02554 00405
71697 36297 02840 00528
65487 43823 00779 02445
The following table gives the first 10 features of 5 images in the database before applying
dimension reduction algorithms
Table3 Table of features before Dimension Reduction1 2 3 4 5 6 7 8 9 10
04372 03659 02132 01925 01821 03083 00014 00013 00009 59048
04385 03409 02389 02018 01928 03131 00011 00015 00010 55827
04351 03572 02582 02521 02349 03069 00019 00033 00030 62997
05061 04364 02362 02355 02283 04019 00008 00015 00011 71697
03765 04012 02818 02850 02844 03319 00054 00064 00046 65487
32 Principal Component Analysis (PCA) Vs Linear Discriminant Analysis (LDA)
Principal Component Analysis is a technique which uses sophisticated underlying mathematical
principles to transform a number of possibly correlated variables into a smaller number of
variables called principal components [13] It is one of the most important results from appliedlinear algebra The advantage of PCA is finding the patterns in the data and compressing data by
reducing the number of dimensions without loss of information The mathematical concepts that
are used for PCA are Standard Deviation Variance Condashvariance and Eigenvectors [23] The
database images belonging to same category may differ in lighting conditions noise etc but are
not completely random and in spite of their differences there may present some patterns Such
patterns could be referred as principal components PCA is a mathematical tool used to extract
principal components of original image data These principal components may also be referred as
Eigen images [18] An important feature of PCA is that any original image from the image
database can be reconstructed by combining the eigen images The algorithm to calculate
Principal Components is as follows
1
Represent the image as one dimensional vector of size N x NSuppose we have M vectors of size N (= rows of image times columns of image)
representing a set of sampled images Then the training set becomes Γ1 Γ2 Γ3ΓM
2
The Mean value of the pixels intensities in each image is calculated and subtracted from
the corresponding image The process is continued for all images in the database
3 The covariance matrix which is of the order N2 x N2 is calculated as given by C = AAT
8202019 Significance of Dimensionality
httpslidepdfcomreaderfullsignificance-of-dimensionality 916
Signal amp Image Processing An International Journal (SIPIJ) Vol6 No3 June 2015
35
4 Find the Eigen values of the covariance matrix C by solving the equation (Cλ - I) = 0 Tofind the eigenvector X repeat the procedure where Xi indicates corresponding Eigen
values
5
The Eigen vectors are sorted according to the corresponding Eigen values in descending
order
6
Choose the First lsquoKrsquo Eigen vectors and Eigen Values
The following table gives the first 10 features of 5 images after applying the dimension reduction
algorithm PCA and reducing the feature database
Table 4 Table of features after Dimension Reduction
Linear Discriminant Analysis (LDA) [24] is most commonly used as dimensionality reduction
technique in the pre-processing step for pattern-classification and machine learning applications
The feature selection in traditional LDA [14] is obtained by maximizing the difference between
classes and minimizing the distance within classes LDA finds the vectors in the underlying space
that best discriminate among classes The prime difference between LDA and PCA is that PCA
does more of feature classification and LDA does data classification [4]
1 Compute the d -dimensional mean vectors for the different classes from the dataset2
Compute the scatter matrices (between-class and within-class scatter matrix)
3
Compute the eigenvectors (e1 e2 ed) and corresponding eigen values (λ 1 λ 2 λ d) for
the scatter matrices
4
Sort the eigenvectors by decreasing eigenvalues and choose k eigenvectors with the
largest eigenvalues to form a d timesk -dimensional matrix W (where every column represents
an eigenvector)
5
Use this d timesk eigenvector matrix to transform the samples onto the new subspace This
can be summarized by the mathematical equation y = WT times x (where x is a dtimes1-
dimensional vector representing one sample and y is the transformed ktimes1-dimensional
sample in the new subspace)
The performance comparison of PCA and LDA can also be done using neural networks by giving
the reduced feature set obtained using PCA or LDA as input to the neural network Neuralnetwork is a network of neuron like units called nodes [29] This neural computing technique is
used in fields of classification optimization control theory and for solving regression problemsThey are very effective in case of classification problems where detection and recognition of
target is required The architecture of neural network consists of a large number of nodes and
interconnection of nodes The individual inputs P1 P2hellip PR are weighted by correspondingelements W11 W12hellipW1R of the weight matrix W [20]
The neuron also has a bias lsquobrsquo which is summed with the weighted inputs to form the net input
lsquonrsquo
8202019 Significance of Dimensionality
httpslidepdfcomreaderfullsignificance-of-dimensionality 1016
Signal amp Image Processing An International Journal (SIPIJ) Vol6 No3 June 2015
36
n = W11 P1 + W12 P2 + hellip W1R PR + b
In matrix form this can be rewritten as
n = W P + b
Now the neuron output is given as
a = f (W P + b)
The transfer function used above is a log-sigmoid transfer function This transfer function takes
the input (which may have any value between plus and minus infinity) and squashes the output in
between 0 to 1 range according to the expression
y = 1 (1+e-n
)
The nodes at a particular stage constitute a layer The first layer is called input layer and last layer
is called output layer The layers in between output and input layer are called hidden layers Asthe number of hidden layers in the network increases the performance of network increases Each
node in a network serves the purpose of summation of all its inputs The output of a node is
further applied to the next node
In this paper Levenberg-Marquardt backpropagation algorithm (trainlm) is used for
classification Trainlm is a network training function that updates weight and bias values
according to Levenberg-Marquardt optimization Trainlm is often the fastest back propagation
algorithm in the matlab toolbox and is highly recommended as a first-choice supervised
algorithm The training process include creation configuring a three-layered neural network andmaking it learn about the extracted color and texture features of training set images Here we use
the reduced feature set obtained from PCA or LDA for the training of images The learning
process is carried out using backpropagation algorithm The training makes the network store thelearnt knowledge in its knowledge base This knowledge base is used in later phase in
comparison and decision making tasks by network
33 Similarity Matching
If R be the dimensionality reduced feature database and R is the feature vector obtained from
query image then the retrieval system is based on a similarity measure defined between R and
R [25] In this paper Euclidean distance is used to measure the similarity between the feature
vectors of reduced query image and reduced database images in the case of PCA and LDA In
the case of Neural Network based PCALDA the matching and decision making is done by the
neural network
34 Performance Evaluation
The performance of retrieval of the system can be measured in terms of its Recall and Precision
Recall measures the ability of the system to retrieve all the models that are relevant while
Precision measures the ability of the system to retrieve only the models that are relevant [20]
8202019 Significance of Dimensionality
httpslidepdfcomreaderfullsignificance-of-dimensionality 1116
Signal amp Image Processing An International Journal (SIPIJ) Vol6 No3 June 2015
37
=
=
The number of relevant items retrieved is the number of the returned images that are similar to
the query image in this case The total number of images retrieved is the total number of images
that are returned by the retrieval system In precision and recall crossover is the point on the
graph where the both precision and recall curves meet The higher the number of crossover points
better will be the performance of the system
4 COMPARATIVE STUDY OF PCA AND LDA
The proposed method has been implemented using Matlab 13 and tested on a general-purpose
database containing 500 images in JPG format of size 256X384 resized to 286x340 The
database includes 500 color images categorized into five classes and each class includes 100images as follows African people Beach Building Bus Dinosaurs The search is based on the
similarity of feature vectors We have followed the image retrieval technique as described in the
section 3 on different feature extraction schemes such as color and texture This scheme
calculated 110 features by means of histogram moments correlogram and Coif wavelet FurtherPrincipal Component Analysis technique and Linear Discriminant Analysis technique is used to
extract the best features from the images By means of PCA and LDA the feature set is reduced
to 75Then the reduced query image is compared with the reduced database feature set using
Euclidean Distance and the top 6 nearer images are displayed In neural network classifier based
PCA or LDA We used Levenberg-Marquardt backpropagation algorithm (trainlm) with 3 hiddenlayers for classification Here the network is trained about the reduced feature set (using PCA
LDA) of all the images from the training dataset A given query image is feature extracted and
searched for similar images For each query image relevant images are considered to be thosewhich belong to the same category as the query image The performance of the training process
can be analysed using the Precision Recall plot
The quality of the image retrieval with different feature extraction schemes has been evaluated
by randomly selecting query images of each category from test image database Each query
returns the top 6 images from database To measure retrieval effectiveness for the image retrieval
system Precision and Recall values are used The Precision Recall rates and plots for PCA LDA
Neural Network based PCA Neural Network based LDA and without dimension reduction
methods are shown in figure1 The graphical user interface for the retrieval of images using
dimension reduction with PCA LDA and Neural Network based PCA and Neural Network
based LDA are shown in the figure 2 figure3 and figure4 and figure5 respectively
From the GUI the database is to be selected first using Select Database button ie the database
of 500 images Then the query image is selected from a set of test images using Select Query
button The query can be processed under 5 options- without dimension reduction Dimension
Reduction using PCA and Dimension Reduction using LDA Neural Network based PCA and
Neural Network based LDA The images are retrieved based on the option selected and top 6
images are displayed in the Returned images frame The Precision-Recall Plot gives the Precision
and Recall rates of the selected option The Performance Comparison button shows the Precision-
8202019 Significance of Dimensionality
httpslidepdfcomreaderfullsignificance-of-dimensionality 1216
Signal amp Image Processing An International Journal (SIPIJ) Vol6 No3 June 2015
38
Recall plots of all the methods of the selected query image From the Table 5 of Precision andRecall it is found that the rates are higher for PCA when compared to LDA This shows that
PCA is a better dimension reduction tool when compared to the other methods
Table 5 Table of Precision Recall Rates
Figure1 Precision ndashRecall Plot
8202019 Significance of Dimensionality
httpslidepdfcomreaderfullsignificance-of-dimensionality 1316
Signal amp Image Processing An International Journal (SIPIJ) Vol6 No3 June 2015
39
Figure 2Dimension Reduction using PCA
Figure 3 Dimension Reduction using LDA
Figure 4 Neural Network Based PCA
8202019 Significance of Dimensionality
httpslidepdfcomreaderfullsignificance-of-dimensionality 1416
Signal amp Image Processing An International Journal (SIPIJ) Vol6 No3 June 2015
40
Figure 5 Neural Network Based LDA
5 CONCLUSION
In this paper we presented a comparative study of dimension reduction methods namely
Principal Component Analysis and Linear Discriminant Analysis Dimensionality reductionmethods aim at revealing meaningful structures and unexpected relationships in multivariate data
PCA projects correlated variables into a lower number of uncorrelated variables called principal
components By using only the first few principal components or eigen vectors PCA makes it
possible to reduce the number of significant dimensions of the data while maintaining the
maximum possible variance The objective of LDA is to perform dimensionality reduction whilepreserving as much of the class discriminatory information as possible In LDA we will compute
eigenvectors from our dataset and collect them in scatter-matrices the between-class scatter
matrix and within-class scatter matrix In Neural Network based PCALDA the network is
trained about the reduced feature set (using PCA or LDA) of all the images from the training
dataset The training algorithm used in this paper is Levenberg-Marquardt backpropagationalgorithm (trainlm) with 3 hidden layers From the Precision and Recall rates calculated in the
table in the above section it can be found that the rates are high for all the cases of PCA when
compared to the LDA Thus it is concluded that PCA tends to outperform LDA in almost all
cases and hence PCA can be adopted as an effective tool for dimension reduction
REFERENCES
[1] Rafael Gonzalez and Richard E Woods lsquoDigital Image processingrsquo Addison Wesley 2nd Edn
2002
[2] HH Pavan Kumar Bhuravarjula And VNS Vijaya Kumar(2012) lsquoA Novel Content Based Image
Retrieval Using Variance Color Momentrsquo Int J Of Computer And Electronics ResearchVol 1
Issue 3 ISSN 2278-5795 pp93-99
[3] Mohd Danish Ritika Rawat and Ratika Sharma(2013) lsquoA Survey Content Based Image Retrieval
Based On Color Texture Shape amp Neuro Fuzzyrsquo Int Journal Of Engineering Research And
Applications ISSN 2248-9622 Vol 3 Issue 5 Sep-Oct 2013 pp839-844
8202019 Significance of Dimensionality
httpslidepdfcomreaderfullsignificance-of-dimensionality 1516
Signal amp Image Processing An International Journal (SIPIJ) Vol6 No3 June 2015
41
[4] S Balakrishnama and A Ganapathiraju lsquoLinear Discriminant Analysis - A Brief Tutorialrsquo Institute
for Signal and Information Processing Department of Electrical and Computer Engineering
Mississippi State University
[5] Manimala Singha and K Hemachandran (2012) lsquoContent based image retrieval using color and
texturersquo Signal amp Image Processing An Int J (SIPIJ) Vol3 No1 pp39-57
[6] Pranali Prakash Lokhande and P A Tijare(2012) lsquoFeature Extraction Approach for Content BasedImage Retrievalrsquo IntJournal of Advanced Research in Computer Science and Software Engineering
Vol 2 Issue 2 ISSN 2277 128X
[7] S Mangijao Singh K Hemachandran (2012) ldquoContent-Based Image Retrieval using Color Moment
and Gabor Texture Featurerdquo IntJ of Computer Science IssuesVol 9 Issue 5 No 1 pp299-309
[8] ARamesh Kumar and DSaravanan rsquo Content Based Image Retrieval Using Color Histogramrsquo Int J
of Computer Science and Information Technologies Vol 4 (2) 2013 242 ndash 245 ISSN0975-9646
[9] Swati V Sakhare amp Vrushali G Nasre(2011) lsquoDesign of Feature Extraction in Content Based Image
Retrieval (CBIR) using Color and Texturersquo Int J of Computer Science amp Informatics Vol-I Issue-
II pp57-61
[10] Wasim Khan Shiv Kumar Neetesh Gupta and Nilofar Khan(2011) lsquoA Proposed Method for Image
Retrieval using Histogram values and Texture Descriptor Analysisrsquo Int Jof Soft Computing and
Engineering (IJSCE) ISSN 2231-2307 Vol-I Issue-II pp33-36
[11] SMeenachi Sundaresan and Dr KGSrinivasagan(2013) lsquoDesign of Image Retrieval Efficacy
System Based on CBIRrsquo Int J of Advanced Research in Computer Science and Software
Engineering Vol 3 Issue 4 ISSN 2277 128X pp48-53
[12] Tamer Mehyar Jalal Omer Atoum(2012) lsquoAn Enhancement on Content-Based Image Retrieval using
Color and Texture Featuresrsquo Journal of Emerging Trends in Computing and Information Sciences
Vol 3 No 4ISSN 2079-8407 pp488-496
[13] Pinderjeet Kaur (2012) lsquoImplementation of Principle Component Analysis with Fuzzy Annotation
for CAD Jewellery Imagesrsquo Int J of Emerging Trends amp Technology in Computer ScienceVol 1
Issue 4 ISSN 2278-6856
[14] Arunasakthi K and Kamatchipriya L(2014) lsquoA Review On Linear And Non-Linear Dimensionality
Reduction Techniquesrsquo Machine Learning And Applications An Int J (Mlaij) Vol1 No1 Pp65-
76
[15] Julie M David Kannan Balakrishnan (2014) Learning Disability Prediction Tool using ANN and
ANFIS International Journal of Soft Computing Springer Verlag Berlin Heidelberg ISSN 1432-
7643 (online) ISSN 1433-7479 (print) DOI 101007s00500-013-1129-0 Vol 18 Issue 6 pp 1093-1112
[16] Julie M David Kannan Balakrishnan (2012) Attribute Reduction and Missing Value Imputing with
ANN Prediction of Learning Disabilities International Journal of Neural Computing amp Applications
Springer-Verlag London Limited DOI 101007s00521-011-0619 Vol 21 Issue 7 pp 1757-1763
[17] Kresimir Delac Mislav Grgic and Sonja Grgic (2006) lsquoIndependent Comparative Study of PCA
ICA and LDA on the FERET Data Setrsquo Wiley Periodicals Inc
[18] Dr HBKekre Sudeep D Thepade and Akshay Maloo (2010) lsquoCBIR Feature Vector Dimension
Reduction with Eigenvectors of Covariance Matrix using Row Column and Diagonal Mean
Sequencesrsquo Int J of Computer Applications (0975 ndash 8887)Vol 3 No12
[19] Sebastian Raschka (2014) rsquoLinear Discriminant Analysis bit by bitrsquo
[20] Shereena VB and Julie M David (2014) lsquoContent Based Image Retrieval Classification Using
Neural Networksrsquo The Int J of Multimedia amp Its Applications (IJMA) Vol6 No5 DOI
105121ijma20146503 31[21] Anca Apatean Alexandrina Rogozan Simina Emerich Abdelaziz Bensrhair lsquoWavelets As Features
For Objects Recognitionrsquo
[22] Prof C S Gode Ms A N Ganar(2014) lsquoImage Retrieval by Using Color Texture and Shape
Featuresrsquo IntJournal of Advanced Research in ElectricalElectronics and Instrumentation
Engineering Vol 3 Issue 4 ISSN (Print) 2320 ndash 3765ISSN (Online) 2278 ndash 8875
8202019 Significance of Dimensionality
httpslidepdfcomreaderfullsignificance-of-dimensionality 1616
Signal amp Image Processing An International Journal (SIPIJ) Vol6 No3 June 2015
42
[23] Hamed Fadaei and Thotsapon Sortrakul(2014) lsquoContent-Based Image Retrieval System with
Combining Color features and Gradient featurersquo Int Conference on Advanced Computational
Technologies amp Creative Media
[24] G Sasikala R Kowsalya and Dr M Punithavalli (2010) lsquoA Comparative Study Of Dimension
Reduction Techniques For Content-Based Image Retrievalrsquo The Int J of Multimedia amp Its
Applications Vol2 No3 Doi 105121Ijma20102303 40[25] RPriya DrVasantha Kalyani David(2012) lsquoEnhanced Content Based Image Retrieval Using
Multiple Feature Fusion Algorithmsrsquo Int J of Scientific amp Engineering Research Vol 3 Issue 2
ISSN 2229-5518
[26] Shereena VB and Julie M David (2014) lsquoContent Based Image Retrieval A Reviewrsquo First
International Conference on Computer Science amp Information Technology COSIT 2014 AIRCC
Publishing Corporation Banglore
[27] Jack V Tu (1996) lsquoAdvantages and disadvantages of using artificial neural networks versus logistic
regression for predicting medical outcomesrsquo Journal of clinical Epidemiology Volume 49 Issue 11
Pages 1207-1325
[28] Aravind Nagathan Animozhi and Jithendra Mungara (2014) lsquoContent-Based Image Retrieval System
using Feed-Forward Backpropagation Neural NetworkrsquoIJCSNS International Journal of Computer
Science and Network Security Vol14 No6pp 70-77
[29] Mohandass Divya Jude Janet and Ramadass Suguna (2014) lsquoA genetic optimized neural network for
image retrieval in telemedicinersquo Divya et al EURASIP Journal on Image and Video Processing
[30] Shamla Mantri Nikhil S Tarale and Sudip C Mahajan(2011)rsquo Dimensionality Reduction technique
using Neural Networks ndash A Surveyrsquo(IJACSA) International Journal of Advanced Computer Science
and ApplicationsVol 2 No 4
AUTHORS
Shereena VBreceived her MCA degree from Bharathidasan University Trichy India
in 2000 During 2000-2004 she was with Mahatma Gandhi University Kottayam
India as Lecturer in the Department of Computer Applications Currently she is
working as Asst Professor in the Department of Computer Applications with MES
College Aluva Cochin India She has published papers in International Journals and
International and National Conference Proceedings Her research interests include Data
Mining Machine Learning and Image Processing
Dr Julie M David completed her Masters Degree in Computer Applications and
Masters of Philosophy in Computer Science in the years 2000 and 2009 in Bharathiyar
University Coimbatore India and in Vinayaka Missions University Salem India
respectively She has also completed her Doctorate in the research area of Artificial
Intelligence from Cochin University of Science and Technology Cochin India in 2013
During 2000-2007 she was with Mahatma Gandhi University Kottayam India as
Lecturer in the Department of Computer Applications Currently she is working as an
Assistant Professor in the Department of Computer Applications with MES College
Aluva Cochin India She has published several papers in International Journals and
International and National Conference Proceedings Her research interests include Artificial Intelligence
Data Mining and Machine Learning She is a life member of International Association of Engineers
IAENG Societies of Artificial Intelligence amp Data Mining Computer Society of India etc and a Reviewerof Elsevier International Journal of Knowledge Based Systems Also she is an Editorial Board Member of
various other International Journals She has coordinated various International and National Conferences
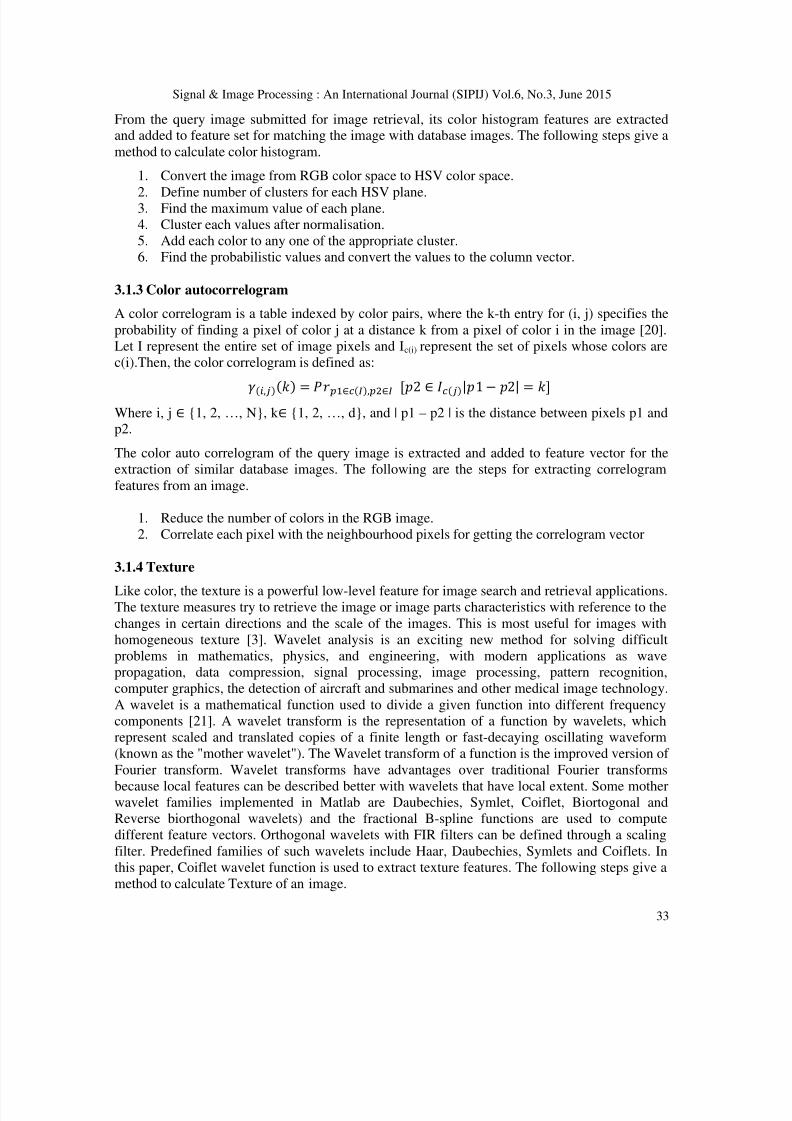
8202019 Significance of Dimensionality
httpslidepdfcomreaderfullsignificance-of-dimensionality 716
Signal amp Image Processing An International Journal (SIPIJ) Vol6 No3 June 2015
33
From the query image submitted for image retrieval its color histogram features are extractedand added to feature set for matching the image with database images The following steps give a
method to calculate color histogram
1
Convert the image from RGB color space to HSV color space
2
Define number of clusters for each HSV plane3
Find the maximum value of each plane
4 Cluster each values after normalisation
5
Add each color to any one of the appropriate cluster
6
Find the probabilistic values and convert the values to the column vector
313 Color autocorrelogram
A color correlogram is a table indexed by color pairs where the k-th entry for (i j) specifies the
probability of finding a pixel of color j at a distance k from a pixel of color i in the image [20]
Let I represent the entire set of image pixels and Ic(i) represent the set of pixels whose colors are
c(i)Then the color correlogram is defined as
()() = isin()isin 2 isin ()1 minus 2 = Where i j isin 1 2 hellip N k isin 1 2 hellip d and | p1 ndash p2 | is the distance between pixels p1 andp2
The color auto correlogram of the query image is extracted and added to feature vector for the
extraction of similar database images The following are the steps for extracting correlogram
features from an image
1 Reduce the number of colors in the RGB image
2
Correlate each pixel with the neighbourhood pixels for getting the correlogram vector
314 Texture
Like color the texture is a powerful low-level feature for image search and retrieval applicationsThe texture measures try to retrieve the image or image parts characteristics with reference to the
changes in certain directions and the scale of the images This is most useful for images with
homogeneous texture [3] Wavelet analysis is an exciting new method for solving difficult
problems in mathematics physics and engineering with modern applications as wave
propagation data compression signal processing image processing pattern recognition
computer graphics the detection of aircraft and submarines and other medical image technology
A wavelet is a mathematical function used to divide a given function into different frequency
components [21] A wavelet transform is the representation of a function by wavelets which
represent scaled and translated copies of a finite length or fast-decaying oscillating waveform
(known as the mother wavelet) The Wavelet transform of a function is the improved version of
Fourier transform Wavelet transforms have advantages over traditional Fourier transforms
because local features can be described better with wavelets that have local extent Some motherwavelet families implemented in Matlab are Daubechies Symlet Coiflet Biortogonal and
Reverse biorthogonal wavelets) and the fractional B-spline functions are used to compute
different feature vectors Orthogonal wavelets with FIR filters can be defined through a scaling
filter Predefined families of such wavelets include Haar Daubechies Symlets and Coiflets In
this paper Coiflet wavelet function is used to extract texture features The following steps give a
method to calculate Texture of an image
8202019 Significance of Dimensionality
httpslidepdfcomreaderfullsignificance-of-dimensionality 816
Signal amp Image Processing An International Journal (SIPIJ) Vol6 No3 June 2015
34
1 Convert the image to grayscale2
Find the 4 stage Coif wavelet coefficients
3
Find the mean and standard deviation of the above coefficients and output to a column
vector
The following table gives the 4 stage coiflet texture values of 5 images
Table 2 Coiflet Texture values Table
59048 26054 01637 00979
55827 29509 02472 00167
62997 37201 02554 00405
71697 36297 02840 00528
65487 43823 00779 02445
The following table gives the first 10 features of 5 images in the database before applying
dimension reduction algorithms
Table3 Table of features before Dimension Reduction1 2 3 4 5 6 7 8 9 10
04372 03659 02132 01925 01821 03083 00014 00013 00009 59048
04385 03409 02389 02018 01928 03131 00011 00015 00010 55827
04351 03572 02582 02521 02349 03069 00019 00033 00030 62997
05061 04364 02362 02355 02283 04019 00008 00015 00011 71697
03765 04012 02818 02850 02844 03319 00054 00064 00046 65487
32 Principal Component Analysis (PCA) Vs Linear Discriminant Analysis (LDA)
Principal Component Analysis is a technique which uses sophisticated underlying mathematical
principles to transform a number of possibly correlated variables into a smaller number of
variables called principal components [13] It is one of the most important results from appliedlinear algebra The advantage of PCA is finding the patterns in the data and compressing data by
reducing the number of dimensions without loss of information The mathematical concepts that
are used for PCA are Standard Deviation Variance Condashvariance and Eigenvectors [23] The
database images belonging to same category may differ in lighting conditions noise etc but are
not completely random and in spite of their differences there may present some patterns Such
patterns could be referred as principal components PCA is a mathematical tool used to extract
principal components of original image data These principal components may also be referred as
Eigen images [18] An important feature of PCA is that any original image from the image
database can be reconstructed by combining the eigen images The algorithm to calculate
Principal Components is as follows
1
Represent the image as one dimensional vector of size N x NSuppose we have M vectors of size N (= rows of image times columns of image)
representing a set of sampled images Then the training set becomes Γ1 Γ2 Γ3ΓM
2
The Mean value of the pixels intensities in each image is calculated and subtracted from
the corresponding image The process is continued for all images in the database
3 The covariance matrix which is of the order N2 x N2 is calculated as given by C = AAT
8202019 Significance of Dimensionality
httpslidepdfcomreaderfullsignificance-of-dimensionality 916
Signal amp Image Processing An International Journal (SIPIJ) Vol6 No3 June 2015
35
4 Find the Eigen values of the covariance matrix C by solving the equation (Cλ - I) = 0 Tofind the eigenvector X repeat the procedure where Xi indicates corresponding Eigen
values
5
The Eigen vectors are sorted according to the corresponding Eigen values in descending
order
6
Choose the First lsquoKrsquo Eigen vectors and Eigen Values
The following table gives the first 10 features of 5 images after applying the dimension reduction
algorithm PCA and reducing the feature database
Table 4 Table of features after Dimension Reduction
Linear Discriminant Analysis (LDA) [24] is most commonly used as dimensionality reduction
technique in the pre-processing step for pattern-classification and machine learning applications
The feature selection in traditional LDA [14] is obtained by maximizing the difference between
classes and minimizing the distance within classes LDA finds the vectors in the underlying space
that best discriminate among classes The prime difference between LDA and PCA is that PCA
does more of feature classification and LDA does data classification [4]
1 Compute the d -dimensional mean vectors for the different classes from the dataset2
Compute the scatter matrices (between-class and within-class scatter matrix)
3
Compute the eigenvectors (e1 e2 ed) and corresponding eigen values (λ 1 λ 2 λ d) for
the scatter matrices
4
Sort the eigenvectors by decreasing eigenvalues and choose k eigenvectors with the
largest eigenvalues to form a d timesk -dimensional matrix W (where every column represents
an eigenvector)
5
Use this d timesk eigenvector matrix to transform the samples onto the new subspace This
can be summarized by the mathematical equation y = WT times x (where x is a dtimes1-
dimensional vector representing one sample and y is the transformed ktimes1-dimensional
sample in the new subspace)
The performance comparison of PCA and LDA can also be done using neural networks by giving
the reduced feature set obtained using PCA or LDA as input to the neural network Neuralnetwork is a network of neuron like units called nodes [29] This neural computing technique is
used in fields of classification optimization control theory and for solving regression problemsThey are very effective in case of classification problems where detection and recognition of
target is required The architecture of neural network consists of a large number of nodes and
interconnection of nodes The individual inputs P1 P2hellip PR are weighted by correspondingelements W11 W12hellipW1R of the weight matrix W [20]
The neuron also has a bias lsquobrsquo which is summed with the weighted inputs to form the net input
lsquonrsquo
8202019 Significance of Dimensionality
httpslidepdfcomreaderfullsignificance-of-dimensionality 1016
Signal amp Image Processing An International Journal (SIPIJ) Vol6 No3 June 2015
36
n = W11 P1 + W12 P2 + hellip W1R PR + b
In matrix form this can be rewritten as
n = W P + b
Now the neuron output is given as
a = f (W P + b)
The transfer function used above is a log-sigmoid transfer function This transfer function takes
the input (which may have any value between plus and minus infinity) and squashes the output in
between 0 to 1 range according to the expression
y = 1 (1+e-n
)
The nodes at a particular stage constitute a layer The first layer is called input layer and last layer
is called output layer The layers in between output and input layer are called hidden layers Asthe number of hidden layers in the network increases the performance of network increases Each
node in a network serves the purpose of summation of all its inputs The output of a node is
further applied to the next node
In this paper Levenberg-Marquardt backpropagation algorithm (trainlm) is used for
classification Trainlm is a network training function that updates weight and bias values
according to Levenberg-Marquardt optimization Trainlm is often the fastest back propagation
algorithm in the matlab toolbox and is highly recommended as a first-choice supervised
algorithm The training process include creation configuring a three-layered neural network andmaking it learn about the extracted color and texture features of training set images Here we use
the reduced feature set obtained from PCA or LDA for the training of images The learning
process is carried out using backpropagation algorithm The training makes the network store thelearnt knowledge in its knowledge base This knowledge base is used in later phase in
comparison and decision making tasks by network
33 Similarity Matching
If R be the dimensionality reduced feature database and R is the feature vector obtained from
query image then the retrieval system is based on a similarity measure defined between R and
R [25] In this paper Euclidean distance is used to measure the similarity between the feature
vectors of reduced query image and reduced database images in the case of PCA and LDA In
the case of Neural Network based PCALDA the matching and decision making is done by the
neural network
34 Performance Evaluation
The performance of retrieval of the system can be measured in terms of its Recall and Precision
Recall measures the ability of the system to retrieve all the models that are relevant while
Precision measures the ability of the system to retrieve only the models that are relevant [20]
8202019 Significance of Dimensionality
httpslidepdfcomreaderfullsignificance-of-dimensionality 1116
Signal amp Image Processing An International Journal (SIPIJ) Vol6 No3 June 2015
37
=
=
The number of relevant items retrieved is the number of the returned images that are similar to
the query image in this case The total number of images retrieved is the total number of images
that are returned by the retrieval system In precision and recall crossover is the point on the
graph where the both precision and recall curves meet The higher the number of crossover points
better will be the performance of the system
4 COMPARATIVE STUDY OF PCA AND LDA
The proposed method has been implemented using Matlab 13 and tested on a general-purpose
database containing 500 images in JPG format of size 256X384 resized to 286x340 The
database includes 500 color images categorized into five classes and each class includes 100images as follows African people Beach Building Bus Dinosaurs The search is based on the
similarity of feature vectors We have followed the image retrieval technique as described in the
section 3 on different feature extraction schemes such as color and texture This scheme
calculated 110 features by means of histogram moments correlogram and Coif wavelet FurtherPrincipal Component Analysis technique and Linear Discriminant Analysis technique is used to
extract the best features from the images By means of PCA and LDA the feature set is reduced
to 75Then the reduced query image is compared with the reduced database feature set using
Euclidean Distance and the top 6 nearer images are displayed In neural network classifier based
PCA or LDA We used Levenberg-Marquardt backpropagation algorithm (trainlm) with 3 hiddenlayers for classification Here the network is trained about the reduced feature set (using PCA
LDA) of all the images from the training dataset A given query image is feature extracted and
searched for similar images For each query image relevant images are considered to be thosewhich belong to the same category as the query image The performance of the training process
can be analysed using the Precision Recall plot
The quality of the image retrieval with different feature extraction schemes has been evaluated
by randomly selecting query images of each category from test image database Each query
returns the top 6 images from database To measure retrieval effectiveness for the image retrieval
system Precision and Recall values are used The Precision Recall rates and plots for PCA LDA
Neural Network based PCA Neural Network based LDA and without dimension reduction
methods are shown in figure1 The graphical user interface for the retrieval of images using
dimension reduction with PCA LDA and Neural Network based PCA and Neural Network
based LDA are shown in the figure 2 figure3 and figure4 and figure5 respectively
From the GUI the database is to be selected first using Select Database button ie the database
of 500 images Then the query image is selected from a set of test images using Select Query
button The query can be processed under 5 options- without dimension reduction Dimension
Reduction using PCA and Dimension Reduction using LDA Neural Network based PCA and
Neural Network based LDA The images are retrieved based on the option selected and top 6
images are displayed in the Returned images frame The Precision-Recall Plot gives the Precision
and Recall rates of the selected option The Performance Comparison button shows the Precision-
8202019 Significance of Dimensionality
httpslidepdfcomreaderfullsignificance-of-dimensionality 1216
Signal amp Image Processing An International Journal (SIPIJ) Vol6 No3 June 2015
38
Recall plots of all the methods of the selected query image From the Table 5 of Precision andRecall it is found that the rates are higher for PCA when compared to LDA This shows that
PCA is a better dimension reduction tool when compared to the other methods
Table 5 Table of Precision Recall Rates
Figure1 Precision ndashRecall Plot
8202019 Significance of Dimensionality
httpslidepdfcomreaderfullsignificance-of-dimensionality 1316
Signal amp Image Processing An International Journal (SIPIJ) Vol6 No3 June 2015
39
Figure 2Dimension Reduction using PCA
Figure 3 Dimension Reduction using LDA
Figure 4 Neural Network Based PCA
8202019 Significance of Dimensionality
httpslidepdfcomreaderfullsignificance-of-dimensionality 1416
Signal amp Image Processing An International Journal (SIPIJ) Vol6 No3 June 2015
40
Figure 5 Neural Network Based LDA
5 CONCLUSION
In this paper we presented a comparative study of dimension reduction methods namely
Principal Component Analysis and Linear Discriminant Analysis Dimensionality reductionmethods aim at revealing meaningful structures and unexpected relationships in multivariate data
PCA projects correlated variables into a lower number of uncorrelated variables called principal
components By using only the first few principal components or eigen vectors PCA makes it
possible to reduce the number of significant dimensions of the data while maintaining the
maximum possible variance The objective of LDA is to perform dimensionality reduction whilepreserving as much of the class discriminatory information as possible In LDA we will compute
eigenvectors from our dataset and collect them in scatter-matrices the between-class scatter
matrix and within-class scatter matrix In Neural Network based PCALDA the network is
trained about the reduced feature set (using PCA or LDA) of all the images from the training
dataset The training algorithm used in this paper is Levenberg-Marquardt backpropagationalgorithm (trainlm) with 3 hidden layers From the Precision and Recall rates calculated in the
table in the above section it can be found that the rates are high for all the cases of PCA when
compared to the LDA Thus it is concluded that PCA tends to outperform LDA in almost all
cases and hence PCA can be adopted as an effective tool for dimension reduction
REFERENCES
[1] Rafael Gonzalez and Richard E Woods lsquoDigital Image processingrsquo Addison Wesley 2nd Edn
2002
[2] HH Pavan Kumar Bhuravarjula And VNS Vijaya Kumar(2012) lsquoA Novel Content Based Image
Retrieval Using Variance Color Momentrsquo Int J Of Computer And Electronics ResearchVol 1
Issue 3 ISSN 2278-5795 pp93-99
[3] Mohd Danish Ritika Rawat and Ratika Sharma(2013) lsquoA Survey Content Based Image Retrieval
Based On Color Texture Shape amp Neuro Fuzzyrsquo Int Journal Of Engineering Research And
Applications ISSN 2248-9622 Vol 3 Issue 5 Sep-Oct 2013 pp839-844
8202019 Significance of Dimensionality
httpslidepdfcomreaderfullsignificance-of-dimensionality 1516
Signal amp Image Processing An International Journal (SIPIJ) Vol6 No3 June 2015
41
[4] S Balakrishnama and A Ganapathiraju lsquoLinear Discriminant Analysis - A Brief Tutorialrsquo Institute
for Signal and Information Processing Department of Electrical and Computer Engineering
Mississippi State University
[5] Manimala Singha and K Hemachandran (2012) lsquoContent based image retrieval using color and
texturersquo Signal amp Image Processing An Int J (SIPIJ) Vol3 No1 pp39-57
[6] Pranali Prakash Lokhande and P A Tijare(2012) lsquoFeature Extraction Approach for Content BasedImage Retrievalrsquo IntJournal of Advanced Research in Computer Science and Software Engineering
Vol 2 Issue 2 ISSN 2277 128X
[7] S Mangijao Singh K Hemachandran (2012) ldquoContent-Based Image Retrieval using Color Moment
and Gabor Texture Featurerdquo IntJ of Computer Science IssuesVol 9 Issue 5 No 1 pp299-309
[8] ARamesh Kumar and DSaravanan rsquo Content Based Image Retrieval Using Color Histogramrsquo Int J
of Computer Science and Information Technologies Vol 4 (2) 2013 242 ndash 245 ISSN0975-9646
[9] Swati V Sakhare amp Vrushali G Nasre(2011) lsquoDesign of Feature Extraction in Content Based Image
Retrieval (CBIR) using Color and Texturersquo Int J of Computer Science amp Informatics Vol-I Issue-
II pp57-61
[10] Wasim Khan Shiv Kumar Neetesh Gupta and Nilofar Khan(2011) lsquoA Proposed Method for Image
Retrieval using Histogram values and Texture Descriptor Analysisrsquo Int Jof Soft Computing and
Engineering (IJSCE) ISSN 2231-2307 Vol-I Issue-II pp33-36
[11] SMeenachi Sundaresan and Dr KGSrinivasagan(2013) lsquoDesign of Image Retrieval Efficacy
System Based on CBIRrsquo Int J of Advanced Research in Computer Science and Software
Engineering Vol 3 Issue 4 ISSN 2277 128X pp48-53
[12] Tamer Mehyar Jalal Omer Atoum(2012) lsquoAn Enhancement on Content-Based Image Retrieval using
Color and Texture Featuresrsquo Journal of Emerging Trends in Computing and Information Sciences
Vol 3 No 4ISSN 2079-8407 pp488-496
[13] Pinderjeet Kaur (2012) lsquoImplementation of Principle Component Analysis with Fuzzy Annotation
for CAD Jewellery Imagesrsquo Int J of Emerging Trends amp Technology in Computer ScienceVol 1
Issue 4 ISSN 2278-6856
[14] Arunasakthi K and Kamatchipriya L(2014) lsquoA Review On Linear And Non-Linear Dimensionality
Reduction Techniquesrsquo Machine Learning And Applications An Int J (Mlaij) Vol1 No1 Pp65-
76
[15] Julie M David Kannan Balakrishnan (2014) Learning Disability Prediction Tool using ANN and
ANFIS International Journal of Soft Computing Springer Verlag Berlin Heidelberg ISSN 1432-
7643 (online) ISSN 1433-7479 (print) DOI 101007s00500-013-1129-0 Vol 18 Issue 6 pp 1093-1112
[16] Julie M David Kannan Balakrishnan (2012) Attribute Reduction and Missing Value Imputing with
ANN Prediction of Learning Disabilities International Journal of Neural Computing amp Applications
Springer-Verlag London Limited DOI 101007s00521-011-0619 Vol 21 Issue 7 pp 1757-1763
[17] Kresimir Delac Mislav Grgic and Sonja Grgic (2006) lsquoIndependent Comparative Study of PCA
ICA and LDA on the FERET Data Setrsquo Wiley Periodicals Inc
[18] Dr HBKekre Sudeep D Thepade and Akshay Maloo (2010) lsquoCBIR Feature Vector Dimension
Reduction with Eigenvectors of Covariance Matrix using Row Column and Diagonal Mean
Sequencesrsquo Int J of Computer Applications (0975 ndash 8887)Vol 3 No12
[19] Sebastian Raschka (2014) rsquoLinear Discriminant Analysis bit by bitrsquo
[20] Shereena VB and Julie M David (2014) lsquoContent Based Image Retrieval Classification Using
Neural Networksrsquo The Int J of Multimedia amp Its Applications (IJMA) Vol6 No5 DOI
105121ijma20146503 31[21] Anca Apatean Alexandrina Rogozan Simina Emerich Abdelaziz Bensrhair lsquoWavelets As Features
For Objects Recognitionrsquo
[22] Prof C S Gode Ms A N Ganar(2014) lsquoImage Retrieval by Using Color Texture and Shape
Featuresrsquo IntJournal of Advanced Research in ElectricalElectronics and Instrumentation
Engineering Vol 3 Issue 4 ISSN (Print) 2320 ndash 3765ISSN (Online) 2278 ndash 8875
8202019 Significance of Dimensionality
httpslidepdfcomreaderfullsignificance-of-dimensionality 1616
Signal amp Image Processing An International Journal (SIPIJ) Vol6 No3 June 2015
42
[23] Hamed Fadaei and Thotsapon Sortrakul(2014) lsquoContent-Based Image Retrieval System with
Combining Color features and Gradient featurersquo Int Conference on Advanced Computational
Technologies amp Creative Media
[24] G Sasikala R Kowsalya and Dr M Punithavalli (2010) lsquoA Comparative Study Of Dimension
Reduction Techniques For Content-Based Image Retrievalrsquo The Int J of Multimedia amp Its
Applications Vol2 No3 Doi 105121Ijma20102303 40[25] RPriya DrVasantha Kalyani David(2012) lsquoEnhanced Content Based Image Retrieval Using
Multiple Feature Fusion Algorithmsrsquo Int J of Scientific amp Engineering Research Vol 3 Issue 2
ISSN 2229-5518
[26] Shereena VB and Julie M David (2014) lsquoContent Based Image Retrieval A Reviewrsquo First
International Conference on Computer Science amp Information Technology COSIT 2014 AIRCC
Publishing Corporation Banglore
[27] Jack V Tu (1996) lsquoAdvantages and disadvantages of using artificial neural networks versus logistic
regression for predicting medical outcomesrsquo Journal of clinical Epidemiology Volume 49 Issue 11
Pages 1207-1325
[28] Aravind Nagathan Animozhi and Jithendra Mungara (2014) lsquoContent-Based Image Retrieval System
using Feed-Forward Backpropagation Neural NetworkrsquoIJCSNS International Journal of Computer
Science and Network Security Vol14 No6pp 70-77
[29] Mohandass Divya Jude Janet and Ramadass Suguna (2014) lsquoA genetic optimized neural network for
image retrieval in telemedicinersquo Divya et al EURASIP Journal on Image and Video Processing
[30] Shamla Mantri Nikhil S Tarale and Sudip C Mahajan(2011)rsquo Dimensionality Reduction technique
using Neural Networks ndash A Surveyrsquo(IJACSA) International Journal of Advanced Computer Science
and ApplicationsVol 2 No 4
AUTHORS
Shereena VBreceived her MCA degree from Bharathidasan University Trichy India
in 2000 During 2000-2004 she was with Mahatma Gandhi University Kottayam
India as Lecturer in the Department of Computer Applications Currently she is
working as Asst Professor in the Department of Computer Applications with MES
College Aluva Cochin India She has published papers in International Journals and
International and National Conference Proceedings Her research interests include Data
Mining Machine Learning and Image Processing
Dr Julie M David completed her Masters Degree in Computer Applications and
Masters of Philosophy in Computer Science in the years 2000 and 2009 in Bharathiyar
University Coimbatore India and in Vinayaka Missions University Salem India
respectively She has also completed her Doctorate in the research area of Artificial
Intelligence from Cochin University of Science and Technology Cochin India in 2013
During 2000-2007 she was with Mahatma Gandhi University Kottayam India as
Lecturer in the Department of Computer Applications Currently she is working as an
Assistant Professor in the Department of Computer Applications with MES College
Aluva Cochin India She has published several papers in International Journals and
International and National Conference Proceedings Her research interests include Artificial Intelligence
Data Mining and Machine Learning She is a life member of International Association of Engineers
IAENG Societies of Artificial Intelligence amp Data Mining Computer Society of India etc and a Reviewerof Elsevier International Journal of Knowledge Based Systems Also she is an Editorial Board Member of
various other International Journals She has coordinated various International and National Conferences
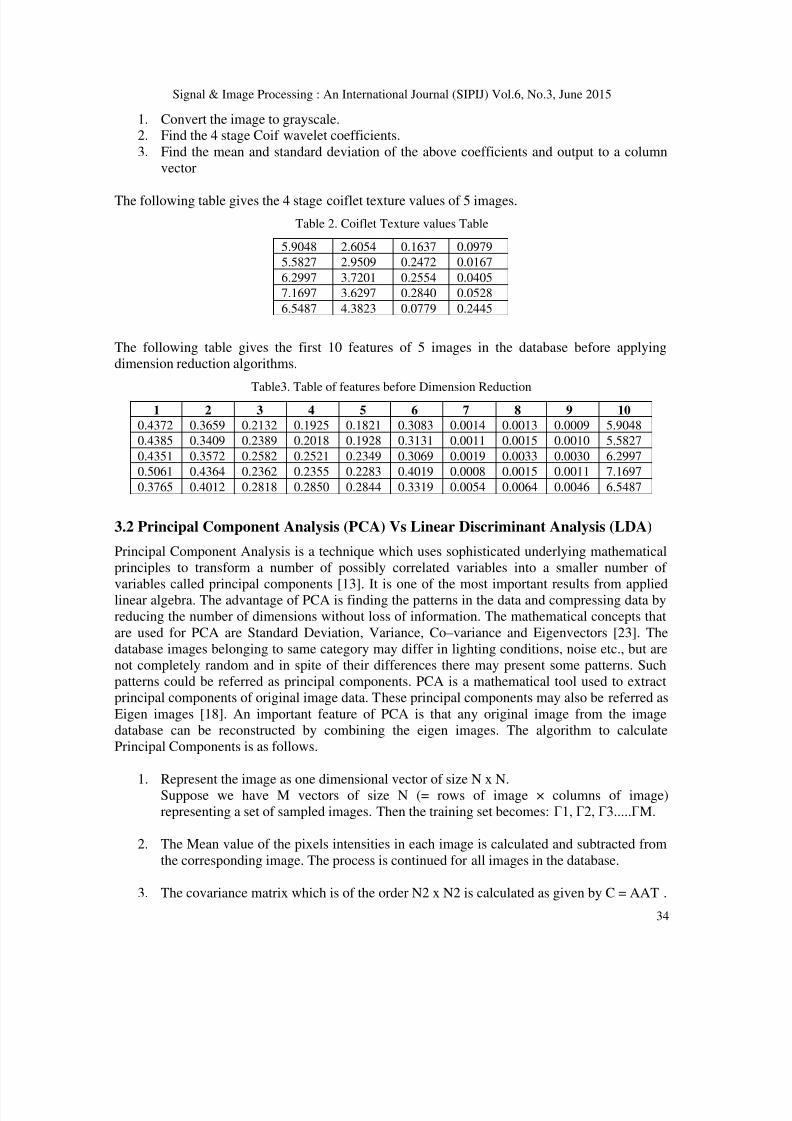
8202019 Significance of Dimensionality
httpslidepdfcomreaderfullsignificance-of-dimensionality 816
Signal amp Image Processing An International Journal (SIPIJ) Vol6 No3 June 2015
34
1 Convert the image to grayscale2
Find the 4 stage Coif wavelet coefficients
3
Find the mean and standard deviation of the above coefficients and output to a column
vector
The following table gives the 4 stage coiflet texture values of 5 images
Table 2 Coiflet Texture values Table
59048 26054 01637 00979
55827 29509 02472 00167
62997 37201 02554 00405
71697 36297 02840 00528
65487 43823 00779 02445
The following table gives the first 10 features of 5 images in the database before applying
dimension reduction algorithms
Table3 Table of features before Dimension Reduction1 2 3 4 5 6 7 8 9 10
04372 03659 02132 01925 01821 03083 00014 00013 00009 59048
04385 03409 02389 02018 01928 03131 00011 00015 00010 55827
04351 03572 02582 02521 02349 03069 00019 00033 00030 62997
05061 04364 02362 02355 02283 04019 00008 00015 00011 71697
03765 04012 02818 02850 02844 03319 00054 00064 00046 65487
32 Principal Component Analysis (PCA) Vs Linear Discriminant Analysis (LDA)
Principal Component Analysis is a technique which uses sophisticated underlying mathematical
principles to transform a number of possibly correlated variables into a smaller number of
variables called principal components [13] It is one of the most important results from appliedlinear algebra The advantage of PCA is finding the patterns in the data and compressing data by
reducing the number of dimensions without loss of information The mathematical concepts that
are used for PCA are Standard Deviation Variance Condashvariance and Eigenvectors [23] The
database images belonging to same category may differ in lighting conditions noise etc but are
not completely random and in spite of their differences there may present some patterns Such
patterns could be referred as principal components PCA is a mathematical tool used to extract
principal components of original image data These principal components may also be referred as
Eigen images [18] An important feature of PCA is that any original image from the image
database can be reconstructed by combining the eigen images The algorithm to calculate
Principal Components is as follows
1
Represent the image as one dimensional vector of size N x NSuppose we have M vectors of size N (= rows of image times columns of image)
representing a set of sampled images Then the training set becomes Γ1 Γ2 Γ3ΓM
2
The Mean value of the pixels intensities in each image is calculated and subtracted from
the corresponding image The process is continued for all images in the database
3 The covariance matrix which is of the order N2 x N2 is calculated as given by C = AAT
8202019 Significance of Dimensionality
httpslidepdfcomreaderfullsignificance-of-dimensionality 916
Signal amp Image Processing An International Journal (SIPIJ) Vol6 No3 June 2015
35
4 Find the Eigen values of the covariance matrix C by solving the equation (Cλ - I) = 0 Tofind the eigenvector X repeat the procedure where Xi indicates corresponding Eigen
values
5
The Eigen vectors are sorted according to the corresponding Eigen values in descending
order
6
Choose the First lsquoKrsquo Eigen vectors and Eigen Values
The following table gives the first 10 features of 5 images after applying the dimension reduction
algorithm PCA and reducing the feature database
Table 4 Table of features after Dimension Reduction
Linear Discriminant Analysis (LDA) [24] is most commonly used as dimensionality reduction
technique in the pre-processing step for pattern-classification and machine learning applications
The feature selection in traditional LDA [14] is obtained by maximizing the difference between
classes and minimizing the distance within classes LDA finds the vectors in the underlying space
that best discriminate among classes The prime difference between LDA and PCA is that PCA
does more of feature classification and LDA does data classification [4]
1 Compute the d -dimensional mean vectors for the different classes from the dataset2
Compute the scatter matrices (between-class and within-class scatter matrix)
3
Compute the eigenvectors (e1 e2 ed) and corresponding eigen values (λ 1 λ 2 λ d) for
the scatter matrices
4
Sort the eigenvectors by decreasing eigenvalues and choose k eigenvectors with the
largest eigenvalues to form a d timesk -dimensional matrix W (where every column represents
an eigenvector)
5
Use this d timesk eigenvector matrix to transform the samples onto the new subspace This
can be summarized by the mathematical equation y = WT times x (where x is a dtimes1-
dimensional vector representing one sample and y is the transformed ktimes1-dimensional
sample in the new subspace)
The performance comparison of PCA and LDA can also be done using neural networks by giving
the reduced feature set obtained using PCA or LDA as input to the neural network Neuralnetwork is a network of neuron like units called nodes [29] This neural computing technique is
used in fields of classification optimization control theory and for solving regression problemsThey are very effective in case of classification problems where detection and recognition of
target is required The architecture of neural network consists of a large number of nodes and
interconnection of nodes The individual inputs P1 P2hellip PR are weighted by correspondingelements W11 W12hellipW1R of the weight matrix W [20]
The neuron also has a bias lsquobrsquo which is summed with the weighted inputs to form the net input
lsquonrsquo
8202019 Significance of Dimensionality
httpslidepdfcomreaderfullsignificance-of-dimensionality 1016
Signal amp Image Processing An International Journal (SIPIJ) Vol6 No3 June 2015
36
n = W11 P1 + W12 P2 + hellip W1R PR + b
In matrix form this can be rewritten as
n = W P + b
Now the neuron output is given as
a = f (W P + b)
The transfer function used above is a log-sigmoid transfer function This transfer function takes
the input (which may have any value between plus and minus infinity) and squashes the output in
between 0 to 1 range according to the expression
y = 1 (1+e-n
)
The nodes at a particular stage constitute a layer The first layer is called input layer and last layer
is called output layer The layers in between output and input layer are called hidden layers Asthe number of hidden layers in the network increases the performance of network increases Each
node in a network serves the purpose of summation of all its inputs The output of a node is
further applied to the next node
In this paper Levenberg-Marquardt backpropagation algorithm (trainlm) is used for
classification Trainlm is a network training function that updates weight and bias values
according to Levenberg-Marquardt optimization Trainlm is often the fastest back propagation
algorithm in the matlab toolbox and is highly recommended as a first-choice supervised
algorithm The training process include creation configuring a three-layered neural network andmaking it learn about the extracted color and texture features of training set images Here we use
the reduced feature set obtained from PCA or LDA for the training of images The learning
process is carried out using backpropagation algorithm The training makes the network store thelearnt knowledge in its knowledge base This knowledge base is used in later phase in
comparison and decision making tasks by network
33 Similarity Matching
If R be the dimensionality reduced feature database and R is the feature vector obtained from
query image then the retrieval system is based on a similarity measure defined between R and
R [25] In this paper Euclidean distance is used to measure the similarity between the feature
vectors of reduced query image and reduced database images in the case of PCA and LDA In
the case of Neural Network based PCALDA the matching and decision making is done by the
neural network
34 Performance Evaluation
The performance of retrieval of the system can be measured in terms of its Recall and Precision
Recall measures the ability of the system to retrieve all the models that are relevant while
Precision measures the ability of the system to retrieve only the models that are relevant [20]
8202019 Significance of Dimensionality
httpslidepdfcomreaderfullsignificance-of-dimensionality 1116
Signal amp Image Processing An International Journal (SIPIJ) Vol6 No3 June 2015
37
=
=
The number of relevant items retrieved is the number of the returned images that are similar to
the query image in this case The total number of images retrieved is the total number of images
that are returned by the retrieval system In precision and recall crossover is the point on the
graph where the both precision and recall curves meet The higher the number of crossover points
better will be the performance of the system
4 COMPARATIVE STUDY OF PCA AND LDA
The proposed method has been implemented using Matlab 13 and tested on a general-purpose
database containing 500 images in JPG format of size 256X384 resized to 286x340 The
database includes 500 color images categorized into five classes and each class includes 100images as follows African people Beach Building Bus Dinosaurs The search is based on the
similarity of feature vectors We have followed the image retrieval technique as described in the
section 3 on different feature extraction schemes such as color and texture This scheme
calculated 110 features by means of histogram moments correlogram and Coif wavelet FurtherPrincipal Component Analysis technique and Linear Discriminant Analysis technique is used to
extract the best features from the images By means of PCA and LDA the feature set is reduced
to 75Then the reduced query image is compared with the reduced database feature set using
Euclidean Distance and the top 6 nearer images are displayed In neural network classifier based
PCA or LDA We used Levenberg-Marquardt backpropagation algorithm (trainlm) with 3 hiddenlayers for classification Here the network is trained about the reduced feature set (using PCA
LDA) of all the images from the training dataset A given query image is feature extracted and
searched for similar images For each query image relevant images are considered to be thosewhich belong to the same category as the query image The performance of the training process
can be analysed using the Precision Recall plot
The quality of the image retrieval with different feature extraction schemes has been evaluated
by randomly selecting query images of each category from test image database Each query
returns the top 6 images from database To measure retrieval effectiveness for the image retrieval
system Precision and Recall values are used The Precision Recall rates and plots for PCA LDA
Neural Network based PCA Neural Network based LDA and without dimension reduction
methods are shown in figure1 The graphical user interface for the retrieval of images using
dimension reduction with PCA LDA and Neural Network based PCA and Neural Network
based LDA are shown in the figure 2 figure3 and figure4 and figure5 respectively
From the GUI the database is to be selected first using Select Database button ie the database
of 500 images Then the query image is selected from a set of test images using Select Query
button The query can be processed under 5 options- without dimension reduction Dimension
Reduction using PCA and Dimension Reduction using LDA Neural Network based PCA and
Neural Network based LDA The images are retrieved based on the option selected and top 6
images are displayed in the Returned images frame The Precision-Recall Plot gives the Precision
and Recall rates of the selected option The Performance Comparison button shows the Precision-
8202019 Significance of Dimensionality
httpslidepdfcomreaderfullsignificance-of-dimensionality 1216
Signal amp Image Processing An International Journal (SIPIJ) Vol6 No3 June 2015
38
Recall plots of all the methods of the selected query image From the Table 5 of Precision andRecall it is found that the rates are higher for PCA when compared to LDA This shows that
PCA is a better dimension reduction tool when compared to the other methods
Table 5 Table of Precision Recall Rates
Figure1 Precision ndashRecall Plot
8202019 Significance of Dimensionality
httpslidepdfcomreaderfullsignificance-of-dimensionality 1316
Signal amp Image Processing An International Journal (SIPIJ) Vol6 No3 June 2015
39
Figure 2Dimension Reduction using PCA
Figure 3 Dimension Reduction using LDA
Figure 4 Neural Network Based PCA
8202019 Significance of Dimensionality
httpslidepdfcomreaderfullsignificance-of-dimensionality 1416
Signal amp Image Processing An International Journal (SIPIJ) Vol6 No3 June 2015
40
Figure 5 Neural Network Based LDA
5 CONCLUSION
In this paper we presented a comparative study of dimension reduction methods namely
Principal Component Analysis and Linear Discriminant Analysis Dimensionality reductionmethods aim at revealing meaningful structures and unexpected relationships in multivariate data
PCA projects correlated variables into a lower number of uncorrelated variables called principal
components By using only the first few principal components or eigen vectors PCA makes it
possible to reduce the number of significant dimensions of the data while maintaining the
maximum possible variance The objective of LDA is to perform dimensionality reduction whilepreserving as much of the class discriminatory information as possible In LDA we will compute
eigenvectors from our dataset and collect them in scatter-matrices the between-class scatter
matrix and within-class scatter matrix In Neural Network based PCALDA the network is
trained about the reduced feature set (using PCA or LDA) of all the images from the training
dataset The training algorithm used in this paper is Levenberg-Marquardt backpropagationalgorithm (trainlm) with 3 hidden layers From the Precision and Recall rates calculated in the
table in the above section it can be found that the rates are high for all the cases of PCA when
compared to the LDA Thus it is concluded that PCA tends to outperform LDA in almost all
cases and hence PCA can be adopted as an effective tool for dimension reduction
REFERENCES
[1] Rafael Gonzalez and Richard E Woods lsquoDigital Image processingrsquo Addison Wesley 2nd Edn
2002
[2] HH Pavan Kumar Bhuravarjula And VNS Vijaya Kumar(2012) lsquoA Novel Content Based Image
Retrieval Using Variance Color Momentrsquo Int J Of Computer And Electronics ResearchVol 1
Issue 3 ISSN 2278-5795 pp93-99
[3] Mohd Danish Ritika Rawat and Ratika Sharma(2013) lsquoA Survey Content Based Image Retrieval
Based On Color Texture Shape amp Neuro Fuzzyrsquo Int Journal Of Engineering Research And
Applications ISSN 2248-9622 Vol 3 Issue 5 Sep-Oct 2013 pp839-844
8202019 Significance of Dimensionality
httpslidepdfcomreaderfullsignificance-of-dimensionality 1516
Signal amp Image Processing An International Journal (SIPIJ) Vol6 No3 June 2015
41
[4] S Balakrishnama and A Ganapathiraju lsquoLinear Discriminant Analysis - A Brief Tutorialrsquo Institute
for Signal and Information Processing Department of Electrical and Computer Engineering
Mississippi State University
[5] Manimala Singha and K Hemachandran (2012) lsquoContent based image retrieval using color and
texturersquo Signal amp Image Processing An Int J (SIPIJ) Vol3 No1 pp39-57
[6] Pranali Prakash Lokhande and P A Tijare(2012) lsquoFeature Extraction Approach for Content BasedImage Retrievalrsquo IntJournal of Advanced Research in Computer Science and Software Engineering
Vol 2 Issue 2 ISSN 2277 128X
[7] S Mangijao Singh K Hemachandran (2012) ldquoContent-Based Image Retrieval using Color Moment
and Gabor Texture Featurerdquo IntJ of Computer Science IssuesVol 9 Issue 5 No 1 pp299-309
[8] ARamesh Kumar and DSaravanan rsquo Content Based Image Retrieval Using Color Histogramrsquo Int J
of Computer Science and Information Technologies Vol 4 (2) 2013 242 ndash 245 ISSN0975-9646
[9] Swati V Sakhare amp Vrushali G Nasre(2011) lsquoDesign of Feature Extraction in Content Based Image
Retrieval (CBIR) using Color and Texturersquo Int J of Computer Science amp Informatics Vol-I Issue-
II pp57-61
[10] Wasim Khan Shiv Kumar Neetesh Gupta and Nilofar Khan(2011) lsquoA Proposed Method for Image
Retrieval using Histogram values and Texture Descriptor Analysisrsquo Int Jof Soft Computing and
Engineering (IJSCE) ISSN 2231-2307 Vol-I Issue-II pp33-36
[11] SMeenachi Sundaresan and Dr KGSrinivasagan(2013) lsquoDesign of Image Retrieval Efficacy
System Based on CBIRrsquo Int J of Advanced Research in Computer Science and Software
Engineering Vol 3 Issue 4 ISSN 2277 128X pp48-53
[12] Tamer Mehyar Jalal Omer Atoum(2012) lsquoAn Enhancement on Content-Based Image Retrieval using
Color and Texture Featuresrsquo Journal of Emerging Trends in Computing and Information Sciences
Vol 3 No 4ISSN 2079-8407 pp488-496
[13] Pinderjeet Kaur (2012) lsquoImplementation of Principle Component Analysis with Fuzzy Annotation
for CAD Jewellery Imagesrsquo Int J of Emerging Trends amp Technology in Computer ScienceVol 1
Issue 4 ISSN 2278-6856
[14] Arunasakthi K and Kamatchipriya L(2014) lsquoA Review On Linear And Non-Linear Dimensionality
Reduction Techniquesrsquo Machine Learning And Applications An Int J (Mlaij) Vol1 No1 Pp65-
76
[15] Julie M David Kannan Balakrishnan (2014) Learning Disability Prediction Tool using ANN and
ANFIS International Journal of Soft Computing Springer Verlag Berlin Heidelberg ISSN 1432-
7643 (online) ISSN 1433-7479 (print) DOI 101007s00500-013-1129-0 Vol 18 Issue 6 pp 1093-1112
[16] Julie M David Kannan Balakrishnan (2012) Attribute Reduction and Missing Value Imputing with
ANN Prediction of Learning Disabilities International Journal of Neural Computing amp Applications
Springer-Verlag London Limited DOI 101007s00521-011-0619 Vol 21 Issue 7 pp 1757-1763
[17] Kresimir Delac Mislav Grgic and Sonja Grgic (2006) lsquoIndependent Comparative Study of PCA
ICA and LDA on the FERET Data Setrsquo Wiley Periodicals Inc
[18] Dr HBKekre Sudeep D Thepade and Akshay Maloo (2010) lsquoCBIR Feature Vector Dimension
Reduction with Eigenvectors of Covariance Matrix using Row Column and Diagonal Mean
Sequencesrsquo Int J of Computer Applications (0975 ndash 8887)Vol 3 No12
[19] Sebastian Raschka (2014) rsquoLinear Discriminant Analysis bit by bitrsquo
[20] Shereena VB and Julie M David (2014) lsquoContent Based Image Retrieval Classification Using
Neural Networksrsquo The Int J of Multimedia amp Its Applications (IJMA) Vol6 No5 DOI
105121ijma20146503 31[21] Anca Apatean Alexandrina Rogozan Simina Emerich Abdelaziz Bensrhair lsquoWavelets As Features
For Objects Recognitionrsquo
[22] Prof C S Gode Ms A N Ganar(2014) lsquoImage Retrieval by Using Color Texture and Shape
Featuresrsquo IntJournal of Advanced Research in ElectricalElectronics and Instrumentation
Engineering Vol 3 Issue 4 ISSN (Print) 2320 ndash 3765ISSN (Online) 2278 ndash 8875
8202019 Significance of Dimensionality
httpslidepdfcomreaderfullsignificance-of-dimensionality 1616
Signal amp Image Processing An International Journal (SIPIJ) Vol6 No3 June 2015
42
[23] Hamed Fadaei and Thotsapon Sortrakul(2014) lsquoContent-Based Image Retrieval System with
Combining Color features and Gradient featurersquo Int Conference on Advanced Computational
Technologies amp Creative Media
[24] G Sasikala R Kowsalya and Dr M Punithavalli (2010) lsquoA Comparative Study Of Dimension
Reduction Techniques For Content-Based Image Retrievalrsquo The Int J of Multimedia amp Its
Applications Vol2 No3 Doi 105121Ijma20102303 40[25] RPriya DrVasantha Kalyani David(2012) lsquoEnhanced Content Based Image Retrieval Using
Multiple Feature Fusion Algorithmsrsquo Int J of Scientific amp Engineering Research Vol 3 Issue 2
ISSN 2229-5518
[26] Shereena VB and Julie M David (2014) lsquoContent Based Image Retrieval A Reviewrsquo First
International Conference on Computer Science amp Information Technology COSIT 2014 AIRCC
Publishing Corporation Banglore
[27] Jack V Tu (1996) lsquoAdvantages and disadvantages of using artificial neural networks versus logistic
regression for predicting medical outcomesrsquo Journal of clinical Epidemiology Volume 49 Issue 11
Pages 1207-1325
[28] Aravind Nagathan Animozhi and Jithendra Mungara (2014) lsquoContent-Based Image Retrieval System
using Feed-Forward Backpropagation Neural NetworkrsquoIJCSNS International Journal of Computer
Science and Network Security Vol14 No6pp 70-77
[29] Mohandass Divya Jude Janet and Ramadass Suguna (2014) lsquoA genetic optimized neural network for
image retrieval in telemedicinersquo Divya et al EURASIP Journal on Image and Video Processing
[30] Shamla Mantri Nikhil S Tarale and Sudip C Mahajan(2011)rsquo Dimensionality Reduction technique
using Neural Networks ndash A Surveyrsquo(IJACSA) International Journal of Advanced Computer Science
and ApplicationsVol 2 No 4
AUTHORS
Shereena VBreceived her MCA degree from Bharathidasan University Trichy India
in 2000 During 2000-2004 she was with Mahatma Gandhi University Kottayam
India as Lecturer in the Department of Computer Applications Currently she is
working as Asst Professor in the Department of Computer Applications with MES
College Aluva Cochin India She has published papers in International Journals and
International and National Conference Proceedings Her research interests include Data
Mining Machine Learning and Image Processing
Dr Julie M David completed her Masters Degree in Computer Applications and
Masters of Philosophy in Computer Science in the years 2000 and 2009 in Bharathiyar
University Coimbatore India and in Vinayaka Missions University Salem India
respectively She has also completed her Doctorate in the research area of Artificial
Intelligence from Cochin University of Science and Technology Cochin India in 2013
During 2000-2007 she was with Mahatma Gandhi University Kottayam India as
Lecturer in the Department of Computer Applications Currently she is working as an
Assistant Professor in the Department of Computer Applications with MES College
Aluva Cochin India She has published several papers in International Journals and
International and National Conference Proceedings Her research interests include Artificial Intelligence
Data Mining and Machine Learning She is a life member of International Association of Engineers
IAENG Societies of Artificial Intelligence amp Data Mining Computer Society of India etc and a Reviewerof Elsevier International Journal of Knowledge Based Systems Also she is an Editorial Board Member of
various other International Journals She has coordinated various International and National Conferences
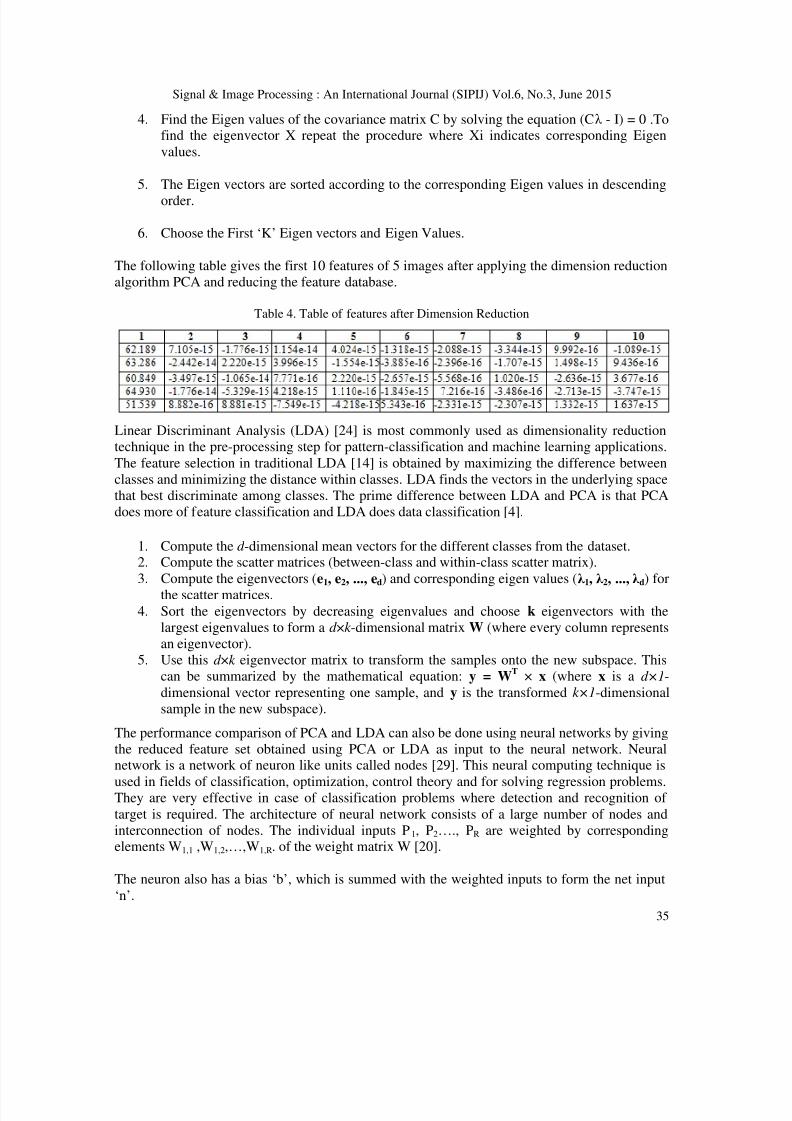
8202019 Significance of Dimensionality
httpslidepdfcomreaderfullsignificance-of-dimensionality 916
Signal amp Image Processing An International Journal (SIPIJ) Vol6 No3 June 2015
35
4 Find the Eigen values of the covariance matrix C by solving the equation (Cλ - I) = 0 Tofind the eigenvector X repeat the procedure where Xi indicates corresponding Eigen
values
5
The Eigen vectors are sorted according to the corresponding Eigen values in descending
order
6
Choose the First lsquoKrsquo Eigen vectors and Eigen Values
The following table gives the first 10 features of 5 images after applying the dimension reduction
algorithm PCA and reducing the feature database
Table 4 Table of features after Dimension Reduction
Linear Discriminant Analysis (LDA) [24] is most commonly used as dimensionality reduction
technique in the pre-processing step for pattern-classification and machine learning applications
The feature selection in traditional LDA [14] is obtained by maximizing the difference between
classes and minimizing the distance within classes LDA finds the vectors in the underlying space
that best discriminate among classes The prime difference between LDA and PCA is that PCA
does more of feature classification and LDA does data classification [4]
1 Compute the d -dimensional mean vectors for the different classes from the dataset2
Compute the scatter matrices (between-class and within-class scatter matrix)
3
Compute the eigenvectors (e1 e2 ed) and corresponding eigen values (λ 1 λ 2 λ d) for
the scatter matrices
4
Sort the eigenvectors by decreasing eigenvalues and choose k eigenvectors with the
largest eigenvalues to form a d timesk -dimensional matrix W (where every column represents
an eigenvector)
5
Use this d timesk eigenvector matrix to transform the samples onto the new subspace This
can be summarized by the mathematical equation y = WT times x (where x is a dtimes1-
dimensional vector representing one sample and y is the transformed ktimes1-dimensional
sample in the new subspace)
The performance comparison of PCA and LDA can also be done using neural networks by giving
the reduced feature set obtained using PCA or LDA as input to the neural network Neuralnetwork is a network of neuron like units called nodes [29] This neural computing technique is
used in fields of classification optimization control theory and for solving regression problemsThey are very effective in case of classification problems where detection and recognition of
target is required The architecture of neural network consists of a large number of nodes and
interconnection of nodes The individual inputs P1 P2hellip PR are weighted by correspondingelements W11 W12hellipW1R of the weight matrix W [20]
The neuron also has a bias lsquobrsquo which is summed with the weighted inputs to form the net input
lsquonrsquo
8202019 Significance of Dimensionality
httpslidepdfcomreaderfullsignificance-of-dimensionality 1016
Signal amp Image Processing An International Journal (SIPIJ) Vol6 No3 June 2015
36
n = W11 P1 + W12 P2 + hellip W1R PR + b
In matrix form this can be rewritten as
n = W P + b
Now the neuron output is given as
a = f (W P + b)
The transfer function used above is a log-sigmoid transfer function This transfer function takes
the input (which may have any value between plus and minus infinity) and squashes the output in
between 0 to 1 range according to the expression
y = 1 (1+e-n
)
The nodes at a particular stage constitute a layer The first layer is called input layer and last layer
is called output layer The layers in between output and input layer are called hidden layers Asthe number of hidden layers in the network increases the performance of network increases Each
node in a network serves the purpose of summation of all its inputs The output of a node is
further applied to the next node
In this paper Levenberg-Marquardt backpropagation algorithm (trainlm) is used for
classification Trainlm is a network training function that updates weight and bias values
according to Levenberg-Marquardt optimization Trainlm is often the fastest back propagation
algorithm in the matlab toolbox and is highly recommended as a first-choice supervised
algorithm The training process include creation configuring a three-layered neural network andmaking it learn about the extracted color and texture features of training set images Here we use
the reduced feature set obtained from PCA or LDA for the training of images The learning
process is carried out using backpropagation algorithm The training makes the network store thelearnt knowledge in its knowledge base This knowledge base is used in later phase in
comparison and decision making tasks by network
33 Similarity Matching
If R be the dimensionality reduced feature database and R is the feature vector obtained from
query image then the retrieval system is based on a similarity measure defined between R and
R [25] In this paper Euclidean distance is used to measure the similarity between the feature
vectors of reduced query image and reduced database images in the case of PCA and LDA In
the case of Neural Network based PCALDA the matching and decision making is done by the
neural network
34 Performance Evaluation
The performance of retrieval of the system can be measured in terms of its Recall and Precision
Recall measures the ability of the system to retrieve all the models that are relevant while
Precision measures the ability of the system to retrieve only the models that are relevant [20]
8202019 Significance of Dimensionality
httpslidepdfcomreaderfullsignificance-of-dimensionality 1116
Signal amp Image Processing An International Journal (SIPIJ) Vol6 No3 June 2015
37
=
=
The number of relevant items retrieved is the number of the returned images that are similar to
the query image in this case The total number of images retrieved is the total number of images
that are returned by the retrieval system In precision and recall crossover is the point on the
graph where the both precision and recall curves meet The higher the number of crossover points
better will be the performance of the system
4 COMPARATIVE STUDY OF PCA AND LDA
The proposed method has been implemented using Matlab 13 and tested on a general-purpose
database containing 500 images in JPG format of size 256X384 resized to 286x340 The
database includes 500 color images categorized into five classes and each class includes 100images as follows African people Beach Building Bus Dinosaurs The search is based on the
similarity of feature vectors We have followed the image retrieval technique as described in the
section 3 on different feature extraction schemes such as color and texture This scheme
calculated 110 features by means of histogram moments correlogram and Coif wavelet FurtherPrincipal Component Analysis technique and Linear Discriminant Analysis technique is used to
extract the best features from the images By means of PCA and LDA the feature set is reduced
to 75Then the reduced query image is compared with the reduced database feature set using
Euclidean Distance and the top 6 nearer images are displayed In neural network classifier based
PCA or LDA We used Levenberg-Marquardt backpropagation algorithm (trainlm) with 3 hiddenlayers for classification Here the network is trained about the reduced feature set (using PCA
LDA) of all the images from the training dataset A given query image is feature extracted and
searched for similar images For each query image relevant images are considered to be thosewhich belong to the same category as the query image The performance of the training process
can be analysed using the Precision Recall plot
The quality of the image retrieval with different feature extraction schemes has been evaluated
by randomly selecting query images of each category from test image database Each query
returns the top 6 images from database To measure retrieval effectiveness for the image retrieval
system Precision and Recall values are used The Precision Recall rates and plots for PCA LDA
Neural Network based PCA Neural Network based LDA and without dimension reduction
methods are shown in figure1 The graphical user interface for the retrieval of images using
dimension reduction with PCA LDA and Neural Network based PCA and Neural Network
based LDA are shown in the figure 2 figure3 and figure4 and figure5 respectively
From the GUI the database is to be selected first using Select Database button ie the database
of 500 images Then the query image is selected from a set of test images using Select Query
button The query can be processed under 5 options- without dimension reduction Dimension
Reduction using PCA and Dimension Reduction using LDA Neural Network based PCA and
Neural Network based LDA The images are retrieved based on the option selected and top 6
images are displayed in the Returned images frame The Precision-Recall Plot gives the Precision
and Recall rates of the selected option The Performance Comparison button shows the Precision-
8202019 Significance of Dimensionality
httpslidepdfcomreaderfullsignificance-of-dimensionality 1216
Signal amp Image Processing An International Journal (SIPIJ) Vol6 No3 June 2015
38
Recall plots of all the methods of the selected query image From the Table 5 of Precision andRecall it is found that the rates are higher for PCA when compared to LDA This shows that
PCA is a better dimension reduction tool when compared to the other methods
Table 5 Table of Precision Recall Rates
Figure1 Precision ndashRecall Plot
8202019 Significance of Dimensionality
httpslidepdfcomreaderfullsignificance-of-dimensionality 1316
Signal amp Image Processing An International Journal (SIPIJ) Vol6 No3 June 2015
39
Figure 2Dimension Reduction using PCA
Figure 3 Dimension Reduction using LDA
Figure 4 Neural Network Based PCA
8202019 Significance of Dimensionality
httpslidepdfcomreaderfullsignificance-of-dimensionality 1416
Signal amp Image Processing An International Journal (SIPIJ) Vol6 No3 June 2015
40
Figure 5 Neural Network Based LDA
5 CONCLUSION
In this paper we presented a comparative study of dimension reduction methods namely
Principal Component Analysis and Linear Discriminant Analysis Dimensionality reductionmethods aim at revealing meaningful structures and unexpected relationships in multivariate data
PCA projects correlated variables into a lower number of uncorrelated variables called principal
components By using only the first few principal components or eigen vectors PCA makes it
possible to reduce the number of significant dimensions of the data while maintaining the
maximum possible variance The objective of LDA is to perform dimensionality reduction whilepreserving as much of the class discriminatory information as possible In LDA we will compute
eigenvectors from our dataset and collect them in scatter-matrices the between-class scatter
matrix and within-class scatter matrix In Neural Network based PCALDA the network is
trained about the reduced feature set (using PCA or LDA) of all the images from the training
dataset The training algorithm used in this paper is Levenberg-Marquardt backpropagationalgorithm (trainlm) with 3 hidden layers From the Precision and Recall rates calculated in the
table in the above section it can be found that the rates are high for all the cases of PCA when
compared to the LDA Thus it is concluded that PCA tends to outperform LDA in almost all
cases and hence PCA can be adopted as an effective tool for dimension reduction
REFERENCES
[1] Rafael Gonzalez and Richard E Woods lsquoDigital Image processingrsquo Addison Wesley 2nd Edn
2002
[2] HH Pavan Kumar Bhuravarjula And VNS Vijaya Kumar(2012) lsquoA Novel Content Based Image
Retrieval Using Variance Color Momentrsquo Int J Of Computer And Electronics ResearchVol 1
Issue 3 ISSN 2278-5795 pp93-99
[3] Mohd Danish Ritika Rawat and Ratika Sharma(2013) lsquoA Survey Content Based Image Retrieval
Based On Color Texture Shape amp Neuro Fuzzyrsquo Int Journal Of Engineering Research And
Applications ISSN 2248-9622 Vol 3 Issue 5 Sep-Oct 2013 pp839-844
8202019 Significance of Dimensionality
httpslidepdfcomreaderfullsignificance-of-dimensionality 1516
Signal amp Image Processing An International Journal (SIPIJ) Vol6 No3 June 2015
41
[4] S Balakrishnama and A Ganapathiraju lsquoLinear Discriminant Analysis - A Brief Tutorialrsquo Institute
for Signal and Information Processing Department of Electrical and Computer Engineering
Mississippi State University
[5] Manimala Singha and K Hemachandran (2012) lsquoContent based image retrieval using color and
texturersquo Signal amp Image Processing An Int J (SIPIJ) Vol3 No1 pp39-57
[6] Pranali Prakash Lokhande and P A Tijare(2012) lsquoFeature Extraction Approach for Content BasedImage Retrievalrsquo IntJournal of Advanced Research in Computer Science and Software Engineering
Vol 2 Issue 2 ISSN 2277 128X
[7] S Mangijao Singh K Hemachandran (2012) ldquoContent-Based Image Retrieval using Color Moment
and Gabor Texture Featurerdquo IntJ of Computer Science IssuesVol 9 Issue 5 No 1 pp299-309
[8] ARamesh Kumar and DSaravanan rsquo Content Based Image Retrieval Using Color Histogramrsquo Int J
of Computer Science and Information Technologies Vol 4 (2) 2013 242 ndash 245 ISSN0975-9646
[9] Swati V Sakhare amp Vrushali G Nasre(2011) lsquoDesign of Feature Extraction in Content Based Image
Retrieval (CBIR) using Color and Texturersquo Int J of Computer Science amp Informatics Vol-I Issue-
II pp57-61
[10] Wasim Khan Shiv Kumar Neetesh Gupta and Nilofar Khan(2011) lsquoA Proposed Method for Image
Retrieval using Histogram values and Texture Descriptor Analysisrsquo Int Jof Soft Computing and
Engineering (IJSCE) ISSN 2231-2307 Vol-I Issue-II pp33-36
[11] SMeenachi Sundaresan and Dr KGSrinivasagan(2013) lsquoDesign of Image Retrieval Efficacy
System Based on CBIRrsquo Int J of Advanced Research in Computer Science and Software
Engineering Vol 3 Issue 4 ISSN 2277 128X pp48-53
[12] Tamer Mehyar Jalal Omer Atoum(2012) lsquoAn Enhancement on Content-Based Image Retrieval using
Color and Texture Featuresrsquo Journal of Emerging Trends in Computing and Information Sciences
Vol 3 No 4ISSN 2079-8407 pp488-496
[13] Pinderjeet Kaur (2012) lsquoImplementation of Principle Component Analysis with Fuzzy Annotation
for CAD Jewellery Imagesrsquo Int J of Emerging Trends amp Technology in Computer ScienceVol 1
Issue 4 ISSN 2278-6856
[14] Arunasakthi K and Kamatchipriya L(2014) lsquoA Review On Linear And Non-Linear Dimensionality
Reduction Techniquesrsquo Machine Learning And Applications An Int J (Mlaij) Vol1 No1 Pp65-
76
[15] Julie M David Kannan Balakrishnan (2014) Learning Disability Prediction Tool using ANN and
ANFIS International Journal of Soft Computing Springer Verlag Berlin Heidelberg ISSN 1432-
7643 (online) ISSN 1433-7479 (print) DOI 101007s00500-013-1129-0 Vol 18 Issue 6 pp 1093-1112
[16] Julie M David Kannan Balakrishnan (2012) Attribute Reduction and Missing Value Imputing with
ANN Prediction of Learning Disabilities International Journal of Neural Computing amp Applications
Springer-Verlag London Limited DOI 101007s00521-011-0619 Vol 21 Issue 7 pp 1757-1763
[17] Kresimir Delac Mislav Grgic and Sonja Grgic (2006) lsquoIndependent Comparative Study of PCA
ICA and LDA on the FERET Data Setrsquo Wiley Periodicals Inc
[18] Dr HBKekre Sudeep D Thepade and Akshay Maloo (2010) lsquoCBIR Feature Vector Dimension
Reduction with Eigenvectors of Covariance Matrix using Row Column and Diagonal Mean
Sequencesrsquo Int J of Computer Applications (0975 ndash 8887)Vol 3 No12
[19] Sebastian Raschka (2014) rsquoLinear Discriminant Analysis bit by bitrsquo
[20] Shereena VB and Julie M David (2014) lsquoContent Based Image Retrieval Classification Using
Neural Networksrsquo The Int J of Multimedia amp Its Applications (IJMA) Vol6 No5 DOI
105121ijma20146503 31[21] Anca Apatean Alexandrina Rogozan Simina Emerich Abdelaziz Bensrhair lsquoWavelets As Features
For Objects Recognitionrsquo
[22] Prof C S Gode Ms A N Ganar(2014) lsquoImage Retrieval by Using Color Texture and Shape
Featuresrsquo IntJournal of Advanced Research in ElectricalElectronics and Instrumentation
Engineering Vol 3 Issue 4 ISSN (Print) 2320 ndash 3765ISSN (Online) 2278 ndash 8875
8202019 Significance of Dimensionality
httpslidepdfcomreaderfullsignificance-of-dimensionality 1616
Signal amp Image Processing An International Journal (SIPIJ) Vol6 No3 June 2015
42
[23] Hamed Fadaei and Thotsapon Sortrakul(2014) lsquoContent-Based Image Retrieval System with
Combining Color features and Gradient featurersquo Int Conference on Advanced Computational
Technologies amp Creative Media
[24] G Sasikala R Kowsalya and Dr M Punithavalli (2010) lsquoA Comparative Study Of Dimension
Reduction Techniques For Content-Based Image Retrievalrsquo The Int J of Multimedia amp Its
Applications Vol2 No3 Doi 105121Ijma20102303 40[25] RPriya DrVasantha Kalyani David(2012) lsquoEnhanced Content Based Image Retrieval Using
Multiple Feature Fusion Algorithmsrsquo Int J of Scientific amp Engineering Research Vol 3 Issue 2
ISSN 2229-5518
[26] Shereena VB and Julie M David (2014) lsquoContent Based Image Retrieval A Reviewrsquo First
International Conference on Computer Science amp Information Technology COSIT 2014 AIRCC
Publishing Corporation Banglore
[27] Jack V Tu (1996) lsquoAdvantages and disadvantages of using artificial neural networks versus logistic
regression for predicting medical outcomesrsquo Journal of clinical Epidemiology Volume 49 Issue 11
Pages 1207-1325
[28] Aravind Nagathan Animozhi and Jithendra Mungara (2014) lsquoContent-Based Image Retrieval System
using Feed-Forward Backpropagation Neural NetworkrsquoIJCSNS International Journal of Computer
Science and Network Security Vol14 No6pp 70-77
[29] Mohandass Divya Jude Janet and Ramadass Suguna (2014) lsquoA genetic optimized neural network for
image retrieval in telemedicinersquo Divya et al EURASIP Journal on Image and Video Processing
[30] Shamla Mantri Nikhil S Tarale and Sudip C Mahajan(2011)rsquo Dimensionality Reduction technique
using Neural Networks ndash A Surveyrsquo(IJACSA) International Journal of Advanced Computer Science
and ApplicationsVol 2 No 4
AUTHORS
Shereena VBreceived her MCA degree from Bharathidasan University Trichy India
in 2000 During 2000-2004 she was with Mahatma Gandhi University Kottayam
India as Lecturer in the Department of Computer Applications Currently she is
working as Asst Professor in the Department of Computer Applications with MES
College Aluva Cochin India She has published papers in International Journals and
International and National Conference Proceedings Her research interests include Data
Mining Machine Learning and Image Processing
Dr Julie M David completed her Masters Degree in Computer Applications and
Masters of Philosophy in Computer Science in the years 2000 and 2009 in Bharathiyar
University Coimbatore India and in Vinayaka Missions University Salem India
respectively She has also completed her Doctorate in the research area of Artificial
Intelligence from Cochin University of Science and Technology Cochin India in 2013
During 2000-2007 she was with Mahatma Gandhi University Kottayam India as
Lecturer in the Department of Computer Applications Currently she is working as an
Assistant Professor in the Department of Computer Applications with MES College
Aluva Cochin India She has published several papers in International Journals and
International and National Conference Proceedings Her research interests include Artificial Intelligence
Data Mining and Machine Learning She is a life member of International Association of Engineers
IAENG Societies of Artificial Intelligence amp Data Mining Computer Society of India etc and a Reviewerof Elsevier International Journal of Knowledge Based Systems Also she is an Editorial Board Member of
various other International Journals She has coordinated various International and National Conferences
8202019 Significance of Dimensionality
httpslidepdfcomreaderfullsignificance-of-dimensionality 1016
Signal amp Image Processing An International Journal (SIPIJ) Vol6 No3 June 2015
36
n = W11 P1 + W12 P2 + hellip W1R PR + b
In matrix form this can be rewritten as
n = W P + b
Now the neuron output is given as
a = f (W P + b)
The transfer function used above is a log-sigmoid transfer function This transfer function takes
the input (which may have any value between plus and minus infinity) and squashes the output in
between 0 to 1 range according to the expression
y = 1 (1+e-n
)
The nodes at a particular stage constitute a layer The first layer is called input layer and last layer
is called output layer The layers in between output and input layer are called hidden layers Asthe number of hidden layers in the network increases the performance of network increases Each
node in a network serves the purpose of summation of all its inputs The output of a node is
further applied to the next node
In this paper Levenberg-Marquardt backpropagation algorithm (trainlm) is used for
classification Trainlm is a network training function that updates weight and bias values
according to Levenberg-Marquardt optimization Trainlm is often the fastest back propagation
algorithm in the matlab toolbox and is highly recommended as a first-choice supervised
algorithm The training process include creation configuring a three-layered neural network andmaking it learn about the extracted color and texture features of training set images Here we use
the reduced feature set obtained from PCA or LDA for the training of images The learning
process is carried out using backpropagation algorithm The training makes the network store thelearnt knowledge in its knowledge base This knowledge base is used in later phase in
comparison and decision making tasks by network
33 Similarity Matching
If R be the dimensionality reduced feature database and R is the feature vector obtained from
query image then the retrieval system is based on a similarity measure defined between R and
R [25] In this paper Euclidean distance is used to measure the similarity between the feature
vectors of reduced query image and reduced database images in the case of PCA and LDA In
the case of Neural Network based PCALDA the matching and decision making is done by the
neural network
34 Performance Evaluation
The performance of retrieval of the system can be measured in terms of its Recall and Precision
Recall measures the ability of the system to retrieve all the models that are relevant while
Precision measures the ability of the system to retrieve only the models that are relevant [20]
8202019 Significance of Dimensionality
httpslidepdfcomreaderfullsignificance-of-dimensionality 1116
Signal amp Image Processing An International Journal (SIPIJ) Vol6 No3 June 2015
37
=
=
The number of relevant items retrieved is the number of the returned images that are similar to
the query image in this case The total number of images retrieved is the total number of images
that are returned by the retrieval system In precision and recall crossover is the point on the
graph where the both precision and recall curves meet The higher the number of crossover points
better will be the performance of the system
4 COMPARATIVE STUDY OF PCA AND LDA
The proposed method has been implemented using Matlab 13 and tested on a general-purpose
database containing 500 images in JPG format of size 256X384 resized to 286x340 The
database includes 500 color images categorized into five classes and each class includes 100images as follows African people Beach Building Bus Dinosaurs The search is based on the
similarity of feature vectors We have followed the image retrieval technique as described in the
section 3 on different feature extraction schemes such as color and texture This scheme
calculated 110 features by means of histogram moments correlogram and Coif wavelet FurtherPrincipal Component Analysis technique and Linear Discriminant Analysis technique is used to
extract the best features from the images By means of PCA and LDA the feature set is reduced
to 75Then the reduced query image is compared with the reduced database feature set using
Euclidean Distance and the top 6 nearer images are displayed In neural network classifier based
PCA or LDA We used Levenberg-Marquardt backpropagation algorithm (trainlm) with 3 hiddenlayers for classification Here the network is trained about the reduced feature set (using PCA
LDA) of all the images from the training dataset A given query image is feature extracted and
searched for similar images For each query image relevant images are considered to be thosewhich belong to the same category as the query image The performance of the training process
can be analysed using the Precision Recall plot
The quality of the image retrieval with different feature extraction schemes has been evaluated
by randomly selecting query images of each category from test image database Each query
returns the top 6 images from database To measure retrieval effectiveness for the image retrieval
system Precision and Recall values are used The Precision Recall rates and plots for PCA LDA
Neural Network based PCA Neural Network based LDA and without dimension reduction
methods are shown in figure1 The graphical user interface for the retrieval of images using
dimension reduction with PCA LDA and Neural Network based PCA and Neural Network
based LDA are shown in the figure 2 figure3 and figure4 and figure5 respectively
From the GUI the database is to be selected first using Select Database button ie the database
of 500 images Then the query image is selected from a set of test images using Select Query
button The query can be processed under 5 options- without dimension reduction Dimension
Reduction using PCA and Dimension Reduction using LDA Neural Network based PCA and
Neural Network based LDA The images are retrieved based on the option selected and top 6
images are displayed in the Returned images frame The Precision-Recall Plot gives the Precision
and Recall rates of the selected option The Performance Comparison button shows the Precision-
8202019 Significance of Dimensionality
httpslidepdfcomreaderfullsignificance-of-dimensionality 1216
Signal amp Image Processing An International Journal (SIPIJ) Vol6 No3 June 2015
38
Recall plots of all the methods of the selected query image From the Table 5 of Precision andRecall it is found that the rates are higher for PCA when compared to LDA This shows that
PCA is a better dimension reduction tool when compared to the other methods
Table 5 Table of Precision Recall Rates
Figure1 Precision ndashRecall Plot
8202019 Significance of Dimensionality
httpslidepdfcomreaderfullsignificance-of-dimensionality 1316
Signal amp Image Processing An International Journal (SIPIJ) Vol6 No3 June 2015
39
Figure 2Dimension Reduction using PCA
Figure 3 Dimension Reduction using LDA
Figure 4 Neural Network Based PCA
8202019 Significance of Dimensionality
httpslidepdfcomreaderfullsignificance-of-dimensionality 1416
Signal amp Image Processing An International Journal (SIPIJ) Vol6 No3 June 2015
40
Figure 5 Neural Network Based LDA
5 CONCLUSION
In this paper we presented a comparative study of dimension reduction methods namely
Principal Component Analysis and Linear Discriminant Analysis Dimensionality reductionmethods aim at revealing meaningful structures and unexpected relationships in multivariate data
PCA projects correlated variables into a lower number of uncorrelated variables called principal
components By using only the first few principal components or eigen vectors PCA makes it
possible to reduce the number of significant dimensions of the data while maintaining the
maximum possible variance The objective of LDA is to perform dimensionality reduction whilepreserving as much of the class discriminatory information as possible In LDA we will compute
eigenvectors from our dataset and collect them in scatter-matrices the between-class scatter
matrix and within-class scatter matrix In Neural Network based PCALDA the network is
trained about the reduced feature set (using PCA or LDA) of all the images from the training
dataset The training algorithm used in this paper is Levenberg-Marquardt backpropagationalgorithm (trainlm) with 3 hidden layers From the Precision and Recall rates calculated in the
table in the above section it can be found that the rates are high for all the cases of PCA when
compared to the LDA Thus it is concluded that PCA tends to outperform LDA in almost all
cases and hence PCA can be adopted as an effective tool for dimension reduction
REFERENCES
[1] Rafael Gonzalez and Richard E Woods lsquoDigital Image processingrsquo Addison Wesley 2nd Edn
2002
[2] HH Pavan Kumar Bhuravarjula And VNS Vijaya Kumar(2012) lsquoA Novel Content Based Image
Retrieval Using Variance Color Momentrsquo Int J Of Computer And Electronics ResearchVol 1
Issue 3 ISSN 2278-5795 pp93-99
[3] Mohd Danish Ritika Rawat and Ratika Sharma(2013) lsquoA Survey Content Based Image Retrieval
Based On Color Texture Shape amp Neuro Fuzzyrsquo Int Journal Of Engineering Research And
Applications ISSN 2248-9622 Vol 3 Issue 5 Sep-Oct 2013 pp839-844
8202019 Significance of Dimensionality
httpslidepdfcomreaderfullsignificance-of-dimensionality 1516
Signal amp Image Processing An International Journal (SIPIJ) Vol6 No3 June 2015
41
[4] S Balakrishnama and A Ganapathiraju lsquoLinear Discriminant Analysis - A Brief Tutorialrsquo Institute
for Signal and Information Processing Department of Electrical and Computer Engineering
Mississippi State University
[5] Manimala Singha and K Hemachandran (2012) lsquoContent based image retrieval using color and
texturersquo Signal amp Image Processing An Int J (SIPIJ) Vol3 No1 pp39-57
[6] Pranali Prakash Lokhande and P A Tijare(2012) lsquoFeature Extraction Approach for Content BasedImage Retrievalrsquo IntJournal of Advanced Research in Computer Science and Software Engineering
Vol 2 Issue 2 ISSN 2277 128X
[7] S Mangijao Singh K Hemachandran (2012) ldquoContent-Based Image Retrieval using Color Moment
and Gabor Texture Featurerdquo IntJ of Computer Science IssuesVol 9 Issue 5 No 1 pp299-309
[8] ARamesh Kumar and DSaravanan rsquo Content Based Image Retrieval Using Color Histogramrsquo Int J
of Computer Science and Information Technologies Vol 4 (2) 2013 242 ndash 245 ISSN0975-9646
[9] Swati V Sakhare amp Vrushali G Nasre(2011) lsquoDesign of Feature Extraction in Content Based Image
Retrieval (CBIR) using Color and Texturersquo Int J of Computer Science amp Informatics Vol-I Issue-
II pp57-61
[10] Wasim Khan Shiv Kumar Neetesh Gupta and Nilofar Khan(2011) lsquoA Proposed Method for Image
Retrieval using Histogram values and Texture Descriptor Analysisrsquo Int Jof Soft Computing and
Engineering (IJSCE) ISSN 2231-2307 Vol-I Issue-II pp33-36
[11] SMeenachi Sundaresan and Dr KGSrinivasagan(2013) lsquoDesign of Image Retrieval Efficacy
System Based on CBIRrsquo Int J of Advanced Research in Computer Science and Software
Engineering Vol 3 Issue 4 ISSN 2277 128X pp48-53
[12] Tamer Mehyar Jalal Omer Atoum(2012) lsquoAn Enhancement on Content-Based Image Retrieval using
Color and Texture Featuresrsquo Journal of Emerging Trends in Computing and Information Sciences
Vol 3 No 4ISSN 2079-8407 pp488-496
[13] Pinderjeet Kaur (2012) lsquoImplementation of Principle Component Analysis with Fuzzy Annotation
for CAD Jewellery Imagesrsquo Int J of Emerging Trends amp Technology in Computer ScienceVol 1
Issue 4 ISSN 2278-6856
[14] Arunasakthi K and Kamatchipriya L(2014) lsquoA Review On Linear And Non-Linear Dimensionality
Reduction Techniquesrsquo Machine Learning And Applications An Int J (Mlaij) Vol1 No1 Pp65-
76
[15] Julie M David Kannan Balakrishnan (2014) Learning Disability Prediction Tool using ANN and
ANFIS International Journal of Soft Computing Springer Verlag Berlin Heidelberg ISSN 1432-
7643 (online) ISSN 1433-7479 (print) DOI 101007s00500-013-1129-0 Vol 18 Issue 6 pp 1093-1112
[16] Julie M David Kannan Balakrishnan (2012) Attribute Reduction and Missing Value Imputing with
ANN Prediction of Learning Disabilities International Journal of Neural Computing amp Applications
Springer-Verlag London Limited DOI 101007s00521-011-0619 Vol 21 Issue 7 pp 1757-1763
[17] Kresimir Delac Mislav Grgic and Sonja Grgic (2006) lsquoIndependent Comparative Study of PCA
ICA and LDA on the FERET Data Setrsquo Wiley Periodicals Inc
[18] Dr HBKekre Sudeep D Thepade and Akshay Maloo (2010) lsquoCBIR Feature Vector Dimension
Reduction with Eigenvectors of Covariance Matrix using Row Column and Diagonal Mean
Sequencesrsquo Int J of Computer Applications (0975 ndash 8887)Vol 3 No12
[19] Sebastian Raschka (2014) rsquoLinear Discriminant Analysis bit by bitrsquo
[20] Shereena VB and Julie M David (2014) lsquoContent Based Image Retrieval Classification Using
Neural Networksrsquo The Int J of Multimedia amp Its Applications (IJMA) Vol6 No5 DOI
105121ijma20146503 31[21] Anca Apatean Alexandrina Rogozan Simina Emerich Abdelaziz Bensrhair lsquoWavelets As Features
For Objects Recognitionrsquo
[22] Prof C S Gode Ms A N Ganar(2014) lsquoImage Retrieval by Using Color Texture and Shape
Featuresrsquo IntJournal of Advanced Research in ElectricalElectronics and Instrumentation
Engineering Vol 3 Issue 4 ISSN (Print) 2320 ndash 3765ISSN (Online) 2278 ndash 8875
8202019 Significance of Dimensionality
httpslidepdfcomreaderfullsignificance-of-dimensionality 1616
Signal amp Image Processing An International Journal (SIPIJ) Vol6 No3 June 2015
42
[23] Hamed Fadaei and Thotsapon Sortrakul(2014) lsquoContent-Based Image Retrieval System with
Combining Color features and Gradient featurersquo Int Conference on Advanced Computational
Technologies amp Creative Media
[24] G Sasikala R Kowsalya and Dr M Punithavalli (2010) lsquoA Comparative Study Of Dimension
Reduction Techniques For Content-Based Image Retrievalrsquo The Int J of Multimedia amp Its
Applications Vol2 No3 Doi 105121Ijma20102303 40[25] RPriya DrVasantha Kalyani David(2012) lsquoEnhanced Content Based Image Retrieval Using
Multiple Feature Fusion Algorithmsrsquo Int J of Scientific amp Engineering Research Vol 3 Issue 2
ISSN 2229-5518
[26] Shereena VB and Julie M David (2014) lsquoContent Based Image Retrieval A Reviewrsquo First
International Conference on Computer Science amp Information Technology COSIT 2014 AIRCC
Publishing Corporation Banglore
[27] Jack V Tu (1996) lsquoAdvantages and disadvantages of using artificial neural networks versus logistic
regression for predicting medical outcomesrsquo Journal of clinical Epidemiology Volume 49 Issue 11
Pages 1207-1325
[28] Aravind Nagathan Animozhi and Jithendra Mungara (2014) lsquoContent-Based Image Retrieval System
using Feed-Forward Backpropagation Neural NetworkrsquoIJCSNS International Journal of Computer
Science and Network Security Vol14 No6pp 70-77
[29] Mohandass Divya Jude Janet and Ramadass Suguna (2014) lsquoA genetic optimized neural network for
image retrieval in telemedicinersquo Divya et al EURASIP Journal on Image and Video Processing
[30] Shamla Mantri Nikhil S Tarale and Sudip C Mahajan(2011)rsquo Dimensionality Reduction technique
using Neural Networks ndash A Surveyrsquo(IJACSA) International Journal of Advanced Computer Science
and ApplicationsVol 2 No 4
AUTHORS
Shereena VBreceived her MCA degree from Bharathidasan University Trichy India
in 2000 During 2000-2004 she was with Mahatma Gandhi University Kottayam
India as Lecturer in the Department of Computer Applications Currently she is
working as Asst Professor in the Department of Computer Applications with MES
College Aluva Cochin India She has published papers in International Journals and
International and National Conference Proceedings Her research interests include Data
Mining Machine Learning and Image Processing
Dr Julie M David completed her Masters Degree in Computer Applications and
Masters of Philosophy in Computer Science in the years 2000 and 2009 in Bharathiyar
University Coimbatore India and in Vinayaka Missions University Salem India
respectively She has also completed her Doctorate in the research area of Artificial
Intelligence from Cochin University of Science and Technology Cochin India in 2013
During 2000-2007 she was with Mahatma Gandhi University Kottayam India as
Lecturer in the Department of Computer Applications Currently she is working as an
Assistant Professor in the Department of Computer Applications with MES College
Aluva Cochin India She has published several papers in International Journals and
International and National Conference Proceedings Her research interests include Artificial Intelligence
Data Mining and Machine Learning She is a life member of International Association of Engineers
IAENG Societies of Artificial Intelligence amp Data Mining Computer Society of India etc and a Reviewerof Elsevier International Journal of Knowledge Based Systems Also she is an Editorial Board Member of
various other International Journals She has coordinated various International and National Conferences
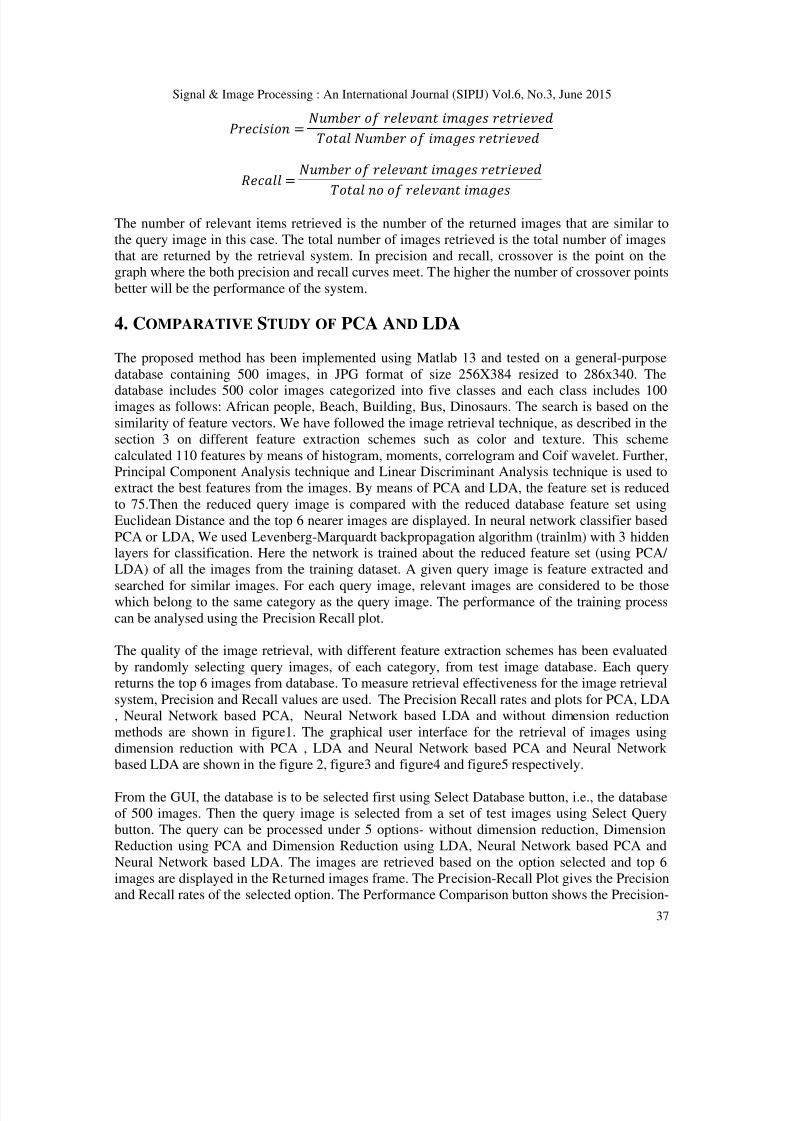
8202019 Significance of Dimensionality
httpslidepdfcomreaderfullsignificance-of-dimensionality 1116
Signal amp Image Processing An International Journal (SIPIJ) Vol6 No3 June 2015
37
=
=
The number of relevant items retrieved is the number of the returned images that are similar to
the query image in this case The total number of images retrieved is the total number of images
that are returned by the retrieval system In precision and recall crossover is the point on the
graph where the both precision and recall curves meet The higher the number of crossover points
better will be the performance of the system
4 COMPARATIVE STUDY OF PCA AND LDA
The proposed method has been implemented using Matlab 13 and tested on a general-purpose
database containing 500 images in JPG format of size 256X384 resized to 286x340 The
database includes 500 color images categorized into five classes and each class includes 100images as follows African people Beach Building Bus Dinosaurs The search is based on the
similarity of feature vectors We have followed the image retrieval technique as described in the
section 3 on different feature extraction schemes such as color and texture This scheme
calculated 110 features by means of histogram moments correlogram and Coif wavelet FurtherPrincipal Component Analysis technique and Linear Discriminant Analysis technique is used to
extract the best features from the images By means of PCA and LDA the feature set is reduced
to 75Then the reduced query image is compared with the reduced database feature set using
Euclidean Distance and the top 6 nearer images are displayed In neural network classifier based
PCA or LDA We used Levenberg-Marquardt backpropagation algorithm (trainlm) with 3 hiddenlayers for classification Here the network is trained about the reduced feature set (using PCA
LDA) of all the images from the training dataset A given query image is feature extracted and
searched for similar images For each query image relevant images are considered to be thosewhich belong to the same category as the query image The performance of the training process
can be analysed using the Precision Recall plot
The quality of the image retrieval with different feature extraction schemes has been evaluated
by randomly selecting query images of each category from test image database Each query
returns the top 6 images from database To measure retrieval effectiveness for the image retrieval
system Precision and Recall values are used The Precision Recall rates and plots for PCA LDA
Neural Network based PCA Neural Network based LDA and without dimension reduction
methods are shown in figure1 The graphical user interface for the retrieval of images using
dimension reduction with PCA LDA and Neural Network based PCA and Neural Network
based LDA are shown in the figure 2 figure3 and figure4 and figure5 respectively
From the GUI the database is to be selected first using Select Database button ie the database
of 500 images Then the query image is selected from a set of test images using Select Query
button The query can be processed under 5 options- without dimension reduction Dimension
Reduction using PCA and Dimension Reduction using LDA Neural Network based PCA and
Neural Network based LDA The images are retrieved based on the option selected and top 6
images are displayed in the Returned images frame The Precision-Recall Plot gives the Precision
and Recall rates of the selected option The Performance Comparison button shows the Precision-
8202019 Significance of Dimensionality
httpslidepdfcomreaderfullsignificance-of-dimensionality 1216
Signal amp Image Processing An International Journal (SIPIJ) Vol6 No3 June 2015
38
Recall plots of all the methods of the selected query image From the Table 5 of Precision andRecall it is found that the rates are higher for PCA when compared to LDA This shows that
PCA is a better dimension reduction tool when compared to the other methods
Table 5 Table of Precision Recall Rates
Figure1 Precision ndashRecall Plot
8202019 Significance of Dimensionality
httpslidepdfcomreaderfullsignificance-of-dimensionality 1316
Signal amp Image Processing An International Journal (SIPIJ) Vol6 No3 June 2015
39
Figure 2Dimension Reduction using PCA
Figure 3 Dimension Reduction using LDA
Figure 4 Neural Network Based PCA
8202019 Significance of Dimensionality
httpslidepdfcomreaderfullsignificance-of-dimensionality 1416
Signal amp Image Processing An International Journal (SIPIJ) Vol6 No3 June 2015
40
Figure 5 Neural Network Based LDA
5 CONCLUSION
In this paper we presented a comparative study of dimension reduction methods namely
Principal Component Analysis and Linear Discriminant Analysis Dimensionality reductionmethods aim at revealing meaningful structures and unexpected relationships in multivariate data
PCA projects correlated variables into a lower number of uncorrelated variables called principal
components By using only the first few principal components or eigen vectors PCA makes it
possible to reduce the number of significant dimensions of the data while maintaining the
maximum possible variance The objective of LDA is to perform dimensionality reduction whilepreserving as much of the class discriminatory information as possible In LDA we will compute
eigenvectors from our dataset and collect them in scatter-matrices the between-class scatter
matrix and within-class scatter matrix In Neural Network based PCALDA the network is
trained about the reduced feature set (using PCA or LDA) of all the images from the training
dataset The training algorithm used in this paper is Levenberg-Marquardt backpropagationalgorithm (trainlm) with 3 hidden layers From the Precision and Recall rates calculated in the
table in the above section it can be found that the rates are high for all the cases of PCA when
compared to the LDA Thus it is concluded that PCA tends to outperform LDA in almost all
cases and hence PCA can be adopted as an effective tool for dimension reduction
REFERENCES
[1] Rafael Gonzalez and Richard E Woods lsquoDigital Image processingrsquo Addison Wesley 2nd Edn
2002
[2] HH Pavan Kumar Bhuravarjula And VNS Vijaya Kumar(2012) lsquoA Novel Content Based Image
Retrieval Using Variance Color Momentrsquo Int J Of Computer And Electronics ResearchVol 1
Issue 3 ISSN 2278-5795 pp93-99
[3] Mohd Danish Ritika Rawat and Ratika Sharma(2013) lsquoA Survey Content Based Image Retrieval
Based On Color Texture Shape amp Neuro Fuzzyrsquo Int Journal Of Engineering Research And
Applications ISSN 2248-9622 Vol 3 Issue 5 Sep-Oct 2013 pp839-844
8202019 Significance of Dimensionality
httpslidepdfcomreaderfullsignificance-of-dimensionality 1516
Signal amp Image Processing An International Journal (SIPIJ) Vol6 No3 June 2015
41
[4] S Balakrishnama and A Ganapathiraju lsquoLinear Discriminant Analysis - A Brief Tutorialrsquo Institute
for Signal and Information Processing Department of Electrical and Computer Engineering
Mississippi State University
[5] Manimala Singha and K Hemachandran (2012) lsquoContent based image retrieval using color and
texturersquo Signal amp Image Processing An Int J (SIPIJ) Vol3 No1 pp39-57
[6] Pranali Prakash Lokhande and P A Tijare(2012) lsquoFeature Extraction Approach for Content BasedImage Retrievalrsquo IntJournal of Advanced Research in Computer Science and Software Engineering
Vol 2 Issue 2 ISSN 2277 128X
[7] S Mangijao Singh K Hemachandran (2012) ldquoContent-Based Image Retrieval using Color Moment
and Gabor Texture Featurerdquo IntJ of Computer Science IssuesVol 9 Issue 5 No 1 pp299-309
[8] ARamesh Kumar and DSaravanan rsquo Content Based Image Retrieval Using Color Histogramrsquo Int J
of Computer Science and Information Technologies Vol 4 (2) 2013 242 ndash 245 ISSN0975-9646
[9] Swati V Sakhare amp Vrushali G Nasre(2011) lsquoDesign of Feature Extraction in Content Based Image
Retrieval (CBIR) using Color and Texturersquo Int J of Computer Science amp Informatics Vol-I Issue-
II pp57-61
[10] Wasim Khan Shiv Kumar Neetesh Gupta and Nilofar Khan(2011) lsquoA Proposed Method for Image
Retrieval using Histogram values and Texture Descriptor Analysisrsquo Int Jof Soft Computing and
Engineering (IJSCE) ISSN 2231-2307 Vol-I Issue-II pp33-36
[11] SMeenachi Sundaresan and Dr KGSrinivasagan(2013) lsquoDesign of Image Retrieval Efficacy
System Based on CBIRrsquo Int J of Advanced Research in Computer Science and Software
Engineering Vol 3 Issue 4 ISSN 2277 128X pp48-53
[12] Tamer Mehyar Jalal Omer Atoum(2012) lsquoAn Enhancement on Content-Based Image Retrieval using
Color and Texture Featuresrsquo Journal of Emerging Trends in Computing and Information Sciences
Vol 3 No 4ISSN 2079-8407 pp488-496
[13] Pinderjeet Kaur (2012) lsquoImplementation of Principle Component Analysis with Fuzzy Annotation
for CAD Jewellery Imagesrsquo Int J of Emerging Trends amp Technology in Computer ScienceVol 1
Issue 4 ISSN 2278-6856
[14] Arunasakthi K and Kamatchipriya L(2014) lsquoA Review On Linear And Non-Linear Dimensionality
Reduction Techniquesrsquo Machine Learning And Applications An Int J (Mlaij) Vol1 No1 Pp65-
76
[15] Julie M David Kannan Balakrishnan (2014) Learning Disability Prediction Tool using ANN and
ANFIS International Journal of Soft Computing Springer Verlag Berlin Heidelberg ISSN 1432-
7643 (online) ISSN 1433-7479 (print) DOI 101007s00500-013-1129-0 Vol 18 Issue 6 pp 1093-1112
[16] Julie M David Kannan Balakrishnan (2012) Attribute Reduction and Missing Value Imputing with
ANN Prediction of Learning Disabilities International Journal of Neural Computing amp Applications
Springer-Verlag London Limited DOI 101007s00521-011-0619 Vol 21 Issue 7 pp 1757-1763
[17] Kresimir Delac Mislav Grgic and Sonja Grgic (2006) lsquoIndependent Comparative Study of PCA
ICA and LDA on the FERET Data Setrsquo Wiley Periodicals Inc
[18] Dr HBKekre Sudeep D Thepade and Akshay Maloo (2010) lsquoCBIR Feature Vector Dimension
Reduction with Eigenvectors of Covariance Matrix using Row Column and Diagonal Mean
Sequencesrsquo Int J of Computer Applications (0975 ndash 8887)Vol 3 No12
[19] Sebastian Raschka (2014) rsquoLinear Discriminant Analysis bit by bitrsquo
[20] Shereena VB and Julie M David (2014) lsquoContent Based Image Retrieval Classification Using
Neural Networksrsquo The Int J of Multimedia amp Its Applications (IJMA) Vol6 No5 DOI
105121ijma20146503 31[21] Anca Apatean Alexandrina Rogozan Simina Emerich Abdelaziz Bensrhair lsquoWavelets As Features
For Objects Recognitionrsquo
[22] Prof C S Gode Ms A N Ganar(2014) lsquoImage Retrieval by Using Color Texture and Shape
Featuresrsquo IntJournal of Advanced Research in ElectricalElectronics and Instrumentation
Engineering Vol 3 Issue 4 ISSN (Print) 2320 ndash 3765ISSN (Online) 2278 ndash 8875
8202019 Significance of Dimensionality
httpslidepdfcomreaderfullsignificance-of-dimensionality 1616
Signal amp Image Processing An International Journal (SIPIJ) Vol6 No3 June 2015
42
[23] Hamed Fadaei and Thotsapon Sortrakul(2014) lsquoContent-Based Image Retrieval System with
Combining Color features and Gradient featurersquo Int Conference on Advanced Computational
Technologies amp Creative Media
[24] G Sasikala R Kowsalya and Dr M Punithavalli (2010) lsquoA Comparative Study Of Dimension
Reduction Techniques For Content-Based Image Retrievalrsquo The Int J of Multimedia amp Its
Applications Vol2 No3 Doi 105121Ijma20102303 40[25] RPriya DrVasantha Kalyani David(2012) lsquoEnhanced Content Based Image Retrieval Using
Multiple Feature Fusion Algorithmsrsquo Int J of Scientific amp Engineering Research Vol 3 Issue 2
ISSN 2229-5518
[26] Shereena VB and Julie M David (2014) lsquoContent Based Image Retrieval A Reviewrsquo First
International Conference on Computer Science amp Information Technology COSIT 2014 AIRCC
Publishing Corporation Banglore
[27] Jack V Tu (1996) lsquoAdvantages and disadvantages of using artificial neural networks versus logistic
regression for predicting medical outcomesrsquo Journal of clinical Epidemiology Volume 49 Issue 11
Pages 1207-1325
[28] Aravind Nagathan Animozhi and Jithendra Mungara (2014) lsquoContent-Based Image Retrieval System
using Feed-Forward Backpropagation Neural NetworkrsquoIJCSNS International Journal of Computer
Science and Network Security Vol14 No6pp 70-77
[29] Mohandass Divya Jude Janet and Ramadass Suguna (2014) lsquoA genetic optimized neural network for
image retrieval in telemedicinersquo Divya et al EURASIP Journal on Image and Video Processing
[30] Shamla Mantri Nikhil S Tarale and Sudip C Mahajan(2011)rsquo Dimensionality Reduction technique
using Neural Networks ndash A Surveyrsquo(IJACSA) International Journal of Advanced Computer Science
and ApplicationsVol 2 No 4
AUTHORS
Shereena VBreceived her MCA degree from Bharathidasan University Trichy India
in 2000 During 2000-2004 she was with Mahatma Gandhi University Kottayam
India as Lecturer in the Department of Computer Applications Currently she is
working as Asst Professor in the Department of Computer Applications with MES
College Aluva Cochin India She has published papers in International Journals and
International and National Conference Proceedings Her research interests include Data
Mining Machine Learning and Image Processing
Dr Julie M David completed her Masters Degree in Computer Applications and
Masters of Philosophy in Computer Science in the years 2000 and 2009 in Bharathiyar
University Coimbatore India and in Vinayaka Missions University Salem India
respectively She has also completed her Doctorate in the research area of Artificial
Intelligence from Cochin University of Science and Technology Cochin India in 2013
During 2000-2007 she was with Mahatma Gandhi University Kottayam India as
Lecturer in the Department of Computer Applications Currently she is working as an
Assistant Professor in the Department of Computer Applications with MES College
Aluva Cochin India She has published several papers in International Journals and
International and National Conference Proceedings Her research interests include Artificial Intelligence
Data Mining and Machine Learning She is a life member of International Association of Engineers
IAENG Societies of Artificial Intelligence amp Data Mining Computer Society of India etc and a Reviewerof Elsevier International Journal of Knowledge Based Systems Also she is an Editorial Board Member of
various other International Journals She has coordinated various International and National Conferences
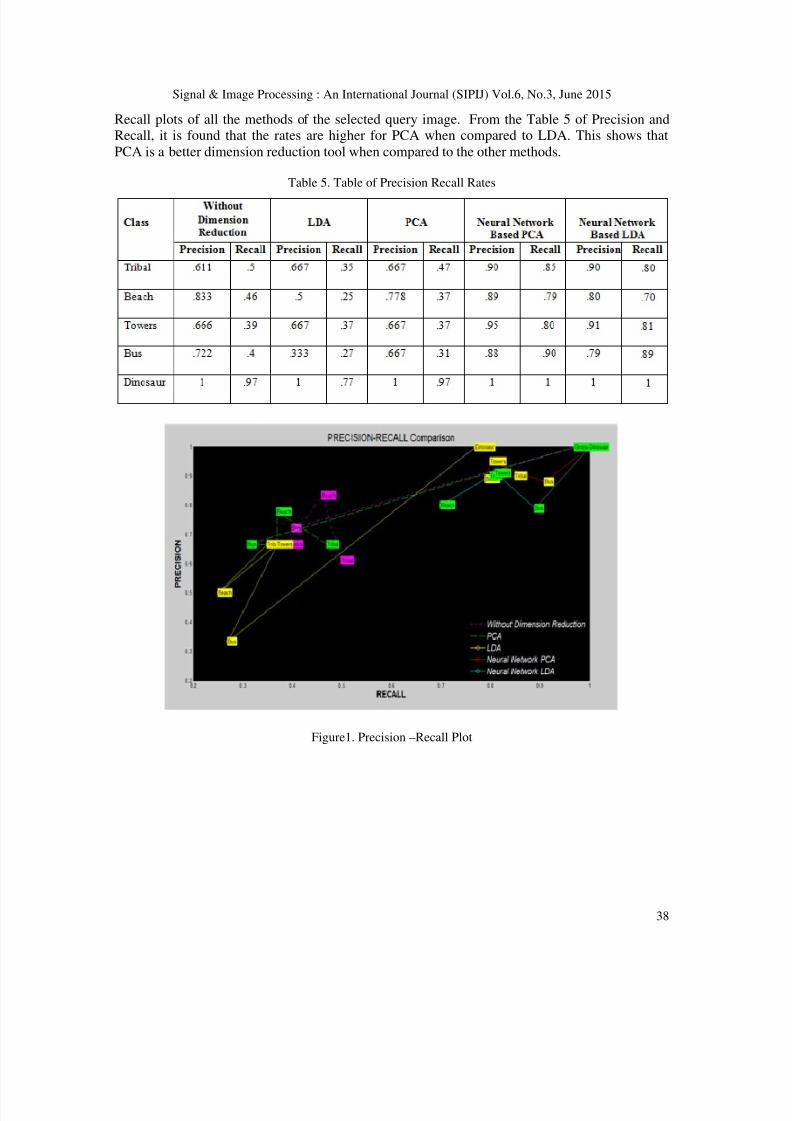
8202019 Significance of Dimensionality
httpslidepdfcomreaderfullsignificance-of-dimensionality 1316
Signal amp Image Processing An International Journal (SIPIJ) Vol6 No3 June 2015
39
Figure 2Dimension Reduction using PCA
Figure 3 Dimension Reduction using LDA
Figure 4 Neural Network Based PCA
8202019 Significance of Dimensionality
httpslidepdfcomreaderfullsignificance-of-dimensionality 1416
Signal amp Image Processing An International Journal (SIPIJ) Vol6 No3 June 2015
40
Figure 5 Neural Network Based LDA
5 CONCLUSION
In this paper we presented a comparative study of dimension reduction methods namely
Principal Component Analysis and Linear Discriminant Analysis Dimensionality reductionmethods aim at revealing meaningful structures and unexpected relationships in multivariate data
PCA projects correlated variables into a lower number of uncorrelated variables called principal
components By using only the first few principal components or eigen vectors PCA makes it
possible to reduce the number of significant dimensions of the data while maintaining the
maximum possible variance The objective of LDA is to perform dimensionality reduction whilepreserving as much of the class discriminatory information as possible In LDA we will compute
eigenvectors from our dataset and collect them in scatter-matrices the between-class scatter
matrix and within-class scatter matrix In Neural Network based PCALDA the network is
trained about the reduced feature set (using PCA or LDA) of all the images from the training
dataset The training algorithm used in this paper is Levenberg-Marquardt backpropagationalgorithm (trainlm) with 3 hidden layers From the Precision and Recall rates calculated in the
table in the above section it can be found that the rates are high for all the cases of PCA when
compared to the LDA Thus it is concluded that PCA tends to outperform LDA in almost all
cases and hence PCA can be adopted as an effective tool for dimension reduction
REFERENCES
[1] Rafael Gonzalez and Richard E Woods lsquoDigital Image processingrsquo Addison Wesley 2nd Edn
2002
[2] HH Pavan Kumar Bhuravarjula And VNS Vijaya Kumar(2012) lsquoA Novel Content Based Image
Retrieval Using Variance Color Momentrsquo Int J Of Computer And Electronics ResearchVol 1
Issue 3 ISSN 2278-5795 pp93-99
[3] Mohd Danish Ritika Rawat and Ratika Sharma(2013) lsquoA Survey Content Based Image Retrieval
Based On Color Texture Shape amp Neuro Fuzzyrsquo Int Journal Of Engineering Research And
Applications ISSN 2248-9622 Vol 3 Issue 5 Sep-Oct 2013 pp839-844
8202019 Significance of Dimensionality
httpslidepdfcomreaderfullsignificance-of-dimensionality 1516
Signal amp Image Processing An International Journal (SIPIJ) Vol6 No3 June 2015
41
[4] S Balakrishnama and A Ganapathiraju lsquoLinear Discriminant Analysis - A Brief Tutorialrsquo Institute
for Signal and Information Processing Department of Electrical and Computer Engineering
Mississippi State University
[5] Manimala Singha and K Hemachandran (2012) lsquoContent based image retrieval using color and
texturersquo Signal amp Image Processing An Int J (SIPIJ) Vol3 No1 pp39-57
[6] Pranali Prakash Lokhande and P A Tijare(2012) lsquoFeature Extraction Approach for Content BasedImage Retrievalrsquo IntJournal of Advanced Research in Computer Science and Software Engineering
Vol 2 Issue 2 ISSN 2277 128X
[7] S Mangijao Singh K Hemachandran (2012) ldquoContent-Based Image Retrieval using Color Moment
and Gabor Texture Featurerdquo IntJ of Computer Science IssuesVol 9 Issue 5 No 1 pp299-309
[8] ARamesh Kumar and DSaravanan rsquo Content Based Image Retrieval Using Color Histogramrsquo Int J
of Computer Science and Information Technologies Vol 4 (2) 2013 242 ndash 245 ISSN0975-9646
[9] Swati V Sakhare amp Vrushali G Nasre(2011) lsquoDesign of Feature Extraction in Content Based Image
Retrieval (CBIR) using Color and Texturersquo Int J of Computer Science amp Informatics Vol-I Issue-
II pp57-61
[10] Wasim Khan Shiv Kumar Neetesh Gupta and Nilofar Khan(2011) lsquoA Proposed Method for Image
Retrieval using Histogram values and Texture Descriptor Analysisrsquo Int Jof Soft Computing and
Engineering (IJSCE) ISSN 2231-2307 Vol-I Issue-II pp33-36
[11] SMeenachi Sundaresan and Dr KGSrinivasagan(2013) lsquoDesign of Image Retrieval Efficacy
System Based on CBIRrsquo Int J of Advanced Research in Computer Science and Software
Engineering Vol 3 Issue 4 ISSN 2277 128X pp48-53
[12] Tamer Mehyar Jalal Omer Atoum(2012) lsquoAn Enhancement on Content-Based Image Retrieval using
Color and Texture Featuresrsquo Journal of Emerging Trends in Computing and Information Sciences
Vol 3 No 4ISSN 2079-8407 pp488-496
[13] Pinderjeet Kaur (2012) lsquoImplementation of Principle Component Analysis with Fuzzy Annotation
for CAD Jewellery Imagesrsquo Int J of Emerging Trends amp Technology in Computer ScienceVol 1
Issue 4 ISSN 2278-6856
[14] Arunasakthi K and Kamatchipriya L(2014) lsquoA Review On Linear And Non-Linear Dimensionality
Reduction Techniquesrsquo Machine Learning And Applications An Int J (Mlaij) Vol1 No1 Pp65-
76
[15] Julie M David Kannan Balakrishnan (2014) Learning Disability Prediction Tool using ANN and
ANFIS International Journal of Soft Computing Springer Verlag Berlin Heidelberg ISSN 1432-
7643 (online) ISSN 1433-7479 (print) DOI 101007s00500-013-1129-0 Vol 18 Issue 6 pp 1093-1112
[16] Julie M David Kannan Balakrishnan (2012) Attribute Reduction and Missing Value Imputing with
ANN Prediction of Learning Disabilities International Journal of Neural Computing amp Applications
Springer-Verlag London Limited DOI 101007s00521-011-0619 Vol 21 Issue 7 pp 1757-1763
[17] Kresimir Delac Mislav Grgic and Sonja Grgic (2006) lsquoIndependent Comparative Study of PCA
ICA and LDA on the FERET Data Setrsquo Wiley Periodicals Inc
[18] Dr HBKekre Sudeep D Thepade and Akshay Maloo (2010) lsquoCBIR Feature Vector Dimension
Reduction with Eigenvectors of Covariance Matrix using Row Column and Diagonal Mean
Sequencesrsquo Int J of Computer Applications (0975 ndash 8887)Vol 3 No12
[19] Sebastian Raschka (2014) rsquoLinear Discriminant Analysis bit by bitrsquo
[20] Shereena VB and Julie M David (2014) lsquoContent Based Image Retrieval Classification Using
Neural Networksrsquo The Int J of Multimedia amp Its Applications (IJMA) Vol6 No5 DOI
105121ijma20146503 31[21] Anca Apatean Alexandrina Rogozan Simina Emerich Abdelaziz Bensrhair lsquoWavelets As Features
For Objects Recognitionrsquo
[22] Prof C S Gode Ms A N Ganar(2014) lsquoImage Retrieval by Using Color Texture and Shape
Featuresrsquo IntJournal of Advanced Research in ElectricalElectronics and Instrumentation
Engineering Vol 3 Issue 4 ISSN (Print) 2320 ndash 3765ISSN (Online) 2278 ndash 8875
8202019 Significance of Dimensionality
httpslidepdfcomreaderfullsignificance-of-dimensionality 1616
Signal amp Image Processing An International Journal (SIPIJ) Vol6 No3 June 2015
42
[23] Hamed Fadaei and Thotsapon Sortrakul(2014) lsquoContent-Based Image Retrieval System with
Combining Color features and Gradient featurersquo Int Conference on Advanced Computational
Technologies amp Creative Media
[24] G Sasikala R Kowsalya and Dr M Punithavalli (2010) lsquoA Comparative Study Of Dimension
Reduction Techniques For Content-Based Image Retrievalrsquo The Int J of Multimedia amp Its
Applications Vol2 No3 Doi 105121Ijma20102303 40[25] RPriya DrVasantha Kalyani David(2012) lsquoEnhanced Content Based Image Retrieval Using
Multiple Feature Fusion Algorithmsrsquo Int J of Scientific amp Engineering Research Vol 3 Issue 2
ISSN 2229-5518
[26] Shereena VB and Julie M David (2014) lsquoContent Based Image Retrieval A Reviewrsquo First
International Conference on Computer Science amp Information Technology COSIT 2014 AIRCC
Publishing Corporation Banglore
[27] Jack V Tu (1996) lsquoAdvantages and disadvantages of using artificial neural networks versus logistic
regression for predicting medical outcomesrsquo Journal of clinical Epidemiology Volume 49 Issue 11
Pages 1207-1325
[28] Aravind Nagathan Animozhi and Jithendra Mungara (2014) lsquoContent-Based Image Retrieval System
using Feed-Forward Backpropagation Neural NetworkrsquoIJCSNS International Journal of Computer
Science and Network Security Vol14 No6pp 70-77
[29] Mohandass Divya Jude Janet and Ramadass Suguna (2014) lsquoA genetic optimized neural network for
image retrieval in telemedicinersquo Divya et al EURASIP Journal on Image and Video Processing
[30] Shamla Mantri Nikhil S Tarale and Sudip C Mahajan(2011)rsquo Dimensionality Reduction technique
using Neural Networks ndash A Surveyrsquo(IJACSA) International Journal of Advanced Computer Science
and ApplicationsVol 2 No 4
AUTHORS
Shereena VBreceived her MCA degree from Bharathidasan University Trichy India
in 2000 During 2000-2004 she was with Mahatma Gandhi University Kottayam
India as Lecturer in the Department of Computer Applications Currently she is
working as Asst Professor in the Department of Computer Applications with MES
College Aluva Cochin India She has published papers in International Journals and
International and National Conference Proceedings Her research interests include Data
Mining Machine Learning and Image Processing
Dr Julie M David completed her Masters Degree in Computer Applications and
Masters of Philosophy in Computer Science in the years 2000 and 2009 in Bharathiyar
University Coimbatore India and in Vinayaka Missions University Salem India
respectively She has also completed her Doctorate in the research area of Artificial
Intelligence from Cochin University of Science and Technology Cochin India in 2013
During 2000-2007 she was with Mahatma Gandhi University Kottayam India as
Lecturer in the Department of Computer Applications Currently she is working as an
Assistant Professor in the Department of Computer Applications with MES College
Aluva Cochin India She has published several papers in International Journals and
International and National Conference Proceedings Her research interests include Artificial Intelligence
Data Mining and Machine Learning She is a life member of International Association of Engineers
IAENG Societies of Artificial Intelligence amp Data Mining Computer Society of India etc and a Reviewerof Elsevier International Journal of Knowledge Based Systems Also she is an Editorial Board Member of
various other International Journals She has coordinated various International and National Conferences
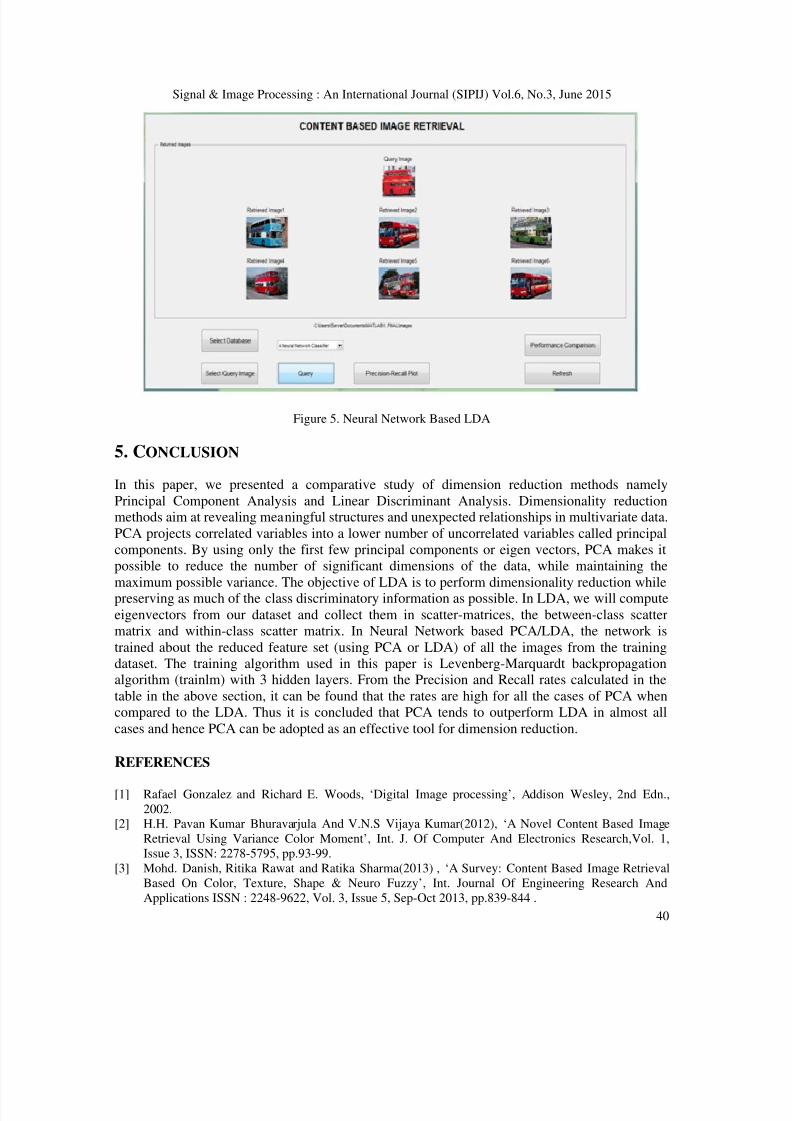
8202019 Significance of Dimensionality
httpslidepdfcomreaderfullsignificance-of-dimensionality 1416
Signal amp Image Processing An International Journal (SIPIJ) Vol6 No3 June 2015
40
Figure 5 Neural Network Based LDA
5 CONCLUSION
In this paper we presented a comparative study of dimension reduction methods namely
Principal Component Analysis and Linear Discriminant Analysis Dimensionality reductionmethods aim at revealing meaningful structures and unexpected relationships in multivariate data
PCA projects correlated variables into a lower number of uncorrelated variables called principal
components By using only the first few principal components or eigen vectors PCA makes it
possible to reduce the number of significant dimensions of the data while maintaining the
maximum possible variance The objective of LDA is to perform dimensionality reduction whilepreserving as much of the class discriminatory information as possible In LDA we will compute
eigenvectors from our dataset and collect them in scatter-matrices the between-class scatter
matrix and within-class scatter matrix In Neural Network based PCALDA the network is
trained about the reduced feature set (using PCA or LDA) of all the images from the training
dataset The training algorithm used in this paper is Levenberg-Marquardt backpropagationalgorithm (trainlm) with 3 hidden layers From the Precision and Recall rates calculated in the
table in the above section it can be found that the rates are high for all the cases of PCA when
compared to the LDA Thus it is concluded that PCA tends to outperform LDA in almost all
cases and hence PCA can be adopted as an effective tool for dimension reduction
REFERENCES
[1] Rafael Gonzalez and Richard E Woods lsquoDigital Image processingrsquo Addison Wesley 2nd Edn
2002
[2] HH Pavan Kumar Bhuravarjula And VNS Vijaya Kumar(2012) lsquoA Novel Content Based Image
Retrieval Using Variance Color Momentrsquo Int J Of Computer And Electronics ResearchVol 1
Issue 3 ISSN 2278-5795 pp93-99
[3] Mohd Danish Ritika Rawat and Ratika Sharma(2013) lsquoA Survey Content Based Image Retrieval
Based On Color Texture Shape amp Neuro Fuzzyrsquo Int Journal Of Engineering Research And
Applications ISSN 2248-9622 Vol 3 Issue 5 Sep-Oct 2013 pp839-844
8202019 Significance of Dimensionality
httpslidepdfcomreaderfullsignificance-of-dimensionality 1516
Signal amp Image Processing An International Journal (SIPIJ) Vol6 No3 June 2015
41
[4] S Balakrishnama and A Ganapathiraju lsquoLinear Discriminant Analysis - A Brief Tutorialrsquo Institute
for Signal and Information Processing Department of Electrical and Computer Engineering
Mississippi State University
[5] Manimala Singha and K Hemachandran (2012) lsquoContent based image retrieval using color and
texturersquo Signal amp Image Processing An Int J (SIPIJ) Vol3 No1 pp39-57
[6] Pranali Prakash Lokhande and P A Tijare(2012) lsquoFeature Extraction Approach for Content BasedImage Retrievalrsquo IntJournal of Advanced Research in Computer Science and Software Engineering
Vol 2 Issue 2 ISSN 2277 128X
[7] S Mangijao Singh K Hemachandran (2012) ldquoContent-Based Image Retrieval using Color Moment
and Gabor Texture Featurerdquo IntJ of Computer Science IssuesVol 9 Issue 5 No 1 pp299-309
[8] ARamesh Kumar and DSaravanan rsquo Content Based Image Retrieval Using Color Histogramrsquo Int J
of Computer Science and Information Technologies Vol 4 (2) 2013 242 ndash 245 ISSN0975-9646
[9] Swati V Sakhare amp Vrushali G Nasre(2011) lsquoDesign of Feature Extraction in Content Based Image
Retrieval (CBIR) using Color and Texturersquo Int J of Computer Science amp Informatics Vol-I Issue-
II pp57-61
[10] Wasim Khan Shiv Kumar Neetesh Gupta and Nilofar Khan(2011) lsquoA Proposed Method for Image
Retrieval using Histogram values and Texture Descriptor Analysisrsquo Int Jof Soft Computing and
Engineering (IJSCE) ISSN 2231-2307 Vol-I Issue-II pp33-36
[11] SMeenachi Sundaresan and Dr KGSrinivasagan(2013) lsquoDesign of Image Retrieval Efficacy
System Based on CBIRrsquo Int J of Advanced Research in Computer Science and Software
Engineering Vol 3 Issue 4 ISSN 2277 128X pp48-53
[12] Tamer Mehyar Jalal Omer Atoum(2012) lsquoAn Enhancement on Content-Based Image Retrieval using
Color and Texture Featuresrsquo Journal of Emerging Trends in Computing and Information Sciences
Vol 3 No 4ISSN 2079-8407 pp488-496
[13] Pinderjeet Kaur (2012) lsquoImplementation of Principle Component Analysis with Fuzzy Annotation
for CAD Jewellery Imagesrsquo Int J of Emerging Trends amp Technology in Computer ScienceVol 1
Issue 4 ISSN 2278-6856
[14] Arunasakthi K and Kamatchipriya L(2014) lsquoA Review On Linear And Non-Linear Dimensionality
Reduction Techniquesrsquo Machine Learning And Applications An Int J (Mlaij) Vol1 No1 Pp65-
76
[15] Julie M David Kannan Balakrishnan (2014) Learning Disability Prediction Tool using ANN and
ANFIS International Journal of Soft Computing Springer Verlag Berlin Heidelberg ISSN 1432-
7643 (online) ISSN 1433-7479 (print) DOI 101007s00500-013-1129-0 Vol 18 Issue 6 pp 1093-1112
[16] Julie M David Kannan Balakrishnan (2012) Attribute Reduction and Missing Value Imputing with
ANN Prediction of Learning Disabilities International Journal of Neural Computing amp Applications
Springer-Verlag London Limited DOI 101007s00521-011-0619 Vol 21 Issue 7 pp 1757-1763
[17] Kresimir Delac Mislav Grgic and Sonja Grgic (2006) lsquoIndependent Comparative Study of PCA
ICA and LDA on the FERET Data Setrsquo Wiley Periodicals Inc
[18] Dr HBKekre Sudeep D Thepade and Akshay Maloo (2010) lsquoCBIR Feature Vector Dimension
Reduction with Eigenvectors of Covariance Matrix using Row Column and Diagonal Mean
Sequencesrsquo Int J of Computer Applications (0975 ndash 8887)Vol 3 No12
[19] Sebastian Raschka (2014) rsquoLinear Discriminant Analysis bit by bitrsquo
[20] Shereena VB and Julie M David (2014) lsquoContent Based Image Retrieval Classification Using
Neural Networksrsquo The Int J of Multimedia amp Its Applications (IJMA) Vol6 No5 DOI
105121ijma20146503 31[21] Anca Apatean Alexandrina Rogozan Simina Emerich Abdelaziz Bensrhair lsquoWavelets As Features
For Objects Recognitionrsquo
[22] Prof C S Gode Ms A N Ganar(2014) lsquoImage Retrieval by Using Color Texture and Shape
Featuresrsquo IntJournal of Advanced Research in ElectricalElectronics and Instrumentation
Engineering Vol 3 Issue 4 ISSN (Print) 2320 ndash 3765ISSN (Online) 2278 ndash 8875
8202019 Significance of Dimensionality
httpslidepdfcomreaderfullsignificance-of-dimensionality 1616
Signal amp Image Processing An International Journal (SIPIJ) Vol6 No3 June 2015
42
[23] Hamed Fadaei and Thotsapon Sortrakul(2014) lsquoContent-Based Image Retrieval System with
Combining Color features and Gradient featurersquo Int Conference on Advanced Computational
Technologies amp Creative Media
[24] G Sasikala R Kowsalya and Dr M Punithavalli (2010) lsquoA Comparative Study Of Dimension
Reduction Techniques For Content-Based Image Retrievalrsquo The Int J of Multimedia amp Its
Applications Vol2 No3 Doi 105121Ijma20102303 40[25] RPriya DrVasantha Kalyani David(2012) lsquoEnhanced Content Based Image Retrieval Using
Multiple Feature Fusion Algorithmsrsquo Int J of Scientific amp Engineering Research Vol 3 Issue 2
ISSN 2229-5518
[26] Shereena VB and Julie M David (2014) lsquoContent Based Image Retrieval A Reviewrsquo First
International Conference on Computer Science amp Information Technology COSIT 2014 AIRCC
Publishing Corporation Banglore
[27] Jack V Tu (1996) lsquoAdvantages and disadvantages of using artificial neural networks versus logistic
regression for predicting medical outcomesrsquo Journal of clinical Epidemiology Volume 49 Issue 11
Pages 1207-1325
[28] Aravind Nagathan Animozhi and Jithendra Mungara (2014) lsquoContent-Based Image Retrieval System
using Feed-Forward Backpropagation Neural NetworkrsquoIJCSNS International Journal of Computer
Science and Network Security Vol14 No6pp 70-77
[29] Mohandass Divya Jude Janet and Ramadass Suguna (2014) lsquoA genetic optimized neural network for
image retrieval in telemedicinersquo Divya et al EURASIP Journal on Image and Video Processing
[30] Shamla Mantri Nikhil S Tarale and Sudip C Mahajan(2011)rsquo Dimensionality Reduction technique
using Neural Networks ndash A Surveyrsquo(IJACSA) International Journal of Advanced Computer Science
and ApplicationsVol 2 No 4
AUTHORS
Shereena VBreceived her MCA degree from Bharathidasan University Trichy India
in 2000 During 2000-2004 she was with Mahatma Gandhi University Kottayam
India as Lecturer in the Department of Computer Applications Currently she is
working as Asst Professor in the Department of Computer Applications with MES
College Aluva Cochin India She has published papers in International Journals and
International and National Conference Proceedings Her research interests include Data
Mining Machine Learning and Image Processing
Dr Julie M David completed her Masters Degree in Computer Applications and
Masters of Philosophy in Computer Science in the years 2000 and 2009 in Bharathiyar
University Coimbatore India and in Vinayaka Missions University Salem India
respectively She has also completed her Doctorate in the research area of Artificial
Intelligence from Cochin University of Science and Technology Cochin India in 2013
During 2000-2007 she was with Mahatma Gandhi University Kottayam India as
Lecturer in the Department of Computer Applications Currently she is working as an
Assistant Professor in the Department of Computer Applications with MES College
Aluva Cochin India She has published several papers in International Journals and
International and National Conference Proceedings Her research interests include Artificial Intelligence
Data Mining and Machine Learning She is a life member of International Association of Engineers
IAENG Societies of Artificial Intelligence amp Data Mining Computer Society of India etc and a Reviewerof Elsevier International Journal of Knowledge Based Systems Also she is an Editorial Board Member of
various other International Journals She has coordinated various International and National Conferences
8202019 Significance of Dimensionality
httpslidepdfcomreaderfullsignificance-of-dimensionality 1516
Signal amp Image Processing An International Journal (SIPIJ) Vol6 No3 June 2015
41
[4] S Balakrishnama and A Ganapathiraju lsquoLinear Discriminant Analysis - A Brief Tutorialrsquo Institute
for Signal and Information Processing Department of Electrical and Computer Engineering
Mississippi State University
[5] Manimala Singha and K Hemachandran (2012) lsquoContent based image retrieval using color and
texturersquo Signal amp Image Processing An Int J (SIPIJ) Vol3 No1 pp39-57
[6] Pranali Prakash Lokhande and P A Tijare(2012) lsquoFeature Extraction Approach for Content BasedImage Retrievalrsquo IntJournal of Advanced Research in Computer Science and Software Engineering
Vol 2 Issue 2 ISSN 2277 128X
[7] S Mangijao Singh K Hemachandran (2012) ldquoContent-Based Image Retrieval using Color Moment
and Gabor Texture Featurerdquo IntJ of Computer Science IssuesVol 9 Issue 5 No 1 pp299-309
[8] ARamesh Kumar and DSaravanan rsquo Content Based Image Retrieval Using Color Histogramrsquo Int J
of Computer Science and Information Technologies Vol 4 (2) 2013 242 ndash 245 ISSN0975-9646
[9] Swati V Sakhare amp Vrushali G Nasre(2011) lsquoDesign of Feature Extraction in Content Based Image
Retrieval (CBIR) using Color and Texturersquo Int J of Computer Science amp Informatics Vol-I Issue-
II pp57-61
[10] Wasim Khan Shiv Kumar Neetesh Gupta and Nilofar Khan(2011) lsquoA Proposed Method for Image
Retrieval using Histogram values and Texture Descriptor Analysisrsquo Int Jof Soft Computing and
Engineering (IJSCE) ISSN 2231-2307 Vol-I Issue-II pp33-36
[11] SMeenachi Sundaresan and Dr KGSrinivasagan(2013) lsquoDesign of Image Retrieval Efficacy
System Based on CBIRrsquo Int J of Advanced Research in Computer Science and Software
Engineering Vol 3 Issue 4 ISSN 2277 128X pp48-53
[12] Tamer Mehyar Jalal Omer Atoum(2012) lsquoAn Enhancement on Content-Based Image Retrieval using
Color and Texture Featuresrsquo Journal of Emerging Trends in Computing and Information Sciences
Vol 3 No 4ISSN 2079-8407 pp488-496
[13] Pinderjeet Kaur (2012) lsquoImplementation of Principle Component Analysis with Fuzzy Annotation
for CAD Jewellery Imagesrsquo Int J of Emerging Trends amp Technology in Computer ScienceVol 1
Issue 4 ISSN 2278-6856
[14] Arunasakthi K and Kamatchipriya L(2014) lsquoA Review On Linear And Non-Linear Dimensionality
Reduction Techniquesrsquo Machine Learning And Applications An Int J (Mlaij) Vol1 No1 Pp65-
76
[15] Julie M David Kannan Balakrishnan (2014) Learning Disability Prediction Tool using ANN and
ANFIS International Journal of Soft Computing Springer Verlag Berlin Heidelberg ISSN 1432-
7643 (online) ISSN 1433-7479 (print) DOI 101007s00500-013-1129-0 Vol 18 Issue 6 pp 1093-1112
[16] Julie M David Kannan Balakrishnan (2012) Attribute Reduction and Missing Value Imputing with
ANN Prediction of Learning Disabilities International Journal of Neural Computing amp Applications
Springer-Verlag London Limited DOI 101007s00521-011-0619 Vol 21 Issue 7 pp 1757-1763
[17] Kresimir Delac Mislav Grgic and Sonja Grgic (2006) lsquoIndependent Comparative Study of PCA
ICA and LDA on the FERET Data Setrsquo Wiley Periodicals Inc
[18] Dr HBKekre Sudeep D Thepade and Akshay Maloo (2010) lsquoCBIR Feature Vector Dimension
Reduction with Eigenvectors of Covariance Matrix using Row Column and Diagonal Mean
Sequencesrsquo Int J of Computer Applications (0975 ndash 8887)Vol 3 No12
[19] Sebastian Raschka (2014) rsquoLinear Discriminant Analysis bit by bitrsquo
[20] Shereena VB and Julie M David (2014) lsquoContent Based Image Retrieval Classification Using
Neural Networksrsquo The Int J of Multimedia amp Its Applications (IJMA) Vol6 No5 DOI
105121ijma20146503 31[21] Anca Apatean Alexandrina Rogozan Simina Emerich Abdelaziz Bensrhair lsquoWavelets As Features
For Objects Recognitionrsquo
[22] Prof C S Gode Ms A N Ganar(2014) lsquoImage Retrieval by Using Color Texture and Shape
Featuresrsquo IntJournal of Advanced Research in ElectricalElectronics and Instrumentation
Engineering Vol 3 Issue 4 ISSN (Print) 2320 ndash 3765ISSN (Online) 2278 ndash 8875
8202019 Significance of Dimensionality
httpslidepdfcomreaderfullsignificance-of-dimensionality 1616
Signal amp Image Processing An International Journal (SIPIJ) Vol6 No3 June 2015
42
[23] Hamed Fadaei and Thotsapon Sortrakul(2014) lsquoContent-Based Image Retrieval System with
Combining Color features and Gradient featurersquo Int Conference on Advanced Computational
Technologies amp Creative Media
[24] G Sasikala R Kowsalya and Dr M Punithavalli (2010) lsquoA Comparative Study Of Dimension
Reduction Techniques For Content-Based Image Retrievalrsquo The Int J of Multimedia amp Its
Applications Vol2 No3 Doi 105121Ijma20102303 40[25] RPriya DrVasantha Kalyani David(2012) lsquoEnhanced Content Based Image Retrieval Using
Multiple Feature Fusion Algorithmsrsquo Int J of Scientific amp Engineering Research Vol 3 Issue 2
ISSN 2229-5518
[26] Shereena VB and Julie M David (2014) lsquoContent Based Image Retrieval A Reviewrsquo First
International Conference on Computer Science amp Information Technology COSIT 2014 AIRCC
Publishing Corporation Banglore
[27] Jack V Tu (1996) lsquoAdvantages and disadvantages of using artificial neural networks versus logistic
regression for predicting medical outcomesrsquo Journal of clinical Epidemiology Volume 49 Issue 11
Pages 1207-1325
[28] Aravind Nagathan Animozhi and Jithendra Mungara (2014) lsquoContent-Based Image Retrieval System
using Feed-Forward Backpropagation Neural NetworkrsquoIJCSNS International Journal of Computer
Science and Network Security Vol14 No6pp 70-77
[29] Mohandass Divya Jude Janet and Ramadass Suguna (2014) lsquoA genetic optimized neural network for
image retrieval in telemedicinersquo Divya et al EURASIP Journal on Image and Video Processing
[30] Shamla Mantri Nikhil S Tarale and Sudip C Mahajan(2011)rsquo Dimensionality Reduction technique
using Neural Networks ndash A Surveyrsquo(IJACSA) International Journal of Advanced Computer Science
and ApplicationsVol 2 No 4
AUTHORS
Shereena VBreceived her MCA degree from Bharathidasan University Trichy India
in 2000 During 2000-2004 she was with Mahatma Gandhi University Kottayam
India as Lecturer in the Department of Computer Applications Currently she is
working as Asst Professor in the Department of Computer Applications with MES
College Aluva Cochin India She has published papers in International Journals and
International and National Conference Proceedings Her research interests include Data
Mining Machine Learning and Image Processing
Dr Julie M David completed her Masters Degree in Computer Applications and
Masters of Philosophy in Computer Science in the years 2000 and 2009 in Bharathiyar
University Coimbatore India and in Vinayaka Missions University Salem India
respectively She has also completed her Doctorate in the research area of Artificial
Intelligence from Cochin University of Science and Technology Cochin India in 2013
During 2000-2007 she was with Mahatma Gandhi University Kottayam India as
Lecturer in the Department of Computer Applications Currently she is working as an
Assistant Professor in the Department of Computer Applications with MES College
Aluva Cochin India She has published several papers in International Journals and
International and National Conference Proceedings Her research interests include Artificial Intelligence
Data Mining and Machine Learning She is a life member of International Association of Engineers
IAENG Societies of Artificial Intelligence amp Data Mining Computer Society of India etc and a Reviewerof Elsevier International Journal of Knowledge Based Systems Also she is an Editorial Board Member of
various other International Journals She has coordinated various International and National Conferences