Embed Size (px)
Citation preview
Invest in people!
Project co-funded by European Social Fund through the Sectoral Operational Program Human Resources
Development 2007 - 2013
Priority "Education and training in support for growth and development of the knowledge society"
Key Area of Intervention 1.5 "Doctoral and post-doctoral programs in support of research"
Project Title: "Doctoral scholarships to increase competitiveness in the medical and pharmaceutical"
The identification number of the contract: POSDRU/88/1.5/S/58965
Beneficiary: University of Medicine and Pharmacy "Gr T. Popa "Iasi
Partner: University of Medicine and Pharmacy "Iuliu Hatieganu" Cluj Napoca
SIGNIFICANCE OF MICROALBUMINURIA
IN THE METABOLIC SYNDROME
SUMMARY OF PhD THESIS
PhD: MAIDANIUC (TRAIAN) Maria Gabriela
Scientific adviser: Prof. Dr. PETROVANU Rodica
IASI - 2013
2
KEYWORDS: metabolic syndrome, endothelium dysfunction, microalbuminuria, insulinoresistance,
dyslipidemiae, circulating endothelial cells, progenitor endothelial cells, ankle arm index.
“Grigore T. Popa” University of Medicine and Pharmacy –Iasi Rector's decision for
the appointment of the PhD Commission no. 9870 / 05.06.2013.
Date of public presentation of the thesis: 26/07/2013
3
CONTENTS page
I. Introduction. Importance of the problem 5
II.Metabolic syndrome 6
II.1. Historical elements defining the conceptual development of the 6
metabolic syndrome
II.2. Epidemiology of the metabolic syndrome 6
II.3. Definition of metabolic syndrome 6
II. 4. Etiopathogenesis of metabolic syndrome 9
II.4.1. Genetic factor 10
II.4.2. Environmental factors 10
II.4.3. Obesity 11
II.4.4. Insulinoresistance 15
II.4.5. Endothelial dysfunction 15
II.4.6. Proinflammatory and prothrombotic status 15
II.4.7. PPAR γ dysfunction 16
II.4.8. Oxidative stress 16
II.4.9. Activation of the sympathetic nervous system 16
II.5. Disorders that may be associated with metabolic syndrome 16
II.5.1. Non-alcoholic fatty liver 17
II.5.2. PCOS 18
II.5.3. Sleep apnea syndrome 18
II.5.4. Hyperuricemia in metabolic syndrome 19
II.6. Clinical Approach to Metabolic Syndrome 20
II.6.1 Obesity diagnosis 22
II.6.2. Hypertension diagnosis 24
II.6.3. Diagnosis of lipid metabolism disorders 27
II.6.4. Diagnosis of glucose metabolism disorders 27
II.6.5. Cardiovascular risk stratification 27
II.7. Management of metabolic syndrome 28
II.7.1 Dietotherapy 29
II.7.2. Farmacotherapy 30
II.7.3. Metabolic syndrome and polimedication 31
III. Vascular endothelium 32
III.1. Developing the concept 32
III.2. Endothelial morphology 33
III.3. Endothelial function 34
III.3.1. Endothelial barrier function 34
III.3.2. The control of homeostasis 34
III.3.3. Vascular tone regulation 35
III.4. Role of nitric oxide in vascular endothelial homeostasis 35
III.5. Vascular endothelium and the renin-angiotensin 38
IV. Endothelial dysfunction 39
IV.1. General considerations 38
IV.2. Metabolic syndrome and endothelial dysfunction 40
IV.2.1. Role of insulin resistance in the development of endothelial dysfunction in
4
metabolic syndrome 40
IV.2.2. The role of hyperglycemia on endothelial dysfunction in 42
metabolic syndrome
IV.2.3. Involvement of obesity, dyslipidemia and free fatty acids in endothelial 42
dysfunction in metabolic syndrome
IV.2.4. Oxidative stress and endothelial dysfunction 43
IV.2.5. Involvement of endothelial dysfunction in atherosclerosis initiation 44
IV.2.6. ADMA and endothelial dysfunction 45
IV.3. Quantification of endothelial dysfunction 47
IV.3.1. Imaging methods for the assessment of endothelial function 47
IV.3.1.1. Invasive techniques for the assessment of endothelial function 47
III.3.1.2. Noninvasive technique for the assessment of endothelial function 48
IV.3.2. Biochemical markers of endothelial dysfunction 52
IV.3.3. The role of circulating endothelial cells and endothelial progenitor cells 54
in endothelial dysfunction
IV.3.4. Microalbuminuria role in endothelial dysfunction 56
IV.3.4.1. General considerations 56
IV.3.4.2. Pathophysiology of microalbuminuria 56
IV.3.4.3. The impact of comorbidities on microalbuminuria 57
IV.3.4.4. Quantification of microalbuminuria 59
IIV.3.4.5. Clinical and prognostic significance of microalbuminuria 59
IV.3.5. Determining genetic factors correlated with endothelial dysfunction 61
IV.4. Endothelial dysfunction as a prognostic factor for major cardiovascular events 62
IV.5. Therapeutic measures to improve endothelial dysfunction 62
IV.5.1. Non-pharmacological measures 63
IV.5.2. Pharmacological therapy 63
IV.5.2.1. Exogenous NO donors 63
IV.5.2.2. Stimulators of NO 64
IV.6. Clinical usefulness of quantifying endothelial function 65
V. Personal part 66
V.1. Description of study. Stages of study 66
V.2. Step 1. Metabolic syndrome and endothelial dysfunction relationship with 66
anthropometric parameters, biochemical and imaging
V.2.1. Purpose 66
V.2.2. Objectives 66
V.2.3. Materials and method 66
V.2.4. Ethical consideration 71
V.2.5. Characterization of associated risk conditions on MS and quantify their 72
association with microalbuminuria as a surrogate marker of early
endothelial dysfunction
V.2.5.1 Results 72
V.2.5.2 Discussion 90
V.2.6. Evaluation of anthropometric indicators to quantify obesity relative to 97
endothelial dysfunction, insulin resistance and liver disease non-alcoholic
V.2.6.1. Results 97
V.2.6.2. Discussion 108
5
V.2.7. Establishing the importance of insulin resistance and non-alcoholic 111
liver disease MS in study group
V.2.7.1. Results 111
V.2.7.2. Discussion 120
V.2.8. Correlation of microalbuminuria and IGB with the definition of 123
metabolic syndrome components in order to assess the usefulness of introducing
them through criteria
V.2.8.1. Results 123
V.2.8.2. Discussion 130
V.3. Step 2. Evaluation of microalbuminuria in quantifying the importance 132
of endothelial dysfunction in metabolic syndrome correlated with circulating
endothelial cells and endothelial progenitor cells.
V.3.1. Introduction 132
V.3.2. Purpose 132
V.3.3. Objectives 132
V.3.4. Materials and method 132
V.3.5. Results 138
V.3.6. Discussion 159
V.4. Step 3. New research directions in the prevention of obesity, insulin resistance 175
and non-alcoholic liver disease. Assessment tool ikke on weight status and
liver Apo knockout mice are under Western diet.
V.4.1. Introduction 175
V.4.2. Objective 176
V.4.3. Description of study 176
V.4.4. Substudy 1: Liver function and weight status by excluding 177
IKKE mice ApoE-/ -.
V.4.4.1. Purpose 177
V.4.4.2. Objective 177
V.4.4.3. Material and method 177
V.4.4.4. Results 178
V.4.4.5. Discussion 179
V.4.4.6. Conclusion 180
V.4.5. Substudy 2: Evolution of fatty liver after bone marrow transplantation 180
IKKE + / + mice ApoE-/ - IKKE-/ -.
V.4.5.1. Purpose 180
V.4.5.2. Objective 180
V.4.5.3. Material and method 180
V.4.5.4. Results 180
V.4.5.5. Discussion 181
V.4.5.6. Conclusion 182
V.5. Limitations and difficulties in research 182
VI. Originality and innovative contributions of the thesis 184
VII. Conclusions 184
VIII. Abbreviations 185
XIX. Bibliography 187
XX. Attachments 206

6
1. Appendix 1. Chloroform methanol water extraction method
2. Appendix 2. GC-MS - analysis of lipids using D25-tridecanoic acid as standard
3. Papers published
7
INTRODUCTION
Metabolic syndrome (MS) is an important public health problem, is the most aggressive
cardiovascular risk factor (1). It overlaps the risk of association with type 2 diabetes, some cancers
and a host of other comorbidities (2). If current trends continue, premature death and disabilities
resulting from these degenerative conditions will bankrupt the national budgets of many countries,
developed or developing.
The presence of metabolic syndrome causes three times higher risk of developing coronary
heart disease and stroke, doubling mortality from these causes. The risk of sudden death is five times
higher in patients with diabetes and two to three times higher in patients with metabolic syndrome
(2). Cardiovascular disease is the leading cause of morbidity and mortality in developed countries
and those in developing countries, through the process of atherosclerosis and endothelial dysfunction
are key process in the pathogenesis of atherosclerosis and its complications. In the metabolic
syndrome, all its components involved in the acceleration of atherosclerosis (8).
I. Description of study. Stages of study
1. Metabolic syndrome and endothelial dysfunction - the relationship with anthropometric
parameters, biochemical and imaging.
2. Evaluation of microalbuminuria in quantifying the importance of endothelial dysfunction in
metabolic syndrome correlated with circulating endothelial cells and endothelial progenitor cells.
3. New research directions in the prevention of obesity, insulin resistance and non-alcoholic liver
disease. Assessment tool IKKE (inhibitor of nuclear factor kappa-B kinase subunit epsilon) on
weight status and liver in ApoE knockout mice (ApoE-/) are under Western type diet (high fat / low
carbohydrates).
II. First stage. Metabolic syndrome and endothelial dysfunction - the relationship with
anthropometric parameters, biochemical and imaging.
II.1. Purpose: Establish the anthropometric parameters, biochemical and imaging elements
endothelial dysfunction correlated with metabolic syndrome.
II.2. Objectives
1. Identification of risk conditions in insulin-resistance syndrome
2. Identify feasible to quantify the anthropometric indicators of abdominal obesity in relation to
insulin resistance, non-alcoholic liver disease and endothelial dysfunction.
3. Quantification of endothelial dysfunction using surrogate markers to identify an easy and feasible
method in ambulatory practice.
4. Evaluation of insulin resistance and non-alcoholic liver disease non-viral (BHNA) in SM in
thestudygroup.
5. Correlation of microalbuminuria with the other diagnostic criteria of MS to assess the usefulness
of placing it among the criteria.
II.3. Materials and methods
The research was conducted in the Specialty Ambulatoryt St. Spiridon Hospital Iasi, and
included patients who were sent to Internal Medicine Cabinet, and meet the criteria for the selection
of the lot. These are: age over 18 years, decision making capacity, metabolic syndrome diagnosed
according to NCEP-ATP III definition modified in 2004 (National Cholesterol Education Program -
Adult Treatment Panel III) (1).
For the diagnosis of metabolic syndrome have used NCEP-ATP III criteria, according to
which diagnosis is made in the presence of at least three of the following:
8
1. Hypertension, BP ≥ 130/85 mmHg or antihypertensive treatment;
2. Triglycerides ≥ 150 mg / dl;
3. HDL-cholesterol <40 mg/dL for men and <50 mg/dl for women;
4. Waist circumference ≥ 102 cm for men and ≥ 88 cm for women;
5. Fasting plasma glucose> 100 mg/dl.
The study was conducted between January 2010 - December 2012 in the Specialty
Ambulatory Hospital St. Spiridon. We included 600 patients per month, of which 300 initial (first
visit). Of those diagnosed with metabolic syndrome have 95 patients / month, giving a total of 2850
patients with metabolic syndrome in the 3 years of study. Unfortunately, 165 were unwilling to
participate in further investigation. 2685 batch of patients was performed a glucose tolerance test and
glycosylated hemoglobin to detect people with undiagnosed diabetes. Thus, 698 (25.9%) patients
were diagnosed with type 2 diabetes newly diagnosed. They were excluded from the study. Of the
1987 patients with non-diabetic metabolic syndrome but 247 did not wish any further (the distance,
the time, etc.) and 141 patients were also not shown, the end group is thus made up of 1599 patients
who were subjected to a full investigation.
The inclusion in the squad following data were recorded: demographic data, clinical data
(family history, personal history, lifestyle), anthropometric data (height, weight, body mass index,
waist circumference, hip circumference ratio waist / hip) complete physical examination, laboratory
data (initial balance sheet that contained all necessary investigations to identify patients with
metabolic syndrome, type 2 diabetes and associated cardiovascular risk factors evaluation and
identify target organ damage, OGTT, ECG, ankle-brachial index ).
Processing of medical data we performed using SPSS 16 (Statistical Package for Social
Sciences) or Microsoft Office Excel to create a database (the program supports the import of data in
SPSS). Determine the ranges of statistical indicators and hypothesis testing was performed with
statistical confidence of 95% resulting in a significance level p = 0.05 (defined as sufficient in
literature).
II.4. Ethical considerations. To study conducted prior to initiating its got the Committee of Ethics
of the University of Medicine and Pharmacy "Gr T. Popa" Iasi.
II.5. Results
The group included 1599 patients with metabolic syndrome aged between 26-77 years. The
average age group was 49.4 years [± 7.5]. The difference in the two sexes showed that women had a
mean age of 49.8 years [± 7.6] and men 49.05 years [± 7.3], older women being 0.76 years difference
with statistical significance (p=0.042).
Gender distribution of the study group showed a predominance of women in the study
group, so a slightly higher frequency of MS in women.
Sources patients showed a predominance of patients in urban areas than those in rural areas.
Thus, the presence of macrosomia birth APP was identified in 191 patients (21.4%) and the
presence of hypertension of pregnancy APP and APP PCOS were present in approximately equal
percentages, 15.15% and 14.14% . APP gestational diabetes was not present in any of the patients.
The presence of male erectile dysfunction group was present in 4.3% of patients, the
association with microalbuminuria was present in 87.1% of them, value highly statistically
significant (p <0.001). Comparison of APP with ankle-brachial index as a marker of endothelial
dysfunction showed a statistically significant 19.6% of people with fetal macrosomia APP (p =
0.024) and 14.2% of those with hypertension of pregnancy APP (p = 0.041). IGB disease was
identified in 9.3% of women with PCOS APP, and 2.2% of men with erectile dysfunction, but
9
without statistically significant in any of the cases.
In our study we considered the following significant family history: type 2 diabetes,
hypertension, dyslipidemia and obesity. Of all, the most frequent association was with history of
hypertension (52.6%), followed by obesity (51.5%). Family history of dyslipidemia were recorded in
34.9% of cases and those of type 2 diabetes 30.5% of people. Family history were significantly
associated with the presence of microalbuminuria, which is present in over 50% of patients with
hypertension (p = 0.017). There was a high percentage of microalbuminuria in patients with a family
history of type 2 diabetes but without statistical significance.
Correlation of positive family history (AHC) with IGB, revealed a significant association of
this marker of endothelial dysfunction in hypertension AHC 56.6% of cases. As can be observed in
Fig. 33), 53.2% of cases with pathological ABI (<0.9) had obesity AHC AHC and 32.2% had type 2
diabetes.
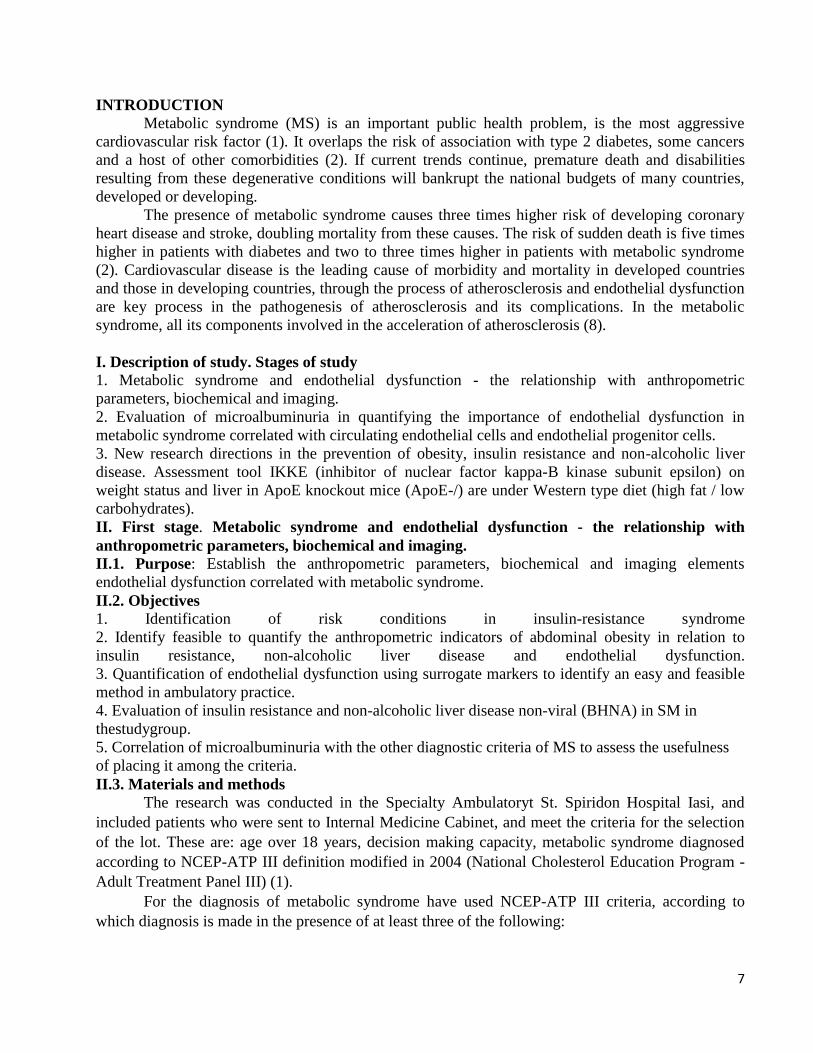
The lipid profile of the study group was quantified in combination with other
cardiometabolic risk factors.
Figure 40. Prevalence of pathological lipid distribution in the study group
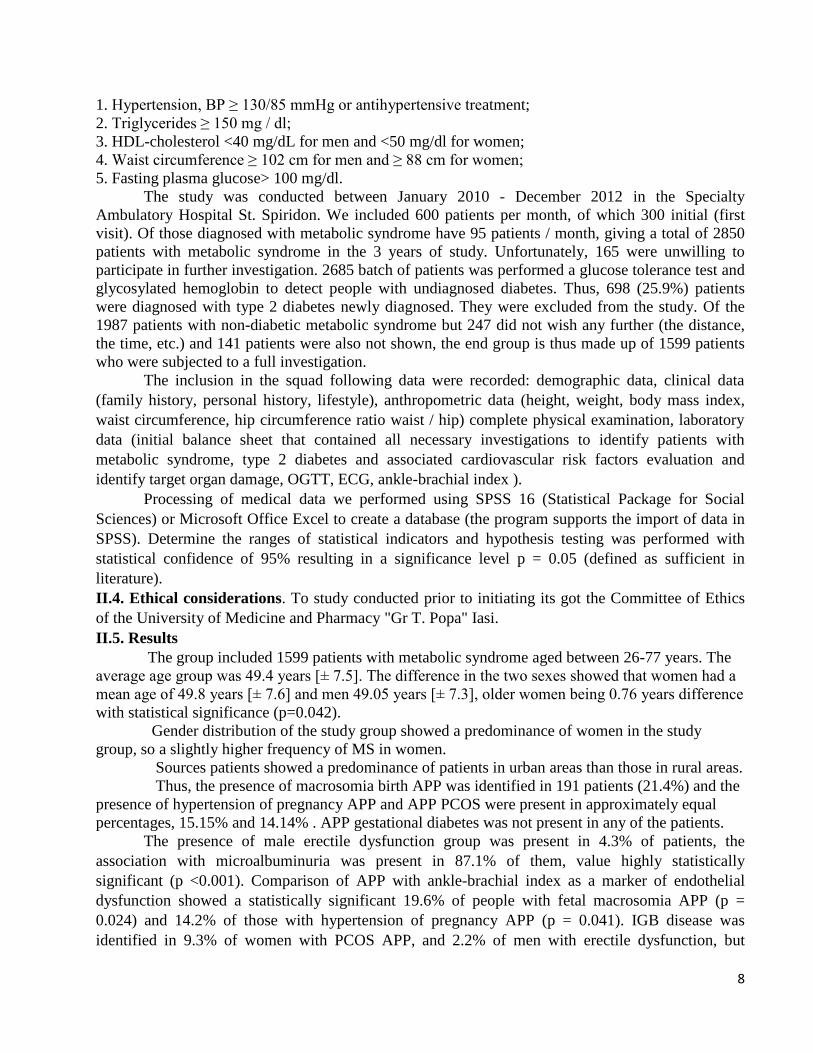
According to BMI in our study the highest percentage was found in patients with obesity grade I
(49.2%):
Fig. 48. Graphical representation of groups of cases divided according to BMI value
I used to quantify abdominal obesity as indicators measuring abdominal circumference (AC)
and the ratio waist / hip (T/S).
0 100 200 300 400 500 600 700 800 900
normal weight
overweight
obesity grade I
obesity grade II
obesity grade III
normal weight overweight obesity grade I obesity grade II obesity grade III
BMI 2 202 787 492 116
BMI
10
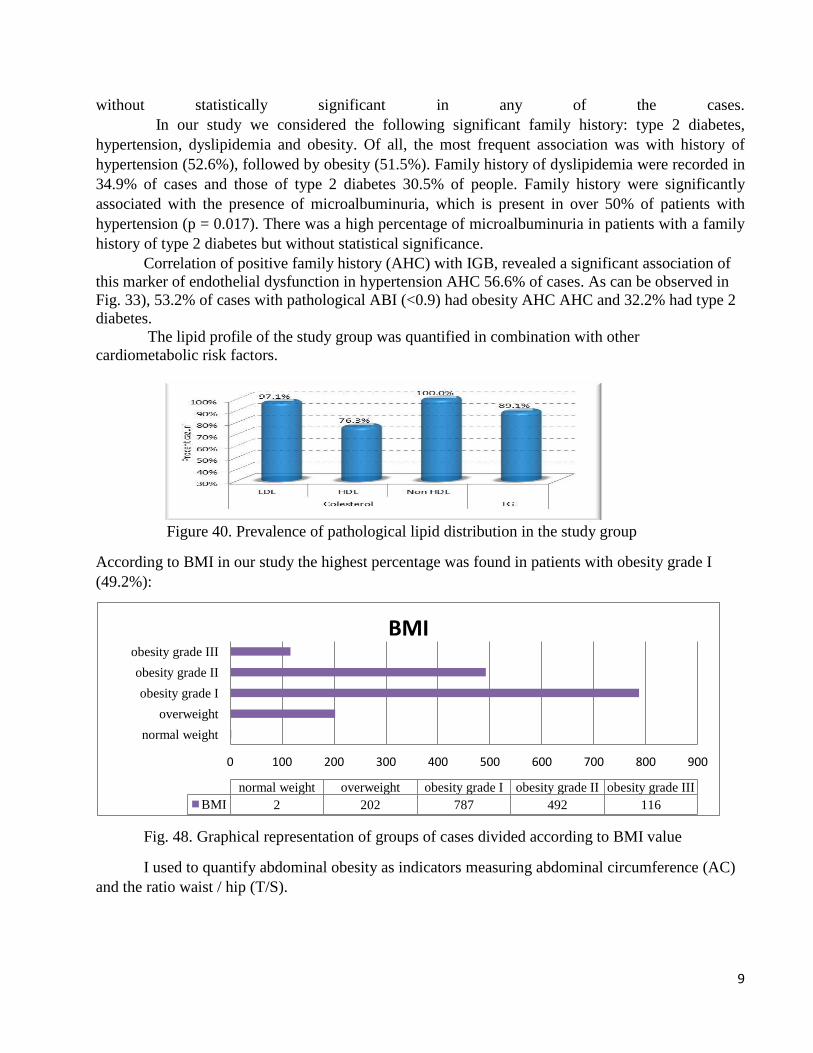
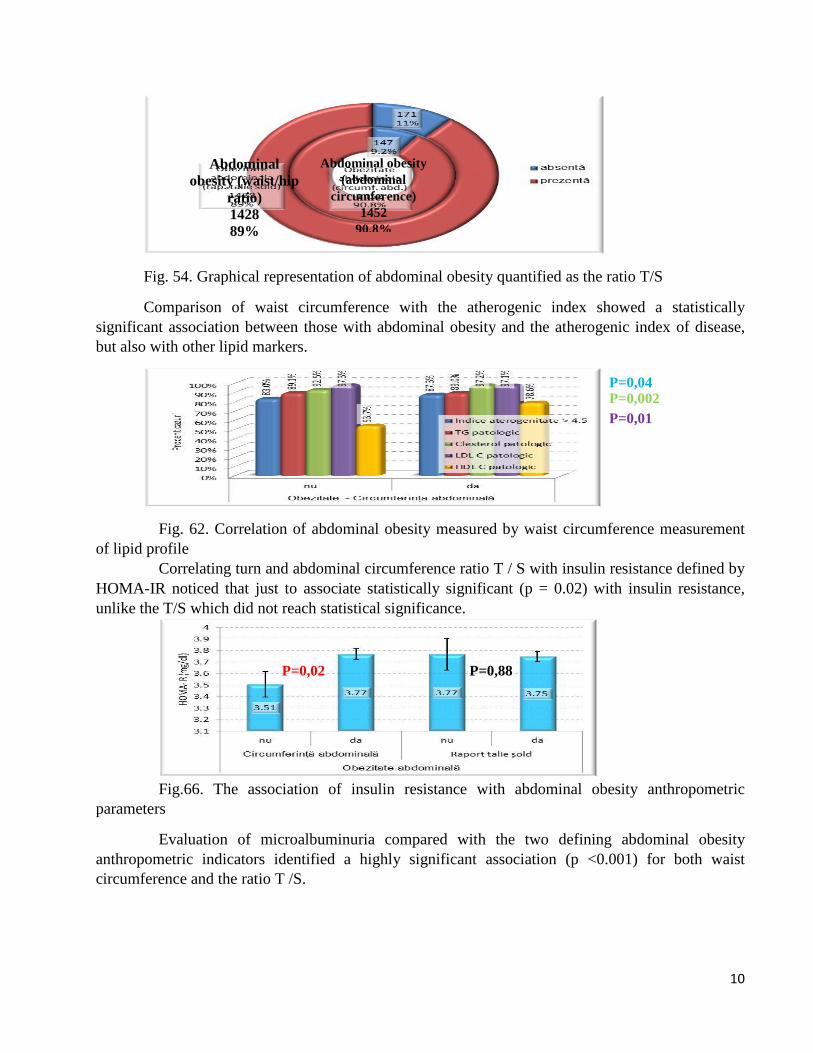
Fig. 54. Graphical representation of abdominal obesity quantified as the ratio T/S
Comparison of waist circumference with the atherogenic index showed a statistically
significant association between those with abdominal obesity and the atherogenic index of disease,
but also with other lipid markers.
Fig. 62. Correlation of abdominal obesity measured by waist circumference measurement
of lipid profile
Correlating turn and abdominal circumference ratio T / S with insulin resistance defined by
HOMA-IR noticed that just to associate statistically significant (p = 0.02) with insulin resistance,
unlike the T/S which did not reach statistical significance.
Fig.66. The association of insulin resistance with abdominal obesity anthropometric
parameters
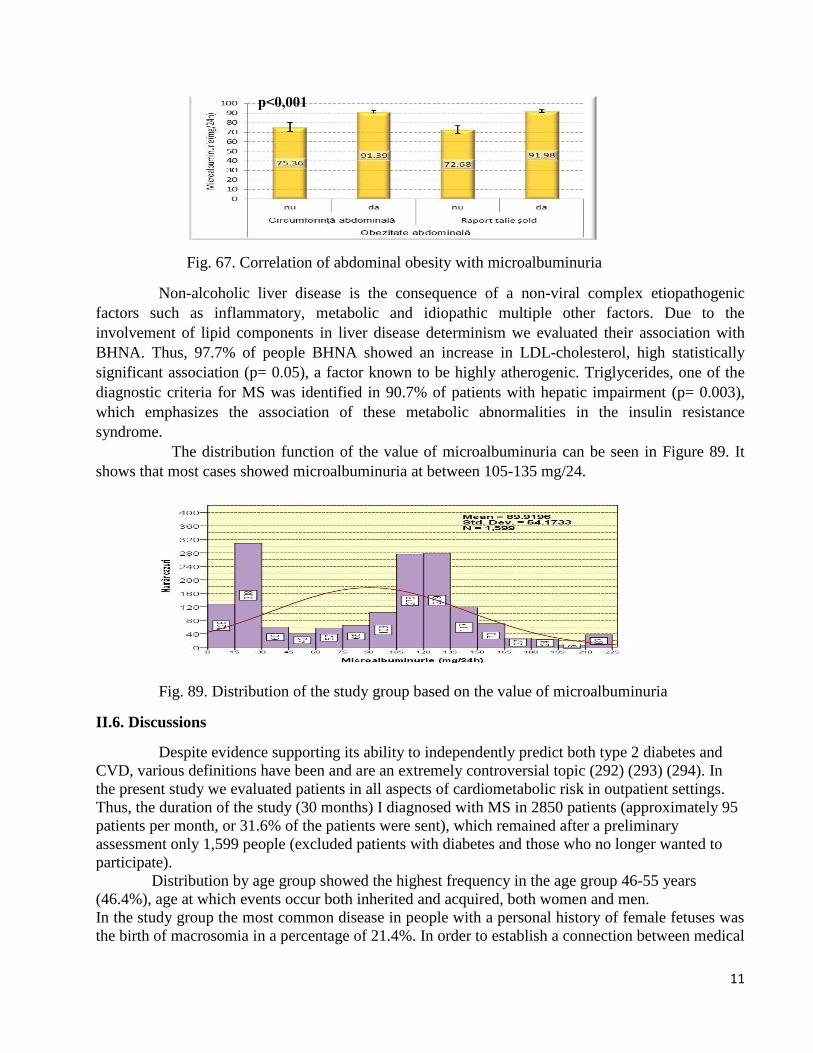
Evaluation of microalbuminuria compared with the two defining abdominal obesity
anthropometric indicators identified a highly significant association (p <0.001) for both waist
circumference and the ratio T /S.
Abdominal
obesity (waist/hip
ratio)
1428
89%
Abdominal obesity
(abdominal
circumference)
1452
90,8%
P=0,04 P=0,002
P=0,01
P=0,02 P=0,88
11
Fig. 67. Correlation of abdominal obesity with microalbuminuria
Non-alcoholic liver disease is the consequence of a non-viral complex etiopathogenic
factors such as inflammatory, metabolic and idiopathic multiple other factors. Due to the
involvement of lipid components in liver disease determinism we evaluated their association with
BHNA. Thus, 97.7% of people BHNA showed an increase in LDL-cholesterol, high statistically
significant association (p= 0.05), a factor known to be highly atherogenic. Triglycerides, one of the
diagnostic criteria for MS was identified in 90.7% of patients with hepatic impairment (p= 0.003),
which emphasizes the association of these metabolic abnormalities in the insulin resistance
syndrome.
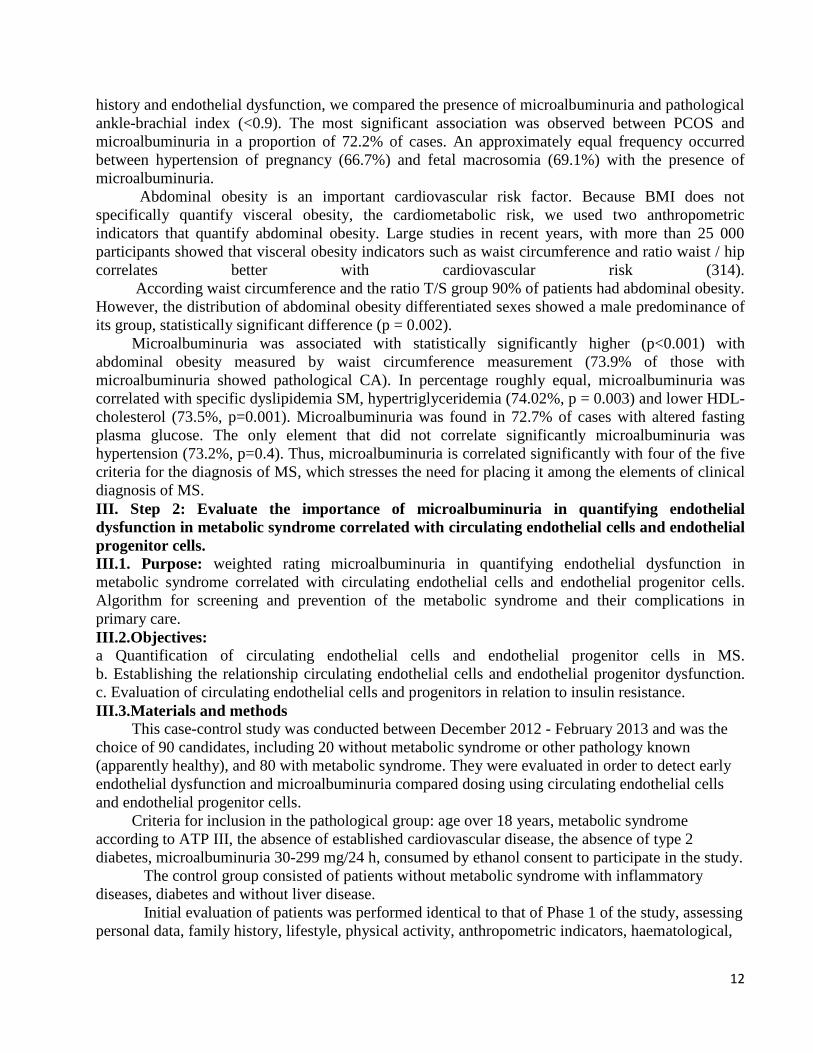
The distribution function of the value of microalbuminuria can be seen in Figure 89. It
shows that most cases showed microalbuminuria at between 105-135 mg/24.
Fig. 89. Distribution of the study group based on the value of microalbuminuria
II.6. Discussions
Despite evidence supporting its ability to independently predict both type 2 diabetes and
CVD, various definitions have been and are an extremely controversial topic (292) (293) (294). In
the present study we evaluated patients in all aspects of cardiometabolic risk in outpatient settings.
Thus, the duration of the study (30 months) I diagnosed with MS in 2850 patients (approximately 95
patients per month, or 31.6% of the patients were sent), which remained after a preliminary
assessment only 1,599 people (excluded patients with diabetes and those who no longer wanted to
participate).
Distribution by age group showed the highest frequency in the age group 46-55 years
(46.4%), age at which events occur both inherited and acquired, both women and men.
In the study group the most common disease in people with a personal history of female fetuses was
the birth of macrosomia in a percentage of 21.4%. In order to establish a connection between medical
p˂0,001
12
history and endothelial dysfunction, we compared the presence of microalbuminuria and pathological
ankle-brachial index (<0.9). The most significant association was observed between PCOS and
microalbuminuria in a proportion of 72.2% of cases. An approximately equal frequency occurred
between hypertension of pregnancy (66.7%) and fetal macrosomia (69.1%) with the presence of
microalbuminuria.
Abdominal obesity is an important cardiovascular risk factor. Because BMI does not
specifically quantify visceral obesity, the cardiometabolic risk, we used two anthropometric
indicators that quantify abdominal obesity. Large studies in recent years, with more than 25 000
participants showed that visceral obesity indicators such as waist circumference and ratio waist / hip
correlates better with cardiovascular risk (314).
According waist circumference and the ratio T/S group 90% of patients had abdominal obesity.
However, the distribution of abdominal obesity differentiated sexes showed a male predominance of
its group, statistically significant difference (p = 0.002).
Microalbuminuria was associated with statistically significantly higher (p<0.001) with
abdominal obesity measured by waist circumference measurement (73.9% of those with
microalbuminuria showed pathological CA). In percentage roughly equal, microalbuminuria was
correlated with specific dyslipidemia SM, hypertriglyceridemia (74.02%, p = 0.003) and lower HDL-
cholesterol (73.5%, p=0.001). Microalbuminuria was found in 72.7% of cases with altered fasting
plasma glucose. The only element that did not correlate significantly microalbuminuria was
hypertension (73.2%, p=0.4). Thus, microalbuminuria is correlated significantly with four of the five
criteria for the diagnosis of MS, which stresses the need for placing it among the elements of clinical
diagnosis of MS.
III. Step 2: Evaluate the importance of microalbuminuria in quantifying endothelial
dysfunction in metabolic syndrome correlated with circulating endothelial cells and endothelial
progenitor cells.
III.1. Purpose: weighted rating microalbuminuria in quantifying endothelial dysfunction in
metabolic syndrome correlated with circulating endothelial cells and endothelial progenitor cells.
Algorithm for screening and prevention of the metabolic syndrome and their complications in
primary care.
III.2.Objectives: a Quantification of circulating endothelial cells and endothelial progenitor cells in MS.
b. Establishing the relationship circulating endothelial cells and endothelial progenitor dysfunction.
c. Evaluation of circulating endothelial cells and progenitors in relation to insulin resistance.
III.3.Materials and methods
This case-control study was conducted between December 2012 - February 2013 and was the
choice of 90 candidates, including 20 without metabolic syndrome or other pathology known
(apparently healthy), and 80 with metabolic syndrome. They were evaluated in order to detect early
endothelial dysfunction and microalbuminuria compared dosing using circulating endothelial cells
and endothelial progenitor cells.
Criteria for inclusion in the pathological group: age over 18 years, metabolic syndrome
according to ATP III, the absence of established cardiovascular disease, the absence of type 2
diabetes, microalbuminuria 30-299 mg/24 h, consumed by ethanol consent to participate in the study.
The control group consisted of patients without metabolic syndrome with inflammatory
diseases, diabetes and without liver disease.
Initial evaluation of patients was performed identical to that of Phase 1 of the study, assessing
personal data, family history, lifestyle, physical activity, anthropometric indicators, haematological,
13
biochemical, immunological and imaging.
Apart from the usual tests taken were taken and 5 ml peripheral blood in anticoagulant dosage
of circulating endothelial cells and endothelial progenitor cells.
Working protocol
1. Optimization method for assessing cell viability (DAPI - 4 ',6-diamidino-2-phenylindole)
2. Lysis in the macrovolum
Table. XXXVI. Marking immunological circulating endothelial cells (CEC) and endothelial progenitor cells
(EPC)
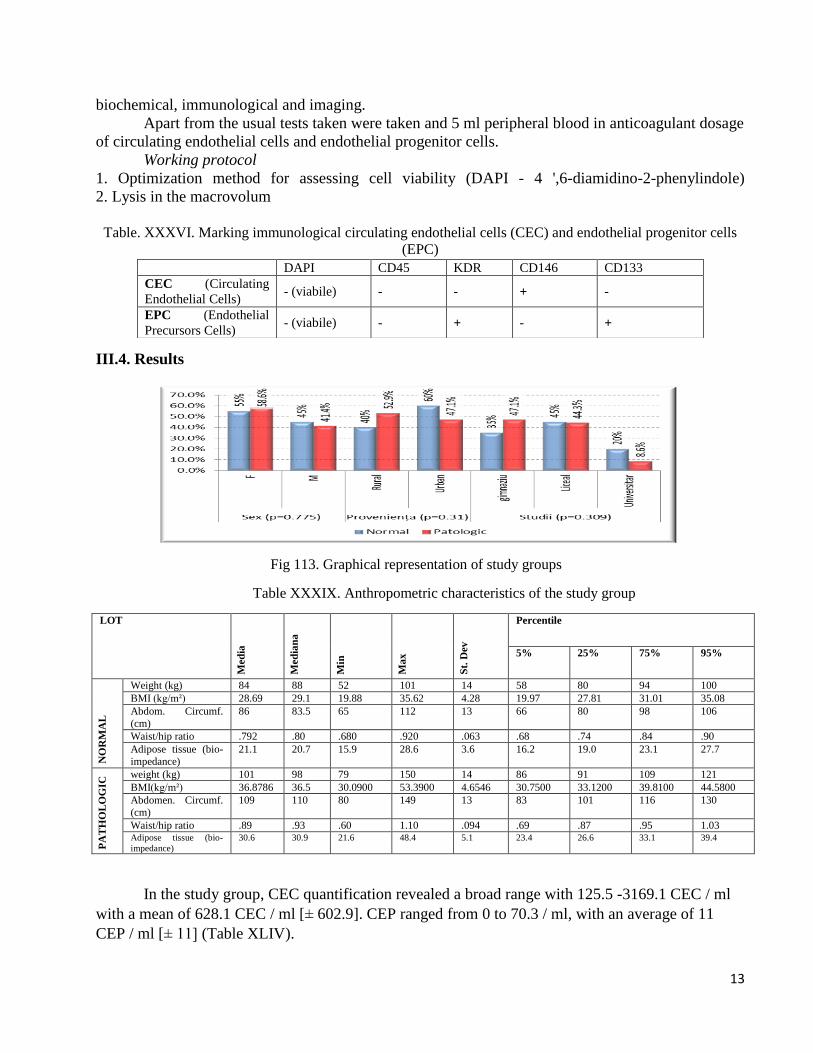
III.4. Results
Fig 113. Graphical representation of study groups
Table XXXIX. Anthropometric characteristics of the study group
LOT
Med
ia
Med
ian
a
Min
Ma
x
St.
Dev
Percentile
5% 25% 75% 95%
NO
RM
AL
Weight (kg) 84 88 52 101 14 58 80 94 100
BMI (kg/m²) 28.69 29.1 19.88 35.62 4.28 19.97 27.81 31.01 35.08
Abdom. Circumf.
(cm)
86 83.5 65 112 13 66 80 98 106
Waist/hip ratio .792 .80 .680 .920 .063 .68 .74 .84 .90
Adipose tissue (bio-
impedance)
21.1 20.7 15.9 28.6 3.6 16.2 19.0 23.1 27.7
PA
TH
OL
OG
IC weight (kg) 101 98 79 150 14 86 91 109 121
BMI(kg/m²) 36.8786 36.5 30.0900 53.3900 4.6546 30.7500 33.1200 39.8100 44.5800
Abdomen. Circumf.
(cm)
109 110 80 149 13 83 101 116 130
Waist/hip ratio .89 .93 .60 1.10 .094 .69 .87 .95 1.03 Adipose tissue (bio-
impedance)
30.6 30.9 21.6 48.4 5.1 23.4 26.6 33.1 39.4
In the study group, CEC quantification revealed a broad range with 125.5 -3169.1 CEC / ml
with a mean of 628.1 CEC / ml [± 602.9]. CEP ranged from 0 to 70.3 / ml, with an average of 11
CEP / ml [± 11] (Table XLIV).
DAPI CD45 KDR CD146 CD133
CEC (Circulating
Endothelial Cells) - (viabile) - - + -
EPC (Endothelial
Precursors Cells) - (viabile) - + - +
14
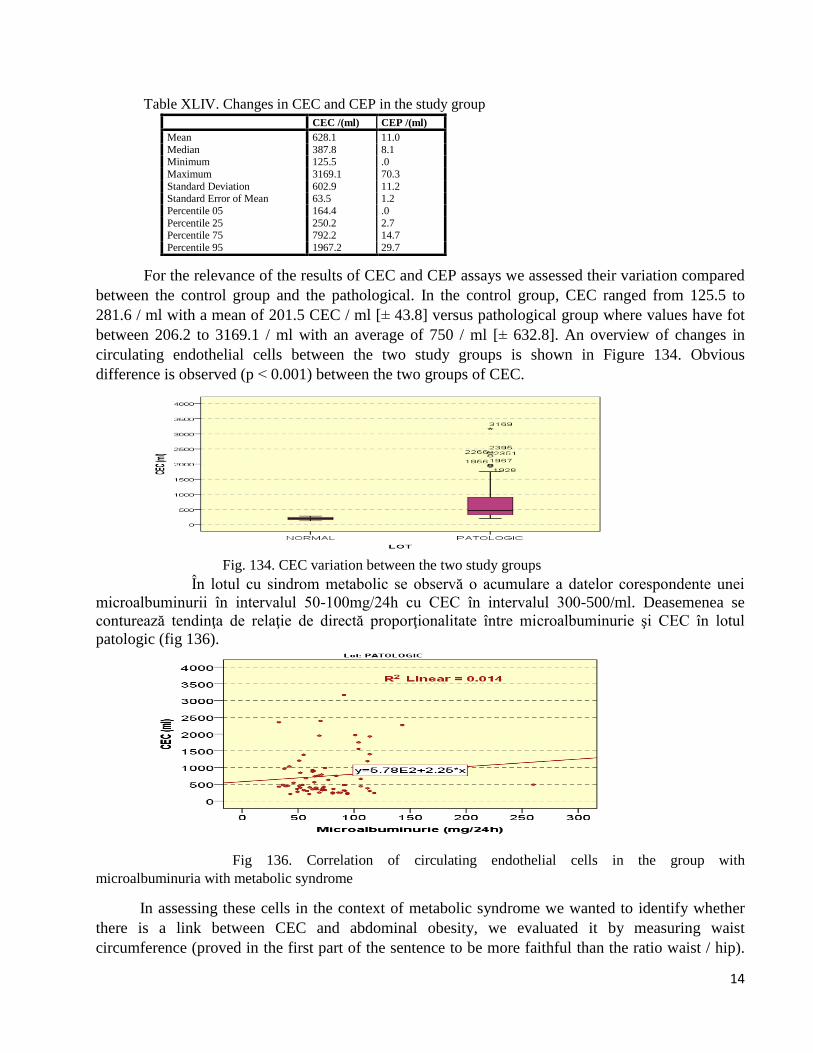
Table XLIV. Changes in CEC and CEP in the study group
For the relevance of the results of CEC and CEP assays we assessed their variation compared
between the control group and the pathological. In the control group, CEC ranged from 125.5 to
281.6 / ml with a mean of 201.5 CEC / ml [± 43.8] versus pathological group where values have fot
between 206.2 to 3169.1 / ml with an average of 750 / ml [± 632.8]. An overview of changes in
circulating endothelial cells between the two study groups is shown in Figure 134. Obvious
difference is observed (p ˂ 0.001) between the two groups of CEC.
Fig. 134. CEC variation between the two study groups
În lotul cu sindrom metabolic se observă o acumulare a datelor corespondente unei
microalbuminurii în intervalul 50-100mg/24h cu CEC în intervalul 300-500/ml. Deasemenea se
conturează tendinţa de relaţie de directă proporţionalitate între microalbuminurie şi CEC în lotul
patologic (fig 136).
Fig 136. Correlation of circulating endothelial cells in the group with
microalbuminuria with metabolic syndrome
In assessing these cells in the context of metabolic syndrome we wanted to identify whether
there is a link between CEC and abdominal obesity, we evaluated it by measuring waist
circumference (proved in the first part of the sentence to be more faithful than the ratio waist / hip).
CEC /(ml) CEP /(ml)
Mean 628.1 11.0
Median 387.8 8.1 Minimum 125.5 .0
Maximum 3169.1 70.3
Standard Deviation 602.9 11.2 Standard Error of Mean 63.5 1.2
Percentile 05 164.4 .0
Percentile 25 250.2 2.7 Percentile 75 792.2 14.7
Percentile 95 1967.2 29.7
15
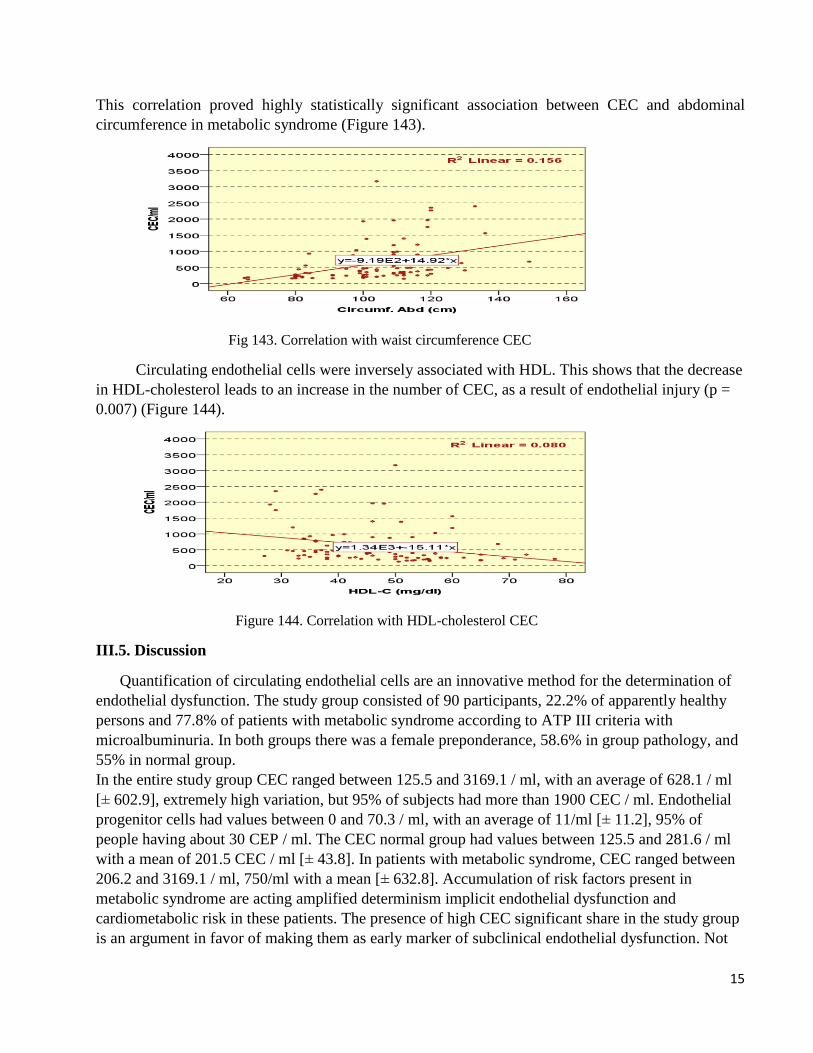
This correlation proved highly statistically significant association between CEC and abdominal
circumference in metabolic syndrome (Figure 143).
Fig 143. Correlation with waist circumference CEC
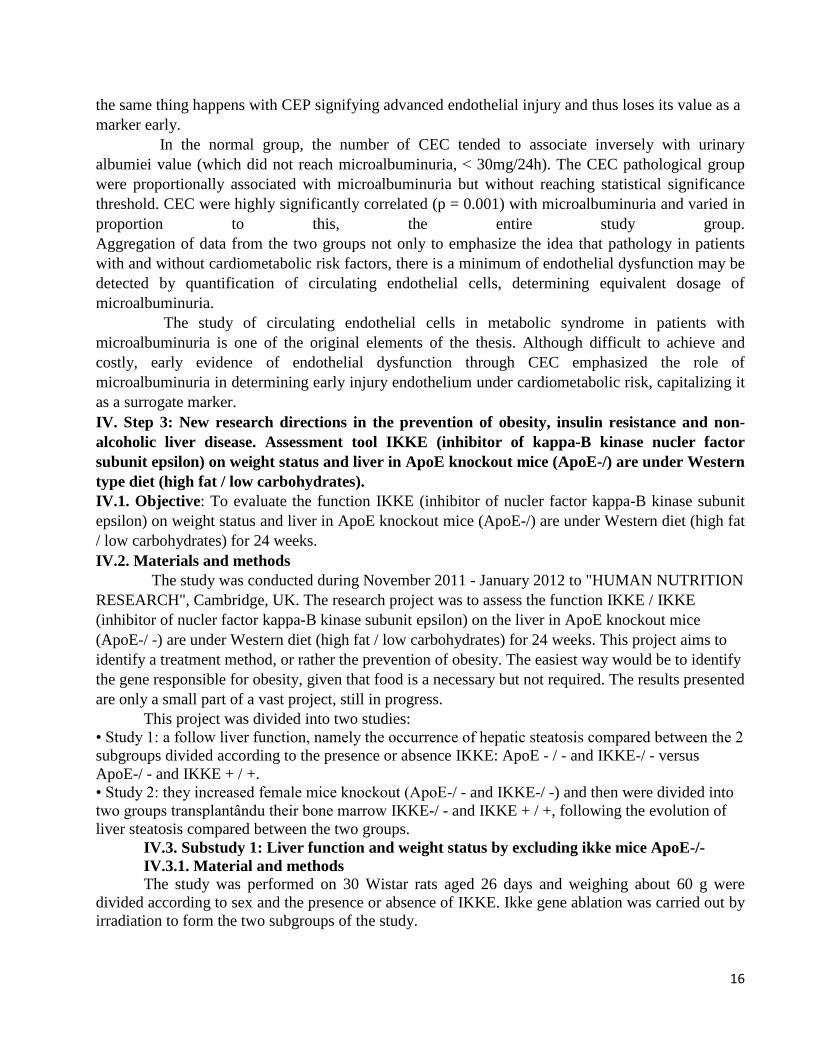
Circulating endothelial cells were inversely associated with HDL. This shows that the decrease
in HDL-cholesterol leads to an increase in the number of CEC, as a result of endothelial injury (p =
0.007) (Figure 144).
Figure 144. Correlation with HDL-cholesterol CEC
III.5. Discussion
Quantification of circulating endothelial cells are an innovative method for the determination of
endothelial dysfunction. The study group consisted of 90 participants, 22.2% of apparently healthy
persons and 77.8% of patients with metabolic syndrome according to ATP III criteria with
microalbuminuria. In both groups there was a female preponderance, 58.6% in group pathology, and
55% in normal group.
In the entire study group CEC ranged between 125.5 and 3169.1 / ml, with an average of 628.1 / ml
[± 602.9], extremely high variation, but 95% of subjects had more than 1900 CEC / ml. Endothelial
progenitor cells had values between 0 and 70.3 / ml, with an average of 11/ml [± 11.2], 95% of
people having about 30 CEP / ml. The CEC normal group had values between 125.5 and 281.6 / ml
with a mean of 201.5 CEC / ml [± 43.8]. In patients with metabolic syndrome, CEC ranged between
206.2 and 3169.1 / ml, 750/ml with a mean [± 632.8]. Accumulation of risk factors present in
metabolic syndrome are acting amplified determinism implicit endothelial dysfunction and
cardiometabolic risk in these patients. The presence of high CEC significant share in the study group
is an argument in favor of making them as early marker of subclinical endothelial dysfunction. Not
16
the same thing happens with CEP signifying advanced endothelial injury and thus loses its value as a
marker early.
In the normal group, the number of CEC tended to associate inversely with urinary
albumiei value (which did not reach microalbuminuria, ˂ 30mg/24h). The CEC pathological group
were proportionally associated with microalbuminuria but without reaching statistical significance
threshold. CEC were highly significantly correlated (p = 0.001) with microalbuminuria and varied in
proportion to this, the entire study group.
Aggregation of data from the two groups not only to emphasize the idea that pathology in patients
with and without cardiometabolic risk factors, there is a minimum of endothelial dysfunction may be
detected by quantification of circulating endothelial cells, determining equivalent dosage of
microalbuminuria.
The study of circulating endothelial cells in metabolic syndrome in patients with
microalbuminuria is one of the original elements of the thesis. Although difficult to achieve and
costly, early evidence of endothelial dysfunction through CEC emphasized the role of
microalbuminuria in determining early injury endothelium under cardiometabolic risk, capitalizing it
as a surrogate marker.
IV. Step 3: New research directions in the prevention of obesity, insulin resistance and non-
alcoholic liver disease. Assessment tool IKKE (inhibitor of kappa-B kinase nucler factor
subunit epsilon) on weight status and liver in ApoE knockout mice (ApoE-/) are under Western
type diet (high fat / low carbohydrates).
IV.1. Objective: To evaluate the function IKKE (inhibitor of nucler factor kappa-B kinase subunit
epsilon) on weight status and liver in ApoE knockout mice (ApoE-/) are under Western diet (high fat
/ low carbohydrates) for 24 weeks.
IV.2. Materials and methods
The study was conducted during November 2011 - January 2012 to "HUMAN NUTRITION
RESEARCH", Cambridge, UK. The research project was to assess the function IKKE / IKKE
(inhibitor of nucler factor kappa-B kinase subunit epsilon) on the liver in ApoE knockout mice
(ApoE-/ -) are under Western diet (high fat / low carbohydrates) for 24 weeks. This project aims to
identify a treatment method, or rather the prevention of obesity. The easiest way would be to identify
the gene responsible for obesity, given that food is a necessary but not required. The results presented
are only a small part of a vast project, still in progress.
This project was divided into two studies:
• Study 1: a follow liver function, namely the occurrence of hepatic steatosis compared between the 2
subgroups divided according to the presence or absence IKKE: ApoE - / - and IKKE-/ - versus
ApoE-/ - and IKKE + / +.
• Study 2: they increased female mice knockout (ApoE-/ - and IKKE-/ -) and then were divided into
two groups transplantându their bone marrow IKKE-/ - and IKKE + / +, following the evolution of
liver steatosis compared between the two groups.
IV.3. Substudy 1: Liver function and weight status by excluding ikke mice ApoE-/-
IV.3.1. Material and methods
The study was performed on 30 Wistar rats aged 26 days and weighing about 60 g were
divided according to sex and the presence or absence of IKKE. Ikke gene ablation was carried out by
irradiation to form the two subgroups of the study.
17
IV.3.2. Results
Weight, which at baseline was approximately equal after 24 weeks of dietary Western was
observed: an increase in weighted subgroup ApoE-/ - IKKE-/ - (dKO) compared to group ApoE-/ -
IKKE + / +, prodominant to sex female.
Gas and liquid chromatography coupled with mass spectrometry showed an increase in fatty acid
composition and in particular to the group ApoE-/ - IKKE-/ -, also more pronounced in women. The
group IKKE + / + showed an increase in the level of fatty acids in the liver, which could be explained
by the absence of ApoE.
IV.3.3. Discussion
ApoE gene ablation rats IKKE-/ -, causes weight gain and liver steatosis, particularly in the
group of women under Western diet.
IV.4. Substudy 2: Evolution of fatty liver after bone marrow transplantation IKKE + / +
mice ApoE-/ - IKKE-/ -.
IV.4.1. Material and methods
The study was conducted on 15 female Wistar rats ApoE-/ - IKKE-/ -, who received a
Western diet for 17 weeks. They were divided into two groups and were identical bone marrow
transplant group IKKE + / + and other IKKE-/ -, then comparing the two groups after 9 weeks.
Design group:
♀: ApoE-/- IKKE-/- n=8 bone marrow transplant ApoE-/- IKKE+/+
♀: ApoE-/- IKKE-/- n=7 bone marrow transplant ApoE-/- IKKE-/-
IV.4.2. Results
Associated gas and liquid chromatography mass spectrometry revealed an increase in
the proportion of fatty acids in the group IKKE-/ -, compared with group IKKE +/+.
Liver biopsy showed a reduction in the group receiving hepatosteatosis transplanted bone marrow
IKKE +/+.
IV.4.3. Discussion
Reactivation ikke weight causes stagnation and alleviate diet-induced steatohepatitis changes.
V. Conclusions
1. In our group the predominant age was between 46 and 55 years, the onset of cardiovascular
disease. In this idea early diagnosis of endothelial dysfunction is useful for prevention.
2. Lipid profile is represented in metabolic syndrome by hypertriglyceridemia and decreased HDL-
cholesterol. They have proven their value in our study, in association with all cardiovascular risk
factors. Non-HDL cholesterol better quantify the risk of cardiovascular disease than LDL cholesterol
in patients with hypertriglyceridemia in metabolic syndrome.
3. Uric acid correlates with all elements of the metabolic syndrome is useful in quantifying the
metabolic risk.
4. Obesity is identified in most cases of metabolic syndrome is present mainly in males. Waist
circumference is the most accurate anthropometric indicators in defining obesity with cardiovascular
risk, irrespective of BMI, especially in women.
5. Insulin resistance is the central pathogenic element of metabolic syndrome, and it is correlated
18
with the surrogate markers of endothelial dysfunction, highlighting the usefulness of HOMA-IR in
the diagnosis and prevention.
6. Non-alcoholic liver disease non-viral has a large share in the metabolic syndrome and is associated
particularly with microalbuminuria and HOMA-IR.
7. Microalbuminuria was found to be the most useful marker of endothelial dysfunction
quantification of metabolic syndrome compared with ankle-brachial index, in association with four
of the five criteria of the clinical definition of the metabolic syndrome.
8. IKKE gene is necessary and sufficient to reduce diet-induced liver steatosis in rats ApoE-/ - and
IKKE-/ -. This particular gene IKKE may be the target of future drugs to treat obesity, fatty liver,
prevent type 2 diabetes and coplicaţiior them.
9. Circulating endothelial cells as a result of endothelial injury are expressed significantly increased
in metabolic syndrome in the absence of clinically evident cardiovascular disease. Endothelial cells
assets are correlated with the decrease in HDL-cholesterol and abdominal obesity measured by waist
circumference. Highly significant correlation statistic between endothelial cells assets and
microalbuminuria proving its usefulness and precocity latter in assessing endothelial dysfunction.
10. Endothelial progenitor cells were significantly associated with circulating endothelial cells in
patients with metabolic syndrome.
11. Primary medicine is the component of the health care system most directly involved in the
identification of the general population at risk and is able to initiate educational measures to change
the lifestyle and risk reduction modern day heart.
19
VI. Selective bibliography
1. Grundy SM, Cleeman JI, Daniels SR, et al. Diagnosis and management of the metabolic
syndrome. An american Heart Association/National Heart, Lung and Blood Institute Scientific
Statement. Circulation 2005;112:2735-52.
2. Alberti KGM, Eckel RH, Grundy SM, et al. Harmonizing the metabolic syndrome: a joint
interim statement of the International Diabetes Federation Task Force on Epidemiology and
Prevention; National Heart, Lung and Blood Institute; American International Association for
the Study of Obesity. Circulation 2009;120:1640-5.
3. Hâncu N, Nita C. Riscul cardiovascular în diabetul zaharat. Cluj-Napoca, Ed. Echinox. 2008.
4. World Health Organization. Definition, diagnosis and classification of diabetes mellitus and
its complications. Report of a WHO consultation 1999.
5. NCEP. Expert panel on detection, evaluation and treatment of high blood pressure in adults.
Executive summary of the third report of the National Cholesterol Education Program (NCEP)
expert panel on detection and evaluation and treatment of high blood cholesterol in adults
(Adult Treatment Panel III). JAMA2001;285:2486–97.
6. Lambert GW, Straznicky NE, Lambert EA. Sympathetic nervous in obesity and the metabolic
syndrome-Causes, consequences and therapeutic implications. Pharmacology&Therapeutics
2010;126:159-72.
7. Bayturan O, Tuzcu EM, Lavoie A, et al. The Metabolic Syndrome, Its Component Risk
Factors, and Progression of Coronary Atherosclerosis. Arch Intern Med 2010;170:478-84.
8. Esposito K, Ceriello A, Giugliano D. Diet and the metabolic syndrome. Metab Syndr Relat
Disord 2007;5:291-6.
9. Eckel RH, Alberti KG, Grundy SM, Zimmet PZ. The metabolic syndrome. Lancet 2010;
375:181-3.
10. Frances Fischbach. Urine Studies. In A Manual of Laboratory and Diagnostic Tests, 8. USA,
Lippincott Williams & Wilkins, 2009, 212-5.
11. Deurenberg P, Yap M, Van Staveren WA. Body mass index and percent body fat: a meta-
analylis among different ethnic groups.Int J Obes Relat Metab Disord 1998;22:1164-71.
12. Kim H, Lee SW, Lee HS, et al. Associations Between Lipid Measures and Metabolic
Syndrome, Insulin Resistance and Adiponectin-Usefulness of Lipid Ratio in Korean Men and
Women. Circ J 2010;74(5):931-7.
13. Peichev M, Naiyer AJ, Pereira D. Expression of VEGFR-2 and AC133 by circulating human
CD34(+) cells identifies a population of functional endothelial precursors.Blood 2000;95
(3):952-8.
14. Elshal MF, Khan SS, Takahashi Y, Solomon MA, McCoy JP. CD146 (Mel-CAM), an adhesion
marker of endothelial cells, is a novel marker of lymphocyte subset activation in normal
peripheral blood. Blood 2005;106(8):2923–4.
15. Cameron AJ, Zimmet PZ, Shaw JE, Alberti KG. The metabolic syndrome: in need of a global
mission statement. Diabet Med 2009;26:306-9.
16. Perkins ND. Integrating cell-signalling pathways with NF-kB and IKK function. Nat Rev Mol
Cell Biol 2007;8(1):49-62.
20
Final date
In the thesis were used XLIV tables, 157 figures and 362 bibliographic index. Tables and figures
have kept the numbering of the summary thesis.
LIST OF SCIENTIFIC PAPERS ISSUED
DURING THE PhD STUDIES
1. Maria Gabriela Maidaniuc, Adorata Elena Coman, G.C. Murariu, L. Traian,
Rodica Petrovanu. Disthyroiditis impact in therapeutic control of essential arterial
hypertension. Practica Medicală 2010;2(18):138-141.
2. Maria Gabriela Maidaniuc, Adorata Elena Coman, Elena Popa, Cecilia Grigore,
Ana Maria Holicov, Rodica Petrovanu. Oral glucose tolerance test- proof of strength
over time. Practica Medicală 2012;4(28):283-288.
3. Maria-Gabriela Traian, Adorata Elena Coman, Elena Popa, L. Traian, Rodica
Petrovanu. Stress: from symptom to disease. Rev. Med. Chir. Soc. Med. Nat.
2013;117(1):72-77.
4. Maria Gabriela Traian, Adorata Elena Coman, Elena Popa, Rodica Petrovanu.
Adipose cells diameter correlated with level of insulinaemia on an obese population
(histological and biochemical issues). Archives of the Balkan Medical Union
2013;48(2):163-169.