Embed Size (px)
Citation preview

992 Copyright © 2017 The Korean Society of Radiology
INTRODUCTION
One of the major difficulties faced by radiologists in everyday practice is selecting the correct diagnosis, or at least narrowing the list of possibilities to a manageable size. In this context, indicative evidences are useful in radiology to recognize the presence of pathologies, and also help in narrowing the list of differential diagnoses. Even though they are classically defined for a single disease, or a closely related family of disorders, most indications are not restricted or exclusive to their traditional definition. Therefore, applying the signs and indications during the diagnostic process is a skill in itself, and requires knowledge of the mechanism of its appears as well as various
Signs in Neuroradiology: A Pictorial ReviewÖzgür Kizilca, MD, Alp Öztek, MD, Ugur Kesımal, MD, Utku Senol, Prof. Dr.All authors: Department of Radiology, Akdeniz University Faculty of Medicine, Antalya, Turkey
One of the major problems radiologists face in everyday practice is to decide the correct diagnosis, or at least narrow down the list of possibilities. In this context, indicative evidences (signs) are useful to recognize pathologies, and also to narrow the list of differential diagnoses. Despite classically being described for a single disease, or a closely related family of disorders, most indications are not restricted exclusively to their traditional definition. Therefore, using signs for prognosis requires knowledge of the mechanism of their appearance, and which pathologies they are observed in. In this study, we demonstrate some of the more common and useful neuroradiologic signs with relevant images, and discuss their use in differential diagnosis.Keywords: Neuroradiology; Signs/indications; MRI; CT; Ultrasound; Brain
Received October 30, 2016; accepted after revision February 2, 2017.Corresponding author: Alp Öztek, MD, Department of Radiology, Akdeniz University Faculty of Medicine, Tıp Fakultesi Hastanesi Kampüs, Antalya 07070, Turkey. • Tel: +90 555 2531010 • Fax: +90 242 2496455• E-mail: [email protected] is an Open Access article distributed under the terms of the Creative Commons Attribution Non-Commercial License (http://creativecommons.org/licenses/by-nc/4.0) which permits unrestricted non-commercial use, distribution, and reproduction in any medium, provided the original work is properly cited.
Korean J Radiol 2017;18(6):992-1004
pathologies it is observed in. In this study, we demonstrate some of the more common and useful neuroradiologic signs with relevant images, and discuss their use in differential diagnosis.
Black Hole
Black holes are areas that, with respect to normal appearing white matter, appear hypointense in T1-weighted images (T1WI) (Fig. 1), and hyperintense in T2-weighted images (T2WI), and are commonly seen in multiple sclerosis (MS) (1). Histopathologically, chronic black holes are related to severe tissue damage, caused by axon loss and demyelination (1, 2). Acute black holes represent a group of lesions caused by edema, demyelination and axonal injury (2).
Caput Medusa
Caput medusa is indicated by the appearance of tubular structures in the brain parenchyma, the “snakes” converging towards a common point (the “head”), in contrast-enhanced MRI and CT images (Fig. 2). It is seen in developmental venous anomalies, also known as cerebral venous angiomas (3).
https://doi.org/10.3348/kjr.2017.18.6.992pISSN 1229-6929 · eISSN 2005-8330
Pictorial Essay | Neuroimaging and Head & Neck

993
Signs in Neuroradiology
Korean J Radiol 18(6), Nov/Dec 2017kjronline.org
Cloverleaf Skull
A cloverleaf skull occurs when the cranium takes a
shape similar to a cloverleaf, appearing trilobular, due to craniosynostosis (Fig. 3). It is a typical feature of various syndromes, and has been described for type I and II thanatophoric dysplasia, Boston type craniosynostosis, and others such as Carpenter syndrome, severe cases of Apert syndrome and Crouzon syndrome (4).
Coca-Cola Bottle Sign
Thyroid disease affects muscles of the eye, with 25% cases of Graves’ disease having ophthalmopathy, and 75–80% of thyroid ophthalmopathies affecting the extraocular muscles (5, 6). The nontendinous part of the muscles are mostly affected, causing a swelling of the belly and the overall muscle having a fusiform shape, likened to a Coca-Cola bottle (Fig. 4) (6). The muscle most commonly involved is the inferior rectus, followed by the medial, lateral and superior recti, respectively. However, there are studies reporting similar frequencies of involvement of different muscles also (6, 7).
Cord Sign and Empty Delta Sign
Cord sign is the loss of flow void in a dural sinus, and its replacement by an abnormal signal intensity on T2-weighted MRI images or linear hyperdensities in the affected area
Fig. 1. Black hole sign. On this MRI T1WI, areas that are hypointense with respect to normal appearing white matter, are so-called “black holes” (arrow). T1WI = T1-weighted images
Fig. 2. Caput medusa sign. Coronal postcontrast MRI images demonstrate tubular converging towards common point in left cerebellar hemisphere (arrow). This appearance is characteristic of venous angiomas.
Fig. 3. Cloverleaf skull sign. Coronal CT image of infant with thanatophoric dysplasia shows trilobular cranium that looks like cloverleaf.

994
Kizilca et al.
Korean J Radiol 18(6), Nov/Dec 2017 kjronline.org
in CT (Fig. 5) (8). Even though it is seen in a minority of cases with cerebral venous thrombosis, the use of thinner sections has increased the incidence of its detection (8). An additional indication possibly seen in this clinical scenario, is the empty delta sign, a triangle shaped filling defect in superior sagittal sinus observed in contrast-enhanced MRI and CT images (9).
Cotton Wool Sign
Cotton wool appearance is described for plain film imaging of Paget’s disease. Paget’s disease is characterised by a lytic phase, where areas of osteolysis appear (osteoporosis circumscripta), a mixed phase and a sclerotic phase (10). When occurrence of sclerosis in previous areas of osteoporosis circumscripta results in a pattern with focal areas of opacity in a previously lucent area; this pattern is called the cotton wool appearance (Fig. 6) (10).
Dawson Fingers
Multiple sclerosis has a wide array of radiological findings, and many of these have their own signs. Demyelinating plaques with a perpendicular course, adjacent to the body
Fig. 4. Coca-Cola bottle sign. T1WI images of patient with Graves’ ophthalmopathy demonstrates extraocular muscles having shape similar to Coca-Cola bottle (arrow), due to relative sparing of tendinous areas.
Fig. 5. Cord sign. Sagittal T1WI shows loss of flow void in cerebral vein, therefore appearing as hyperintensity (arrow).
Fig. 6. Cotton wool sign. Transverse CT image of patient with Paget’s disease shows cotton wool appearance.

995
Signs in Neuroradiology
Korean J Radiol 18(6), Nov/Dec 2017kjronline.org
of the lateral ventricle, present as hyperintensities on T2WI (Fig. 7) (11). They are called Dawson’s fingers and are are considered to be a relatively specific sign for MS.
Dense MCA and Insular Ribbon
Indications of dense middle cerebral artery (MCA) are the
hyperattenuating appearance of the proximal part of MCA (Fig. 8). This is one of the early signs of ischemic stroke with 90–100% sensitivity, but only 30% specificity (12). False positives are seen in patients with high hematocrit values or calcified atherosclerosis, in which case the patients are asymptomatic and the appearance is usually bilateral (12). A similar appearance has also been reported in some viral infections (12).
The insular cortex is more susceptible to ischemia than other parts of the MCA territory due to lack of collateral supply from anterior cerebral arteries and posterior cerebral arteries (13). The normal gray-white matter interface located here is called the insular ribbon, and the loss of this distinction is an early sign of a MCA infarction.
Dural Tail
Dural tail is the result of the thickening of dura mater adjacent to a mass, resembling a tail extending from the lesion, in contrast enhanced MRI (Fig. 9) (14). It is classically a feature of meningiomas, with approximately 60–72% featuring a tail (15). However, it is not exclusive to meningiomas, and the process has also been described in other lesions such as glioblastome multiforme,
Fig. 7. Dawson fingers. Sagittal MRI FLAIR image of patient with MS shows hyperintensities perpendicular to corpus callosum (arrows), so-called Dawson fingers. FLAIR = fluid attenuated inversion recovery, MS = multiple sclerosis
Fig. 8. Dense MCA sign. On transverse CT image, left MCA appears hyperdense due to thrombus (arrow). MCA = middle cerebral artery
Fig. 9. Dural tail. Transverse MRI image shows dural “tail” of lesion (arrow), classically considered feature of meningiomas.

996
Kizilca et al.
Korean J Radiol 18(6), Nov/Dec 2017 kjronline.org
medulloblastoma, chloroma, lymphoma, neurosarcoidosis, and acoustic neuroma (16).
Etat Crible
Poirier and Derouesne originally described 3 types of lacunae: type I (infarct), type II (hemorrhage) and type III (dilation of the perivascular space) (17). Presence of numerous type III lacunae results in a colander-like appereance of the brain, which is referred to as état criblé (cribriform state). A few cases of vascular parkinsonism presenting as état criblé have been reported (18).
The Eye of the Tiger Sign
The eye of the tiger sign is the presence of a hypointense area around a high signal intensity area in the anteromedial globus pallidus, in T2WI images (Fig. 10) (19). The hypointensity is caused by iron accumulation (19). It is classically seen in Hallervorden-Spatz syndrome where, besides its diagnostic utility, it can be used to identify patients for testing of PANK2 mutations, and to identify siblings of affected children before the symptoms appear (20). The sign is not pathognomonic, and has also been reported in cortical-basal ganglionic degeneration, Steele-Richardson-Olszewski syndrome, and early onset levodopa responsive parkinsonism (19).
Figure of 8
In radiology, there are various apperances resembling a snowman or Figure 8 (Fig. 11). The one related to neuroradiology is seen in pituitary macroadenomas. By definiton, these lesions are, larger than 1 cm, and first expand the sella turcica, after which they grow upwards. As the lesion grows, it squeezes through the diaphragma sella, causing an indentation or a ‘waist’ in the lesion, giving it an appearance like a snowman or the number 8 (21).
Ground-Glass Appearance
Fibrous dysplasia is characterized by the progressive displacement of normal bone tissue by elements of fibrous tissue (22). It can affect any bone in the body, and the face and skull are frequent sites of involvement (22). The ground-glass appearance (Fig. 12) in an expanded bone is the most common pattern of fibrous dysplasia observed in CT (23).
Fig. 10. Eye of tiger sign. Coronal T2WI shows eye of tiger sign (arrows) in patient with Hallervorden-Spatz syndrome. T2WI = T2-weighted images
Fig. 11. Figure of 8. Coronal T1WI of MRI shows pituitary macroadenoma resembling figure of 8 (or snowman) (arrow) due to indentation at diaphragma sellae.
Fig. 12. Ground-glass appearance. Coronal CT image demonstrates ground-glass appearance in right temporal bone (arrow). Patient had diagnosis of fibrous dysplasia.

997
Signs in Neuroradiology
Korean J Radiol 18(6), Nov/Dec 2017kjronline.org
Harlequin Appearance
Either unilateral or bilateral coronal suture synostosis causes shallowing of the anterior cranial fossa and the orbits, and the uplifting of the orbital roof with elevation of the superolateral corner (24). On head radiographic images, these findings result in an appearance similar to a harlequin, thus giving it the name the harlequin appearance (Fig. 13).
Horseshoe Sign
In active stage of the disease, MS plaques demonstrate temporary enhancement. An incomplete ring of enhancement, where the non-enhancing part points toward the cortex, resembles a horseshoe (Fig. 14), and is observed especially in large tumefactive lesions (25).
Hot Cross Bun Sign
Hot cross bun sign is a cross shaped hyperintensity in
the pons seen on T2WI (Fig. 15) (26, 27). It is usually seen in multiple system atrophy C, but is also observed in spinocerebellar atrophy and parkinsonism secondary to vasculitis (18). It has also been reported in variant Creutzfeld-Jacob disease (26). It is thought to be caused by neuronal loss in the pontine nuclei and transverse pontocerebellar tract, but sparing the corticospinal tracts and the pontine tegmentum (26, 27).
Hot Nose and Empty Skull
There are several signs described for the scintigraphic appearance of brain death. One of them is the hot nose, defined as the early and increased activity observed in the
Fig. 13. Harlequin appearance. Head radiography shows uplifting of orbital roof with elevation of superolateral corner, so-called harlequin appearance.
Fig. 15. Hot cross bun sign. T2WI shows cross shaped hyperintensity in pons (arrow). This patient had multiple system atrophy.
Fig. 14. Horseshoe sign. In patient with MS, postcontrast MRI image demonstrates incomplete ring of enhancement, resembling horseshoe (arrow).

998
Kizilca et al.
Korean J Radiol 18(6), Nov/Dec 2017 kjronline.org
nasopharyngeal region (28). It is caused by the lack of flow in the internal carotid arteries, causing lack of scintigraphic activity in the brain (the empty skull appearance). Since all the blood in the carotid arteries necessarily flow through the external carotids, the activity around the nose is both early and increased (the hot nose sign) (Fig. 16) (29).
Hummingbird Sign
This indication, known as the hummingbird sign or king penguin sign, is seen on mid-sagittal T2WI, where selective atrophy of the tegmentum coupled with a relatively preserved pons gives the appearance of the head and body of a hummingbird (Fig. 17). It is characteristic of progressive supranuclear palsy (previously known as Steele-Richardson-Olszewski syndrome) (30, 31).
Ice Cream Cone Sign
The normal positioning of the head of malleus and the body of incus resemble an ice cream cone in axial CT images (Fig. 18), where the cone is the body of incus and the icecream ball itself is the head of malleus (32). Disruption of the “ice cream cone” is seen in incudomalleolar dysarticulation (33).
Ivy Sign
Ivy sign is an appearance of linear hyperintensities in the sulci and subarachnoid space. These intensities can be continuous or discontinuous, and can be observed on fluid attenuated inversion recovery (FLAIR) images or postcontrast T1WI (Fig. 19) (34, 35). Contrast-enhanced T1WI are considered superior to FLAIR images
for demonstration of the ivy sign (34). The appearance in postcontrast T1WI images is considered to be due to slow flowing enlarged pial vessels (34).
Lemon Sign
During antenatal imaging (with ultrasonography or MRI) on the axial plane through the head, the appearance of bifrontal flattening or concavityresembles a lemon (Fig. 20) (36). It is classically seen in fetuses with spina bifida, which is commonly associated with Chiari II malformation (36).
Molar Tooth Sign
In transverse CT or MRI images at the level of the
Fig. 18. Ice cream cone sign. Coronal CT image shows normal appearance of incus and malleus, resembling ice cream cone (arrows).
Fig. 17. Hummingbird sign. Mid-sagittal T1WI shows appearance similar to head and body of hummingbird (arrow), due to selective atrophy of tegmentum and relatively preserved pons.
Fig. 16. Hot nose and empty skull. Tc99m-DTPA images show lack of activity inside cranium (“empty skull”) with increased activity in nasopharyngeal area due to increased flow via external carotid arteries (“hot nose”).
999
Signs in Neuroradiology
Korean J Radiol 18(6), Nov/Dec 2017kjronline.org
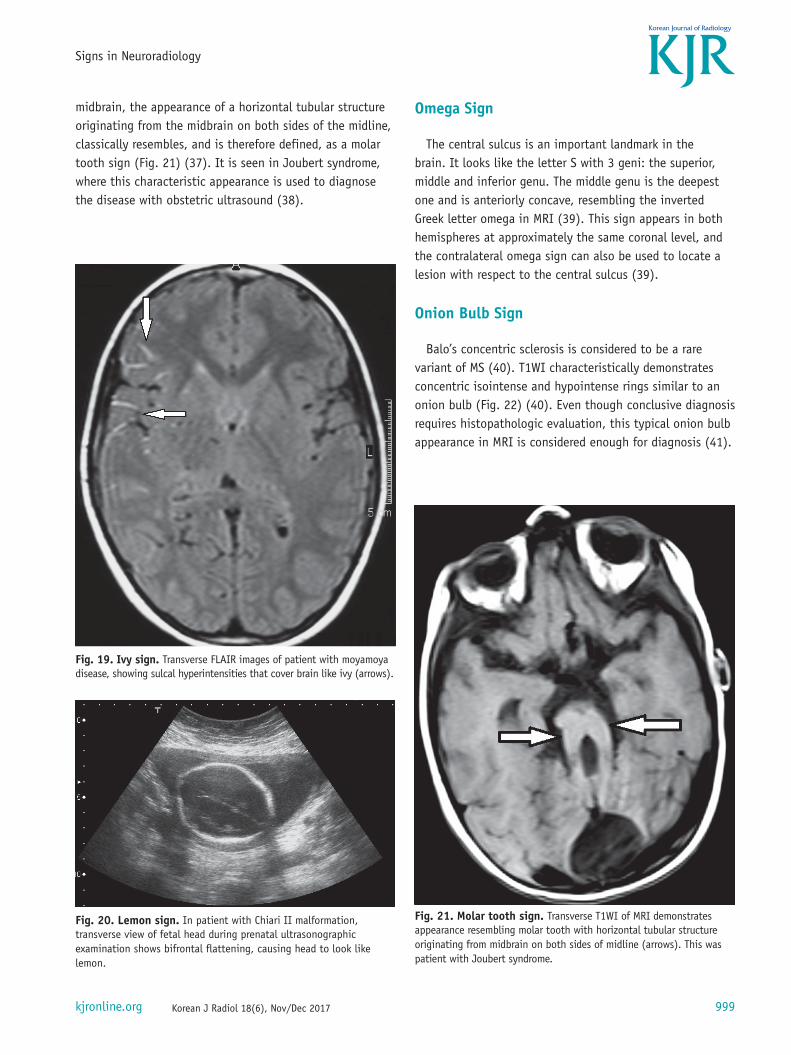
midbrain, the appearance of a horizontal tubular structure originating from the midbrain on both sides of the midline, classically resembles, and is therefore defined, as a molar tooth sign (Fig. 21) (37). It is seen in Joubert syndrome, where this characteristic appearance is used to diagnose the disease with obstetric ultrasound (38).
Omega Sign
The central sulcus is an important landmark in the brain. It looks like the letter S with 3 geni: the superior, middle and inferior genu. The middle genu is the deepest one and is anteriorly concave, resembling the inverted Greek letter omega in MRI (39). This sign appears in both hemispheres at approximately the same coronal level, and the contralateral omega sign can also be used to locate a lesion with respect to the central sulcus (39).
Onion Bulb Sign
Balo’s concentric sclerosis is considered to be a rare variant of MS (40). T1WI characteristically demonstrates concentric isointense and hypointense rings similar to an onion bulb (Fig. 22) (40). Even though conclusive diagnosis requires histopathologic evaluation, this typical onion bulb appearance in MRI is considered enough for diagnosis (41).
Fig. 19. Ivy sign. Transverse FLAIR images of patient with moyamoya disease, showing sulcal hyperintensities that cover brain like ivy (arrows).
Fig. 20. Lemon sign. In patient with Chiari II malformation, transverse view of fetal head during prenatal ultrasonographic examination shows bifrontal flattening, causing head to look like lemon.
Fig. 21. Molar tooth sign. Transverse T1WI of MRI demonstrates appearance resembling molar tooth with horizontal tubular structure originating from midbrain on both sides of midline (arrows). This was patient with Joubert syndrome.

1000
Kizilca et al.
Korean J Radiol 18(6), Nov/Dec 2017 kjronline.org
Popcorn Sign (Mulberry Sign)
Popcorn sign (also known as mulberry sign) is the appearance of a well-defined lobulated lesion with a central area of heterogeneous intensities on T1WI and T2WI (Fig. 23) (42). It is considered characteristic of cavernous hemangiomas, and can be seen in both cerebral and spinal lesions (42, 43). The central area of mixed intensity is formed by thrombosis, fibrosis, blood breakdown products and calcification (43).
Puff of Smoke
In moyamoya disease, proliferation of extensive deep collateral networks, including the lenticulostriates, anterior and posterior choroidal branches, form a characteristic appearance of a network of tiny intracranial collateral vessels in angiography (Fig. 24) (44). This “puff of smoke” appearance is considered diagnostic of moyamoya disease, which itself means a “hazy puff of smoke” in Japanese (45).
Pulvinar Sign
Pulvinar sign is the hyperintensity of the pulvinar and medial areas of the thalamus in T2WI and FLAIR images (Fig. 25) typically seen in, but not exclusive to, Fabry disease (46).
Interestingly, it is almost always seen in male patients, with only few cases reported in females (47). It has also been reported in Creutzfeld-Jacob disease, central nervous system infections, phakomatoses, and as a result of chemotherapy and radiotherapy in brain tumors (47, 48).
Fig. 23. Popcorn sign. Transverse T1WI demonstrates well-defined lobulated lesion with central area of heterogeneous signal intensities (arrow). This appearance is typical for cavernous hemangiomas.
Fig. 24. Puff of smoke. Lateral digital subtraction angiography image of patient with moyamoya disease shows characteristic appearance of network of tiny intracranial collateral vessels resembling “puff of smoke.”
Fig. 22. Onion bulb sign. Coronal T1WI of patient with diagnosis of Balo’s concentric sclerosis, shows concentric isointense and hypointense rings that look like onion bulb (arrow).

1001
Signs in Neuroradiology
Korean J Radiol 18(6), Nov/Dec 2017kjronline.org
Swirl Sign
On noncontrast CT, image of the active bleeding into an epidural hematoma is identified as the swirl sign (Fig. 26) (49, 50). The active component of uncoagulated blood is of lower attenuation than the surrounding clotted blood, forming an area of low attenuation in an otherwise hyperattenuating hematoma (50). The recognition of this sign identifies actively bleeding epidural hematomas, resulting in the appropriate intervention for the patient (50).
Target Sign
There are various appearances called target sign (or bull’s eye sign), related to many organs and systems. Even for a single organ, various entities result in a target appearance. For instance, cerebral metastases (Fig. 27) and abscesses can cause the target sign, as well as some hematomas in MRI (in which case it is also called concentric ring sign). Eccentric target signs have also been reported for cerebral toxoplasmosis (51).
Tiger Stripe Pattern
The tiger stripe sign is the presence of inner hyperintense
Fig. 25. Pulvinar sign. Pulvinar hyperintensities (arrows) on FLAIR images of patient with Fabry disease.
Fig. 26. Swirl sign. Transverse CT image demonstrates hypoattenuating areas in otherwise hyperdense epidural hematoma (arrow), corresponding to active hemorrhage.
Fig. 27. Target sign. Postcontrast transverse MRI image reveals target-like lesions (arrow) in patient with cerebral metastases of malignant melanoma.
bands alternating with outer hypointense areas, observed in the cerebellum on T2WI (Fig. 28). This appearance is due to the close apposition of thickened cerebellar folia

1002
Kizilca et al.
Korean J Radiol 18(6), Nov/Dec 2017 kjronline.org
(52). When unilateral, and seen in a middle-aged adult, it is considered typical for Lhermitte-Duclos disease, also known as dysplastic cerebellar gangliocytoma (53). It often enables a diagnosis without histopathological confirmation. However, some authors recommend advanced imaging or biopsy in certain clinical settings (54).
Tigroid Pattern
Tigroid pattern, also called as leopard skin sign, is when the hypointense lines or spots are seen in periventricular white matter on T2WI (Fig. 29) (32). It is caused by demyelination, is prominent in periventricular white matter and centrum semiovale, and is characteristically observed in metachromatic leukodystrophy (55). It has also been reported in Pelizaeus-Merzbacher disease, globoid cell leukodystrophy and Lowe syndrome (56).
White Cerebellum Sign
On CT imaging, white (or dense) cerebellum sign is seen when the cerebellum appears dense with respect to
the cerebral parenchyma. The “increase” in attenuation of cerebellum is in fact a relative hyperdensity caused by decreased attenutation of the brain (Fig. 30). It represents anoxic-ischemic cerebral injury, and has a very poor prognosis (32).
Fig. 28. Tiger stripe pattern. Transverse FLAIR image shows alternating hyperintense and hypointense bands in tiger stripe pattern, in right cerebellar hemisphere (arrow).
Fig. 29. Tigroid pattern. Transverse T2WI shows hypointense lines in otherwise hyperintese periventricular white matter (arrows), characteristically seen in metachromatic leukodystrophy.
Fig. 30. White cerebellum sign. Transverse CT image of infant shows “white cerebellum” that appears denser than cerebral parenchyma (arrow). This appearance has very poor prognosis.

1003
Signs in Neuroradiology
Korean J Radiol 18(6), Nov/Dec 2017kjronline.org
Another sign associated with severe ischemic damage is the reversal sign, where the gray matter appears hypodense with respect to the white matter, in contrast to the normal appearance where gray matter is denser (57).
CONCLUSION
Signs are useful in radiology since they are easy to remember, can help recognize presence of abnormalities, and narrow the list of differentials. By knowing which pathologies create the typical appearance of a ‘sign,’ radiologists can reach a decision regarding the diagnosis more efficiently.
AcknowledgmentsThe authors would like to thank Dr. Kader Oguz (Hacettepe
University, Faculty of Medicine, Department of Radiology, Ankara, Turkey) for providing the case image for the eye of tiger sign (Fig. 10) and Dr. Osman Kızılkılıç (Istanbul University, Cerrahpasa Faculty of Medicine, Department of Radiology, Istanbul, Turkey) for providing the case image for puff of smoke (Fig. 24).
REFERENCES
1. Tam RC, Traboulsee A, Riddehough A, Li DK. Improving the clinical correlation of multiple sclerosis black hole volume change by paired-scan analysis. Neuroimage Clin 2012;1:29-36
2. Naismith RT, Xu J, Tutlam NT, Scully PT, Trinkaus K, Snyder AZ, et al. Increased diffusivity in acute multiple sclerosis lesions predicts risk of black hole. Neurology 2010;74:1694-1701
3. Saba PR. The caput medusae sign. Radiology 1998;207:599-600
4. Chen CP, Lin SP, Su YN, Huang JK, Wang W. A cloverleaf skull associated with Crouzon syndrome. Arch Dis Child Fetal Neonatal Ed 2006;91:F98
5. Bartalena L. Diagnosis and management of Graves disease: a global overview. Nat Rev Endocrinol 2013;9:724-734
6. Gonçalves AC, Gebrim EM, Monteiro ML. Imaging studies for diagnosing Graves’ orbitopathy and dysthyroid optic neuropathy. Clinics (Sao Paulo) 2012;67:1327-1334
7. Nugent RA, Belkin RI, Neigel JM, Rootman J, Robertson WD, Spinelli J, et al. Graves orbitopathy: correlation of CT and clinical findings. Radiology 1990;177:675-682
8. Vijay RK. The cord sign. Radiology 2006;240:299-3009. Lee EJ. The empty delta sign. Radiology 2002;224:788-789
10. Smith SE, Murphey MD, Motamedi K, Mulligan ME, Resnik CS, Gannon FH. From the archives of the AFIP. Radiologic spectrum of Paget disease of bone and its complications with
pathologic correlation. Radiographics 2002;22:1191-121611. Matthews L, Marasco R, Jenkinson M, Küker W, Luppe S, Leite
MI, et al. Distinction of seropositive NMO spectrum disorder and MS brain lesion distribution. Neurology 2013;80:1330-1337
12. Jensen-Kondering U, Riedel C, Jansen O. Hyperdense artery sign on computed tomography in acute ischemic stroke. World J Radiol 2010;2:354-357
13. Nakano S, Iseda T, Kawano H, Yoneyama T, Ikeda T, Wakisaka S. Correlation of early CT signs in the deep middle cerebral artery territories with angiographically confirmed site of arterial occlusion. AJNR Am J Neuroradiol 2001;22:654-659
14. Wallace EW. The dural tail sign. Radiology 2004;233:56-5715. Bourekas EC, Wildenhain P, Lewin JS, Tarr RW, Dastur KJ, Raji
MR, et al. The dural tail sign revisited. AJNR Am J Neuroradiol 1995;16:1514-1516
16. Detwiler PW, Henn JS, Porter RW, Lawton MT, White WL, Spetzler RF. Medulloblastoma presenting with tentorial “dural-tail” sign: is the “dural-tail” sign specific for meningioma? Skull Base Surg 1998;8:233-236
17. Campero A, Ajler P, Martins C, Emmerich J, de Alencastro LF, Rhoton A Jr. Usefulness of the contralateral Omega sign for the topographic location of lesions in and around the central sulcus. Surg Neurol Int 2011;2:164
18. Suzuki K, Masawa N, Takatama M. Pathogenesis of état criblé in experimental hypertensive rats. J Stroke Cerebrovasc Dis 2001;10:106-112
19. Guillerman RP. The eye-of-the-tiger sign. Radiology 2000;217:895-896
20. Sabat SB, Deshmukh MP. Hallervorden Spatz disease. J Assoc Physicians India 2006;54:629
21. Han BK, Towbin RB, De Courten-Myers G, McLaurin RL, Ball WS Jr. Reversal sign on CT: effect of anoxic/ischemic cerebral injury in children. AJNR Am J Neuroradiol 1989;10:1191-1198
22. Brown EW, Megerian CA, McKenna MJ, Weber A. Fibrous dysplasia of the temporal bone: imaging findings. AJR Am J Roentgenol 1995;164:679-682
23. Chong VF, Khoo JB, Fan YF. Fibrous dysplasia involving the base of the skull. AJR Am J Roentgenol 2002;178:717-720
24. Benson ML, Oliverio PJ, Yue NC, Zinreich SJ. Primary craniosynostosis: imaging features. AJR Am J Roentgenol 1996;166:697-703
25. Osborn AG. Demyelinating and inflammatory diseases. In: Osborn AG, ed. Osborn’s brain: imaging, pathology, and anatomy, 1st ed. Manitoba: Amirsys, 2013;405-442
26. Soares-Fernandes JP, Ribeiro M, Machado A. “Hot cross bun” sign in variant Creutzfeldt-Jakob disease. AJNR Am J Neuroradiol 2009;30:E37
27. Shrivastava A. The hot cross bun sign. Radiology 2007;245:606-607
28. Huang AH. The hot nose sign. Radiology 2005;235:216-217 29. Munari M, Zucchetta P, Carollo C, Gallo F, De Nardin M,
Marzola MC, et al. Confirmatory tests in the diagnosis of brain death: comparison between SPECT and contrast angiography. Crit Care Med 2005;33:2068-2073

1004
Kizilca et al.
Korean J Radiol 18(6), Nov/Dec 2017 kjronline.org
30. Itolikar SM, Salagre SB, Kalal CR. ‘Hummingbird sign,’ ‘penguin sign,’ and ‘Mickey mouse sign’ in progressive supranuclear palsy. J Assoc Physicians India 2012;60:52
31. Sonthalia N, Ray S. The hummingbird sign: a diagnostic clue for Steele-Richardson-Olszweski syndrome. BMJ Case Rep 2012;2012:bcr2012006263
32. Chavhan GB, Shroff MM. Twenty classic signs in neuroradiology: a pictorial essay. Indian J Radiol Imaging 2009;19:135-145
33. Meriot P, Veillon F, Garcia JF, Nonent M, Jezequel J, Bourjat P, et al. CT appearances of ossicular injuries. Radiographics 1997;17:1445-1454
34. Yoon HK, Shin HJ, Chang YW. “Ivy sign” in childhood moyamoya disease: depiction on FLAIR and contrast-enhanced T1-weighted MR images. Radiology 2002;223:384-389
35. Maeda M, Tsuchida C. “Ivy sign” on fluid-attenuated inversion-recovery images in childhood moyamoya disease. AJNR Am J Neuroradiol 1999;20:1836-1838
36. Thomas M. The lemon sign. Radiology 2003;228:206-20737. McGraw P. The molar tooth sign. Radiology 2003;229:671-67238. Pugash D, Oh T, Godwin K, Robinson AJ, Byrne A, Van Allen
MI, et al. Sonographic ‘molar tooth’ sign in the diagnosis of Joubert syndrome. Ultrasound Obstet Gynecol 2011;38:598-602
39. Pisaneschi M, Kapoor G. Imaging the sella and parasellar region. Neuroimaging Clin N Am 2005;15:203-219
40. Hardy TA, Miller DH. Baló’s concentric sclerosis. Lancet Neurol 2014;13:740-746
41. Pohl D, Rostasy K, Krone B, Hanefeld F. Baló’s concentric sclerosis associated with primary human herpesvirus 6 infection. J Neurol Neurosurg Psychiatry 2005;76:1723-1725
42. Hegde AN, Mohan S, Lim CC. CNS cavernous haemangioma: “popcorn” in the brain and spinal cord. Clin Radiol 2012;67:380-388
43. Hegde A, Mohan S, Tan KK, Lim CC. Spinal cavernous malformations: magnetic resonance imaging and associated findings. Singapore Med J 2012;53:582-586
44. Ortiz-Neira CL. The puff of smoke sign. Radiology 2008;247:910-911
45. Burke GM, Burke AM, Sherma AK, Hurley MC, Batjer HH,
Bendok BR. Moyamoya disease: a summary. Neurosurg Focus 2009;26:E11
46. Molloy S, O’Laoide R, Brett F, Farrell M. The “pulvinar” sign in variant Creutzfeldt-Jakob disease. AJR Am J Roentgenol 2000;175:555-556
47. Burlina AP, Manara R, Caillaud C, Laissy JP, Severino M, Klein I, et al. The pulvinar sign: frequency and clinical correlations in Fabry disease. J Neurol 2008;255:738-744
48. Krasnianski A, Schulz-Schaeffer WJ, Kallenberg K, Meissner B, Collie DA, Roeber S, et al. Clinical findings and diagnostic tests in the MV2 subtype of sporadic CJD. Brain 2006;129(Pt 9):2288-2296
49. Roche CJ, O’Keeffe DP, Lee WK, Duddalwar VA, Torreggiani WC, Curtis JM. Selections from the buffet of food signs in radiology. Radiographics 2002;22:1369-1384
50. Greenberg J, Cohen WA, Cooper PR. The “hyperacute” extraaxial intracranial hematoma: computed tomographic findings and clinical significance. Neurosurgery 1985;17:48-56
51. Al-Nakshabandi NA. The swirl sign. Radiology 2001;218:43352. Nair P, Pal L, Jaiswal AK, Behari S. Lhermitte-Duclos disease
associated with dysembryoplastic neuroepithelial tumor differentiation with characteristic magnetic resonance appearance of “tiger striping.” World Neurosurg 2011;75:699-703
53. Moenninghoff C, Kraff O, Schlamann M, Ladd ME, Katsarava Z, Gizewski ER. Assessing a dysplastic cerebellar gangliocytoma (Lhermitte-Duclos disease) with 7T MR imaging. Korean J Radiol 2010;11:244-248
54. Douglas-Akinwande AC, Payner TD, Hattab EM. Medulloblastoma mimicking Lhermitte-Duclos disease on MRI and CT. Clin Neurol Neurosurg 2009;111:536-539
55. Cheon JE, Kim IO, Hwang YS, Kim KJ, Wang KC, Cho BK, et al. Leukodystrophy in children: a pictorial review of MR imaging features. Radiographics 2002;22:461-476
56. Onur MR, Senol U, Mihçi E, Lüleci E. Tigroid pattern on magnetic resonance imaging in Lowe syndrome. J Clin Neurosci 2009;16:112-114
57. Gonçalves FG, Barra FR, Matos VL, Jovem CL, Amaral LLF, del Carpio-O’Donovan R. Signs in neuroradiology: part 1. Radiol Bras 2011;44:123-128