Embed Size (px)
Citation preview

SILENCING THE NOISE: NEW TECHNOLOGY TO OBTAIN TIME-
INTEGRATED AVERAGE GROUNDWATER CONCENTRATION OVER MONTHS
Thomas McHugh, Charles Newell, Lisa Molofsky, Julia Small, Kaitlin MoranGSI ENVIRONMENTAL
Harry O’NeillBEACON ENVIRONMENTAL
GC
3
EMDQ Workshop, Phoenix, AZ, April 2017

HOW DO WE CURRENTLY MONITOR CONTAMINATED
GROUNDWATER?
INTRODUCTION
2 2

How do we collect groundwater samples?
• Use pump (or other device) to collect water sample from well• Time consuming• Purge waste
• Send water sample to laboratory for analysis• Requires cooler with ice• Heavy, expensive, time
sensitive
INTRODUCTION
3 3

Ln
(Co
ncen
trati
on
)
Time
MW-1
Clean-up Goal
Decreasing
concentrations?
What do we get: Noisy Data
INTRODUCTION
4 4

▪ Sample collection is expensive and time consuming
▪ Significant event-to-event variability in monitoring results (i.e. data is noisy)▪ Grab samples are problematic
Problems with current monitoring methods?
INTRODUCTION
5 5

CAN WE DEVELOP A SAMPLER THAT IS EASIER TO USE AND PROVIDES
BETTER DATA?
1) Ease of use
2) Lower cost
3) Minimize data variability
Goals?
INTRODUCTION
6
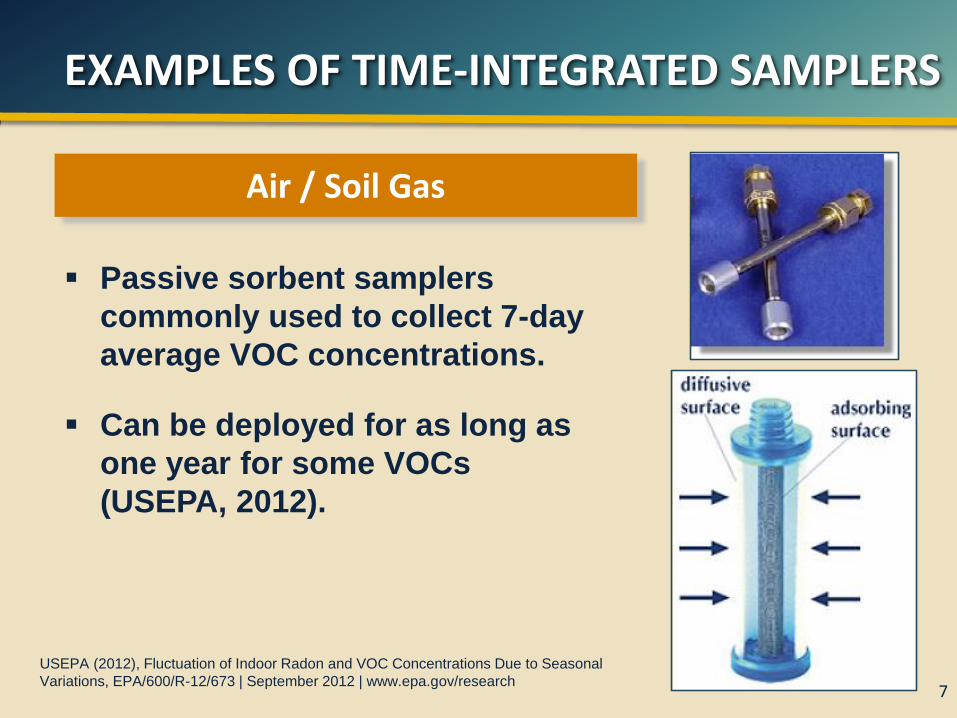
EXAMPLES OF TIME-INTEGRATED SAMPLERS
Air / Soil Gas
USEPA (2012), Fluctuation of Indoor Radon and VOC Concentrations Due to Seasonal
Variations, EPA/600/R-12/673 | September 2012 | www.epa.gov/research
▪ Passive sorbent samplers
commonly used to collect 7-day
average VOC concentrations.
▪ Can be deployed for as long as
one year for some VOCs
(USEPA, 2012).
7 7

Sediment
▪ Sorbent samplers increasingly used for integrated sampling of sediments.
▪ Example: POCIS – Polar Organics Contaminant Integrated Sampler (Developed by USGS).
EXAMPLES OF TIME-INTEGRATED SAMPLERS
8

WHAT ALTERNATIVES TO GRAB
SAMPLES ARE CURRENTLY USED
FOR GROUNDWATER?
INTRODUCTION
9 9

Passive Diffusion Bag
PassiveVaporDiffusion
GC
3
Passive Diffusion
Sampler
Church, P.E., D.A. Vroblesky, F.P. Lyford, and R.E. Willey. 2002. Guidance on the use of passive-vapor-diffusion samplers to detect volatile organic
compounds in ground water-discharge areas, and example applications in New England. USGS Water- Resources Investigations Report 02-4186.
Reston, Virginia: USGS.
David T. Adamson, Thomas E. McHugh, Michal W. Rysz, Roberto Landazuri, and Charles J. Newell, Field Investigation of Vapor-Phase-Based
Groundwater Monitoring, Ground Water Monitoring & Remediation 32, no. 1/ Winter 2012/pages 59–72
KEY POINT: 14-day equilibration time. Not a grab sample but not a true time-integrated sample.
■ Equilibration between well and air inside diffusion bag (Adamson, 2012)
■ Equilibration between well and water inside diffusion bag (Church, 2002)
DIFFUSION SAMPLERS FOR GROUNDWATER
1010

Gore Sorber
■ Measures contaminant flux through well (additional measurement needed to estimate concentration)
■ Potential for biofouling of sorbent limits deployment time to a maximum of 28 days.
■ High uptake rate limits deployment time to hours
Enviroflux
KEY POINT: Existing sorbent samplers have limitations that prevent long-term deployment (weeks to months).
SORBENT SAMPLERS FOR GROUNDWATER
11

TIME-INTEGRATED SAMPLERLET’S COMBINE A PASSIVE
SORBENT SAMPLER WITH AN EQUILIBRIUM SAMPLERS TO
GET THE BEST OF BOTH WORLDS
INTRODUCTION
1212

1) Protective outer mesh▪ Same mesh used to protect PDB
2) Outer diffusion membrane▪ Same material as PDB▪ Inner chamber is filled
with air instead of water
1313
3) Sorbent tube▪ Adsorbs VOCs from inner
chamber
TIGER SAMPLER: DESIGN
PDB = Passive Diffusion Bag; VOCs = Volatile organic compounds.

■ Outer membrane allows rapid equilibration between groundwater sampler chamber
■ Low uptake rate kinetic sampler does not disrupt equilibrium and allows long deployment times
How it Works
Problems Solved:
Biofouling: Sorbent is protected from groundwater
Saturation: Uptake rate can be set to allow for long deployment times without saturation of sorbent
Protective mesh
Diffusion membrane (around an open glass vial)
Sorbent tube
14
TIGER SAMPLER: THEORY

DOES THE SAMPLER WORK?(IN THE LABORATORY)
15
LABORATORY VALIDATION

1) Construct test tank with contaminated water▪ Tetrachloroethene (PCE)
2) Deploy samplers (duplicate pairs)▪ 2 days, 4 days, 8 days
3) Measure PCE▪ PCE concentration in water▪ PCE mass on samplers
SAMPLER
16
Validation Program
LABORATORY VALIDATION

17
Experiment 1
• Its HARD to get PCE to dissolve in water
Experiment 2
• Its REALLY HARD to get PCE to dissolve in water
LABORATORY FAILURES

18
Experiment 3
• High uptake kinetic sampler (0.5 mL/min)
Experiment 4
• Low uptake kinetic sampler (0.001 mL/min)
LABORATORY SUCCESSES

19
PCE IN TANK WATER
Time (Days)
PC
E C
on
c. (
µg
/L)
It’s not easy to keep PCE in water!
EXPERIMENT 3: HIGH UPTAKE SAMPLER

20
PC
E M
ass
(ng)
Total Sample Time
PCE MASS ON HIGH UPTAKE SAMPLERS (0.5 ML/MIN)
KEYPOINT:
Good agreement between dups. >> Sampler results are reproducible.
Measured PCE Dup 1
Measured PCE Dup 2
EXPERIMENT 3: HIGH UPTAKE SAMPLER

21
PC
E M
ass
(ng)
TOTAL SAMPLE TIME
PCE MASS ON HIGH UPTAKE SAMPLERS (0.5 ML/MIN)
KEYPOINT:
Can accurately predict PCE on sorbent tube based on measured PCE in water (after model calibration).
Predicted PCE based on PCE concentration measured in water
Measured PCE Dup 1
Measured PCE Dup 2
LABORATORY VALIDATION: EXPERIMENT 3

22
PCE IN TANK WATER
TIME (DAYS)
PC
E C
on
c. (
ug
/L)
PCE concentration in water is similar to Experiment 3
EXPERIMENT 4: LOW UPTAKE SAMPLER

23
PC
E M
ass
(ng)
TOTAL SAMPLE TIME
PCE MASS ON LOW UPTAKE SAMPLERS (0.001 ML/MIN)
KEYPOINT:
GREAT agreement between dups
Much lower PCE mass on samplers (due to lower uptake rate)
Measured PCE Dup 1
Measured PCE Dup 2
EXPERIMENT 4: LOW UPTAKE SAMPLER

24
PC
E M
ass
(ng)
TOTAL SAMPLE TIME
KEYPOINT:
Can accurately predict PCE on sorbent tube based on measured PCE in water.>> Used model calibration from Experiment #3!!
Measured PCE Dup 1
Measured PCE Dup 2
PCE MASS ON LOW UPTAKE SAMPLERS (0.001 ML/MIN)
Predicted PCE based on PCE concentration measured in water
LABORATORY VALIDATION: EXPERIMENT 4

DOES THE SAMPLER WORK?(IN THE FIELD)
25
FIELD VALIDATION

1) Four wells – chlorinated VOCs
2) Deploy samplers (duplicate pairs)▪ 2 weeks, 1 month▪ 2 months, 3 months
3) Compare sampler results to conventional low-flow purge samplers
SAMPLER
Validation Program
26
FIELD VALIDATION

27
FIELD VALIDATION

2828
KEYPOINT:
Correlation between TIGER and low-flow sample is similar to that observed between any paired purge and no-purge sample methods.
FIELD VALIDATION

Collecting a Sample
1) Remove from package and place in well screen interval
2) Wait 3 months
3) Remove from well and place kinetic sampler in package
4) Send to lab (in a box, no ice)
Advantages: - Reduced sampler deployment time- No purge waste- Ship at ambient temperature (no cooler, no ice)
29
TIGER SAMPLER: HOW TO USE
1
3
2
4

▪ Less data variability▪ Less confusion▪ More accurate
clean-up time estimates
30
TIGER SAMPLER: WHY?
Advantage of time-integrated data
Ln
(Co
ncen
trati
on
)
Time
MW-1
Clean-up Goal
Grab sample
90-day sample
30

LAB VALIDATION
FIELD VALIDATION
COMMERCIALIZATION
PATENT APPLICATION
DEVELOPMENT PROCESS
2017
On-going
31
Development Process
31
TIME INTEGRATED SAMPLER FOR GW?

Thomas McHugh, Charles Newell, Lisa Molofsky, Julia Small, Kaitlin Moran email: [email protected] ENVIRONMENTAL
Harry O’Neill email: [email protected] ENVIRONMENTAL
ACKNOWLEDGEMENTS Laboratory Validation Study:Ciara Simmons-Pino, Rice UniversityCaroline Li, Rice UniversityRob Griffin, Rice UniversityBen Medina, GSI EnvironmentalJohn Connor, GSI Environmental
Field Validation Study:James Anderson, Rebekah Westrup, Mark Lach, Adriana Handszer, Roberto Sosa (All w/ Cardeno)