Embed Size (px)
DESCRIPTION
Silent Do Now (5 minutes) *Take out your homework and your weekly sheet!. What does the word CONFIDENCE mean? If I asked you to pick a number, can I be more confident that your number is between 1 and 50 or between 1 and 10? - PowerPoint PPT Presentation
Citation preview
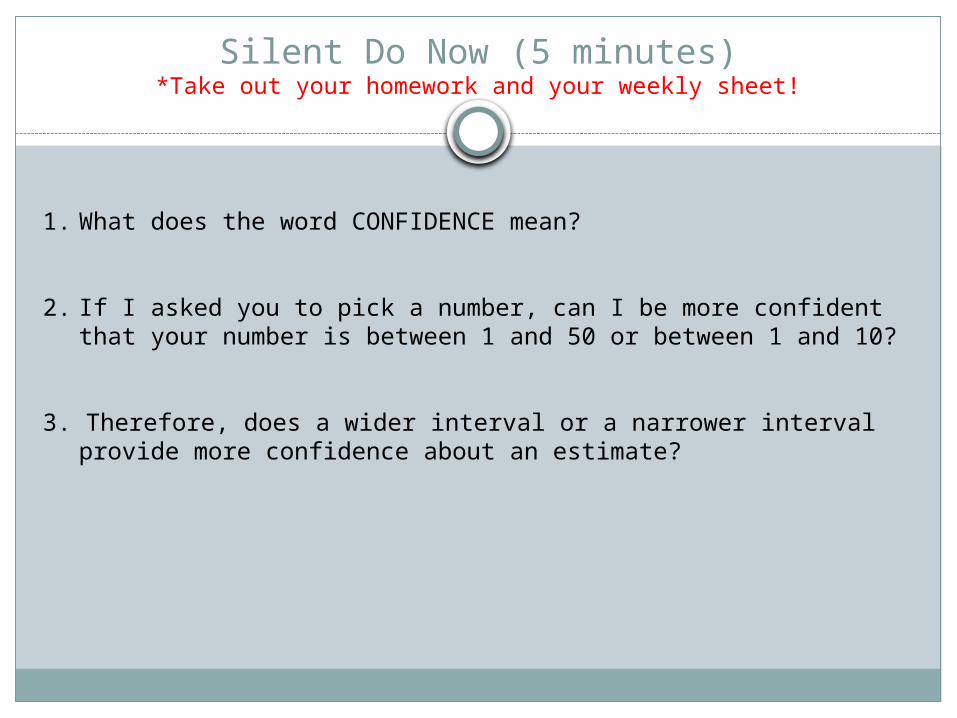
Silent Do Now (5 minutes)*Take out your homework and your weekly sheet!
1. What does the word CONFIDENCE mean?
2. If I asked you to pick a number, can I be more confident that your number is between 1 and 50 or between 1 and 10?
3. Therefore, does a wider interval or a narrower interval provide more confidence about an estimate?

Agenda
Review Do Now/HomeworkUnit 5 AssessmentHomework: Baron’s Book
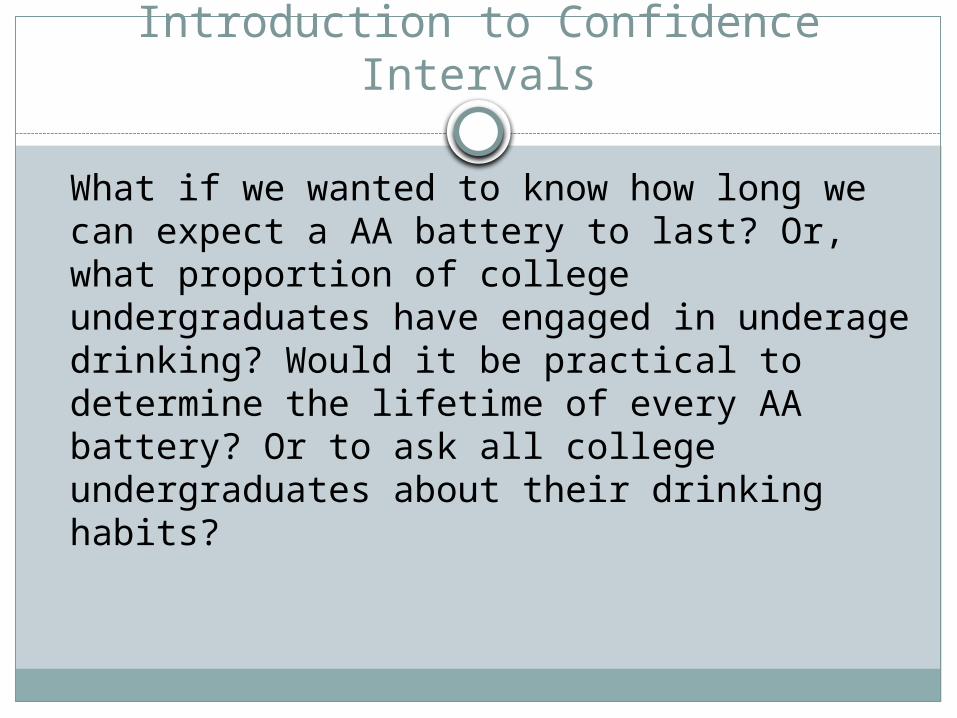
Introduction to Confidence Intervals
What if we wanted to know how long we can expect a AA battery to last? Or, what proportion of college undergraduates have engaged in underage drinking? Would it be practical to determine the lifetime of every AA battery? Or to ask all college undergraduates about their drinking habits?
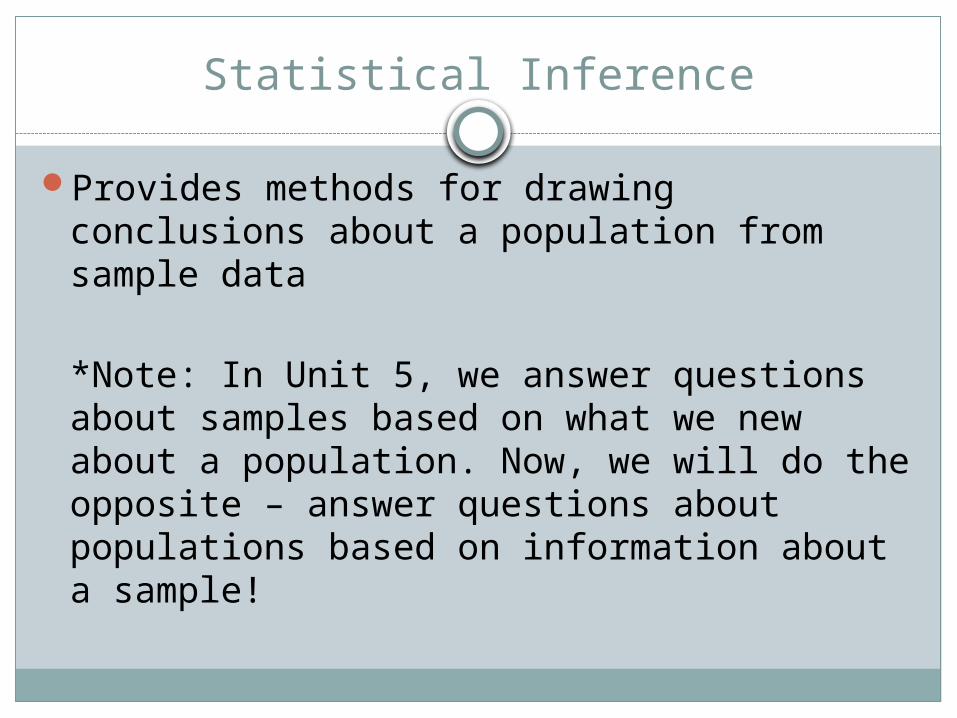
Statistical Inference
Provides methods for drawing conclusions about a population from sample data
*Note: In Unit 5, we answer questions about samples based on what we new about a population. Now, we will do the opposite – answer questions about populations based on information about a sample!

The Two Most Common Types of Formal Statistical Inference
1. SIGNIFICANCE TESTS, which assess the evidence for a claim about a population.
2. CONFIDENCE INTERVAL estimating the value of a population parameter.
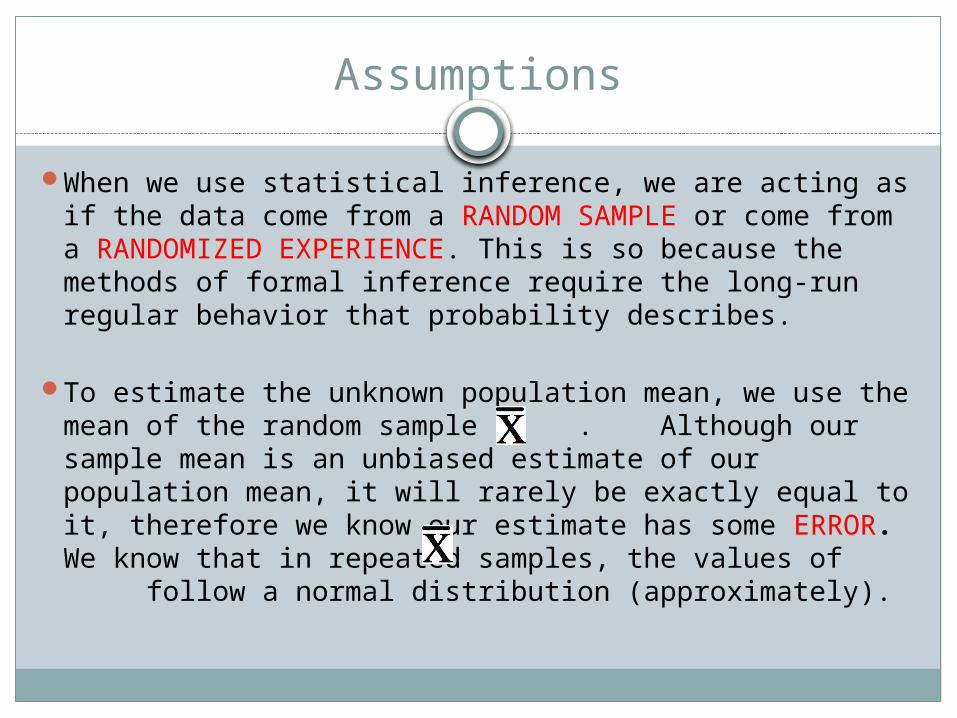
Assumptions
When we use statistical inference, we are acting as if the data come from a RANDOM SAMPLE or come from a RANDOMIZED EXPERIENCE. This is so because the methods of formal inference require the long-run regular behavior that probability describes.
To estimate the unknown population mean, we use the mean of the random sample . Although our sample mean is an unbiased estimate of our population mean, it will rarely be exactly equal to it, therefore we know our estimate has some ERROR. We know that in repeated samples, the values of follow a normal distribution (approximately).
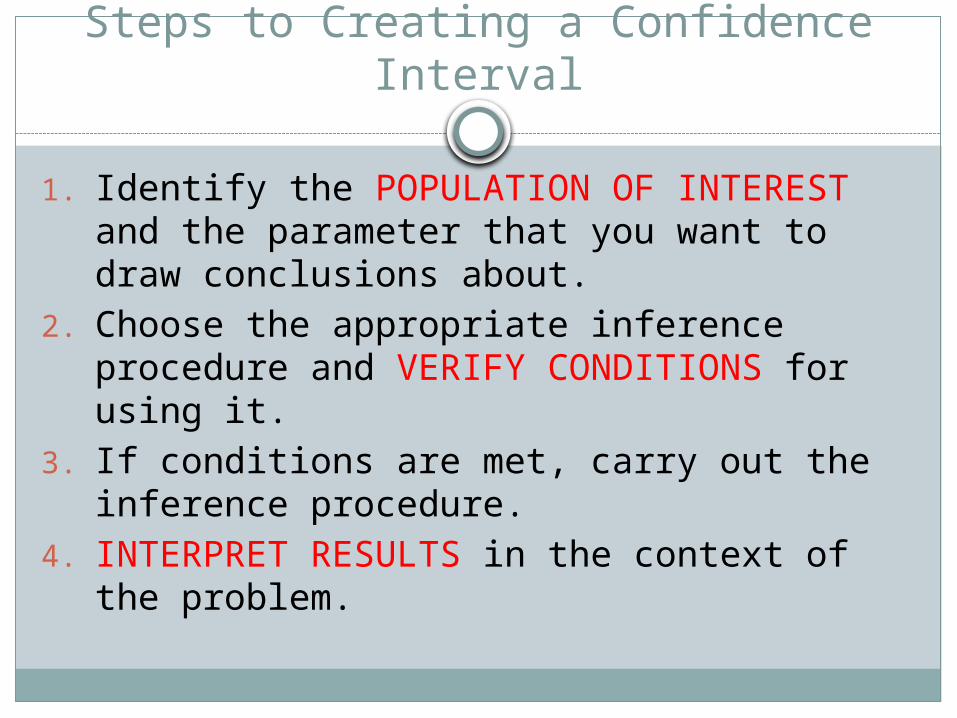
Steps to Creating a Confidence Interval
1. Identify the POPULATION OF INTEREST and the parameter that you want to draw conclusions about.
2. Choose the appropriate inference procedure and VERIFY CONDITIONS for using it.
3. If conditions are met, carry out the inference procedure.
4. INTERPRET RESULTS in the context of the problem.
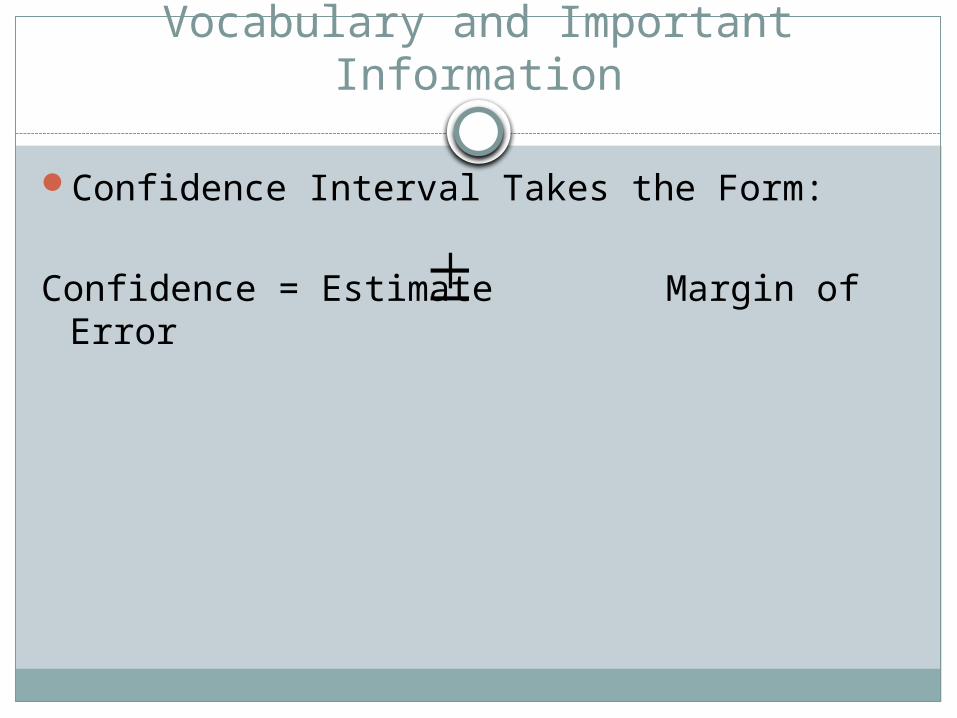
Vocabulary and Important Information
Confidence Interval Takes the Form:
Confidence = Estimate Margin of Error
€
±
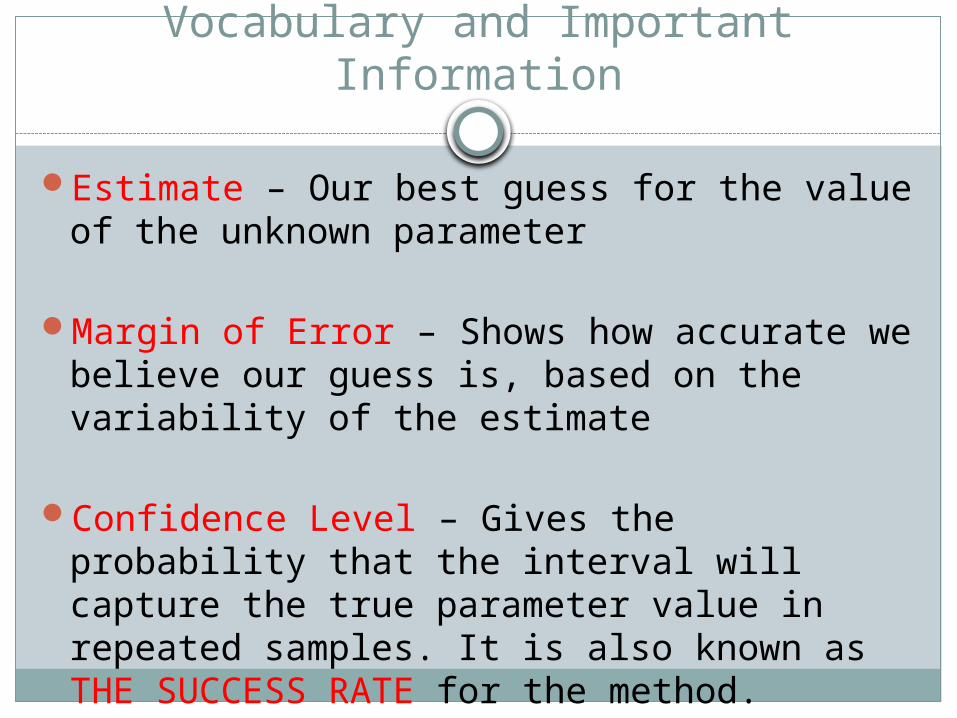
Vocabulary and Important Information
Estimate – Our best guess for the value of the unknown parameter
Margin of Error – Shows how accurate we believe our guess is, based on the variability of the estimate
Confidence Level – Gives the probability that the interval will capture the true parameter value in repeated samples. It is also known as THE SUCCESS RATE for the method.
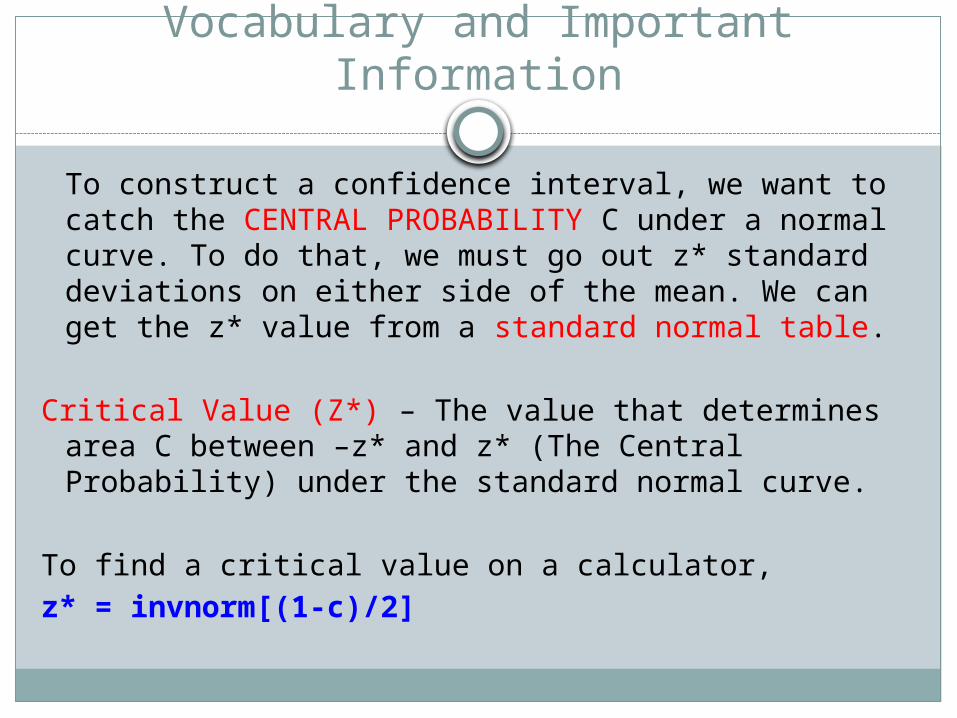
Vocabulary and Important Information
To construct a confidence interval, we want to catch the CENTRAL PROBABILITY C under a normal curve. To do that, we must go out z* standard deviations on either side of the mean. We can get the z* value from a standard normal table.
Critical Value (Z*) – The value that determines area C between –z* and z* (The Central Probability) under the standard normal curve.
To find a critical value on a calculator, z* = invnorm[(1-c)/2]
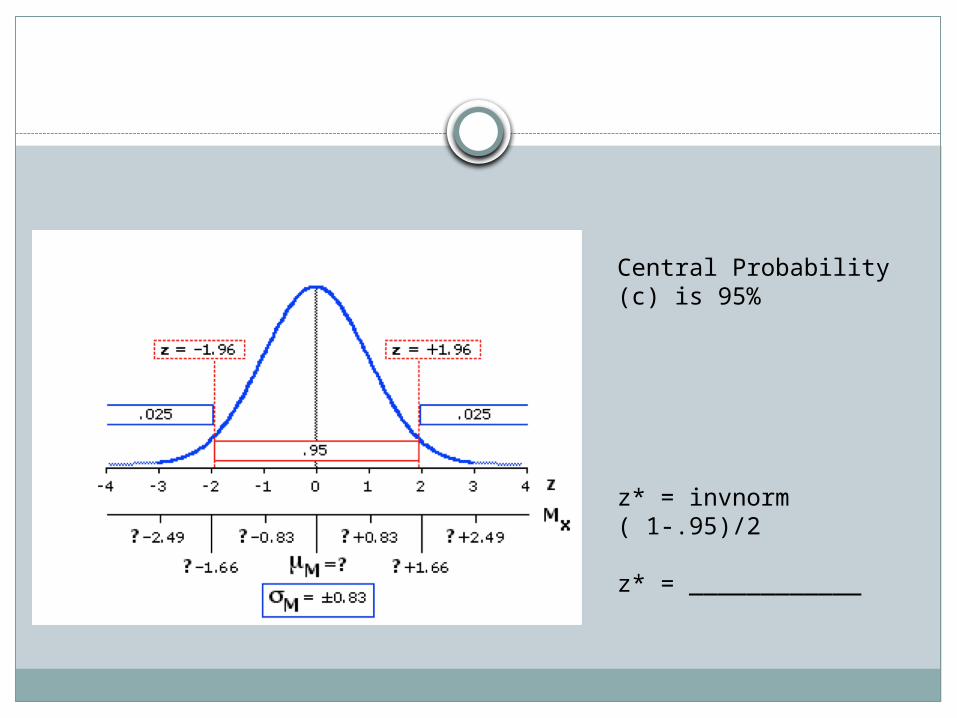
Central Probability (c) is 95%
z* = invnorm ( 1-.95)/2
z* = ____________
Example 1: Find the critical value (z*) for a confidence level of 90% 95% and 99%
Quick Check!
1. Use the table of standard normal probabilities to find z* for confidence interval 97.5%
2. Now find z* for confidence level 94%
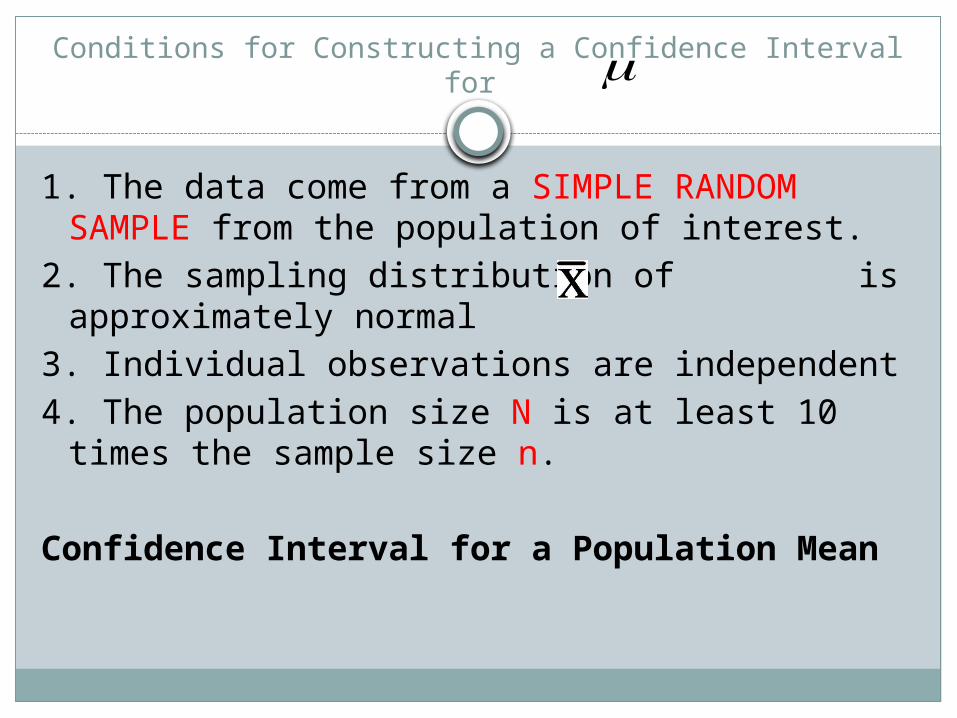
Conditions for Constructing a Confidence Interval for
1. The data come from a SIMPLE RANDOM SAMPLE from the population of interest.
2. The sampling distribution of is approximately normal
3. Individual observations are independent 4. The population size N is at least 10 times the
sample size n.
Confidence Interval for a Population Mean
€
μ
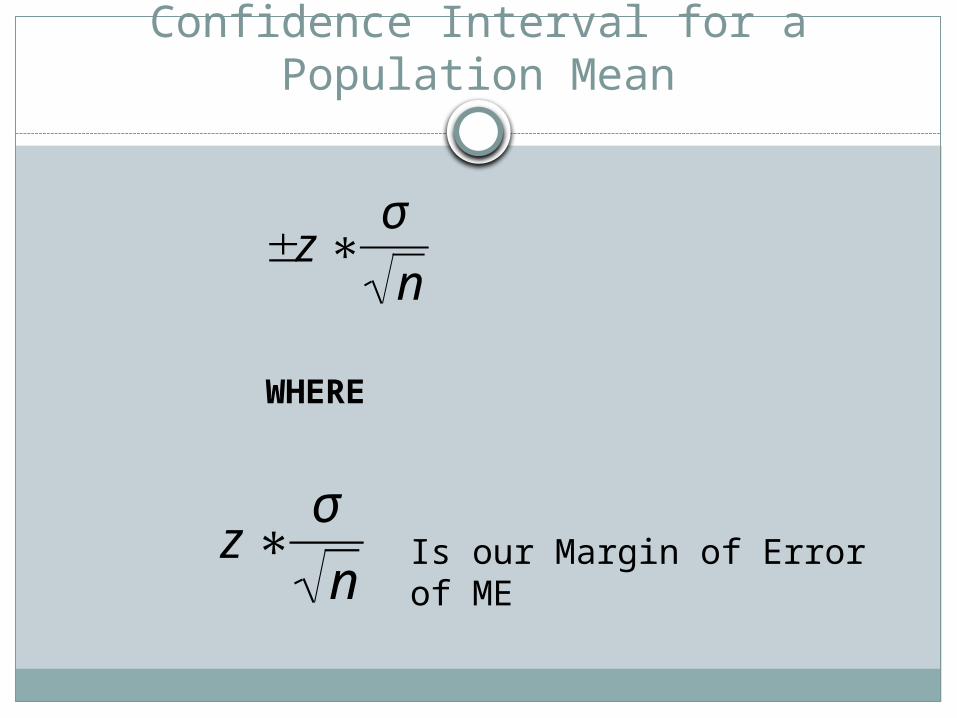
Confidence Interval for a Population Mean
WHERE
€
z ∗σ
n
€
±z ∗σ
n
Is our Margin of Error of ME
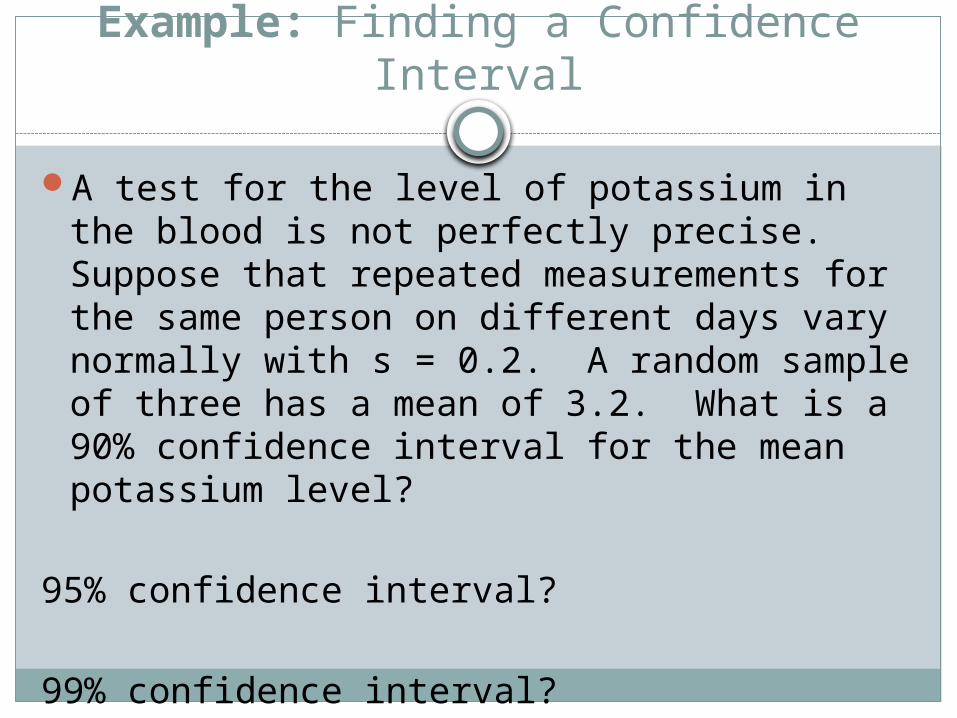
Example: Finding a Confidence Interval
A test for the level of potassium in the blood is not perfectly precise. Suppose that repeated measurements for the same person on different days vary normally with s = 0.2. A random sample of three has a mean of 3.2. What is a 90% confidence interval for the mean potassium level?
95% confidence interval?
99% confidence interval?
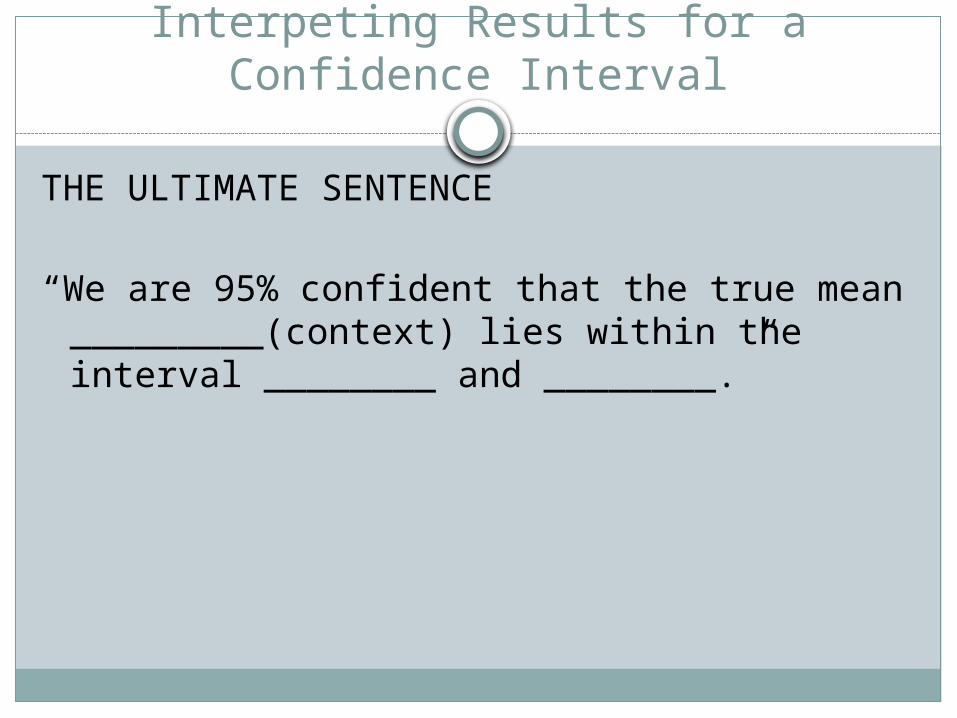
Interpeting Results for a Confidence Interval
THE ULTIMATE SENTENCE
“We are 95% confident that the true mean _________(context) lies within the interval ________ and ________.”
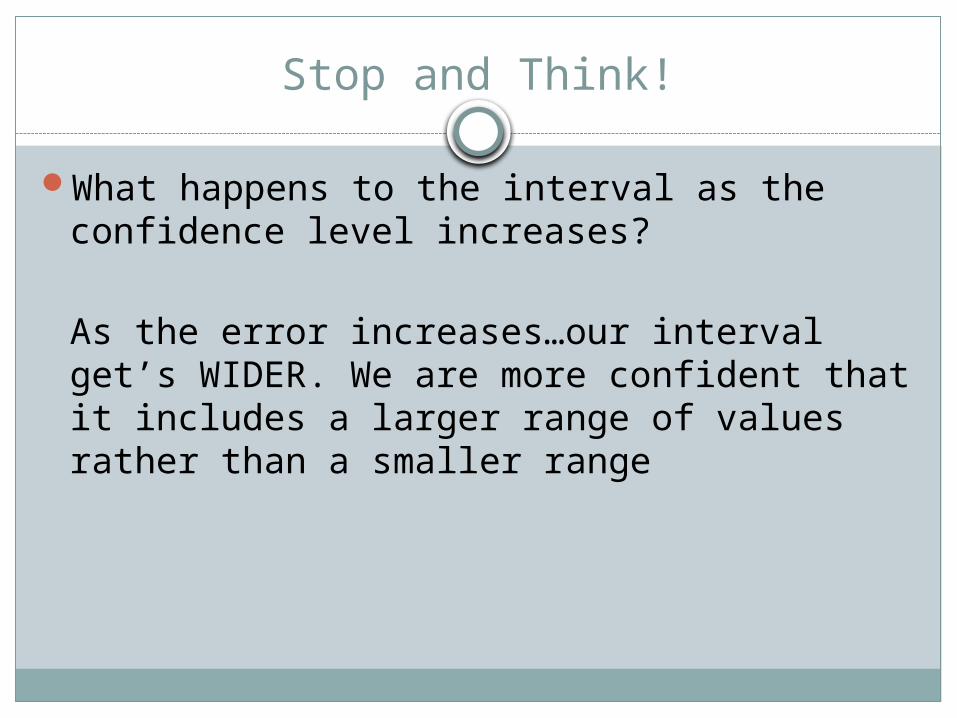
Stop and Think!
What happens to the interval as the confidence level increases?
As the error increases…our interval get’s WIDER. We are more confident that it includes a larger range of values rather than a smaller range

Guided Practice
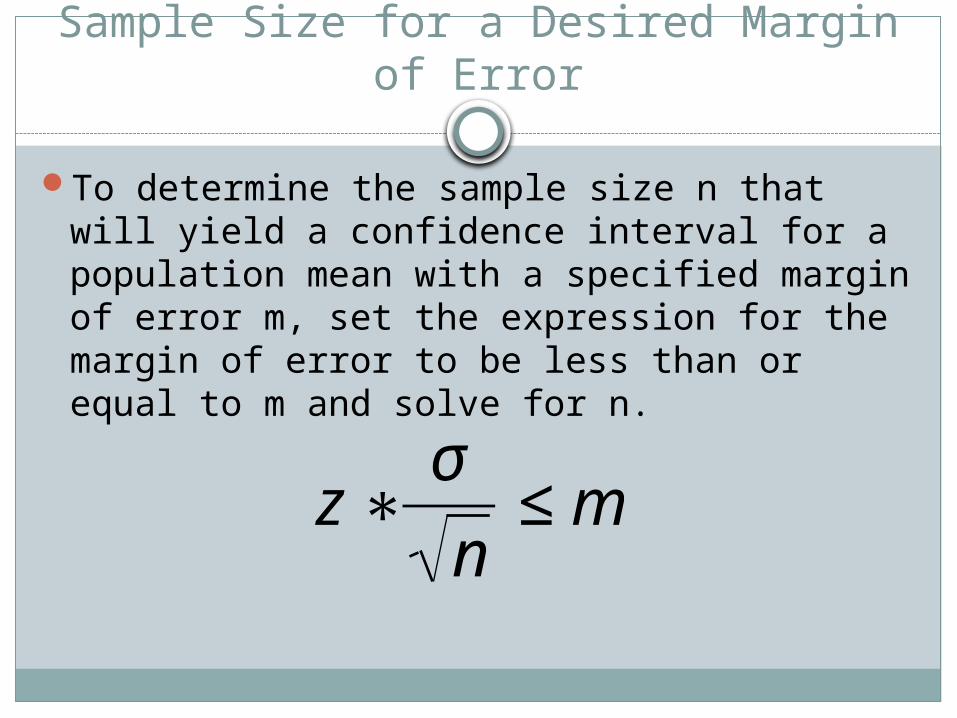
Sample Size for a Desired Margin of Error
To determine the sample size n that will yield a confidence interval for a population mean with a specified margin of error m, set the expression for the margin of error to be less than or equal to m and solve for n.
€
z ∗σ
n≤ m
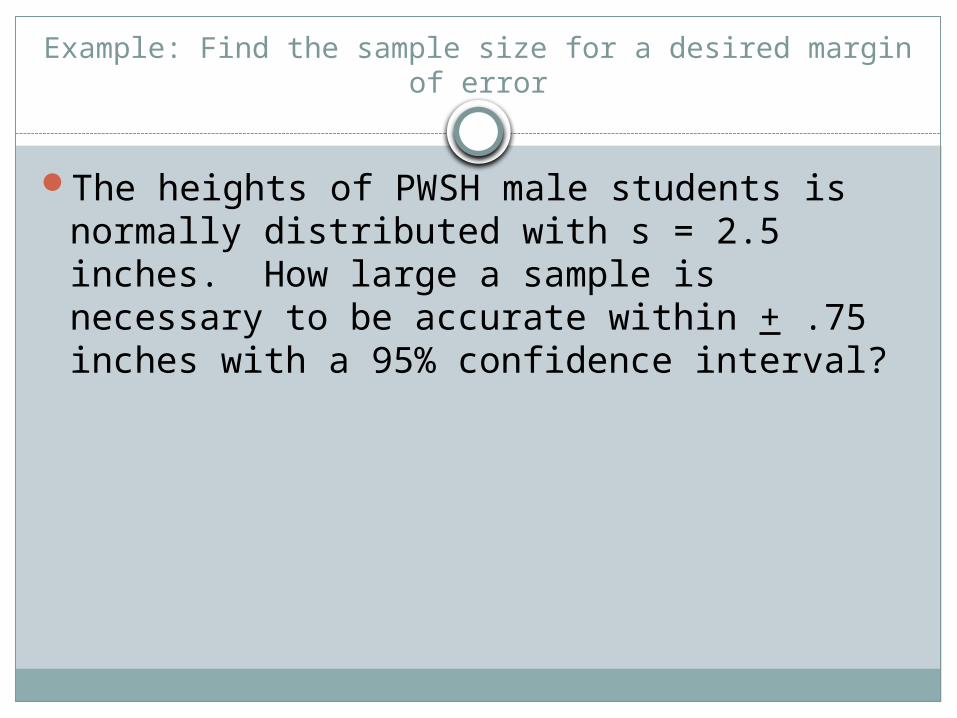
Example: Find the sample size for a desired margin of error
The heights of PWSH male students is normally distributed with s = 2.5 inches. How large a sample is necessary to be accurate within + .75 inches with a 95% confidence interval?

Guided Practice
Independent Practice/HW
Listed in notes!