Embed Size (px)
Citation preview
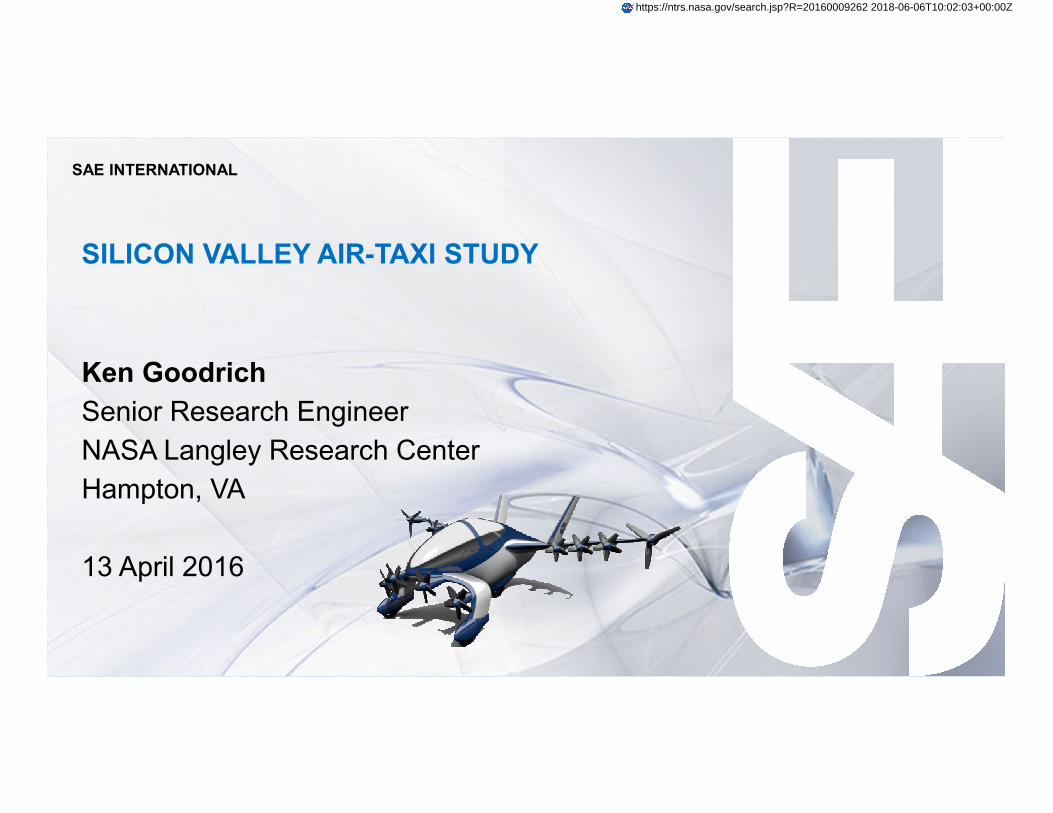
SILICON VALLEY AIR-TAXI STUDY
Ken Goodrich
Senior Research Engineer
NASA Langley Research Center
Hampton, VA
13 April 2016
SAE INTERNATIONAL
https://ntrs.nasa.gov/search.jsp?R=20160009262 2018-06-06T10:02:03+00:00Z

INITIAL BENEFIT & FEASIBILITY ASSESSMENT OF ON-
DEMAND, URBAN MOBILITY USING 3 DIMENSIONS
OUTLINE
� My background, briefly
� Silicon Valley air-taxi commuter study
� Why now
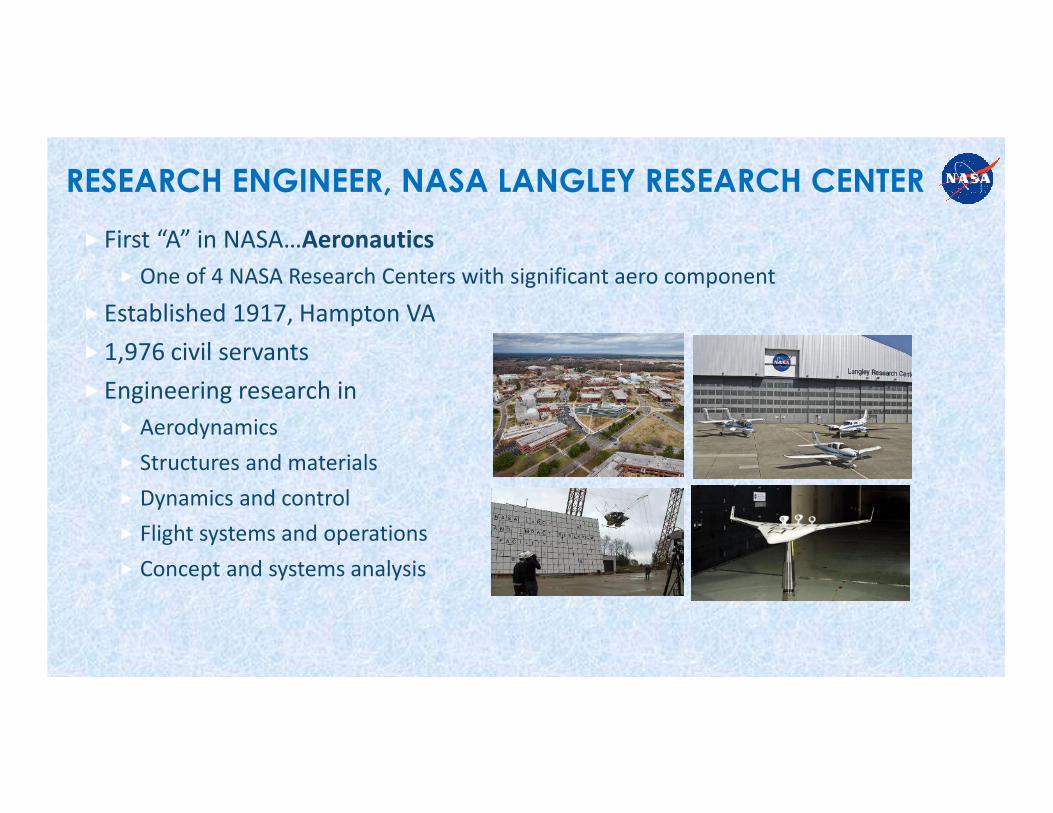
RESEARCH ENGINEER, NASA LANGLEY RESEARCH CENTER
�First “A” in NASA…Aeronautics
� One of 4 NASA Research Centers with significant aero component
�Established 1917, Hampton VA
�1,976 civil servants
�Engineering research in
� Aerodynamics
� Structures and materials
� Dynamics and control
� Flight systems and operations
� Concept and systems analysis
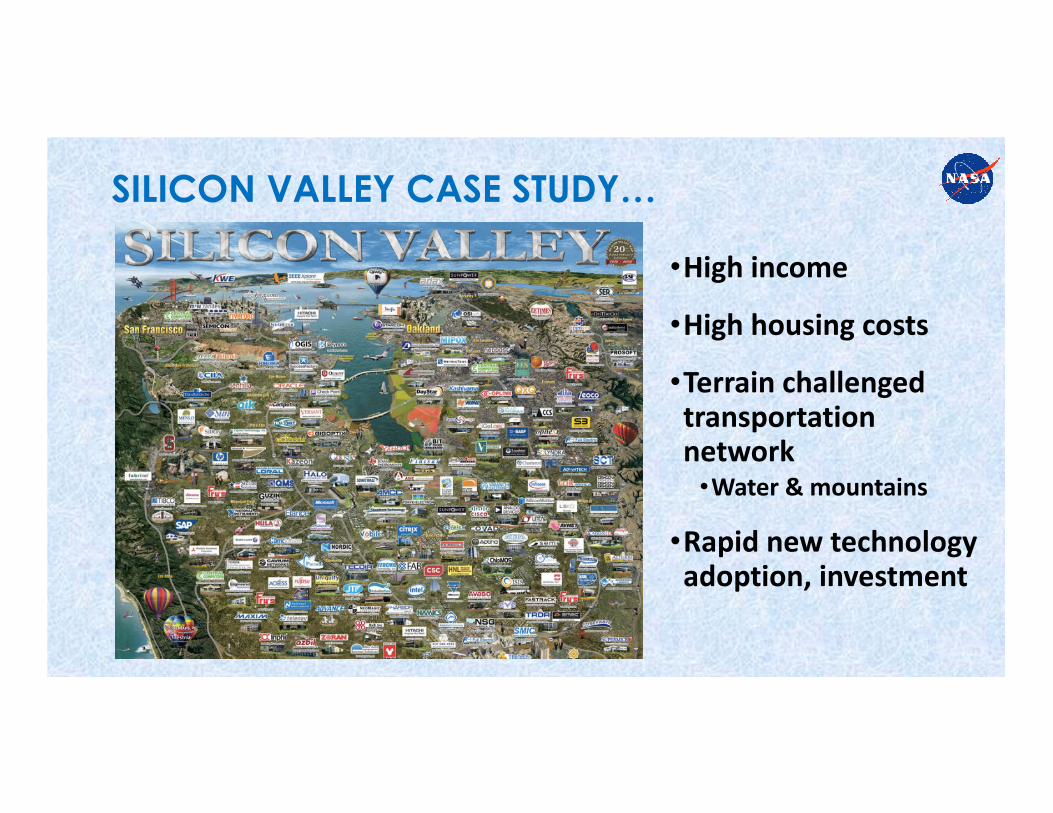
SILICON VALLEY CASE STUDY…
•High income
•High housing costs
•Terrain challenged transportation network•Water & mountains
•Rapid new technology adoption, investment
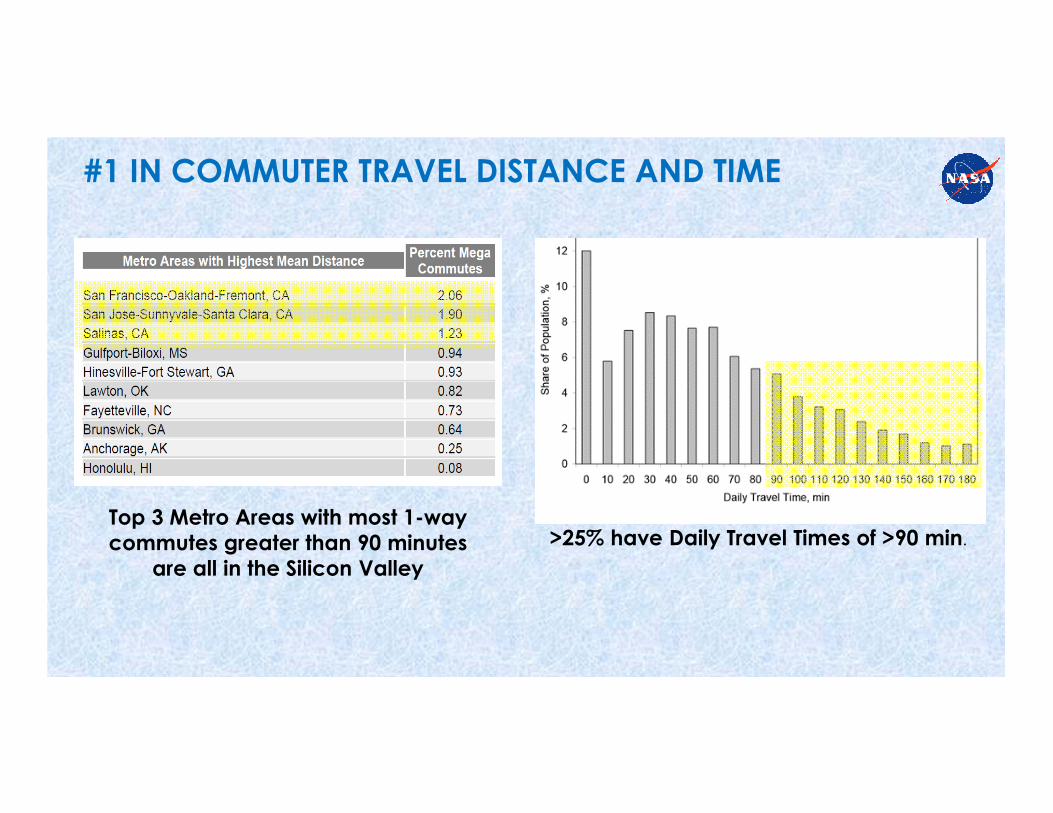
#1 IN COMMUTER TRAVEL DISTANCE AND TIME
Top 3 Metro Areas with most 1-way
commutes greater than 90 minutes
are all in the Silicon Valley
>25% have Daily Travel Times of >90 min.
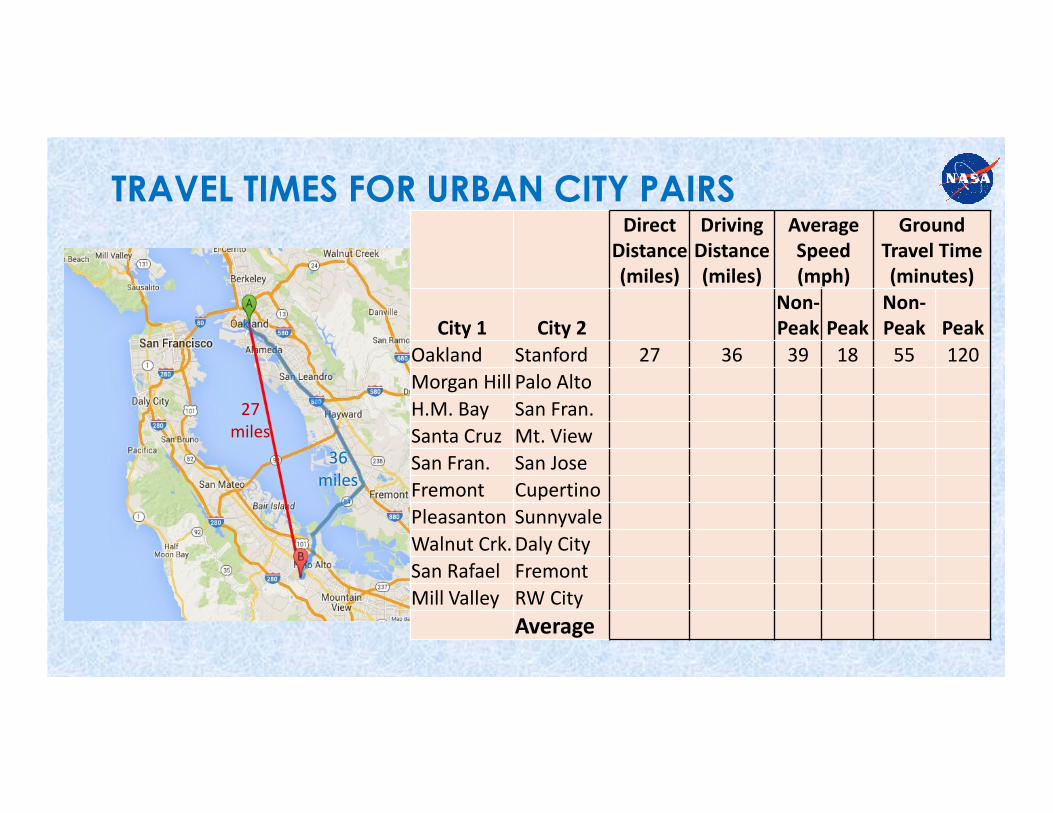
TRAVEL TIMES FOR URBAN CITY PAIRS
27
miles
36
miles
Direct
Distance
(miles)
Driving
Distance
(miles)
Average
Speed
(mph)
Ground
Travel Time
(minutes)
City 1 City 2
Non-
Peak Peak
Non-
Peak Peak
Oakland Stanford 27 36 39 18 55 120
Morgan Hill Palo Alto
H.M. Bay San Fran.
Santa Cruz Mt. View
San Fran. San Jose
Fremont Cupertino
Pleasanton Sunnyvale
Walnut Crk. Daly City
San Rafael Fremont
Mill Valley RW City
Average
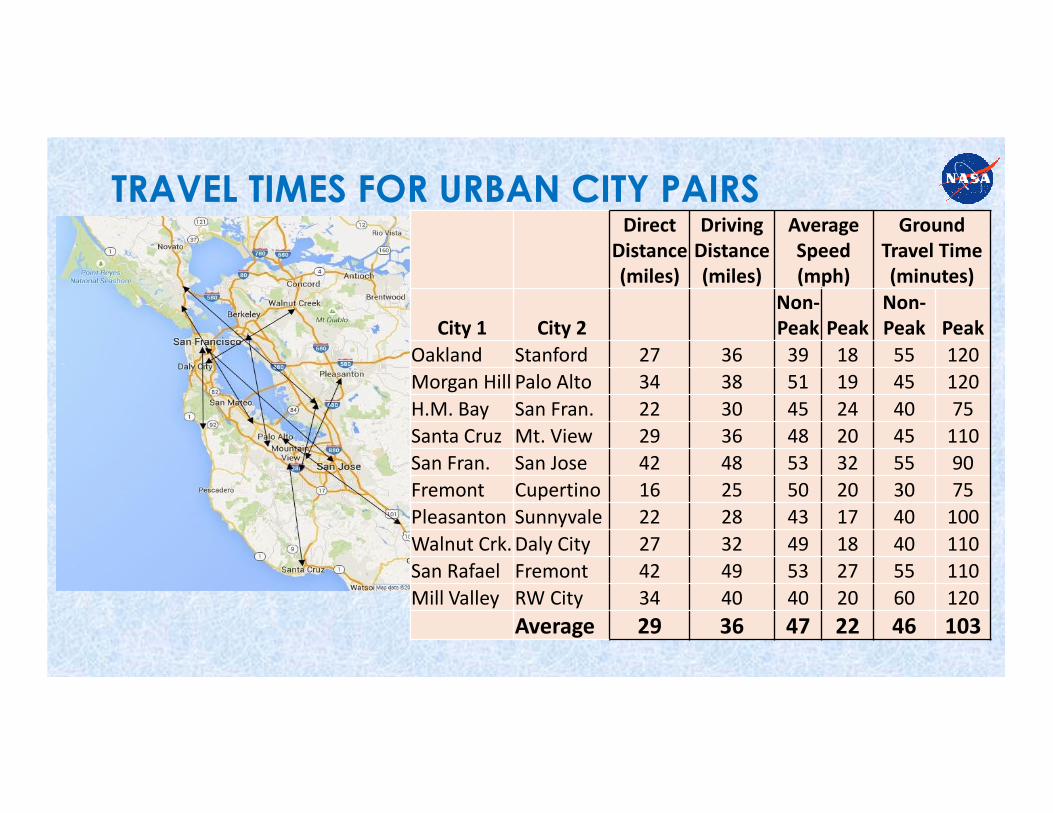
TRAVEL TIMES FOR URBAN CITY PAIRSDirect
Distance
(miles)
Driving
Distance
(miles)
Average
Speed
(mph)
Ground
Travel Time
(minutes)
City 1 City 2
Non-
Peak Peak
Non-
Peak Peak
Oakland Stanford 27 36 39 18 55 120
Morgan Hill Palo Alto 34 38 51 19 45 120
H.M. Bay San Fran. 22 30 45 24 40 75
Santa Cruz Mt. View 29 36 48 20 45 110
San Fran. San Jose 42 48 53 32 55 90
Fremont Cupertino 16 25 50 20 30 75
Pleasanton Sunnyvale 22 28 43 17 40 100
Walnut Crk. Daly City 27 32 49 18 40 110
San Rafael Fremont 42 49 53 27 55 110
Mill Valley RW City 34 40 40 20 60 120
Average 29 36 47 22 46 103
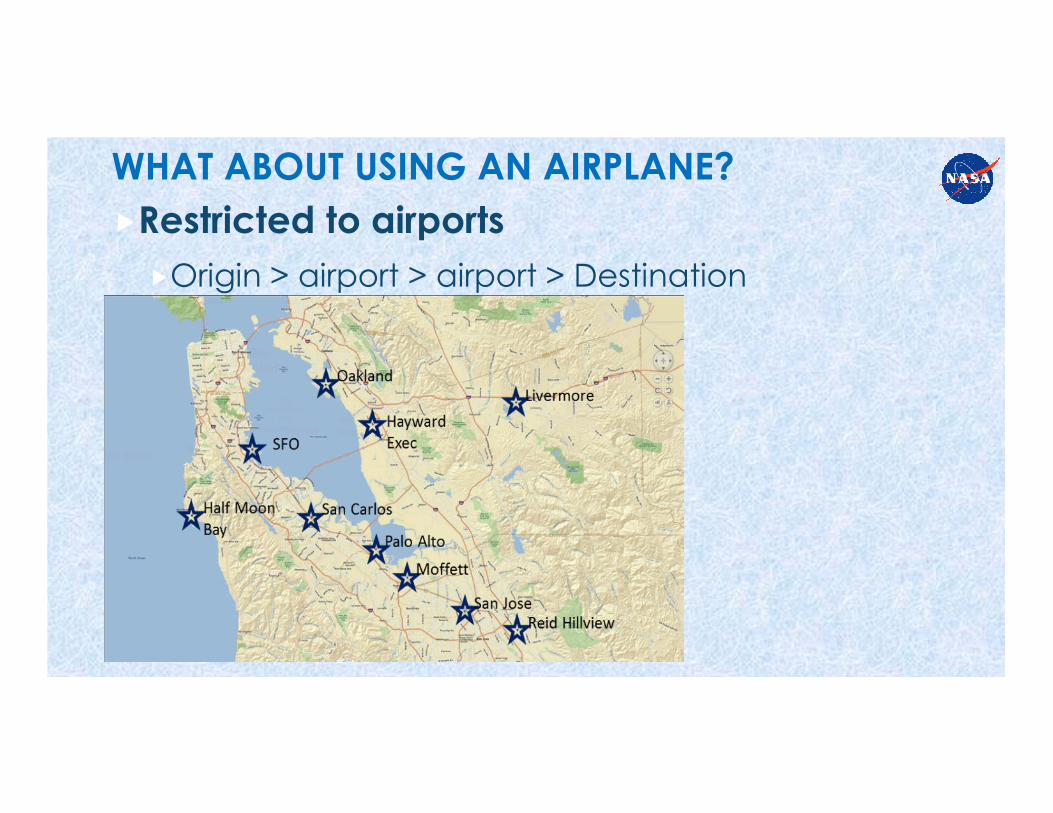
WHAT ABOUT USING AN AIRPLANE?
�Restricted to airports
�Origin > airport > airport > Destination
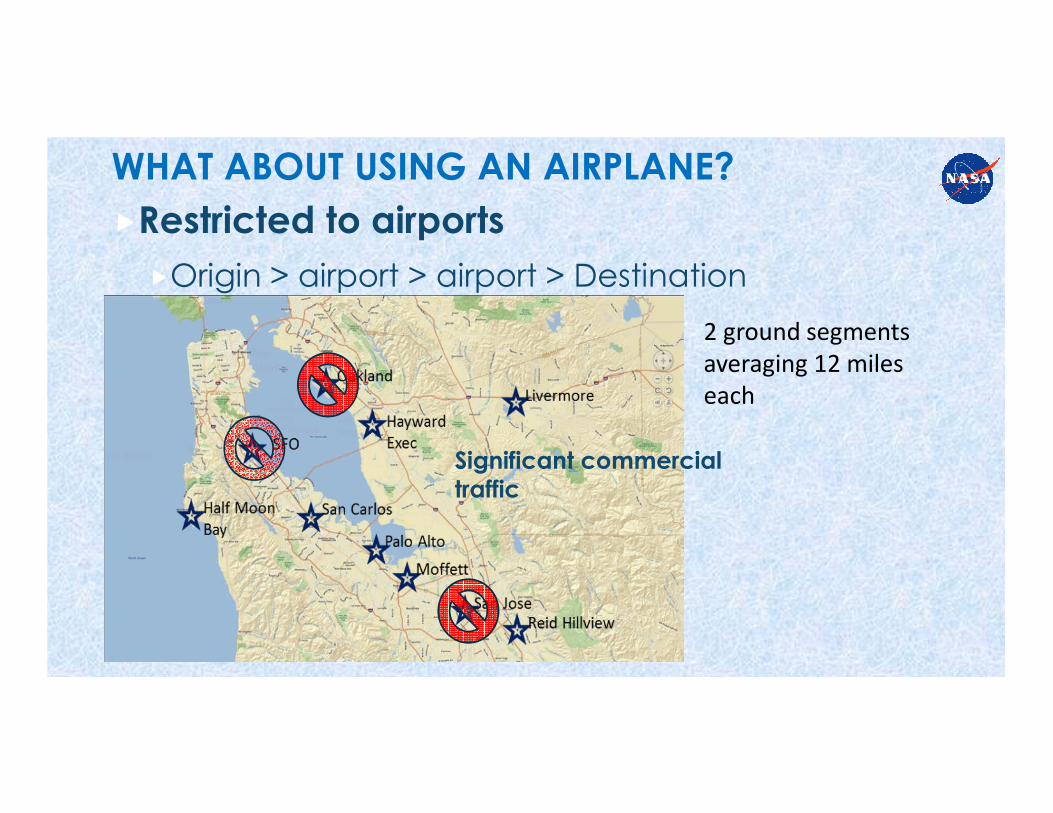
WHAT ABOUT USING AN AIRPLANE?
�Restricted to airports
�Origin > airport > airport > Destination
Significant commercial
traffic
2 ground segments
averaging 12 miles
each
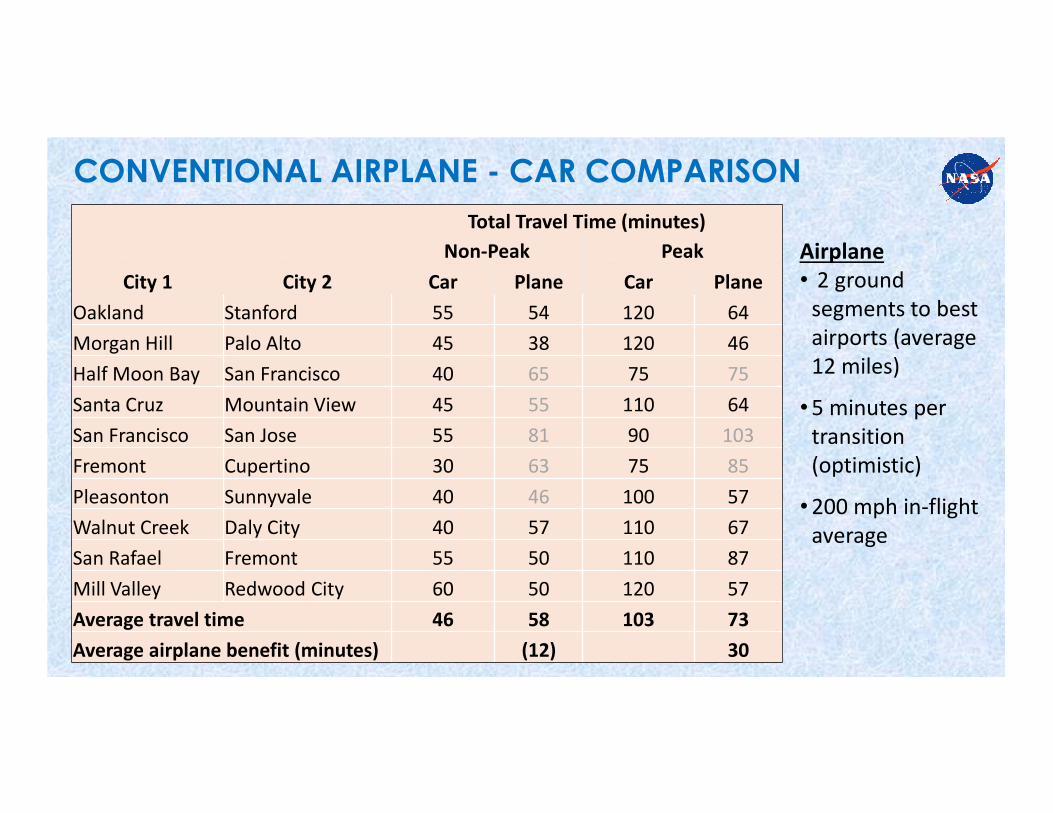
CONVENTIONAL AIRPLANE - CAR COMPARISON
Total Travel Time (minutes)
Non-Peak Peak
City 1 City 2 Car Plane Car Plane
Oakland Stanford 55 54 120 64
Morgan Hill Palo Alto 45 38 120 46
Half Moon Bay San Francisco 40 65 75 75
Santa Cruz Mountain View 45 55 110 64
San Francisco San Jose 55 81 90 103
Fremont Cupertino 30 63 75 85
Pleasonton Sunnyvale 40 46 100 57
Walnut Creek Daly City 40 57 110 67
San Rafael Fremont 55 50 110 87
Mill Valley Redwood City 60 50 120 57
Average travel time 46 58 103 73
Average airplane benefit (minutes) (12) 30
Airplane
• 2 ground
segments to best
airports (average
12 miles)
•5 minutes per
transition
(optimistic)
•200 mph in-flight
average
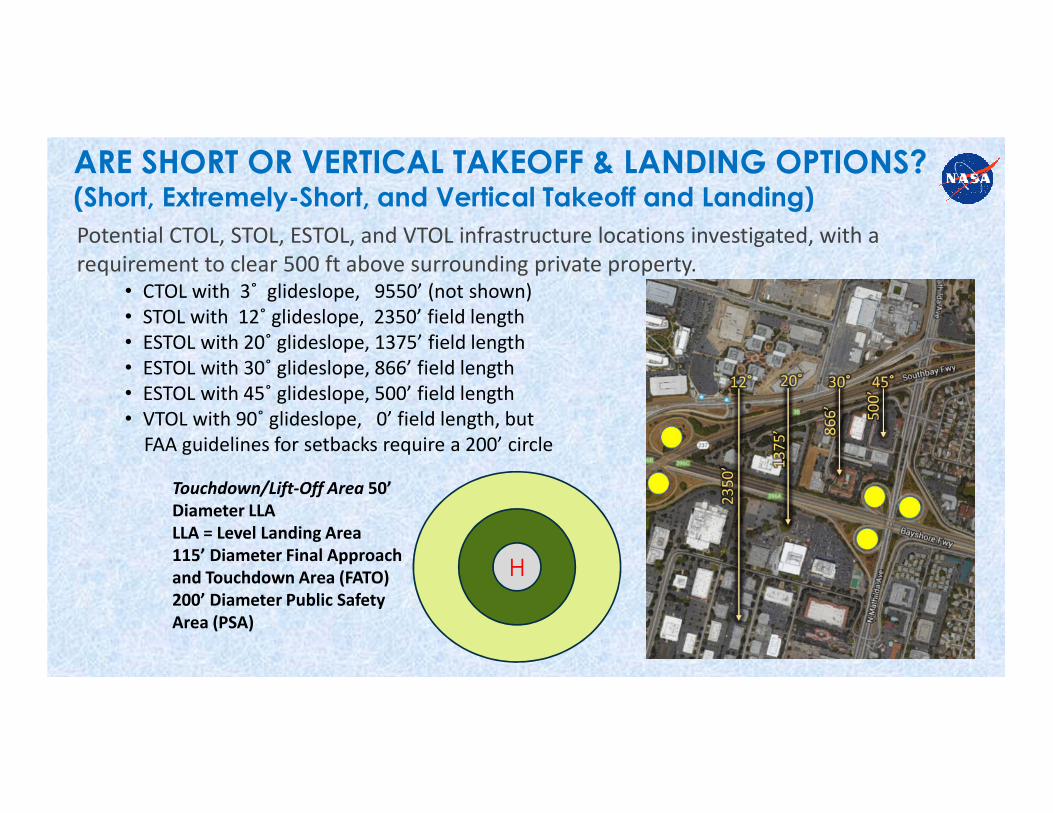
ARE SHORT OR VERTICAL TAKEOFF & LANDING OPTIONS?(Short, Extremely-Short, and Vertical Takeoff and Landing)
Potential CTOL, STOL, ESTOL, and VTOL infrastructure locations investigated, with a
requirement to clear 500 ft above surrounding private property.• CTOL with 3˚ glideslope, 9550’ (not shown)
• STOL with 12˚ glideslope, 2350’ field length
• ESTOL with 20˚ glideslope, 1375’ field length
• ESTOL with 30˚ glideslope, 866’ field length
• ESTOL with 45˚ glideslope, 500’ field length
• VTOL with 90˚ glideslope, 0’ field length, but
FAA guidelines for setbacks require a 200’ circle
Touchdown/Lift-Off Area 50’
Diameter LLA
LLA = Level Landing Area
115’ Diameter Final Approach
and Touchdown Area (FATO)
200’ Diameter Public Safety
Area (PSA)
H

POTENTIAL HELIPAD LOCATIONS, CLOVERLEAF
• Available DOT land resource provides approach/departure paths without overflight of private property at <500 ft.
• Existing high noise area that the community accepts with established setbacks• Distribution that couples to existing ground roads for minimum travel time
Secondary Street to Highway
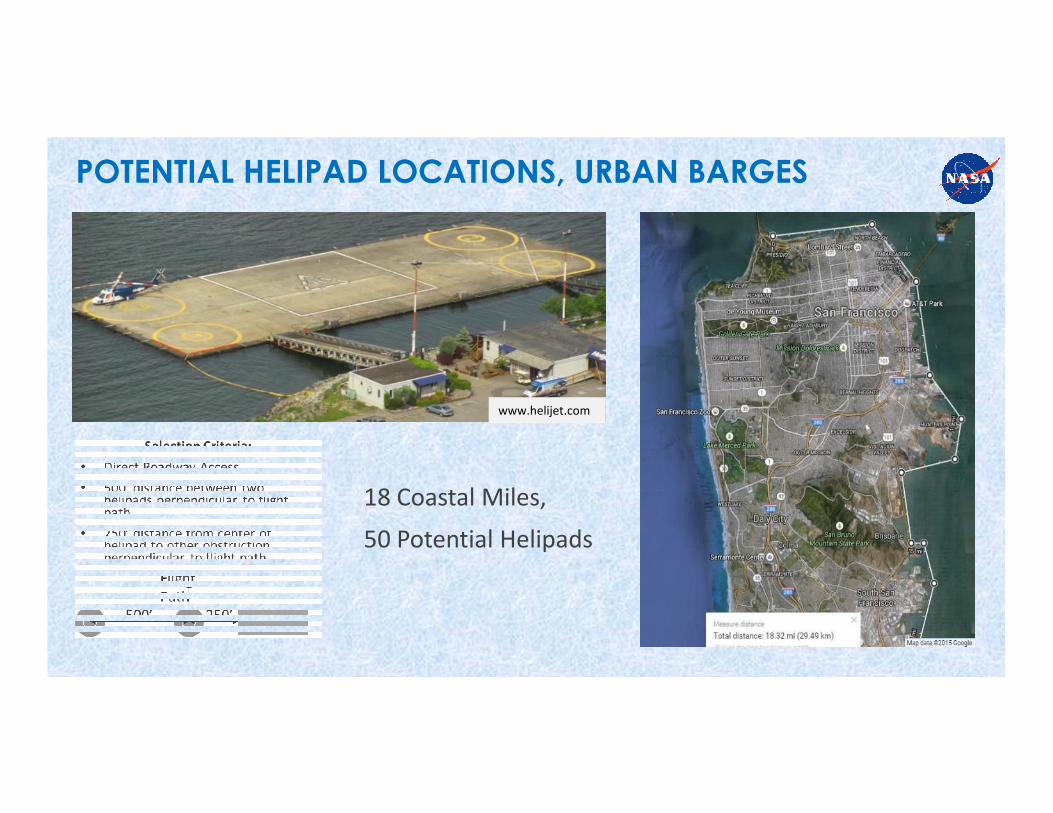
POTENTIAL HELIPAD LOCATIONS, URBAN BARGES
18 Coastal Miles,
50 Potential Helipads
www.helijet.com
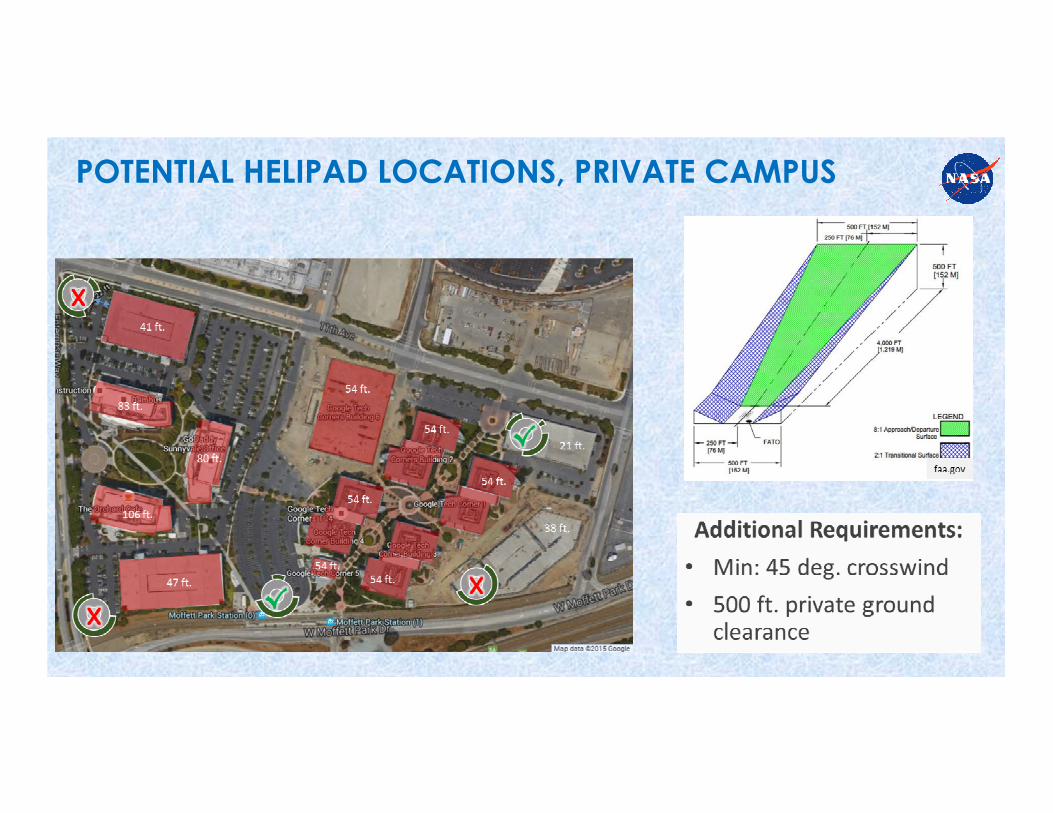
POTENTIAL HELIPAD LOCATIONS, PRIVATE CAMPUS
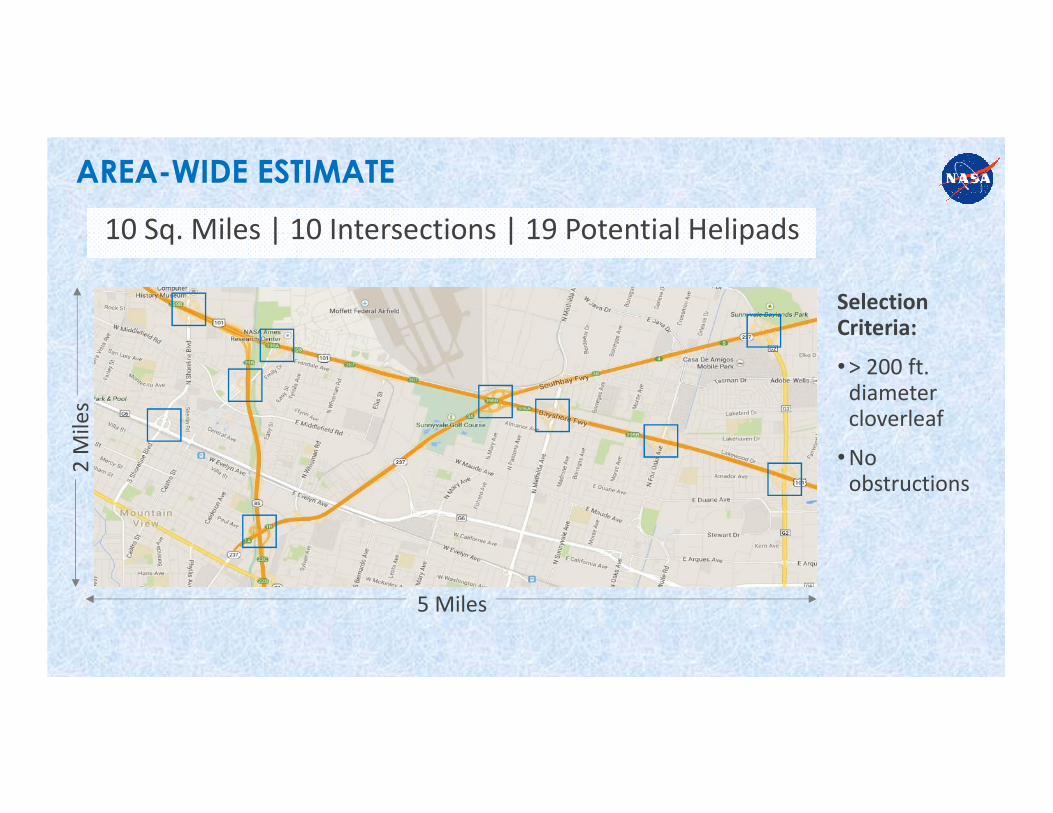
AREA-WIDE ESTIMATE
2 M
ile
s
5 Miles
10 Sq. Miles | 10 Intersections | 19 Potential Helipads
Selection Criteria:
•> 200 ft. diameter cloverleaf
•No obstructions
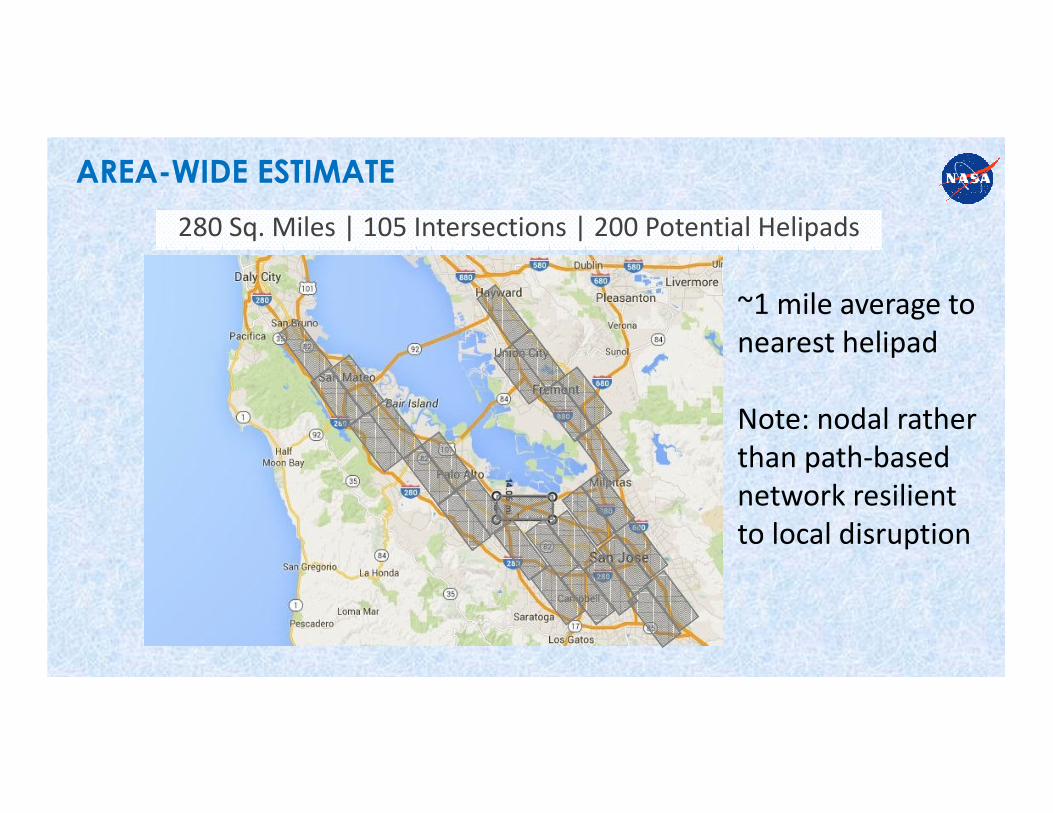
280 Sq. Miles | 105 Intersections | 200 Potential Helipads
~1 mile average to
nearest helipad
Note: nodal rather
than path-based
network resilient
to local disruption
AREA-WIDE ESTIMATE
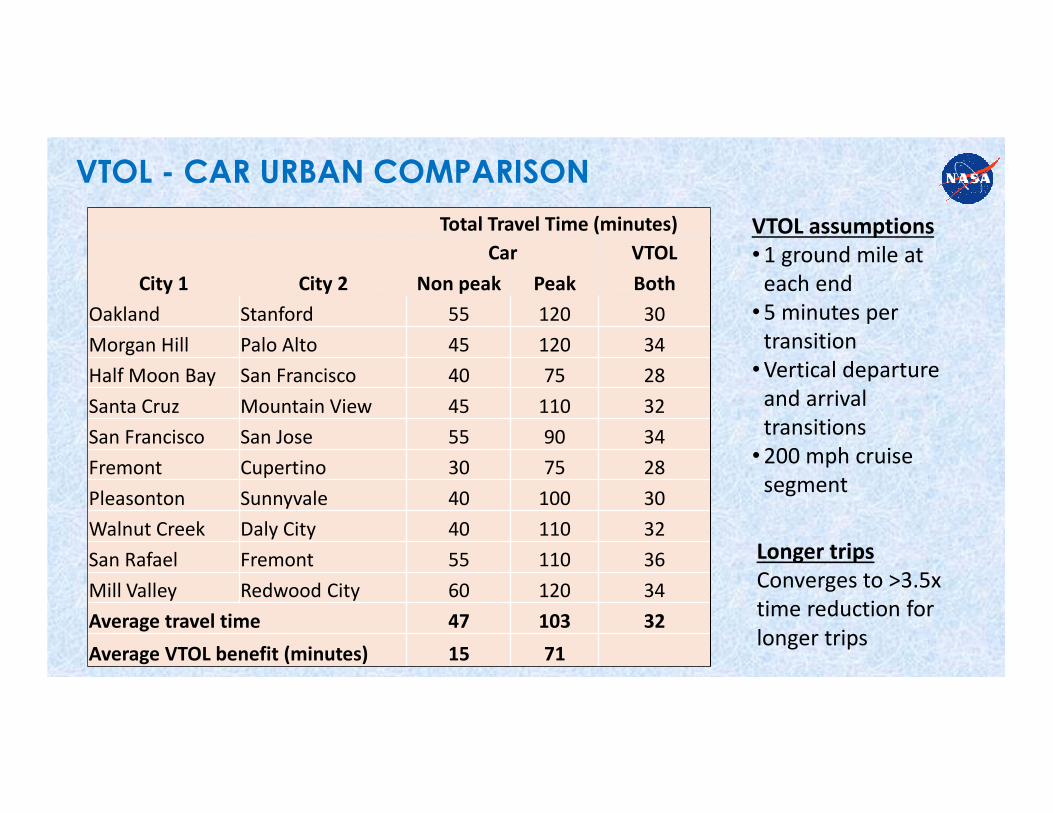
VTOL - CAR URBAN COMPARISON
Total Travel Time (minutes)
Car VTOL
City 1 City 2 Non peak Peak Both
Oakland Stanford 55 120 30
Morgan Hill Palo Alto 45 120 34
Half Moon Bay San Francisco 40 75 28
Santa Cruz Mountain View 45 110 32
San Francisco San Jose 55 90 34
Fremont Cupertino 30 75 28
Pleasonton Sunnyvale 40 100 30
Walnut Creek Daly City 40 110 32
San Rafael Fremont 55 110 36
Mill Valley Redwood City 60 120 34
Average travel time 47 103 32
Average VTOL benefit (minutes) 15 71
VTOL assumptions
•1 ground mile at
each end
•5 minutes per
transition
•Vertical departure
and arrival
transitions
•200 mph cruise
segment
Longer trips
Converges to >3.5x
time reduction for
longer trips
WE’VE HEARD THIS FOR DECADES--
THE BARRIERS ARE TOO HIGH!
� Too expensive
� Not safe enough
� Community noise
� Hard to use
� Unreliable
� Uncomfortable
� Final mile problem
� Inefficient & high emissions
� Never certify
�Airspace integration
� …
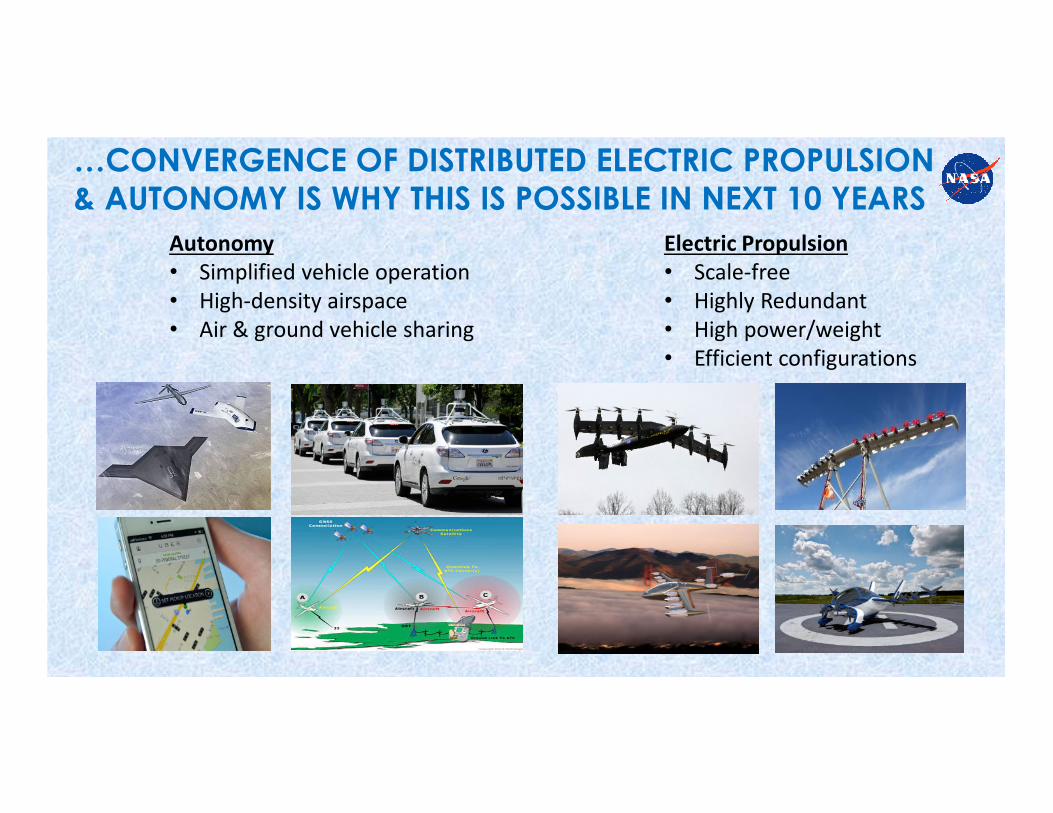
…CONVERGENCE OF DISTRIBUTED ELECTRIC PROPULSION
& AUTONOMY IS WHY THIS IS POSSIBLE IN NEXT 10 YEARS
Electric Propulsion
• Scale-free
• Highly Redundant
• High power/weight
• Efficient configurations
Autonomy
• Simplified vehicle operation
• High-density airspace
• Air & ground vehicle sharing
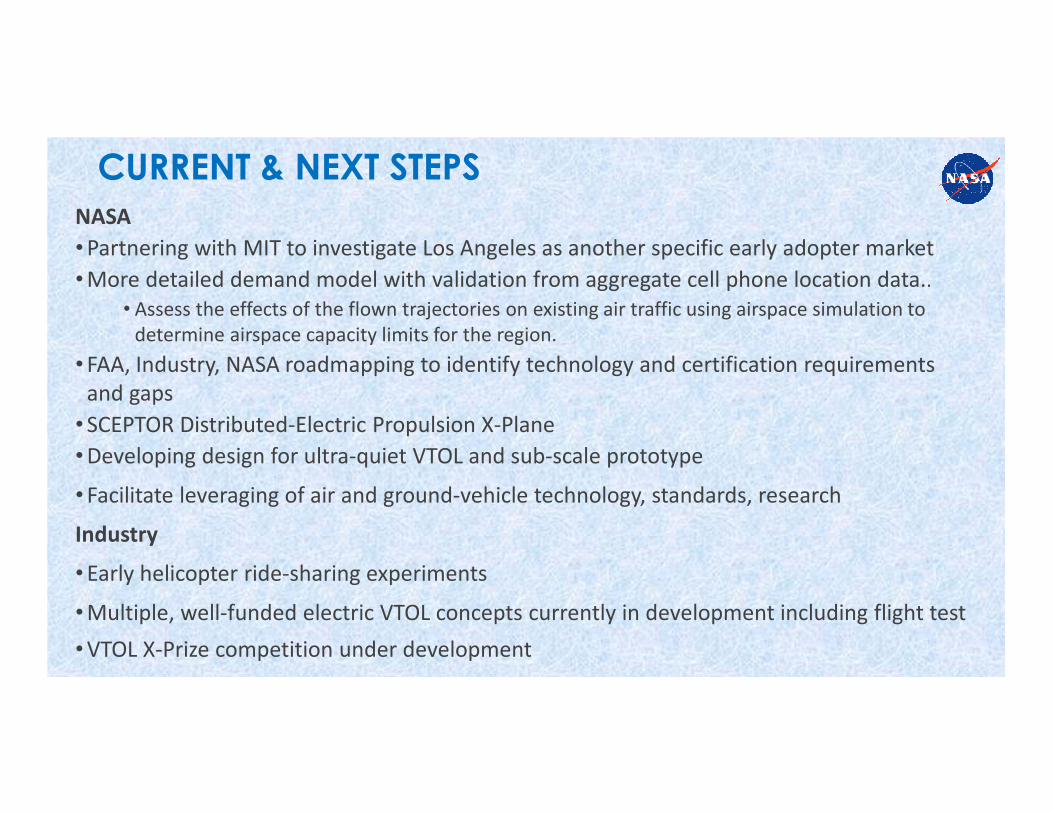
CURRENT & NEXT STEPS
NASA
•Partnering with MIT to investigate Los Angeles as another specific early adopter market
•More detailed demand model with validation from aggregate cell phone location data..
• Assess the effects of the flown trajectories on existing air traffic using airspace simulation to
determine airspace capacity limits for the region.
•FAA, Industry, NASA roadmapping to identify technology and certification requirements
and gaps
•SCEPTOR Distributed-Electric Propulsion X-Plane
•Developing design for ultra-quiet VTOL and sub-scale prototype
•Facilitate leveraging of air and ground-vehicle technology, standards, research
Industry
•Early helicopter ride-sharing experiments
•Multiple, well-funded electric VTOL concepts currently in development including flight test
•VTOL X-Prize competition under development

QUESTIONS?