Embed Size (px)
Citation preview

This is a one-time single-issue premium to induce subscriptions to GSA-Pro or GSA-Top10.
Welcome to Silver Stock Analyst
If you have been a Gold and Silver stock investor for any period of time, you probably know this publication’s parent, Gold Stock Analyst (GSA). For the 17 years since 1994, GSA has published GSA-Pro for investment pro-fessionals; it covers 70 miners to find the 10 best stocks, the GSA Top 10. Since mid-2010 we’ve also published GSA-Top10 for those not needing the detail level of GSA-Pro, but wanting coverage of just our Top 10 stocks. The results of GSA’s Top 10 stock portfolio have been spectacular, with an average gain of 43%/year over the past 10 years. More at http://www.GoldStockAnalyst.com including a link to the independent audit report on our track record by Alpha Performance Verification Services. Silver stocks are a much smaller sector of the precious metals universe as evidenced by a couple of examples: 1) Production by largest Silver miner is trivial compared to the largest Gold miner. For example, the #1 Silver miner forecasts 26.0 mil oz prod in 2011 whereas the largest Gold miner (with production restated as Silver equiva-lent based on a 43 ratio on $1,500/$35 per ounce prices) will produce 335 mil Ag Eqv oz in 2011… 14X higher! Or 2), looking at the miners on a Market Cap basis, GSA’s Gold stock universe has a total Market Capitalization of $340 billion. But the 15 significant Silver stocks (producers and near producers) that we examined for this issue have a total valuation of just $29 billion, or less than 10% of the Gold miners’ total size.
Because this is a one-time publication with no follow-on coverage (as of now), we decided to limit our company reports to those we see worthy of purchase… in addition to providing a big picture look at the Silver market. So rather than give the full data array of all those examined, a la GSA-Pro, the four “must owns” are covered in 2-3 page reports in the GSA-Top10 style.
If you also subscribe to GSA-Pro or GSA-Top10, you know our valuation and stock selection process begins with 3 key metrics. These are all derived from a stock’s Market Capitalization, the stock market’s value of the en-tire company and simply a company’s total number of shares issued multiplied by the stock price. The Market Caps for all the Silver miners we examined ranges from $100 million to over $10 billion. As with the other GSA publica-tions, use of these Market Cap metrics puts each miner on a standardized basis for comparison. Our final decision depends on multiple subjective considerations, but this is a place to start. 1) Market Cap/ounce of Production: Value the Market gives to an ounce of miner’s output; range $100-$500/oz. 2) Market Cap/ounce of Proven & Probable Reserves: Value the Market gives to Reserves ounces (with the high-est level of certainty) in the ground and available for future production; range: $4-$55/oz. 3) Operating Cash Flow Multiple: Annual cash generated by a company’s mines net of direct mining expenses such as labor, power and supplies, divided into Market Cap; range 3X to 15X.
™
A one-time Silver premium that might become a monthly publication. From Gold Stock Analyst, publisher of GSA-Pro and GSA-Top10.
Our Silver Stock Picks and Data 2 Silver Supply and Demand 3 Quantitative Silver Price Analysis 4 Silver Price Forecast 5
#1 in Profits 6-8 #1 in Silver Ounces 9-10 #1 in Growth 11-12 #1 Not yet in Production 13-14
Inside:
Editors: John C. Doody and Garrett Goggin • Single Issue: $100 Silver Stock Analyst Box 7440 Ft Lauderdale, FL 33338 USA • 100% Subscriber Supported
Website: http://www.SilverStockAnalyst.com • Contact/Email: [email protected]
Silver Stock Analyst
™
Silver Stock Analyst Metrics
© 2011 SILVER STOCK ANALYST Box 7440 Ft Lauderdale, FL 33338 http://www.SilverStockAnalyst.com 12/11
2
Silver Stock Analyst is written by the Gold Stock Analyst™ which also writes two Gold-oriented newsletters: GSA-Pro (for investment professionals, covering ~70 stocks, issued on first business day of the month and includes GSA-Top10 newsletter) and GSA Top-10 (for individual investors, covers just the GSA-Top10 stocks and is issued mid-month). Both include Special Alerts when there’s important news on a GSA Top-10 stock or our recommendation changes. Members access issues through the Subscriber’s area of our website http://www.GoldStockAnalyst.com using their email address and a self-selected password. GSA’s 20 page User Guide is helpful in understanding our analysis and abbreviations in this Silver issue. It’s posted on website: http://www.GoldStockAnalyst.com.
Subscription Information GSA-Pro: $995 for 12 months, $1,695 for 2 years. Single issue: $150. GSA-Top10: $495 for 12 months, $895 for 2 years. Single issue: $100.
Silver Stock Analyst: Special report available at http://www.GoldStockAnalyst.com for $100. MC, Visa, and Amex accepted. Order on our Website, or Fax 954-527-4877. Subscriptions are final and non-refundable.
Questions? Email us: [email protected]
The information herein is from: company reports, interviews, press releases, SEC filings, and original research by GOLD STOCK ANALYST staff. Every effort made to assure accuracy, but mistakes are possible. GSA is not an investment advisor. This newsletter is for information purposes only. No warranties are made as to investment results. Stocks range from established, well-capitalized firms with skilled management and a long track record to those which are highly speculative, under-capitalized, with untested management and no production history. It is entirely up to the subscriber to determine if any are appropriate for his purchase. The analysis and conclusions herein reflect Editor and Staff’s opin-ions, based on the facts available at the time, and are subject to change. COMPANIES DO NOT PAY FOR COVERAGE. Selection for coverage is entirely determined by GSA and based in part on: 1) Stock trades in North America; 2) Current production and/or a published independent feasibility study showing a deposit to be economic. 3) Current or potential 5+ mil oz/yr Silver production. All rights reserved and protected (© 1994-2011) under US Copyright Law. Reproduction of any portion is not permitted without specific permission. Editor and Staff may buy/sell securities of firms herein at any time, increase/decrease and trade around positions, but never act contrary to GSA’s basic recommendation.
Silver Stock Analyst Team: John Doody, Editor; Garrett Goggin, Associate Editor; Doug Noble, Webmaster SILVER STOCK ANALYST™ newsletter is owned/published by Gold Stock Analyst, Inc.
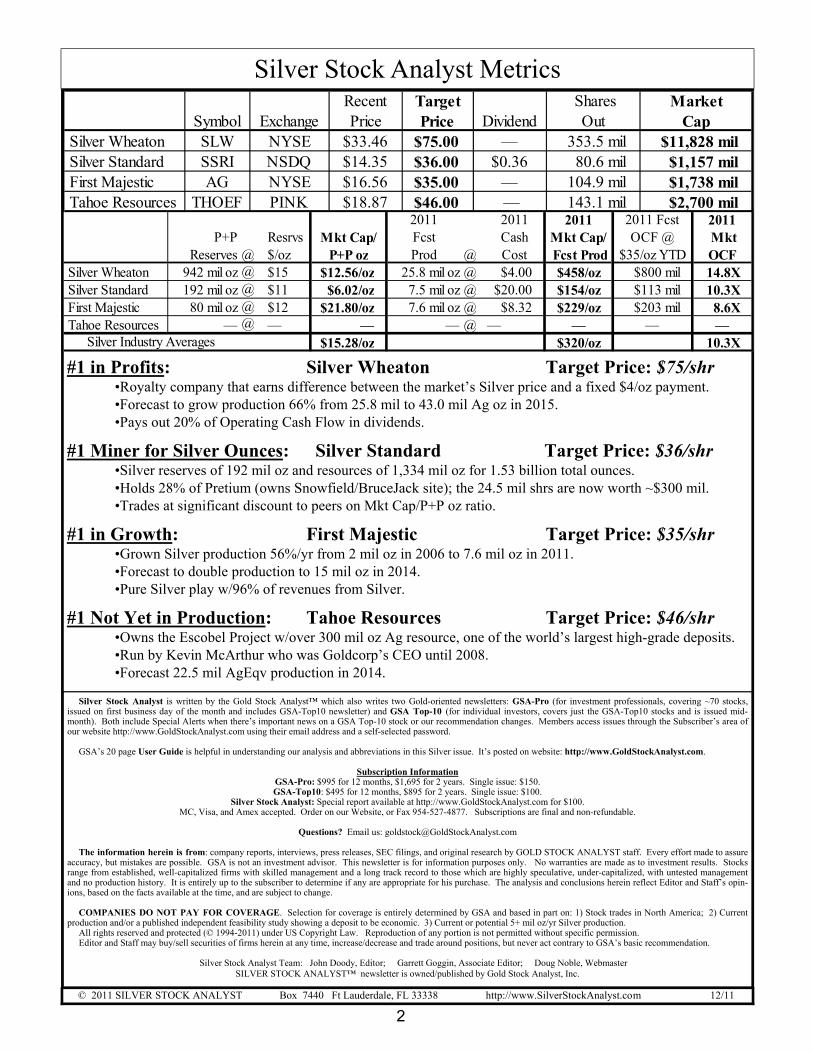
#1 in Profits: Silver Wheaton Target Price: $75/shr •Royalty company that earns difference between the market’s Silver price and a fixed $4/oz payment. •Forecast to grow production 66% from 25.8 mil to 43.0 mil Ag oz in 2015. •Pays out 20% of Operating Cash Flow in dividends.
#1 Miner for Silver Ounces: Silver Standard Target Price: $36/shr •Silver reserves of 192 mil oz and resources of 1,334 mil oz for 1.53 billion total ounces. •Holds 28% of Pretium (owns Snowfield/BruceJack site); the 24.5 mil shrs are now worth ~$300 mil. •Trades at significant discount to peers on Mkt Cap/P+P oz ratio.
#1 in Growth: First Majestic Target Price: $35/shr •Grown Silver production 56%/yr from 2 mil oz in 2006 to 7.6 mil oz in 2011. •Forecast to double production to 15 mil oz in 2014. •Pure Silver play w/96% of revenues from Silver.
#1 Not Yet in Production: Tahoe Resources Target Price: $46/shr •Owns the Escobel Project w/over 300 mil oz Ag resource, one of the world’s largest high-grade deposits. •Run by Kevin McArthur who was Goldcorp’s CEO until 2008. •Forecast 22.5 mil AgEqv production in 2014.
2011 2011 2011 2011 Fcst 2011P+P Resrvs Mkt Cap/ Fcst Cash Mkt Cap/ OCF @ Mkt
Reserves @ $/oz P+P oz Prod @ Cost Fcst Prod $35/oz YTD OCF Silver Wheaton 942 mil oz @ $15 $12.56/oz 25.8 mil oz @ $4.00 $458/oz $800 mil 14.8X Silver Standard 192 mil oz @ $11 $6.02/oz 7.5 mil oz @ $20.00 $154/oz $113 mil 10.3X First Majestic 80 mil oz @ $12 $21.80/oz 7.6 mil oz @ $8.32 $229/oz $203 mil 8.6X Tahoe Resources — @ — — — @ — — — —
$15.28/oz $320/oz 10.3XSilver Industry Averages
Recent Target Shares MarketSymbol Exchange Price Price Dividend Out Cap
Silver Wheaton SLW NYSE $33.46 $75.00 — 353.5 mil $11,828 mil Silver Standard SSRI NSDQ $14.35 $36.00 $0.36 80.6 mil $1,157 mil First Majestic AG NYSE $16.56 $35.00 — 104.9 mil $1,738 mil Tahoe Resources THOEF PINK $18.87 $46.00 — 143.1 mil $2,700 mil
Silver Supply and Demand
© 2011 SILVER STOCK ANALYST Box 7440 Ft Lauderdale, FL http://www.SilverStockAnalyst.com 12/11
3
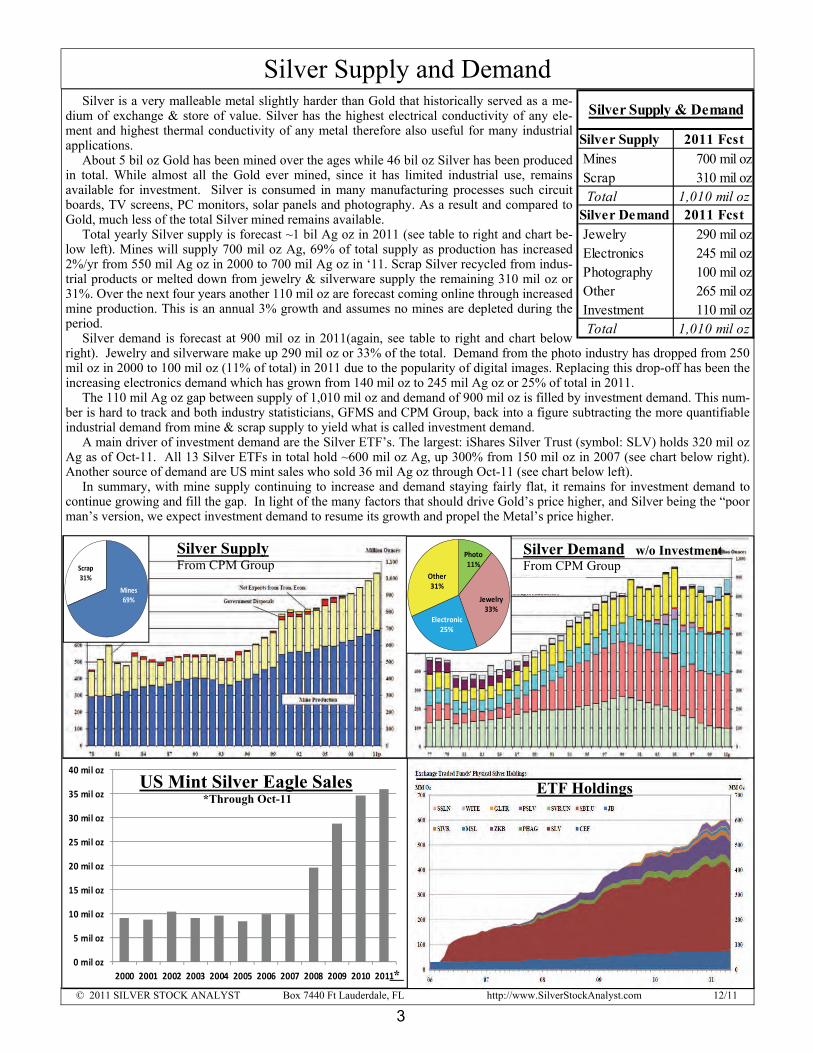
Silver is a very malleable metal slightly harder than Gold that historically served as a me-dium of exchange & store of value. Silver has the highest electrical conductivity of any ele-ment and highest thermal conductivity of any metal therefore also useful for many industrial applications. About 5 bil oz Gold has been mined over the ages while 46 bil oz Silver has been produced in total. While almost all the Gold ever mined, since it has limited industrial use, remains available for investment. Silver is consumed in many manufacturing processes such circuit boards, TV screens, PC monitors, solar panels and photography. As a result and compared to Gold, much less of the total Silver mined remains available. Total yearly Silver supply is forecast ~1 bil Ag oz in 2011 (see table to right and chart be-low left). Mines will supply 700 mil oz Ag, 69% of total supply as production has increased 2%/yr from 550 mil Ag oz in 2000 to 700 mil Ag oz in ‘11. Scrap Silver recycled from indus-trial products or melted down from jewelry & silverware supply the remaining 310 mil oz or 31%. Over the next four years another 110 mil oz are forecast coming online through increased mine production. This is an annual 3% growth and assumes no mines are depleted during the period. Silver demand is forecast at 900 mil oz in 2011(again, see table to right and chart below right). Jewelry and silverware make up 290 mil oz or 33% of the total. Demand from the photo industry has dropped from 250 mil oz in 2000 to 100 mil oz (11% of total) in 2011 due to the popularity of digital images. Replacing this drop-off has been the increasing electronics demand which has grown from 140 mil oz to 245 mil Ag oz or 25% of total in 2011. The 110 mil Ag oz gap between supply of 1,010 mil oz and demand of 900 mil oz is filled by investment demand. This num-ber is hard to track and both industry statisticians, GFMS and CPM Group, back into a figure subtracting the more quantifiable industrial demand from mine & scrap supply to yield what is called investment demand. A main driver of investment demand are the Silver ETF’s. The largest: iShares Silver Trust (symbol: SLV) holds 320 mil oz Ag as of Oct-11. All 13 Silver ETFs in total hold ~600 mil oz Ag, up 300% from 150 mil oz in 2007 (see chart below right). Another source of demand are US mint sales who sold 36 mil Ag oz through Oct-11 (see chart below left). In summary, with mine supply continuing to increase and demand staying fairly flat, it remains for investment demand to continue growing and fill the gap. In light of the many factors that should drive Gold’s price higher, and Silver being the “poor man’s version, we expect investment demand to resume its growth and propel the Metal’s price higher.
ETF Holdings
0 mil oz
5 mil oz
10 mil oz
15 mil oz
20 mil oz
25 mil oz
30 mil oz
35 mil oz
40 mil oz
2000 2001 2002 2003 2004 2005 2006 2007 2008 2009 2010 2011
US Mint Silver Eagle Sales *Through Oct-11
*
Silver Demand From CPM Group
Jewelry 33%
Electronic 25%
Photo 11%
Other 31%
Silver Supply From CPM Group Scrap
31%
Mines 69%
Silver Supply 2011 Fcst Mines 700 mil oz Scrap 310 mil oz Total 1,010 mil ozSilver Demand 2011 Fcst Jewelry 290 mil oz Electronics 245 mil oz Photography 100 mil oz Other 265 mil oz Investment 110 mil oz Total 1,010 mil oz
Silver Supply & Demand
w/o Investment
Quantitative Silver Price Analysis
© 2011 SILVER STOCK ANALYST Box 7440 Ft Lauderdale, FL http://www.SilverStockAnalyst.com 12/11
4
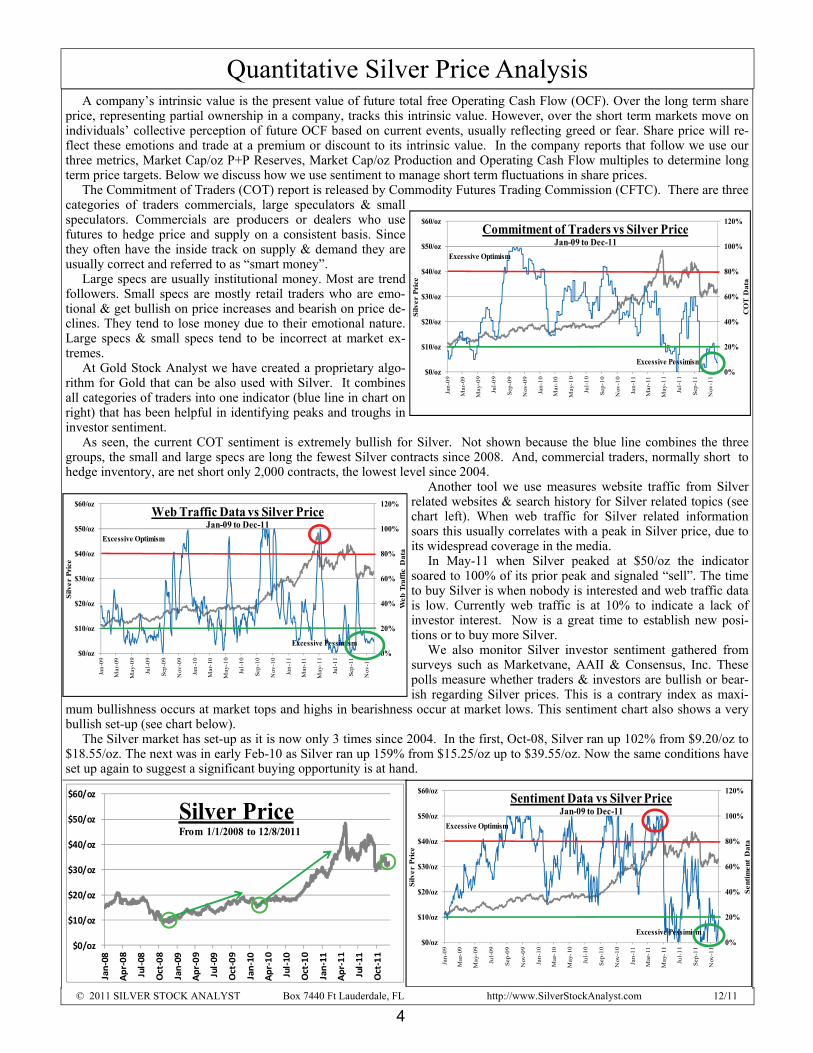
A company’s intrinsic value is the present value of future total free Operating Cash Flow (OCF). Over the long term share price, representing partial ownership in a company, tracks this intrinsic value. However, over the short term markets move on individuals’ collective perception of future OCF based on current events, usually reflecting greed or fear. Share price will re-flect these emotions and trade at a premium or discount to its intrinsic value. In the company reports that follow we use our three metrics, Market Cap/oz P+P Reserves, Market Cap/oz Production and Operating Cash Flow multiples to determine long term price targets. Below we discuss how we use sentiment to manage short term fluctuations in share prices. The Commitment of Traders (COT) report is released by Commodity Futures Trading Commission (CFTC). There are three categories of traders commercials, large speculators & small speculators. Commercials are producers or dealers who use futures to hedge price and supply on a consistent basis. Since they often have the inside track on supply & demand they are usually correct and referred to as “smart money”. Large specs are usually institutional money. Most are trend followers. Small specs are mostly retail traders who are emo-tional & get bullish on price increases and bearish on price de-clines. They tend to lose money due to their emotional nature. Large specs & small specs tend to be incorrect at market ex-tremes. At Gold Stock Analyst we have created a proprietary algo-rithm for Gold that can be also used with Silver. It combines all categories of traders into one indicator (blue line in chart on right) that has been helpful in identifying peaks and troughs in investor sentiment. As seen, the current COT sentiment is extremely bullish for Silver. Not shown because the blue line combines the three groups, the small and large specs are long the fewest Silver contracts since 2008. And, commercial traders, normally short to hedge inventory, are net short only 2,000 contracts, the lowest level since 2004.
Another tool we use measures website traffic from Silver related websites & search history for Silver related topics (see chart left). When web traffic for Silver related information soars this usually correlates with a peak in Silver price, due to its widespread coverage in the media. In May-11 when Silver peaked at $50/oz the indicator soared to 100% of its prior peak and signaled “sell”. The time to buy Silver is when nobody is interested and web traffic data is low. Currently web traffic is at 10% to indicate a lack of investor interest. Now is a great time to establish new posi-tions or to buy more Silver. We also monitor Silver investor sentiment gathered from surveys such as Marketvane, AAII & Consensus, Inc. These polls measure whether traders & investors are bullish or bear-ish regarding Silver prices. This is a contrary index as maxi-
mum bullishness occurs at market tops and highs in bearishness occur at market lows. This sentiment chart also shows a very bullish set-up (see chart below). The Silver market has set-up as it is now only 3 times since 2004. In the first, Oct-08, Silver ran up 102% from $9.20/oz to $18.55/oz. The next was in early Feb-10 as Silver ran up 159% from $15.25/oz up to $39.55/oz. Now the same conditions have set up again to suggest a significant buying opportunity is at hand.
0%
20%
40%
60%
80%
100%
120%
$0/oz
$10/oz
$20/oz
$30/oz
$40/oz
$50/oz
$60/oz
Jan
-09
Mar
-09
May
-09
Jul-
09
Sep
-09
Nov
-09
Jan
-10
Mar
-10
May
-10
Jul-
10
Sep
-10
Nov
-10
Jan
-11
Mar
-11
May
-11
Jul-
11
Sep
-11
Nov
-11
Sen
tim
ent
Dat
a
Silv
er P
rice
Excessive Optimism
Excessive Pessimism
Sentiment Data vs Silver Price Jan-09 to Dec-11
0%
20%
40%
60%
80%
100%
120%
$0/oz
$10/oz
$20/oz
$30/oz
$40/oz
$50/oz
$60/oz
Jan
-09
Mar
-09
May
-09
Jul-
09
Sep
-09
Nov
-09
Jan
-10
Mar
-10
May
-10
Jul-
10
Sep
-10
Nov
-10
Jan
-11
Mar
-11
May
-11
Jul-
11
Sep
-11
Nov
-11
Web
Tra
ffic
Dat
a
Silv
er P
rice
Excessive Optimism
Excessive Pessimism
Web Traffic Data vs Silver Price Jan-09 to Dec-11
0%
20%
40%
60%
80%
100%
120%
$0/oz
$10/oz
$20/oz
$30/oz
$40/oz
$50/oz
$60/oz
Jan
-09
Mar
-09
May
-09
Jul-
09
Sep
-09
Nov
-09
Jan
-10
Mar
-10
May
-10
Jul-
10
Sep
-10
Nov
-10
Jan
-11
Mar
-11
May
-11
Jul-
11
Sep
-11
Nov
-11
CO
T D
ata
Sil
ver
Pri
ce
Excessive Optimism
Excessive Pessimism
Commitment of Traders vs Silver Price Jan-09 to Dec-11
$0/oz
$10/oz
$20/oz
$30/oz
$40/oz
$50/oz
$60/oz
Jan‐08
Apr‐08
Jul‐08
Oct‐08
Jan‐09
Apr‐09
Jul‐09
Oct‐09
Jan‐10
Apr‐10
Jul‐10
Oct‐10
Jan‐11
Apr‐11
Jul‐11
Oct‐11
Silver PriceFrom 1/1/2008 to 12/8/2011
Silver Price Forecast
© 2011 SILVER STOCK ANALYST Box 7440 Ft Lauderdale, FL http://www.SilverStockAnalyst.com 12/11
5
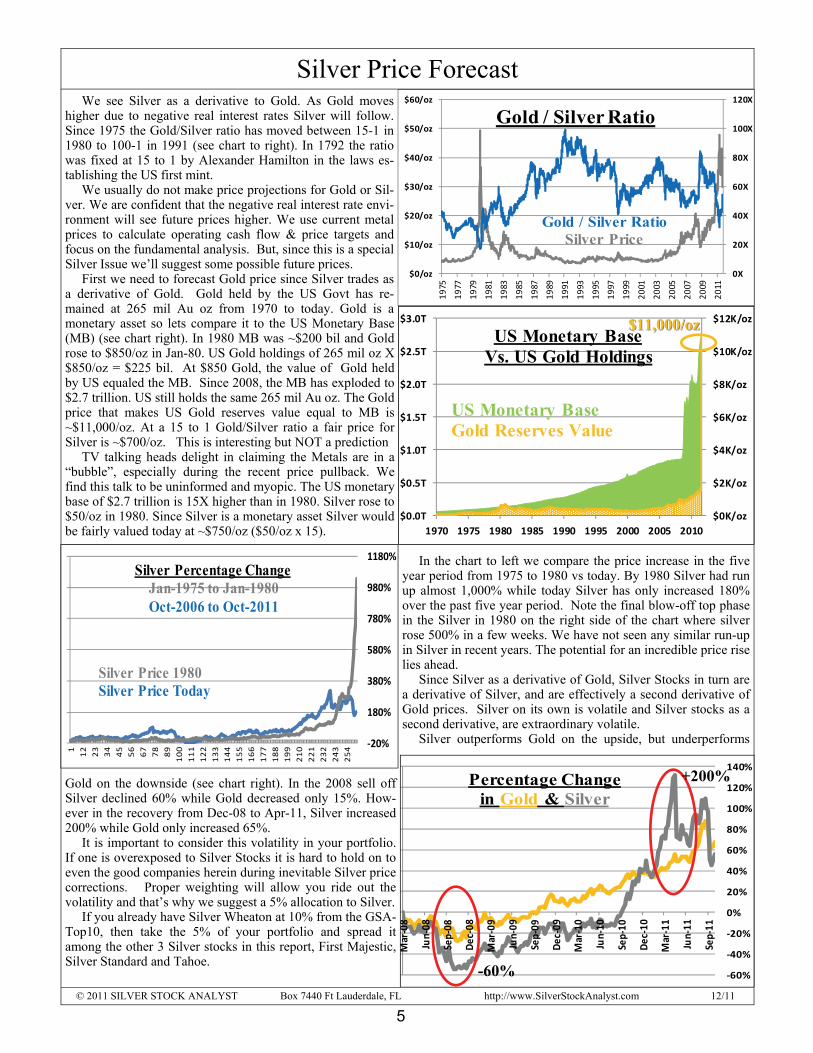
We see Silver as a derivative to Gold. As Gold moves higher due to negative real interest rates Silver will follow. Since 1975 the Gold/Silver ratio has moved between 15-1 in 1980 to 100-1 in 1991 (see chart to right). In 1792 the ratio was fixed at 15 to 1 by Alexander Hamilton in the laws es-tablishing the US first mint. We usually do not make price projections for Gold or Sil-ver. We are confident that the negative real interest rate envi-ronment will see future prices higher. We use current metal prices to calculate operating cash flow & price targets and focus on the fundamental analysis. But, since this is a special Silver Issue we’ll suggest some possible future prices. First we need to forecast Gold price since Silver trades as a derivative of Gold. Gold held by the US Govt has re-mained at 265 mil Au oz from 1970 to today. Gold is a monetary asset so lets compare it to the US Monetary Base (MB) (see chart right). In 1980 MB was ~$200 bil and Gold rose to $850/oz in Jan-80. US Gold holdings of 265 mil oz X $850/oz = $225 bil. At $850 Gold, the value of Gold held by US equaled the MB. Since 2008, the MB has exploded to $2.7 trillion. US still holds the same 265 mil Au oz. The Gold price that makes US Gold reserves value equal to MB is ~$11,000/oz. At a 15 to 1 Gold/Silver ratio a fair price for Silver is ~$700/oz. This is interesting but NOT a prediction TV talking heads delight in claiming the Metals are in a “bubble”, especially during the recent price pullback. We find this talk to be uninformed and myopic. The US monetary base of $2.7 trillion is 15X higher than in 1980. Silver rose to $50/oz in 1980. Since Silver is a monetary asset Silver would be fairly valued today at ~$750/oz ($50/oz x 15).
In the chart to left we compare the price increase in the five year period from 1975 to 1980 vs today. By 1980 Silver had run up almost 1,000% while today Silver has only increased 180% over the past five year period. Note the final blow-off top phase in the Silver in 1980 on the right side of the chart where silver rose 500% in a few weeks. We have not seen any similar run-up in Silver in recent years. The potential for an incredible price rise lies ahead. Since Silver as a derivative of Gold, Silver Stocks in turn are a derivative of Silver, and are effectively a second derivative of Gold prices. Silver on its own is volatile and Silver stocks as a second derivative, are extraordinary volatile. Silver outperforms Gold on the upside, but underperforms
Gold on the downside (see chart right). In the 2008 sell off Silver declined 60% while Gold decreased only 15%. How-ever in the recovery from Dec-08 to Apr-11, Silver increased 200% while Gold only increased 65%. It is important to consider this volatility in your portfolio. If one is overexposed to Silver Stocks it is hard to hold on to even the good companies herein during inevitable Silver price corrections. Proper weighting will allow you ride out the volatility and that’s why we suggest a 5% allocation to Silver. If you already have Silver Wheaton at 10% from the GSA-Top10, then take the 5% of your portfolio and spread it among the other 3 Silver stocks in this report, First Majestic, Silver Standard and Tahoe.
0X
20X
40X
60X
80X
100X
120X
$0/oz
$10/oz
$20/oz
$30/oz
$40/oz
$50/oz
$60/oz
1975
1977
1979
1981
1983
1985
1987
1989
1991
1993
1995
1997
1999
2001
2003
2005
2007
2009
2011
Gold / Silver Ratio
Gold / Silver RatioSilver Price
‐20%
180%
380%
580%
780%
980%
1180%
1
12
23
34
45
56
67
78
89
100
111
122
133
144
155
166
177
188
199
210
221
232
243
254
Silver Percentage ChangeJan-1975 to Jan-1980Oct-2006 to Oct-2011
Silver Price 1980Silver Price Today
$0K/oz
$2K/oz
$4K/oz
$6K/oz
$8K/oz
$10K/oz
$12K/oz
$0.0T
$0.5T
$1.0T
$1.5T
$2.0T
$2.5T
$3.0T
1970 1975 1980 1985 1990 1995 2000 2005 2010
US Monetary BaseVs. US Gold Holdings
US Monetary BaseGold Reserves Value
‐60%
‐40%
‐20%
0%
20%
40%
60%
80%
100%
120%
140%
Mar‐08
Jun‐08
Sep‐08
Dec
‐08
Mar‐09
Jun‐09
Sep‐09
Dec
‐09
Mar‐10
Jun‐10
Sep‐10
Dec
‐10
Mar‐11
Jun‐11
Sep‐11
Percentage Changein Gold & Silver
-60%
+200%
$11,000/oz$11,000/oz
.
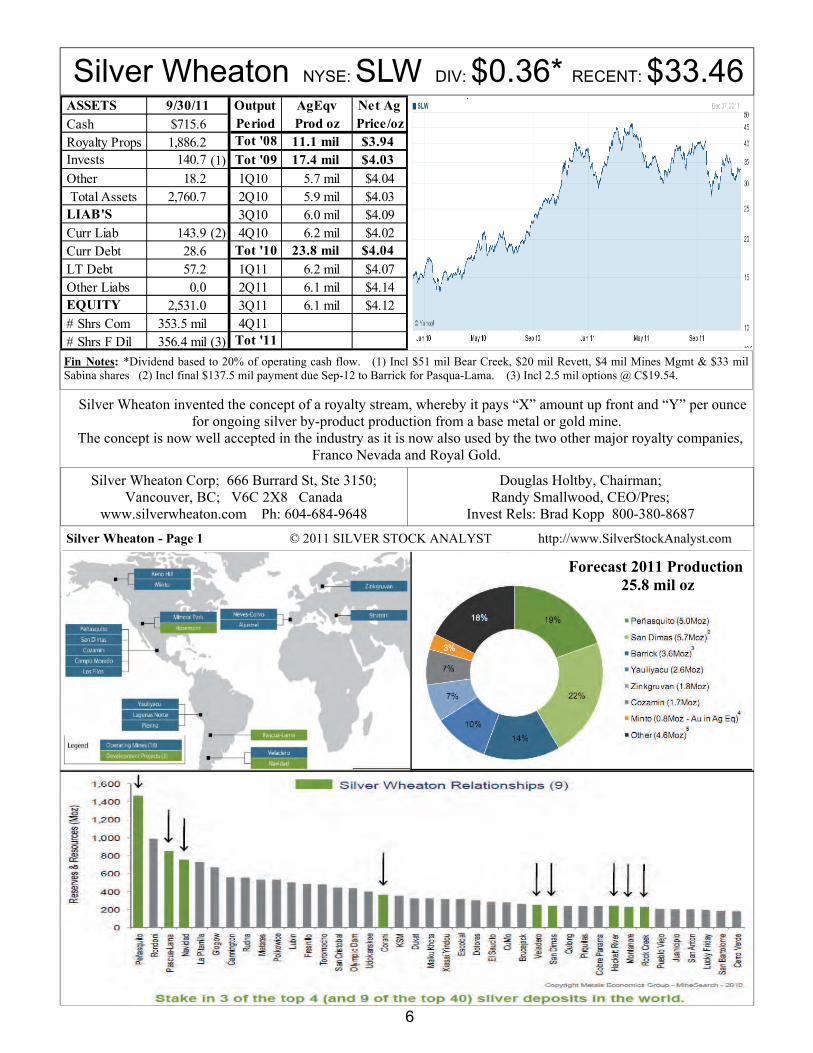
Silver Wheaton NYSE: SLW DIV: $0.36* RECENT: $33.46
6
Silver Wheaton invented the concept of a royalty stream, whereby it pays “X” amount up front and “Y” per ounce for ongoing silver by-product production from a base metal or gold mine.
The concept is now well accepted in the industry as it is now also used by the two other major royalty companies, Franco Nevada and Royal Gold.
Silver Wheaton Corp; 666 Burrard St, Ste 3150; Vancouver, BC; V6C 2X8 Canada
www.silverwheaton.com Ph: 604-684-9648
Douglas Holtby, Chairman; Randy Smallwood, CEO/Pres;
Invest Rels: Brad Kopp 800-380-8687
Forecast 2011 Production 25.8 mil oz
Silver Wheaton - Page 1 © 2011 SILVER STOCK ANALYST http://www.SilverStockAnalyst.com
Fin Notes: *Dividend based to 20% of operating cash flow. (1) Incl $51 mil Bear Creek, $20 mil Revett, $4 mil Mines Mgmt & $33 mil Sabina shares (2) Incl final $137.5 mil payment due Sep-12 to Barrick for Pasqua-Lama. (3) Incl 2.5 mil options @ C$19.54.
ASSETS Output AgEqv Net Ag Cash $715.6 Period Prod oz Price/oz Royalty Props 1,886.2 Tot '08 11.1 mil $3.94 Invests 140.7 (1) Tot '09 17.4 mil $4.03
Other 18.2 1Q10 5.7 mil $4.04 Total Assets 2,760.7 2Q10 5.9 mil $4.03 LIAB'S 3Q10 6.0 mil $4.09 Curr Liab 143.9 (2) 4Q10 6.2 mil $4.02 Curr Debt 28.6 Tot '10 23.8 mil $4.04 LT Debt 57.2 1Q11 6.2 mil $4.07 Other Liabs 0.0 2Q11 6.1 mil $4.14 EQUITY 2,531.0 3Q11 6.1 mil $4.12 # Shrs Com 353.5 mil 4Q11 # Shrs F Dil 356.4 mil (3) Tot '11
9/30/11
Silver Wheaton - Page 2 © 2011 SILVER STOCK ANALYST http://www.SilverStockAnalyst.com
7
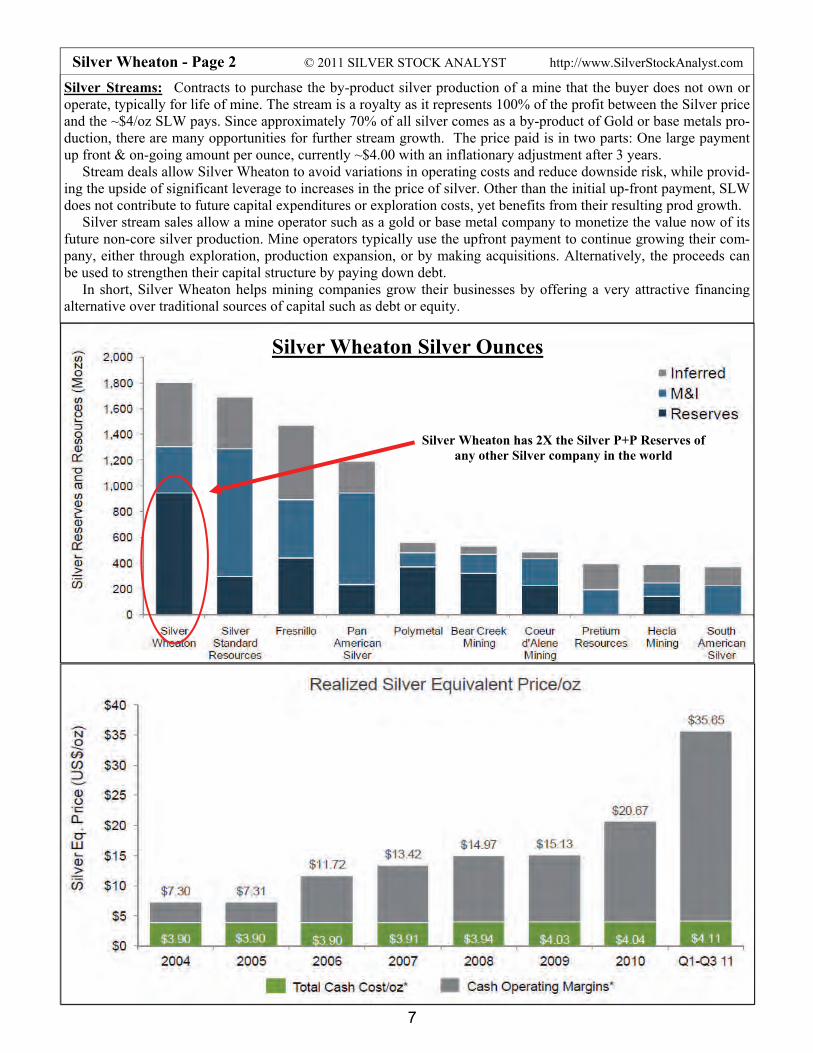
Silver Wheaton Silver Ounces
Silver Wheaton has 2X the Silver P+P Reserves of any other Silver company in the world
Silver Streams: Contracts to purchase the by-product silver production of a mine that the buyer does not own or operate, typically for life of mine. The stream is a royalty as it represents 100% of the profit between the Silver price and the ~$4/oz SLW pays. Since approximately 70% of all silver comes as a by-product of Gold or base metals pro-duction, there are many opportunities for further stream growth. The price paid is in two parts: One large payment up front & on-going amount per ounce, currently ~$4.00 with an inflationary adjustment after 3 years. Stream deals allow Silver Wheaton to avoid variations in operating costs and reduce downside risk, while provid-ing the upside of significant leverage to increases in the price of silver. Other than the initial up-front payment, SLW does not contribute to future capital expenditures or exploration costs, yet benefits from their resulting prod growth. Silver stream sales allow a mine operator such as a gold or base metal company to monetize the value now of its future non-core silver production. Mine operators typically use the upfront payment to continue growing their com-pany, either through exploration, production expansion, or by making acquisitions. Alternatively, the proceeds can be used to strengthen their capital structure by paying down debt. In short, Silver Wheaton helps mining companies grow their businesses by offering a very attractive financing alternative over traditional sources of capital such as debt or equity.
Silver Wheaton - Page 3 ©2011 SILVER STOCK ANALYST http://www.SilverStockAnalyst.com
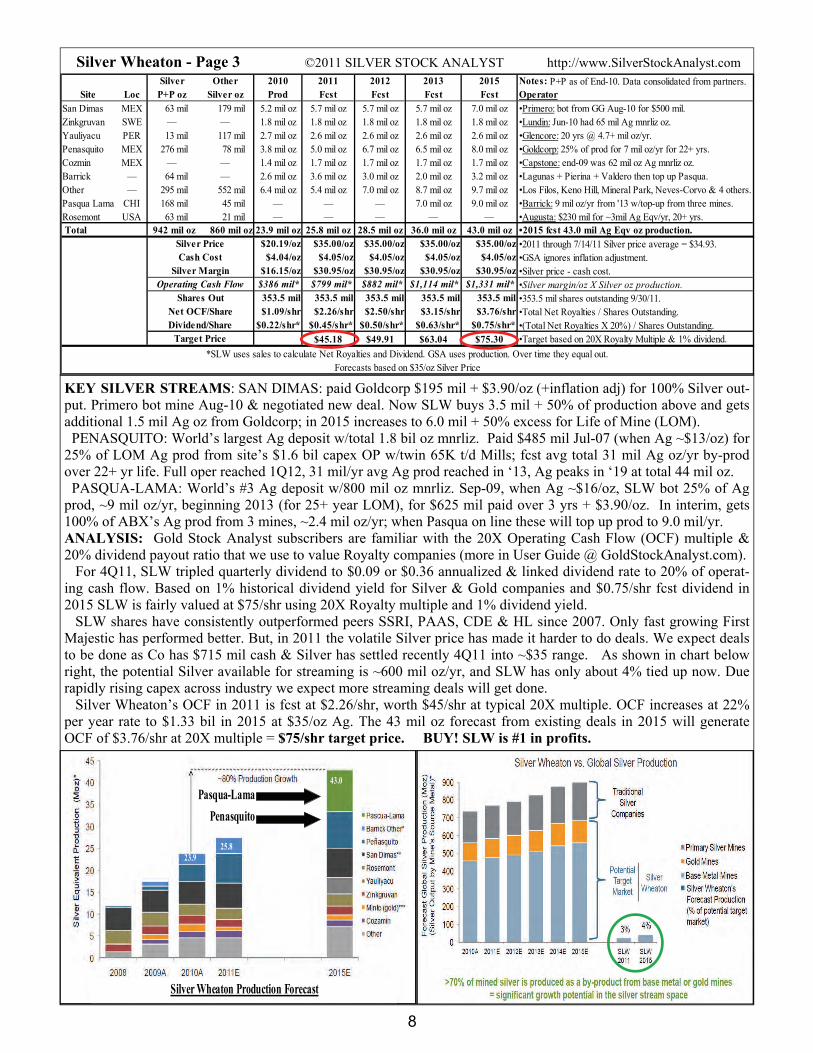
KEY SILVER STREAMS: SAN DIMAS: paid Goldcorp $195 mil + $3.90/oz (+inflation adj) for 100% Silver out-put. Primero bot mine Aug-10 & negotiated new deal. Now SLW buys 3.5 mil + 50% of production above and gets additional 1.5 mil Ag oz from Goldcorp; in 2015 increases to 6.0 mil + 50% excess for Life of Mine (LOM). PENASQUITO: World’s largest Ag deposit w/total 1.8 bil oz mnrliz. Paid $485 mil Jul-07 (when Ag ~$13/oz) for 25% of LOM Ag prod from site’s $1.6 bil capex OP w/twin 65K t/d Mills; fcst avg total 31 mil Ag oz/yr by-prod over 22+ yr life. Full oper reached 1Q12, 31 mil/yr avg Ag prod reached in ‘13, Ag peaks in ‘19 at total 44 mil oz. PASQUA-LAMA: World’s #3 Ag deposit w/800 mil oz mnrliz. Sep-09, when Ag ~$16/oz, SLW bot 25% of Ag prod, ~9 mil oz/yr, beginning 2013 (for 25+ year LOM), for $625 mil paid over 3 yrs + $3.90/oz. In interim, gets 100% of ABX’s Ag prod from 3 mines, ~2.4 mil oz/yr; when Pasqua on line these will top up prod to 9.0 mil/yr. ANALYSIS: Gold Stock Analyst subscribers are familiar with the 20X Operating Cash Flow (OCF) multiple & 20% dividend payout ratio that we use to value Royalty companies (more in User Guide @ GoldStockAnalyst.com). For 4Q11, SLW tripled quarterly dividend to $0.09 or $0.36 annualized & linked dividend rate to 20% of operat-ing cash flow. Based on 1% historical dividend yield for Silver & Gold companies and $0.75/shr fcst dividend in 2015 SLW is fairly valued at $75/shr using 20X Royalty multiple and 1% dividend yield. SLW shares have consistently outperformed peers SSRI, PAAS, CDE & HL since 2007. Only fast growing First Majestic has performed better. But, in 2011 the volatile Silver price has made it harder to do deals. We expect deals to be done as Co has $715 mil cash & Silver has settled recently 4Q11 into ~$35 range. As shown in chart below right, the potential Silver available for streaming is ~600 mil oz/yr, and SLW has only about 4% tied up now. Due rapidly rising capex across industry we expect more streaming deals will get done. Silver Wheaton’s OCF in 2011 is fcst at $2.26/shr, worth $45/shr at typical 20X multiple. OCF increases at 22% per year rate to $1.33 bil in 2015 at $35/oz Ag. The 43 mil oz forecast from existing deals in 2015 will generate OCF of $3.76/shr at 20X multiple = $75/shr target price. BUY! SLW is #1 in profits.
8
Silver Other 2010 2011 2012 2013 2015 Notes: P+P as of End-10. Data consolidated from partners.Site Loc P+P oz Silver oz Prod Fcst Fcst Fcst Fcst Operator
San Dimas MEX 63 mil 179 mil 5.2 mil oz 5.7 mil oz 5.7 mil oz 5.7 mil oz 7.0 mil oz •Primero: bot from GG Aug-10 for $500 mil.Zinkgruvan SWE — — 1.8 mil oz 1.8 mil oz 1.8 mil oz 1.8 mil oz 1.8 mil oz •Lundin: Jun-10 had 65 mil Ag mnrliz oz.Yauliyacu PER 13 mil 117 mil 2.7 mil oz 2.6 mil oz 2.6 mil oz 2.6 mil oz 2.6 mil oz •Glencore: 20 yrs @ 4.7+ mil oz/yr.Penasquito MEX 276 mil 78 mil 3.8 mil oz 5.0 mil oz 6.7 mil oz 6.5 mil oz 8.0 mil oz •Goldcorp: 25% of prod for 7 mil oz/yr for 22+ yrs.Cozmin MEX — — 1.4 mil oz 1.7 mil oz 1.7 mil oz 1.7 mil oz 1.7 mil oz •Capstone: end-09 was 62 mil oz Ag mnrliz oz.Barrick — 64 mil — 2.6 mil oz 3.6 mil oz 3.0 mil oz 2.0 mil oz 3.2 mil oz •Lagunas + Pierina + Valdero then top up Pasqua.Other — 295 mil 552 mil 6.4 mil oz 5.4 mil oz 7.0 mil oz 8.7 mil oz 9.7 mil oz •Los Filos, Keno Hill, Mineral Park, Neves-Corvo & 4 others.Pasqua Lama CHI 168 mil 45 mil — — — 7.0 mil oz 9.0 mil oz •Barrick: 9 mil oz/yr from '13 w/top-up from three mines.Rosemont USA 63 mil 21 mil — — — — — •Augusta: $230 mil for ~3mil Ag Eqv/yr, 20+ yrs. Total 942 mil oz 860 mil oz 23.9 mil oz 25.8 mil oz 28.5 mil oz 36.0 mil oz 43.0 mil oz •2015 fcst 43.0 mil Ag Eqv oz production.
$20.19/oz $35.00/oz $35.00/oz $35.00/oz $35.00/oz •2011 through 7/14/11 Silver price average = $34.93.$4.04/oz $4.05/oz $4.05/oz $4.05/oz $4.05/oz •GSA ignores inflation adjustment.
$16.15/oz $30.95/oz $30.95/oz $30.95/oz $30.95/oz •Silver price - cash cost.$386 mil* $799 mil* $882 mil* $1,114 mil* $1,331 mil* •Silver margin/oz X Silver oz production.353.5 mil 353.5 mil 353.5 mil 353.5 mil 353.5 mil •353.5 mil shares outstanding 9/30/11.$1.09/shr $2.26/shr $2.50/shr $3.15/shr $3.76/shr •Total Net Royalties / Shares Outstanding.
$0.22/shr* $0.45/shr* $0.50/shr* $0.63/shr* $0.75/shr* •(Total Net Royalties X 20%) / Shares Outstanding.$45.18 $49.91 $63.04 $75.30 •Target based on 20X Royalty Multiple & 1% dividend.
Forecasts based on $35/oz Silver Price
Dividend/Share
Silver Price
*SLW uses sales to calculate Net Royalties and Dividend. GSA uses production. Over time they equal out.
Net OCF/Share
Target Price
Cash CostSilver Margin
Operating Cash FlowShares Out
23.9 25.8
43.0
Pasqua-Lama
Penasquito
Silver Wheaton Production Forecast
Silver Standard NSDQ: SSRI DIV: Nil RECENT: $14.25
Silver Standard - Page 1 © 2011 SILVER STOCK ANALYST http://www.SilverStockAnalyst.com
9
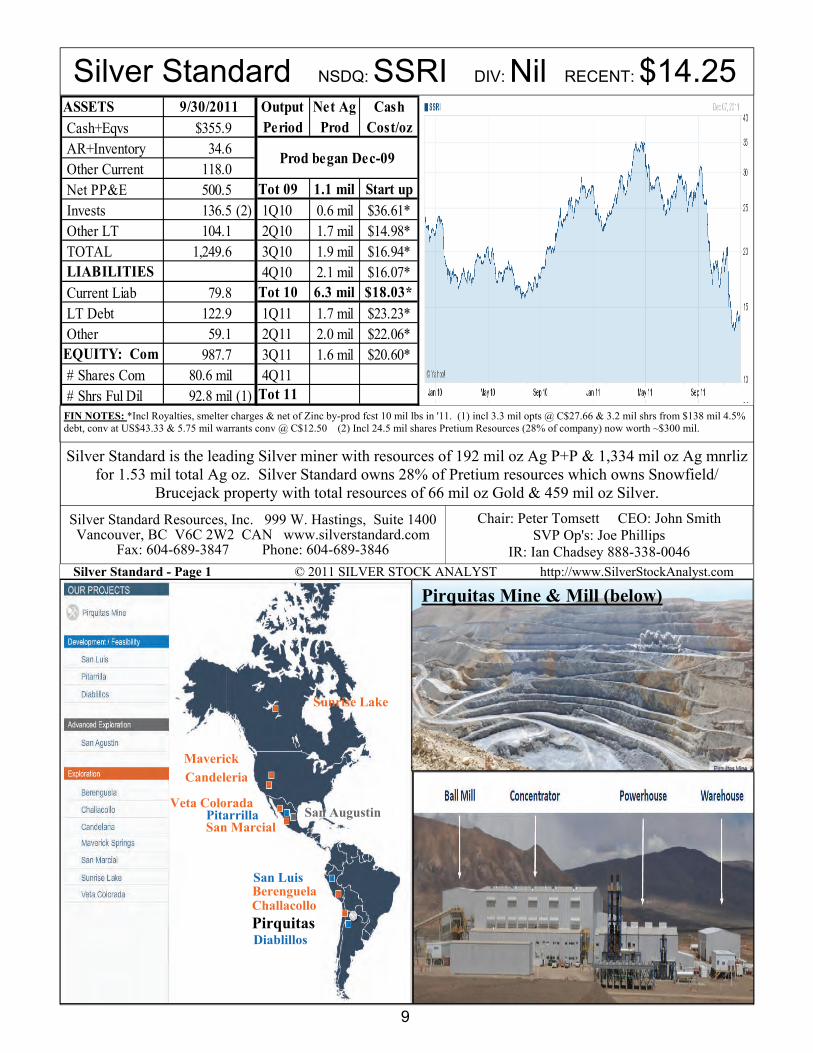
Silver Standard is the leading Silver miner with resources of 192 mil oz Ag P+P & 1,334 mil oz Ag mnrliz for 1.53 mil total Ag oz. Silver Standard owns 28% of Pretium resources which owns Snowfield/
Brucejack property with total resources of 66 mil oz Gold & 459 mil oz Silver.
Pirquitas Mine & Mill (below)
Sunrise Lake
Pirquitas
Pitarrilla
Diablillos
Berenguela San Luis
Challacollo
Candeleria
Maverick
San Marcial
Veta Colorada San Augustin
FIN NOTES: *Incl Royalties, smelter charges & net of Zinc by-prod fcst 10 mil lbs in '11. (1) incl 3.3 mil opts @ C$27.66 & 3.2 mil shrs from $138 mil 4.5% debt, conv at US$43.33 & 5.75 mil warrants conv @ C$12.50 (2) Incl 24.5 mil shares Pretium Resources (28% of company) now worth ~$300 mil.
Silver Standard Resources, Inc. 999 W. Hastings, Suite 1400 Vancouver, BC V6C 2W2 CAN www.silverstandard.com
Fax: 604-689-3847 Phone: 604-689-3846
Chair: Peter Tomsett CEO: John Smith SVP Op's: Joe Phillips
IR: Ian Chadsey 888-338-0046
ASSETS Output Net Ag Cash Cash+Eqvs $355.9 Period Prod Cost/oz AR+Inventory 34.6 Other Current 118.0 Net PP&E 500.5 Tot 09 1.1 mil Start up Invests 136.5 (2) 1Q10 0.6 mil $36.61* Other LT 104.1 2Q10 1.7 mil $14.98* TOTAL 1,249.6 3Q10 1.9 mil $16.94* LIABILITIES 4Q10 2.1 mil $16.07* Current Liab 79.8 Tot 10 6.3 mil $18.03* LT Debt 122.9 1Q11 1.7 mil $23.23* Other 59.1 2Q11 2.0 mil $22.06*EQUITY: Com 987.7 3Q11 1.6 mil $20.60* # Shares Com 80.6 mil 4Q11 # Shrs Ful Dil 92.8 mil (1) Tot 11
9/30/2011
Prod began Dec-09
Silver Standard - Page 2 © 2011 SILVER STOCK ANALYST http://www.SilverStockAnalyst.com
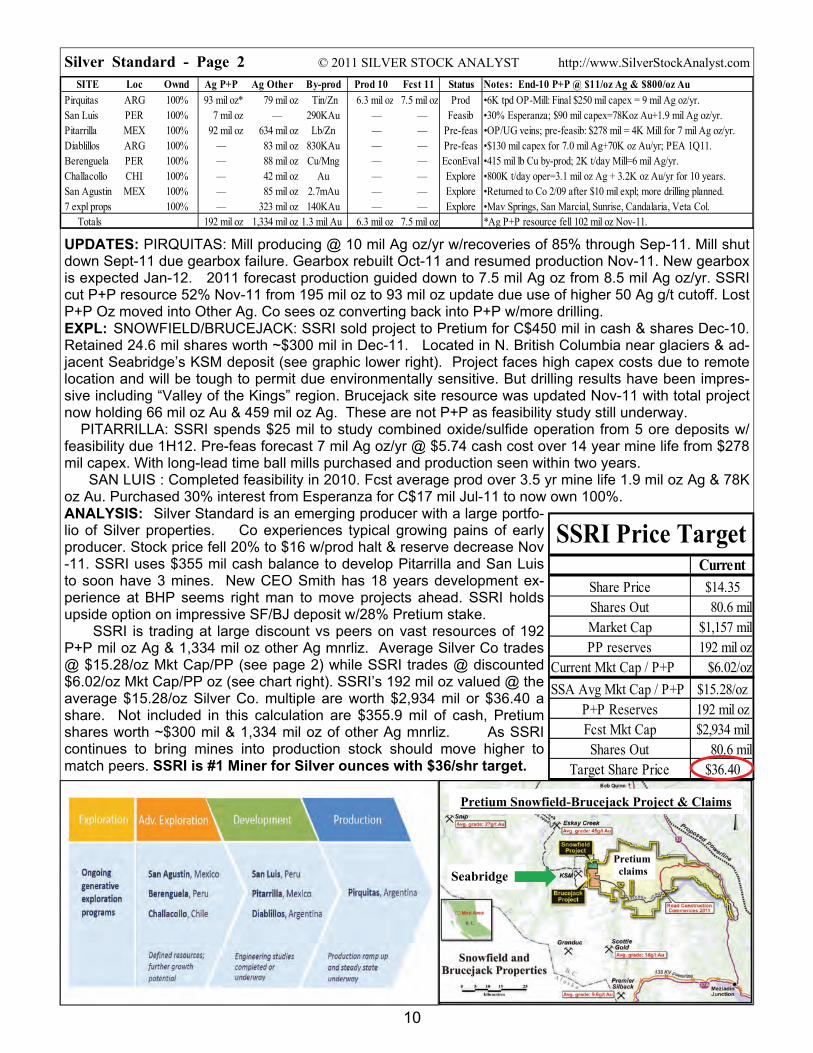
UPDATES: PIRQUITAS: Mill producing @ 10 mil Ag oz/yr w/recoveries of 85% through Sep-11. Mill shut down Sept-11 due gearbox failure. Gearbox rebuilt Oct-11 and resumed production Nov-11. New gearbox is expected Jan-12. 2011 forecast production guided down to 7.5 mil Ag oz from 8.5 mil Ag oz/yr. SSRI cut P+P resource 52% Nov-11 from 195 mil oz to 93 mil oz update due use of higher 50 Ag g/t cutoff. Lost P+P Oz moved into Other Ag. Co sees oz converting back into P+P w/more drilling. EXPL: SNOWFIELD/BRUCEJACK: SSRI sold project to Pretium for C$450 mil in cash & shares Dec-10. Retained 24.6 mil shares worth ~$300 mil in Dec-11. Located in N. British Columbia near glaciers & ad-jacent Seabridge’s KSM deposit (see graphic lower right). Project faces high capex costs due to remote location and will be tough to permit due environmentally sensitive. But drilling results have been impres-sive including “Valley of the Kings” region. Brucejack site resource was updated Nov-11 with total project now holding 66 mil oz Au & 459 mil oz Ag. These are not P+P as feasibility study still underway. PITARRILLA: SSRI spends $25 mil to study combined oxide/sulfide operation from 5 ore deposits w/feasibility due 1H12. Pre-feas forecast 7 mil Ag oz/yr @ $5.74 cash cost over 14 year mine life from $278 mil capex. With long-lead time ball mills purchased and production seen within two years. SAN LUIS : Completed feasibility in 2010. Fcst average prod over 3.5 yr mine life 1.9 mil oz Ag & 78K oz Au. Purchased 30% interest from Esperanza for C$17 mil Jul-11 to now own 100%. ANALYSIS: Silver Standard is an emerging producer with a large portfo-lio of Silver properties. Co experiences typical growing pains of early producer. Stock price fell 20% to $16 w/prod halt & reserve decrease Nov-11. SSRI uses $355 mil cash balance to develop Pitarrilla and San Luis to soon have 3 mines. New CEO Smith has 18 years development ex-perience at BHP seems right man to move projects ahead. SSRI holds upside option on impressive SF/BJ deposit w/28% Pretium stake. SSRI is trading at large discount vs peers on vast resources of 192 P+P mil oz Ag & 1,334 mil oz other Ag mnrliz. Average Silver Co trades @ $15.28/oz Mkt Cap/PP (see page 2) while SSRI trades @ discounted $6.02/oz Mkt Cap/PP oz (see chart right). SSRI’s 192 mil oz valued @ the average $15.28/oz Silver Co. multiple are worth $2,934 mil or $36.40 a share. Not included in this calculation are $355.9 mil of cash, Pretium shares worth ~$300 mil & 1,334 mil oz of other Ag mnrliz. As SSRI continues to bring mines into production stock should move higher to match peers. SSRI is #1 Miner for Silver ounces with $36/shr target.
10
SITE Loc Ownd Ag P+P Ag Other By-prod Prod 10 Fcst 11 Status Notes: End-10 P+P @ $11/oz Ag & $800/oz Au
Pirquitas ARG 100% 93 mil oz* 79 mil oz Tin/Zn 6.3 mil oz 7.5 mil oz Prod •6K tpd OP-Mill: Final $250 mil capex = 9 mil Ag oz/yr. San Luis PER 100% 7 mil oz — 290KAu — — Feasib •30% Esperanza; $90 mil capex=78Koz Au+1.9 mil Ag oz/yr. Pitarrilla MEX 100% 92 mil oz 634 mil oz Lb/Zn — — Pre-feas •OP/UG veins; pre-feasib: $278 mil = 4K Mill for 7 mil Ag oz/yr. Diablillos ARG 100% — 83 mil oz 830KAu — — Pre-feas •$130 mil capex for 7.0 mil Ag+70K oz Au/yr; PEA 1Q11. Berenguela PER 100% — 88 mil oz Cu/Mng — — EconEval •415 mil lb Cu by-prod; 2K t/day Mill=6 mil Ag/yr. Challacollo CHI 100% — 42 mil oz Au — — Explore •800K t/day oper=3.1 mil oz Ag + 3.2K oz Au/yr for 10 years. San Agustin MEX 100% — 85 mil oz 2.7mAu — — Explore •Returned to Co 2/09 after $10 mil expl; more drilling planned. 7 expl props 100% — 323 mil oz 140KAu — — Explore •Mav Springs, San Marcial, Sunrise, Candalaria, Veta Col. Totals 192 mil oz 1,334 mil oz 1.3 mil Au 6.3 mil oz 7.5 mil oz *Ag P+P resource fell 102 mil oz Nov-11.
Pretium Snowfield-Brucejack Project & Claims
Seabridge
CurrentShare Price $14.35Shares Out 80.6 milMarket Cap $1,157 milPP reserves 192 mil oz
Current Mkt Cap / P+P $6.02/oz
SSA Avg Mkt Cap / P+P $15.28/ozP+P Reserves 192 mil ozFcst Mkt Cap $2,934 milShares Out 80.6 mil
Target Share Price $36.40
SSRI Price Target
Pretium claims
First Majestic NYSE: AG DIV: Nil RECENT: $15.76
First Majestic - Page 1 © 2011 SILVER STOCK ANALYST http://wwww.SilverStockAnalyst.com
11
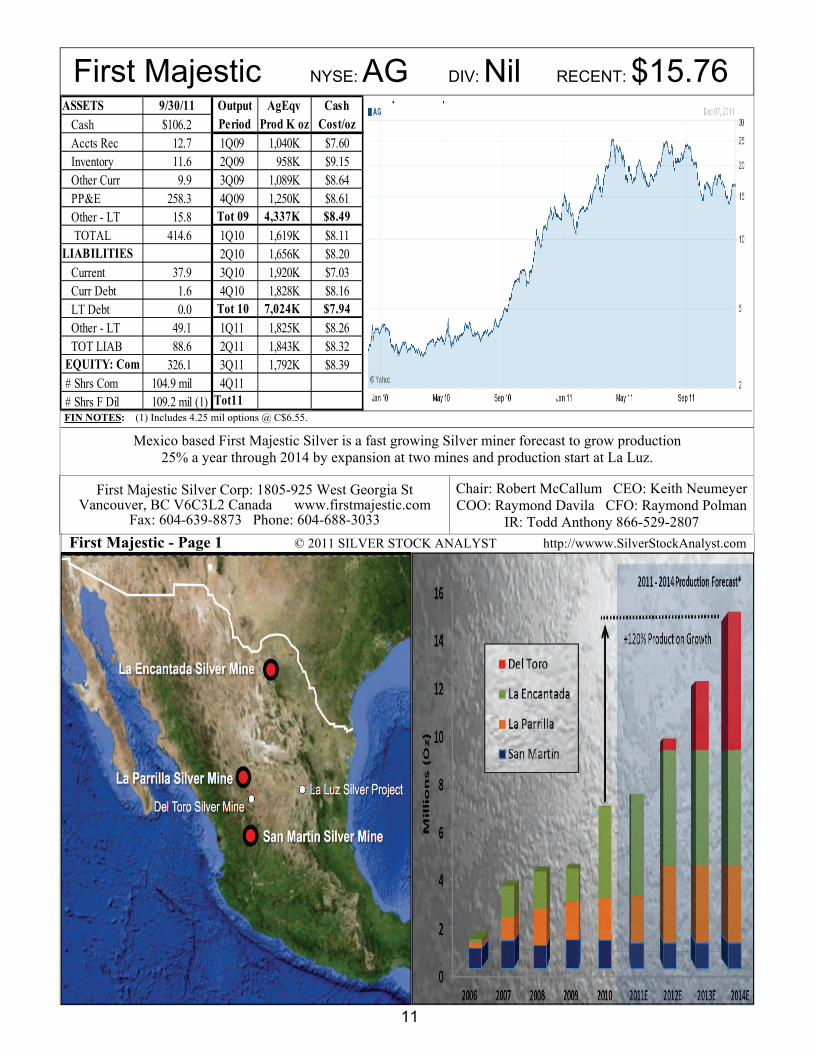
Mexico based First Majestic Silver is a fast growing Silver miner forecast to grow production 25% a year through 2014 by expansion at two mines and production start at La Luz.
FIN NOTES: (1) Includes 4.25 mil options @ C$6.55.
First Majestic Silver Corp: 1805-925 West Georgia St Vancouver, BC V6C3L2 Canada www.firstmajestic.com
Fax: 604-639-8873 Phone: 604-688-3033
Chair: Robert McCallum CEO: Keith Neumeyer COO: Raymond Davila CFO: Raymond Polman
IR: Todd Anthony 866-529-2807
ASSETS Output AgEqv Cash Cash $106.2 Period Prod K oz Cost/oz Accts Rec 12.7 1Q09 1,040K $7.60 Inventory 11.6 2Q09 958K $9.15 Other Curr 9.9 3Q09 1,089K $8.64 PP&E 258.3 4Q09 1,250K $8.61 Other - LT 15.8 Tot 09 4,337K $8.49
TOTAL 414.6 1Q10 1,619K $8.11LIABILITIES 2Q10 1,656K $8.20 Current 37.9 3Q10 1,920K $7.03 Curr Debt 1.6 4Q10 1,828K $8.16 LT Debt 0.0 Tot 10 7,024K $7.94 Other - LT 49.1 1Q11 1,825K $8.26 TOT LIAB 88.6 2Q11 1,843K $8.32 EQUITY: Com 326.1 3Q11 1,792K $8.39 # Shrs Com 104.9 mil 4Q11 # Shrs F Dil 109.2 mil (1) Tot11
9/30/11
First Majestic – Page 2 SILVER STOCK ANALYST http://www.SilverStockAnalyst.com
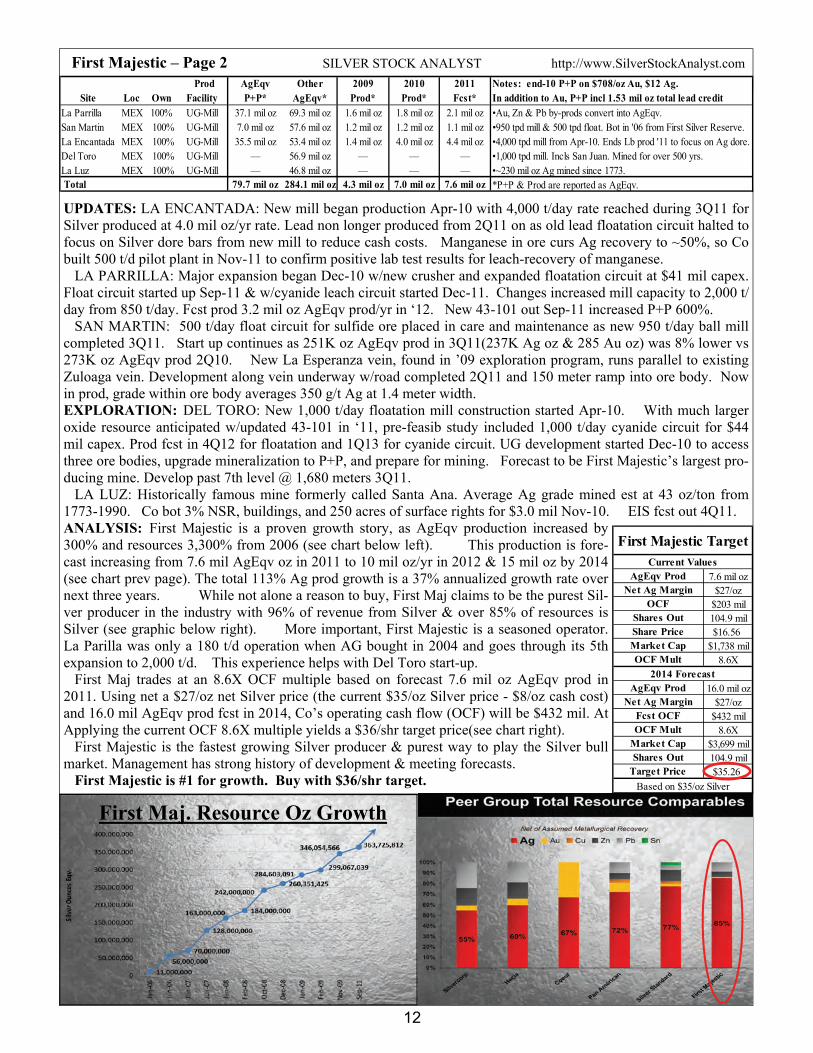
UPDATES: LA ENCANTADA: New mill began production Apr-10 with 4,000 t/day rate reached during 3Q11 for Silver produced at 4.0 mil oz/yr rate. Lead non longer produced from 2Q11 on as old lead floatation circuit halted to focus on Silver dore bars from new mill to reduce cash costs. Manganese in ore curs Ag recovery to ~50%, so Co built 500 t/d pilot plant in Nov-11 to confirm positive lab test results for leach-recovery of manganese. LA PARRILLA: Major expansion began Dec-10 w/new crusher and expanded floatation circuit at $41 mil capex. Float circuit started up Sep-11 & w/cyanide leach circuit started Dec-11. Changes increased mill capacity to 2,000 t/day from 850 t/day. Fcst prod 3.2 mil oz AgEqv prod/yr in ‘12. New 43-101 out Sep-11 increased P+P 600%. SAN MARTIN: 500 t/day float circuit for sulfide ore placed in care and maintenance as new 950 t/day ball mill completed 3Q11. Start up continues as 251K oz AgEqv prod in 3Q11(237K Ag oz & 285 Au oz) was 8% lower vs 273K oz AgEqv prod 2Q10. New La Esperanza vein, found in ’09 exploration program, runs parallel to existing Zuloaga vein. Development along vein underway w/road completed 2Q11 and 150 meter ramp into ore body. Now in prod, grade within ore body averages 350 g/t Ag at 1.4 meter width. EXPLORATION: DEL TORO: New 1,000 t/day floatation mill construction started Apr-10. With much larger oxide resource anticipated w/updated 43-101 in ‘11, pre-feasib study included 1,000 t/day cyanide circuit for $44 mil capex. Prod fcst in 4Q12 for floatation and 1Q13 for cyanide circuit. UG development started Dec-10 to access three ore bodies, upgrade mineralization to P+P, and prepare for mining. Forecast to be First Majestic’s largest pro-ducing mine. Develop past 7th level @ 1,680 meters 3Q11. LA LUZ: Historically famous mine formerly called Santa Ana. Average Ag grade mined est at 43 oz/ton from 1773-1990. Co bot 3% NSR, buildings, and 250 acres of surface rights for $3.0 mil Nov-10. EIS fcst out 4Q11. ANALYSIS: First Majestic is a proven growth story, as AgEqv production increased by 300% and resources 3,300% from 2006 (see chart below left). This production is fore-cast increasing from 7.6 mil AgEqv oz in 2011 to 10 mil oz/yr in 2012 & 15 mil oz by 2014 (see chart prev page). The total 113% Ag prod growth is a 37% annualized growth rate over next three years. While not alone a reason to buy, First Maj claims to be the purest Sil-ver producer in the industry with 96% of revenue from Silver & over 85% of resources is Silver (see graphic below right). More important, First Majestic is a seasoned operator. La Parilla was only a 180 t/d operation when AG bought in 2004 and goes through its 5th expansion to 2,000 t/d. This experience helps with Del Toro start-up. First Maj trades at an 8.6X OCF multiple based on forecast 7.6 mil oz AgEqv prod in 2011. Using net a $27/oz net Silver price (the current $35/oz Silver price - $8/oz cash cost) and 16.0 mil AgEqv prod fcst in 2014, Co’s operating cash flow (OCF) will be $432 mil. At Applying the current OCF 8.6X multiple yields a $36/shr target price(see chart right). First Majestic is the fastest growing Silver producer & purest way to play the Silver bull market. Management has strong history of development & meeting forecasts. First Majestic is #1 for growth. Buy with $36/shr target.
12
First Maj. Resource Oz Growth
Prod AgEqv Other 2009 2010 2011 Notes: end-10 P+P on $708/oz Au, $12 Ag.Site Loc Own Facility P+P* AgEqv* Prod* Prod* Fcst* In addition to Au, P+P incl 1.53 mil oz total lead credit
La Parrilla MEX 100% UG-Mill 37.1 mil oz 69.3 mil oz 1.6 mil oz 1.8 mil oz 2.1 mil oz •Au, Zn & Pb by-prods convert into AgEqv.San Martin MEX 100% UG-Mill 7.0 mil oz 57.6 mil oz 1.2 mil oz 1.2 mil oz 1.1 mil oz •950 tpd mill & 500 tpd float. Bot in '06 from First Silver Reserve.La Encantada MEX 100% UG-Mill 35.5 mil oz 53.4 mil oz 1.4 mil oz 4.0 mil oz 4.4 mil oz •4,000 tpd mill from Apr-10. Ends Lb prod '11 to focus on Ag dore.Del Toro MEX 100% UG-Mill — 56.9 mil oz — — — •1,000 tpd mill. Incls San Juan. Mined for over 500 yrs.La Luz MEX 100% UG-Mill — 46.8 mil oz — — — •~230 mil oz Ag mined since 1773. Total 79.7 mil oz 284.1 mil oz 4.3 mil oz 7.0 mil oz 7.6 mil oz *P+P & Prod are reported as AgEqv.
AgEqv Prod 7.6 mil ozNet Ag Margin $27/oz
OCF $203 milShares Out 104.9 milShare Price $16.56Market Cap $1,738 milOCF Mult 8.6X
AgEqv Prod 16.0 mil ozNet Ag Margin $27/oz
Fcst OCF $432 milOCF Mult 8.6X
Market Cap $3,699 milShares Out 104.9 mil
Target Price $35.26
First Majestic Target
Based on $35/oz Silver
Current Values
2014 Forecast
Tahoe Resources PINK: THOEF DIV: Nil RECENT: $18.87
Tahoe Resources - Page 1 ©2011 SILVER STOCK ANALYST http://www.SilverStockAnalyst.com
13
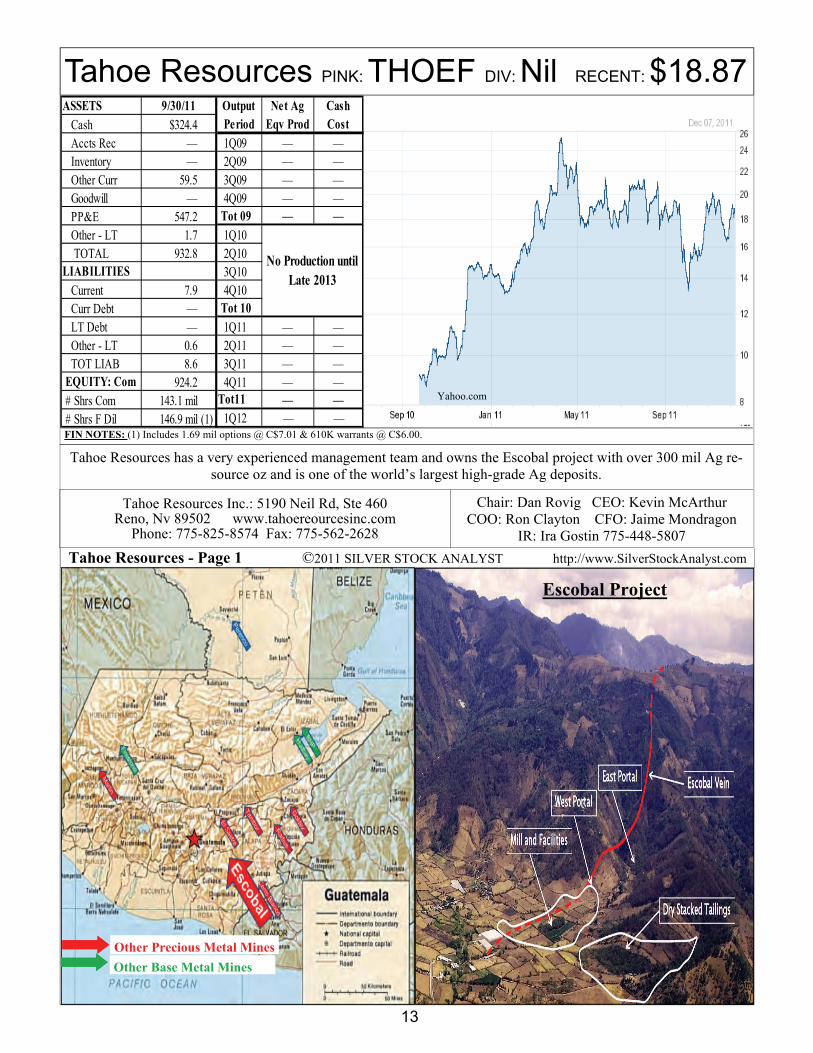
Tahoe Resources has a very experienced management team and owns the Escobal project with over 300 mil Ag re-source oz and is one of the world’s largest high-grade Ag deposits.
FIN NOTES: (1) Includes 1.69 mil options @ C$7.01 & 610K warrants @ C$6.00.
Tahoe Resources Inc.: 5190 Neil Rd, Ste 460 Reno, Nv 89502 www.tahoereourcesinc.com
Phone: 775-825-8574 Fax: 775-562-2628
Chair: Dan Rovig CEO: Kevin McArthur COO: Ron Clayton CFO: Jaime Mondragon
IR: Ira Gostin 775-448-5807
ASSETS Output Net Ag Cash Cash $324.4 Period Eqv Prod Cost Accts Rec — 1Q09 — — Inventory — 2Q09 — — Other Curr 59.5 3Q09 — — Goodwill — 4Q09 — — PP&E 547.2 Tot 09 — — Other - LT 1.7 1Q10 TOTAL 932.8 2Q10LIABILITIES 3Q10 Current 7.9 4Q10 Curr Debt — Tot 10 LT Debt — 1Q11 — — Other - LT 0.6 2Q11 — — TOT LIAB 8.6 3Q11 — — EQUITY: Com 924.2 4Q11 — — # Shrs Com 143.1 mil Tot11 — — # Shrs F Dil 146.9 mil (1) 1Q12 — —
No Production until Late 2013
9/30/11
Escobal Project
Other Base Metal Mines
Other Precious Metal Mines
Yahoo.com
Tahoe Resources – Page 2 SILVER STOCK ANALYST http://www.SilverStockAnalyst.com
TAHOE HISTORY: Tahoe bot Escobal deposit from Goldcorp for total $505 mil & went public to finance deal May-10: sold 63.8 mil shares at C$6.00 to raise C$382 mil. Then issued 44 mil shares to Goldcorp & paid $253 mil cash to close deal. Goldcorp owns 41% of company. Dec-10: sold 25.0 mil shares at C$14.10 for C$352 mil. Tahoe’s CEO is Kevin McArthur, Goldcorp’s CEO until 2008. Prior to Goldcorp, McArthur was CEO of Glamis Gold from 1998-06 until Glamis was acquired by Goldcorp. McArthur grew Glamis from small producer with Mkt Cap of $200 mil to 400K+ Au oz/yr & $8 bil Mkt Cap in 7 yrs before merger with Goldcorp.
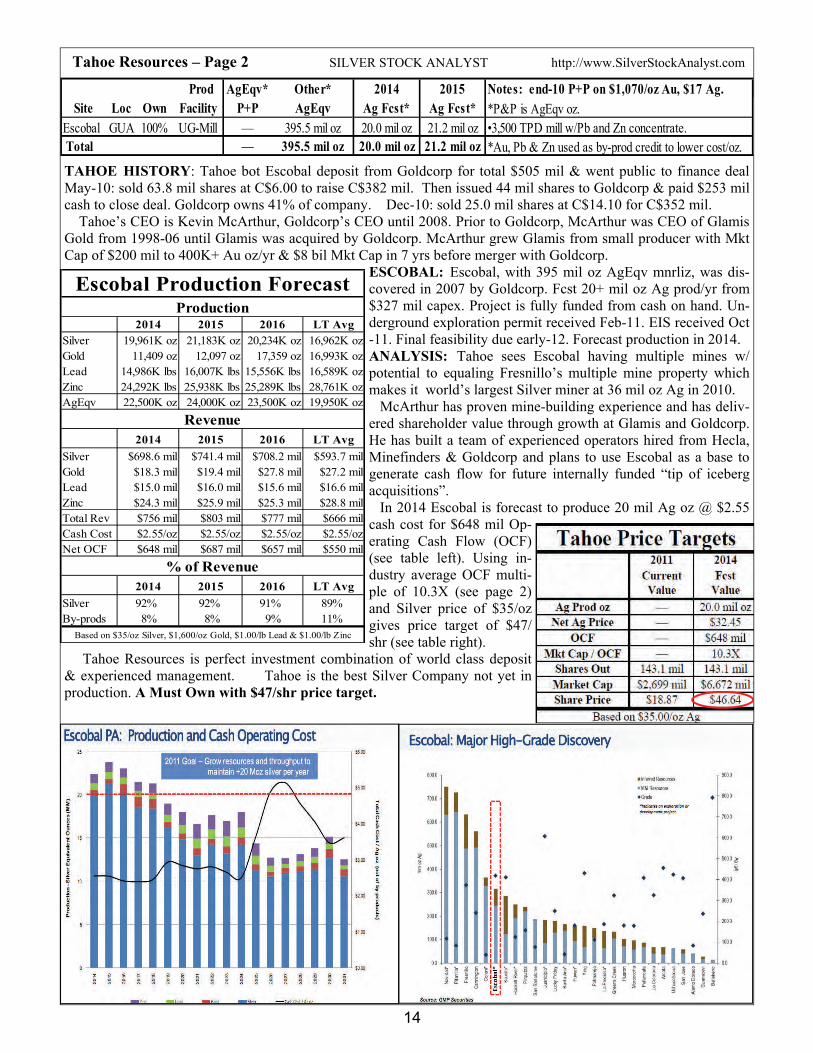
ESCOBAL: Escobal, with 395 mil oz AgEqv mnrliz, was dis-covered in 2007 by Goldcorp. Fcst 20+ mil oz Ag prod/yr from $327 mil capex. Project is fully funded from cash on hand. Un-derground exploration permit received Feb-11. EIS received Oct-11. Final feasibility due early-12. Forecast production in 2014. ANALYSIS: Tahoe sees Escobal having multiple mines w/potential to equaling Fresnillo’s multiple mine property which makes it world’s largest Silver miner at 36 mil oz Ag in 2010. McArthur has proven mine-building experience and has deliv-ered shareholder value through growth at Glamis and Goldcorp. He has built a team of experienced operators hired from Hecla, Minefinders & Goldcorp and plans to use Escobal as a base to generate cash flow for future internally funded “tip of iceberg acquisitions”. In 2014 Escobal is forecast to produce 20 mil Ag oz @ $2.55 cash cost for $648 mil Op-erating Cash Flow (OCF) (see table left). Using in-dustry average OCF multi-ple of 10.3X (see page 2) and Silver price of $35/oz gives price target of $47/shr (see table right).
Tahoe Resources is perfect investment combination of world class deposit & experienced management. Tahoe is the best Silver Company not yet in production. A Must Own with $47/shr price target.
14
2014 2015 2016 LT AvgSilver 19,961K oz 21,183K oz 20,234K oz 16,962K ozGold 11,409 oz 12,097 oz 17,359 oz 16,993K ozLead 14,986K lbs 16,007K lbs 15,556K lbs 16,589K ozZinc 24,292K lbs 25,938K lbs 25,289K lbs 28,761K ozAgEqv 22,500K oz 24,000K oz 23,500K oz 19,950K oz
2014 2015 2016 LT Avg
Silver $698.6 mil $741.4 mil $708.2 mil $593.7 milGold $18.3 mil $19.4 mil $27.8 mil $27.2 milLead $15.0 mil $16.0 mil $15.6 mil $16.6 milZinc $24.3 mil $25.9 mil $25.3 mil $28.8 milTotal Rev $756 mil $803 mil $777 mil $666 milCash Cost $2.55/oz $2.55/oz $2.55/oz $2.55/ozNet OCF $648 mil $687 mil $657 mil $550 mil
2014 2015 2016 LT Avg
Silver 92% 92% 91% 89%By-prods 8% 8% 9% 11%
Revenue
% of Revenue
Based on $35/oz Silver, $1,600/oz Gold, $1.00/lb Lead & $1.00/lb Zinc
Production
Escobal Production Forecast
Prod AgEqv* Other* 2014 2015 Notes: end-10 P+P on $1,070/oz Au, $17 Ag.Site Loc Own Facility P+P AgEqv Ag Fcst* Ag Fcst* *P&P is AgEqv oz.
Escobal GUA 100% UG-Mill — 395.5 mil oz 20.0 mil oz 21.2 mil oz •3,500 TPD mill w/Pb and Zn concentrate. Total — 395.5 mil oz 20.0 mil oz 21.2 mil oz *Au, Pb & Zn used as by-prod credit to lower cost/oz.
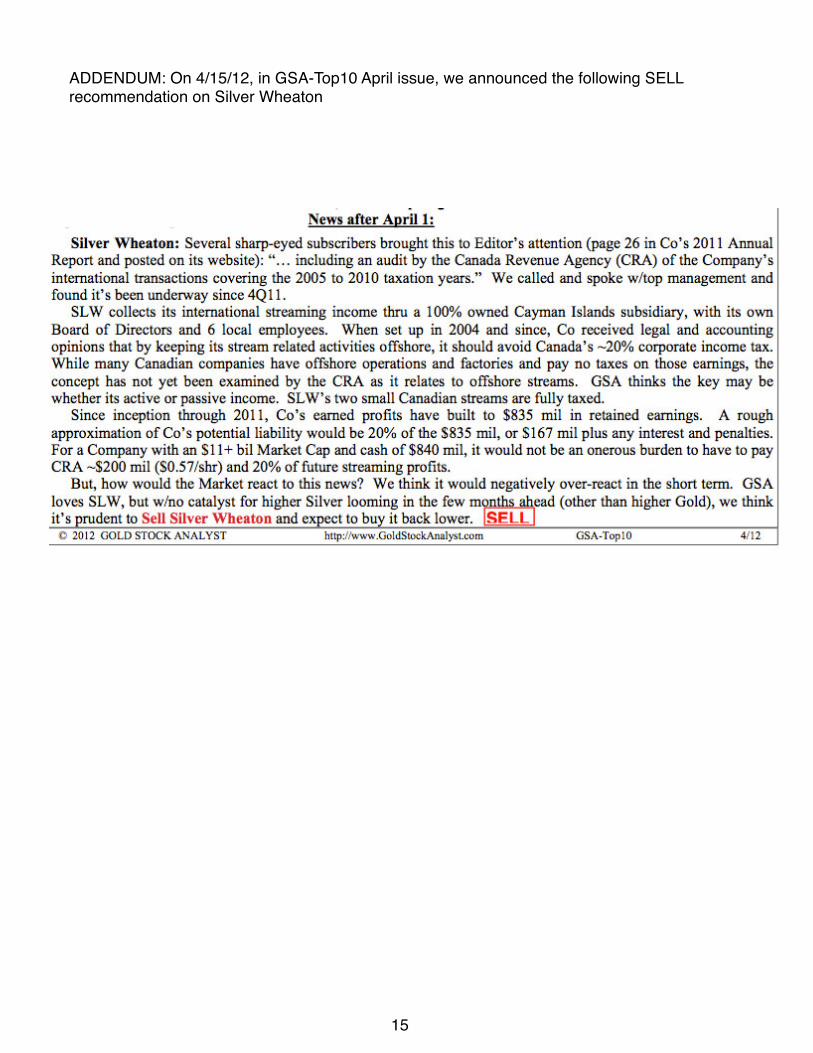
ADDENDUM: On 4/15/12, in GSA-Top10 April issue, we announced the following SELL recommendation on Silver Wheaton
15