Embed Size (px)
Citation preview

Safety in Mines Research Advisory Committee
An investigation into the support systems in South African collieries
Final Report
I. Canbulat*, A. Wilkinson*,G. Prohaska*, M. Mnisi** and N. Singh**
*Groundwork Consulting (Pty) Ltd
**CSIR Mining Technology
Research Agency : CSIR Division of Mining Technology Contractor : Groundwork Consulting (Pty) Ltd Project No : SIM 020205 Date : March 2005 Report No : CR231/0205/SIM302

2
Executive summary
A study of falls of ground in South African collieries by van der Merwe et al. (2000) concluded
that the majority of falls of ground occur under supported roof. For this reason it was decided
that roof support systems should be investigated for the purpose of obtaining an understanding
of the fundamental mechanisms of roof support systems and developing guidelines and design
methodologies for their improvement. To this end all of the currently available roof bolt support
elements and related machinery were evaluated underground in three different rock types,
namely sandstone, shale, and coal.
Roof bolts are available in many different forms. Full-column single-resin bolts, full-column slow-
fast combination resin bolts, resin point anchors, and mechanical anchors are the most widely
used support systems in South Africa.
There are five important components of a bolting system, namely:
• Resin;
• Bolt;
• Hole;
• Machinery/equipment; and
• Rock type
As part of this study, important parameters of these five components were investigated.
A detailed literature review showed that since the introduction of mechanical bolts in the 1940s
a significant amount of research has been carried out on understanding the behaviour of roof
bolts. Today, almost all coal mine roofs in South Africa use roof bolts for roof support.
In the early years, the design of roof bolt patterns was based on local experience and the
judgement of mining personnel. The suspension mechanism was the most easily understood
and most widely used roof bolting mechanism. However, significant advances have been made
over the last 20 years in the development of resin anchors, tendon elements and installation
hardware, advances which have resulted in an increased use of full column resin bolts.
The design of roof bolt patterns has also improved, and four main rock reinforcement
techniques have been developed: simple skin control, beam building, suspension and keying.

3
The geology and the stress levels determine the mechanism required for a particular
application.
Investigations into the causes of roof falls in South African collieries highlighted that the roof bolt
densities were relatively low compared to those found in the USA, the UK, and Australia. It was
concluded, therefore, that the main cause of falls of ground was the excessive bolt spacing and
the skin failures between the bolts that this brought about.
The importance of tensioning roof bolts remains a subject of controversy. This report shows that
the critical roof deformations in South African collieries are relatively small, therefore tensioned
roof bolts may well be required to reduce roof deformations after the installation of support.
Short encapsulation pull tests showed that pre-tensioning reduced the system stiffness, though
the point was made that the testing procedure may not be well suited to evaluating tensioned
bolts and therefore may have produced sub-standard results.
The selection of roof bolt type for different geological environments is well documented.
However, the changing conditions underground must be determined and the design and the
support system have to be modified accordingly. Therefore, widespread instrumentation and
vigilant visual observations are important for ensuring safety and stability in coal mines.
While the effect of roof bolt diameter on support performance is well understood, controversy
remains over the correct length of the roof bolts. Since skin failures (< 0.5 m thick) are more
common in South Africa (Canbulat and Jack, 1998, van der Merwe and Madden, 2002) than
larger roof falls, short roof bolts for skin control may be an effective support for a stiff system.
The length of roof bolts, however, should be determined through in situ monitoring and
assessment of the roof strata.
Despite the fact that roof bolting has been the most researched aspect of coal mining, falls of
ground remain the major cause of fatalities in South African coal mines. There is no commonly
accepted design approach for underground coal mines. Roof bolts have been found to behave
differently under different loading conditions, despite being tested in fully controlled
environments in laboratories. The most important key to the design of roof support systems is a
better understanding of roof behaviour in different geotechnical environments through
continuous in situ monitoring.
A detailed investigation into the specifications of roofbolters that are currently being used
indicated that the quality of installation of a support system is directly related to the performance
of the equipment that is used to install the bolts. For this reason the performance of bolting

4
equipment was investigated as part of this study in order that the range and relative importance
of the various machine parameters could be ascertained. The study showed that there are no
standards in South Africa for the parameters investigated (speeds, torque, and thrust). The
variations in these parameters were found to be greater than previously believed.
The relationship between hole profile and speed, torque, and thrust was investigated. The
following values for roofbolter parameters are recommended for optimally producing rough
walled holes in South African coal mines:
Spinning speed 450 rpm
Torque 240 Nm
Thrust 15 kN
The performance of roof bolts that are currently supplied to South African mines was also
investigated. A series of short encapsulated pull tests in shale indicated that, on average, bond
strengths obtained from the roof bolts supplied by Manufacturer “C” (referred to in the report)
were approximately 18 per cent and 28 per cent greater than those obtained from the roof bolts
supplied by Manufacturers “A” and “B”, respectively.
To determine whether variations in the profile of bolts supplied by the different manufacturers
could account for the differences in performance, the bolt-core diameters and rib diameters from
different bolt manufacturers in South Africa were measured.
The parameters that determine the contact strength between bolt and resin are rib-height,
spacing between the ribs, and the rib angle. An investigation was conducted into the
dimensions of roof bolts that are used currently. The results showed insignificant differences
between the parameters that determine the bolt profile of South African roof bolts. Owing to the
physical similarity between the bolts studied, it was not possible to determine the influence of
these parameters. On specifically manufactured or imported bolts that have a different
configuration, it is recommended that a laboratory-testing programme be carried out to
determine the effect of these parameters on the performance of roof bolts being used in South
Africa.
The effect of rib angle was investigated and the results of a literature search showed that, as
the rib angle increases away from normal to the bolt axis, so the pull-out load of the bolt
decreases. It is therefore suggested that, in order to achieve relatively high pull-out loads, low
rib angles on the bolts are required. This was confirmed by laboratory tests on different bolts
with different rib angles in Australia (O’Brien, 2003). However, lowering the rib angle may result

5
in poor resin mixing performances. It is therefore recommended that further work on the effect of
bolt profile on rockbolt performance be carried out, with the aim of achieving failure on the
rockbolt-resin interface. It is also recommended that the quality of resin mixing should be
investigated for different rib angles in order that the most effective rib angles for roof bolts can
be determined. Unfortunately, because rib configurations in South African bolt types are very
similar and because testing took place in an underground environment (uncontrolled
conditions), the effect of rib angle, rib height and thickness and spacing between the ribs could
not be quantified. It is, therefore, suggested that these tests should be conducted in a controlled
laboratory environment.
A conceptual model was developed to determine the effect of bolt profiles. This model indicated
that maximum pull-out loads can be achieved between the resin and roof bolt when:
• The ribs are relatively high;
• The distance between the ribs is relatively low; and
• The ribs are relatively thick.
An attempt to determine the effect of spinning parameters on resin characteristics showed that
the gelling time decreases with an increase in free rotation speed. It is therefore suggested that
the resin spinning times should be adjusted to improve resin performance.
A series of short encapsulated pull tests indicated that in the majority of pull tests, failure took
place at the rock-resin interface, indicating that the rock failed before the resin shear strength
had been reached. It is therefore suggested that the strength of resin currently being used in
South Africa is adequate. However, the stiffness of the system of which resin is a part should be
determined by short encapsulated pull tests.
The conceptual model developed as part of this project was used to determine the effect of
resin in the support system. It is concluded that the failure characteristics of a roof bolting
system will be determined by the shear strength of bolt, resin, and rock.
• The failure will take place at the resin-rock interface when the shear strength of the rock
is lower than the resin (rock will fail).
• The failure will take place at either the resin-rock or resin-bolt interface when the resin
shear strength is the lowest in the system.
• When the resin shear strength is the lowest in the system, the failure will be determined
by the roughness of the hole and the bolt profile.

6
The test results showed that the reinforcing system using bolts from all four manufacturers
performed almost identically in sandstone, but performed in different ways in the other rock
types. The bolts from Manufacturer “A” performed slightly better in coal and shale rock types
than the bolts from other manufacturers.
The performance of resins that are currently being used in South African collieries was also
investigated by means of short encapsulated pull tests. The results indicated that in sandstone
the resin types from the two different manufacturers performed similarly. However, the strength
of slow (5/10-minute) resins from both manufacturers was much lower than that of fast resins.
The results also indicated that 15-second and 30-second resins from Manufacturer “A” achieved
higher stiffnesses than resins from Manufacturer “B” in sandstone and coal. In shale, both resins
from each of the manufacturers performed in a similar manner.
In order to investigate the effect of bit types, a series of short encapsulated pull tests were
conducted. The results showed that the 2-prong bit outperformed the spade bit in sandstone
and shale rock types. However, the annuli obtained from the 2-prong bit were always greater
than the spade bit. It is thought that this is because 2-prong bits drilled a rougher hole profile.
Both the stiffness and the maximum load obtained from the 2-prong bits was greater than for
the spade bits. These findings suggest that 2-prong bits are more effective in collieries than
spade bits are.
The effect of hole annulus was also investigated. The results show that an annulus between
2.8 mm 4.5 mm resulted in the most effective bond strengths. Another interesting point is that as
the annulus drops below 2 mm, it appears to have a negative effect on the grip factors.
The effect of wet and dry drilling was also investigated by means of short encapsulated pull
tests. The results showed that bond strengths and overall support stiffnesses are greater with
the use of the wet drilling in all three resin types.
Tensioned versus non-tensioned bolts is one of the most discussed topics in roof bolting. A
number of papers have been published on this topic in Australia and the US. An additional 25
short encapsulated pull tests were conducted to determine the effect of tensioning on bond
strength. The results showed that non-tensioned roof bolts achieved significantly higher bond
strengths than the tensioned bolts in sandstone and shale roofs. Similarly, the overall support
stiffness of non-tensioned roof bolts was significantly greater than that of the tensioned roof
bolts. It is thought that, with relatively short bond length of 250 mm, the bonding could easily be
damaged when the bolt is tensioned. It is therefore suggested that a new testing procedure
should be developed for testing the performance of tensioned bolts.

7
The effect of rock type on support performance was also investigated by means of a series of
short encapsulated pull tests. The results from these tests highlight the very distinct differences
between bolt system performances in different rock types. Sandstone was shown in the tests to
produce significantly better results than shale and coal. From these results it can be concluded
that rock type is one of the primary factors influencing the support system performance.
A new support system design methodology has also been developed, on the basis of the roof
softening concept. This concept highlighted that to maintain the stability of an underground
opening, it is essential to keep the immediate roof-softening zone stable. Roof bolts in this zone
force all the bolted layers to sag by the same amount; the layers within the bolting range thus
act like a solid beam. Building such a beam is actually the ultimate goal of roof bolting where a
beam building effect is the required mechanism.
In other SIMRAC projects, a total of 54 intersection and roadway sites were evaluated from
mining depths of 32 m to 170 m, situated in significantly different geotechnical environments.
The heights of roof softening at these sites were calculated. The results showed that for a 40
per cent increase in the span, taken across the diagonal of an intersection, relative to the
roadway span, the magnitude of the displacement in the roof increased by a factor of four. The
results also showed no evidence (in intersections and roadways) of a substantial increase in the
height of bed separation. It was also found that the average height of roof softening measured
at 54 sites in South African collieries was 1.07 m, which is less than the roof bolt lengths
commonly used in South Africa. The new design methodology and above results indicated that
on average almost all supported roofs will be stable in South Africa, if the support is properly
installed.
Support system stiffness, which can be calculated from in situ short encapsulated pull tests, has
been found to be one of the most important parameters in the design and performance of
support system. In order to achieve the maximum performance of support systems, the
following support system stiffnesses have been recommended for different sizes of bolts. This
stiffness would be determined from in situ short encapsulation pull tests.
Bolt diameter
Required Support Stiffness for Non-tensioned bolts
(kN/mm) 20 mm 60
18 mm 50
16 mm 40

8
This investigation recommended that an extensive study into the shear strength of full column
resin bolts be undertaken.
An investigation into the quality control procedures of support systems was also conducted.
Quality control procedures for compliance with the design, support elements and quality of
installation are presented in the report. Recommendations for improving quality control
measures and for developing testing procedures for bolt system components, installation quality
and resin performance are provided.

9
Acknowledgements
The authors gratefully acknowledge the Safety in Mines Research Advisory Committee
(SIMRAC) of the Mine Health and Safety Council and co-operation given by many mines.
South African coal Rock Engineers, D. Minney, L. Munsamy, G Makusha, J.J. van Wijk, J.
Latilla, E. Wevell, D. Neal, D. Postma, B. Vorster, B.J. Madden, M. Spengler and many
others of Anglo Coal, Ingwe (BHP Billition), Xstrata Coal and Sasol Coal are thanked for their
support and assistance.
All suppliers in South Africa, Minova South Africa, Rockbolt Resins (Pty) Ltd, JAE (RSC)
Mining, Videx Mining Products and Grinaker are thanked for their willingness to test their
products as part of this study.
D O’Connor, N Henderson and A Odendaal are specially thanked for their support and
assistance in the project.
D. Viljoen and B. Engelbrecht of Xstrata Coal are also thanked for granting permission to use
some confidential information from Xstrata Coal.
The authors would also like to thank the following people and collieries. M. Elliott and the
staff of Spitzkop Colliery, J. Fullard and the staff of Boschmans Colliery, V. Maseko and the
staff of Greenside Colliery, N. Finch and the staff of Forzando Colliery, J. Standish-White and
the staff of Goedehoop Colliery, and J. Breytenbach and the staff of South Witbank Colliery.

10
Table of contents
Executive summary................................................................................2
Acknowledgements................................................................................9
Table of contents..................................................................................10
List of figures........................................................................................13
List of tables .........................................................................................17
1 Introduction ...............................................................................18
2 Literature review........................................................................20
2.1 Introduction .................................................................................................... 20
2.2 Types of roof bolts ......................................................................................... 21 2.2.1 Mechanical coupled roof bolts .................................................................................22 2.2.2 Resin point anchors .................................................................................................25 2.2.3 Full-column single-resin-type bolts ..........................................................................27 2.2.4 Full-column slow/fast-resin combination bolts .........................................................29 2.2.5 Friction rock stabilisers ............................................................................................31 2.2.6 Wooden dowels and fibreglass dowels....................................................................32 2.2.7 Spin-to-stall system..................................................................................................33 2.2.8 Current guidelines for the selection of roof bolt type................................................34 2.3 Theories of roof bolting support..................................................................... 38 2.3.1 Simple skin support..................................................................................................39 2.3.2 Suspension mechanism...........................................................................................39 2.3.3 Beam-building mechanism.......................................................................................41 2.3.4 Keying ......................................................................................................................41 2.4 Roof bolting design ........................................................................................ 42 2.4.1 Analytical methods...................................................................................................43 2.4.2 Field testing..............................................................................................................45 2.4.3 Numerical modelling ................................................................................................52 2.4.4 Roof bolt design based on geotechnical classification.............................................53 2.4.5 Physical modelling ...................................................................................................63 2.5 Geometric parameters ................................................................................... 65 2.5.1 Bolt length ................................................................................................................65 2.5.2 Bolt diameter............................................................................................................67 2.5.3 Bolt pattern...............................................................................................................69 2.5.4 Annulus size.............................................................................................................69 2.6 Tensioned versus non-tensioned bolts.......................................................... 71
2.7 Stiffness of roof support................................................................................. 72
2.8 Intersection support ....................................................................................... 73
2.9 Discussion and conclusions .......................................................................... 74

11
3 Testing procedures ...................................................................77
3.1 Short encapsulated pull testing ..................................................................... 77 3.1.1 Introduction ..............................................................................................................77 3.1.2 Bond strength...........................................................................................................77 3.1.3 Number of tests........................................................................................................78 3.1.4 Location ...................................................................................................................78 3.1.5 Equipment required..................................................................................................78 3.1.6 Measurements required ...........................................................................................81 3.1.7 Capsule preparation and measurement of embedment length................................82 3.1.8 Bolt installation procedure for SEPT using a drawbar .............................................84 3.1.9 Bolt installation procedure for SEPT installed over rockbolt ....................................85 3.1.10 Procedure for pulling the installed roof bolts............................................................86 3.1.11 Calculation of bond strength ....................................................................................89 3.2 Benchmark review of laboratory testing procedures for rockbolts ................ 89 3.2.1 Introduction ..............................................................................................................89 3.2.2 Laboratory assessment methods - United Kingdom ................................................89 3.2.3 Laboratory assessment methods - Australia............................................................98 3.2.4 Laboratory assessment methods – USA ...............................................................104 3.2.5 Conclusions ...........................................................................................................106
4 Specifications for roofbolters ................................................108
4.1 Introduction .................................................................................................. 108
4.2 Testing procedure........................................................................................ 108
4.3 Results ......................................................................................................... 110 4.3.1 Free rotation speed................................................................................................110 4.3.2 Rotation speed during drilling ................................................................................114 4.3.3 Resin spinning speed.............................................................................................116 4.3.4 Comparison of speeds ...........................................................................................119 4.3.5 Torque....................................................................................................................122 4.3.6 Thrust.....................................................................................................................125 4.3.7 Hole profile.............................................................................................................127 4.4 Specifications for roofbolters ....................................................................... 135
4.5 Wet and dry drilling ...................................................................................... 136
4.6 Determination of roofbolter performances using SEPT............................... 137
4.7 Conclusions ................................................................................................. 139
5 Performance of roof bolts.......................................................140
5.1 Performance of roof bolts manufactured in South Africa ............................ 140
5.2 Tensioned versus non-tensioned roof bolts ................................................ 141
5.3 Variation in roof bolt parameters ................................................................. 143
6 Performance of resin...............................................................148
6.1 Performance of resin manufactured in South Africa ................................... 148
6.2 Effect of spinning speed on resin setting..................................................... 151
7 Specifications for bolt and resin............................................156

12
8 Effect of bit, annulus and rock type.......................................161
8.1 Performance of bits...................................................................................... 161
8.2 Effect of hole annulus .................................................................................. 163
8.3 Effect of rock types ...................................................................................... 164
9 Support system selection and design...................................166
9.1 Support design methodology for beam building mechanism ...................... 166
9.2 Transverse shear stresses in beams........................................................... 167
9.3 Shear formulae ............................................................................................ 168
9.4 Shear stresses in beams ............................................................................. 170
9.5 Height of roof softening................................................................................ 174
9.6 Support system stiffness.............................................................................. 176
10 Quality control procedures.....................................................180
10.1 Support elements......................................................................................... 182
10.2 Compliance with the design......................................................................... 188
10.3 Installation.................................................................................................... 189
10.4 Number of tests required ............................................................................. 189
11 Conclusions and recommendations......................................194
12 References ...............................................................................203

13
List of figures
Figure 2—1 Saleable coal production in South Africa for the period 1915 to 1960 (after
Minerals Bureau, 2003)..................................................................................... 20 Figure 2—2 The length-capacity relationships that have evolved for rockbolts, cable bolts,
and ground anchors (after Windsor and Thompson, 1997) .............................. 22 Figure 2—3 Mechanical anchor bolt ..................................................................................... 23 Figure 2—4 Forces acting on the components of an expansion shell anchor (after Windsor
and Thompson, 1997) ....................................................................................... 24 Figure 2—5 Various expansion shell mechanisms (after Windsor and Thompson, 1997) ... 25 Figure 2—6 Point resin anchor ............................................................................................. 26 Figure 2—7 Full column resin bolt ........................................................................................ 28 Figure 2—8 Full-column slow/fast-resin combination bolts (the dual resin system) ............. 30 Figure 2—9 Split Set............................................................................................................. 32 Figure 2—10 Spin-to-stall installation procedure (after Minney and Munsamy, 1998) ........... 34 Figure 2—11 Selection of bolt type (after Maleki, 1992)......................................................... 36 Figure 2—12 Simple skin support........................................................................................... 39 Figure 2—13 Suspension mechanism .................................................................................... 40 Figure 2—14 Beam-building mechanism................................................................................ 41 Figure 2—15 Keying effect of bolting...................................................................................... 42 Figure 2—16 Compression zone created by keying (after Luo et al., 1998)........................... 42 Figure 2—17 Short encapsulated pull test equipment (after DMCIDC, 1996) ........................ 46 Figure 2—18 A typical short encapsulated pull test result ...................................................... 48 Figure 2—19 Instrumented roof bolt (after Signer and Jones 1990)....................................... 49 Figure 2—20 A tell tale (after Altounyan et al., 1997) ............................................................. 51 Figure 2—21 Numerical methods in rock engineering............................................................ 52 Figure 2—22 Components of the CMRR system.................................................................... 55 Figure 2—23 The impact splitting equipment ......................................................................... 59 Figure 2—24 Impact splitting unit rating calculation ............................................................... 60 Figure 2—25 Bolt pattern (after Spann and Napier, 1983) ..................................................... 64 Figure 2—26 Deflection compared to number of bolts (after Spann and Napier, 1983)......... 65 Figure 2—27 A typical plate load versus time in South African collieries (after Canbulat et
al., 2003) ........................................................................................................... 72 Figure 3—1 SEPT using a drawbar ...................................................................................... 80 Figure 3—2 SEPT installed over rockbolt ............................................................................. 80 Figure 3—3 Bolt preparation................................................................................................. 81

14
Figure 3—4 Borehole micrometer for measuring borehole diameter.................................... 82 Figure 3—5 Resin preparation.............................................................................................. 83 Figure 3—6 Resin pill resizing .............................................................................................. 83 Figure 3—7 Measurements for calculations, using a drawbar.............................................. 84 Figure 3—8 Measurements for calculations, installed over rockbolt..................................... 85 Figure 3—9 Double Embedment Tensile Test, sectional diagram of test assembly............. 92 Figure 3—10 Laboratory Short Encapsulation Pull Test – apparatus for Installation ............. 94 Figure 3—11 Laboratory Short Encapsulation Pull Test – apparatus for test ......................... 96 Figure 3—12 Example rock core pull test envelope ............................................................... 97 Figure 3—13 Laboratory push test arrangement .................................................................... 99 Figure 3—14 Short encapsulation pull test – laboratory and field set-up ............................. 101 Figure 4—1 Form used for recording data from equipment tests ....................................... 111 Figure 4—2 Free rotation speed - bolter A ......................................................................... 112 Figure 4—3 Free rotation speed - bolter B ......................................................................... 112 Figure 4—4 Free rotation speed - other bolters.................................................................. 113 Figure 4—5 Free rotation speed - all bolters ...................................................................... 113 Figure 4—6 Drilling speed - bolter A................................................................................... 114 Figure 4—7 Drilling speed - bolter B................................................................................... 115 Figure 4—8 Drilling speed - other bolters ........................................................................... 115 Figure 4—9 Drilling speed - all bolters................................................................................ 116 Figure 4—10 Resin spinning speed - bolter A ...................................................................... 117 Figure 4—11 Resin spinning speed - bolter B ...................................................................... 117 Figure 4—12 Resin spinning speed - other bolters............................................................... 118 Figure 4—13 Resin spinning speed - all bolters ................................................................... 118 Figure 4—14 Speed comparisons – for 40 type-“A” bolters.................................................. 119 Figure 4—15 Speed comparisons – for remaining 39 type-“A” bolters................................. 120 Figure 4—16 Speed comparisons – bolter B ........................................................................ 121 Figure 4—17 Speed comparisons - other bolters ................................................................. 121 Figure 4—18 Torque - bolter A ............................................................................................. 123 Figure 4—19 Torque - bolter B ............................................................................................. 123 Figure 4—20 Torque - other bolters...................................................................................... 124 Figure 4—21 Torque - all bolters .......................................................................................... 124 Figure 4—22 Thrust - bolter A .............................................................................................. 125 Figure 4—23 Thrust - bolter B .............................................................................................. 126 Figure 4—24 Thrust - other bolters....................................................................................... 126 Figure 4—25 Thrust - all bolters ........................................................................................... 127 Figure 4—26 Hole profile standard deviation frequency....................................................... 128
15
Figure 4—27 Drilling speed against hole profile standard deviation..................................... 129 Figure 4—28 Torque against hole profile standard deviation ............................................... 130 Figure 4—29 Thrust against hole profile standard deviation ................................................ 130 Figure 4—30 Drilling Speed against hole profile standard deviation in machines using wet
flushing system ............................................................................................... 131 Figure 4—31 Drilling speed against hole profile standard deviation in machines using dry
flushing system ............................................................................................... 132 Figure 4—32 Torque against hole profile standard deviation in machines using dry flushing
system............................................................................................................. 133 Figure 4—33 Resin spinning speed against hole profile standard deviation in machines
using wet flushing system ............................................................................... 133 Figure 4—34 Hole profile standard deviation in sandstone .................................................. 134 Figure 4—35 Hole profile standard deviation in 'soft' materials ............................................ 135 Figure 4—36 Effect of wet-dry drilling................................................................................... 136 Figure 4—37 Effect of wet and dry drilling on overall support stiffness ................................ 137 Figure 4—38 Performance of roofbolters using SEPT.......................................................... 138 Figure 5—1 Performance of roof bolts determined from underground SEPTs ................... 140 Figure 5—2 Effect of tensioning on bond strength.............................................................. 142 Figure 5—3 Effect of tensioning on overall stiffness........................................................... 142 Figure 5—4 Roof bolt diameter deviations in bolts from three different manufacturers...... 144 Figure 5—5 Roof bolt rib-height measurements in bolts from three different manufacturers145 Figure 5—6 Visual illustration of four South African roof bolts............................................ 146 Figure 5—7 Visual comparison of UK and South African bolts........................................... 147 Figure 6—1 Performance of 15-second and 30-second resin types in sandstone from both
resin manufacturers ........................................................................................ 148 Figure 6—2 Performance of 15-second and 30-second resin types in shale from both resin
manufacturers ................................................................................................. 149 Figure 6—3 Performance of 15-second and 30-second resin types in coal from both resin
manufacturers ................................................................................................. 149 Figure 6—4 System stiffness of 15-second and 30-second resin types from both resin
manufacturers ................................................................................................. 150 Figure 6—5 Disposable plastic paddle used in mixing the resin......................................... 152 Figure 6—6 Minova gel tester............................................................................................. 152 Figure 6—7 Effect of free rotation speed on resin set times at 200 C ................................. 153 Figure 6—8 Comparison between measured and predicted setting times ......................... 154 Figure 6—9 Resin set times versus free rotation speed ..................................................... 154 Figure 7—1 Simplified drawing of roof bolt profile components.......................................... 157

16
Figure 7—2 Simplified drawing of failure between the rock and the resin .......................... 158 Figure 7—3 Effect of rib angle on pull-out loads (simplified) .............................................. 160 Figure 8—1 Spade and 2-prong bits (25 mm) .................................................................... 161 Figure 8—2 Performance of spade bit and 2-prong bit....................................................... 162 Figure 8—3 Hole annuli obtained from the 2-prong and spade bits ................................... 162 Figure 8—4 Overall stiffnesses obtained from the 2-prong and spade bits ........................ 163 Figure 8—5 Effect of hole annulus on bond strength.......................................................... 164 Figure 8—6 Effect of rock type on support performance .................................................... 165 Figure 9—1 Beam with transverse shear force showing the transverse shear stress
developed by it ................................................................................................ 167 Figure 9—2 Beam with applied loads ................................................................................. 168 Figure 9—3 Length of beam dx with normal stress distribution due to bending moment ... 168 Figure 9—4 Segment of length dx cut a distance y from N.A., with equilibrating shear
stress τxy. ......................................................................................................... 169 Figure 9—5 Computation and distribution of shear stress in a beam with rectangular cross-
section............................................................................................................. 170 Figure 9—6 Reactions and shear forces in a beam............................................................ 171 Figure 9—7 Effect of thickness of soft strata overlying a supported beam on shear stress in
the beam (bord width is 6.0 m)........................................................................ 173 Figure 9—8 Effect of increasing thickness of soft strata on required support density (bord
width is 6.0 m) ................................................................................................. 173 Figure 9—9 Zone of roof softening ..................................................................................... 175 Figure 9—10 Measured height of roof softening in intersections and roadways in South
African collieries .............................................................................................. 176 Figure 9—11 Roof and bolt stiffness..................................................................................... 177 Figure 9—12 Required stiffness for 20 mm, 18 mm, and 16 mm bolting systems ............... 179 Figure 10—1 T-distribution showing the margin of error....................................................... 190 Figure 10—2 Extra tests required for a confidence level of 90 per cent ............................... 192 Figure 10—3 Extra tests required for confidence levels of 90 and 95 per cent .................... 193

17
List of tables
Table 2—1 Support system characteristics summary (after van der Merwe and Madden,
2002) ................................................................................................................. 36 Table 2—2 Support system suitability (after van der Merwe and Madden, 2002) ............... 37 Table 2—3 A summary of some classification systems used in South African coal mining
and their main applications ............................................................................... 57 Table 2—4 Description of sedimentary facies and summary of their underground
properties .......................................................................................................... 58 Table 2—5 Unit and coal roof classification system (after Buddery and Oldroyd, 1989)..... 60 Table 2—6 Estimated support requirements for different roof classifications (after van
Wijk, 2004) ........................................................................................................ 61 Table 3—1 Short encapsulation pull test log sheet ............................................................. 87 Table 4—1 Effect of wet and dry drilling ............................................................................ 137 Table 4—2 Performance of roofbolters.............................................................................. 138 Table 5—1 Performance of roof bolts determined from underground SEPTs (averages) . 141 Table 5—2 Effect of tensioning on support performance .................................................. 143 Table 5—3 Rib thickness, spacing and angle measured on South African roof bolts ....... 146 Table 6—1 Overall stiffnesses of resin determined from underground SEPTs (averages)151 Table 8—1 Performance of bit using SEPT....................................................................... 163 Table 9—1 Height of soft-surcharge material for different bolt lengths ............................. 174 Table 9—2 Required support stiffnesses for different bolting types .................................. 179 Table 10—1 A list of direct controllables ............................................................................. 181
18
1 Introduction
Roof bolting is by far the most common support system used in South African collieries. Roof
bolts are available in many forms, and the methods for attaching them to the rock mass are
as varied. Full-column single-resin bolts, full-column slow-fast combination resin bolts, resin
point anchors and mechanical anchors are the most widely used roofbolting systems used in
South Africa.
The support capabilities of encapsulated bolts depend on the strength of the bond between
the resin and the bolt, the strength of the bond between the resin and the surrounding strata,
the strength and the modulus of deformability of the resin, the diameter of the bolt and
borehole (including surface irregularities of the bolt) and, most importantly, the effective
length of encapsulation. These are the five most important components of a bolting system.
• Resin;
• Bolt;
• Hole;
• Machinery; equipment; and
• Rock type
These five components are of equal importance, as failure of any of these will result in an
inadequate support system. Therefore, as part of this study, all important parameters of
these five components have been investigated in detail. The important parameters of the five
components are given below:
Resin
• Set and spin times;
• Effect of roofbolter thrust and torque;
• Deformability;
• Resin type; and
• Effect of plastic encapsulation.
Bolt and components (thread, nut and washer)
• Bolt profile;
• Effect of preload on bolt and components;
• Steel characteristics; and

19
• Deformability.
Bolt hole
• Effect of wet and dry drilling on system performance and hole profile;
• Hole profile as a function of the bit characteristics;
• Size of annulus between bolt and hole;
• Effect of drilling speed on hole profile; and
• Effect of rock type on hole profile.
Machinery and equipment
• Torques;
• Effect of rock type on drilling performance for different types of machinery;
• Thrust;
• Effect of different drill rods and bits on the support performance; and
• Drilling speed.
Rock type The geology is also a very important external component of the support system. An
understanding of the interaction between the rock and the bolting system is crucial, therefore,
to achieving the most appropriate support system for different geological environments.

20
2 Literature review
2.1 Introduction
Roof bolting can be ranked as one of most important technological developments in the field of
ground control in the entire history of mining (Mark, 2002). It is an essential component in the
design of underground excavations and has been used to provide an overall ground
improvement scheme since the middle of the last century. Support is required to improve both
safety and productivity. Roof bolting has become the primary support system in the coal mining
industry and all underground coal mines in South Africa are mined under supported roofs. Roof
bolts dramatically reduce the number of fatalities each year and they were initially hailed as
“one of the great social advances of our time” (Mark, 2002). With the introduction of roof bolting
in South Africa, a dramatic increase in saleable coal production was also achieved, as indicated
in Figure 2—1.
0
5
10
15
20
25
30
35
40
1915 1920 1925 1930 1935 1940 1945 1950 1955 1960
Years
Sale
able
Coa
l Pro
duct
ion
(Mt)
Introduction ofroof bolting in SA
Figure 2—1 Saleable coal production in South Africa for the period 1915 to 1960
(after Minerals Bureau, 2003)
In the early years, the design of roof bolt systems in South African collieries was based on local
experience and the judgement of mining personnel. However, significant advances have been
made over the last 20 years in the development of resin anchors, tendon elements and
installation hardware. As a result, roof bolting systems have been successfully applied to
21
increasingly difficult roadway conditions as technology has improved and design knowledge has
grown.
In the last 20 years, monitoring of roadway behaviour has been undertaken extensively in coal
mining operations. Field monitoring, together with laboratory testing and back analyses through
the use of numerical modelling, have provided new insight into rock behaviour and the function
and performance requirements of rock reinforcement systems.
This section summarises the most commonly used roof-bolting elements and the design
methods that have been developed worldwide.
2.2 Types of roof bolts
According to Windsor and Thompson (1997), modern roof support practice may be subdivided
into three main techniques:
1. Roof bolting;
2. Cable bolting; and
3. Ground anchoring.
These terms are used to describe the practice of using roof bolts, cable bolts, and ground
anchors.
Windsor and Thompson (1997) state that these terms have been in widespread use for many
years, and that they describe an important concept, namely the relationship between the
reinforcement length and capacity. The reinforcement and length–capacity relationship for the
three reinforcement techniques are shown in Figure 2—2. The associated scales of instability
are listed below:
Surface instability - 0-3 m-long elements for roof bolts
Near surface instability - 3-15 m-long elements or cable bolts
Deep seated instability - 10-30 m-long elements or ground anchors

22
Groundanchors
Cablebolts
Rockbolts
REINFORCEMENT LENGTH
REI
NFO
RC
EM
EN
T C
APA
CIT
Y
Groundanchors
Cablebolts
Roofbolts
REINFORCEMENT LENGTH
REI
NFO
RC
EM
EN
T C
APA
CIT
Y
Groundanchors
Cablebolts
Rockbolts
REINFORCEMENT LENGTH
REI
NFO
RC
EM
EN
T C
APA
CIT
Y
Groundanchors
Cablebolts
Roofbolts
REINFORCEMENT LENGTH
REI
NFO
RC
EM
EN
T C
APA
CIT
Y
Figure 2—2 The length-capacity relationships that have evolved for rockbolts, cable
bolts, and ground anchors (after Windsor and Thompson, 1997)
There are eight types of roof bolt used in the South African coal mining industry. These are
1. mechanical anchors;
2. resin point anchors;
3. full-column single-resin-type bolts;
4. full-column slow/fast-resin combination bolts (dual resin system);
5. friction rock stabilisers;
6. wooden dowels;
7. fibreglass dowels; and
8. spin-to-stall resin bolts.
The mechanical anchor bolt, the oldest design in use in underground coal mines, was the main
roof support used in the collieries due to the rapid rate of installation. Today, the fully grouted
roof bolt is considered superior to the mechanical anchor bolt because of a better anchorage
capacity and load transfer capability. Currently, more than 95 per cent of roof bolts installed in
South African coal mines are full-column resin bolts (Minney, van Wijk, Vorster and Koen,
2004). The two main systems are the full-column slow/fast-resin combination, and spin-to-stall
systems.
2.2.1 Mechanical coupled roof bolts
The mechanical anchor bolt consists of a smooth bar with a threaded anchor end. A mechanical
shell anchor attached to the threaded end of the bolt is used to anchor the system. When a
torque is applied to the bolt, the force drives a plug against the outer shell, which then expands

23
and sets against the rock in the borehole walls (Figure 2—3). Once the anchor is set, the bolt is
then tensioned. Over time, the tension may be reduced as a result of creep or failure of the rock
around the anchor. For this reason the mechanical anchor bolt system should be installed in
stronger roof rocks.
Bail
Leaf
Expansion shell anchor.These are available in a variety of sizes, materials and actuating mechanisms
Smooth bar element.Bars are available in a variety of materials, diameters and grades of strength
Threaded length of element
Nut
Steel plate
Bail
Leaf
Expansion shell anchor.These are available in a variety of sizes, materials and actuating mechanisms
Smooth bar element.Bars are available in a variety of materials, diameters and grades of strength
Threaded length of element
Nut
Steel plate
Figure 2—3 Mechanical anchor bolt
Van der Merwe and Madden, (2002) state that because of the long free length of the steel
tendon, mechanical anchor bolts can stretch when load is applied. It is therefore a soft support,
even though it is active by virtue of pre-tensioning. These authors also state that in most coal
mine roof types, the anchors start slipping from 30 to 70 kN.

24
Wagner (1995) states that, because of high contact stresses which develop at the position of
the end anchor, mechanical anchors should be used in rock strata that have a uniaxial
compressive strength of more than 50 MPa.
The strength of rock required for mechanically end anchored bolts has also been investigated
by Windsor and Thompson (1997). They found that the mechanical performance of the anchor
may be estimated using the equilibrium of the forces on the components of the anchor system
as shown in Figure 2—4.
ROCK
α
shell
wedge
SR
SR
R
Nb
Sb
Sb
T
Figure 2—4 Forces acting on the components of an expansion shell anchor (after
Windsor and Thompson, 1997)
The radial (R) and longitudinal shear force (SR) at the interface between the shell and the rock
can be converted to approximate equivalent normal (σr) and longitudinal (τr) stresses with the
use of the following equations:
( )br DL
Tφαπ
σ+
=tan
[2-1]
DLT
r πτ = [2-2]
where D is the nominal diameter of the anchor or borehole
L is the length of the shell in contact with the rock
T is tension on the bolt
bφ is the contact friction angle (degree)
The radial stress predicted by Equation [2-1] assumes the force is distributed equally around the
circumference of the borehole for the total length of the leaves. In reality, the stresses will be
greater than this estimate as a result of a non-uniform distribution of the stresses. Also, in hard
rock, the teeth in the leaves will initially be in contact with the rock, and the contact stresses will

25
be much greater and bring about local failure. At higher axial forces, the average radial stress
will be given approximately by Equation [2-2].
The suitability of an expansion shell anchor for a particular rock type can be assessed with the
use of Equations [2-1] and [2-2]. For example, these equations can be used to calculate the
maximum radial and longitudinal stresses based on the strength of the tendon. The radial stress
may be used to estimate the stresses induced in the rock near the borehole wall and these can,
in turn, be compared with the compressive strength of the rock. Shear stresses induced at the
borehole wall must also be less than the shear strength of the rock.
Various types of expansions shells are shown in Figure 2—5.
Figure 2—5 Various expansion shell mechanisms (after Windsor and Thompson,
1997)
2.2.2 Resin point anchors
Resin anchoring of roof bolts with the use of capsules was developed in France during the
1960s (Raffoux, 1971). In principle, the same remarks apply here as for mechanical anchors.
The only difference between mechanical anchors and point resin anchors is that the expansion
shell is replaced by a fast setting resin (Figure 2—6). This indicates that in areas where the rock

26
is not strong enough to enable mechanical anchors to be installed, point resin anchors may be
used.
Resin anchors require more time and care to install than mechanical anchors. Van der Merwe
and Madden (2002) described the advantages and disadvantages of the resin point anchor
system as follows:
Ribbed bar elementBars are available in a variety of materials, diameters and grades of strength
Threaded length of element
Nut
Steel plate
Resin section.A variety of procedures and resin are available for fixing the element into the hole
Flat or 45 degree cuts
Ribbed bar elementBars are available in a variety of materials, diameters and grades of strength
Threaded length of element
Nut
Steel plate
Resin section.A variety of procedures and resin are available for fixing the element into the hole
Flat or 45 degree cuts
Figure 2—6 Point resin anchor
Advantages:
• The anchor resistance can be increased by making the anchorage length longer; and

27
• The changeover to full-column resin support, should it be required by changing
conditions, is less traumatic because operators will already be trained in resin
installation.
Disadvantage:
• Point resin anchors cannot be used in friable or burnt coal ribsides, because of
difficulties in proper mixing of the resin.
2.2.3 Full-column single-resin-type bolts
These are full-column resin bolts of a ribbed bar, anchored with a full-length column of resin
obtained from a cartridge (Figure 2—7). This system is considered to be non-tensioned.
However, the plate is loaded with stress due to thrust (Karabin and Debevec, 1976). This load
can also be increased using the “thrust bolting technique“ (Tadolini and Dolinar, 1991), which
can apply upwards of 44 kN of initial plate load (Tadolini and Dolinar, 1991). These loads are
similar to what is measured in the typical Australian "non-tensioned" roof bolt (Frith and
Thomas, 1998).
Because the steel is friction bound to the rock over its entire length, full-column installations
allow very little displacement to take place once they are installed, making the system one of
stiff support. Furthermore, because the full length of the hole is filled, this system restricts lateral
movement between different layers.
Van der Merwe and Madden (2002) described the advantages and disadvantages of the full-
column resin system as follows:
Advantages:
• It is ideal for any long-term requirement like main developments, underground
workshops, etc.;
• Full-column resin support is essential in beam-building mechanisms; and
• It is ideal for the support of laminated roofs.
Disadvantages:
• The support is relatively expensive;
• It requires care to install as operators have to be well trained; and
• Full-column resin anchors cannot be used in friable or burnt coal ribsides, because of
difficulties in proper mixing of the resin.

28
Van der Merwe and Madden (2002) also state that the passive nature of full-column resin can
be overcome if bolts are installed close to the face before layer separation occurs.
Mark (2000) found that the total load generated within the resin is generally less than the
strength of the steel for bonded lengths of less than 0.61. It was also noted that the bond
strength depends on rock strength and other installation parameters.
Ribbed bar elementBars are available in a variety of materials, diameters and grades of strength
Threaded length of element
Nut
Steel plate
Resin section.Entire length of bolt is covered by single-speed resin
Flat or 45 degree cuts
Ribbed bar elementBars are available in a variety of materials, diameters and grades of strength
Threaded length of element
Nut
Steel plate
Resin section.Entire length of bolt is covered by single-speed resin
Flat or 45 degree cuts
Figure 2—7 Full column resin bolt
The stiffness of a full-column single-resin bolt is determined by the load-transfer mechanisms
between the rock, the resin, and the bolt (Mark, 2000). Good load transfer exists when very high

29
loads develop in the bolt in response to small ground movements, and these loads are rapidly
dissipated away from the zone of roof movement. Poor load transfer can result in:
• Large plate loads;
• Large roof movements before maximum bolt response; and
• Low ultimate bolt capacity, particularly if roof movements occur near the top of the bolt
(Fabjanczyk and Tarrant, 1992).
2.2.4 Full-column slow/fast-resin combination bolts
This system is the most widely used roof bolting system in South African collieries. It is a stiff
and active system (Figure 2—8).

30
Ribbed bar elementBars are available in a variety of materials, diameters and grades of strength
Threaded length of element
Nut
Steel plate
Fast setting resin section
Slow setting resin section
Flat or 45 degree cuts
Ribbed bar elementBars are available in a variety of materials, diameters and grades of strength
Threaded length of element
Nut
Steel plate
Fast setting resin section
Slow setting resin section
Flat or 45 degree cuts
Figure 2—8 Full-column slow/fast-resin combination bolts (the dual resin system)
Van der Merwe (1989) found that, in general, slower resins tend to result in higher shear
strength of the resin/rock contact plane than fast resin do. Also, the slower the resin, the wider
the tolerance of the mixing and waiting times.
In full-column installations, it is difficult to install longer bolts (> 1.5 m) with fast resin only. The
time taken to push the steel tendon through the resin column (which often has to be done during
spinning in order to achieve penetration) sometimes means that the resin at the bottom of the
hole will be spun for the incorrect length of time. With very fast resins, it was frequently found
that the resin at the bottom of the hole starts to set before the steel tendon is fully inserted (van
der Merwe and Madden, 2002).

31
On the other hand using only slower resins means that more time is required to complete the
installations, which may lead to a loss in production. Van der Merwe (1989) suggests that an
appropriate balance needs to be found between the efficiency of the system and the time taken
to carry out the installation. For this reason, van der Merwe (1989) suggests the use of dual
systems: a single fast capsule is placed at the top of the column, while the remainder of the
column is made up of slow resin capsules.
2.2.5 Friction rock stabilisers
Friction rock stabilisers are generally passive bolts because they cannot be tensioned. The only
friction rock stabiliser realistically available at present on South African coal mines is the Split
Set (Buddery, 1989) used for ribside support.
A Split Set is installed by being forced into an undersized hole (Figure 2—9), giving rise to radial
forces and, dependent upon the operator and the thrust of the installation machine, a degree of
axial load. Strata movement causes frictional forces to be induced along the tendon/rock
interface.
Because of the large exposed surface area Split Sets are highly susceptible to corrosion. Most
of the corrosion is on the inner surface, and the increased likelihood of tensile or shear failure
outweighs any increase in frictional resistance along the bolt/rock interface. For this reason Split
Sets should be viewed as temporary support only, unless they are installed in a non-corrosive
environment (Buddery, 1989), or post-grouted.
Split Sets are quick and easy to install, but are expensive. In Split Set application, control over
hole diameters is crucial. Split Sets are an ideal support for burnt coal and in other applications,
for example moulding wire mesh to hollows in roofs and ribsides prior to shotcreting (van der
Merwe and Madden, 2002).

32
Hot rolled. High strength, steel cylinder with a longitudinal slot that contracts during insertion into the borehole
Steel retaining ring
Domed steel plate
Reducing taper
Split set – rock interface
Hot rolled. High strength, steel cylinder with a longitudinal slot that contracts during insertion into the borehole
Steel retaining ring
Domed steel plate
Reducing taper
Split set – rock interface
Figure 2—9 Split Set
2.2.6 Wooden dowels and fibreglass dowels
Dowels are ideal when they are in contact with the host rock along the entire length of the
dowel. They are often used as ribside support where steel is not suitable, for example in
longwalls, or where stooping is contemplated. Resistance to movement is the result of an
“interface fit” provided by either a resin or cement grout filling the void between hole wall and
bolt. The grout adheres firmly to the bolt but adhesion to the host rock is not significant. Cement
is rarely used in South African collieries (Buddery, 1989).

33
Dowels are referred to as “passive supports” since they require strata movement before they
offer effective support. Tension in dowels is the result of ground movement, which means that
frequent manual re-tensioning is unnecessary. Dowels are far less susceptible to corrosion than
most roof bolts.
Since a dowel is a non-pre-tensioned device, no purpose is served by a washer unless it is to
secure mesh, straps, tapes, etc.
Dowels are very effective in preventing longwall face deterioration in cases where the face is not
mined for extended periods (van der Merwe and Madden, 2002).
2.2.7 Spin-to-stall system
In the UK and Germany roof bolting was introduced widely in coal mines in the 1980s (Siddall,
1992). The success of this introduction, following earlier failures, depended on the adoption of
the high bond strength system, which had been developed in Australia. Because mining
conditions in the deeper European mines were even more demanding, further developments to
improve the capacity and bonding properties were also made. In these conditions, the
importance of ensuring that every bolt is installed correctly led to the development of improved
standards and systems for quality control (O’Connor et al., 2002).
Consistent high-quality installation and improved bond strength were also recognised in South
Africa, and led to the development of new systems that are unique to South Africa. These are
the “reverse-spin” system and the “spin-to-stall” system developed by Anglo Coal, South Africa.
In the spin-to-stall system, the bolt is spun to mix the resin and spinning continues until the
gelling resin increases the resistance, resulting in breakout of a torque nut. The nut runs up the
thread and is tightened against the bolt to be installed, in approximately 10 seconds. The length
of exposed thread provides an indication of the standard of installation.
Although the spin-to-stall system gives a simpler underground operation, it is more demanding
on the roof bolting system components. The resin must provide sufficient time for mixing and
roof bolt insertion, then transform very rapidly from a fluid to a set state, and develop high bond
strength. The properties of the resin, the properties of the roof bolt, the breakout torque of the
nut and other parameters are important for developing and optimising the system (O’Connor et
al., 2002).

34
The installation procedure for the spin-to-stall system is shown in Figure 2—10. As can be seen
from this figure, there is no holding time in the spin-to-stall system.
3
Thrustuntil bolt is fully inserted
Hole ~50mm shorterthan bolt drilled tofixed distance
1
Spin until resin “grabs” bolt, breaks the shear pin and the nut spins to stall
4
Correct quantity ofresin inserted to ensure full the back of hole
2 6
Installation complete
5
~ 25mm thread showing
Make sure that the boltis tight against the roof..
Stop on drill rod
Top hat
Bolt in tension Rock in
compression
“SPIN TO STALL” BLACK RESIN
“SLOW “YELLOW RESIN
NO HOLD
TIME
333
Thrustuntil bolt is fully inserted
Hole ~50mm shorterthan bolt drilled tofixed distance
Hole ~50mm shorterthan bolt drilled tofixed distance
11
Spin until resin “grabs” bolt, breaks the shear pin and the nut spins to stall
44
Correct quantity ofresin inserted to ensure full the back of hole
22 66
Installation complete
55
~ 25mm thread showing
Make sure that the boltis tight against the roof..
Stop on drill rod
Top hat
Bolt in tension Rock in
compression
“SPIN TO STALL” BLACK RESIN
“SLOW “YELLOW RESIN
NO HOLD
TIME
Figure 2—10 Spin-to-stall installation procedure (after Minney and Munsamy, 1998)
Minney and Munsamy (1998) reported that the final tightening of the nut may damage the
bonding between the bolt and the resin. Therefore, forged-head bolts and shear-pin bolts were
recommended in spin-to-stall systems.
Van der Merwe and Madden (2002) state that this type of application may require a denser
support spacing to compensate for the weak bond due to the installation procedure. In addition,
they state that the spin-to-stall system application should be approached with great caution and
should be implemented only after a comprehensive test programme has been carried out.
2.2.8 Current guidelines for the selection of roof bolt type
The choice of bolt type depends primarily on the geological condition, the roof rock, and the
mining method.
While mechanical anchor bolts are not effective in weak rock, Split Sets are not recommended
in corrosive environments. The fully grouted bolts can meet a wider range of roof conditions and
support requirements (Smith, 1993; van der Merwe and Madden, 2002). Anchorage is

35
distributed over the grouted length, the resin protects against corrosion and, even if the rock
weathers away from the bearing plate, the resin/rebar will continue to hold the rock together. For
long-term support, the resin/rebar bolt will always be a better choice (Parker, 2001).
Yassien (2003) made certain recommendations on the selection of bolt type. Mechanical bolts
are recommended for:
• Hard and strong rock as they can resist bit biting and keep the anchorage force;
• Temporary reinforcement systems;
• Conditions where bolt tension can be checked regularly;
• Rock that will not undergo high shear force; and
• Areas away from blast sites where bolt tension may be lost.
Fully grouted bolts are recommended by Yassien (2003) for:
• Areas and conditions where mechanical bolts are not recommended;
• Rock without wide fractures or voids that will cause grout loss; and
• Long-term support of thinly bedded roof strata.
Maleki (1992) proposed the preliminary criterion for selecting bolt types depending on the stress
level and rock mass strength by the following formula (Figure 2—11):
Rock Mass Strength = Uniaxial compressive strengthKRock Mass Strength = Uniaxial compressive strengthK [2-3]
where K equals 1 for massive strata; K equals 2 for cohesive, medium bedded strata; and K
equals 3 for thinly laminated, non-cohesive strata.
Van der Merwe and Madden (2002) summarised the characteristics of the different support
systems that indicate their main areas of applicability (Table 2—1). Table 2—2 lists some of the
more commonly encountered ground conditions, and indicates which support systems are best
suited to these.

36
Fully grouted tensioned boltCombination bolt
Fully grouted tensioned bolt
Mechanical bolt No bolt
Rock mass strength, x 1000 psi
Ave
rage
stre
ss, x
1000
psi
0 2 4 6 8 10
6
4
2
Figure 2—11 Selection of bolt type (after Maleki, 1992)
Table 2—1 Support system characteristics summary (after van der Merwe and
Madden, 2002)
System Active/ Passive
Stiff/ Soft
Corrosion resistance
Ease of installation
Pull-out resistance
Where to use
Mechanical
Anchors Active Soft Medium Good Medium
Short term,
unlaminated roof,
medium, light load
Resin point
anchor Active Soft Medium
Medium,
requires trainingVery good
Short term,
unlaminated roof,
medium, heavy
load
Full-column
resin (single-
resin type)
Passive Stiff Good Medium,
requires trainingVery good
Long term,
laminated roof,
heavy load, thick
weak roof, close to
face
Full-column
resin-
(slow/fast
combination)
Active Stiff Good Medium,
requires trainingVery good
Long term,
laminated roof
heavy load, beam
building, thick weak
roof
Friction rock
stabilisers Passive Stiffish Poor Good Poor
Burnt coal ribsides,
wire mesh fill-in,
37
System Active/ Passive
Stiff/ Soft
Corrosion resistance
Ease of installation
Pull-out resistance
Where to use
(Split Set in
SA collieries)
thin laminated
layers, short term,
light load
Wooden
dowels Passive
Stiff
but
weak
Excellent Easy Poor Longwall faces,
ribsides in stooping
Fibreglass
dowels Passive Stiff Excellent Easy Good
Burnt coal, joint
areas, friable roof,
long term, densely
populated areas
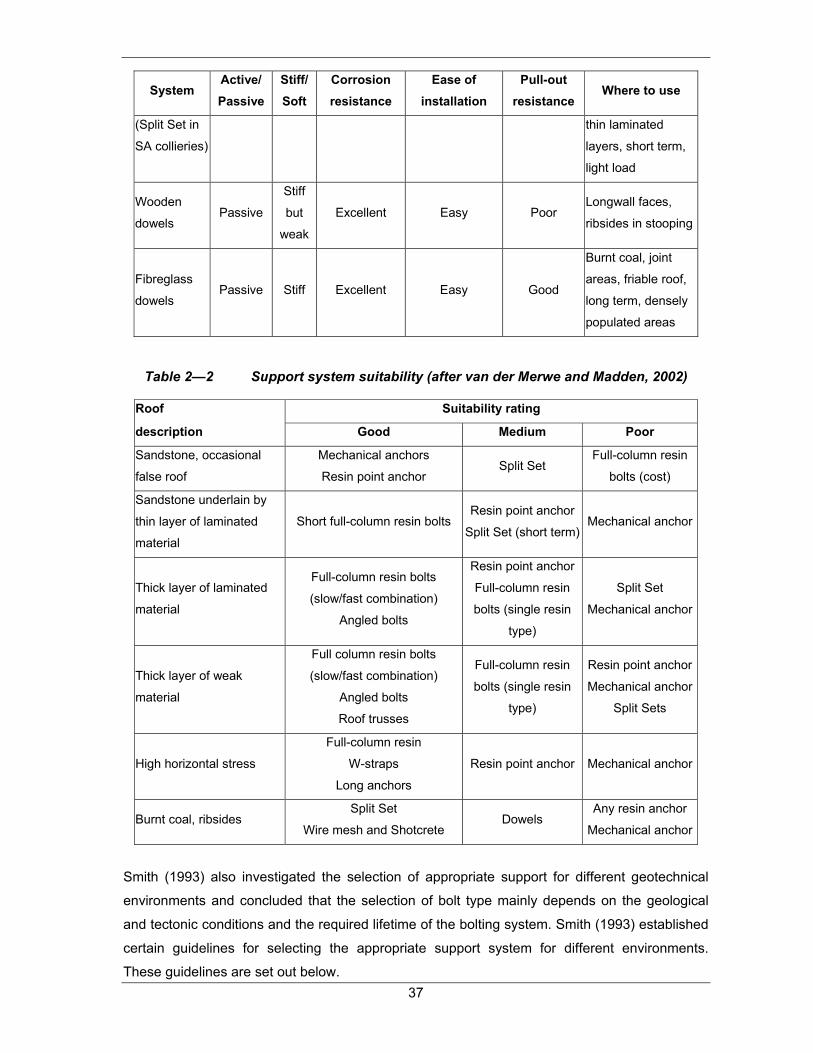
Table 2—2 Support system suitability (after van der Merwe and Madden, 2002)
Roof Suitability rating
description Good Medium Poor
Sandstone, occasional
false roof
Mechanical anchors
Resin point anchor Split Set
Full-column resin
bolts (cost)
Sandstone underlain by
thin layer of laminated
material
Short full-column resin bolts Resin point anchor
Split Set (short term) Mechanical anchor
Thick layer of laminated
material
Full-column resin bolts
(slow/fast combination)
Angled bolts
Resin point anchor
Full-column resin
bolts (single resin
type)
Split Set
Mechanical anchor
Thick layer of weak
material
Full column resin bolts
(slow/fast combination)
Angled bolts
Roof trusses
Full-column resin
bolts (single resin
type)
Resin point anchor
Mechanical anchor
Split Sets
High horizontal stress
Full-column resin
W-straps
Long anchors
Resin point anchor Mechanical anchor
Burnt coal, ribsides Split Set
Wire mesh and Shotcrete Dowels
Any resin anchor
Mechanical anchor
Smith (1993) also investigated the selection of appropriate support for different geotechnical
environments and concluded that the selection of bolt type mainly depends on the geological
and tectonic conditions and the required lifetime of the bolting system. Smith (1993) established
certain guidelines for selecting the appropriate support system for different environments.
These guidelines are set out below.

38
1. Mechanical bolts are used in:
• Harder rock conditions where the rock properties will not adversely affect the gripping
force of the anchor;
• Temporary reinforcement systems;
• Conditions where bolt tension can be checked regularly;
• Rock that will not experience high shear forces;
• Rock that is not highly fractured; and
• Areas away from blast sites where bolt tension may be lost.
2. Resin bolts are generally used in:
• The conditions as set out above but where mechanical bolts are not recommended;
• Permanent reinforcement systems;
• Boreholes without continuous water run-off problems or with continuous water run-off
that would not interfere with installation; and
• Rock without wide fractures and voids in which significant amounts of grout could be
lost.
3. Non-tensioned bolts are recommended in rock that is highly fractured and deformable,
as long as adequate bolt installation is feasible. Generally, bolts in more competent
strata often require a shorter grout column than do bolts in less competent strata.
4. Tensioned grouted bolts are recommended for use where additional frictional forces, in
combination with a grouted column, may enhance roof stability.
2.3 Theories of roof bolting support
The main function of roof bolting is to bind stratified or broken rock layers together to prevent
roof falls. In order to achieve this objective four basic theories have been established for roof
bolting (Wagner, 1985; Buddery, 1989; Peng, 1986; Van der Merwe and Madden, 2002; Mark,
2000).
The four theories are:

39
• Simple skin support;
• Suspension of a thin roof layer from a massive bed;
• Beam building of laminated strata; and
• Keying of highly fractured and blocky rock mass.
2.3.1 Simple skin support
A strong, massive roof subjected to low stress levels can be essentially “self-supporting”,
meaning that a major roof collapse is unlikely to occur. However, cracks, joints, cross-bedding,
or slickensides can create occasional hazardous loose rock at the skin of the excavation (Figure
2—12). Pattern bolting is therefore required to prevent local loose rock from falling, but the bolts
may be relatively short and light. Skin control is also an important secondary function of roof
bolts, along with the other three support mechanisms (Mark, 2000).
Coalpillar
Coalpillar
Coalpillar
Coalpillar
Figure 2—12 Simple skin support
2.3.2 Suspension mechanism
The suspension mechanism (Figure 2—13) is the most easily understood and most widely used
roof bolting mechanism.
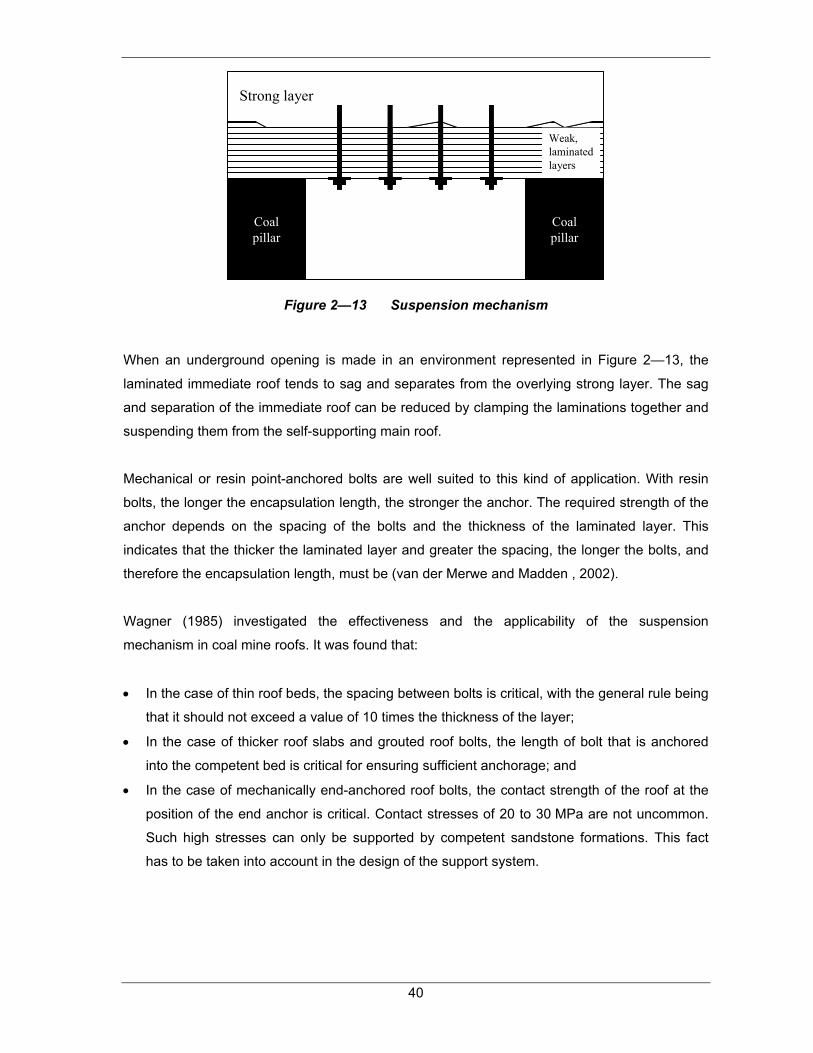
40
Coalpillar
Coalpillar
Strong layer
Weak, laminatedlayers
Coalpillar
Coalpillar
Strong layer
Weak, laminatedlayers
Figure 2—13 Suspension mechanism
When an underground opening is made in an environment represented in Figure 2—13, the
laminated immediate roof tends to sag and separates from the overlying strong layer. The sag
and separation of the immediate roof can be reduced by clamping the laminations together and
suspending them from the self-supporting main roof.
Mechanical or resin point-anchored bolts are well suited to this kind of application. With resin
bolts, the longer the encapsulation length, the stronger the anchor. The required strength of the
anchor depends on the spacing of the bolts and the thickness of the laminated layer. This
indicates that the thicker the laminated layer and greater the spacing, the longer the bolts, and
therefore the encapsulation length, must be (van der Merwe and Madden , 2002).
Wagner (1985) investigated the effectiveness and the applicability of the suspension
mechanism in coal mine roofs. It was found that:
• In the case of thin roof beds, the spacing between bolts is critical, with the general rule being
that it should not exceed a value of 10 times the thickness of the layer;
• In the case of thicker roof slabs and grouted roof bolts, the length of bolt that is anchored
into the competent bed is critical for ensuring sufficient anchorage; and
• In the case of mechanically end-anchored roof bolts, the contact strength of the roof at the
position of the end anchor is critical. Contact stresses of 20 to 30 MPa are not uncommon.
Such high stresses can only be supported by competent sandstone formations. This fact
has to be taken into account in the design of the support system.

41
2.3.3 Beam-building mechanism
In many practical situations, the strata overlying a roadway is thinly laminated. Often there is no
competent bed within a distance of a few metres into the roof that could serve to suspend the
thin layers on roof bolts. In these cases, the beam-building mechanism, as shown in Figure 2—
14, is more effective. As a result, the horizontal movements between these layers will be greatly
reduced and the combined thick beam will be more stable (Peng, 1998). Full-column resin bolts
are required for this mechanism (van der Merwe, 1998).
Coalpillar
Coalpillar
Strong layer
Weak, laminatedlayers
Coalpillar
Coalpillar
Strong layer
Weak, laminatedlayers
Figure 2—14 Beam-building mechanism
2.3.4 Keying
When the roof strata are highly fractured and blocky, or the immediate roof contains one or
several sets of joints with different orientations, roof bolting can significantly increase frictional
forces along fractures, cracks, and weak planes. Sliding and/or separation along discontinuities
is thus prevented or reduced, as shown in Figure 2—15. This keying effect mainly depends on
active bolt tension or, under favourable circumstances, passive tension due to rock mass
movement. It has been shown that bolt tension produces stresses in the stratified roof, which
are compressive both in the direction of the bolt and orthogonal to the bolt. Superposition of the
compressive area around each bolt forms a continuous compressive zone in which tensile
stresses are reduced and the shear strengths of discontinuities are improved, as shown in
Figure 2—16 (Luo et al., 1998).

42
Coalpillar
Coalpillar
Coalpillar
Coalpillar
Figure 2—15 Keying effect of bolting
Figure 2—16 Compression zone created by keying (after Luo et al., 1998)
2.4 Roof bolting design
As in the design of other support systems, the design of a rockbolting system depends on: the
nature of the discontinuities and the intact rock; the magnitude and distribution of the stresses
induced; support requirements such as acceptable deformation and lifetime of the opening; and
the size and shape of the openings. For a complete and appropriate rockbolting system design,
the following parameters must be properly determined (Luo et al., 1998):
• Bolt type;
• Bolt length;
• Pattern and spacing of bolts;
• Bolt diameter and anchor capacity;
• Whether pre-tension should be applied or not. If pre-tensioned, the magnitude of the
tension should be determined.

43
In order to achieve the best support system design, the mechanical behaviour of rock masses
reinforced by full grouted bolts, i.e. the rock-bolt interaction, needs to be fully understood. The
design methodologies for roof bolts can be classified into four categories:
• Analytical methods;
• Field testing;
• Numerical modelling;
• Geotechnical classification; and
• Physical modelling.
2.4.1 Analytical methods
The oldest, simplest, and probably still the most widely used equation for bolt design is dead-
weight suspension (Obert and Duvall, 1967; Stillborg, 1986).
A modified version of this design principle (Wagner, 1985) is still being used in South African
collieries in the design of suspension methods. The design of roof bolt systems, based on the
dead-weight principle, has to satisfy the following requirements:
• The strength of the roof bolt system, SB, has to be greater than the weight, W, of the loose
roof layer that has to be carried.
∑ >− WSBni 1 [2-4]
• The anchorage forces, AF, of the roof bolt system have to be greater than the weight of the
loose roof layer.
∑ >− WAFini 1 [2-5]
• Usually the support design incorporates a safety factor, SF.
0.0.11
>−>− ∑∑ −−WSFAFandWSFSB n
i
n
i i [2-6]
The number, n, of bolts/m2 required to support a loose layer or layers of thickness, t, is given by:
fPgtSFn ρ
= [2-7]
where, SF = Safety Factor
ρ = Density of suspended strata
g = Gravitational acceleration

44
Pf = Anchorage capacity
This method is suitable for suspension bolting in low-stress environments. However, horizontal
forces can greatly increase the loads applied to roof bolts (Wright 1973; Fairhurst and Singh,
1974). Signer et al. (1993) found that measured loads on roof bolts are often twice what would
be predicted by dead-weight design.
Beam theory has also been used since the 1980s in South African collieries in the design of roof
bolt systems (Wagner, 1985; van der Merwe, 1995; van der Merwe, 1998; Van der Merwe and
Madden, 2002). The parameters that govern the behaviour of gravity-loaded beams with
clamped ends are as follows:
Maximum bending stress (MPa) t
qLxy 2
2ρσ = [2-8]
Maximum shear stress (MPa) 4
3 qLxy
ρσ = [2-9]
Maximum deflection (m) 2
4
32EtqL
xyρσ =
[2-10]
where L = roof span (width of roadway) (m)
t = thickness of roof layer (m)
ρ = density of suspended strata (kg/m3)
g = gravitational acceleration (m/s2)
E = Elastic Modulus (MPa)
In Australia, Frith (1998) proposed a model that is based on underground measurements and
divides mine roofs into two classes:
• Static roof that is essentially self-supporting and requires minimum reinforcement; and
• Buckling roof that is thinly bedded and tends to fail layer by layer as a result of horizontal
stress.
Frith (1998) proposed that the behaviour of the second type of roof can be explained by the
basic structural engineering concept of the Euler buckling beam. There have been a number of
trials of high-tension fully grouted bolts in Australia, and the results are reported to be positive.
Unfortunately, the field evidence that has been presented to date has been largely anecdotal
(Mark, 2000).

45
2.4.2 Field testing
The roof bolt design approach based on field testing was first developed in Australia (Gale,
1991; Gale and Fabjanczyk, 1993) and was largely adopted by the U.K. Code of Practice
(Bigby, 1997).
The basic concept is that as individual roof beds become overstressed and fail, they force
stresses higher into the roof, which can in turn fail more beds. Reinforcement aims to mobilise
the frictional strength of failed roof beds in order to restrict the height and severity of failure in
the roof. It involves measuring the loads developed in roof bolts during mining, together with a
definition of the height and severity of roof deformation obtained from multipoint extensometers
and sonic probe extensometers. On the basis of the measurements, Mark (2000) indicated that
optimisation of the bolting design might include:
• Adjusting the bolt length so that adequate anchorage is achieved above the highest
level in the roof where failure is occurring;
• Adjusting the bolt density and placement to maximise reinforcement where the roof
needs it most; and
• Improving load transfer by reducing hole size, optimising bit type, or flushing the hole.
The results are considered valid for environments that are similar to the one studied. Significant
changes in the geology or stress field require additional monitoring (Mark, 2000).
According to Altounyan and Taljaard (2001), the design is based on two distinct stages:
• Detailed monitoring stations to provide design information; and
• Routine monitoring devices to measure and display roof movement.
The pull-out tests, roof monitoring using sonic probe extensometers, or tell tales and
instrumented bolts, are three main tools to determine:
• Changes in bolt load;
• Load transfer between the rock, the resin, and the bolt; and
• Roof deformations.

46
2.4.2.1 Pull-out test
The bond strength of a resin bonded roof bolt is a fundamental parameter determining the
effectiveness. The stronger the bond, the shorter the required anchorage zone of the bolt and
the longer the full resistance zone over which the full bolt strength is available to resist roof
movement (Mark et al., 2002).
With a mechanical anchor, the strength of the anchorage can be measured by pulling a
standard installed bolt. With the resin-anchoring system, the anchorage provided by resin is
related to the length of bond and the bond strength can easily exceed the strength of the steel
(O’Connor et al., 2002). For this reason, a specially installed bolt with a shorter length of resin
encapsulation is required in order to measure the anchorage properties of the resin anchor
system rather than the strength of the bolt. This test has become known as the “short
encapsulated pull test” (SEPT) and is an internationally recognised method of measuring the
resin anchorage or bond properties of fully bonded roof bolts (UK Health and Safety Executive,
1996).
Standard SEPT equipment is shown in Figure 2—17.
250mm EMBEDDEDLENGTH
HYDRAULIC RAM
DIAL GAUGE
BOLT
HYDRAULIC PUMP WITH FORCE INDICATORMONOPOD
BEARING PLATE
TEST HORIZON
NUT
SHIMS
250mm EMBEDDEDLENGTH
HYDRAULIC RAM
DIAL GAUGE
BOLT
HYDRAULIC PUMP WITH FORCE INDICATORMONOPOD
BEARING PLATE
TEST HORIZON
NUT
SHIMS
Figure 2—17 Short encapsulated pull test equipment (after DMCIDC, 1996)
The load-transfer capacity is a term equated to the effectiveness of the roof bolt in providing
support to the rock strata. Serbousek and Signor (1987) defined it as the change in load with

47
respect to distance along the roof bolt. Gray and Finlow-Bates (1998) defined it in terms of the
maximum stress generated per unit area of the roof bolt. More effective support systems are
characterised by high load-transfer capacity with high loads generated at small displacements.
Two models concerning the nature of load transfer with a fully encapsulated bolt have evolved
over the past 30 years. One accounts for non-linear load transfer observed in pull tests
undertaken in the laboratory and in situ. An alternative model accounts for linear load transfer,
also observed in field studies but where load transfer was initiated through bed separation.
Whitaker (1998) accounted for the two models as being due to differences in the method of
loading the roof bolt. In a conventional pull test, an axial tensile load is applied at the free end of
the grouted roof bolt usually being a hydraulic cylinder. At the same time, the resultant reactive
force of the hydraulic cylinder induces a compressive load as it is made to press against the
surface of surrounding rock.
Hagan (2003b) postulates that the more likely mechanism of loading a roof bolt in the field is
caused by bed separation with a roof bolt being drawn in opposite directions by adjacent layers.
Hagan (2003b) devised a laboratory test programme for investigating the effect of the loading
method on a roof bolt under controlled laboratory conditions. Hagan (2003b) used two different
methods to apply the load to the instrumented roof bolts. While the first method was intended to
replicate a conventional pull test, the second method was intended to mirror the loading
condition of a roof bolt subjected to bed separation. Hagan (2003b) found that: in the pull-test
arrangement the rate of load transfer was non-linear; and in the bed separation arrangement,
load transfer appeared to follow a linear reduction with distance. Hagan (2003b) suggested that
caution should be exercised when results based on the pull-out test are interpreted, as it tends
to overestimate the level of support that would actually be provided in supporting rock through
load transfer and confinement.
In short encapsulated pull testing, the grip factor (bond strength), contact shear strength, and
the system stiffness can be calculated as follows (Figure 2—18):
( ) [ / ]=FGrip Factor GP kN mml
[2-11]
( ) [ ]π
=FContact Shear Strength CSS kPadl
[2-12]
( ) [ / ]∆=∆
FSystem Stiffness k kN mmD
[2-13]

48
Where F = Load to slippage (kN)
∆F = Change in force (usually from 20 kN to 80 kN) (kN)
∆D = Change in deformation (mm)
l = Anchorage length (250 mm)
d = Hole diameter (mm)
0
20
40
60
80
100
120
140
0 1 2 3 4 5
Displacement (mm)
Load
(kN
)
∆F
F
∆D
Figure 2—18 A typical short encapsulated pull test result
The key to using these relationships is that shear failure must take place between the resin-bolt,
or resin-rock interface. In weak roof materials the resin-rock interface controls the failure
mechanism. If the rock material is stronger, bond failure may occur on the resin-bolt interface. If
tendon failure does not occur and the applied force exceeds the peak shear strength, the
Equation [2-12] can be used to calculate the shear stress for the applied force, and system
stiffness can be calculated from Equation [2-13] (Pile et al., 2003).
A good anchorage determined by short encapsulated pull tests is defined as one with minimum
movement (high bond stiffness), where the anchorage capacity is equal to or slightly exceeds

49
the bolt yield strength. A poor anchorage results in excessive movement and fails at lower loads
than the bolt yield strength (Mark, 2004; Peng, 1986).
Biron and Arioglu (1985) state that the load distribution in the pull-out load of a bolt is
determined by the ratio of elastic modulus of resin (ER) to elastic modulus of roof rock (ERR),
when:
• ER/ ERR > 10 load distribution is linear
• ER/ ERR < 10 load distribution is non-linear
2.4.2.2 Instrumented bolt
An instrumented fully grouted bolt has pairs of strain gauges attached along its length (Figure
2—19). The strain along the bolt length can be measured, and the bolt load calculated by using
the modulus of elasticity and the cross-sectional area of the bolt. The instrumented bolt can be
used to measure the bolt loads sustained during different mining stages in situ. These bolt loads
are compared with the yield load (Signer and Jones, 1990), allowing optimal design of the roof
bolting system (bolt length and bolt spacing). Another way to design the roof bolting system is to
calculate the total stress (axial and bending stresses) for every strain gauge (Signer et al.,
1997).
Figure 2—19 Instrumented roof bolt (after Signer and Jones 1990)
If the total stress (from field measurements) is greater than the maximum allowable stress, the
following measures can be used to reduce the stress in the bolt:
Strain gaugesLeads
A
A’
Section A-A
x4x3 x2 x1
x6x5
Bolt length
Strain gaugesLeads
A
A’
x4x3 x1
x6x5
Bolt length
0.25” 0.125”
x2

50
1. Reducing the bolt spacing between rows;
2. Increasing the number of bolts per row; or
3. Increasing the diameter of the bolts.
Although the instrumented bolt can provide details about axial and bending load distribution
along the bolt length, it has some disadvantages (Signer, 1990):
1. The rebar is milled with a certain depth along each side, which will cause incorrect
representation of the bolt area.
2. The maximum axial load or bending moment may be attained between the locations of
the strain gauges and might not be measured.
3. The alignment of the strain gauges is critical to obtain good results.
4. The failure of strain gauges in some locations could be a result of wire failure or
excessive loading, and can bias the readings towards one or more of the axial loading
values (Signer and Lewis, 1998).
2.4.2.3 Roof monitoring, sonic probe extensometer and tell tales
Regardless of roof bolt design, failures are always possible. Often, an unstable area can be
controlled with secondary support if the problem is detected in time (Yassien, 2003).
While routine monitoring of roof movements is only just becoming common practice in South
Africa, it is enforced by regulations abroad. In the UK and Canada, tell tales are required every
20 m in bolted roadways and in all intersections (Figure 2—20). The tell tales have two
movement indicators, one that shows displacement within the bolted height, and the other that
shows movement above the bolts. Tell tales are visible to everyone using the roadway, and the
information provided by them can be recorded for later analysis (Altounyan et al. 1997).

51
“B”Anchor
“A”Anchor
“A”
“B”GreenYellowRed
1020304050601020304050
GreenYellowRed
Dis
plac
emen
t ind
icat
or
“B”Anchor
“A”Anchor
“A”
“B”GreenYellowRed
GreenYellowRed
1020304050601020304050
GreenYellowRed
GreenYellowRed
Dis
plac
emen
t ind
icat
or
Figure 2—20 A tell tale (after Altounyan et al., 1997)
Mark (2000) stated that the key to the effective use of monitoring is the determination of
appropriate "action levels." In the UK, typical action levels are 25 mm within the bolted horizon
and 10-25 mm above (Kent et al., 1999a). A survey of action levels in Australian mines,
however, found no such uniformity (Mark, 2000). Some mines used total movement criteria;
while others used rates of movement ranging from 1 to 10 mm per week (Mark, 1998). In the
US, data is scarce, but action levels or "critical sag rates" are usually about 5 mm per week
(Mark et al., 1994).
Often, roof monitoring can uncover a hidden geological factor that can then be accounted for in
the design (Mark, 2000). For example, a back analysis of monitoring data from the Selby
coalfields in the United Kingdom found that excessive roof movements occurred where entries
were unfavourably oriented relative to the horizontal stress, and where the mudstone thickness
exceeded 2.5 m (Kent et al., 1999b). At the Plateau Mine in Utah, Maleki et al. (1987) found that
excessive sag rates correlated with the presence of a channel sandstone within 1.5 to 2.2 m of
roof. A programme of test holes helped locate the sandstone and reduced the number of
sagmeters required (Mark, 2000).

52
2.4.3 Numerical modelling
Numerical methods of analysis are now widely used in rock engineering. The numerical
methods used are listed in Figure 2—21.
NUMERICALMETHODS
ContinuumModel
DiscontinuumModel
Subgrade Reaction Model
Finite Element Method
Finite Difference
Method
Boundary Element Method
Beam Element Method
Discontinuous Deformation
Analysis
Finite Difference
Method
Distinct element model
NUMERICALMETHODS
ContinuumModel
DiscontinuumModel
Subgrade Reaction Model
Finite Element Method
Finite Difference
Method
Boundary Element Method
Beam Element Method
Discontinuous Deformation
Analysis
Finite Difference
Method
Distinct element model
Figure 2—21 Numerical methods in rock engineering
For effective quantitative design using numerical models, three basic prerequisites must be met
(Mark, 2000; Hayes and Altounyan, 1995; Gale and Fabjanczyk, 1993). These are set out in the
paragraphs below.
Model: The model must be capable of replicating the behaviour of coal measure rock, which
implies that it must be able to simulate the various failure modes and large deformations that
typically occur.
Material properties and stress: Input rock mass properties must reflect both pre- and post-
failure mechanics of the different rock layers encountered. In situ stress levels must be
measured in the field.
Validation: To ensure that the model replicates underground behaviour, stresses and
displacements must be measured. Important parameters include the magnitude and location of
deformations, the distribution of bolt loads, and the behaviour of interfaces at the top of the pillar
and within the roof.
Mark (2000) states that numerical models used in the US seldom meet any of these
requirements.
Peng and Guo (1989) used a computer program consisting of a combined boundary-finite
element method to analyse the stresses within roof reinforced by fully grouted roof bolts. The
Discrete Element Method
53
models incorporated weak bedding planes and horizontal stress. Different geological conditions
and bolt patterns were used to develop the design criteria. The bolt spacing depends on several
factors such as roof span, thickness of the immediate roof, etc. They found that for a 6.1-m-wide
roadway, the proper number of bolts varies from 4 to 6. To prevent failures associated with high
horizontal stress, the number of bolts needs to be increased or the bolts need to be pre-
tensioned during installation.
Theory describing roof bolt bond models and bolt models for inclusion in finite element and finite
difference schemes are outlined by St. John and van Dillen (1983). Lorig (1985) re-iterates the
theory specifically for explicit solution schemes and presents a number of empirical and analytic
solutions for the shear response of bolts.
In recent work, roof bolts are effectively installed “over” an existing continuum mesh. The roof
bolt nodes are therefore independent of the continuum degrees of freedom (i.e. the rock mass).
Continuum elements and the roof bolt elements are connected through bond elements, thus
permitting the simulation of grout, resin or friction coupling between the bar and the rock.
Displacements from the continuum are transferred to the roof bolt system through these
elements, and the resultant reactions are passed to the continuum as external loads. Roof bolt
systems are constructed of interconnected layers of bond elements and axial structural
elements. The constitutive models for both these types of elements are effectively one-
dimensional and therefore are easily adjusted to account for any bond characteristic. In
addition, there is the capacity for elements crossing discontinuities to generate reactions
consistent with transverse shearing of roof bolts (Roberts, 2000).
2.4.4 Roof support design based on geotechnical classification
Rock mass classification systems have constituted an integral part of empirical mine design for
over 100 years (Ritter, 1879). The use of such systems can be either implicit or explicit, and are
traditionally used to group areas of similar geotechnical characteristics, to provide guidelines of
stability performance, and to select appropriate support. In more recent years, classification
systems have often been used in tandem with analytical and numerical tools. There has been
an increase of work linking classification indices to material properties such as modulus of
elasticity, the m and s parameters in the Hoek and Brown (1988) failure criterion, etc. These
values can be used as input parameters for numerical models. The importance of methods of
application of rock mass characterisation has increased over time. The primary objective of all
classification systems is to quantify the intrinsic properties of the rock mass on the basis of past
experience. The second objective is to investigate how external loading conditions acting on a

54
rock mass influence its behaviour. An understanding of these processes can lead to the
successful prediction of rock mass behaviour for different conditions.
The earliest reference to the use of rock mass classification for the design of tunnel support is
by Terzaghi (1946). In this classification, rock loads are estimated on the basis of a descriptive
classification. Since Terzaghi (1946), many rock mass classification systems have been
proposed, the most important of which are those of:
• Lauffer (1958);
• Deere (1970) (Rock Quality Designation, RQD);
• Wickham et al. (1972) (Rock structure Rating);
• Bieniawski (1973) (Geomechanics Classification, Rock Mass Rating); and
• Barton et al. (1974) (Q- System).
Most of the multi-parameter classification schemes by Wickham et al. (1972), Bieniawski (1973,
1989) and Barton et al. (1974) were developed from civil engineering case histories in which
most of the components of the engineering geological character of the rock mass were
included. Studies of these systems have shown that their application is for both hard and soft
jointed rock masses. Several classification systems have been developed and modified for
underground coal mining. Most rock engineers locally and abroad have been using locally
developed classification systems that are in most cases not well documented and are restricted
to the developer of such systems, or to the mine on which the system was developed.
Furthermore, these systems cannot be compared with one another and neither can results be
converted to an equivalent rating in another mine.
Today, the two most commonly used systems in collieries are Coal Mine Roof Rating (CMRR)
and Impact Split Testing (IST).
The USA Bureau of Mines (USBM) has developed the Coal Mine Roof Rating (CMRR)
classification system to quantify descriptive geological information for use in coal mine design
and roof support selection (Molinda et al., 1994). This system resulted from years of geologic
ground control research in longwall mines in the USA. The CMRR weights the geotechnical
factors that determine roof competence, and combines them into a single rating on a scale from
0-100. The characteristics of the CMRR are that it:
• Focuses on the characteristics of bedding planes, slickensides, and other discontinuities
that weaken the fabric of sedimentary coal measure rock;

55
• Applies to all U.S. coalfields, and allows a meaningful comparison of structural
competence even where lithologies are quite different;
• Concentrates on the bolted interval and potential to form a stable mine structure; and
• Provides a methodology for geotechnical data collection.
The USBM is currently engaged in research to further develop the CMRR to be applicable to
other coal mines around the world. The principle behind the original CMRR system (1994) was
to evaluate the geotechnical characteristics of the mine roof, rather than to provide a geological
description. CMRR emphasises structurally weak or strong units instead of geological divisions.
The structure of the system is similar to the RMR (Bieniawski, 1973) system in that the
important roof parameters are identified, their influence on roof strength is quantified, and the
final rating reflects the combined effects of all the parameters. Figure 2—22 shows the
parameters that compose the CMRR system. The system is also designed such that the final
rating/unsupported span/stand-up time relationship is comparable to that of the RMR. However,
the CMRR is intended to be a universal system for coal mining and to initially exclude time-
consuming and expensive laboratory analyses. Later, Molinda and Mark (1999) documented a
revised approach that takes into consideration the point load test in borehole cores.
An important attribute of the CMRR is the ability to rate the strength of bedded rocks in general,
and of shales and other clay-rich rocks in particular. Layered rocks are generally much weaker
when loaded compressively parallel to bedding, and the CMRR addresses both the degree of
layering and the strength of the bedding planes. Recent research in the USA has shown that
most coal mine roofs are subjected to high horizontal stresses. The CMRR has been modified
by Molinda and Mark (1999) to retain the ability to identify those rocks that are most susceptible
to horizontal stresses.
Groundwateradjustment
RockStrength
Strong bed adjustment
Bedding contact adjustment
Moisture sensitivity
DiscontinuitiesSpacingCohesionRoughnessPersistence
Surcharge adjustment
Groundwateradjustment
RockStrength
Strong bed adjustment
Bedding contact adjustment
Moisture sensitivity
DiscontinuitiesSpacingCohesionRoughnessPersistence
Surcharge adjustment
Figure 2—22 Components of the CMRR system
56
Van der Merwe (2001) developed the first South African roof rating system in 1980, using Rock
Quality Designation (RQD). In this rating system the critical height into the roof was taken as
2.0 m. This height of the roof was initially rated with RQD. Following a splitting test conducted
with a chisel at regular distances along the core, RQD was re-applied and the final results were
compared with the initial results. The final rating was then calculated on the basis of the
difference between the initial and final RQDs. Owing to possible discrepancies resulting from
the use of chisels with different geometries and forces, van der Merwe developed a standard
chisel for all roof rating tests. A summary of the rating systems that have been documented for
use in coal mining in South African is given in Table 2—3.
Jermy and Ward (1988) conducted an investigation into relating the geotechnical properties of
various sedimentary facies to observed underground behaviour in order to quantify the
geological factors that affect roof stability. Twenty-four distinct facie types were determined from
borehole cores from a number of collieries throughout South Africa. A database of 10 000 tests
from core samples was compiled from the Waterberg, Witbank, Highveld, Eastern Transvaal,
Klip River, Utrecht and Vryheid Coalfields. The results from the tests have shown that those
facies with lower direct tensile strengths generally give rise to unstable roof conditions.
Furthermore, the low direct tensile strengths of the argillaceous facie were found to be very
important when the behaviour of these rocks underground is considered. The arenaceous facie
were found to have higher average direct tensile strengths. However, the authors found that this
can be reduced dramatically by the presence of argillaceous or carbonaceous partings within
the rock. Other tests that were included in the assessment were the Brazilian Disc Strength and
the Uniaxial Compressive Strength (UCS) but these were found not to be of importance for
considering the tensile strength of the rock. Descriptions of sedimentary facies and a summary
of their underground properties are given in Table 2—4.

57
Table 2—3 A summary of some classification systems used in South African coal
mining and their main applications
Name of classification
system
Form and Type∗∗ Main Applications Reference
Roof and floor classification for
collieries
Descriptive form
For quantification of geological factors that
affect roof stability
Jermy and Ward, 1988
Duncan Swell and Slake
durability tests
Numerical and behaviouristic
form Functional type
Quantification of floor conditions
Buddery and Oldroyd, 1992
Impact splitting test
Descriptive and behaviouristic
form Functional type
Coal roof characterisation and
support design
Buddery and Oldroyd, 1992
CMRR
Descriptive and behaviouristic
form Functional type
Coal roof characterisation and
support design.
Molinda and Mark, 1994
Section physical risk and
performance rating
Descriptive Functional type
Classification of adherence to mine
standards and physical rating
Oldroyd and Latilla, 1999
∗∗Definition of the Form and Type: Descriptive form: the input to the system is mainly based on descriptions Numerical form: the input parameters are given numerical ratings according to their character Behaviouristic form: the input is based on the behaviour of the rock mass. General type: the system is worked out to serve as a general characterisation Functional type: the system is structured for a special application (for example, for rock support recommendation)

58
Table 2—4 Description of sedimentary facies and summary of their underground
properties
FACIES DESCRIPTION PROPERTIES OF ROCK STRATA UNDERGROUND
1 Massive dark grey to black carbonaceous siltstone.
2 Lenticular-bedded siltstone with discontinuous ripple cross lamination. Resembles lenticular bedding of Reineck and Wunderlich (1986).
3 Alteration of 1-cm-thick layers of flat laminated siltstone and fine grained sandstone.
Very poor roof and floor strata due to low tensile strength and deteriorates rapidly upon exposure. Roof falls common and floor heave occurs when depth of mining exceeds 150 m.
4 Flaser bedded siltstone and fine grained sandstone as described by Reineck and Wunderlich (1968).
Reasonable roof strata which deteriorate upon exposure, giving rise to spalling from the roof.
5 Ripple cross laminated fine-grained grey feldspathic sandstone.
6 Ripple cross laminated fine-grained grey feldspathic sandstone with silt drapes and grit bands.
Reasonable roof strata, although localised roof falls do occur as a result of parting along silt drapes. Durability good.
7 Massive fine grained greyish white feldspathic sandstone.
8 Fine grained greyish white feldspathic sandstone with planar/trough crossbeds.
Very competent floor and roof strata due to low porosity and high tensile strength.
9 Massive medium grained white feldspathic sandstone.
10 Medium grained white feldspathic sandstone with planar/trough crossbeds
Good roof and floor strata with fairly high tensile strengths. Sometimes creates problems as a result of poor goafing ability in stoping areas.
11 Massive coarse-grained white feldspathic sandstone.
12 Coarse-grained white feldspathic sandstone with planar/trough crossbeds.
Good roof and floor strata. Decomposes under prolonged saturation giving rise to stability problems.
13 Intensely bioturbated carbonaceous siltstone or fine-grained sandstone.
Deteriorates rapidly upon exposure and saturation to produce roof and floor instability.
14 Medium- to coarse-grained feldspathic sandstone with irregular carbonaceous drapes and slump structures. No information available.
15 Highly carbonaceous silty sandstone. No information available. 16 Whitish brown calcrete.
17 Highly weathered creamy orange to grey Beaufort (?) mudstone.
18 Unweathered grey Beaufort (?) mudstone.
19 Massive khaki to grey mudstone associated with diamictite.
20 Dark greyish black gritty diamictite with angular 0-4 mm matrix supported clasts
21 Dark greyish black pebbly diamictite with , angular matrix supported clasts > 4 mm diameter.
Not applicable.
22 Coal mixed dull and bright. More stable roof rock than facies 1-3.
23 Mixed coal and mudstone.
24 Massive greyish-black carbonaceous mudstone associated with coal seam middling.
Not applicable.
Buddery and Oldroyd (1992) developed a roof and floor classification system for collieries. The
following principles were applied in the creation of this classification system:
• Rock property tests should be related to the expected mode of failure of the strata;

59
• The whole spectrum of strata should be tested, with particular emphasis placed on
obtaining the properties of the weakest material; and
• Large numbers of tests should be able to be conducted simply, quickly, at low cost and
in-house.
Roof failure in South African coal mines is strongly related to the frequency of laminations or
bedding planes. In their roof classification, Buddery and Oldroyd (1992) considered a Coal Rock
Structure Rating (CRSR) system to classify the roof condition. Tests to indicate the propensity
of the laminations or bedding planes to open and separate would therefore be ideal for
planning. The tests should indicate the mode of failure of the roof and it should be easy for a
large number of tests to be conducted in-house. This was initially based on three parameters:
RQD, the results of impact splitting tests, and a parameter related to joint condition and
groundwater. Owing to the difficulty in satisfactorily distinguishing between drilling-induced and
natural fractures in the coal measures strata, the RQD parameter was discarded from the
system. The third parameter (joint condition and groundwater) proved to be difficult to determine
irrespective of the roof type. It was therefore decided to confine the determination of roof ratings
to the results of impact splitting tests.
The impact splitting test involves imparting the same impact to the core at 20 mm intervals. The
resulting fracture frequency is then used to determine a roof rating. The instrument shown in
Figure 2—23 consists of an angle iron base which holds the core. Mounted on this base is a
tube containing a chisel with a mass of 1.5 kg and a blade width of 25 mm. The chisel is
dropped onto the core from a constant height according to core size; 100 mm for a 60 mm
diameter core and 64 mm for 48 mm diameter core. The impact splitter causes weak or poorly
cemented bedding planes and laminations to open, thus giving an indication of the likely in situ
behaviour of the rock when subjected to bending stresses.
Figure 2—23 The impact splitting equipment

60
It is suggested that, when coal mine roof support is designed, 2.0 m of strata above the
immediate roof should be tested. If failure is likely on any particular roof horizon, then all strata
from the lowest likely roof horizon to 2.0 m above the highest likely roof horizon are tested. In
this classification system, the strata are divided into geotechnical units. The units are then
tested and a mean fracture spacing for each unit is obtained. An individual rating for each unit is
determined through the use of one of the following equations:
For fs < 5 rating = 4fs
For fs > 5 rating = 2fs+10 [2-14]
Where fs = fracture spacing is in cm.
ROOF HORIZON
t (m)h (m)
ROOF HORIZON
t (m)h (m)
t (m)h (m)
Figure 2—24 Impact splitting unit rating calculation
This value is then used to classify the individual strata units into rock quality categories as
shown in Table 2—5. For coal mine roofs, the individual ratings are adjusted to obtain a roof
rating for the first 2.0 m of roof. It was stated that the immediate roof unit will have a much
greater influence on the roof stability and consequently, the unit ratings are weighted according
to their position in the roof with the use of the following equation:
Weighted rating = rating x 2(2-h) t [2-15]
Where h is mean unit height above the roof in metres and t is thickness of unit in metres (Figure
2—24).
The weighted ratings for all units are then totalled to give a final roof rating. Buddery and
Oldroyd (1992) concluded that good agreement between expected and actual roof conditions
were found when this rating system was used.
Table 2—5 Unit and coal roof classification system (after Buddery and Oldroyd,
1989)
Unit Rating Rock Class Roof Rating
t (m)

61
< 10 Very poor < 39
11 – 17 Poor 40 – 69
18 – 27 Moderate 70 – 99
28 – 32 Good 100 – 129
> 32 Very good > 130
This rating system has recently been modified by Ingwe Rock Engineering to take into account
areas where the immediate roof is coal. The unit rating is multiplied by 1.56, which is the ratio of
sandstone density (2500 kg/m3) to coal density (1600 kg/m3).
On the basis of this rating system the support patterns listed in Table 2—6 are adopted,
together with a special “current-with-mining assessment” technique for adapting to changing
roof conditions.
Table 2—6 Estimated support requirements for different roof classifications (after
van Wijk, 2004)
Typical systematic support
Roof condition
Bord width (m) Type Length (m) Pattern
Distance between rows of
bolts (m)Excellent 7 M16 point anchor 0.9 or 1.2 Spot bolting false roof N/A
Very Good 6.5 to 7 M16 point anchor 1.2 Spot bolting and 5 bolts per intersection only N/A
Good 6 to 6.5 M16 point anchor 1.2 or 1.5 5 bolts per intersection and 2 per row in bords 2 to 2.5
Moderate 5.5 to 6 M16 or M20 full-column resin 1.5 or 1.8 9 bolts per intersection and 3 per row in bords 1.5 to 2
Poor 5 to 5.5 M20 full-column resin 1.8
16 bolts per intersection and 4 per row in bords. Steel straps may be necessary
1 to 1.5
Very Poor <5
Specialised support. e.g. 1.8m M20 full-column resin bolts and/or cable anchors with steel straps. Cable trusses, cluster stick packs or shotcrete may also be required
≥1.8
As dictated by conditions. Typically 5 bolts per row with steel straps. Often 9 cables in intersections.
<1
Sasol Coal has also developed a roof rating system based on fall of ground accidents. Analyses
of fall of ground (FOG) accidents in Group collieries indicated that almost all such accidents
occurred near dykes and underneath rivers. The collieries were divided into four groups
indicating the roof conditions on the basis of these two criteria. These areas are marked on
mine plans as “Normal”, Class “C”, Class “B” and Class “A”. The worst and the best ground

62
conditions are expected in Class “A” and “Normal” respectively. Although there is no difference
in specified mining parameters between the “Normal” and Class ”C” roof, Class ”C” gives the
section a warning of possible changes in ground conditions, which allows time to ensure that
support standards are strictly adhered to before a Class “B” area is reached. In Class "C" areas,
a spare roof bolter and tell tales should be available to identify and deal with possible roof
deterioration.
On each special area plan, a borehole log is also attached to indicate to mining personnel the
roof structure in the area. This log also assists mining personnel in determining what length of
roof bolt to use in the area. The same mining group has also developed a rating system to be
used on borehole cores in greenfield areas, called the “Percentage Lamination Plan”. This plan
assists mining personnel in determining;
• The thickness of laminated material;
• The position of the laminated stratum within the roof;
• Whether the lamination is such that intersection failure can occur; and
• Whether the section is approaching ground where drastic changes in roof conditions are
likely to occur.
This plan indicates the percentage laminated strata in the direct roof and is expressed in the
following ranges: the first metre of roof, the second metre of roof and the first two metres of roof.
There are also rating systems used in South Africa that are empirical correlations between
particular features and roof behaviour, based largely in the local geology. These systems are
usually based on the experience of mining personnel or geologists. If a specific layer (or the
position of a layer) has caused problems underground, these layers and/or positions usually
form the basis for the rating systems. An experienced geologist identifies the significant layer
and its position in the roof during the logging of boreholes. This information is then marked on
mine plans referred to as “Roof Hazard Plans”. In geology-based rating systems, the thickness
of particular layers is also important. Therefore, for some mines, the roof rating is based on the
thickness of particular layers, such as sandstone, shale or siltstone, and the roof support pattern
is determined by the assessed quality of the roof. It was also found that geological
discontinuities are important and play a major role in the quality of roof, for this reason some
mines have adapted rating systems on the basis of these features.
Investigations into the rating systems used in South Africa (Canbulat and Dlokweni, 2003) have
highlighted that roof rating systems are being used mainly for planning purposes, and not
necessarily to determine changing conditions underground. However, rating systems have been

63
developed in South Africa by Ingwe Coal (Oldroyd and Latilla, 1999) whereby support systems
are changed on the basis of on-going evaluation of underground conditions.
2.4.5 Physical modelling
Yassien (2003) states that physical modelling is a very useful tool for the design of underground
roadways as it allows accurate measurement of bolt performance under controlled test
conditions in the laboratory. Technically, however, it is difficult to ensure a consistent similitude
ratio of geometry and material properties.
An early attempt at a comprehensive design procedure was presented by Panek (1964). A
series of scale model tests were conducted using limestone slabs to represent roof beds. The
results were presented in the form of a monogram that related bed thickness and roof span to
the required bolt length, tension, and pattern. Although Panek's monogram continues to be
republished, it has not been used for practical design in decades (Fuller, 1999; Mark, 2000).
Several researchers have also used physical models to explore roof bolting performance
(Fairhurst and Singh, 1974; Dunham, 1976; Gerdeen et al., 1979). All of these studies assumed
that the roof was perfectly bedded, and it was consistently found that bolts located in the centre
of the roadway added little to roof stability. In contrast, one model study of roof containing low-
angle shears as well as bedding found that an evenly spaced pattern performs best (Mark,
1982).
By simulating a physical model for a roadway, Dunham (1976) studied the influence of bolt
length, bolt spacing, bolt pattern, and inclination of the outer bolts on the stability of the roadway
model. The fully grouted bolt was simulated by a 0.4 mm diameter silver wire, with resin injected
into the hole by syringes. It was found that the bolt length had a significant effect on the failure
mode and that increasing the bolt length could increase the stability of the roadway. Moreover,
the angled outer bolts create more stable conditions and reduce the diagonal shear cracks
above the rib. Considering the lateral and longitudinal spacing together, it appears there is
scope for reducing the number of bolts and decreasing the spacing between rows in the
formulation of a roof bolting pattern.
Another physical model was described by Tully (1987). It was found that the use of five 2.4 m
bolts with two outer bolts inclined at 35 to 40° reduced the roof convergence.

64
Spann and Napier (1983) conducted a series of model tests to study and verify the beam-
building concept. Figure 2—25 shows the different roof bolting patterns that were modelled in
the laboratory, and Figure 2—26 shows the effectiveness of the various patterns in controlling
roof deflection. The effectiveness of roof bolts installed close to the roadway abutments in
controlling shear movement, and hence beam deflection, is evident.
Spann and Napier (1983) concluded that the most important factor governing beam deflection is
the location of the bolts in the beam, and that the best results are obtained if the bolts are
installed close to the clamped end (abutment) of the beam.
0
2
1
7
8
9
10
11
12
13
14
15
16
17
6
5
4
3
0
2
1
3
4
4
4
5
5
6
6
6
8
11
3
3
2
2
Figure 2—25 Bolt pattern (after Spann and Napier, 1983)

65
0
1
27
3
4
5
68
109
1112
15
1314
16
17
0
0.05
0.1
0.15
0.2
0.25
0.3
0.35
0.4
0 1 2 3 4 5 6 7 8 9 10 11 12
No BOLT
DEF
LEC
TIO
N (m
m)
1 = BOLT PATTERN
Figure 2—26 Deflection compared to number of bolts (after Spann and Napier, 1983)
2.5 Geometric parameters
2.5.1 Bolt length
The optimal roof bolt length depends on the support mechanism. Where bolts are merely acting
as skin control, they may be as short as 900 mm (Minney and Munsamy, 1998). In the
suspension mode, bolts should obtain at least 300 mm of anchorage in the solid strata (Mark,
2000). In the USA, federal regulations (30 CFR 75.204) require that when point-anchor bolts are
used, test holes are to be drilled at least another 300 mm above the normal anchorage.
Van der Merwe and Madden (2002) state that with resin bolts used in suspension mode, the
longer the resin portion in the hole, the stronger the anchor. The bolt length must therefore be
greater than the thickness of the laminated zone and have sufficient anchorage length above

66
this zone to provide a strong enough anchor to suspend the laminations. The required strength
of the anchor depends on the spacing of the bolts and the thickness of the laminated layer.
The required anchor length is determined by two methods in South African collieries. One is to
use destructive pull tests to determine which minimum bond length will allow consistent failure
of the tendon prior to anchor failure. The second method is to determine the mean shear
strength of the bond, τ, by means of short anchor tests. In these tests a short capsule (250 mm)
is used, and the bolt is pulled to failure.
The bond length, LB, is given by:
22
2
dDL
L cB −=
δ[2-16]
where, δ = capsule diameter (mm)
D = hole diameter (mm)
d = tendon diameter (mm)
Lc = capsule length (mm)
The mean shear strength may then be calculated from:
B
f
DLP
πτ = [2-17]
where, τ = mean shear strength (Pa)
Pf = yield load of bolt (N)
D = hole diameter (m)
Lc = capsule length (m)
Once τ has been determined by short encapsulated pull tests, the calculation may be reversed
in order for the required capsule length to be found through substituting Pf for a design load. A
suitable safety factor should also be used.
The proper bolt length is more difficult to determine in the beam-building mode. Van der Merwe
and Madden (2002) suggest that the bolts must be longer than the thickness of the beam
created, which is a function of road width, stress levels, etc.
Several investigators have also studied the optimal length of the bolt that should be installed
under various conditions. A summary of recommendations is given below. Note that B is span
(m) and L is bolt length (m).
• Dejean and Raffoux (1976)

67
L = 1 m (strong homogeneous rock)
L = (1/3– 1/2) B (weak homogeneous rock)
L ≥ 1.5 m (strong stratified rock)
L = (1/3 – 1/2) B (weak stratified rock)
[2-18]
• Tincelin (1970)
L > 1/3 B (Roadways)
L ≥ 1.25 (1/3 B) (strong stratified rock) [2-19]
• Lang and Bischoff (1982)
L = B2/3 [2-20]
• Bieniawski (1987)
L = B/3 [2-21]
• Unal (1984)
−
=
100100
2RMRBL [2-22]
Where RMR is the rock mass rating (Bieniawski, 1987) which ranges from 20 to 80 depending
on roof rock conditions.
• Mark (2001)
−
=100
100)225.3(log)(12.0 10CMRRHIL sB [2-23]
Where: LB = Bolt length (m)
Is = Intersection span (average of the sum-of-the-diagonals, m)
H = depth below surface (m)
CMRR = Coal Mine Roof Rating
2.5.2 Bolt diameter
The yield capacity (C) of a roof bolt is normally determined by the bolt diameter (D) and the
grade of the steel (G) (Mark, 2000):
2
4GDC
=π
[2-24]
This equation highlights that the yield strength of a bolt is proportional to the square of the
diameter. In addition, as the bolt diameter increases, the stiffness of the bolt increases (see

68
Section 2.7). Many authors argue in favour of greater bolt capacity to improve the effectiveness
of roof bolts (Gale, 1991; Stankus and Peng, 1996). Higher capacity bolts are also capable of
producing more confinement and promoting greater shear strength in the rock, and they may be
pre-tensioned to higher loads (Mark, 2000).
Wullschlager and Natau (1983) analysed a finite element model to study the effect of changing
the fully grouted bolt diameter on the load deformation behaviour of the bolt. The result showed
that as the bolt diameter increases from 28.3 mm to 80 mm, the bolt stiffness increases.
Coats and Cochrane (1971) proposed the following formula for calculating the bolt diameter
according to the yield strength of the steel:
AR σ=max [2-25]
nd
SFR
P σ2max 785.0== [2-26]
Where Rmax is the maximum bearing capacity of bolt; P is the allowable axial load in the bolt in
kN; SF is the safety factor (chosen as 2-4); and σ is the yield strength of the steel in kg/cm2; A is
the bolt area in cm2, n is the number of bolts and d is the bolt diameter in cm.
Mark (2001) suggests the following formula for determining the bolt pattern (PRSUP) and
capacity:
)(5.14 eB
BB
WSCNL
PRSUP = [2-27]
Where: NB = Number of bolts per row
C = Capacity (kN)
SB = Spacing between rows of bolts (m)
We = Road width (m)
Mark (2001) states that the suggested value of PRSUP depends on the CMRR and the depth of
cover, as expressed in the following equations:
PRSUP = 15.5 - 0.23 CMRR (shallow depth) [2-28]
PRSUP = 17.8 - 0.23 CMRR (high and moderate depth) [2-29]
Where CMRR is the Coal Mine Roof Rating

69
2.5.3 Bolt pattern
Lang and Bischoff (1982) found that the bolt spacing should satisfy the criterion that the ratio of
bolt length to bolt spacing should be 1.5 in general, and a minimum of 2.0 in fractured rock.
Bieniawski (1987) states that in coal mine roofs, this ratio should, in general, be 1.2.
In U.S. coal mines four bolts per row in 5.5 m to 6.1 m-wide roadways has become the near-
standard and bolt spacing is constrained by law to a maximum of 1.5 m (Mark, 2000). However,
according to Mark (2000), by international standards, 1.5 m bolt spacing is relatively light
compared to the UK and Australian mines for beam building in high-stress conditions. In the UK,
the minimum bolt density allowed by law is one bolt per square metre, and many Australian
mines use similar bolt densities. In South Africa, however, there is no restriction for minimum
bolt density. Therefore, the bolt spacing is greater, which has resulted in falls of ground in South
African collieries (van der Merwe et al., 2001).
The roof bolt pattern in South Africa is based on the beam theory (Buddery, 1989; van der
Merwe, 1995; van der Merwe, 1998; van der Merwe and Madden, 2002). Mines also conduct
statistical analyses on falls of ground incidents to determine the spacing requirements of bolts.
The field study reported by Maleki et al. (1994) found that increasing the bolt density reduced
the average bolt load, while the total load remained approximately the same. Other researchers
have found that when one side of the roadway suffers stress damage, bolts on that side sustain
significantly higher loads (Mark and Barczak, 2000; Siddall and Gale et al., 1992). Additional
bolts on the stress-damage side can help maintain overall stability (Maleki et al., 1994).
2.5.4 Annulus size
Karabin and Debevec (1978) states that the anchorage capacity of a roof bolt increases with
roof bolt diameter; this holds true so long as the hole annulus or thickness of the resin between
roof bolt and rock remains constant. For a constant annulus, increasing borehole diameter (and
bolt diameter) increases both the maximum load-bearing capacity of the bolt and the shear
strength of the resin/rock interface.
Snyder et al. (1979) argue that an increase in the borehole diameter must be accompanied by a
commensurate increase in the diameter of the roof bolt, as this would otherwise lead to an
increase in resin thickness. This would result in poor confinement of the resin, leading to a
reduction in the shear strength of the bond.

70
Franklin and Woodfield (1971) found that when a 19 mm rebar was used, a resin annulus of
6.4 mm resulted in the strongest and most rigid anchorage system. Dunham (1976) suggests an
optimal range of resin annulus of between 4 and 6 mm.
Wagner (1985) suggests that the bolt hole size should be a maximum of 6 to 8 mm greater than
the nominal bolt diameter (3 to 4 mm annulus). This has been the design criterion in South
Africa for many years. However, numerous tests have been conducted recently, which have
shown that resin annulus is one of the critical variables that affect the bolt performance. The
optimal difference between the diameter of the bolt and the diameter of the hole has been found
to be no greater than 6 mm, giving an annulus of about 3 mm (Fairhurst and Singh, 1974;
Karabin and Debevec, 1976; Ulrich et al., 1989).
Larger holes can result in poor resin mixing, a greater likelihood of "finger-gloving", and reduced
load-transfer capability (Mark, 2000). Work reported by Fabjanczyk and Tarrant (1992) on roof
bolt push tests showed a marked reduction in load-transfer performance of over 30 per cent with
an increase in borehole diameter from 27 mm to 29 mm when a standard 22 mm roof bolt was
used. Fabjanczyk and Tarrant (1992) suggest that the optimal borehole size is the smallest
practical diameter when both bolt installation factors and resin viscosity are taken into account.
Laboratory and field tests performed by Tadolini (1998), however, indicated that annuli ranging
from 2.5 to 6.5 mm provided acceptable results in strong rock. Smaller holes can reduce the
resin flow around the bolt, which may cause the loss of resin into bedding planes and vertical
fractures in the rock mass (Campoli et al., 1999).
Hagan (2003a) conducted a series of laboratory tests to determine the effect of resin annulus
on pull-out load. Mix-and-pour resin was used to avoid the effect of plastic packaging on the
maximum pull-out load. It was concluded that there was an insignificant difference in the
stiffness for resin annulus thicknesses of 2, 3 and 4 mm up to the maximum pull-out load. The
results also showed that the lowest maximum pull-out load and post-failure stiffness were
associated with the smallest annulus. Hagan (2003a) concluded that this may indicate the need
for a minimum amount of resin for good bonding and load transfer between a roof bolt and rock.
In addition, it should be noted that smaller annuli (< 3.0 mm) may cause significant temperature
rises during the mixing in the hole, which may accelerate setting of the resin, causing gellation
before the determined setting time has expired.

71
2.6 Tensioned versus non-tensioned bolts
The choice of tensioned or non-tensioned bolts is one of the most discussed topics in roof
bolting (Mark, 2000). A number of papers have been published on this topic in Australia and the
US. The issue is complicated, as there are three possible systems: fully grouted non-tensioned,
fully grouted tensioned, and point-anchor tensioned.
Peng (1998) states that resin-assisted point-anchor tensioned bolts can be used to clamp thinly
laminated roof beds into a thick beam that is more resistant to bending. In addition, Stankus and
Peng (1996) state that by increasing frictional resistance along bedding planes, roof sag and
deflection are minimised and that lateral movement due to horizontal stress is less likely.
Tensioned bolts are also more efficient, because a stronger beam can be built with the same
bolt by applying a larger installed load (Mark, 2000).
Frith and Thomas (1998) and van der Merwe and Madden (2002) advocate pre-tensioning fully
grouted bolts using two-stage resins and special hardware. Frith and Thomas (1998) argue that
active pre-loads modify roof behaviour by dramatically reducing bed separation and
delaminations in the immediate 0.5 to 0.8 m of roof. In addition, Frith and Thomas (1998) state
that the key reason why tension works can be better understood if the roof is seen as an Euler
buckling beam. In the presence of a pre-tensioned beam, small vertically applied loads have
less potential to cause instability.
Gray and Finlow-Bates (1998) found that non-tensioned, fully grouted bolts with good load-
transfer characteristics may be just as effective. It is argued that a preload of 100 kN results in a
confining stress of only 70 kPa within the immediate roof, which is small compared to in situ
horizontal stresses, which are at least 10 times greater. Others have observed that in field
measurements, resin bolts have quickly achieved loads that are even greater than those on
nearby point-anchor bolts (Mark et al., 2000). McHugh and Signer (1999) showed that, in
laboratory tests, pre-tensioning fully grouted bolts did little to strengthen rock joints.
Fuller (1999) concludes that "the generally positive results of field trials indicates that pre-
tensioning, when combined with full bonding of bolts, provides the maximum strata
reinforcement".
Unfortunately, direct comparisons of the three systems are rare (Mark, 2000). Anecdotal
evidence is often cited, sometimes from situations where bolt length, capacity and pre-tension
were changed (Stankus, 1991). There is a consensus that large preloads are not necessary for

72
resin bolts to function effectively in the suspension mode (Peng, 1998; Frith and Thomas, 1998;
Maleki, 1992), but more research is suggested for more specific conclusions to be drawn.
While plate loads may be typically 30 to 50 kN in South African collieries, Singer (1990)
measured plate loads of approximately 11 kN in the USA. Plate loads can increase by a factor
of ten or more in highly deformed ground (Tadolini and Ulrich, 1986). Plate load as a function of
time in South African collieries was measured as part of this project (Figure 2—27). This figure
indicates that the load on the plate reduces over time.
0
5
10
15
20
25
30
35
40
45
50
0 20 40 60 80 100
120
Time (days)
Load
(kN
)
Figure 2—27 A typical plate load versus time in South African collieries (after
Canbulat et al., 2003)
2.7 Stiffness of roof support
Stiffness is a measure of how quickly a support develops load-carrying capacity in response to
roof strata dilation (Mark, 2000). Stiffer supports will develop capacity over less displacement
than softer supports.
Stiffness (K) is a function of the area (A), material modulus of elasticity (E), and the length of the
support (L):
LEA
K = [2-30]

73
This equation indicates that the stiffness increases with increasing area (bolt diameter) and
material modulus (steel modulus) and decreases with increasing length. It should be noted that,
with a conventional point-anchor mechanical roof bolt, the bolt is anchored only at the top, and
the “free length” of the bolt is the entire length of the bolt less the anchored length. In full-
column resin bolts, the “free length” of the bolt is less, and the full-column roof bolts hence
provide stiffer support than mechanical bolts (Mark, 2000).
2.8 Intersection support
Intersections are particularly susceptible to strata control problems as a result of inherently wide
roof spans and resulting induced stress. This situation is accentuated in the presence of high
horizontal stresses. As a result many authors have investigated this problem area (Gercek,
1982; Hanna and Conover, 1988; Vervoort, 1990; Molinda et al., 1998; Canbulat and Jack,
1998; Mark, 2001; Zhang, 2003; van der Merwe et al., 2001, van der Merwe and Madden,
2002).
Vervoort (1990) investigated the fall of ground (FOG) fatalities in South African collieries. It was
found that 43.4 per cent of all FOG fatalities for the period 1970 to 1988 occurred in
intersections. Further analyses of FOG fatalities carried out by Canbulat and Jack (1998) also
showed that the majority of FOG fatalities (36 per cent) for the period covering 1989 to 1995
occurred in intersections. Van der Merwe et al. (2001) also conducted a study into the causes of
FOG in South African collieries. Again, it was found that the majority of all roof falls occurred at
intersections, which were responsible for 66 per cent of the 182 falls of ground investigated.
Note that there was no mention in these studies of whether the intersections were supported or
not.
Van der Merwe et al. (2001) state that intersections account for approximately 30 per cent of the
total exposed roof, which means that the risk of a roof fall in an intersection is more than four
times greater than in a roadway. According to Molinda et al. (1998), approximately 71 per cent
of all FOG occurred in intersections, indicating that the roof fall rate in the US is eight to ten
times greater in intersections than in roadways.
Studies have shown that intersection stability is a function of rock quality and the ratio of
horizontal stress to vertical stress (Molinda et al., 1998; Gercek, 1982; Unal, 1984). The
following steps were recommended by various authors for reducing the risk of failure in
intersections:

74
• Roof control plans should be developed that specify the maximum spans that are
allowed (Molinda et al., 1998; van der Merwe and Madden, 2002).
• Mining sequence should be designed to limit the number, location, and size of splits, and
not to orient splits at critical angles to the principal horizontal stress direction (Molinda et
al., 1998, Hanna and Conover, 1988).
• Bolt length and bolt density in intersection corners near the ribsides should be increased
(Hanna and Conover, 1988; Zhang, 2003).
• Splits should be holed only into supported intersections (Minney and Munsamy, 1998).
On the other hand, Molinda et al. (1998) found that replacing four-way intersections with three-
way intersections may not be an effective control technique in terms of roof stability.
Current practice for supporting intersections is to use the same roof bolt design as for roadways,
seldom with additional supports. Local experience has often determined additional support in
intersections. In order to support the intersections efficiently, a better understanding of rock
behaviour in intersections is required. The influence of different strata conditions on this
behaviour needs to be determined so that better support design and installation rules can be
facilitated. This will improve overall stability and reduce accidents due to roof falls in
intersections.
2.9 Discussion and conclusions
Since the introduction of mechanical bolts in the 1940s, the amount of research into the
understanding of the behaviour of roof bolts has been significant. Today, almost all coal mine
roofs are supported with roof bolts in South Africa.
In the early years, the design of roof bolt patterns was based on local experience and the
judgement of mining personnel. The suspension mechanism was the most easily understood
and most widely used roof bolting mechanism. However, significant advances have been made
over the last 20 years, in particular, the development of resin anchors, tendon elements, and
installation hardware. These advances have resulted in an increase in the use of full column
resin bolts.
The design of roof bolt patterns has also been improved, and four main rock reinforcement
techniques have been developed: simple skin control, beam building, suspension, and keying.
The geology and the stress levels determine the appropriate mechanism for a particular
application.

75
Investigations into the causes of roof falls in South African collieries have highlighted that, whilst
roof conditions are comparatively better in South Africa, the roof bolt densities are relatively low
in comparison with those used in the USA, the UK and Australia. Therefore, the main cause of
FOG was found to be excessive bolt spacing, causing skin failures between the bolts.
The importance of tensioning roof bolts remains a subject of controversy. As will be seen in the
following chapters, the critical roof deformations in South African collieries are relatively small.
Therefore, tensioned roof bolts are beneficial in that they allow less roof deformation to take
place after the support has been installed. However, if the bolting system is stiff enough,
tensioning may not be required.
Although there have been many studies into the support of intersections, a better understanding
of rock behaviour in intersections is required.
Numerical models are useful in understanding roof and roof bolt behaviour; however, extensive
laboratory studies are required for determining the input parameters. The Australian technique,
subsequently adapted in the UK, has proven that numerical modelling can be used to back
analyse underground scenarios. Once the model is calibrated, then the results obtained from
the numerical models can be used for design.
The selection of roof bolt type for different geological environments is well documented.
However, the changing conditions underground must also be determined and the design and
the support system have to be modified accordingly. Widespread instrumentation and vigilant
visual observations are important for ensuring safety and stability in coal mines.
While the effect of roof bolt diameter on support performance is well understood, there is still
controversy over the length of the roof bolts. It has been shown by Molinda et al. (2000) that the
probability of roof failures increases with decreasing bolt length. Since skin failures (< 0.5 m
thick) are more common in South Africa than larger roof falls (Canbulat and Jack, 1998, van der
Merwe and Madden, 2002), short roof bolts for skin control may make up part of an effective
support system.
In conclusion, despite the fact that roof bolting has been the most researched aspect of coal
mining, FOG still remain the major cause of fatalities in South Africa. There are no commonly
accepted design approaches available for underground coal mines. Roof bolts were found to
behave differently under different loading conditions, emphasising the importance of
understanding the interaction between the roof bolts and the rockmass. The most important key

76
to the design of a roof support system is a better understanding of roof behaviour in different
geotechnical environments through continuous in situ monitoring.

77
3 Testing procedures
Rock Mechanics Technology (RMT) evaluated the underground short encapsulated pull testing
(SEPT) procedures and the laboratory testing procedures as part of this project.
3.1 Short encapsulated pull testing
3.1.1 Introduction
This section provides guidance on a reliable and accurate testing procedure for determining the
mechanical and capacity properties of roof bolts. It is aimed at rock engineers and technicians
who are familiar with rockbolt support operations and are involved in this evaluation. The results
from the suggested testing procedure can be used for rockbolt design verification and routine
quality monitoring.
The ability of fully bonded rockbolt systems to provide reinforcement depends on the strength
and stiffness of the bond between the rockbolt and the rock. These qualities can be measured
in the laboratory or underground, with the use of short encapsulation pull testing. This section
concentrates on underground short encapsulation pull testing. The performance of partially
encapsulated types, such as point anchored bolts, falls somewhere between these two
extremes, depending on both the bond strength and degree of encapsulation.
Each of the elements of a rockbolting system - hole size, drill bit size and type, resin properties,
steel properties and bolt profile – should be developed to maximise the bond strength, and yet
provide a system capable of rapid installation. The torque nut and plate assembly should be
designed to give resin-mixing quality control during installation and to allow post-installation
quality auditing to be carried out.
3.1.2 Bond strength
Bond strength is measured through short encapsulation pull tests (SEPT). The objective of the
test is to fail the resin bond and to characterise the bond failure in terms of bond strength and
system stiffness. Thus, in order to measure the bond strength, it is necessary to shear the bond
on the bolt-resin or resin-rock interface. With the modern high-strength, high-stiffness, polyester
resins that are in use today, it has been found through numerous tests, that a bond length of
250 mm is appropriate for determining the resin bond for a 20 mm diameter bar.
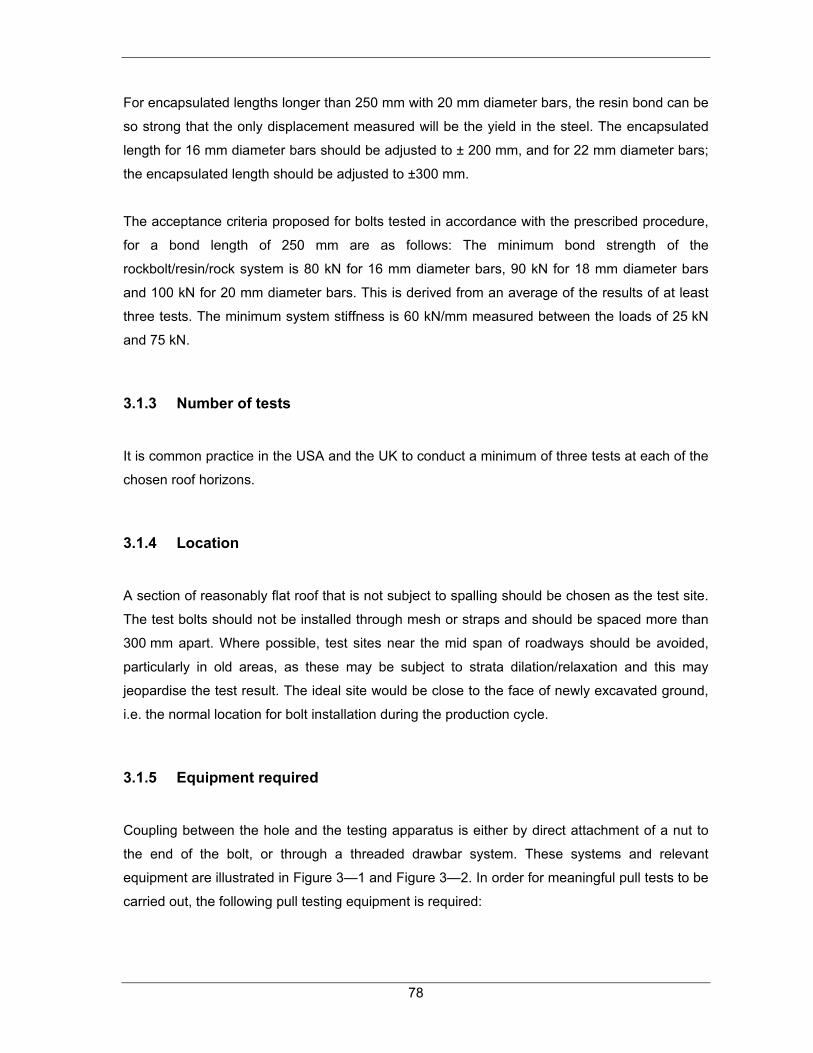
78
For encapsulated lengths longer than 250 mm with 20 mm diameter bars, the resin bond can be
so strong that the only displacement measured will be the yield in the steel. The encapsulated
length for 16 mm diameter bars should be adjusted to ± 200 mm, and for 22 mm diameter bars;
the encapsulated length should be adjusted to ±300 mm.
The acceptance criteria proposed for bolts tested in accordance with the prescribed procedure,
for a bond length of 250 mm are as follows: The minimum bond strength of the
rockbolt/resin/rock system is 80 kN for 16 mm diameter bars, 90 kN for 18 mm diameter bars
and 100 kN for 20 mm diameter bars. This is derived from an average of the results of at least
three tests. The minimum system stiffness is 60 kN/mm measured between the loads of 25 kN
and 75 kN.
3.1.3 Number of tests
It is common practice in the USA and the UK to conduct a minimum of three tests at each of the
chosen roof horizons.
3.1.4 Location
A section of reasonably flat roof that is not subject to spalling should be chosen as the test site.
The test bolts should not be installed through mesh or straps and should be spaced more than
300 mm apart. Where possible, test sites near the mid span of roadways should be avoided,
particularly in old areas, as these may be subject to strata dilation/relaxation and this may
jeopardise the test result. The ideal site would be close to the face of newly excavated ground,
i.e. the normal location for bolt installation during the production cycle.
3.1.5 Equipment required
Coupling between the hole and the testing apparatus is either by direct attachment of a nut to
the end of the bolt, or through a threaded drawbar system. These systems and relevant
equipment are illustrated in Figure 3—1 and Figure 3—2. In order for meaningful pull tests to be
carried out, the following pull testing equipment is required:

79
• 20/30-tonne hydraulic pump with custom gauge as per hydraulic ram area, system
calibrated in tonnes and/or kN, capable of reading pressures to an accuracy of better
than 10 kN.
• 20/30-tonne hydraulic hollow ram of known effective area, with at least 3.0 m suitable
hydraulic hose (300 kN capacity), complete with couplers.
• Dial gauge micrometer with a minimum range of 15 mm capable of reading to an
accuracy of 0.01 mm.
• Extendable (telescopic) pole with suitable bracket to connect to the dial gauge.
• Dial gauge positioning nut/locator nut for dial gauge pointer to fit end of rockbolt.
• Two steel backing plates/bearing plates
• Packing shims for uneven roof made from mild steel plate 150 mm x 50 mm.
• Drawbar (if drawbar method is used)
• Borehole micrometer (Tri-bor) for measuring inner diameter of borehole
• Vernier Calliper for measuring diameter of rockbolt
• Go/No-go gauge for measuring resin diameter
• Hand tools and consumables including:
o Plastic cable tie wraps for preparation of short resin capsules;
o Tape measure and knife;
o Pliers / Cutters;
o Paint marker;
o Plastic adhesive insulating tape; and
o Shifting (adjustable) spanners;
Note that the hydraulic system needs to be calibrated regularly (at intervals of no greater than
three months).

80
Figure 3—1 SEPT using a drawbar
Figure 3—2 SEPT installed over rockbolt

81
3.1.6 Measurements required
Measurement of bolt length, bolt and resin capsule diameter are required.
When a draw bar is used, the bolt length needs to be at least 50 mm longer than the hole length
to allow full engagement of the drawbar on the threaded end of the bolt. When a draw bar is not
used, the bolt needs to extend from the collar of the roof hole by a sufficient length for the pull
test jack assembly and double nut fixing to be assembled. To conduct the test within the roof
strata at the top of the bolted horizon, specially prepared longer bolts are needed.
All test bolts, including full-length bolts, need to be cut square to the bolt axis. Bolts need to be
cleaned so that they are free from dirt, loose rust, paint, or other surface contaminants.
The test bolt is marked off 250 mm from the end, and tape is wound around the next ± 100 mm
with PVC tape (electricians tape) as shown in Figure 3—3 (double wound). This is done to
ensure the accuracy of the bond length of 250 mm. Any excess resin will flow over the taped
part of the bolt and will not bond properly.
Figure 3—3 Bolt preparation
Using a Vernier Calliper the bolt diameter must be measured in detail, both over the ribs and the
core of the bolt, and recorded on the log sheet. The bolt must be suitably marked.

82
Using either a Vernier Calliper or a Go/No-go gauge the resin diameter must be recorded and
the capsules marked accordingly.
Note that it is recommended that a new drill bit of the specified type be used for each test. Also,
the same drilling machine and operator needs to be used throughout the tests. The width of the
tip of the bit must be measured with a Vernier Calliper. The degree of reaming in the hole can
be quantified through these measurements. The hole debris clearance system normally used for
bolt installation must be used to clean the installation hole.
Drill holes to the required depth. Mark drill steel to ensure the correct depth is drilled and check
hole depth after drilling with the use of the test bolt. The depth of the hole can be checked for
correct length (Sections 3.1.8 and 3.1.9).
After the holes have been drilled, the inside diameter of the drilled hole is measured, at intervals
along the back 250 mm of the hole with a borehole micrometer. A minimum of four
measurements are required, over the 250 mm distance, as shown in Figure 3—4. These
measurements are averaged. This procedure is repeated for each hole drilled.
Figure 3—4 Borehole micrometer for measuring borehole diameter
3.1.7 Capsule preparation and measurement of embedment length
The required length of capsule is calculated through the use of equation 3-1.

83
)()(sinRe
)()(2
22
mmlengthBondxmmdia
mmdiaBoltmmdiaHolelengthCapsule −= [3-1]
Add 10 mm to the capsule length to allow for irregular capsule ends. Test resin capsules of the
calculated length are prepared from the resin used in the heading, using cable ties, as
illustrated in Figure 3—5 and Figure 3—6.
Figure 3—5 Resin preparation
Figure 3—6 Resin pill resizing

84
3.1.8 Bolt installation procedure for SEPT using a drawbar
The roof should be inspected for obvious fractures, bed separation, and/or loose rock, and
dressed or barred. The test holes should be marked off on flat, stable roof.
The drill steel should be marked to correspond with distance “A” as shown in Figure 3—7. The
hole is then drilled perpendicular to the roof and properly flushed.
Figure 3—7 Measurements for calculations, using a drawbar
At this point all necessary measurements (as described in Section 3.1.6) should be made.
When the bolt is inserted into the back of the hole, ± 50 mm must protrude from the bottom of
the hole to allow the drawbar to be safely attached to the bolt. The resin cartridge and bolt
should be inserted by hand to ensure that no damage occurs to the cartridge during installation.
The machine is then raised to the bolt and the bolt engaged in the chuck adaptor. The bolt and
capsule are accurately positioned using the depth mark on the bolt to indicate when the resin
capsule is at the back of the hole.
The machine is activated and the bolt spun for the instructed period as per normal installation of
bolt. The spin period is timed and recorded on the log sheet. The bolt is held for the instructed
period. Note the bolt is not pre-tensioned through breaking out the shear pin. The roofbolter

85
spanner is removed and the resin allowed to cure for at least one hour, but for no more than 24
hours.
3.1.9 Bolt installation procedure for SEPT installed over rockbolt
As per the drawbar installation, the roof should be inspected and an appropriate site selected.
The drill steel should be marked to correspond with distance “A” as shown in Figure 3—8. The
hole is then drilled and appropriate measurements are made.
Figure 3—8 Measurements for calculations, installed over rockbolt
After drilling ensure the hole is properly flushed.
Make all the necessary measurements pertaining to the hole, as described in Section 3.1.6.
The bolt is inserted to the back of the hole, with length “B” equal to the length of the hydraulic
ram, the 2 backing plates and ±60 mm to attach a double lock-nut
.
The thickness of the two nuts (length “E”) and 50 mm for the thread-free length (length “C”)
should be allowed for.
The resin capsule and bolt are then inserted into hole, and the installation completed as
described above.

86
3.1.10 Procedure for pulling the installed roof bolts
Bolts need to be pulled no sooner than one hour and no later than 24 hours after installation.
This is to ensure that the resin has time to cure and that no time-dependent roof movement
mechanically locks the bolt in the hole.
The pull test jack and bearing plates and, where applicable, the drawbar, are assembled, as
shown in Figure 3—1 and Figure 3—2.
The ram is aligned along the axis of the bolt ensuring that the bolt is not in contact with the wall
of the hole. To achieve this, any loose material is trimmed from around the mouth of the hole
(where necessary) and the assembly is aligned by placing steel shims between the roof and
bearing plate. The bolt must not be in contact with the shims or bearing plates as this will affect
the result.
The dial gauge is set directly below the safety nut or in the indentation in the pull bar, and
secured. When the assembly is fully aligned, the stem of the dial gauge is located into the
indentation on the end of the draw bar so that it is also in line with the bolt axis. Where a draw
bar is not used, a dial gauge locator nut is fixed to the end of the bolt.
The foot of the monopod should be located on a firm surface. The axis of bolt, dial gauge, ram
and monopod should be in line to ensure that load is applied axially to the bolt. The dial is set to
zero and initial readings on the dial gauge and pressure gauge recorded.
At least two skilled operators are required to carry out the tests, one of whom needs to operate
the pump and read the pressure gauge and the other reads the dial gauge. The operator should
stand clear from the pulling equipment and start applying slow steady continuous pressure
using the hand pump. The load should be applied slowly and smoothly and without pause. The
bolt displacement from the dial gauge is recorded every 10 kN until maximum pressure is
reached, or the bond fails. Bond failure is indicated by a significant movement on dial gauge for
no appreciable increase in force, i.e. one revolution/sweep for 10 kN force increase. The load
should not exceed 100 kN (10 tons) for 16 mm bolts and 150 kN (15 tons) for 20 mm bolts.
All relevant information can be captured on a pull test data-recording sheet, as presented in
Table 3—1.

87
Table 3—1 Short encapsulation pull test log sheet
PULL TEST RESULTS COLLIERY SECTION DATEMM Bit type Bit O mm
Roof Horizon (measured from top of seam)
Bolt Lengthmm
1 2 3 4 5 6 7 8 9 10 11 12 0 210
kN 1
34
65
789
1011
Installation time Pull out time
Bolt rib Bolt core Hole Resin Resin SpareO O O capsule O length Thread
(mm) (mm) (mm) (mm) (mm) ( mm)
Remarks:
2030405060708090100110120130140150160170180190200210220
12
Test Details :


89
3.1.11 Calculation of bond strength
A graph of applied force (kN) vs. bond displacement needs to be plotted to calculate the bond
strength and system stiffness from the mean of three tests. The bond strength is taken as the
applied force at which the slope of the graph falls below 20 kN/mm.
The bond displacement is calculated using the following equation:
)( drawbarboltmeasuredbond ElongationElongationdd +−= [3-2]
The bolt and/or draw bar extension is calculated with the use of the following equation:
2
4π
⋅=bolt
s
F LFElongationE D [3-3]
where: F = Applied Force (N)
LF = Bolt free length (mm) = bolt length - (encapsulated length + length in pull bar)
ES = Young's Modulus for steel (MPa)
D = Nominal bolt diameter (mm)
When failure occurs on the resin/rock interface, the bond strength can be expressed as a
contact shear strength or bond stress through:
πσ
bondbond
bondbond Lengthdia
F= [3-4]
3.2 Benchmark review of laboratory testing procedures for rockbolts
3.2.1 Introduction
Rock Mechanics Technology (RMT) carried out a benchmark review of laboratory procedures
for assessment of rockbolt performance for this project. This review included assessment of
current practice, national standards, and the status of research into new methodologies in the
leading mining nations of the USA, Australia and the UK. The results of the study are set out
below.
3.2.2 Laboratory assessment methods - United Kingdom
Research into laboratory comparative measurements of rockbolt performance in the UK was led
by a technology transfer initiative arranged by British Coal, initially with the ACIRL research

90
laboratories of Australia and, later, Strata Control Technology of Australia. This technology
transfer programme led British Coal to evaluate the push test method – for rockbolt performance
measurement – and the double embedment test method, for assessment of long tendon
performance. Research using these methods was published as an ECSC project report (British
Coal Operations Department, 1994). It was found that the push test did not provide sufficiently
repeatable results to make comparative results meaningful for rockbolt designs as a result of the
relatively short length of embedment. However, the double embedment method was found to
provide good repeatability from tests on long tendons such as bird-caged cables, and it was
decided to research this methodology in terms of suitability for the comparative testing of rigid
rockbolts. The result was the application of this method for routine assessment of rockbolt
performance, and eventually to its incorporation into the national standard for strata
reinforcement support system components used in coal mines (British Standards Institution,
1996). The method is still used because the standard has not yet been officially superseded, but
a revised British Standard using the laboratory SEPT has recently been issued for industry
consultation.
Both the push test and the double embedment pull test utilise a thick steel tube in which the
candidate bolt is embedded through the use of the candidate resin or grout. As a result, the wall
of the hole in which the bolt resides is extremely stiff. Additionally, the wall is serrated or
grooved to promote a high level of bond with the grout. Since bond stress is a function of load
and the inverse of the area of the periphery of the bond, stresses are likely to be higher at the
periphery of the bolt than at the wall of the hole – due mainly to the larger surface area of the
hole wall. The combination of the stiff wall and lower bond stress implies that failure will
normally occur at the bolt/grout interface. This fact makes the test useful for comparison of resin
shear strength, and the evaluation of bolt geometry up to a point, but takes no account of rock
quality, rock stresses, or the influence of hole geometry and surface. Accordingly, RMT
researched a methodology that would incorporate the influence of rock in the assessment of
bolt bond performance. The laboratory SEPT basically simulates the underground pull test but
makes use of rock of known properties as the embedment medium so that comparative
assessments can be carried out. The laboratory SEPT has been incorporated into the draft
revision of the national standard (British Standards Institution, 1996), and is already used for
evaluation of rockbolt performance along with the test given in the current standard. Research
work is also ongoing toward using an adaptation of the method for evaluation of flexible bolt
systems and long tendons. Details of present and proposed methods are set out below.

91
3.2.2.1 The double embedment tensile test
A diagram of the double embedment tensile test equipment is shown in Figure 3—9. The
method for assessment of rockbolts is given by the British Standards Institution (1996), the
British national standard for rockbolt consumables for use in coal mines. However, the standard
specifies a particular size of bolt and the test method applies to this size. In the late 1980s the
mining industry in the UK adopted a system of rockbolting consumables comprising one
diameter of bolt, resin capsule, and drill bit. The system is simple and unambiguous and works
very well, and the test, as specified, is designed to evaluate components conforming to this
system. Accordingly, the test equipment is made up of the components described below.
• Two pieces of steel tube which should be hot-rolled seamless steel tube broadly to DIN
1629/84 with a yield stress of at least 355 MPa and tensile strength of 500 to 650 MPa.
The tubes have an external diameter of at least 50 mm and have plain finished ends.
The length of each tube should be 125 mm. The external surface of one end of each
tube should be machined with a suitable thread, say M50 x 2 mm, over a length of about
60 mm. The internal bore of the tube should be 27 mm and be machined with a thread-
type groove 1 mm deep and with a 2 mm pitch.
• Chuck adaptors that will engage with the end of the tube can either be gripped in the
jaws of the testing machine or engage with couplers in the machine platens.
• A means of determining displacement between the tubes as they separate under load,
for example a linear variable displacement transducer.
The test method is set out briefly here. The plain ends of the tubes are taped securely together,
and one end of the assembly stopped off, also using tape or, other suitable means. Both
sections of thread should also be protected from grout spill, again with the use of tape.
Sufficient grout is prepared and poured into the assembly, which should be placed vertical,
open end up, and secured in a vice. A section of bolt pre-cut to a length of 250 mm is then
lowered carefully into the assembly, rotating and centralising within the tube until it is fully
embedded and encapsulated. The assembly is then left to cure for the period recommended by
the supplier of the grout. After curing, all tape masking the thread and at the centre joint is
removed, and the chuck adaptors are fitted to both ends of the test piece. The assembly is then
placed and secured in a suitable tensile testing machine and a displacement transducer fitted to
record displacement across the joint between the tube sections. Ideally, a data-acquisition
system should be used, logging data from the displacement transducer and from a signal
analogous to load. This could be from a load cell or from, for example, a pressure transducer
fitted in the testing machine hydraulic system.

92
Figure 3—9 Double Embedment Tensile Test, sectional diagram of test assembly
Load should be applied at a steady rate – no greater than 1 kN/second – with data logged until
recorded loads have reached a peak and started to fall off, and after a displacement of at least
10 mm has occurred.
Analysis of data, according to the standard, consists of plotting load against displacement, and
analysing the curve to extract system stiffness and bond strength. System stiffness is defined as
the slope of the characteristic curve (in kN/mm) over a defined range of load. For the standard,
system stiffness should be a minimum of 70 kN/mm measured between loads of 50 and 150 kN.
Bond strength is defined as the load at which the slope of the curve (or system stiffness) falls
below 20 kN/mm. Bond strength should be a minimum of 200 kN. The average of three test
results would be compared with the requirement.

93
3.2.2.2 The laboratory short encapsulation pull test
The laboratory short encapsulation pull test developed by RMT utilises a machine tool lathe on
which the entire preparation of the test piece and, in most cases, the test itself can take place.
The lathe is used to bore the hole in a rock core sample and can be used to install the bolt by
spinning through the embedment medium (if this type of installation is required). The lathe is
also a convenient mounting for the test piece during loading. The rest of the apparatus consists
of a hydraulic biaxial cell, water feed system and drill assembly, pull test equipment, and a
means of recording load and bolt displacement.
The sample preparation and test equipment are shown in Figure 3—10. A hydraulic biaxial
pressure cell is mounted on the tool block carriage of the lathe, sufficiently secured to withstand
the force of drilling into the rock sample. A hydraulic pump and pressure gauge are connected
to the cell. The test has two aims: to make the test more realistic than the one with an extremely
stiff (steel) hole wall, and to enable the repeatability that is necessary for product comparison
and research into variation of conditions and properties. For the test to have relevance to UK
strata conditions, it was decided that the rock properties should be defined by an unconfined
compressive strength in the range 21 to 31 MPa, and elastic modulus in the range 7 to 11 GPa.
The material could be natural or synthetic. RMT decided to opt for a natural material and
researched locally available rocks that might be reasonably homogeneous and plentiful. A local
sandstone (Hollington) was eventually selected and this material has been used throughout the
test programme to the present day. However, there may be some merit in considering the use of
a synthetic material. The biaxial cell is used to provide confining pressure to the sample and in
this way induce lateral stresses into the rock, which are intended to be similar to those
measured in the underground environment. The intention is for the stressed sample to behave
in the same way as the in situ material.

94
WATER FEED UNITDRILL ROD & DRILL BIT ASSEMBLY BIAXIAL CELL MOUNTED
ON LATHE STOCK
ROCK CORE
MACHINE TOOL LATHE
Figure 3—10 Laboratory Short Encapsulation Pull Test – apparatus for Installation
The rock sample should be drilled with a drill bit and rod combination intended for use
underground and with water flushing if appropriate. The geometry of the drilled hole has been
found to be fundamentally important to the bond properties of the system. A smooth-walled hole
will affect the bond strength potential of the system far less than a hole wall that is serrated or
‘rifled’. It is well known that the type of hole drilled in situ depends on several factors, including
the type of drilling machinery, the drill rod type, length of drill rod, and the design of the bit.
Whether water flushing or vacuum flushing are used will also have an effect. These factors will
affect hole diameter as well as deformation geometry and, with so many influences, there will
obviously be potential for considerable variation in geometry. The RMT approach to applying
realistic conditions to this aspect of the test was to study the condition of holes drilled routinely
underground and attempt to emulate these observations in the laboratory. The trend throughout
the UK mining industry has been to optimise bond strength in situ by drilling holes that generate
a high degree of hole wall serration or rifling, and with optimal diameter, and this is verified by
observations and the results of in situ pull tests. It has been found that the same geometry can
be obtained in the laboratory if the same drill rod and bit combination used for normal
installation are used and with variation of drill rod length beyond the chuck engagement.
Increasing rod length causes the rod to be more flexible and more likely to generate rifling. This
approach can also lead to increase in hole diameter beyond acceptable limits, but this increase
can be counteracted if the bit is ground to a smaller diameter until the optimal hole is achieved.
RMT has classified rifling obtained in a drilled hole using a “rifling index” where a numerical
value is assigned to the rifling quality of 0, 1, or 2. Where no rifling is evident a value of 0 is
assigned. A level of rifling where the depth of groove is around 1 mm is assigned a value of 1,

95
and heavy rifling with a groove depth of 2 mm or more is classified as 2. The RMT approach has
been to aim for an index of 2 to optimise bond strength, and the envelope of acceptable bond
performance obtained using “calibration” consumables is based on this premise. An
understanding of the importance of hole diameter was gained during research carried out with
engineers from the US Bureau of Mines, some 18 years ago. This work showed that in order to
optimise bond strength of resin-grouted rebar-type systems, hole diameter had to be controlled
within fairly tight limits. Too big a hole diameter relative to the bolt diameter would weaken the
bond by reducing the system axial shear strength, and too small a hole diameter would cause
installation difficulties. It was found that a diametral annulus of 6 mm was the optimum for bolts
in the diameter range 20 to 25 mm, and this fundamental performance concept has been
applied by RMT to the present day.
The test hole is drilled to a depth selected from research, to provide in normal circumstances, a
load during testing which is slightly less than the yield strength of the material. This is to ensure
that the bond performance is not masked by inducing plastic deformation of the bolt. Research
by RMT has shown that hole depth should generally be 160 mm so that an acceptable bond
performance is obtained.
The test bolt would be of sufficient length to allow for the embedment length and the assembly
onto the protruding end of a bearing plate, hydraulic ram, end plate and lock nuts. The end of
the bolt will, of course, be furnished with a thread. The candidate grout is prepared by hand
mixing where appropriate and placed in the hole, and the bolt is installed by hand by gradually
inserting, turning and centralising the bolt until it is fully embedded. This is the preferred
method, because no capsule materials will be present to cause so-called “gloving” or “glove-
fingering” which will affect bond performance. If hand installation is not possible - for example,
because the setting speed of an encapsulated resin is too fast to allow hand mix and installation
- an alternative approach is to take the candidate capsule of resin and cut to a length sufficient
to provide full encapsulation. A simple equation of annulus volume to capsule volume will
provide the required capsule length. The capsule is inserted in the drilled hole and the
candidate bolt installed in the lathe chuck. The rotational direction of the bolt is chosen to avoid
wind-out of resin during insertion. The chuck is started, and the lathe carriage is advanced until
the bolt is fully embedded, followed by rapid stop. With either method the installation is left to
cure for the recommended time before testing.
The testing arrangement is shown in Figure 3—11. The pull test equipment is assembled onto
the protruding bar and tightened by hand. The ram is connected to a hand-operated or motor-
driven pump and a pressure gauge or transducer is included in the circuit. A linear variable
displacement transducer or dial indicator is fitted to a bracket mounted on the lathe bed, and set

96
with the actuator resting on the end of the bolt and aligned axially. Load is applied at a rate of
around 1 kN/sec and readings of load and displacement are taken incrementally or logged via
computer. Testing is continued until an overall displacement of around 10 mm is achieved or
load comfortably exceeds the yield capacity of the bar, in which case it is the bar properties
rather than bond properties that are being tested.
DIAL GAUGE TO MEASURE BOLT END DISPLACEMENT
100mmTHREAD
HYDRAULIC PUMPPRESSURE GAUGE
HYDRAULIC HOSE
30 TONNE HYDRAULIC JACKDIAL GAUGE TO MEASURE BOLT END DISPLACEMENT
100mmTHREAD
HYDRAULIC PUMPPRESSURE GAUGE
HYDRAULIC HOSE
30 TONNE HYDRAULIC JACK
Figure 3—11 Laboratory Short Encapsulation Pull Test – apparatus for test
Analysis of data is normally carried out with the assistance of an Excel spread sheet and
consists of first determining the extension due to the free length of bar, subtracting this from the
measured displacement and plotting the result against the applied load. Analysed parameters
consist of bond strength and system stiffness. Numerical definitions of these parameters have
been determined for the purposes of the draft revision of the national standard for rockbolts
used in coal mines (British Standards Institution, 1996) and are currently as follows:
a) Bond strength is defined as the load at which the slope of the load vs. displacement
characteristic falls below 20 kN/mm. This is provisionally set at 120 kN in the revision
of the British Standards Institution (1996).
b) System stiffness is defined as the slope of the load vs. displacement characteristic
and is provisionally set at a minimum of 100 kN/mm measured between loads of 40
and 80 kN.
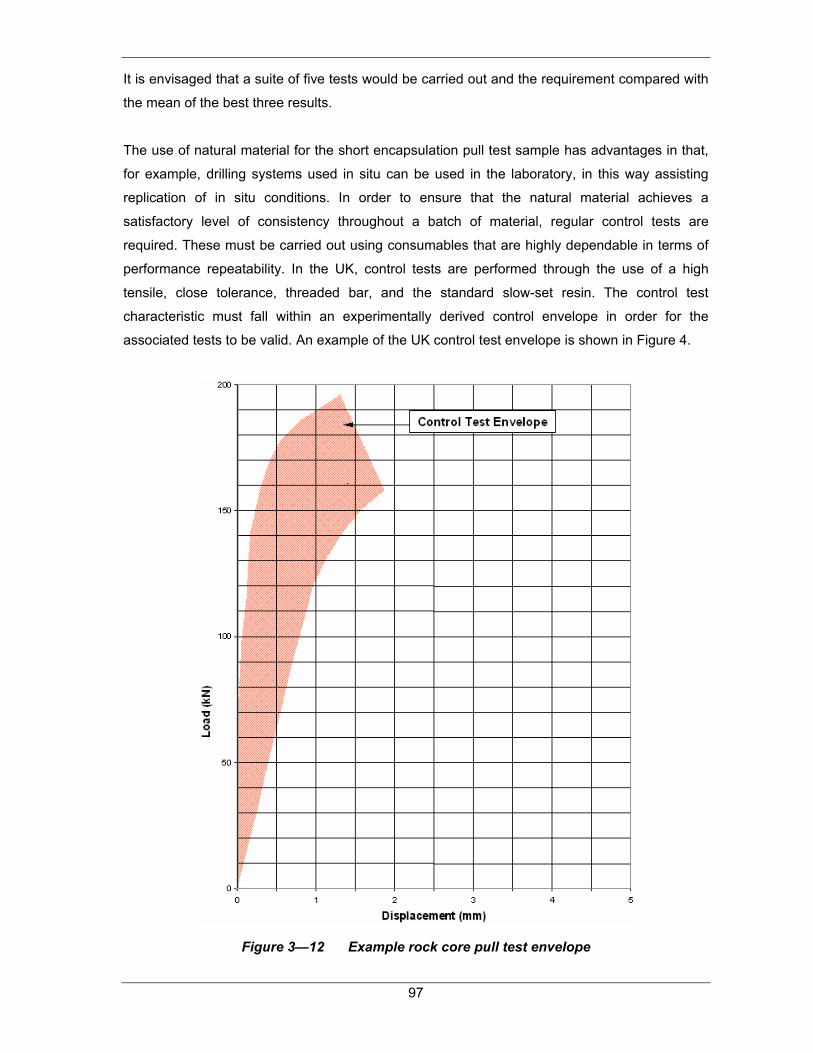
97
It is envisaged that a suite of five tests would be carried out and the requirement compared with
the mean of the best three results.
The use of natural material for the short encapsulation pull test sample has advantages in that,
for example, drilling systems used in situ can be used in the laboratory, in this way assisting
replication of in situ conditions. In order to ensure that the natural material achieves a
satisfactory level of consistency throughout a batch of material, regular control tests are
required. These must be carried out using consumables that are highly dependable in terms of
performance repeatability. In the UK, control tests are performed through the use of a high
tensile, close tolerance, threaded bar, and the standard slow-set resin. The control test
characteristic must fall within an experimentally derived control envelope in order for the
associated tests to be valid. An example of the UK control test envelope is shown in Figure 4.
Figure 3—12 Example rock core pull test envelope

98
However, it must be acknowledged that use of a synthetic material, a sand/cement mix for
example, could provide even greater consistency, and additionally, the use of such a material
could provide guaranteed hole geometry by allowing the moulding of specified diameter, rifling,
etc. Research work in the UK may be directed to this aspect in the future.
Although the double embedment tensile test (DETT) is the current UK norm, the revision of the
standard is likely to be published in 2005, and this is almost certain to replace the DETT with the
laboratory short encapsulation pull test (LSEPT). Current assessments of consumables already
include the LSEPT, so that there is already a considerable library of test information.
Additionally, a revision of the standard for long tendons used in coal mines, currently under way,
is also likely to accept the LSEPT as the standard method for assessment of long tendon
performance under tensile loading conditions.
The LSEPT is already used to some degree in South Africa, with three manufacturers of
consumables already routinely carrying out the test.
3.2.3 Laboratory assessment methods - Australia
Research into laboratory comparative measurements of rockbolt performance in Australia was
led by the Australian Coal Industries Research Laboratories under Winton Gale in the 1970s
and 1980s. This group developed instrumentation for underground use and also a methodology
for the assessment of consumables. There are key laboratory tests that have been made
available in Australia, and some that have been adopted elsewhere, for example by the UK, but
there is currently no formalised test or group of tests that would be used as a standard to
express the performance of a rockbolt system. The tests which are currently used to define
rockbolt system performance are the push test and laboratory- or surface-based short
encapsulation pull tests. There is, however, a strategy to develop a national standard test, as
further described below.
3.2.3.1 Current system tests
3.2.3.1.1 Push test
Figure 3—13 shows the push test apparatus and illustrates the methodology. The test
equipment comprises a push test cylinder, sample bolt, sample resin and a test machine set up
to provide compressive force and measurement of force and displacement. The cylinder is

99
typically 50 mm deep, and has a centre hole typically 27 mm in diameter, and is grooved to
provide an efficient bond between the hole wall and the resin. The cylinder usually has an
outside diameter at least twice the diameter of the internal hole, and is made from a material
with a very high tensile strength, such as stainless steel. One end of the cylinder is first blanked
off, and then a sample of candidate grout is mixed and poured into the cylinder hole. This
implies that candidate grouts are always of sufficiently long gel time to allow hand mix and pour.
A bolt of a length typically 10 mm greater than the hole depth, and with ends machined flat and
perpendicular to the bolt axis, is gradually inserted by hand into the cylinder hole, and is turned
and centralised until the bolt sample is fully encapsulated. Excess resin is removed and the
assembly left to cure for at least one and up to 24 hours. In preparation for testing, the sample
is placed on a spacer plate with a central hole of sufficient diameter and depth to allow the
unobstructed passage of the bolt as it is pushed through the cylinder. The assembly is then
placed between the platens of a stiff testing machine and the data logging system set to record
load and (usually) piston stroke. Load is applied at a rate of typically 1 kN/sec and the test is
continued until the load has peaked and begins to decrease. Analysis of results includes plotting
load against displacement, but the comparison criterion is normally the maximum load achieved.
There is no nationally recognised pass criteria for performance as determined by the push test.
Rather, results would be presented as comparison of bolt profiles or resin formulations and an
advantage inferred by virtue of the peak load achieved for a particular system.
Figure 3—13 Laboratory push test arrangement

100
The push test is relatively inexpensive to perform because it is possible to reclaim the cylinder
for re-use, and the samples are cheap to make. The test procedure is quick and easy to set up
and perform. The push test has the advantage of allowing rapid comparison of systems on a
laboratory basis. However, it can be criticised because the bond length is very short (much
shorter than for a double embedment pull test, for example), and bond stresses induced at the
cylinder/resin interface are not representative due to the very stiff nature of the hole wall.
Recent research work using the push test system is described by Aziz and Webb (2003). In this
work, the load capacities of several different profiled bolts were examined by installing bolt
samples in 75 mm long stainless steel push test cylinders. It was found that bolts with higher
profile were, in general, found to have greater shearing resistance and higher stiffness than low
profile bolts. Widely spaced profiles allowed greater displacement at peak shear strength and,
unsurprisingly, bolts with no profile provided very little load transfer capability.
3.2.3.1.2 Short encapsulation pull test
Short encapsulation pull tests are carried out by suppliers or research bodies with the object of
comparing system performance in an environment simulating underground installation, using a
rock that may not have the same properties as site material, but is consistent and consequently
aids comparison. Typically, a consumables supplier or research body will set up a surface
replica of an underground pull test using an elevated block of sandstone or something similar,
and with facilities for drilling and bolt installation from below. A candidate bolt and resin will be
used for installation in a short encapsulation length, typically 300 mm. A coupler will be used to
connect the bolt to a pull bar, or the bolt will be long enough for assembly of a hydraulic jack
directly on to it. A simple form of the test will be to load the bolt through the jack until a peak
load is achieved. A more sophisticated approach is to measure displacement of the bolt with
load, using, for example, a dial indicator erected on a monopod and set to contact the end face
of the bolt. Load and displacement will be recorded incrementally as loading is applied. A typical
test arrangement is shown in Figure 3-14.
There are no nationally recognised pass criteria for performance as determined by this short
encapsulation pull test. Rather, results would be presented as a comparison of bolt profiles or
resin formulations, and an advantage inferred by virtue of the peak load achieved for a
particular system, and possibly system stiffness (the slope of the characteristic over a specified
load range). The short encapsulation pull test, as described, has advantages in that results may
be similar to those achievable underground, and therefore a realistic estimate of bond stresses
can be provided. A useful comparison between systems is provided through the use of a

101
consistent embedment material. However, because different organisations are certain to use
different embedment materials and differences in method, results obtained from different places
will probably not be comparable.
300mm EMBEDDED LENGTH
HYDRAULIC RAM
DIAL GAUGE
BOLT
HYDRAULIC PUMP WITH FORCE INDICATOR
MONOPOD
FACE PLATE
PULL BAR
TEST HORIZON 300mm EMBEDDED LENGTH
HYDRAULIC RAM
DIAL GAUGE
BOLT
HYDRAULIC PUMP WITH FORCE INDICATOR
MONOPOD
FACE PLATE
PULL BAR
TEST HORIZON
Figure 3—14 Short encapsulation pull test – laboratory and field set-up
3.2.3.2 Strategies for development of a national standard
It was accepted in the late 1990s that, although the Australian underground coal industry utilises
a huge number of rockbolts (5-6 million per annum) at a cost of tens of millions of dollars,
probably one third of those bolts do not perform to specification. There were no standardised
methods for assessing rock support consumables, installation techniques, and support
behaviour. The actual anchorage and failure mechanisms of resin anchors had yet to be
adequately quantified, with rock support systems primarily evolving from experience rather than
rigorous engineering design. It was recognised that a need existed to develop this engineering
knowledge base, and in 1998 an Australian Coal Association Research Programme (ACARP)
grant was made to fund a project with the following primary concerns:
• Establishing a rockbolt testing facility in Australia that addresses many of the problems
and limitations associated with past research efforts into rockbolt anchorage and failure
mechanisms;

102
• Utilising the new test facility to establish standard laboratory testing procedures for both
rockbolt support components and rockbolt support systems;
• Advancing the understanding of the anchorage and failure mechanisms of fully
encapsulated rockbolts; and
• Fostering national and international collaboration between researchers in the field of
rockbolting.
The project spanned three years during which literature surveys were carried out, together with
a numerical modelling exercise to establish whether the mechanics associated with applying
load to a rockbolt in field testing or laboratory testing were representative of the in situ loading
environment. A prototype rockbolt testing facility was established, and a number of preliminary
tests were conducted to calibrate the facility, and to evaluate proposed testing procedures.
Following this initial work, modifications were made to the facility and procedures, and a range
of new tests developed. The most significant finding from the research was the correlation
observed between the applied axial bolt load and the lateral pressure change measured in the
surrounding rock mass once the encapsulation medium yielded. It was not clear whether this
was a Poisson’s effect or a response to the confining action of deformed ribs on a rockbolt, or a
combination of both.
Following the initial ACARP project, a Stage 2 project was commissioned and had the following
objectives:
• Enhancing and upgrading the control and monitoring capabilities of the testing facility
established in the earlier project;
• Modifying and refining the testing procedures to ensure more reliable research
outcomes; and
• Expanding on the earlier research activities covering a greater level of detail and a wider
range of principles that affect the performance of rockbolts.
This project improved the understanding of the effect of changes in a range of parameters on
anchorage performance, as well as the load transfer behaviour and failure mechanisms of fully
encapsulated rockbolts. Several investigations were conducted at the upgraded test facility.
These included an investigation into the effect of changes in the design as well as the
conditions concerned with the installation of fully encapsulated rockbolts. In particular, the
investigations focused on the effect of changes in:
• Resin annulus;
• Deformation geometry of the rockbolt; and
• Resin spin time.

103
A further investigation was undertaken to better understand the nature of load transfer of a fully
encapsulated rockbolt.
The various findings of this investigation are set out below.
In terms of load transfer, load was found to decrease with distance along an encapsulated
rockbolt, the load being greatest nearest the rock free surface (that is nearest the point of load
application), and gradually reducing with distance along the rockbolt into the rock mass.
This finding supports the theory that an externally applied load on an encapsulated rockbolt is
gradually transferred into the rock mass, creating a localised stress field that aids in clamping
the rock mass together. This finding was predicted by the numerical modelling of Whittaker and
reported earlier in the Stage 1 final report.
There has been some conjecture as to the nature of the load transfer function. To better
understand this, two arrangements of load application were investigated. One arrangement
modelled the standard rockbolt pull-test. This tends to confine the surface of the rock
surrounding the rockbolt. The second arrangement modelled loading resulting from the
separation of the partings in a rock mass. In both cases load transfer occurred over the entire,
albeit short, length of encapsulation. Minor differences were observed in the load-transfer
function between the two loading arrangements.
An earlier test indicated a non-linear rate of load reduction with distance using the first
arrangement while in the second arrangement the trend appeared to be linear. In a subsequent
test using a rockbolt with twice the number of strain-gauges, differences in the load transfer
function between the two loading arrangement were less apparent. Significantly, load transfer
appeared to be non-linear in both cases, with 50% of the load transfer taking place within
approximately 54 mm or 2.5 rockbolt diameters from the free surface. Interestingly, cratering of
the test sample immediately surrounding the rockbolt was observed in the laboratory tests with
the second loading arrangement, a result that was predicted following the numerical modelling
analysis undertaken in Stage 1.
Following on from these results in terms of the mechanism of rockbolt failure, when a high load
is applied to a rockbolt, the resulting stress induced in the surrounding rock mass may exceed
its strength and bring about localised rock failure. It is reasonable to assume that the load will
be transferred along the rockbolt until either confinement of the rock mass is sufficient to
withstand the load transfer, the rockbolt intersects a higher strength rock mass, or the end of
the rockbolt is reached. In any case this transfer of load extends the length of localised failure

104
with permanent de-coupling of the rockbolt from the rock mass.
The strength or load-bearing capacity of a fully encapsulated rockbolt (FERB) was found to be
independent of changes in resin annulus where resin annulus remained less than 4 mm. With
greater resin thickness, there was a reduction in the magnitude of anchorage strength and an
increase in the variability. In addition, the stiffness of the anchorage system reduced as the
influence of the properties of the resin in the anchorage system became more prominent.
Under-spinning or over-spinning of a fast-set resin cartridge had the same result in terms of
diminishing the anchorage performance of a rockbolt, and are equally undesirable in practice.
Both had a pronounced negative effect in terms of increasing the variability in rockbolt
performance. More consistent performance was achieved in those tests that were closer to the
recommended spin time.
A near doubling in anchorage strength was observed with a changeover to a mix-and-pour
resin from resin cartridges when a rockbolt was being anchored. There was also greater
variation with resin cartridges, even under supposedly similar conditions.
A full description of recent developments using the UNSW test facility is given by Hagan
(2004).
3.2.4 Laboratory assessment methods – USA
Research into performance testing of rockbolts in the USA was led by the US Bureau of Mines,
which researched the variation of bolt performance with annulus size, and other important
issues. This research resulted in a formalised test for bolt performance (American Society for
Testing and Materials, Standard D4435-04) and an ANSI standard for bolting consumables
including bolts, plates, accessories and resins (American Society for Testing and Materials,
Standard F432-04). Additionally, there is a formalised test (American Society for Testing and
Materials, Standard D4436-04) for long-term rockbolt load retention. The majority of rockbolts
installed in US underground coal mines are rebar profiled, in a size and strength range laid
down in the standard, and feature a forged or fixed head, the design of which is also specified in
the standard.
A laboratory-based test for roof bolt performance exists and is applied by the National Institute
for Safety and Health (NIOSH) at the mining headquarters in Pittsburgh. There are at present no
plans to modify or replace this methodology.
105
3.2.4.1 Current system tests - short encapsulation pull test
The current laboratory performance test for rockbolts is the specified American Society for
Testing and Materials Standard F432-046, which comprises a short encapsulation pull test
similar to other tests of this type described elsewhere in this report. The standard method
consists first of the drilling of a hole in Indiana limestone with a 25.4 mm (1 inch) bit, typically
using drilling with vacuum extraction. The hole is drilled to a depth of 305 mm (1 foot) and the
test bolt embedded using the test resin. Following a period allowed for curing, a hydraulic ram
and associated plates are assembled and attached. A dial indicator or displacement transducer
is located axially at the bolt end to measure displacement, and load is measured using a
bourdon gauge or transducer in the hydraulic circuit between ram and a hand pump. Load is
applied up to a maximum of 9 tonnes (10 short tonnes) with load and displacement noted for
increments of 0.9 tonne (1 short ton). Pass criteria for the test are that a maximum load of at
least 9 tonnes should be achieved, and that displacement (uncorrected) should be no greater
than 12.5 mm (0.5 inches).
3.2.4.2 Research into test methods
Considerable research is ongoing in the USA for the purpose of further understanding and
developing the performance of rockbolting systems in underground coal mines. Research work
comprises laboratory and underground testing and is based on pull testing, usually with short
encapsulation columns.
A good example of a joint laboratory and underground study is given by Tadolini (1998) who
describes a test programme conducted in a laboratory set up by a consumables supplier, and
further test work at a US underground mine. The test method used in the laboratory consisted of
a short encapsulation pull test conducted on bolts installed in rifled steel tubes with varying
encapsulation length, and further tests with bolts installed in an elevated block of limestone with
a drilling arrangement installed beneath. The test method was as described above (standard
procedure) except that loading was continued until “yield” of the system occurred. A system
stiffness was calculated from the slope of the plotted load vs. displacement characteristic,
although it is not known whether displacement was corrected for extension in the bolt free
length, or over what loading range system stiffness was assessed. Field trials were carried out
in an Alabama underground coal mine, again using short encapsulation (approximately 450 mm
bond length) methods as described above. The test work showed the effectiveness of
optimising resin annulus with respect to a particular configuration of rockbolt but, more

106
importantly, comprehensively illustrated the effectiveness of the methodologies used in
laboratory and underground.
Further test work at the San Juan Coal Company mine in New Mexico is reported by Pile et al.
(2003). The same methods of testing bolt performance as described above were used and the
testing was again orientated toward optimisation of resin annulus in order to maximise system
performance. Tadolini (1998) defines the anchorage of a fully grouted rockbolt, or “Grip Factor”,
as the pull-out resistance per inch of bolt length. Following a short encapsulation pull test,
where the resin column has been adjusted to minimise the possibility of the bolt yielding prior to
bond failure occurring, grip factor (in tons/inch) would be calculated as
GF = (load to slippage)/(resin anchor length).
The load to slippage would be the maximum load achieved in the test where bolt yield did not
take place. A low grip factor is regarded as less than approximately 1 ton/inch. Pile et al. (2003)
concluded that short encapsulation pull tests allow optimisation of support performance in
varying roof conditions, and the test method is now used routinely at the mine to select a
satisfactory length of bolt for different areas of the mine.
3.2.5 Conclusions
The double embedment tensile test described in the current national standard of the United
Kingdom is outdated, and is likely to be replaced by a single embedment tensile test in rock, the
objective of which is to simulate a short encapsulation pull test as carried out in situ but, at the
same time, to provide consistent conditions for comparative study. The test is likely to have
nationally recognised benchmarks.
A need for a national procedure is recognised in Australia, and research projects directed at this
objective are currently assessing a similar methodology to that likely to be adopted in the UK.
Currently in Australia a version of the short encapsulation pull test, where consumables are
installed in a non-stressed stone block, is used more commonly than a laboratory push test.
American laboratory methods are formalised nationally, based on a short encapsulation pull test
in a non-stressed rock sample, but, having recently been revised, are unlikely to change in the
near future.
107
The laboratory short encapsulation pull test is likely to represent the most suitable methodology
for comparative studies in, at least the immediate future, and several consumables suppliers in
South Africa have already been equipped and trained to carry out this test.

108
4 Specifications for roofbolters
4.1 Introduction
The quality of installation of a support system is directly related to the performance of the
equipment that is used to install the bolts. The performance of bolting equipment was therefore
investigated as part of this study in order that the relative importance of the various machine
parameters could be ascertained, as well as the range in values of these parameters as
provided by the equipment used in South African collieries.
The following parameters were assessed in determining the performances of bolting equipment:
• Free rotation speed (rpm);
• Drilling speed (rpm);
• Spinning speed (rpm);
• Torque (Nm);
• Thrust (kN); and
• Hole profile for various combinations.
These parameters were then measured against roof bolt performance in various rock types. It
should be noted that currently in South Africa, there are no standards for these parameters in
collieries, except the torque, which should be 240 Nm in order to generate 50 kN (5 tonnes) for
tensioning by roofbolters.
A total of 143 roofbolters, which were operational during the evaluation, were tested from 27
different collieries, ranging from Tshikondeni in the north to Zululand Anthracite Colliery (ZAC) in
the south. This provided a comprehensive database of roof bolter information. Tests were done
on a variety of machines from different manufacturers, including Rham, Fletcher, Voest Alpine,
License, Klockner, Biz Africa, along with custom-designed bolters manufactured by particular
mines. Results from all of these machines varied widely, even to the extent of differing from
boom to boom on twin boom machines.
4.2 Testing procedure
During this investigation, the testing procedure for each machine followed a set pattern, which
was developed to be as quick and easy as possible, in this way minimizing any possible

109
downtime to production machines. For each machine, the torque setting at which the machine
spins the bolt was measured, to ensure that the machine was capable of breaking out either the
crimp or shear pin of the bolt, if such a future was present.
Following this, a hole was drilled and the speed of drilling was measured in revolutions per
minute using a laser digital tachometer. This device quickly and easily measures the speed by
simply attaching a reflective strip to the drill chuck or drill steel, and shining the laser onto the
strip while the drilling is in progress.
Once the hole was drilled, the depth was measured and a borehole micrometer was inserted to
measure the hole diameter at intervals along the length of the hole. This gives an indication of
the hole profile as drilled by the particular bit type at a specific rotation speed. Measurements
were taken from two to three holes per roofbolter.
A bolt is then inserted into the chuck and a load cell fitted over the bolt. The bolt is pushed into
the hole, without inserting resin, and pushed against the roof with the maximum force possible
to establish the thrust that the roof bolter is capable of exerting against the bolt, which is
important when full-column roof bolts are being installed and a bolt is being pushed through
several resin capsules.
The bolt was then installed with resin and a speed measurement is taken while the bolt was
being spun through the resin. This measurement shows the speed at which the resin is being
mixed. Finally, the maximum free rotation speed of the drill chuck was measured as a
comparison to the other speeds measured.
The form, presented in Figure 4—1 was used to record measurements during the testing. Other
measurements taken were standard lengths and diameters, the bit type and diameter, drill steel
length and diameter, type of bolt, bolt length and diameter. The type of support, be it
mechanical point anchor, resin point anchor or full-column resin was noted and resin type,
capsule length and diameter recorded.
Finally, drilling type (wet or dry) was noted, as this may have considerable impact on the hole
profile in different rock types. Where possible, a borehole log of the area in which tests were
conducted was collected in order to take into account the influence of the immediate roof in
which installation is taking place.

110
4.3 Results
4.3.1 Free rotation speed
The free rotation speed of the drill chuck was taken as a baseline reading for comparison with
the drilling and resin spinning speeds. Theoretically this should always be the highest speed
possible from the machine as this is the speed taken while the chuck is not under load. In
practice, this was generally shown to be the case. However, in some instances both the other
speeds were higher than the free rotation speed. A number of reasons could explain this result,
such as: the operator not fully opening the lever when the measurements were read; a simple
reading error of the tachometer (despite being continuously calibrated); or it could be a
characteristic of the hydraulic valve or clutch system. The number of cases where this occurred
is, however, small enough for it not to be a major factor.
The results for the free rotation speed obtained from various types of bolters are presented in
Figure 4—2, Figure 4—3, Figure 4—4 and the data from all the bolters is plotted in Figure 4—5.
These figures highlight that there is a significant variation in the free rotation speed of various
bolters. The rotation speed comparison of all the bolters tested (Figure 4—5) shows a maximum
value of 854 revolutions per minute and a minimum of 195 rpm. With Bolter A and other bolters
the frequency distributions are similar, and the most common rotation speeds are concentrated
between 250 and 550 rpm. Bolter B indicated much higher speeds, with the dominant speed
measured being between 600 and 650 rpm. The reasons for this are not clear. However, the
majority of Bolter B machines tested were relatively new (two to three years old). A reasonable
percentage of all other machines tested were considerably older than this, with the average age
being approximately five years and the oldest over 20 years. The newer machines are more
likely to be in a better working order and to have been more regularly maintained and serviced
than the older machines.

111
DateMine 1 2 3Section 25.5 27.5 27.0Mining Method 25.5 29.0 27.5Production Rate 25.0 28.0 28.0Type of Roofbolter 25.7 28.0 28.0Date of Purchase 26.0Cycle Time (Bolts per hour/shift) 4 5 6Bit Type 27.5Bit Diameter (mm) 27.5Drill Steel Diameter (mm) 27.8Drill Steel Length (m) 28.0Type of SupportType of ResinCapsule Diameter (mm)Capsule Length (mm)Type of BoltBolt Diameter (mm)Bolt Length (m)Bolt ConsumptionWasher TypeWasher Dimensions (mm)Type of Pin/NutDry/Wet Drilling?
Left Boom Right BoomFree Rotation Speed (rpm) 609 629Drill Speed (rpm) 441 479Resin Spinning Speed (rpm) 443 210Torque (Nm) 420 420Thrust (kN) 480 500Hole Length (m) 1.14m 1.14mBorehole Log
1. The first hole profile reading
should be taken +/- 50 mm
from the back of the hole.
5. Bolt diameter measured across core, across ribs and
across parallel rib.
2. Bolt should be pushed through the resin before
measuring spinning speed.3. Three speeds are to be measured. Free rotation,
drilling, and resin spinning 4. Stop measuring the drilling
speed before the hole is finished.
Hole Profile
125 x 125 x 4.6mmNibbed - 24mm
Dry
Ribs - 16.9mm Parallel - 15.6mmRebar - Nibbed
1.20m+/-150 / shift
Dome - Dog eared
2 x resin capsuleFasloc 10/20 Spin/Hold - 19 x 500mm
19.4mm500mm
Spade Bit25.8mm
23.3mm - Flat 24.2mm - Hex1.17m
+/- 1600 / shiftFletcher - DDR-15-B-C-F Serial No. - 99030
26/07/1999/
19/09/2002Boschman's - Tweefontein
B4Stooping - CM
Figure 4—1 Form used for recording data from equipment tests

112
0
2
4
6
8
10
12
14
16
18
20
50 100
150
200
250
300
350
400
450
500
550
600
650
700
750
800
850
Revolutions per minute
Freq
uenc
y
.0%
10.0%
20.0%
30.0%
40.0%
50.0%
60.0%
70.0%
80.0%
90.0%
100.0%
Figure 4—2 Free rotation speed - bolter A
0
2
4
6
8
10
12
14
16
18
50 100
150
200
250
300
350
400
450
500
550
600
650
700
750
800
850
Revolutions per minute
Freq
uenc
y
.0%
10.0%
20.0%
30.0%
40.0%
50.0%
60.0%
70.0%
80.0%
90.0%
100.0%
Figure 4—3 Free rotation speed - bolter B

113
0
2
4
6
8
10
12
50 100
150
200
250
300
350
400
450
500
550
600
650
700
750
800
850
Revolutions per minute
Freq
uenc
y
.0%
10.0%
20.0%
30.0%
40.0%
50.0%
60.0%
70.0%
80.0%
90.0%
100.0%
Figure 4—4 Free rotation speed - other bolters
0
5
10
15
20
25
30
50 100
150
200
250
300
350
400
450
500
550
600
650
700
750
800
Revolutions per minute
Freq
uenc
y
.00%
10.00%
20.00%
30.00%
40.00%
50.00%
60.00%
70.00%
80.00%
90.00%
100.00%
Figure 4—5 Free rotation speed - all bolters

114
4.3.2 Rotation speed during drilling
The results of rotation speed during drilling are presented in Figure 4—6, Figure 4—7, Figure
4—8, and Figure 4—9. Drilling speeds for all machines show a similar trend to that of rotation
speed, with the same shape distribution curve produced. As would be expected, the curve is
shifted lower down the axis with the introduction of load to the system. The maximum rpm is
816, with a minimum of 148 rpm. Again, results for Bolter B are above the average, the largest
proportion being in the 550 to 600 rpm range. Similarly, Bolter A and other bolters behave in the
same way as with the previous set of results, the majority of the results falling within the 250 to
400 rpm range. The effect that rock type has on the drilling speed is discussed later in the
report.
0
2
4
6
8
10
12
14
16
18
20
50 100
150
200
250
300
350
400
450
500
550
600
650
700
750
800
850
Revolutions per minute
Freq
uenc
y
.00%
10.00%
20.00%
30.00%
40.00%
50.00%
60.00%
70.00%
80.00%
90.00%
100.00%
Figure 4—6 Drilling speed - bolter A

115
0
1
2
3
4
5
6
7
8
9
10
100
150
200
250
300
350
400
450
500
550
600
650
700
750
800
Revolutions per minute
Freq
uenc
y
.00%
10.00%
20.00%
30.00%
40.00%
50.00%
60.00%
70.00%
80.00%
90.00%
100.00%
Figure 4—7 Drilling speed - bolter B
0
2
4
6
8
10
12
50 100
150
200
250
300
350
400
450
500
550
600
650
700
750
800
850
Revolutions per minute
Freq
uenc
y
.00%
10.00%
20.00%
30.00%
40.00%
50.00%
60.00%
70.00%
80.00%
90.00%
100.00%
Figure 4—8 Drilling speed - other bolters

116
0
5
10
15
20
25
30
50 100
150
200
250
300
350
400
450
500
550
600
650
700
750
800
850
Revolutions per minute
Freq
uenc
y
.00%
10.00%
20.00%
30.00%
40.00%
50.00%
60.00%
70.00%
80.00%
90.00%
100.00%
Figure 4—9 Drilling speed - all bolters
4.3.3 Resin spinning speed
The speeds measured while spinning resin for various types of bolters are shown in Figure 4—
10, Figure 4—11, Figure 4—12, and data from all the bolters is plotted in Figure 4—13. Resin
spinning speeds, generally, show much lower results than either of the other speed
measurements. The resistance offered by the resin capsule in a confined space reduces the
speed considerably. Resin spinning speed shows a maximum speed of 643 rpm and a minimum
of 45 rpm. The distributions within the groups, however, tend to be similar to those of the other
speeds, with the results of Bolter B being proportionately higher than those of the other two
groups. Resin manufacturers recommend a spinning speed of between 400 and 500 rpm on “A”
type spin-to-stall resin. Obviously, too low a spinning speed may not mix the resin correctly in
the required spinning time, and result in a weak bond. It is also possible that too high a spinning
speed may over-spin the resin, damaging the bond and reducing the strength. Figure 4—13
indicates that the resin spinning speeds of approximately 22 per cent of all bolters tested are
within the resin manufacturers recommended range.

117
0
2
4
6
8
10
12
14
16
50 100
150
200
250
300
350
400
450
500
550
600
650
700
750
800
850
Revolutions per minute
Freq
uenc
y
.00%
10.00%
20.00%
30.00%
40.00%
50.00%
60.00%
70.00%
80.00%
90.00%
100.00%
Figure 4—10 Resin spinning speed - bolter A
0
1
2
3
4
5
6
7
8
100
150
200
250
300
350
400
450
500
550
600
650
700
750
800
Revolutions per minute
Freq
uenc
y
.00%
10.00%
20.00%
30.00%
40.00%
50.00%
60.00%
70.00%
80.00%
90.00%
100.00%
Figure 4—11 Resin spinning speed - bolter B

118
0
2
4
6
8
10
12
50 100
150
200
250
300
350
400
450
500
550
600
650
700
750
800
850
Revolutions per minute
Freq
uenc
y
.00%
10.00%
20.00%
30.00%
40.00%
50.00%
60.00%
70.00%
80.00%
90.00%
100.00%
Figure 4—12 Resin spinning speed - other bolters
0
5
10
15
20
25
50 100
150
200
250
300
350
400
450
500
550
600
650
700
750
800
850
Revolutions per minute
Freq
uenc
y
.00%
10.00%
20.00%
30.00%
40.00%
50.00%
60.00%
70.00%
80.00%
90.00%
100.00%
Figure 4—13 Resin spinning speed - all bolters

119
4.3.4 Comparison of speeds
In order to compare free rotation, drilling and spinning speeds, these variables were plotted
together in Figure 4—14, Figure 4—15, Figure 4—16, and Figure 4—17. Note that FRS is free
rotation speed, DS is drilling speed and RSS is resin spinning speed in these figures. While the
first two figures show the results from roofbolter “A”, the following two figures show the results
from roofbolter “B” and all other roofbolters, respectively. As was mentioned earlier there are
some instances where the drilling speed or the resin spinning speed are greater than the free
rotation speed. Also mentioned earlier was that in most cases the free rotation speed is
greatest, followed by the drilling speed, and then the resin spinning speed. This result reflects
what would normally be expected in terms of the work required of a bolter performing the
various tasks. That the order should be different in some cases suggests that it should be
investigated more closely. Of greatest importance is the difference between the drilling speed
and the resin spinning speed, as the free rotation speed is merely used as a comparison and
has little bearing on the ultimate installation of a roof bolt.
0
100
200
300
400
500
600
700
800
1 3 5 7 9 11 13 15 17 19 21 23 25 27 29 31 33 35 37 39
RPM
FRS DS RSS
Figure 4—14 Speed comparisons – for 40 type-“A” bolters
When the results are compared for Bolter A, significant variation can be seen. In some cases
the resin spinning speed is much higher than the drilling speed. This could be the consequence
of a hard roof, or drilling an oversized hole (resulting in less resistance to mixing and hence

120
higher speeds). For example, Bolter 18 in Figure 4—14 had free rotation and resin spinning
speeds of over 550 rpm but a drilling speed of only 209 rpm. Upon closer inspection, however,
this mine has an interlaminated mudstone, sandstone and coal roof. Bolter 29 in Figure 4—14
had free rotation, drilling, and resin spinning speed all at almost the same level, and a
comparison with the borehole log shows that it has a roof consisting of coal and siltstone. A soft
roof of this type would be expected to show a high drilling speed.
0
100
200
300
400
500
600
700
800
900
1 3 5 7 9 11 13 15 17 19 21 23 25 27 29 31 33 35 37 39
RP
M
FRS DS RSS
Figure 4—15 Speed comparisons – for remaining 39 type-“A” bolters
As can be seen in Figure 4—16, Bolter B has consistently higher speeds overall than any other
type of bolter. All three speeds are also grouped much more closely together, almost regardless
of rock type. Bolter B appears to be the most consistent bolting machine tested when its speed
statistics are compared.

121
0
100
200
300
400
500
600
700
1 3 5 7 9 11 13 15 17 19 21 23 25
RPM
FRS DS RSS
Figure 4—16 Speed comparisons – bolter B
0
100
200
300
400
500
600
700
1 3 5 7 9 11 13 15 17 19 21 23 25 27 29 31 33 35 37 39
RP
M
FRS DS RSS
Figure 4—17 Speed comparisons - other bolters
122
4.3.5 Torque
Currently in South Africa, a bolter is expected to produce 200 Nm to 250 Nm torque at all times
in order to tension the bolt to 5 tonnes (50 kN).
In the drilling phase, enough torque is required to allow the bit to penetrate whatever rock type
may be present in the roof and pass through harder layers with the same efficiency as through
soft. When the bolt is installed, enough torque is also required to ensure a sufficient mix of resin
and catalyst and also to break out the crimp or shear pin on a bolt, should one be present.
The results from the torque measurements are shown in Figure 4—18, Figure 4—19, Figure 4—
20, and Figure 4—21. These figures indicate that the torque on all machines ranges from a
maximum of 560 Nm to a minimum of 50 Nm. The lower value is not sufficient to break the
crimp or shear pin, and this was observed to be the case on one mine. The bolter in question
was tested and found to provide torque of 80 Nm. Observation of the roof bolt crew trying to
install bolts made it clear that the machine was unable to break out the shear pin. The spread of
torque values for all bolters show a similar distribution and variability. .
Figure 4—21 indicates that only 26 per cent of all bolters had torques within the 200 Nm to
250 Nm range.

123
0
2
4
6
8
10
12
14
16
50 100
150
200
250
300
350
400
450
500
550
600
Nm
Freq
uenc
y
.00%
10.00%
20.00%
30.00%
40.00%
50.00%
60.00%
70.00%
80.00%
90.00%
100.00%
Figure 4—18 Torque - bolter A
0
1
2
3
4
5
6
7
100
150
200
250
300
350
400
450
500
550
600
Nm
Freq
uenc
y
.00%
10.00%
20.00%
30.00%
40.00%
50.00%
60.00%
70.00%
80.00%
90.00%
100.00%
Figure 4—19 Torque - bolter B

124
0
1
2
3
4
5
6
7
8
9
10
50 100
150
200
250
300
350
400
450
500
550
600
Nm
Freq
uenc
y
.00%
10.00%
20.00%
30.00%
40.00%
50.00%
60.00%
70.00%
80.00%
90.00%
100.00%
Figure 4—20 Torque - other bolters
0
5
10
15
20
25
30
50 100
150
200
250
300
350
400
450
500
550
600
Nm
Freq
uenc
y
.00%
10.00%
20.00%
30.00%
40.00%
50.00%
60.00%
70.00%
80.00%
90.00%
100.00%
Figure 4—21 Torque - all bolters

125
4.3.6 Thrust
Thrust is the axial force exerted on the drill steel by the machine. Thrust applied while a hole is
being drilled is difficult to measure. For this reason, the thrust given in this section is the
maximum thrust capacity of the machine. Thrust is required in order to penetrate the roof, and
also to force the bolt through a resin capsule to the back of the hole before spinning occurs.
Thrust varies a great deal, from as little as 10 kN to 32 kN, with an average of around 18 kN.
The results are presented in Figure 4—22, Figure 4—23, Figure 4—24, and Figure 4—25.
0
2
4
6
8
10
12
14
10.6
12.6
14.6
16.6
18.6
20.6
22.6
24.6
26.6
28.6
30.6
kN
Freq
uenc
y
.00%
10.00%
20.00%
30.00%
40.00%
50.00%
60.00%
70.00%
80.00%
90.00%
100.00%
Figure 4—22 Thrust - bolter A

126
0
0.5
1
1.5
2
2.5
3
3.5
10.6
12.6
14.6
16.6
18.6
20.6
22.6
24.6
26.6
28.6
30.6
kN
Freq
uenc
y
.00%
10.00%
20.00%
30.00%
40.00%
50.00%
60.00%
70.00%
80.00%
90.00%
100.00%
Figure 4—23 Thrust - bolter B
0
1
2
3
4
5
6
10.6
12.6
14.6
16.6
18.6
20.6
22.6
24.6
26.6
28.6
30.6
kN
Freq
uenc
y
.00%
10.00%
20.00%
30.00%
40.00%
50.00%
60.00%
70.00%
80.00%
90.00%
100.00%
Figure 4—24 Thrust - other bolters

127
0
2
4
6
8
10
12
14
16
18
20
10.6
12.6
14.6
16.6
18.6
20.6
22.6
24.6
26.6
28.6
30.6
kN
Freq
uenc
y
.00%
10.00%
20.00%
30.00%
40.00%
50.00%
60.00%
70.00%
80.00%
90.00%
100.00%
Figure 4—25 Thrust - all bolters
4.3.7 Hole profile
The hole profile is also a fundamentally important parameter, as it determines the bonding
quality between the resin and rock. A smooth-walled hole will exhibit far lower bond strength
than a hole wall that is serrated or ‘rifled’.
Currently, there is no suitable tool available to determine the hole profile, apart from overcoring.
However, overcoring is very expensive and cannot practically be used for a large-scale
experiment applied to all available bolters in South Africa.
Therefore, the hole profile is measured by taking a number of hole diameter measurements at
regular intervals along the hole. This gives an indication of the quality of hole being drilled in
each particular test. A mean is calculated for the five diameter measurements, and the standard
deviation determined. The standard deviation gives a description of the quality of hole drilled;
the smaller the deviation, the smoother the hole. With this in mind, comparisons were made
between hole quality and other measurements in an attempt to try and find links between the
controllable factors and the quality of hole. The most obvious factors influencing the hole quality
should be the drilling speed, torque and thrust of the bolter in a particular rock type. As can be
seen from the graphs below, no correlation was found between any one of these factors. The

128
hole profile was then compared for wet drilling and dry drilling machines, again with no
significant differences.
0
5
10
15
20
25
30
35
40
0.2 0.4 0.6 0.8 1 1.2 1.4 1.6 1.8 2
Standard Deviation (mm)
Freq
uenc
y
.00%
10.00%
20.00%
30.00%
40.00%
50.00%
60.00%
70.00%
80.00%
90.00%
100.00%
Figure 4—26 Hole profile standard deviation frequency
As shown in Figure 4—26, the largest percentage (approximately 80 per cent) of standard
deviation on all holes, drilled by all machines, in all different roof types, is less than 1.0 mm
diameter over the entire hole length. Although 1.0 mm may seem insignificant, the fact remains
that most 25 mm drill bits are shown to be drilling 27 to 28 mm diameter holes. This indicates
that most 20 mm bolts are being installed in a hole with an annulus of up to 10 mm, when the
worst case example of almost 2 mm standard deviation is taken. (See Figure 4.26 above.)

129
0
0.5
1
1.5
2
2.5
0 100 200 300 400 500 600 700
Revolutions per minute
Stan
dard
Dev
iatio
n
Figure 4—27 Drilling speed against hole profile standard deviation
One of the most obvious factors influencing the quality of the hole would be the speed at which
the hole is drilled. A hole drilled at high speed would either have a very smooth profile as a
result of the speed of drilling, or would produce a large diameter hole because of inadequate
flushing, which is more likely at high speed. As can be seen from Figure 4—27, there is no
correlation between drilling speed and hole diameter standard deviation.
Figure 4—28 shows that there is a very wide range of torque settings on roof bolting machines
in South Africa, and that they do not correlate with the regularity of the hole profile.

130
0
0.5
1
1.5
2
2.5
0 100 200 300 400 500 600
Torque (Nm)
Stan
dard
Dev
iatio
n
Figure 4—28 Torque against hole profile standard deviation
Similarly, Figure 4—29 shows no correlation between the standard deviation and thrust.
0
0.5
1
1.5
2
2.5
0 10 20 30 40 50
Thrust (kN)
Sta
ndar
d D
evia
tion
(mm
)
Figure 4—29 Thrust against hole profile standard deviation

131
Figure 4—30 shows the relationship between drilling speed and hole quality for wet flushing
systems only. Again, no correlation is evident. A similar analysis is also conducted for dry
drilling machines (Figure 4—31), again showing no obvious correlation.
0
0.5
1
1.5
2
2.5
0 100 200 300 400 500 600 700Drilling Speed (rpm)
Stan
dard
Dev
iatio
n (m
m)
Figure 4—30 Drilling Speed against hole profile standard deviation in machines using
wet flushing system
While the comparison between wet drilling machines and dry drilling machines must be made,
Figure 4—30 and Figure 4—31 illustrate that dry drilling machines, on average, drill at higher
speeds than their wet counterparts, rather than produce any discernable difference in hole
quality.

132
0
0.2
0.4
0.6
0.8
1
1.2
1.4
1.6
0 100 200 300 400 500 600 700
Drilling Speed (rpm)
Stan
dard
Dev
iatio
n
Figure 4—31 Drilling speed against hole profile standard deviation in machines using
dry flushing system
The relationship between torque and hole quality for dry drilling machines is presented in Figure
4—32. No correlation is evident.
The final parameter that was checked against hole profile was resin spinning speed. Figure 4—
33. It was also found that there is no correlation between the hole profile and resin spinning
speed.

133
0
0.2
0.4
0.6
0.8
1
1.2
1.4
1.6
0 100 200 300 400 500Torque (Nm)
Stan
dard
Dev
iatio
n
Figure 4—32 Torque against hole profile standard deviation in machines using dry
flushing system
0
0.5
1
1.5
2
2.5
0 100 200 300 400 500 600 700Revolutions per minute
Stan
dard
Dev
iatio
n (m
m)
Figure 4—33 Resin spinning speed against hole profile standard deviation in
machines using wet flushing system

134
Figure 4—34 and Figure 4—35 show that there is very little difference between standard
deviation of hole profiles in sandstone and in the softer materials such as siltstone, shale or
coal. While there is more variation in the case of sandstone, in both cases the mean standard
deviation is approximately 0.6 mm.
0
1
2
3
4
5
6
0.2 0.4 0.6 0.8 1 1.2 1.4 1.6 1.8 2Standard Deviation (mm)
Freq
uenc
y
.00%
10.00%
20.00%
30.00%
40.00%
50.00%
60.00%
70.00%
80.00%
90.00%
100.00%
Figure 4—34 Hole profile standard deviation in sandstone

135
0
1
2
3
4
5
6
7
8
9
0.2 0.4 0.6 0.8 1 1.2 1.4 1.6 1.8 2Standard Deviation (mm)
Freq
uenc
y
.00%
10.00%
20.00%
30.00%
40.00%
50.00%
60.00%
70.00%
80.00%
90.00%
100.00%
Figure 4—35 Hole profile standard deviation in 'soft' materials
4.4 Specifications for roofbolters
Discussions with resin manufacturers in South Africa revealed that the required spinning speed
of a roofbolter is approximately 450 rpm if the maximum resin performance is to be achieved. It
is also known that the 240 Nm torque is required to tension the roof bolts to 50 kN.
The following relationship has been established through a linear regression analysis on hole
profile measurements:
FRS0.26 TOR0.24 THR0.44 = 0.016 [4-1]
Where FRS = Free rotation speed (rpm)
TOR = Torque (kN)
THR = Thrust (kN)
From this formula it can be concluded that if the required torque is 240 kN (to apply the 50 kN
tension on installed bolts), and the required free rotation speed is 450 rpm (as recommended by
the resin manufacturers), approximately 15 kN thrust will be required on the drill bit.

136
4.5 Wet and dry drilling
A total of 24 short encapsulated pull tests were conducted to determine the effect of wet and dry
drilling. These tests were conducted for three different resin types; namely, 15-second resin, 30-
second resin and 5/10-minute resin using the same roofbolter, and the same resin from
Manufacturer “B”.
Figure 4—36 shows the bond strengths achieved for different resin types using wet and dry
drilling. This figure indicates that bond strengths for wet drilling are between 4 to 28 per cent
greater than with dry drilling probably due to the fine particles which may be left behind after dry
drilling.
0.00
0.05
0.10
0.15
0.20
0.25
0.30
0.35
0.40
0.45
0.50
15sec resin 60sec resin 5/10min resin
Bon
d St
reng
th (k
N/m
m)
Vacuum
Wet
Figure 4—36 Effect of wet-dry drilling
Figure 4—37 shows the overall stiffnesses achieved when wet and dry drilling is used for
different resins. As can be seen from this figure, the overall stiffnesses are significantly greater
for wet drilling than for dry drilling for the faster speed resin types.

137
0.00
20.00
40.00
60.00
80.00
100.00
120.00
140.00
15sec resin 60sec resin 5/10min resin
Ove
rall
Stiff
ness
(kN/
mm
)
VacuumWet
Figure 4—37 Effect of wet and dry drilling on overall support stiffness
The data shown in the above figures is presented in Table 4—1.
Table 4—1 Effect of wet and dry drilling
Rock
Type Drill type Resin Type Annulus (mm)
Bond
Strength
(kN/mm)
Contact
Shear
Strength
(kPa)
Max Load
Achieved
(kN)
Overall
Stiffness
(kN/mm)
Shale Vacuum 15-second 4.22 0.36 4029.22 90.00 51.72
Shale Wet 15-second 3.93 0.43 4908.03 106.67 131.71
Shale Vacuum 60-second 4.30 0.41 4632.19 103.33 79.88
Shale Wet 60-second 3.63 0.43 4974.21 106.67 103.77
Shale Vacuum 5/10-minute 4.55 0.36 3964.22 90.00 56.08
Shale Wet 5/10-minute 3.35 0.45 5404.71 113.33 55.04
4.6 Determination of roofbolter performances using SEPT
In order to determine the influence that different roofbolters have on the bond strength of roof
bolts installed by the particular bolter, a total of 20 short encapsulated pull tests were conducted
in a shale roof at Greenside, Boschmans, and Goedehoop Collieries. Resin type, flushing type
and bit type were kept the same in all tests.

138
Three roofbolters from three different manufacturers were evaluated. The results are shown in
Figure 4—38. As can be seen, the bond strengths achieved from Manufacturer “C” were greater
than those from Manufacturers “A” and “B”. On average, bond strengths obtained from
Manufacturer “C” were approximately 18 per cent and 28 per cent greater than those obtained
from Manufacturers “A” and “B”, respectively.
0.00
0.10
0.20
0.30
0.40
0.50
0.60
0.70
Manufacturer "A" Manufacturer "B" Manufacturer "C"
Bond
Str
engt
h (k
N/m
m)
Figure 4—38 Performance of roofbolters using SEPT
The data shown in above figure is presented in Table 4—2.
Table 4—2 Performance of roofbolters
Manufacturer
Annulus
(mm)
Bond Strength
(kN/mm)
Contact Shear
Strength (kPa)
Max Load
Achieved (kN)
Overall Stiffness
(kN/mm)
"A" 3.30 0.51 6036.35 126.67 101.94
"B" 4.57 0.47 5131.59 116.67 38.17
"C" 4.25 0.60 6701.32 150.00 170.21

139
4.7 Conclusions
Although a considerable amount of time was spent on this task, few trends could be observed in
the parameters influencing the support performance. The study showed that there are no
standards in South Africa for the parameters investigated (speeds, torque, and thrust).
Underground testing showed that the variations in the parameters are greater than was
previously believed. No correlation between the hole profiles and the parameters investigated
could be discerned.
Nevertheless, this indicates that in South Africa, the installation quality of bolts varies
significantly. Irrespective of design, the bolts are installed in completely different manners.
Unfortunately, there is no data available on the relationship between roof collapses and the
quality of bolt installation. It is therefore impossible to determine empirically which support
installation performs best. This highlights a need for the best equipment performance for the
best support installation to be investigated in detail. Such a study would assist in reducing the
falls of ground and, therefore, the rock-related casualties in South African collieries. However,
experience gained during the underground experiments showed that such work can only be
done in a more controlled environment, such as with the laboratory.
The following parameters are recommended for roofbolters to achieve optimally rough holes in
South African coal mines:
Spinning speed 450 rpm
Torque 240 kN
Thrust 15 kN
Investigation into the effect of wet-dry drilling showed that both the bond strength and system
stiffness were relatively greater for wet drilling than for dry drilling. The reason for this was not
determined but is probably related to the surface condition of the holes and its influence on the
adherence of the resin to the rock.
A series of short encapsulated pull tests indicated that, on average, bond strengths obtained in
shale from roofbolters supplied by Manufacturer “C” were approximately 18 per cent and 28 per
cent greater than those supplied by Manufacturer “A” and “B”, respectively.

140
5 Performance of roof bolts
5.1 Performance of roof bolts manufactured in South Africa
A total of 61 short encapsulated pull tests were conducted on 20 mm roof bolts to determine the
performance of bolts obtained from four manufacturers.
The results from these tests are shown in Figure 5—1. As can be seen from this figure, bolts
from all four manufacturers showed almost identical results in sandstone, while in other rock
types the results were dissimilar. This figure also indicates that bolts from Manufacturer “A”
performed slightly better in shale, whilst manufacturer “B” performed slightly better in coal than
those from the other manufacturers.
0.00
0.10
0.20
0.30
0.40
0.50
0.60
0.70
Manufacturer "A" Manufacturer "B" Manufacturer "C" Manufacturer "D"
Bond
Stre
ngth
(kN/
mm
)
ShaleSandstoneCoal
Figure 5—1 Performance of roof bolts determined from underground SEPTs
As will be shown in the following chapters, the roof bolt profile plays a significant role in
determining the pull-out resistance of roof bolts. However, the above figure indicates that the
variation in the performance of roof bolts in sandstone is not significant. In coal and shale,
however, there appears to be a significant variation in pull-out strength.
The data shown in the above figure is presented in Table 5—1.

141
Table 5—1 Performance of roof bolts determined from underground SEPTs
(averages)
Rock Type Manufacturer
Hole Annulus
(mm)
Bond
Strength
(kN/mm)
Contact Shear
Strength (kPa)
Max Load
Achieved (kN)
Overall Stiffness
(kN/mm)
Shale A 3.30 0.51 6036.35 126.67 101.94
Shale B 4.45 0.31 3406.12 76.67 81.23
Shale C 3.35 0.41 4920.62 103.33 40.26
Shale D 3.67 0.45 5318.22 113.33 23.82
Sandstone A 2.96 0.60 7330.47 150.00 128.48
Sandstone B 3.02 0.60 7281.30 150.00 208.77
Sandstone C 3.49 0.59 6926.54 146.67 30.88
Sandstone D 3.50 0.60 7045.31 150.00 69.56
Coal A 3.50 0.51 5963.47 128.33 47.19
Coal B 2.70 0.59 7313.46 146.67 46.31
Coal D 2.95 0.44 5366.14 110.00 82.07
5.2 Tensioned versus non-tensioned roof bolts
An additional 25 short encapsulated pull tests were conducted to determine the effect of
tensioning on bond strength. These tests were conducted in sandstone and shale roofs.
Figure 5—2 shows the effect of tensioning on bond strength. Non-tensioned roof bolts achieved
significantly greater bond strengths then the tensioned bolts. Figure 5—3 shows the effect of
tensioning on overall support stiffness. Similarly, non-tensioned roof bolts achieved significantly
stiffer systems than the tensioned roof bolts.
It is thought that with tensioned bolts, because the bond length is only 250 mm, the bonding
could easily be damaged when the bolt is being tensioned. For this reason it is probable that the
test results obtained do not give a fair reflection of the performance of tensioned bolts. It is
therefore suggested that a new testing procedure be developed to test the performance of
tensioned bolts.

142
0.0
0.1
0.2
0.3
0.4
0.5
0.6
0.7
Sandstone Shale
Bon
d S
treng
th (k
N/m
m)
UntensionedTensioned
Figure 5—2 Effect of tensioning on bond strength
0.0
20.0
40.0
60.0
80.0
100.0
120.0
140.0
Sandstone Shale
Ove
rall
Stif
fnes
s (k
N/m
m)
UntensionedTensioned
Figure 5—3 Effect of tensioning on overall stiffness
The data shown in the above figures is presented in Table 5—2.

143
Table 5—2 Effect of tensioning on support performance
Rock Type Type
Annulus
(mm)
Bond
Strength
(kN/mm)
Contact Shear
Strength (kPa)
Max Load
Achieved
(kN)
Overall
Stiffness
(kN/mm)
Sandstone Non-tensioned 2.96 0.60 7330.47 150.00 128.48
Sandstone Tensioned 3.87 0.29 3375.81 73.33 55.25
Shale Non-tensioned 3.30 0.51 6036.35 126.67 101.94
Shale Tensioned 5 3.35 0.43 5131.66 106.67 24.54
5.3 Variation in roof bolt parameters
In a support system, it may not be possible to control the hole diameter, because of many
factors, such as the rock strength, bit type, drilling type, thrust of roofbolter etc. However, it is
possible to control the bolt diameter and profile, which is a part of the engineering design.
Therefore, an investigation into the variations in the roof bolts that are currently being used in
South Africa was conducted by means of measuring the bolt core diameters and rib diameters
from different bolt manufacturers in South Africa.
A total of 235 roof bolts from three different manufacturers were evaluated (approximately 80
roof bolts from each manufacturer). The bolts were measured in three places - top, middle and
above the thread - to give an average bolt diameter. Rib diameter was measured diagonally
across both ribs and bolt core diameter was measured between the ridges, normal to the axis of
the bolt.
Bolts of 16 mm diameter were measured from Manufacturers “A” and “B”, and 20 mm roof bolts
were measured from Manufacturer “C”.
Figure 5—4 shows the deviations of roof bolt diameters (from the average) and the average roof
bolt diameters from these three manufacturers. This figure highlights that the deviations from
the average diameters of roof bolts from Manufacturers “A” and “C” will be in a significantly
narrower range than those from Manufacturer “B”.
The rib diameter measurements from these three manufacturers are presented in Figure 5—5.
This figure shows that there is a significant variation in the rib-heights of the roof bolts from
Manufacturer “B” and that the average rib-height of roof bolts from this manufacturer is
approximately 34 per cent less than those supplied by the other two manufacturers.

144
The effect of annulus size on support performance has been shown to be significant. Also,
theoretically, a 0.6 mm reduction in bolt diameter can reduce the yield load of a 16 mm bolt by 7
per cent (assuming a tensile strength of 480 MPa). This highlights the need for quality control
procedures to be in place at mines for checking the elements of a support system, which are
themselves part of the engineering design (roof bolt, bits etc.).
-0.7
-0.5
-0.3
-0.1
0.1
0.3
0.5
0.7D
evia
tion
from
Ave
rage
(mm
) Average Bolt Diameter =15.98 mm
Manufacturer “A”
-0.7
-0.5
-0.3
-0.1
0.1
0.3
0.5
0.7
Dev
iatio
n fr
om A
vera
ge (m
m) Average Bolt Diameter =15.42 mm
Manufacturer “B”
-0.7
-0.5
-0.3
-0.1
0.1
0.3
0.5
0.7
Dev
iatio
n fr
om A
vera
ge (m
m) Average Bolt Diameter =20.01 mm
Manufacturer “C”
Figure 5—4 Roof bolt diameter deviations in bolts from three different manufacturers

145
0
0.2
0.4
0.6
0.8
1
1.2
1.4
1.6
1.8
Rib
hei
ght (
mm
)
Average Rib Height =1.44 mm
Manufacturer “A”
0
0.2
0.4
0.6
0.8
1
1.2
1.4
1.6
1.8
2
Rib
hei
ght (
mm
)
Average Rib Height =1.07 mm
Manufacturer “B”
0
0.2
0.4
0.6
0.8
1
1.2
1.4
1.6
1.8
2
Rib
hei
ght (
mm
)
Average Rib Height =1.36 mm
Manufacturer “C”
Figure 5—5 Roof bolt rib-height measurements in bolts from three different
manufacturers
An attempt was also made to determine the rib thickness, the spacing between the ribs, and the
angle of the ribs of currently used roof bolts in South Africa. Approximately 30 roof bolts from
four different suppliers were obtained and three measurements were taken for each bolt. The
average results obtained from each manufacturer are shown in Table 5—3.
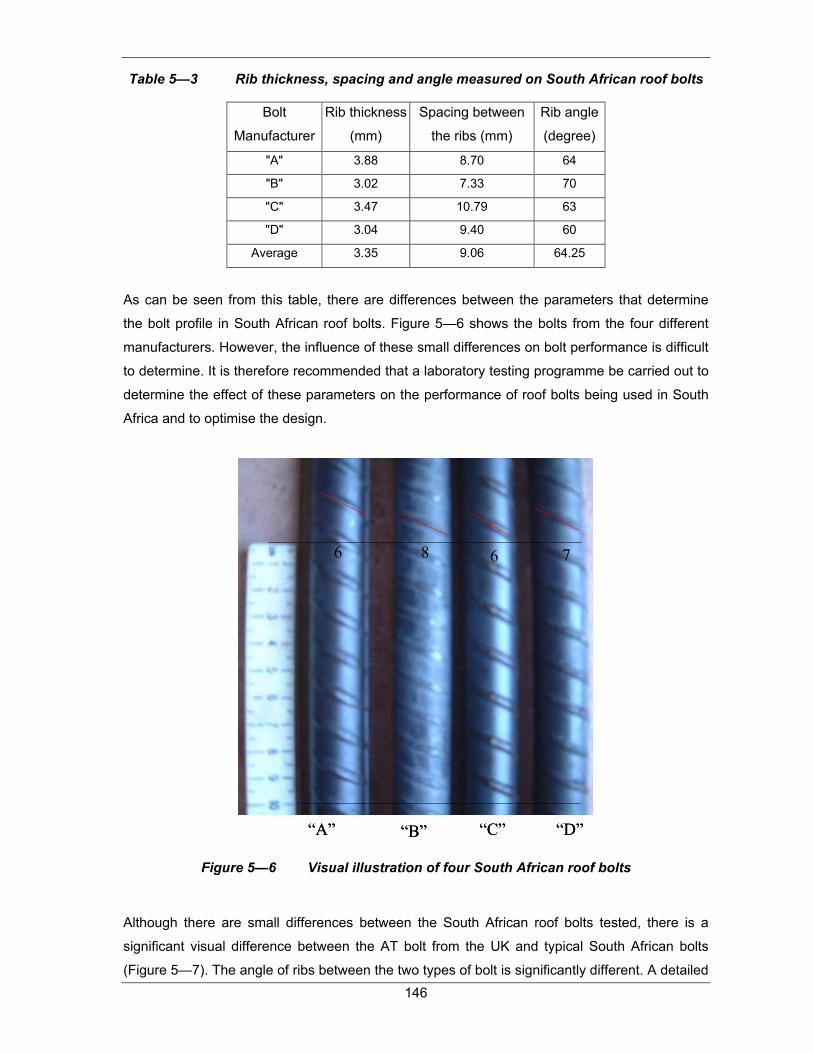
146
Table 5—3 Rib thickness, spacing and angle measured on South African roof bolts
Bolt
Manufacturer
Rib thickness
(mm)
Spacing between
the ribs (mm)
Rib angle
(degree)
"A" 3.88 8.70 64
"B" 3.02 7.33 70
"C" 3.47 10.79 63
"D" 3.04 9.40 60
Average 3.35 9.06 64.25
As can be seen from this table, there are differences between the parameters that determine
the bolt profile in South African roof bolts. Figure 5—6 shows the bolts from the four different
manufacturers. However, the influence of these small differences on bolt performance is difficult
to determine. It is therefore recommended that a laboratory testing programme be carried out to
determine the effect of these parameters on the performance of roof bolts being used in South
Africa and to optimise the design.
“D”“C”“B”“A”
6 8 6 7
“D”“C”“B”“A”
6 8 6 7
Figure 5—6 Visual illustration of four South African roof bolts
Although there are small differences between the South African roof bolts tested, there is a
significant visual difference between the AT bolt from the UK and typical South African bolts
(Figure 5—7). The angle of ribs between the two types of bolt is significantly different. A detailed

147
sensitivity analysis to the various parameters should be conducted on the resin that would be
used and the rock types in which it would be installed in South African collieries.
Roofbolting should be considered as a system and the design of elements comprising the
system should be such that the difference in strength between the weakest and strongest
element is minimised.
AT BoltFrom UK
South African Bolt (“D”)
AT BoltFrom UK
South African Bolt (“D”)
Figure 5—7 Visual comparison of UK and South African bolts
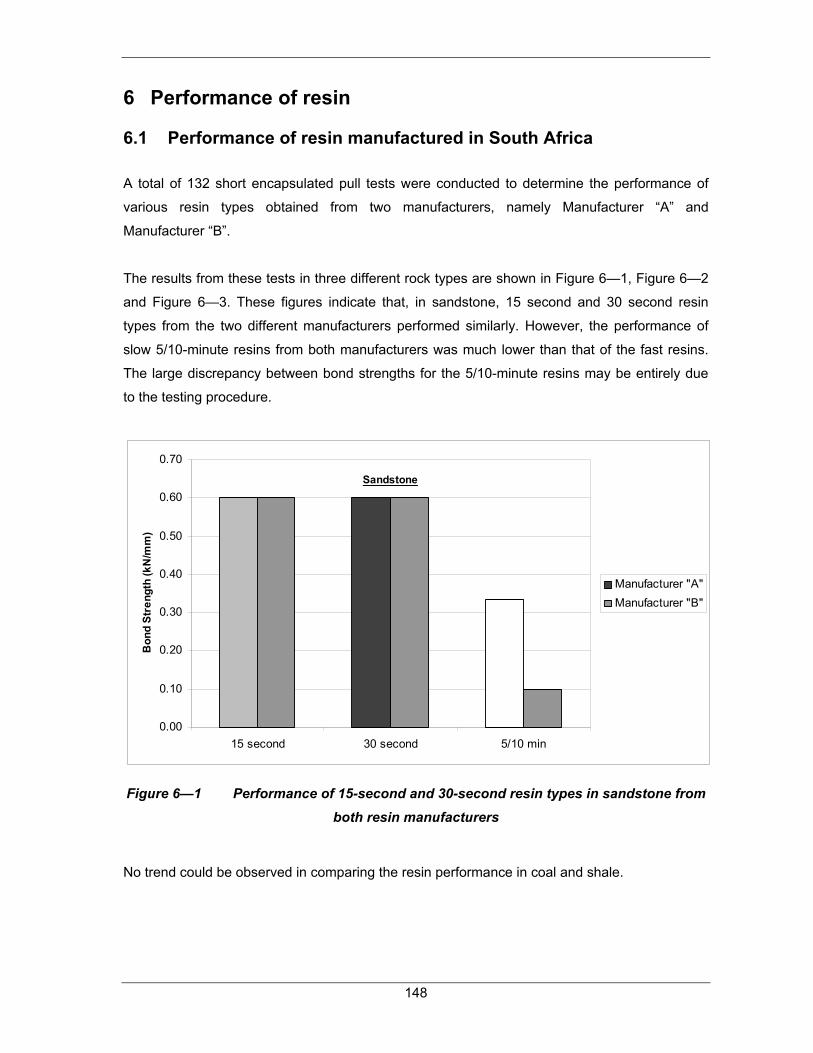
148
6 Performance of resin
6.1 Performance of resin manufactured in South Africa
A total of 132 short encapsulated pull tests were conducted to determine the performance of
various resin types obtained from two manufacturers, namely Manufacturer “A” and
Manufacturer “B”.
The results from these tests in three different rock types are shown in Figure 6—1, Figure 6—2
and Figure 6—3. These figures indicate that, in sandstone, 15 second and 30 second resin
types from the two different manufacturers performed similarly. However, the performance of
slow 5/10-minute resins from both manufacturers was much lower than that of the fast resins.
The large discrepancy between bond strengths for the 5/10-minute resins may be entirely due
to the testing procedure.
0.00
0.10
0.20
0.30
0.40
0.50
0.60
0.70
15 second 30 second 5/10 min
Bon
d St
reng
th (k
N/m
m)
Manufacturer "A"Manufacturer "B"
Sandstone
Figure 6—1 Performance of 15-second and 30-second resin types in sandstone from
both resin manufacturers
No trend could be observed in comparing the resin performance in coal and shale.

149
0.00
0.10
0.20
0.30
0.40
0.50
0.60
0.70
15s 30s
Bond
Stre
ngth
(kN
/mm
)
Manufacturer "A"Manufacturer "B"
Shale
Figure 6—2 Performance of 15-second and 30-second resin types in shale from both
resin manufacturers
0.00
0.10
0.20
0.30
0.40
0.50
0.60
0.70
15s 30s
Bon
d St
reng
th (k
N/m
m)
Manufacturer "A"
Manufacturer "B"
Coal
Figure 6—3 Performance of 15-second and 30-second resin types in coal from both
resin manufacturers
An analysis of the system stiffness of both resin types from both manufacturers was also
conducted. The results are shown in Figure 6—54.

150
0
20
40
60
80
100
120
140
160
180
Sandstone Shale Coal
Ove
rall
Stif
fnes
s (k
N/m
m)
15s Manufacurer "A"
30s Manufacurer "A"
15s Manufacurer "B"
30s Manufacurer "B"
Figure 6—4 System stiffness of 15-second and 30-second resin types from both
resin manufacturers
Figure 6.4 indicates that both 15-second and 30-second resins from Manufacturer “A” achieved
higher stiffness than those from Manufacturer “B” in sandstone and coal. In shale, both resins
from both manufacturers performed in a similar manner.
The data shown in above figures is presented in Table 6—1.

151
Table 6—1 Overall stiffnesses of resin determined from underground SEPTs
(averages)
Rock Type Manufacturer Resin Type
Annulus
(mm)
Bond
Strength
(kN/mm)
Contact Shear
Strength (kPa)
Max Load
Achieved
(kN)
Overall
Stiffness
(kN/mm)
Sandstone A 15-second 3.37 0.60 7170.96 150.00 150.35
Sandstone A 30-second 3.80 0.60 6980.67 150.00 167.35
Sandstone A 5/10-minute 3.17 0.33 4013.31 83.33 65.56
Sandstone B 15-second 3.01 0.60 7299.21 150.00 71.23
Sandstone B 30-second 2.96 0.60 7330.47 150.00 128.48
Sandstone B 5/10-minute 3.33 0.11 1184.60 25.00 22.03
Shale A 15-second 3.45 0.48 5689.04 120.00 58.53
Shale A 30-second 3.37 0.51 6034.17 126.67 43.88
Shale B 120-second 3.65 0.39 4613.01 98.33 24.51
Shale B 15-second 3.22 0.37 4497.89 93.33 54.33
Shale B 30-second 3.30 0.51 6036.35 126.67 67.66
Shale B 5/10-minute 3.27 0.49 5957.16 123.33 42.99
Coal A 15-second 3.55 0.60 7056.66 150.00 82.46
Coal A 30-second 3.43 0.42 4901.13 105.00 88.10
Coal B 15-second 3.48 0.60 7100.73 150.00 40.86
Coal B 30-second 3.50 0.51 5963.47 128.33 47.19
6.2 Effect of spinning speed on resin setting
In order to determine the effect of spinning speed on resin setting times, a series of tests was
conducted at the Minova (South Africa) laboratory. The Minova gel tester comprises an electric
motor attached to a spinning arm. Into this arm is inserted a disposable plastic paddle. The arm
is then lowered into a hand-prepared resin/catalyst sample and spun. The electric current used
by the motor is monitored throughout the spinning process. As the resin gels, the resistance to
the motor increases, with a resultant increase in the required current. At a preset current (in
milliamps) the resin is deemed to have set and the test is complete. A plot of mA versus time is
then interpreted to determine the gelling time of the sample.
The frequency of current to the motor in the gel tester is variable and the spinning speed is
directly related to this. In the Minova laboratory tests the free rotation speed of the motor was
measured every 5 Hz up to the maximum in order that the relationship between frequency and
spinning speed could be established. The free rotation speed is the speed of the motor when it

152
is not under load. Once this was established, tests were performed using Minova’s 15 and 30
second resins at the various frequencies and resulting spinning speeds.
70 mm
20 m
m
70 mm
20 m
m
Figure 6—5 Disposable plastic paddle used in mixing the resin
Figure 6—6 Minova gel tester
Figure 6—7 shows the spinning times versus the gelling times of 15-second and 30-second
resin at different free rotation speeds.
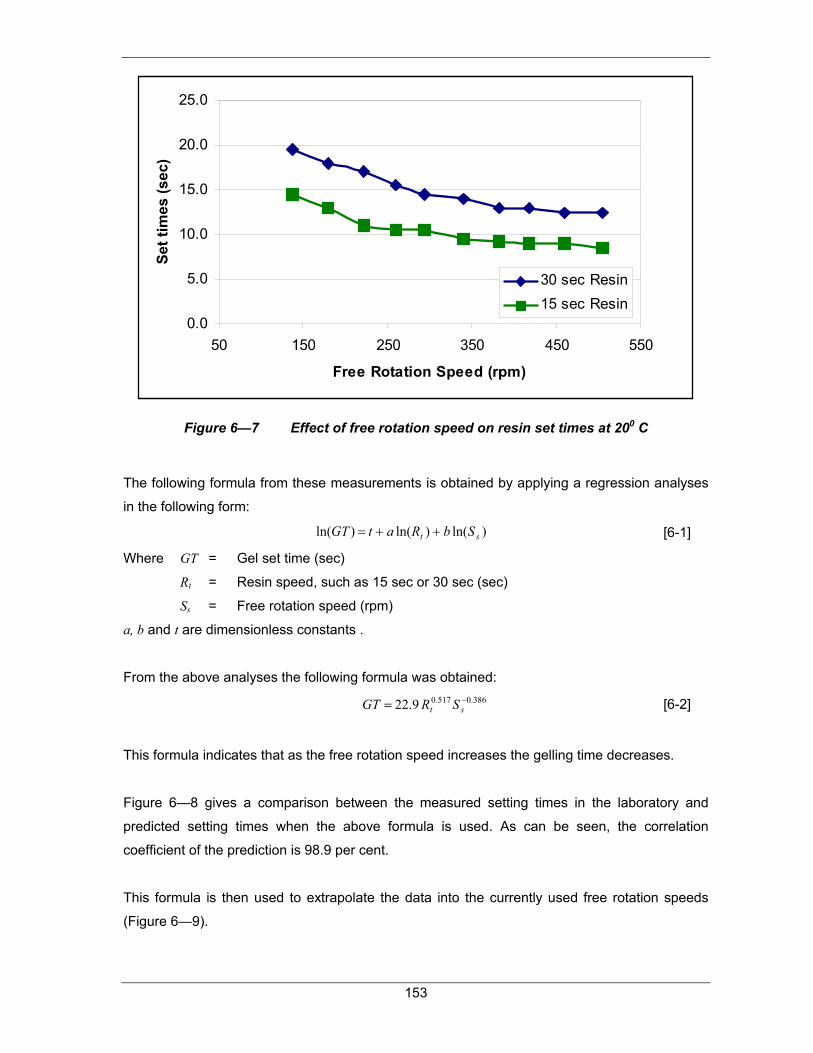
153
0.0
5.0
10.0
15.0
20.0
25.0
50 150 250 350 450 550
Free Rotation Speed (rpm)
Set t
imes
(sec
)
30 sec Resin15 sec Resin
Figure 6—7 Effect of free rotation speed on resin set times at 200 C
The following formula from these measurements is obtained by applying a regression analyses
in the following form:
)ln()ln()ln( st SbRatGT ++= [6-1]
Where GT = Gel set time (sec)
Rt = Resin speed, such as 15 sec or 30 sec (sec)
Ss = Free rotation speed (rpm)
a, b and t are dimensionless constants .
From the above analyses the following formula was obtained: 386.0517.09.22 −= st SRGT [6-2]
This formula indicates that as the free rotation speed increases the gelling time decreases.
Figure 6—8 gives a comparison between the measured setting times in the laboratory and
predicted setting times when the above formula is used. As can be seen, the correlation
coefficient of the prediction is 98.9 per cent.
This formula is then used to extrapolate the data into the currently used free rotation speeds
(Figure 6—9).

154
Figure 6.9 indicates that as the free rotation speed increases the set times of the resin
decreases for both resin types (approximately 80 percent reduction in 30-second resin, and 100
per cent reduction in 15-second from free rotation speeds of 150 rpm to 700 rpm).
y = 0.992x + 0.093R2 = 0.989
0
5
10
15
20
25
0 5 10 15 20 25
Measured setting time (sec)
Pred
icte
d se
tting
tim
e (s
ec)
Figure 6—8 Comparison between measured and predicted setting times
0.0
5.0
10.0
15.0
20.0
25.0
100 200 300 400 500 600 700
Free rotation speed (rpm)
Resi
n se
t tim
e (s
ec)
30 sec Resin15 sec Resin
Figure 6—9 Resin set times versus free rotation speed

155
This Figure can be used to adjust the setting times of 15-second and 30-secon resin for the
different free rotation speeds of roofbolters.

156
7 Specifications for bolt and resin
The deform pattern of a bolt is an important factor in determining the support system
performance. The bolt profile determines three important phases of support installation and
performance. These are:
• Quality of resin mixing;
• Pushing the resin towards the end of the hole; and
• Load transfer capabilities of the bolting system.
However, the effect of bolt profile on support performance is poorly understood by the end user.
The majority of information pertaining to the design and specification of fully encapsulated
rockbolting systems is commercial intellectual property, and little information is available in the
public domain. One of the causes of this lack of knowledge regarding the influence of bolt profile
on support performance is the testing procedure adopted. When testing the effect of bolt profile,
the important factor is the location of the failure mechanism, which should be on the resin-bolt
interface. Extensive laboratory short encapsulated pull tests resulted in inconsistent results due
to failure taking place on the rock- or pipe-resin interface. In this case, the maximum load in the
test is probably independent of bolt profile, assuming that bolt profile did not affect the quality of
resin mixing.
The important considerations in a roof bolt profile are depicted in Figure 7—1:
• The rib radius (R);
• Rib angle (α);
• Distance between the ribs (p); and
• Thickness of rib (d).

157
CL
r
p
d
Resin
R
Bolt shear point
Resin shear point
α
CL
r
p
d
Resin
R
Bolt shear point
Resin shear point
α
Figure 7—1 Simplified drawing of roof bolt profile components
Matching the bolt profile to resin strength is also an important consideration in support system
design. In 1999, the South African coal mining industry imported Australian low-rib height roof
bolts, which showed relatively poor performance (O’Connor, 2004).
O’Connor (2004) developed a mathematical model to determine the effectiveness of matching
resin properties to the profile of the bolt. This model is based on the bolt shearing at the base of
the ribs, at the same load as the grout shears between the ribs. O’Connor states that this
happens when:
pRrd
=strengthshearSteelstrengthshearResin
[7-1]
Where R is the rib radius, α is the rib angle, p is distance between the ribs, and d is the
thickness of rib.

158
This equation indicates that to maintain a balanced performance between resin and roof bolt
profile, lower resin strength requires either higher ribs, or longer spacing between ribs, or both
of these. Note that this model ignores the effects of resin mixing, film shredding and rib angle.
This model also indicates that the maximum pull-out loads can be achieved between the resin
and roof bolt when:
• The ribs are relatively high;
• The distance between the ribs is relatively low; and
• The ribs are relatively thick.
It should also be noted that the failure between the rock and the resin takes place in a similar
manner. Therefore, the pull-out loads (from SEPT) in stronger rock (such as sandstone) are
greater than in softer rock, such as shale (Figure 7—2).
F
Rock shear point
Resin shear point
FF
Rock shear point
Resin shear point
Figure 7—2 Simplified drawing of failure between the rock and the resin
As can be seen from Figure 7—2 and Equation [7-1], the pull-out load to failure will increase:
• When the rock shear strength is relatively high; and
• When the hole is rougher.
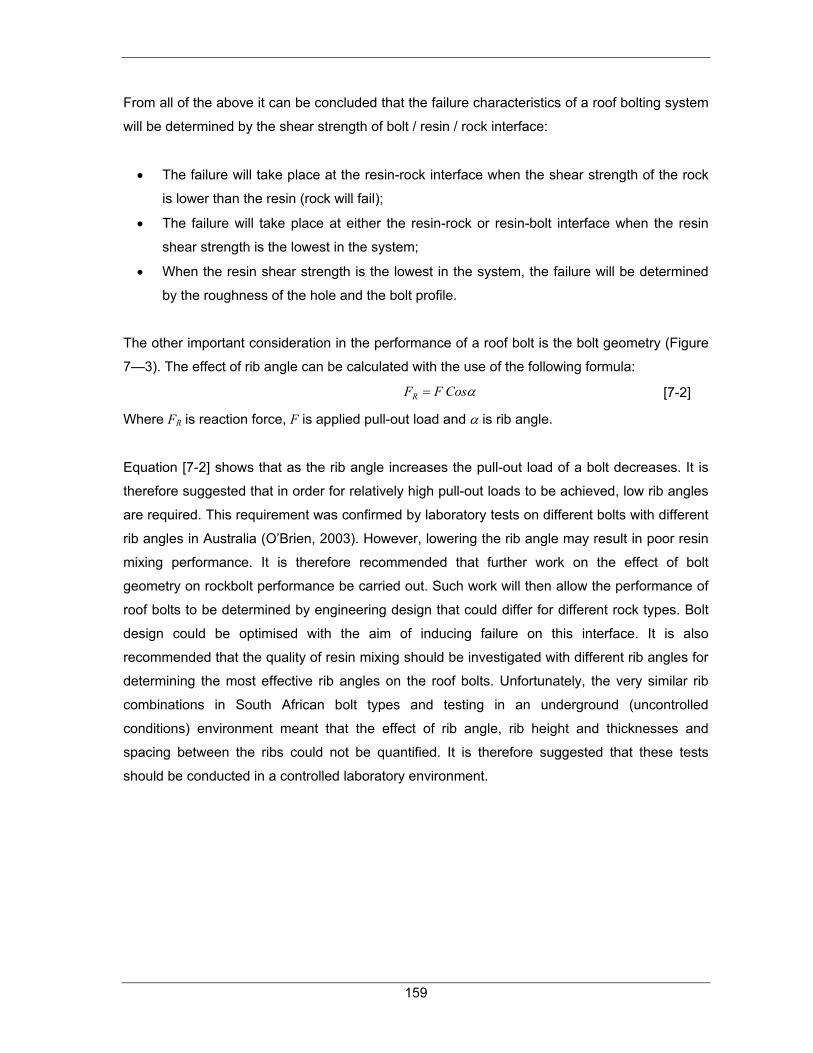
159
From all of the above it can be concluded that the failure characteristics of a roof bolting system
will be determined by the shear strength of bolt / resin / rock interface:
• The failure will take place at the resin-rock interface when the shear strength of the rock
is lower than the resin (rock will fail);
• The failure will take place at either the resin-rock or resin-bolt interface when the resin
shear strength is the lowest in the system;
• When the resin shear strength is the lowest in the system, the failure will be determined
by the roughness of the hole and the bolt profile.
The other important consideration in the performance of a roof bolt is the bolt geometry (Figure
7—3). The effect of rib angle can be calculated with the use of the following formula:
αCosFFR = [7-2]
Where FR is reaction force, F is applied pull-out load and α is rib angle.
Equation [7-2] shows that as the rib angle increases the pull-out load of a bolt decreases. It is
therefore suggested that in order for relatively high pull-out loads to be achieved, low rib angles
are required. This requirement was confirmed by laboratory tests on different bolts with different
rib angles in Australia (O’Brien, 2003). However, lowering the rib angle may result in poor resin
mixing performance. It is therefore recommended that further work on the effect of bolt
geometry on rockbolt performance be carried out. Such work will then allow the performance of
roof bolts to be determined by engineering design that could differ for different rock types. Bolt
design could be optimised with the aim of inducing failure on this interface. It is also
recommended that the quality of resin mixing should be investigated with different rib angles for
determining the most effective rib angles on the roof bolts. Unfortunately, the very similar rib
combinations in South African bolt types and testing in an underground (uncontrolled
conditions) environment meant that the effect of rib angle, rib height and thicknesses and
spacing between the ribs could not be quantified. It is therefore suggested that these tests
should be conducted in a controlled laboratory environment.

160
F
Rib
FR
α
α
F
F
Rib
FR
α
α
F
Figure 7—3 Effect of rib angle on pull-out loads (simplified)

161
8 Effect of bit, annulus and rock type
8.1 Performance of bits
Two types of drill bits are commonly used in South African collieries. These are the 2-prong bits
and the spade bit. Both bits are shown in Figure 8—1.
Spade bit 2-Prong bitSpade bit 2-prong bit
Figure 8—1 Spade and 2-prong bits (25 mm)
A total of 40 short encapsulated pull tests were conducted in order that the performance of the
two different bit types could be determined.
The results from these tests in sandstone and shale are summarised in Figure 8—2. As can be
seen in the figure the 2-prong bit outperformed the spade bit in both rock types. However, the
annuli obtained from the 2-prong bit were always greater than those from the spade bit (Figure
8—3). This is probably because of rougher holes obtained with 2-prong bits.
The stiffnesses obtained from the 2-prong bits were also greater than those from the spade bit
(Figure 8—4). These findings suggest that 2-prong bits are more effective in collieries than the
spade bits.

162
0.0
0.1
0.2
0.3
0.4
0.5
0.6
0.7
Sandstone Shale
Bond
Str
engt
h (k
N/m
m)
2-Prong BitSpade Bit
Figure 8—2 Performance of spade bit and 2-prong bit
2.5
2.6
2.7
2.8
2.9
3.0
3.1
3.2
3.3
3.4
Sandstone Shale
Hole
Ann
ulus
(mm
)
2-Prong BitSpade Bit
Figure 8—3 Hole annuli obtained from the 2-prong and spade bits

163
0.0
20.0
40.0
60.0
80.0
100.0
120.0
140.0
Sandstone Shale
Ove
rall
Stif
fnes
s (k
N/m
m)
2-Prong BitSpade Bit
Figure 8—4 Overall stiffnesses obtained from the 2-prong and spade bits
The data shown in the above figures is presented in Table 6—1.
Table 8—1 Performance of bit using SEPT
Rock Type Bit Type
Annulus
(mm)
Bond
Strength
(kN/mm)
Contact Shear
Strength (KPa)
Max Load
Achieved
(kN)
Overall
Stiffness
(kN/mm)
Sandstone 2-Prong 2.96 0.60 7330.47 150.00 128.48
Sandstone Spade 2.83 0.48 5842.97 120.00 102.35
Shale 2-Prong 3.30 0.51 6036.35 126.67 101.94
Shale Spade 3.10 0.34 4110.14 85.00 23.20
8.2 Effect of hole annulus
Borehole annulus is defined as half of the difference between the bolt and hole diameters. As a
continuation to the investigation to determine the effect of borehole annulus on support
performance, an additional 68 short encapsulated pull tests were conducted under near
identical conditions in sandstone and shale roofs. These tests were done using a variety of
different sized drill bits in order to attain the necessary annuli. The results from these tests are
shown in Figure 8—5.

164
As can be seen, the results from these tests show that an annulus between 2.8 mm 4.5 mm
resulted in the highest bond strengths. Another interesting point is that as the annulus drops
below 2 mm, it appears to have a negative effect on the bond strength. This confirms the
findings of tests conducted by Hagan (2003) in Australia.
0.00
0.10
0.20
0.30
0.40
0.50
0.60
0.70
0.0 1.0 2.0 3.0 4.0 5.0 6.0 7.0 8.0 9.0
Annulus (mm)
Bond
Str
engt
h (k
N/m
m)
ShaleSandstoneCoal
2.5 mm to 3.8 mm
Figure 8—5 Effect of hole annulus on bond strength
Note that the annuli in Figure 8—5 are determined from the actual hole and bolt diameter
measurements, and not from the bit size. Generally, 24 mm or 25 mm bits with 20 mm roof bolts
give an annulus of 2.8 mm and 4.5 mm respectively. It is therefore suggested that these bit
sizes should be used with 20 mm roof bolts.
8.3 Effect of rock types
As has been indicated previously by many researchers, rock type greatly affects support
performance. To investigate this effect, a series of pull tests were conducted at Greenside,
Spitzkop, South Witbank, and Forzando Collieries.
Figure 8—6 highlights the very distinct differences between bolt system performances in
different rock types. The results clearly show that sandstone produces significantly better results
than shale and coal, as was explained in Section 7 of this report. From these results it can be
concluded that rock type is one of the primary factors influencing support system performance.

165
0.00
0.10
0.20
0.30
0.40
0.50
0.60
0.70
Sandstone Shale Coal
Bond
Stre
ngth
(kN/
mm
)
Figure 8—6 Effect of rock type on support performance

166
9 Support system selection and design
Although rock-related injuries and fatalities on coal mines have reduced substantially over the
past decade (Canbulat, 2003) as a result of improvements in support design and installation, fall
of ground accidents remain the single major cause of fatalities in South African collieries.
A SIMRAC project conducted by van der Merwe et al. (2001) on the causes of falls of ground in
South African collieries highlighted that almost 70% of all falls occurred after support had been
installed, just over 10% before support had been installed, and in 20% of the cases where there
was no systematic support installed.
This finding shows that a support system design needs to improved and optimised for particular
application.
9.1 Support design methodology for beam building mechanism
Roof bolting is the most common support system used in South African collieries. Full-column
single-resin bolts, full-column slow-fast combination resin bolts, resin point anchors, and
mechanical anchors are the most widely used support systems. For many years the design of
roof support systems was based on experience and the judgment of mining personnel. Although
this approach was fairly successful, a more scientific approach based on sound engineering
principles was required.
Generally, the roof in South African coal mines can be considered to consist of a succession of
plates, due to the stratified composition of the sediments comprising coal measures. If the
length of an excavation is more than twice its width, the analysis can be further simplified to
consider the behaviour of beams, rather than plates.
The design of systematic roof bolt support systems is based on two basic principles, namely
suspension and beam building. Both these principles assume that the roof consists of a
horizontal beam that is clamped at both ends. Owing to the horizontal stratification of typical
coalmine measures, this assumption is justified.
The suspension method of designing roof support is based on the principle of suspending the
total weight of an immediate roof beam from a more competent layer above it. This principle
assumes that the total weight of a beam is suspended by a systematic pattern of support units.

167
It further assumes that the weight that can be supported by a support unit is directly proportional
to the strength of the unit and inversely proportional to the thickness of the beam.
When the roof consists of a succession of thin beams, none of which are self-supporting, the
suspension principle cannot be applied. In this case it is necessary to combine individual beams
to provide a composite beam that is self-supporting. In order for two horizontal beams to bend
together, there must be relative lateral movement between them. This lateral movement can
only take place if the shear strength of the contact between the two beams can be overcome.
This is the principle adopted in the beam-building mechanism for determining the support
strategies for collieries.
9.2 Transverse shear stresses in beams
Beams are the most common of all structural elements, and often they are subjected to
transverse loads that generate both bending moments M(x) and shear forces V(x) along the
beam. The bending moments cause bending normal stresses, σ, to arise through the depth of
the beam, and the shear forces cause transverse shear-stress distribution through the beam
cross-section as shown in Figure 9—1.
a
a
P Transverse Force
xArea A
Resultant ShearForce V(x)
Cross-section a-a
Area Aτ=0 at the top surface
Shear stress τ
a
a
P Transverse Force
xArea A
Resultant ShearForce V(x)
Cross-section a-a
Area Aτ=0 at the top surface
Shear stress τ
Figure 9—1 Beam with transverse shear force showing the transverse shear stress
developed by it
One important consideration in beam theory is that for a typical beam section with a transverse
stress as in Figure 9—1, the top and bottom surfaces of the beam carry no longitudinal load,
and that the shear stresses are zero. As a consequence of this, the shear stress distribution is
equal to:
AV(x)τ4
3= [9-1]
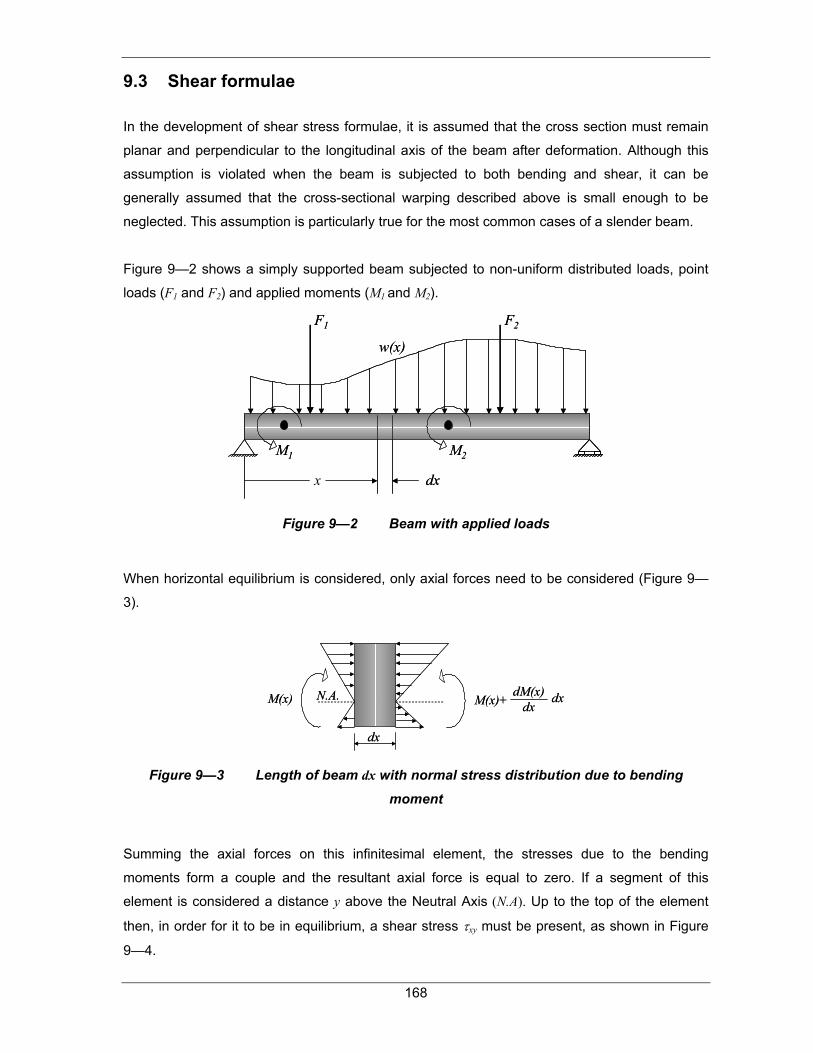
168
9.3 Shear formulae
In the development of shear stress formulae, it is assumed that the cross section must remain
planar and perpendicular to the longitudinal axis of the beam after deformation. Although this
assumption is violated when the beam is subjected to both bending and shear, it can be
generally assumed that the cross-sectional warping described above is small enough to be
neglected. This assumption is particularly true for the most common cases of a slender beam.
Figure 9—2 shows a simply supported beam subjected to non-uniform distributed loads, point
loads (F1 and F2) and applied moments (M1 and M2).
x dx
M1 M2
F1 F2
w(x)
x dx
M1 M2
F1 F2
w(x)
Figure 9—2 Beam with applied loads
When horizontal equilibrium is considered, only axial forces need to be considered (Figure 9—
3).
dx
N.A.M(x) M(x)+dM(x)
dxdx
dx
N.A.M(x) M(x)+dM(x)
dxdx
Figure 9—3 Length of beam dx with normal stress distribution due to bending
moment
Summing the axial forces on this infinitesimal element, the stresses due to the bending
moments form a couple and the resultant axial force is equal to zero. If a segment of this
element is considered a distance y above the Neutral Axis (N.A). Up to the top of the element
then, in order for it to be in equilibrium, a shear stress τxy must be present, as shown in Figure
9—4.

169
Let the width of the section at a distance y from the N.A. be a function of y and call it
“t(y)”.Applying the horizontal equilibrium equation, gives:
∑ ∫∫==
=+−==→+toptop y
yxyx
y
yxx dxytdyytdyytF
02
01 0)()()(0 τσσ [9-2]
dx
dy
N.A.M(x)
ytop
y
σx2σx1
M(x)+ dxdM(x)
dx
y
dy
N.A.
ytop
t(y)
dx
τxy
dx
dy
N.A.M(x)
ytop
y
σx2σx1
M(x)+ dxdM(x)
dxM(x)+ dxdM(x)
dx
y
dy
N.A.
ytop
t(y)
dx
τxy
Figure 9—4 Segment of length dx cut a distance y from N.A., with equilibrating shear
stress τxy.
Substituting for the magnitude of the stresses gives:
∫∫==
=++
−toptop y
yxy
y
y
dxytdyytI
yxdMxMdyytI
yxM
00
0)()())()(()()( τ [9-3]
Simplifying and dividing by dx and t(y) gives:
∫=
=topy
yxy dyyyt
yItdxxdM
0
)()(
1)(τ [9-4]
Since,
dxxdMxV )()( = [9-5]
the shear stress distribution is given by:
ItVQ
yItyQxVdyyyt
yItxV topy
yxy === ∫
=)(
)()()()()(
0
τ [9-6]
where V(x) = the shear force carried by the section
I = the second moment of area
T(y) = the sectional width at the distance y from the N.A.
Q(y) = ∫ =topy
y
Aydyyyt '')( where A’ is the top (or bottom) portion of the member’s
cross-sectional area, defined from the section where t(y) is measured, and
'
y is the distance to the centroid of A’, measured from the N.A.

170
9.4 Shear stresses in beams
Consider the beam to have a rectangular cross section of width b and height h as in Figure 9—
5.
h
centroid of A’
A’ y’
b
N.A.
h/2 y
N.A.
τmax
τ=0
Shear stress distribution
Parabolic curve
τmaxh
centroid of A’
A’ y’y’
b
N.A.
h/2 y
N.A.
τmax
τ=0
Shear stress distribution
Parabolic curve
τmax
Figure 9—5 Computation and distribution of shear stress in a beam with rectangular
cross-section
The distribution of the shear stress throughout the cross section due to a shear force V can be
determined by computing the shear stress at an arbitrary height y from the N.A.
byhbyhyhyAyQ
−=
−
−+== 2
2''
421
2.
221 [9-7]
The second moment of area for a beam of rectangular cross-section is given by: 12
3bhI =
With t=b, applying the shear formula, Equation [9-6] becomes:
−=
−
== 22
33
22
46
12
421
yhbh
V
bbh
byhV
ItVQτ [9-8]
The result indicates that the shear stress distribution over the cross-section is parabolic, as
plotted in Figure 9—5. The shear force intensity varies from zero at the top and bottom, y = ±
h/2, to a maximum value at the neutral axis at y = 0.
From the above equation, the maximum shear stress that occurs at the N.A. where y=0 is:

171
AV
23
=τ [9-9]
Where A = hb. By comparison, τmax is 50% greater than the average shear stress determined
from Equation [9-1].
Figure 9—6 shows a beam subjected to a uniformly distributed load (w).
wBRA 21
= wBRB 21
=
w
wBRA 21
= wBRB 21
=
w
Figure 9—6 Reactions and shear forces in a beam
wBRRV BA 21
=== [9-10]
Where w is distributed load and B is bord width:
2ghBw ρ
= [9-11]
Where h = supported thickness (m)
ρ = density of suspended strata (kg/m3)
g = gravitational acceleration (m/s2)
Equation [9-9] then becomes:
hBgh
83 'ρτ = [9-12]
For underground application, h’ = h+h1 where h1 is the thickness of soft roof material on top of
the supported beam, which creates a surcharge load on the beam. Equation [9-12] then
becomes:
hBhhg
8)(3 1+
=ρτ [9-13]
The shear strength of the contact plane is dependant on the friction and the cohesion between
the two beams and is, therefore, a function of the coefficient of friction of the contact surface (µ),
which is estimated 0.5 for shale, and the normal force across the surface. Installing a roof bolt

172
through the contact plane and then tensioning the roof bolt can apply an increased normal force
across the contact plane.
The shear resistance of a tensioned roof bolt system can be calculated by using the following
formula:
µpR nFT = [9-14]
Where n is the number of bolts per square metre, and Fp is the pre-tension on the bolt (usually
50 kN).
Owing to the shear strength of the bolt, shear resistance is also generated, which should also
be considered in the design. This can be calculated using the following formula:
RB nST = [9-15]
Where SR is shear strength of bolt (in kN).
There have been extensive studies in the past to determine the shear strength of a bolt. In
South Africa, it has been accepted that 50 per cent of the tensile strength of a bolt is
approximately equal to the shear strength of a bolt. However, Azuar (1977) concluded, from
tests of resin-grouted bolts embedded in concrete, that the shear resistance of a joint when the
bolt is installed perpendicular to the joint is similar to the tensile strength, and about 90 per cent
for inclined bolts. Roberts (1995) reported shear test results for smooth bars, rebars and cone
bolts. From tests , Roberts (1995) noted that a grouted 16-mm diameter rebar had a static shear
strength of almost 90 per cent of the ultimate tensile strength. Since this simple assumption will
determine the required bolt length and density, it has been conservatively assumed in this study
that the shear strength of a full column bolt is equal to 80 per cent of the ultimate tensile
strength of the bolt.
Equation [9-15] then becomes:
BB nST 8.0= [9-16]
Where SB is ultimate strength of bolt (in kN).
The shear resistance a bolt can therefore be determined as follows:
)8.0( BpTOTAL SFnT += µ [9-17]
The effect of surcharge load created by the soft strata resting on the bolted strata for different
bolt lengths is shown in Figure 9—7 (bord width is 6.0 m, a yielding strength of 18 tons for the
bolt) using Equations [9-13] and [9-17]. This figure shows that, as the length of bolt increases
(thickness of bolted strata), the shear stress decreases in a beam. It can be concluded that the

173
thickness of soft strata resting on a supported beam a very important consideration, especially
at shallow depth, because of the weathered nature of the strata. The implication of increasing
thickness of soft strata on the bolted roof is that the required support density will also increase,
and eventually it will reach a point where the roof cannot be supported (Figure 9—8).
0
0.02
0.04
0.06
0.08
0.1
0.12
0.14
0.16
0.18
0 0.5 1 1.5 2 2.5
Surcharge thickness (m)
Shea
r Str
ess
(MPa
)
1.0 m bolt length
1.5 m bolt length
2.0 bolt length
Figure 9—7 Effect of thickness of soft strata overlying a supported beam on shear
stress in the beam (bord width is 6.0 m)
0
0.1
0.2
0.3
0.4
0.5
0.6
0.7
0.8
0.9
0 0.5 1 1.5 2 2.5
Height of soft material (m)
Supp
ort d
ensi
ty p
er s
quar
e m
eter
1.0 m bolt length
1.5 m bolt length
2.0 bolt length
Figure 9—8 Effect of increasing thickness of soft strata on required support density
(bord width is 6.0 m)

174
It is common practice to use four 20 mm (18 ton yield strength) bolts in a row, and a 1.5 m to 2.0
m row spacing. The maximum soft strata thicknesses that can be supported for rows spaced
1.5 m and 2.0 m apart (for different bolt lengths) is shown in Table 9-1.
Table 9—1 Height of soft-surcharge material for different bolt lengths
Distance between the
rows (m)
Support length (m)
Height of surcharge material
(m) 0.9 0.59
1.2 0.78
1.5 0.98
1.8 1.17
1.5
2.0 1.30
0.9 0.21
1.2 0.29
1.5 0.36
1.8 0.43
2.0
2.0 0.48
9.5 Height of roof softening
Before an opening is excavated, the underground stress distribution is uniform and the
magnitude of vertical stress increases proportionally to the depth. But once an opening is made,
the portion of the strata directly above the opening loses support and the stress equilibrium is
disturbed. The roof starts to sag under the gravitational force. If the immediate roof strata are
competent, the sag will stop before the roof collapses and the stresses around the opening will
eventually reach a new equilibrium. However, in coal mines, the immediate roofs of entries are
not always competent enough to sustain the changes of the stress distribution and the
interaction induced by mining. These may finally collapse into the opening if they are not
sufficiently supported by some means (Peng, 1984).
To maintain the stability of an underground opening, it is essential to keep the immediate roof-
softening zone stable (Figure 9—9). Roof bolts in this zone force all the bolted layers to sag with
the same magnitude; the layers within the bolting range therefore act like a solid beam. Building
such a beam is the ultimate goal of roof bolting where the beam building effect is the desired
design mechanism.

175
Active roof softening zone
Pillar Pillar
Measured to be maximum 2.5 mBolted zone
Active roof softening zone
Pillar Pillar
Measured to be maximum 2.5 mBolted zone
Figure 9—9 Zone of roof softening
As part of two SIMRAC projects -“COL 328: Review of current design methodologies to improve
the roof support systems, particularly in the face area, in collieries” and COL 609: “Safe mining
face advance and support installation practice in mechanical miner workings under different
geotechnical conditions” - the roof behaviour in roadways and intersections was investigated
with the use of sonic probe extensometers. A total of 54 intersection and roadway sites (situated
in significantly different geotechnical environments) were evaluated from depths of 32 m to
170 m. The height of roof softening in these sites was also calculated. (Figure 9—10).
A comparison between roadways and intersections indicated that, for a 40 per cent increase in
the span, taken across the diagonal of an intersection, relative to the roadway span, the
magnitude of the displacement in the roof increased by a factor of four. The results however,
showed no evidence of a substantial increase, in the height of beds separation or potential
unstable roof strata between intersections and roadways. This is different to the high horizontal
stress driven, beam buckling mechanism experienced in overseas coal mines. Therefore, it was
concluded that the magnitude of horizontal stresses is relatively low in South African collieries
compared to overseas collieries.
It was also found that the average height of roof softening measured in 54 sites in South African
collieries was 1.07 m, which is less than the roof bolt lengths commonly used in South Africa.
This indicates that, on average, almost all supported roofs will be stable in South Africa, if the
support is properly installed.

176
0
0.5
1
1.5
2
2.5
3
Stab
le r
oof e
leva
tions
(m)
RoadwaysIntersections
Total of 54 measurements
Figure 9—10 Measured height of roof softening in intersections and roadways in
South African collieries
9.6 Support system stiffness
As described earlier, stiffness is a measure of how quickly a support develops its load-carrying
capacity in response to dilation or bed separation in the roof strata. Stiffness is expressed in
terms of cross-sectional area and material modulus and the length of the support in
Equation [2-30].
One of the most important considerations in support system design is the required stiffness of
the support system. To achieve the required system stiffness it is necessary to know the
stiffness of individual units.
The magnitude of roof deformation in South African collieries has been found to be relatively
low compared with that of other major coal-producing countries, such as Australia, UK and USA
(Canbulat and Jack, 1998). However, the critical deformations before failure are also relatively
low. Anglo Coal Rock Engineering Department measured a maximum of 5.0 mm of roof skin
displacement at a site at one particular colliery (Minney, 1998) prior to roof failure, which
compares well with the roof measurements taken from many collieries and geotechnical
environments in South Africa. Unfortunately, this is the only critical-roof deformation
measurement taken successfully in South African collieries. Although this finding may be

177
specific to geology, it is prudent to utilize this data in determining the required support system
stiffness.
The basic principle of support stiffness is shown in Figure 9—11, using four different bolts with
two different stiffnesses: Bolt 1 and Bolt 4 had the same stiffness, and Bolt 2 and Bolt 3 had the
same stiffness, which was lower than that of bolts 1 and 4:
• Bolt 1: Non-tensioned, high stiffness;
• Bolt 2: Pre-tensioned, less stiff than Bolt 1;
• Bolt 3: Non-tensioned, same stiffness as Bolt 2; and
• Bolt 4: Late-installed support, therefore creep took place in the roof, same stiffness as
Bolt 1.
Roof deformation
Load
Roof softening
Bolt
load
s
Point of load transfer(roof load to bolt load)
Maximum roof & bolt load carrying capacity
Point of roof failure
Bolt stiffness
Bolt 1
Bolt 2
Bolt 3
Bolt 4
Effe
ct o
f pre
tens
ioni
ng
Effect of creep Roof deformation
Load
Roof softening
Bolt
load
s
Point of load transfer(roof load to bolt load)
Maximum roof & bolt load carrying capacity
Point of roof failure
Bolt stiffness
Bolt 1
Bolt 2
Bolt 3
Bolt 4
Effe
ct o
f pre
tens
ioni
ng
Effect of creep
Figure 9—11 Roof and bolt stiffness
178
Figure 9.11 indicates that:
• When the roof deforms, the bolts starts taking load;
• At the point where the bolt and the roof deformation lines meet, the bolt begins to
increase the stiffness of the system and thus inhibits further roof deflection;
• Pre-tensioning is not required as long as the support system is stiff enough (Bolt 1);
• Even the less stiff systems, which may not be suitable (Bolt 3), can be used as stiffer
systems with pre-tensioning (Bolt 2); and
• Support should be installed as early as possible to avoid the effect of creep in the rock
mass on support effectiveness (Bolt 4).
It should be noted that the roof experiences some creep in the period from mining to support
installation. Although this effect was measured to be insignificant (Canbulat and Jack, 1998),
this phenomenon is not fully understood. It is therefore suggested that the maximum allowable
deformation should be 2.5 mm in South African collieries (i.e. 50 per cent of critical deformation
measured by Minney (1998)). Although this assumption is based on one measurement, it could
be used until further measurements are available. It is also important for bolts not to reach peak
capacity when the deformations are at the critical levels. If the allowable deformation is set at
2.5 mm, then the required support stiffness can be calculated, from the slopes of the different
support lines shown in Figure 9—12. The results are given in Table 9—2:

179
0
10
20
30
40
50
60
70
80
90
100
110
120
130
140
150
160
0 0.5 1 1.5 2 2.5 3 3.5 4 4.5 5
Deformation (mm)
Load
(kN
)
Maximum allow ed deformation 2.5 mm
20 mm bolt
18 mm bolt
16 mm bolt
Assumed roof loading line
Pre-tensioned bolts
Non-tensioned bolts
Figure 9—12 Required stiffness for 20 mm, 18 mm, and 16 mm bolting systems
Table 9—2 Required support stiffnesses for different bolting types
Bolt type Required Support Stiffness for Non-tensioned bolts
(kN/mm) 20 mm 60
18 mm 50
16 mm 40
Note that the yielding loads of bolts are calculated according to a minimum steel strength of
480 MPa.

180
10 Quality control procedures
It is estimated that approximately 5 million roof bolts are installed annually in South African
collieries. Although there are systems available to test the integrity of installed bolts, it is
important to ensure that the roof bolts are installed in the best way possible.
There are several factors contributing to the under-performance of roof bolts. These factors
should be regularly controlled by systematic quality control procedures.
The factors that can affect the performance of a roof bolt support system can be classified as:
• Direct controllables; and
• Indirect controllables.
The indirect controls are related to suppliers’ quality control procedures, such as metallurgical
properties of roof bolts, deformation pattern of roof bolts, and chemicals used in the
manufacturing process of resin capsules and the consistency of these properties. It is
suggested that mining houses should request to examine their suppliers’ quality control
procedures. It is also suggested that these quality control procedures should comply with ISO
standards and that an independent auditor should regularly check for compliance.
The direct controllables can also be divided into three distinct groups (Table 10—1):
• Support elements;
• Compliance with the design; and
• Quality of installation.
As part of this project, currently available quality control procedures established by Anglo Coal
and Ingwe have been reviewed. These rating systems are the basis of the quality control
procedures presented here. However, it should be noted that a SIMRAC research project on
quality control guidelines is currently under way.

181
Table 10—1 A list of direct controllables
Support elements Roof bolts
Strength of roof bolts Correct length Correct diameter Corrosion Straightness
Resin Strength Storage Type
Borehole Diameter and annulus Straightness Location and inclination Length Roughness
Roofbolters Torque Thrust Speed
Accessories Washer strength Washer size Nut strength Threat type
Compliance with the design Spacing Using correct bolt Using correct resin Correct hole size Correct drill bit Correct adjustment of roof bolters
Installation Correct installation cycle Correct spinning-holding times Correct insertion of resin Correct drilling Correct bit size Correct rod length and hole lengthCorrect flushing
Correct roof bolt pattern Correct time-to-installation Correct resin storage

182
10.1 Support elements ROOF BOLTS
1 Length General Roof bolt assemblies are to be supplied in standard lengths (see
table below) with the provision available for the supply of non-
standard lengths at the request of the client. The tolerance on roof
bolt length shall be -5 mm +15 mm.
Diameter tolerance The maximum tolerance on roof bolt diameters should be within
0.235 mm.
Rib height Should meet the SEPT requirement.
Rib thickness Should meet the SEPT requirement.
2 Profile
Rib distance Should meet the SEPT requirement.
3 Straightness General Deviation form straight must be within 0.4% of the length of the
supplied bolt.
4 Finish General The roof bolt must be free of any grease and defects such as burrs,
sharp edged seams, laps or irregular surfaces that may affect its
serviceability.
5 Colour coding General Colour coding; the base of the threaded portion or forged head
(proximal end) of every roof bolt supplied must be colour coded
according to the following table:
Nominal roof bolt length (m) - Colour coding:
0.6 - Orange
0.9 - Yellow
1.2 - Blue
1.5 - White
1.8 - Green
2.1 - Pink
2.4 – Red
6 End of bolt General The non-threaded end of the rockbolt must be free of burrs and
edges that protrude beyond the roof bolt profile. Depending on the
requirement of the mine: the non-threaded end of the rockbolt must
be formed square by cropping; the threaded end of the roof bolt
must be acceptably square to the longitudinal axis of the shank; and
must be cropped at the distal end at 45º.
Threaded section General The threads are to be roll-formed for 120 mm on the bar and when
gauged, must be parallel throughout its length. The basic profile of
the thread shall conform to the relevant dimensions specified in DIN
405 Part 1: Knuckle Threads.
7
Run-out General In the thread run-out bolt systems, the thread run-out must not
exceed three pitches.
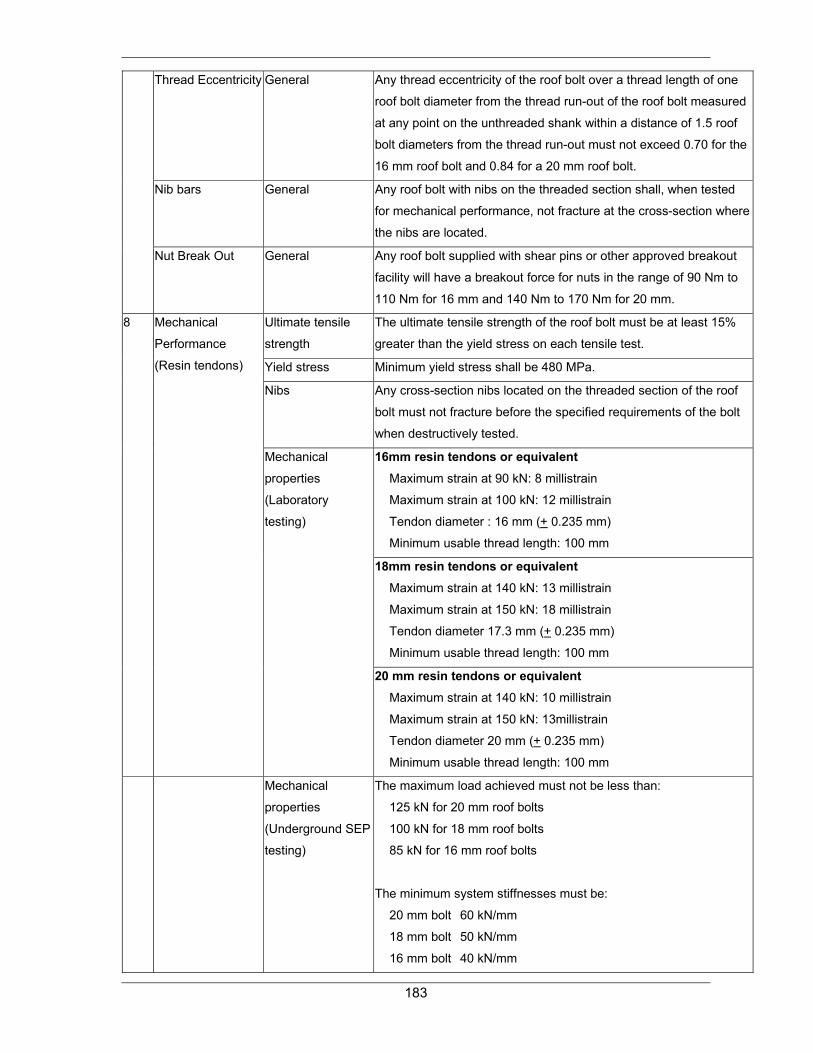
183
Thread Eccentricity General Any thread eccentricity of the roof bolt over a thread length of one
roof bolt diameter from the thread run-out of the roof bolt measured
at any point on the unthreaded shank within a distance of 1.5 roof
bolt diameters from the thread run-out must not exceed 0.70 for the
16 mm roof bolt and 0.84 for a 20 mm roof bolt.
Nib bars General Any roof bolt with nibs on the threaded section shall, when tested
for mechanical performance, not fracture at the cross-section where
the nibs are located.
Nut Break Out General Any roof bolt supplied with shear pins or other approved breakout
facility will have a breakout force for nuts in the range of 90 Nm to
110 Nm for 16 mm and 140 Nm to 170 Nm for 20 mm.
Ultimate tensile
strength
The ultimate tensile strength of the roof bolt must be at least 15%
greater than the yield stress on each tensile test.
Yield stress Minimum yield stress shall be 480 MPa.
Nibs Any cross-section nibs located on the threaded section of the roof
bolt must not fracture before the specified requirements of the bolt
when destructively tested.
16mm resin tendons or equivalent Maximum strain at 90 kN: 8 millistrain
Maximum strain at 100 kN: 12 millistrain
Tendon diameter : 16 mm (+ 0.235 mm)
Minimum usable thread length: 100 mm
18mm resin tendons or equivalent Maximum strain at 140 kN: 13 millistrain
Maximum strain at 150 kN: 18 millistrain
Tendon diameter 17.3 mm (+ 0.235 mm)
Minimum usable thread length: 100 mm
8 Mechanical
Performance
(Resin tendons)
Mechanical
properties
(Laboratory
testing)
20 mm resin tendons or equivalent Maximum strain at 140 kN: 10 millistrain
Maximum strain at 150 kN: 13millistrain
Tendon diameter 20 mm (+ 0.235 mm)
Minimum usable thread length: 100 mm
Mechanical
properties
(Underground SEP
testing)
The maximum load achieved must not be less than:
125 kN for 20 mm roof bolts
100 kN for 18 mm roof bolts
85 kN for 16 mm roof bolts
The minimum system stiffnesses must be:
20 mm bolt 60 kN/mm
18 mm bolt 50 kN/mm
16 mm bolt 40 kN/mm

184
Performance during underground testing
Minimum pull-out load
Units must achieve 70 kN of pull-out load.
Underground
testing
Maximum deformation must not exceed 1.2 times the average
deformation attained by the control installations.
Maximum
deformation
Mechanically anchored roof bolts should be provided by Rock
Engineering in control installations.
Control installation Rockbolts and studs shall comply with the following specifications:
They must have Bail-type or Regular shells, and be equipped with
crimp nuts failing at torque equivalent to a pre-tension of 20 kN to
40 kN or Bail-type shells with forged head.
9 Mechanical
Performance
(Mechanical bolts)
Specifications
Maximum strain at 70 kN: 4 millistrain
Maximum strain at 80 kN: 5 millistrain
Minimum tendon diameter: 14.5 mm
Minimum usable thread length: 100 mm
General Washers must be manufactured from steel and must be a minimum
of 120 mm x 120 mm square.
Surfaces All surfaces must be free of burrs and sharp edges
Holes Holes in the dog-eared portion of washers must not be closer then
3 mm to the edge of the washer.
Shape Washer plates must be square or round type (deformed or ribbed
and with or without dog-ears).
For use with 18 mm tendons:
Washers for use with 18mm tendons must meet the following
specifications:
• Maximum displacement at 140 kN: 13 mm
• Maximum displacement at 150 kN: 18 mm
For use with 20 mm tendons: Washers for use with 20 mm tendons must meet the following
specifications:
• Maximum displacement at 140 kN: 10 mm
• Maximum displacement at 150 kN: 13 mm
For use with all other tendons
10 Washers
Specifications
Washers for use with all other tendons must meet the following
specifications:
Maximum displacement at 90 kN: 8 mm
Maximum displacement at 100 kN: 12 mm
11 Nuts General Nuts must be of hexagon steel. The dimensions across the flats
shall be 24 mm for a 16 mm roof bolt and 32 mm for a 20 mm roof
bolt.

185
Processing All nuts are to be cold forged from steel and should be heat treated
to provide the required mechanical properties.
Compliance Nuts must comply with the relevant requirements for eccentricity
and tilt as in SABS 135.
Compliance The threads must conform to DIN 405: Part 1 as applicable to nut
size.
Manufacturing
process
All nuts must be manufactured from a higher grade steel than the
tendon and washer, the steel grade to be a minimum of grade 6.
When tested, all nuts must achieve a surface hardness of Vickers
220 to 302HV.
When tested to destruction in the laboratory the nut must not fail in
any way before the ultimate strength of the tendon is exceeded. The
Rock Engineering Department may from time to time call for
destructive testing as it sees fit. For routine quality control tests,
nuts used with the following tendons must not fail at the following
minimum loads:
a) Smooth bar (mechanical anchors): 85 kN
b) 16mm tendons 110 kN
Performance
c) 18mm and 20 mm tendons 170 kN
Load indicators One in each ten bolts shall be supplied with a device capable of
visually indicating that an installation has been adequately pre-
tensioned. During static laboratory testing (not spun or torqued) the
indicators must fail at a load of between 45 kN and 55 kN (4.5 to 5.5
tonnes).
Nut break out The nut break out facility must operate at the torque range values
detailed below:
• Bolt Length 0. 9m, 1.2 m - 70 Nm to 90 Nm
Bolt Length 1.5 m, 1.8 m, 2.1 m - 110 Nm to 140 Nm
12 Drill bits General Only the following (nominal) size drill bits may be supplied to mine
for the purpose of drilling holes to install ground support material:
For resin tendon applications:
• For 16 mm and 18 mm roof bolts: 22 mm
• For 20 mm roof bolts: 23.5 mm
For cable anchor applications: 36mm
For mechanically anchored roof bolts: 36 or 38mm
All drill bits (borers) must be manufactured with a tolerance of -
0/+0.25 mm.
13 Roofbolters Torque The torque on the roofbolter must be between 220 kN to 250 kN.
Thrust The thrust on the roofbolter must be between 12 kN to 18 kN.

186
Speed The speed of the roofbolter must be 350 rpm to 550 rpm.
RESIN
Capsule All resin must be supplied in capsule form.
Compliance All resin capsules used must conform to SABS 1534:2002.
1 General
Information
required
The following information must be shown clearly on each box of
resin:
a) Capsule dimensions
b) Expiry date
c) Batch number
d) Spin and hold times
2 Capsule Size Tolerance Capsules must be 19 mm ± 0.5 mm in diameter for use with 16 mm
bolts and 23 mm ± 0.5 mm in diameter for use with 20 mm bolts.
The tolerance on supplied length must be nominal ordered length
+10 /-5 mm when measured between the crimped ends.
3 Colour Coding Colour coding Resin types must be identified by a self-colour coding as given
below:
• Fast Set – Red
• Slow Set – Yellow
4 Shelf Life General All resins must retain their ability to conform to the performance
requirements of this specification and retain sufficient rigidity for
insertion with a capsule-loading tube for a minimum period of six
months when they are stored in accordance with the manufacturer’s
instructions.
General All packing must be capable of withstanding transportation, handling
and storage, and general handling associated with the mining
environment.
5 Packaging
Information
required
Each package must be identified with the manufacturer’s name,
type of resin, size of capsule, and quantity of capsules, and be of a
colour consistent with the resin-type colour code specified above.

187
Information display The following additional information must be displayed on all
packages in a position that is visible when the packages are
stacked:
a. Capsule dimensions
b. Expiry date
c. Batch number
d. Nominal mixing and holding time
e. Shelf life and storage instructions
f. Date of manufacture
g. Batch and time reference
h. Manufacturer’s identification
i. The symbols, risk and safety phrases as required under the
Safety Regulations
j. Remedial measures in the event misuse/accident
k. Installation procedure taking into account applicable
regulations.
6 Gel and Setting
Time
General Gel setting times for different spinning speeds and temperatures
should be clearly indicated on the box.
7 Bond Strength and
System Stiffness
Performance When tested in SEPT, the minimum bond strength between roof
bolt and resin must be 95 kN for 16 mm bar, 120 kN for 18 mm bar
and 140 kN for 20 mm bar. The minimum system stiffness must be
60 kN/mm measured between loads of 40 kN and 80 kN, based on
underground pull tests.
8 Uniaxial
Compressive
Strength (UCS)
Performance The UCS of the resin must be greater than 60Mpa when it is
measured at least 24 hours after preparation of the test specimens.
The number of tests should be determined from the methodology
described in this report.
9 Elastic Modulus Performance The elastic modulus of the resin must not be less than 10GPa when
it is measured 24 hours after preparation of the test specimens. The
required number of tests should be determined from the
methodology described in this report.
10 Creep Performance The creep of the resin must be no more than 0.12% when it is
measured 24 hours after preparation of the test specimens. The
required number of tests should be determined from the
methodology described in Section 10.4.
11 Shear strength Performance Must meet the SEPT requirements.
The maximum load achieved must not be less than:
125 kN for 20 mm roof bolts
100 kN for 18 mm roof bolts
85 kN for 16 mm roof bolts

188
The minimum system stiffnesses must be:
20 mm for bolt 60 kN/mm
18 mm for bolt 50 kN/mm
16 mm for bolt 40 kN/mm
ROUTINE TESTS
Mechanical
properties
The number of tests should be determined as described in Section
10.4 using the methodologies described in Sections 3.1 and 3.2.
Length As a routine test, one roof bolt in every 200 produced must be
checked for length using a measuring tape.
Diameter As a routine test, one roof bolt in every 200 produced must be
checked for diameter using a Vernier.
Straightness As a routine test, one roof bolt in every 200 produced must be
checked for straightness using an appropriate gauge.
Rib height As a routine test, one roof bolt in every 200 produced must be
checked for rib height using a Vernier.
Washer The number of tests should be determined as described in Section
10.4.
Thread As a routine test, one roof bolt in every 200 produced must be
checked for thread.
1 Roof bolts
Nuts As described in Section 10.4.
Length As a routine test, one resin in every 10 boxes produced must be
checked for length using a Vernier.
Diameter As a routine test, one resin in every 10 boxes produced must be
checked for diameter using a measuring tape.
2 Resin
Mechanical
properties
The number of tests should be determined as described in Section
10.4 using the methodologies described in Sections 3.1 and 3.2.
3 Short encapsulated
pull testing
Underground As described in Section 3.1.
3 Laboratory testing Laboratory As described in Section 3.2.
4 Roofbolters Torque, thrust and
speed
As a routine test, roofbolter’s torque, thrust and speed must be
checked once every month.
10.2 Compliance with the design
Compliance with the design should be checked underground at least once every fourth week.
The following parameters should be measured and recorded:
• Spacing of roof bolts using a simple measuring tape;

189
• The use of correct bolt type;
• The use of correct resin type;
• Correct hole size using a borehole micrometer;
• The use of the correct drill bit; and
• Correct adjustment of torque, thrust and speed of roofbolters using a torque wrench, load
cell and tachometer, respectively.
10.3 Installation
Underground support installation is one of the most important aspects of support performance.
The following parameters should be measured and recorded every fourth week using the
appropriate instruments, where necessary:
• Correct installation cycle;
• Correct spinning-holding times;
• Correct insertion of resin;
• Correct drilling;
• Correct bit size;
• Correct rod length and hole length;
• Correct flushing;
• Correct roof bolt pattern;
• Correct time-to-installation; and
• Correct resin storage.
10.4 Number of tests required
In conjunction with this project on roof support, another SIMRAC project (SIM 040205, Malan et
al, 2005) also investigated quality assurance procedures for support products. The approach
regarding sample size given below was developed for the SIM 040205 project, but is repeated
in this report for the sake of completeness.
The number of samples selected for testing determines the confidence levels that can be
derived, and therefore the larger the sample size the better. However, since destructive testing
of mine support units is expensive it is important to obtain a balance between confidence levels
(and acceptable risk levels) and testing costs. Furthermore, there is an optimal sample size
beyond which taking more samples does not significantly improve the confidence level. If the

190
sample size is small, which is typically the case for support testing, a normal distribution cannot
be used to obtain these confidence levels. In cases where:
• The sample size is less than 30 (typical for testing of support units);
• The population mean is unknown (typical for support products);
• There is no reason to believe that the population follows a normal distribution; and
• A confidence interval for the population mean can be constructed using the t-distribution.
The number of additional samples (or tests in the case of destructive testing) to achieve a
required level of confidence can be obtained using the following arguments:
The following important criterion is assumed in these calculations:
Criterion 1: The estimate for the mean performance of the support unit must be determined
such that the 95 % confidence interval for the mean is less than ± 5 % of the mean value.
Figure 10—1 below illustrates the t-distribution for the sample, the sample mean, X , and the
margin of error, E. For a 95 % confidence interval, it implies that a 95 % chance exists that the
sampling error (difference between the sample mean and the population mean) is less than the
margin of error.
XE− E
95 %
Figure 10—1 T-distribution showing the margin of error
The margin of error E for the t-distribution is given as:
nst
E / ⋅= 2α [10-1]
where
2/tα = critical value of t (value read from the t-distribution tables)

191
s = sample standard deviation
n = sample size
From Figure 10—1, the width of the 95% confidence interval is given by 2E. From equation
[10-1] it follows that this width is therefore n
st / ⋅22 α . On the basis of criterion 1 given above, it
follows that at the extreme:
nst
X. / ⋅= 22
10 α [10-2]
Through manipulation it follows that: 2
2
102
⋅
=X.
stn /α [10-3]
The minimum number of tests required to meet criterion 1 is given by equation 1 above and will
be referred to as reqn . Assume an initial number of samples initn are tested with:
reqinit nn < [10-4]
Therefore an additional number of samples addn need to be tested so that
addinitreq nnn += [10-5]
When inserting [10-3], it follows that
init/
add nX.
stn −
⋅
=2
2
102 α [10-6]
which can also be written as:
initinit
/
initadd nX.
nst
nn −
⋅
=
2
2
10
12 α
[10-7]
The number of additional samples required to obtain a specific confidence level is therefore a
function of the initial sample size, the variability in the results, the confidence levels required,
and a criterion for acceptable testing. Note that from this analysis the test quantity is not
determined by the total number of units supplied to the mine.
Figure 10—2 shows the number of extra tests required, assuming that the standard deviation of
the test results are either 10, 15 or 20 per cent of the mean value and the required confidence
level is 90 per cent. The results show that, regardless of the variability, testing fewer than five

192
samples initially will lead to a considerable number of additional tests. Large variability in the
initial results will naturally lead to a larger number of additional tests.
Figure 10—3 shows the effect of two different required confidence levels on the extra tests
required, assuming the standard deviation divided by the mean of the test results is 15 per cent
and the same acceptance criterion is used. The results show that approximately twice as many
extra tests will be required to achieve a 95 per cent confidence level relative to a 90 per cent
level.
For the laboratory tests on tendons, it is proposed that the initial number of tests should be 10,
on the bases of the arguments set out above. If the standard deviation and the mean of the
samples are calculated, Equation [10-7] will give an indication of whether additional tests are
required. If Equation [10-7] gives a negative number, the initial sample size of 10 will be
adequate.
EXTRA TESTS REQUIRED(90% Confidence Level)
010
20304050
607080
90100
0 5 10 15 20 25 30 35 40INITIAL NUMBER OF TESTS
EXTR
A TE
STS
RE
QUI
RED SD/MEAN=10%
= 15% = 20%
Figure 10—2 Extra tests required for a confidence level of 90 per cent

193
EXTRA TESTS REQUIRED(SD/MEAN=15%)
01020
3040506070
8090
100
0 5 10 15 20 25 30 35 40INITIAL NUMBER OF TESTS
EXT
RA T
ESTS
REQ
UIRE
D 90%95%
Figure 10—3 Extra tests required for confidence levels of 90 and 95 per cent
194
11 Conclusions and recommendations
There are five important components of a bolting system. These are:
1. Resin
2. Bolt
3. Hole
4. Machinery, equipment, and
5. Rock type
All five of these components are equally important, as any failure in any of these components
will result in an inadequate support system. Therefore, as part of this study, all-important
parameters in these five components were investigated. The important parameters of these five
components are given below:
Literature review A comprehensive literature review showed that since the introduction of mechanical bolts in
1940s, there has been a significant amount of research into the understanding of the behaviour
of roof bolts. Today, almost all coal mine roofs are supported by the use of roof bolts in South
Africa.
In the early years, the design of roof bolt patterns was based on local experience and the
judgement of mining personnel. The suspension mechanism was the most easily understood
and most widely used roof bolting mechanism. However, significant advances have been made
over the last 20 years in the development of resin anchors, tendon elements and installation
hardware. These advances have resulted in the increased use of full column resin bolts.
The design of roof bolt patterns has been improved, and four main rock reinforcement
techniques have been developed: simple skin control, beam building, suspension, and keying.
The geology and the stress levels determine the mechanism required for a particular
application.
Investigations into the causes of roof falls in South African collieries have highlighted that, whilst
roof conditions are comparatively better in South Africa, roof bolt densities are relatively low
compared to those of the USA, the UK and Australia. The main cause of falls of ground was
found to be excessive bolt spacing causing skin failures between the bolts.

195
The importance of tensioning roof bolts remains a subject of controversy. The critical roof
deformations in South African collieries are relatively small. Therefore, tensioned roof bolts are
probably required to allow less roof deformations to take place after the installation of support.
However, if the bolting system is stiff enough, tensioning is not a requirement. It was also found
that tensioning bolts in short encapsulation pull tests reduces stiffness and bond strength.
However this may be the result of the test method, and further research is required for
understanding this phenomenon.
Numerical models are useful in understanding roof and roof bolt behaviour, however, extensive
laboratory studies are required to determine the input parameters. The Australian technique,
subsequently adopted in the UK, has proven that numerical modelling can be used to back
analyse the underground conditions. Once the model is calibrated, the results obtained from the
numerical models can be used for design.
The selection of roof bolt type for different geological environments is well documented.
However, the changing conditions underground must be determined and the design of the
support system must be modified accordingly. Therefore, widespread instrumentation and
thorough visual observations are important to ensure safety and roof stability in coal mines.
While the effect of roof bolt diameter on support performance is well understood, there is still
controversy over the length of the roof bolts. Since skin failures (< 0.5 m thick) are more
common in South Africa (Canbulat and Jack, 1998, van der Merwe and Madden, 2002) than
larger roof falls, short roof bolts for skin control may be an effective support system.
In conclusion, despite the fact that roof bolting has been the most researched aspect of coal
mining, falls of ground still remain the major cause of fatalities in South Africa. There is no
commonly accepted design approach for underground coal mines. Roof bolts were found to
behave differently under different loading conditions, even though they were tested in fully
controlled environments in the laboratories. The way forward for the design of roof support
systems is a better understanding of roof behaviour in different geotechnical environments
through continuous in situ monitoring.
Specifications of roofbolters A detailed investigation into the specifications of roofbolters that are currently being used
indicated that the quality of installation of a support system is directly related to the performance
of the equipment that is used to install the bolts. The performance of bolting equipment was
therefore investigated as part of this study so that the relative importance of the various

196
machine parameters could be ascertained as well as the range in values of these parameters
provided by the equipment used in South African collieries.
The study showed that there are no standards in South Africa for those parameters investigated
as part of the study (speeds, torque and thrust). The variations in these parameters are also
greater than previously believed.
The relationship between the hole profile and the roofbolter parameters was investigated. The
following parameters are recommended for roofbolters to achieve rough holes in South African
coal mines:
Spinning speed 450 rpm
Torque 240 Nm
Thrust 15 kN
An investigation into the effect of wet or dry drilling showed wet drilling resulted in significantly
greater system stiffnesses and slightly greater bond strengths.
A series of short encapsulated pull tests indicated that, on average, bond strengths obtained in
shale using the roofbolter supplied by Manufacturer “C” were approximately 18 per cent and 28
per cent greater than those supplied by Manufacturer “A” and “B” respectively. Roofbolts
installed using machines from both Manufacturers “A” and “B” achieved bond strengths that
were within acceptable limits.
Performance of roof bolts that are currently used in South Africa In a support system it may not be possible to control the hole diameter, because of a
combination of many factors, such as the rock strength, bit type, wet or dry drilling, and thrust of
roofbolter etc. However, it is possible to control the bolt diameter and profile. For this reason an
investigation was conducted into the variations in the geometry of the roof bolts that are
currently being used in South Africa. This investigation measured the bolt-core diameters and
rib diameters from different South African bolt manufacturers.
A total of 235 roof bolts from three different manufacturers were evaluated (approximately 80
roof bolts from each manufacturer). The results showed that the diameters of roof bolts from
Manufacturers “A” and “C” are more consistent, having a narrower range than those from
Manufacturer “B”. In addition, there was a significant variation in the rib-heights of the roof bolts
from the Manufacturer “B”. The average rib-height of roof bolts from Manufacturer “B” was also
approximately 34 per cent less than that of those supplied by the other two manufacturers.

197
The parameters that determine the contact strength between resin and bolt are rib thickness,
spacing between the ribs, and rib angle. An investigation was also conducted into these
dimensions of currently used roof bolts. The results showed that there are insignificant
differences between the parameters that determine the bolt profile in South African roof bolts.
The influence of these parameters on bolt performance was impossible to determine. It is
therefore recommended that a laboratory testing programme be carried out on specially
constructed or imported bolts that have different configurations, for the purpose of determining
the effect of these parameters on the performance of roof bolts.
It was also found that although there are small differences between the South African roof bolts,
there is a significant visual difference between the UK’s AT bolt and South African bolts. The
angles of ribs between the two types of bolt are significantly different. For this reason the effect
of angle of ribs was investigated. The results of a literature search showed that as the rib angle
increases, the pull-out load of a bolt decreases. It is therefore suggested that in order to achieve
relatively high pull-out loads, low rib angles on the bolts are required. This was confirmed by
laboratory tests on different bolts with different rib angles in Australia (O’Brien, 2003). However,
lowering the rib angle may result in poor resin mixing performances. It is therefore
recommended that further work on the effect of bolt profile on rockbolt performance and quality
of resin mixing should be conducted in a controlled laboratory environment.
A conceptual model was also developed to determine the effect of bolt profiles. This model
indicated that the maximum pull-out loads can be achieved between the resin and roof bolt
when:
• The ribs are relatively high;
• The distance between the ribs is relatively low; and
• The ribs are relatively thick.
An attempt to determine the effect of spinning parameters on resin characteristics showed that
as the free rotation speed increases the gelling time decreases. It is therefore suggested that
the resin spinning times should be adjusted, with the aim of increasing the performance of the
resin.
A series of short encapsulated pull tests (SEPT) indicated, that in the majority of pull tests,
failure took place at the rock-resin interface, indicating that the rock failed before the resin shear
strength had been reached. It is therefore suggested that the strength of resin currently being
used in South Africa is adequate. However, stiffness of the system of which resin is a part
should be determined by SEPT.

198
The conceptual model developed as part of this project was used to determine the effect of
resin in the support system. It is concluded that the failure characteristics of a roof bolting
system will be determined by the shear strength of bolt, resin and the rock.
• The failure will take place at the resin-rock interface when the shear strength of the rock
is lower than the resin (rock will fail).
• The failure will take place at either the resin-rock or resin-bolt interface when the resin
shear strength is the lowest in the system.
• When the resin shear strength is the lowest in the system, the failure will be determined
by the roughness of the hole and the bolt profile.
The results from testing showed that the reinforcing system using bolts from all four
manufacturers performed almost identically in sandstone, but somewhat differently in the other
rock types. The bolts from Manufacturer “A” performed slightly better in coal and shale rock
types compared to those from the other manufacturers, but all manufacturers tested were still
within acceptable limits.
Performances of resins that are currently used in South African collieries The performance of resins that are currently being used in South African collieries was also
investigated by means of short encapsulated pull tests. The results indicated that in sandstone
the resin types from the two different manufacturers performed similarly. However, the strength
of slow (5/10-minute) resins from both manufacturers was low compared to that of the fast
resins. The results also indicated that 15-second and 30-second resins from Manufacturer “A”
achieved higher stiffnesses than those from Manufacturer “B” in sandstone and coal. In shale,
both resins from each of the manufacturers performed in a similar manner.
The effect of bit type, annulus and rock type Both the stiffnesses and the maximum loads obtained from the two-prong bits were greater than
those obtained from the spade bit. These findings suggested that two-prong bits are more
effective in collieries than spade bits.
The effect of hole annulus was also investigated. The results from these tests show that an
annulus between 2.8 mm and 4.5 mm resulted in the highest bond strengths. Another
interesting point is that as the annulus drops below 2 mm, it appears to have a negative effect
on the bond strength.

199
Short encapsulated pull test results also showed very distinct differences between bolt system
performance in different rock types and that sandstone produces significantly better results than
shale and coal do. From these results it can be concluded that rock type is one of the primary
factors influencing support system performance.
The effect of wet and dry drilling The difference in bond strengths achieved by wet or dry drilling is negligible. However, the
overall support stiffnesses are significantly greater for wet drilling than for dry drilling in all three
resin types.
Tensioned versus non-tensioned As discussed in the literature review tensioned versus non-tensioned bolts is one of the most
discussed topics in roof bolting. A number of papers have been published on this topic in
Australia and the USA. An additional 25 short encapsulated pull tests were conducted to
determine the effect of tensioning on bond strength. The results showed that:
• Non-tensioned roof bolts achieved significantly greater bond strengths than the tensioned
bolts in sandstone and shale roofs; and
• The overall support stiffness of non-tensioned roof bolts was significantly greater than
that of the tensioned roof bolts.
It is thought that in tensioned bolts, because the bond length is only 250 mm, the bonding could
easily be damaged when the bolt is being tensioned and therefore may have produced sub-
standard results. It is therefore suggested that a new testing procedure should be developed for
effectively testing the performance of tensioned bolts.
The development of a new support system design methodology The methodology is based on the concept of stabilising the roof-softening zone. Roof bolts in
this zone result in the bolted layers sagging together. The layers within the bolting range thus
act like a solid beam. Forming such a beam is the ultimate goal of roof bolting where beam
building is the required mechanism of stabilisation.
In other SIMRAC projects, a total of 54 intersection and roadway sites were evaluated from
mining depths of 32 m to 170 m, situated in significantly different geotechnical environments.
The heights of roof softening at these sites were calculated. The results showed that for a 40
per cent increase in the span, taken across the diagonal of an intersection relative to the
roadway span, the magnitude of the displacement in the roof increased by a factor of four. The
results showed no evidence of a substantial increase in the height of the bed separation in

200
intersections and roadways. It was also found that the average height of roof softening
measured in 54 sites in South African collieries was 1.07 m, which is less than the length of roof
bolt commonly used in South Africa. The new design methodology and results set out above
indicated that, on average, almost all supported roofs will be stable in South Africa, if the
support is properly installed.
Support system stiffness has been found to be one of the most important parameters in the
design and performance of a support system. In order to achieve the maximum performance of
support systems, the following support system stiffnesses are recommended for different size
bolts.
Bolt diameter
Required Support Stiffness for Non-tensioned bolts
(kN/mm) 20 mm 60
18 mm 50
16 mm 40
It is recommended that an extensive study into the shear strength of full-column resin bolts be
carried out.
Quality control procedures of support systems There are several factors contributing to the underperformance of roof bolts. These factors
should be regularly controlled by systematic quality control procedures in order that the risk of
failure can be reduced.
The factors that can affect the performance of roof bolt support system can be classified as:
• Direct controllables; and
• Indirect controllables
The direct controllables are divided into three distinct groups.
• Compliance with the design;
• Support elements; and
• Quality of installation.
A list of quality control procedures for all of the above is given in the main text. A procedure
developed as part of SIM 040205 for determining the required number of tests for support
elements is also included.

201
Concluding remarks As a final step in this project, a total of five presentations were given to rock engineering
practitioners and suppliers.
It is recommended that, in order to achieve the best support system in different environments,
further research be undertaken in the following areas:
• Develop a series of quick-and-easy testing procedures to determine the performance of
support elements;
• Improve the quality of installation of roof support; and
• Evaluate newly developed resin-testing procedures.
Discussion with coal rock engineering personnel highlighted that a new series of testing
procedures should be identified to determine the performance of support elements, such as the
bolt, resin, nut, or washer. It is therefore recommended that testing procedures be developed to
assist the coal mining industry in conducting such tests quickly and efficiently.
One other important factor that affects the performance of a support system is the quality of
support installation. Investigation into the quality of support installation was not a part of the
current project. New support installation techniques such as the “spin-to-stall system” helped
collieries to improve the support installation practice. While the spin-to-stall system provides a
simpler underground procedure, it is significantly more demanding on components of the roof
bolting system. The resin must provide sufficient time for adequate mixing and roof bolt
insertion, then transform very rapidly from a fluid to a set state and develop high bond strength.
The properties of the resin, the properties of the roof bolt, the breakout torque of the nut and
other parameters are important in developing and optimising this new system (O’Connor et al.,
2002). An improved installation technique to minimise the human error in the installation of
support and ensure all components of the bolting system are compatible is therefore required to
ensure the correct installation of support to improve the safety of the underground workforce.
Resin is probably the most vulnerable part of a bolting system. Many investigations around the
world found that larger bolt-holes can result in poor resin mixing, a greater likelihood of "finger-
gloving", and reduced load-transfer capability. On the other hand, smaller holes can result in
significant temperature rises during the mixing in the hole, which may accelerate the resin
setting, causing gellation before the determined setting time. The current project, SIM 020205,

202
suggested the use of SABS testing facilities in mine quality control testing procedures. However,
it has been found that resin that passes the SABS tests may fail in underground short
encapsulation pull tests. Also, new resin-testing facilities have been built by Anglo Coal and
Minova in South Africa recently. Therefore, it is suggested that an evaluation of these facilities
and procedures should be conducted for the development of a new resin quality control
technique that will ensure the expected support performance.
As part of this work it is recommended that the rib geometry of rebars be investigated so that
the interaction between bolt and resin can be optimised and at the same time thorough mixing
of the resin can be ensured.
The influence that the values recommended for roofbolters in terms of thrust, rotation speed,
and torque, have on productivity and drilling rates needs to be evaluated.
The appropriateness of using SEPT to evaluate the effect of pre-tensioning on bolt performance
needs to be thoroughly investigated and a new test procedure developed if necessary.

203
12 References
Altounyan P.F.R., Bigby D.N., Hurt K.G. and Peake H.V. (1997). Instrumentation and
procedures for routine monitoring of reinforced mine roadways to prevent falIs of ground. In:
Dhar BB, Bhowmick BC. eds. Proceedings of the 27th International Conference of Safety in
Mines Research Institutes. Vol. 2. New Delhi, India, pp. 759-766.
Altounyan P.F.R. and Taljaard, D. (2001). Developments in controlling the roof in South African
coal mines – a smarter approach. The Journal of The South African Institute of Mining and
Metallurgy, January/February, pp.33-40.
American Society for Testing and Materials. Standard test method for rockbolt anchor pull test,
Standard D4435-04.
American Society for Testing and Materials. Standard specification for roof and rockbolts and
accessories, Standard F432-04.
American Society for Testing and Materials. Standard test method for rockbolt long-term load
retention, Standard D4436-04.
Aziz N. and Webb B. (2003). Study of load transfer capacity of bolts using the short
encapsulation push test, Proceedings of the 22nd International Conference on Ground Control
in Mining, Morgantown, WV, USA.
Barton, N., Lien, R. and Lunde, J. (1974). Engineering classification of rock masses for the
design of tunnel support. Rock Mechanics 6, 189-236.
Bieniawski, Z. T. (1987). Strata control in mineral engineering, John Wiley and Sons. pp. 29-37.
Bieniawski, Z.T. (1973). Engineering classification of jointed rock masses. The Civil Engineer in
South Africa, December.
Bigby O.N. (1997). Developments in British rockbolting technology. Coal International,
Rockbolting Technology, May, pp. 111-114.
Biron, C. and Arioglu, E. (1985). Madenlerde tahkimat isleri ve tasarimi. Istanbul Technical
University. Birsen Kitabevi. Istanbul.

204
British Coal Operations Department (1994). Optimisation of cable bolting and rockbolting
material properties, Final Report to the Commission of the European Communities Directorate
General for Energy.
2. British Standards Institution (1996). Strata reinforcement support system components used in
coal mines. Part 1. Specification for rockbolting. British Standard BS7861: Part 1.
Buddery, P. (1989). Fundamental principles of roof bolting in South African Collieries. Advances
in rock mechanics in underground coal mining. SANGORM Symposium, September.
Buddery, P. S. and Oldroyd, D. C. (1992). Development of roof and floor classification
applicable to collieries. Eurock’92. Thomas Telford, London.
Campoli A.A., Mills P.A., Todd P. and Dever K. (1999). Resin annulus size effects on rebar bolt
pull strength and resin loss to fractured rock. In: Peng SS, Mark C. eds. Proceedings of the 18th
International Conference on Ground Control in Mining. Morgantown, WV: West Virginia
University, pp. 222-231.
Canbulat, I. (2004). An investigation into the roof and support behaviour in South African
collieries for the design of optimum support systems. PhD Thesis, University of Pretoria.
Canbulat, I. and van der Merwe, J.N. (2000). Safe mining face advance and support installation
practice in mechanical miner workings under different geotechnical conditions. SIMRAC Project
Final Report COL609. Report No. 2000-0154. April.
Canbulat, I. and Dlokweni, T. (2003) Roof rating systems being used in South Africa. ISRM
2003–Technology Roadmap for Rock Mechanics, South African Institute of Mining and
Metallurgy, pp 175-184. September.
Canbulat, I. and Jack, B.W. (1998). Review of current design methodologies to improve the
safety of roof support systems, particularly in the face area, in collieries. SIMRAC Final Project
Report, COL 328, December.
Canbulat, I. and van der Merwe, J.N., van Zyl, M., Wilkinson, A., Daehnke, A. and J. Ryder.
(2003). The development of techniques to predict and manage the impact of surface
subsidence. Final Project Report, COALTECH 2020, Task 6.9.1. January. 211 pp.

205
Canbulat, I., Wilkinson, A. and Prohaska, G.P. (2003). An investigation into the support systems
in South African collieries. Safety in Mines Research Advisory Committee (SIMRAC). Project
No: SIM020205. Quarterly report, June.
Coats, D.F. and Cochrane, T.S. (1971). Rockbolting, research and design specifications,
Canadian Mining Journal, March.
Deep Mines Coal Industry Advisory Committee (DMCIDC). (1996). Guidance on the use of
rockbolts to support roadways in coal mines. HSE Books, UK.
Deere, D.U. (1964). Technical description of cores for engineering purposes. Rock Mechanics
and Engineering Geology. Volume 1, Number 1, 17-22.
Dejean, M. and Raffoux, J.F. (1976). Role of rockbolting and parameters in its selection, Mining
drifts and tunnels: Tunnelling’76, London, Institute of Mining and Metallurgy. pp. 321-327.
Dunham, R.K. (1976). Anchorage tests on strain-gauged resin bonded bolts. Tunnels and
Tunnelling 8 (6), pp. 73-76.
Fabjanczyk, M. W., and Tarrant, G. C. (1992). Load transfer mechanisms in reinforcing tendons.
In: Aziz NI, Peng SS, eds. Proceedings of the 11th International Conference on Ground Control
in Mining. Wollongong, New South Wales, Australia: University of Wollongong, pp. 212-219.
Fairhurst, C. and Singh, B. (1974). Roof bolting in horizontally laminated rock. Eng Min J Feb:
80-90.
Franklin, J. and Woodfiled, P. (1971). Comparison of a polyester resin and a mechanical
rockbolt anchor. Transactions of the Institute of Mining and Metallurgy, (A)8-:91-A100.
Frith R. (1998). Strata engineering summary. Australian Coal Association Research Program
(ACARP) Technical Seminar Course Notes.
Frith, R. and Thomas, R. (1998). The pre-tensioning pedigree. Australia's Mining Monthly
Supplement-Underground Equipment and Technology June, pp. 68-72.
Fuller, P.G. (1999). Keynote lecture: roof strata reinforcement-achievements and challenges. In:
Proceedings of the Rock Support and Reinforcement Practice in Mining. Balkema, pp. 405-415.

206
Gale W.J. (1991). Strata control utilizing rock reinforcement techniques and stress control
methods, in Australian coal mines. The Mining Engineer Jan:247-253.
Gale, W. and Fabjanczyk, M.W. (1993). Design approach to assess coal mine roadway stability
and support requirements. In: Proceedings of the Eighth Australian Tunnelling Conference
(Sydney, Australia).
Gale, W., Fabjanczyk, M. W., Tarrant, G. C. and Guy, R. J. (1992). Optimisation of
reinforcement design of coal mine roadways. In: Aziz NI, Peng SS, eds. Proceedings of the 11th
International Conference on Ground Control in Mining. Wollongong, New South Wales,
Australia: University of Wollongong, pp. 272-279.
Gercek, H. (1982). Stability of intersection in room and pillar coal mining. Ph.D. Thesis,
Pennsylvania State University. WV. 186 pp.
Gerdeen, J.C., Snyder, V.W., Viegelahn, G.L. and Parker, J. (1979). Design criteria for roof
bolting plans using fully resin-grouted non-tensioned bolts to reinforce bedded mine roof.
Volume III: Experimental model studies; Volume IV: Theoretical analysis. Houghton, MI:
Michigan Technological University. U.S. Bureau of Mines contract No. J0366004.
Guo, S. (1996). Development and improvement of numerical models for roof supports in
Underground Coal Mines, Ph.D. Thesis, WVU, Morgantown, WV, pp. 31-42.
Hagan P. (2004). Variation in the load transfer of fully encapsulated rockbolts, Proceedings of
the 23rd International Conference on Ground Control in Mining, Morgantown, WV, USA.
Hagan, P.C. (2003a). The effect of resin annulus on anchorage performance of fully
encapsulated rockbolts, in Technology roadmap for rock mechanics, Proceedings ISRM 2003
Conference, pp 447-450 (South Africa Inst. Min. and Metal.: Johannesburg).
Hagan, P.C. (2003b). Observations on the differences in load transfer of a fully encapsulated
rockbolt. .Proceedings of 1st Australasian Ground Control in Mining Conference, November.
Hanna, K. and Conover, D.P. (1988) Design of coal mine entry intersections. Paper at SME
Annual Meeting, Phoenix, AZ, January, 1998.
Hayes A.W. and Altounyan P.F.R. (1995). Strata control the state-of-the-art. Mining Technology,
Institute of Mining Engineers 77(892): 354-358.

207
Karabin, G.J. and Debevec W.J. (1976) Comparative evaluation of conventional and ersin
bolting systems. U.S. Department of Labor, Mine Enforcement and Safety Administration, IR
1033.
Kent F.L., Coggan J.S. and Altounyan P.F.R. (1999b) Investigation into factors affecting
roadway deformation in the Selby coalfield. In: Proceedings of the Geotechnical and Geological
Engineering, pp. 273-289.
Kent L., Cartwright P.B. and Bigby D.N. (1999a). Tunnel deformation monitoring "action levels"
in coal mines for support/reinforcement design. In: Peng SS, Mark C, eds. Proceedings of the
18th International Conference on Ground Control in Mining. Morgantown, WV: West Virginia
University, pp. 98-107.
Lang T.A. and Bischoff J.A. (1982). Stabilization of rock excavations using rock reinforcement.
In: Proceedings of the 23rd U.S. Rock Mechanics Symposium. pp. 935-944.
Lauffer, H. (1958). “Gebirgsklassifizierung fur den Stollenbau,” Geologie and Bauwesen, Vol.
24, No. 1, pp. 46-51.
Lorig, L.J. (1985). A simple numerical representation of fully bonded passive rock reinforcement
for hard rocks. Computers and Geotechnics 0266-352X. Great Britain: Elsevier.
Luo, J., Haycocks, C., Karmis, M. and Westman, E. (1998). A critical overview of U.S.
rockbolting practices. Third International Symposium, Roof bolting in mining. Aachen Germany,
June 3 – 4.
MaIeki H., Signer S.P., King M. and Edminster P. (1994). Evaluation of support performance in
a highly stressed mine. In: Peng SS, ed. Proceedings of the 13th International Conference on
Ground Control in Mining. Morgantown, WV: West Virginia University, pp. 9-17.
Maleki H., Carlisle T., Hunt G. and Agapito J.F.T. (1987). A novel ground control program at
Plateau Mining Company. In: Peng SS, ed. Proceedings of the 6th International Conference on
Ground Control in Mining. Morgantown, WV: West Virginia University, pp. 118-125.
Maleki, H. (1992). Significance of bolt tension in ground control, Proceeding of the Rock
Support in Mining and Underground Construction, Balkema, pp. 439-449.

208
Mark C. (1998). Comparison of ground conditions and ground control practices in the USA and
Australia. In: Peng SS, ed. Proceedings of the 17th International Conference on Ground Control
in Mining. Morgantown, WV: West Virginia University, pp. 63-71.
Mark C. and Barczak T.M. (2000). Fundamentals of coal mine roof support. In: New Technology
for Coal Mine Roof Support. Pittsburgh, PA: U.S. Department of Health and Human Services,
Public Health Service, Centers for Disease Control and Prevention, National Institute for
Occupational Safety and Health, DHHS (NIOSH) Publication No. 2000-151, IC 9453.
Mark C., Dolinar D.R. and Mucho T.P. (2000). Summary of field measurements of roof bolt
performance. In: New Technology for Coal Mine Roof Support. Pittsburgh, P A: U.S.
Department of Health and Human Services, Public Health Service, Centers for Disease Control
and Prevention, National Institute for Occupational Safety and Health, DHHS (NIOSH)
Publication No. 2000-151, IC 9453.
Mark, C. (1982). A physical model study of coal mine roof using the base friction technique. PhD
Thesis. University Park, PA: The Pennsylvania State University.
Mark, C. (2000). Design of roof bolt systems. In: New technology for coal mine roof support.
Pittsburgh, PA: U.S. Department of Health and Human Services, Public Helath Service, Centres
for Disease Control and Prevention, National Institute for Occupational Safety and Health,
DHHS, (NIOSH) Publication No. 2000-151, IC 9453.
Mark, C. (2001). Overview of ground control research for underground coal mines in the USA.
17th International Mining Congress and Exhibition of Turkey. June.
Mark, C. (2002). The introduction of roof bolting to U.S. underground coal mines (1948-1960): A
cautionary tale. In: Peng SS, ed. Proceedings of the 21th International Conference on Ground
Control in Mining. Morgantown, WV: West Virginia University,
Mark, C. (2004). Personal communication.
Mark, C., Chase, F. and Molinda, G. (1994). Design of longwall gate entry systems using roof
classification. New technology for ground control, Proceedings: USBM Technology Transfer
Seminar, Washington D.C., pp. 5-17.

209
Mark, C., Compton, C., Oyler, D. and Dolinar, D. R. (2002). Anchorage pull testing for fully
grouted roof bolts. In: Peng SS, ed. Proceedings of the 13th International Conference on
Ground Control in Mining. Morgantown, WV: West Virginia University.
McHugh E. and Signer S.P. (1999). Roofbolt response to shear stress: laboratory analysis. In:
Peng SS, Mark C, eds. Proceedings of the 18th International Conference on Ground Control in
Mining. Morgantown, WV: West Virginia University, pp. 232-238.
Minerals Bureau, (2003). Operating and developing coal mines in the Republic of South Africa.
Department of Minerals and Energy. South Africa.
Minney, D. and Munsamy, L. (1998). Personal communication.
Minney, D., van Wijk, J. and Vorster, B. and Koen, F. (2004). Personal communication.
Molinda, G. M. and Mark, C. (1994). The coal mine roof rating (CMRR): A practical rock mass
classification for coal mines. In: Peng SS, ed. Proceedings of the 12th International Conference
on Ground Control in Mining. Morgantown, WV: West Virginia University, pp. 92-103.
Molinda, G., Mark, C., and Dolinar, D. (2000). Assessing coal mine roof stability through roof fall
analysis. In: New technology for coal mine roof support. Pittsburgh, PA: U.S. Department of
Health and Human Services, Public Health Service, Centres for Disease Control and
Prevention, National Institute for Occupational Safety and Health, DHHS, (NIOSH) Publication
No. 2000-151, IC 9453.
Molinda, G., Mark, C., Bauer, E., Babich, D. and Papas, D. (1998). Factors influencing
intersection stability in U.S. coal mines. In: Peng SS, ed. Proceedings of the 17th International
Conference on Ground Control in Mining. Morgantown, WV: West Virginia University, pp. 267-
275
O’Brien, B.J. (2003). The effect of profile on rockbolt performance. BSc thesis. University of
New South Wales. Australia.
O’Connor, D. (2004). Personal communication.
O’Connor, D., van Vuuren, J. and Altounyan, P. (2002). Measuring the effect of bolt installation
practice on bond strength for resin anchored rockbolts. SANIRE 2002 Symposium. Re-Defining
the Boundaries. September.

210
Obert, L. and Duvall, W. I. (1967). Rock mechanics and the design of structures in Rock. John
Wiley and Sons.
Panek L.A. (1964). Design for bolting stratified roof. Trans SME, 229. Littleton, CO: Society for
Mining, Metallurgy, and Exploration, Inc., pp. 113-119.
Parker, J. (2001). Selecting a roof bolting system, Part 2, AGGMAN, November, pp. 16-21.
Peng S.S. (1998). Roof bolting adds stability to weak strata. Coal Age Magazine Dec: pp. 32-
38.
Peng S.S. and Guo L.B. (1989). Design criteria for resin bolting. SME preprint 89-166. Littleton,
CO: Society for Mining, Metallurgy, and Exploration, Inc.
Peng, S.S. (1986). Coal mine ground control, 2nd edition, John Wiley and Sons.
Pile, J., Bessinger, S., Mark, C. and Tadolini, S. (2003). Short-encapsulation pull tests for roof
bolt evaluation at an operating coal mine. In: Peng SS, ed. Proceedings of the 22nd
International Conference on Ground Control in Mining. Morgantown, WV: West Virginia
University, pp. 226-232.
Raffoux, J.S. (1971). Resin bonded bolting in French coal mines. Proc. Symp. On Rockbolting,
Wollongong, Australia, pp. 18-25.
Roberts, D.P. (2000). Finite element modelling of rockbolts and reinforcing elements. PhD
Thesis submitted to the University of Wales, Swansea.
Roberts, D.P. (1995). Testing of mining tunnel support elements and systems for hard rock
mines, Master of Science in Engineering to the Department of Mechanical Engineering,
University of Natal, South Africa.
Serbousek, M.O. and Signer, S.P. (1987). Linear load-transfer mechanisms of fully grouted roof
bolts. U.S. Bureau of Mines. R19135.
Siddall, R. G. and Gale, J. (1992). Strata control – A new science for an old problem. Institution
of Mining Engineers and the Institution of Mining and Metallurgy Annual Meeting. UK, January.

211
Siddall, R.G. (1992). Roofbolting – supply side technology. Institution of Mining Engineers and
the Institution of Mining and Metallurgy Annual Meeting. Harrogate, UK, June.
Signer S.P. (1990). Field verification of load transfer mechanics of fully grouted roof bolts.
Spokane, WA: U.S. Department of the Interior, Bureau of Mines, RI 9301.
Signer S.P., Mark C., Franklin G. and Hendon G. (1993). Comparisons of active versus passive
bolts in a bedded mine roof. In: Peng SS, ed. Proceedings of the 12th International Conference
on Ground Control in Mining. Morgantown, WV: West Virginia University, pp. 16-23.
Signer, S.P. and Jones, S.D. (1990). A case study of grouted roof bolt loading in a two-entry
gateroad, In: Peng SS, ed. Proceedings of the 9th International Conference on Ground Control
in Mining. Morgantown, WV: West Virginia University, pp. 35-41.
Signer, S.P. and Lewis, J.L. (1998). A case study of bolt performance in a two-entry gateroad.
In: Peng SS, ed. Proceedings of the 17th International Conference on Ground Control in Mining.
Morgantown, WV: West Virginia University, pp. 249-256.
Signer, S.P., Cox D. and Johnston, J. (1997). A method for the selection of rock support based
on bolt loading measurement. In: Peng SS, ed. Proceedings of the 16th International
Conference on Ground Control in Mining. Morgantown, WV: West Virginia University, pp. 183-
190.
Sinha R.S. (1989) Underground structures design and instrumentation. Denver.
Smith, W. (1993). Roof control strategies for underground coal mines, U.S. Bureau of Mines. IC
9351 USBM.
Snyder, V.W., Geerden, J.C. and Viegelahn, G.L. (1979). Factors governing the effectiveness of
roof bolting systems using fully resin-grouted non-tensioned bolts. In Proceedings 20th
Symposium on Rock Mechanics, pp. 607-613.
Spann, H. P. and Napier, J. A. L. (1983). The influence of different bolt patterns and anchor
types on the deflection of a laminated beam.
St. John, C.M. and van Dillen, D.E. (1983). Rockbolts: a new numerical representation and its
application in tunnel design. 24th U.S. Symp. Rock Mech.

212
Stankus J.C. (1991). Tensioned point anchor resin system versus non-tensioned fully grouted
rebar-two case studies. In: Peng SS, ed. Proceedings of the 10th International Conference on
Ground Control in Mining. Morgantown, WV: West Virginia University, pp. 65-76.
Stankus J.C. and Peng S.S. (1996). A new concept for roof support. Reprint from Coal Age
Magazine, September.
Stillborg, B. (1986). Professional Users Hand Book for Rockbolting, Trans Tech Publications,
vol. 15, pp. 55-89.
Tadolini S.C. (1998). The effects of reduced annulus in roof bolting performance. In: Peng SS,
ed. Proceedings of the 17th International Conference on Ground Control in Mining.
Morgantown, WV: West Virginia University, pp. 230-236.
Tadolini S.C. and Ulrich B.F. (1986). Evaluation of bearing plates installed on full-column resin-
grouted bolts. U.S. Department of the Interior, Bureau of Mines, RI 9044.
Tadolini, S.C. and Dolinar D.R. (1991). Thrust bolting: a new innovation in coal mine roof
support. In: Peng SS, ed. Proceedings of the 10th International Conference on Ground Control
in Mining. Morgantown, WV: West Virginia University, pp. 76-84.
Terzaghi, K. (1946). Rock defects and loads on tunnel support. Rock tunnelling with steel
support. Commercial Shearing Co., Youngstown, Ohio.15-99.
Tincelin, E. (1970). Roof bolting recommendations. Exploration of mineral deposits and mineral
proceedings. Parley of Cooperation and Industrial Promotion. Sydney. May.
Tully, D.M. (1987). The Application of scale model studies in the design of rockbolting system
for Mine Roadways, 28 U.S. Symposium on Rock Mechanics, June, pp. 781-788.
UK Health and Safety Executive (1996). Guidance on the use of rockbolts to support roadways
in coal mines. UK Health and Safety Executive, Deep Mine Coal Industry Advisory Committee.
16 pp.
Ulrich B.F., Wuest, J. and Stateham R.M. (1989). Relationships between annulus thickness and
the integrity of resin grouted bolts. Denver, CO: U.S. Department of the Interior, Bureau of
Mines, RI 9253.

213
Unal, E. (1984). Empirical approach to calculate rock loads in coal mine roadways. In: Peng SS,
ed. Proceedings of the 5th International Conference on Ground Control in Mining. Morgantown,
WV: West Virginia University, pp. 232-246.
Van der Merwe, J.N. (1989). A probabilistic approach to the design of coal mine roof support
systems. Advances in rock mechanics in underground coal mining. SANGORM Symposium,
September.
Van der Merwe, J.N. (1995). Practical coal mining strata control. A guide for managers.
Johannesburg, South Africa, November.
Van der Merwe, J.N. (1998). Practical coal mining strata control. A guide for managers. And
supervisors at all levels. Second edition. Johannesburg, South Africa, November.
Van der Merwe, J.N. (2001). Personal communication.
Van der Merwe, J.N. and Madden, B.J. (2002). Rock engineering for coal mining. Safety in
Mines Research Advisory Committee (SIMRAC). SAIMM Special Publications Series 7. April.
Van der Merwe, J.N., van Vuuren, J.J., Butcher, R. and Canbulat, I. (2001). Causes of falls of
roof in South African collieries. SIMRAC, Department of Minerals and Energy, Johannesburg,
South Africa Final Project Report, Report No: COL613. March 2001.
Vervoort, A. M. J. (1990). Falls of ground in South African collieries during the Period 1970 –
1988. Part 3: Effect of exploitation method. Chamber of Mines Research Organisation
(COMRO) Internal Report, Project Report No. 7/90, Project No. CC8S03, January.
Wagner, H. (1985). Design of roof bolting patterns. Chamber of Mines workshop on roof bolting
in collieries. Republic of South Africa. Johannesburg.
Whitaker, A. (1998). Critical assessment of past research into rockbolt anchorage mechanisms.
Unpublished BE (Mining Engineering) thesis, University of New South Wales, Sydney.
Wickham, G.E., Tiedemann, H.R. and Skinner, E.H. (1972). Support determination based on
geological predictions. Proceedings, rapid Excavation and Tunnelling Conference, AIME, New
York, pp. 43-64.

214
Windsor, C. and Thompson A. (1997). Rock reinforcement practice, advanced course. Rock
Technology Pty Limited. Australia.
Wright F.D. (1973). Roof control through beam action and arching. In: Given lA, ed. SME Mining
Engineering Handbook 1(13). Littleton, CO: Society for Mining, Metallurgy, and Exploration, Inc.,
p. 80.
Wullschlager, D. and Natau, O. (1983). Studies of the composite system of rock mass and non-
prestressed grouted rockbolts, Proceeding of the International Symposium on Rockbolting,
September, 1983, pp. 75-85.
Yassien, A.M. (2003). 2-D numerical simulation and design of fully grouted bolts for
underground coal mines. PhD Thesis. West Virginia University, Morgantown. 180 pp.
Zhang, Y. (2003). 3-D Numerical simulation and design of tensioned roof bolting for
underground coal mines. PhD Thesis. West Virginia University, Morgantown. 197 pp.