Embed Size (px)
Citation preview
aaaa
Simcoe County District School BoardCapital Plan
December 2008
Moved by Robert North Seconded by Debra Edwards (5) #BP-2008-12-17-186 That the Board approve the Capital Plan, attached as APPENDIX A through APPENDIXO inclusively, as set out in Report No. FAC-D-5, Capital Plan: 2008, dated December 10,2008. CARRIED Moved by Robert North Seconded by Debra Edwards (6,7,8,) #BP-2008-12-17-186 (6) That the Board approve that an Attendance Area Review be undertaken, commencing inMarch 2009 in Elementary Planning Review Area PE2, which includes AdmiralCollingwood Elementary School, Cameron Street Public School, Connaught PublicSchool, Mountain View Elementary School, Nottawa Central Elementary School andWorsley Public School, as set out in Report No. FAC-D-5, Capital Plan: 2008, datedDecember 10, 2008. (7) #BP-2008-12-17-186 That the Board approve that an Attendance Area Review be undertaken, commencing in March 2009 in Elementary Planning Review Area PE8, which includes Assikinack Public School, Ferndale Woods Elementary School, and Trillium Woods Elementary School, for the new Ardagh North elementary school, as set out in Report No. FAC-D-5, Capital Plan: 2008, dated December 10, 2008. (8) #BP-2008-12-17-186 That the Board approve that an attendance review be undertaken, commencing January 2009 which includes the northwest area of Bradford District High School attendance area (which is in Cookstown Public School attendance area) and the attendance area of Nantyr Shores. CARRIED
Capital Project Summary:
1
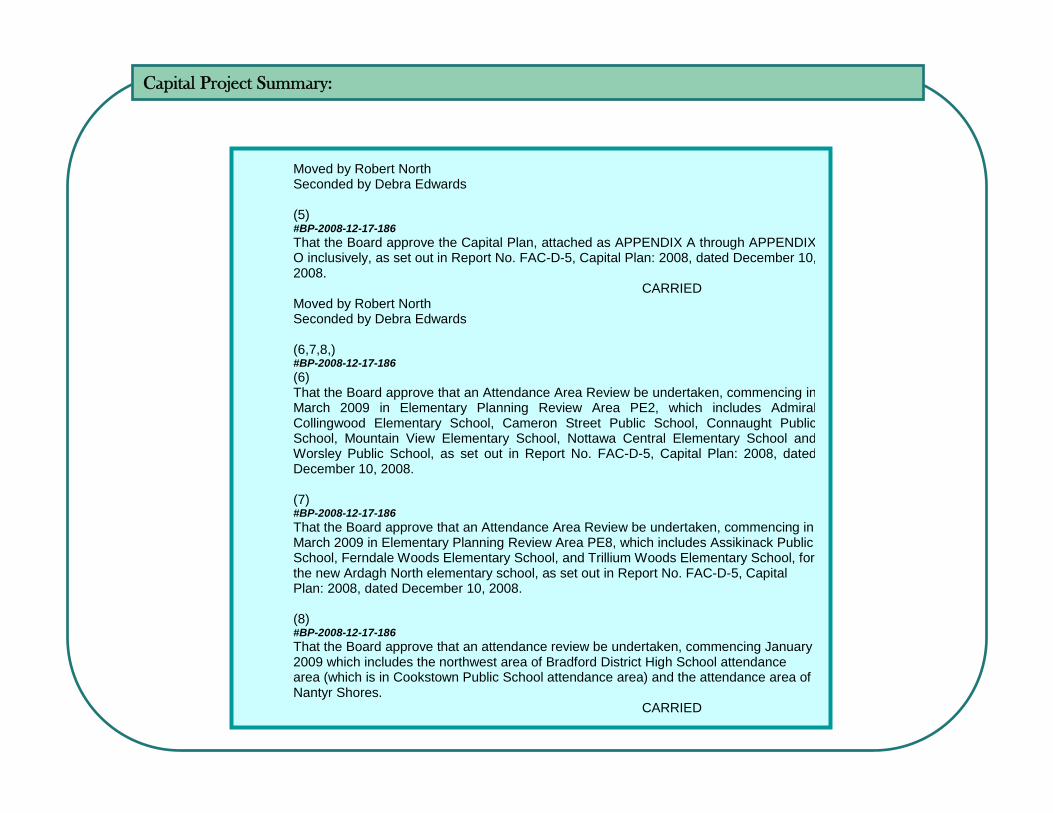
Capital Planning – Glossary of TermsAttendance Area ReviewsThe process of studying defined school attendance areas, for the purpose of achieving adequate and balanced accommodation amongst two or more schools.
Critical FCI ratingA school facility has a critical FCI rating when the cost of renewing the building is between 30 to 65% of the cost of replacing the existing building.
Facility Condition Index (FCI)Facility Condition Index refers to the percentage of renewal funding required to upgrade/repair a school compared to the school’s replacement value.
Good Places to Learn (GPL) In February 2005, the Ministry of Education announced a new initiative called Good Places to Learn. The Good Places to Learn document cites the need for boards to provide a new, comprehensive outlook on school facilities, their conditions in the future, and their ability to provide safe environments for current program and curriculum delivery. The Good Places to Learn Grant was put into place for high and urgent component replacement needs.
Growth SchoolSchool needed in an area of new residential development where an EDC by-law is in place. Funding for a “growth school” may be available if a business case is accepted by the Ministry of Education.
InfillThe creation of residential lots through land severances.
Learning EnvironmentRefers to the condition of educational spaces as they relate to the effectiveness of teaching spaces for program delivery.
On-the-Ground Capacity (OTG)The capacity of the school as determined by the Ministry of Education by loading all instructional spaces within the facility to current Ministry standards for class size requirements and room areas.
Planning Review Areas (PE & PS)The areas as delineated in the background study used in the preparation of the Board’s Education Developmental Charge By-law.
Prohibitive to Repair (PTR)A school facility is deemed “Prohibitive to Repair” when the cost of renewing the building surpasses 65% of the cost of replacing the existing building (FCI>65%).
Pupil Accommodation ReviewThe review of two or more schools in order to develop viable and practical solutions for the accommodation of students within an accommodation review area. Reviews are to take place in accordance with Policy 2313, Pupil Accommodation Review.
Secondary PlansSecondary Plans are long range municipal planning documents which direct major infrastructure: arterial roads, servicing, schools, and community parks.
2
Introduction to the Capital Plan
In February 2005, the Minister of Education announced the “Good Places to Learn: Renewing Ontario's Schools”document. The primary focus of this document was to: implement class size caps; increase child care spaces; review accessibility; provide funding for major school repairs, replacement school funding and growth school funding; and provide a framework for school closure.
Capital Planning is a ten year rolling endeavor. Staff will continue to monitor each planning area, as well as, proposed study areas based upon the above criteria, and different Ministry initiatives which may alleviate certain “pressure points”, or perhaps create new ones. Staff will recommend to the Board of Trustees, annually, which study areas should be acted upon, with options presented back to the Board of Trustees for a decision.
In December 2007 the Board received a Capital Planning document outlining each Planning Review Area. Staff proposed study areas based upon three distinct criteria: condition of school facilities, program delivery, and accommodation issues. These criteria must be recognized for the delivery of quality learning environments to the current and future students of Simcoe County. The Capital Plan recommended that five accommodation review committees be struck and two attendance area reviews. The Board approved these recommendations. Currently, 4 accommodation reviews and one attendance area review is underway, one attendance area review has been completed, and attendance areas have been implemented, and lastly one accommodation review will commence in January 2008.
Since the preparation of the Capital Plan, new ministry initiatives have transpired.
On October 1st 2008 the Ministry announced new capital funding to school boards. In order to be a candidate for funding, a Capital Priorities Template was to be completed identifying priority projects that were required up to and including the 2011-2012 school year. Only permanent construction can be identified as priority projects. Ministry funding will be reviewed and allocated on a project by project approval basis at the designated ministry benchmark costs for: growth. prohibitive to repair and other (which includes: localized accommodation pressure, consolidation, program enhancements, and facility retrofit.) These priority projects were submitted to the Ministry on October 31, 2008 with supporting business cases, and are contained within this Capital Plan.
In addition to capital priorities funding, the Ministry announced some funding for Full Day Learning for Four and Five Year Olds. In light of this announcement staff have included the concept of including all day learning into the system for 2010. For the purpose of the capital plan, the Board will assume that children enrolled within the half time kindergarten program will have opportunities to attend school on a full time bases. Capital projects, and attendance area reviews addressing the Full Day Learning will be determined once provincial policy is received.
3
Capital Planning – Population Growth
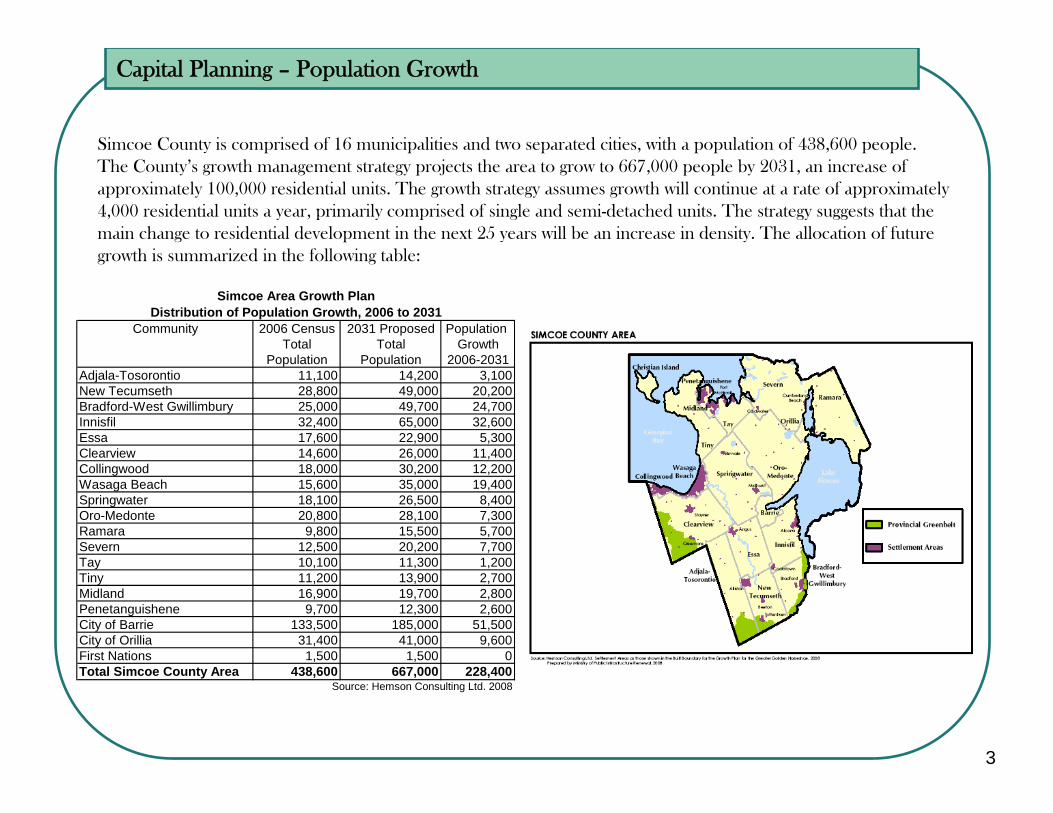
Simcoe County is comprised of 16 municipalities and two separated cities, with a population of 438,600 people.The County’s growth management strategy projects the area to grow to 667,000 people by 2031, an increase of approximately 100,000 residential units. The growth strategy assumes growth will continue at a rate of approximately 4,000 residential units a year, primarily comprised of single and semi-detached units. The strategy suggests that the main change to residential development in the next 25 years will be an increase in density. The allocation of future growth is summarized in the following table:
Community 2006 Census 2031 Proposed Population Total Total Growth
Population Population 2006-2031Adjala-Tosorontio 11,100 14,200 3,100New Tecumseth 28,800 49,000 20,200Bradford-West Gwillimbury 25,000 49,700 24,700Innisfil 32,400 65,000 32,600Essa 17,600 22,900 5,300Clearview 14,600 26,000 11,400Collingwood 18,000 30,200 12,200Wasaga Beach 15,600 35,000 19,400Springwater 18,100 26,500 8,400Oro-Medonte 20,800 28,100 7,300Ramara 9,800 15,500 5,700Severn 12,500 20,200 7,700Tay 10,100 11,300 1,200Tiny 11,200 13,900 2,700Midland 16,900 19,700 2,800Penetanguishene 9,700 12,300 2,600City of Barrie 133,500 185,000 51,500City of Orillia 31,400 41,000 9,600First Nations 1,500 1,500 0Total Simcoe County Area 438,600 667,000 228,400
Source: Hemson Consulting Ltd. 2008
Distribution of Population Growth, 2006 to 2031Simcoe Area Growth Plan
4
Capital Planning – Secondary Planning Review Area
Planning Review AreaSecondary PanelSimcoe CountyBarrieOrillia
#
#
#
#
#
#
#
##
#
#
###
##
COLLINGWOOD CI
STAYNER CI
BANTING MEMORIAL HS
BEAR CREEK SS
NANTYR SHORES SS
BRADFORD DISTRICT HS
ELMVALE DISTRICT HS
MIDLAND SS
PENETANGUISHENE SS
TWIN LAKES SSORILLIA DISTRICT CVIORILLIA PARK ST C
EASTVIEW SSBARRIE NORTH CIBARRIE CENTRAL CI
INNISDALE SS
N
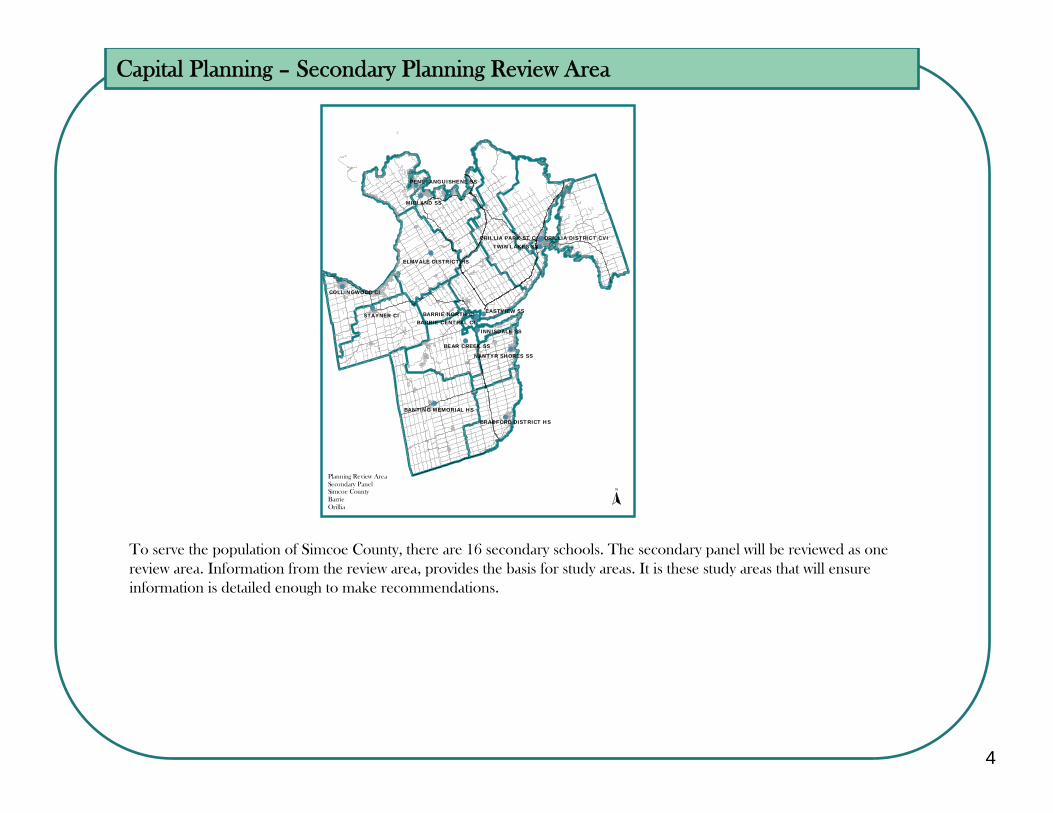
To serve the population of Simcoe County, there are 16 secondary schools. The secondary panel will be reviewed as one review area. Information from the review area, provides the basis for study areas. It is these study areas that will ensure information is detailed enough to make recommendations.
5
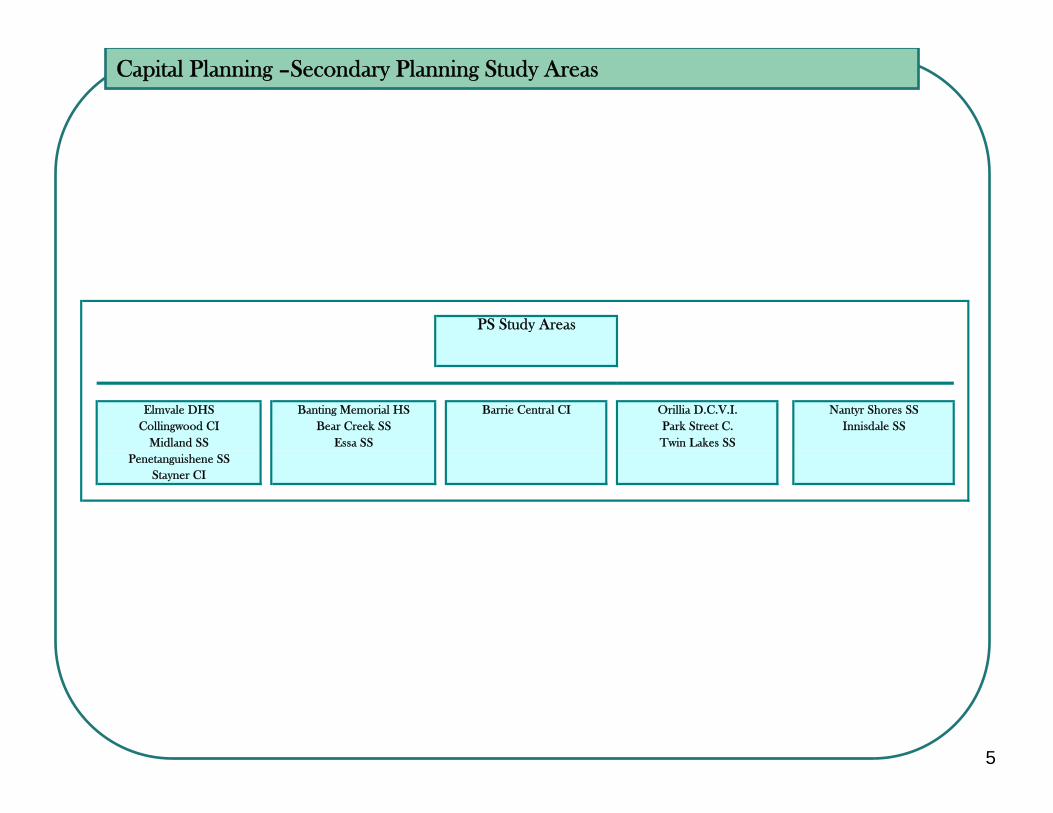
PS Study Areas
Elmvale DHS Banting Memorial HS Barrie Central CI Orillia D.C.V.I. Nantyr Shores SSCollingwood CI Bear Creek SS Park Street C. Innisdale SS
Midland SS Essa SS Twin Lakes SSPenetanguishene SS
Stayner CI
Capital Planning –Secondary Planning Study Areas
6
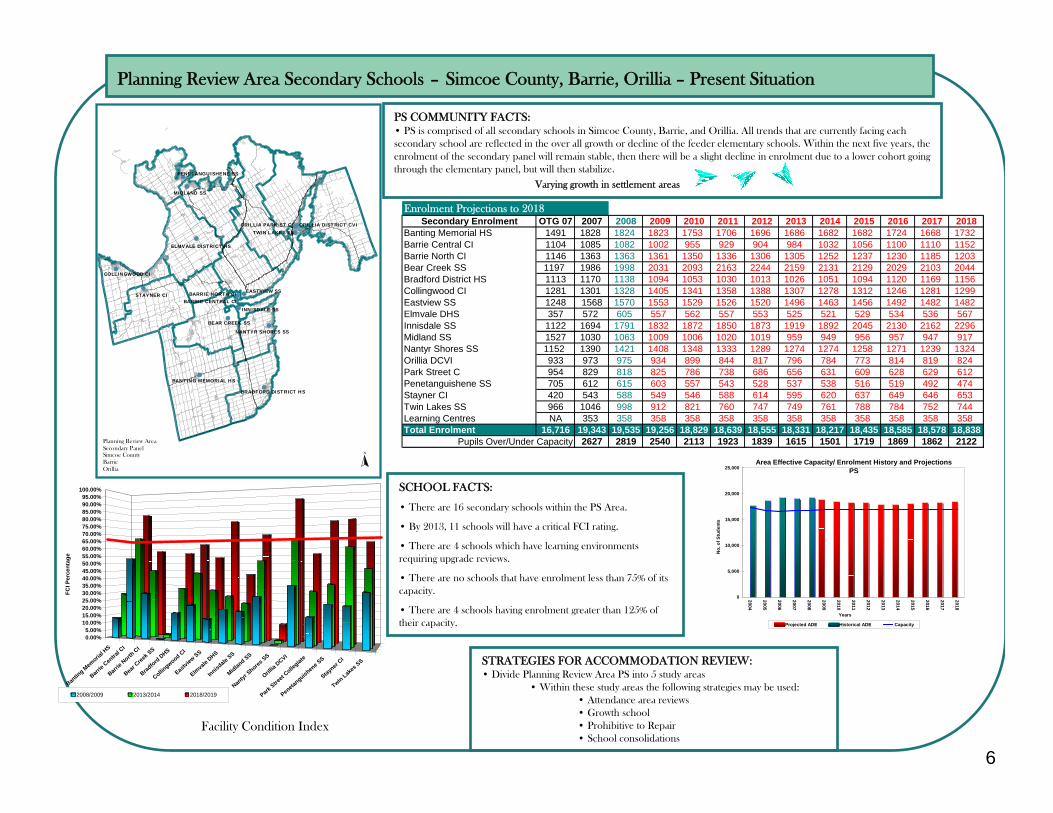
Planning Review Area Secondary Schools – Simcoe County, Barrie, Orillia – Present Situation
Facility Condition Index
SCHOOL FACTS:
• There are 16 secondary schools within the PS Area.
• By 2013, 11 schools will have a critical FCI rating.
• There are 4 schools which have learning environments requiring upgrade reviews.
• There are no schools that have enrolment less than 75% of its capacity.
• There are 4 schools having enrolment greater than 125% of their capacity.
STRATEGIES FOR ACCOMMODATION REVIEW:• Divide Planning Review Area PS into 5 study areas
• Within these study areas the following strategies may be used:• Attendance area reviews• Growth school• Prohibitive to Repair• School consolidations
PS COMMUNITY FACTS:• PS is comprised of all secondary schools in Simcoe County, Barrie, and Orillia. All trends that are currently facing each secondary school are reflected in the over all growth or decline of the feeder elementary schools. Within the next five years, the enrolment of the secondary panel will remain stable, then there will be a slight decline in enrolment due to a lower cohort going through the elementary panel, but will then stabilize.
Varying growth in settlement areas
Planning Review AreaSecondary PanelSimcoe CountyBarrieOrillia
#
#
#
#
#
#
#
##
#
#
###
##
COLLINGWOOD CI
STAYNER CI
BANTING MEMORIAL HS
BEAR CREEK SS
NANTYR SHORES SS
BRADFORD DISTRICT HS
ELMVALE DISTRICT HS
MIDLAND SS
PENETANGUISHENE SS
TWIN LAKES SSORILLIA DISTRICT CVIORILLIA PARK ST C
EASTVIEW SSBARRIE NORTH CIBARRIE CENTRAL CI
INNISDALE SS
N
Bantin
g Mem
orial H
S
Barrie
Central C
I
Barrie
North CI
Bear C
reek SS
Bradford DHS
Collingwood CI
Eastview SS
Elmva
le DHS
Innisdale
SS
Midland SS
Nantyr S
hores SS
Orillia
DCVI
Park Stre
et Colle
giate
Penetanguishene SS
Stayner
CI
Twin Lakes
SS
0.00%5.00%
10.00%15.00%20.00%25.00%30.00%35.00%40.00%45.00%50.00%55.00%60.00%65.00%70.00%75.00%80.00%85.00%90.00%95.00%
100.00%
FCI P
erce
ntag
e
2008/2009 2013/2014 2018/2019
Enrolment Projections to 2018Secondary Enrolment OTG 07 2007 2008 2009 2010 2011 2012 2013 2014 2015 2016 2017 2018
Banting Memorial HS 1491 1828 1824 1823 1753 1706 1696 1686 1682 1682 1724 1668 1732Barrie Central CI 1104 1085 1082 1002 955 929 904 984 1032 1056 1100 1110 1152Barrie North CI 1146 1363 1363 1361 1350 1336 1306 1305 1252 1237 1230 1185 1203Bear Creek SS 1197 1986 1998 2031 2093 2163 2244 2159 2131 2129 2029 2103 2044Bradford District HS 1113 1170 1138 1094 1053 1030 1013 1026 1051 1094 1120 1169 1156Collingwood CI 1281 1301 1328 1405 1341 1358 1388 1307 1278 1312 1246 1281 1299Eastview SS 1248 1568 1570 1553 1529 1526 1520 1496 1463 1456 1492 1482 1482Elmvale DHS 357 572 605 557 562 557 553 525 521 529 534 536 567Innisdale SS 1122 1694 1791 1832 1872 1850 1873 1919 1892 2045 2130 2162 2296Midland SS 1527 1030 1063 1009 1006 1020 1019 959 949 956 957 947 917Nantyr Shores SS 1152 1390 1421 1408 1348 1333 1289 1274 1274 1258 1271 1239 1324Orillia DCVI 933 973 975 934 899 844 817 796 784 773 814 819 824Park Street C 954 829 818 825 786 738 686 656 631 609 628 629 612Penetanguishene SS 705 612 615 603 557 543 528 537 538 516 519 492 474Stayner CI 420 543 588 549 546 588 614 595 620 637 649 646 653Twin Lakes SS 966 1046 998 912 821 760 747 749 761 788 784 752 744Learning Centres NA 353 358 358 358 358 358 358 358 358 358 358 358Total Enrolment 16,716 19,343 19,535 19,256 18,829 18,639 18,555 18,331 18,217 18,435 18,585 18,578 18,838
2627 2819 2540 2113 1923 1839 1615 1501 1719 1869 1862 2122Pupils Over/Under Capacity
0
5,000
10,000
15,000
20,000
25,000
2004
2005
2006
2007
2008
2009
2010
2011
2012
2013
2014
2015
2016
2017
2018
Years
No.
of S
tude
nts
Projected ADE Historical ADE Capacity
Area Effective Capacity/ Enrolment History and ProjectionsPS
7
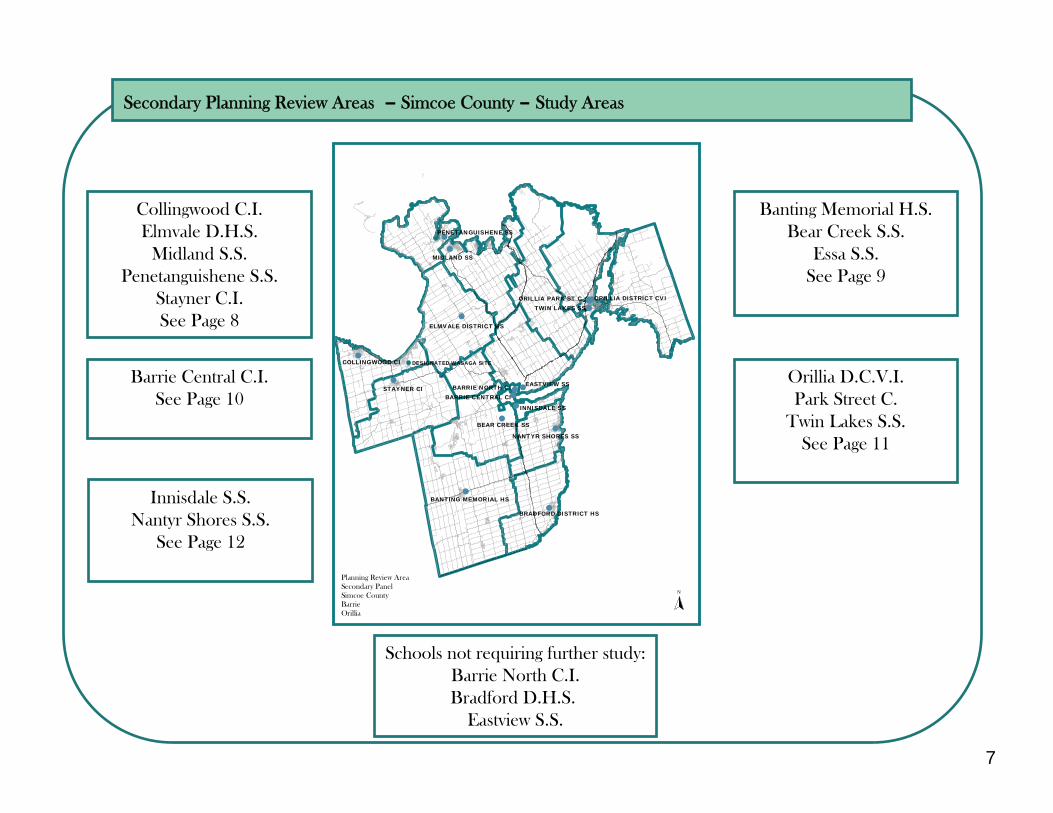
Secondary Planning Review Areas – Simcoe County – Study Areas
Schools not requiring further study:Barrie North C.I.Bradford D.H.S.
Eastview S.S.
Collingwood C.I.Elmvale D.H.S.
Midland S.S.Penetanguishene S.S.
Stayner C.I.See Page 8
Barrie Central C.I.See Page 10
Orillia D.C.V.I.Park Street C.
Twin Lakes S.S.See Page 11
Banting Memorial H.S.Bear Creek S.S.
Essa S.S.See Page 9
Planning Review AreaSecondary PanelSimcoe CountyBarrieOrillia
#
#
#
#
#
#
#
##
#
#
###
##
COLLINGWOOD CI
STAYNER CI
BANTING MEMORIAL HS
BEAR CREEK SS
NANTYR SHORES SS
BRADFORD DISTRICT HS
ELMVALE DISTRICT HS
MIDLAND SS
PENETANGUISHENE SS
TWIN LAKES SSORILLIA DISTRICT CVIORILLIA PARK ST C
EASTVIEW SSBARRIE NORTH CIBARRIE CENTRAL CI
INNISDALE SS
DESIGNATED WASAGA SITE
N
Innisdale S.S.Nantyr Shores S.S.
See Page 12
8
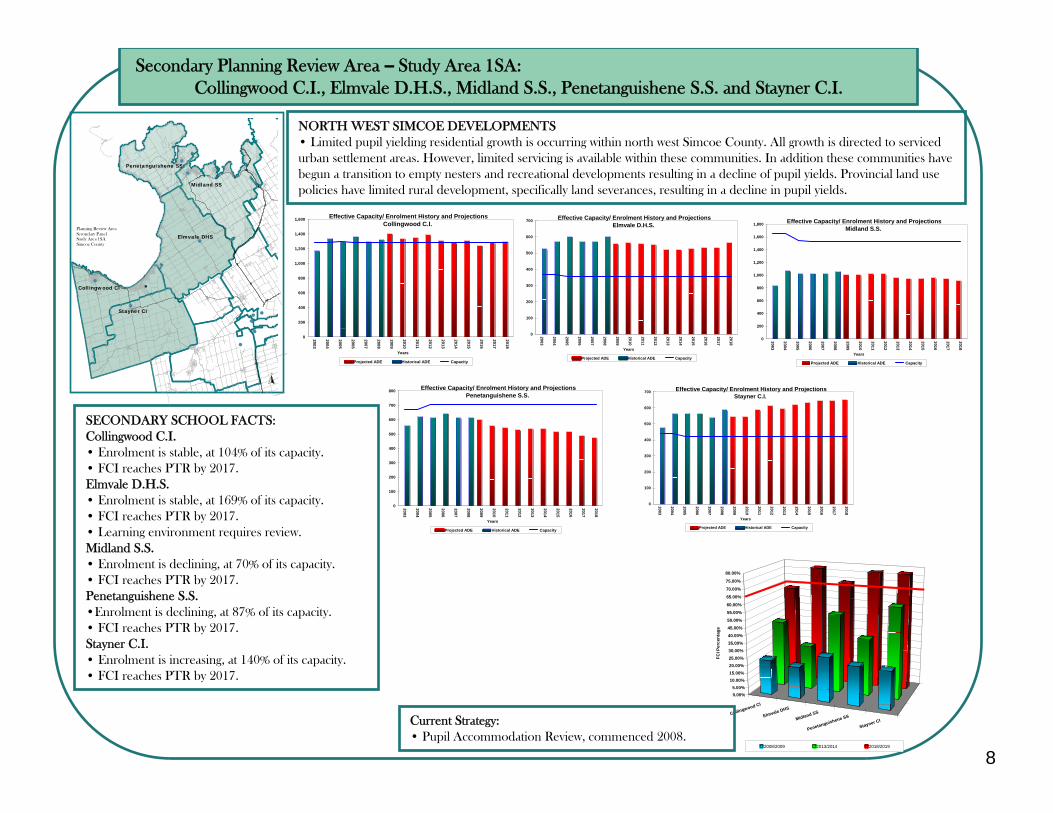
Secondary Planning Review Area – Study Area 1SA:Collingwood C.I., Elmvale D.H.S., Midland S.S., Penetanguishene S.S. and Stayner C.I.
NORTH WEST SIMCOE DEVELOPMENTS• Limited pupil yielding residential growth is occurring within north west Simcoe County. All growth is directed to serviced urban settlement areas. However, limited servicing is available within these communities. In addition these communities have begun a transition to empty nesters and recreational developments resulting in a decline of pupil yields. Provincial land use policies have limited rural development, specifically land severances, resulting in a decline in pupil yields.
SECONDARY SCHOOL FACTS:Collingwood C.I.• Enrolment is stable, at 104% of its capacity.• FCI reaches PTR by 2017.Elmvale D.H.S.• Enrolment is stable, at 169% of its capacity.• FCI reaches PTR by 2017.• Learning environment requires review.Midland S.S.• Enrolment is declining, at 70% of its capacity.• FCI reaches PTR by 2017.Penetanguishene S.S.•Enrolment is declining, at 87% of its capacity.• FCI reaches PTR by 2017.Stayner C.I.• Enrolment is increasing, at 140% of its capacity.• FCI reaches PTR by 2017.
N
#
#
#
#
#
##
#
#
#
Penetanguishene SS
Midland SS
Elmvale DHS
Collingwood CI
Stayner CI
Planning Review AreaSecondary PanelStudy Area 1SASimcoe County
Collingwood CI
Elmvale DHS
Midland SS
Penetanguishene SS
Stayner CI
0.00%5.00%
10.00%15.00%20.00%25.00%30.00%35.00%40.00%45.00%50.00%
55.00%
60.00%
65.00%
70.00%
75.00%
80.00%
FCI P
erce
ntag
e
2008/2009 2013/2014 2018/2019
Current Strategy:• Pupil Accommodation Review, commenced 2008.
0
200
400
600
800
1,000
1,200
1,400
1,600
2003
2004
2005
2006
2007
2008
2009
2010
2011
2012
2013
2014
2015
2016
2017
2018
Years
Projected ADE Historical ADE Capacity
Effective Capacity/ Enrolment History and ProjectionsCollingwood C.I.
0
100
200
300
400
500
600
700
2003
2004
2005
2006
2007
2008
2009
2010
2011
2012
2013
2014
2015
2016
2017
2018
Years
Projected ADE Historical ADE Capacity
Effective Capacity/ Enrolment History and ProjectionsElmvale D.H.S.
0
200
400
600
800
1,000
1,200
1,400
1,600
1,800
2003
2004
2005
2006
2007
2008
2009
2010
2011
2012
2013
2014
2015
2016
2017
2018
Years
Projected ADE Historical ADE Capacity
Effective Capacity/ Enrolment History and ProjectionsMidland S.S.
0
100
200
300
400
500
600
700
800
2003
2004
2005
2006
2007
2008
2009
2010
2011
2012
2013
2014
2015
2016
2017
2018
Years
Projected ADE Historical ADE Capacity
Effective Capacity/ Enrolment History and ProjectionsPenetanguishene S.S.
0
100
200
300
400
500
600
7002003
2004
2005
2006
2007
2008
2009
2010
2011
2012
2013
2014
2015
2016
2017
2018
Years
Projected ADE Historical ADE Capacity
Effective Capacity/ Enrolment History and ProjectionsStayner C.I.
9
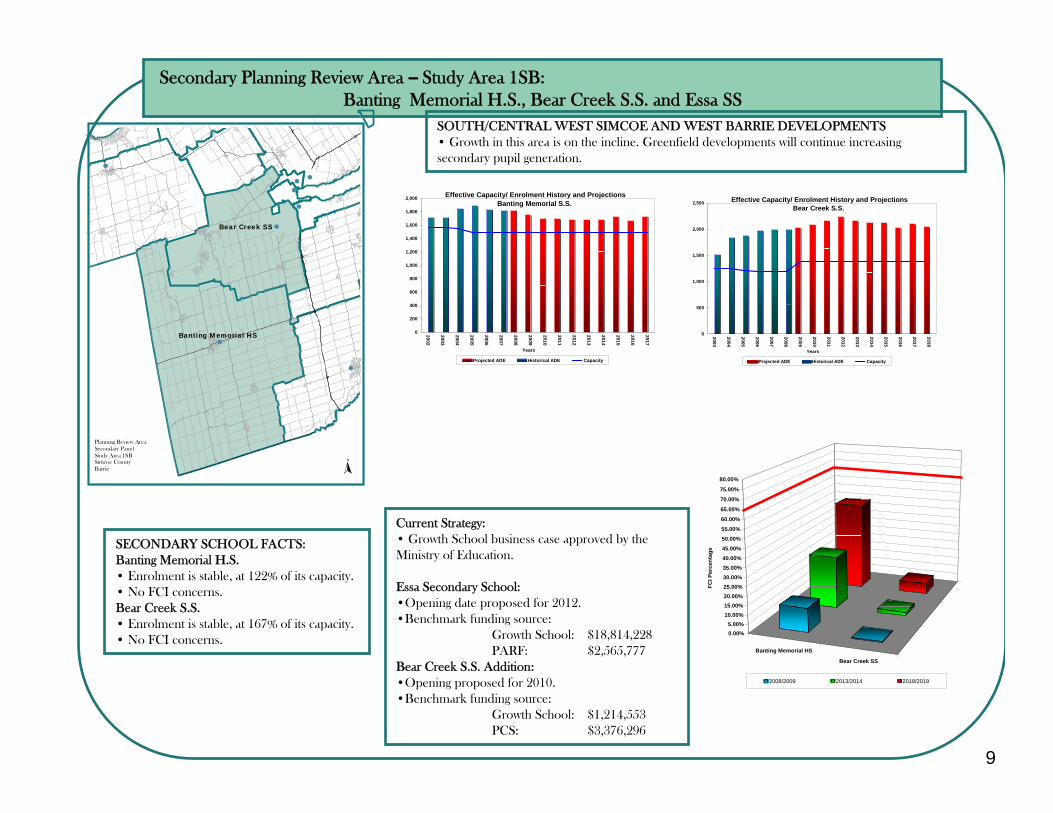
Secondary Planning Review Area – Study Area 1SB:Banting Memorial H.S., Bear Creek S.S. and Essa SS
SOUTH/CENTRAL WEST SIMCOE AND WEST BARRIE DEVELOPMENTS• Growth in this area is on the incline. Greenfield developments will continue increasing secondary pupil generation.
SECONDARY SCHOOL FACTS:Banting Memorial H.S.• Enrolment is stable, at 122% of its capacity.• No FCI concerns.Bear Creek S.S.• Enrolment is stable, at 167% of its capacity.• No FCI concerns.
Current Strategy:• Growth School business case approved by the Ministry of Education.
Essa Secondary School:•Opening date proposed for 2012. •Benchmark funding source:
Growth School: $18,814,228 PARF: $2,565,777
Bear Creek S.S. Addition:•Opening proposed for 2010.•Benchmark funding source:
Growth School: $1,214,553PCS: $3,376,296
N
#
#
#
#
#
#
#
#Bear Creek SS
Banting Memorial HS
Planning Review AreaSecondary PanelStudy Area 1SBSimcoe CountyBarrie
Banting Memorial HS
Bear Creek SS
0.00%5.00%
10.00%15.00%20.00%25.00%30.00%35.00%40.00%45.00%50.00%55.00%
60.00%
65.00%
70.00%
75.00%
80.00%
FCI P
erce
ntag
e
2008/2009 2013/2014 2018/2019
0
200
400
600
800
1,000
1,200
1,400
1,600
1,800
2,000
2002
2003
2004
2005
2006
2007
2008
2009
2010
2011
2012
2013
2014
2015
2016
2017
Years
Projected ADE Historical ADE Capacity
Effective Capacity/ Enrolment History and ProjectionsBanting Memorial S.S.
0
500
1,000
1,500
2,000
2,500
2003
2004
2005
2006
2007
2008
2009
2010
2011
2012
2013
2014
2015
2016
2017
2018
Years
Projected ADE Historical ADE Capacity
Effective Capacity/ Enrolment History and ProjectionsBear Creek S.S.
10
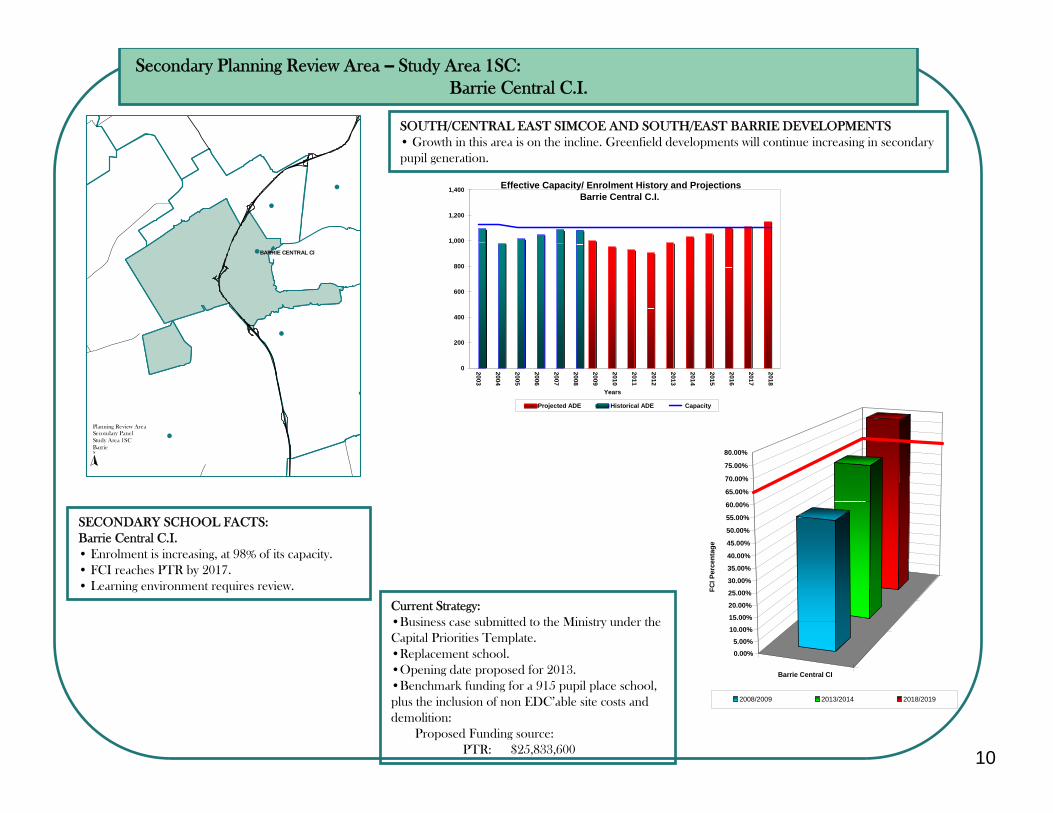
Secondary Planning Review Area – Study Area 1SC:Barrie Central C.I.
SOUTH/CENTRAL EAST SIMCOE AND SOUTH/EAST BARRIE DEVELOPMENTS• Growth in this area is on the incline. Greenfield developments will continue increasing in secondary pupil generation.
SECONDARY SCHOOL FACTS:Barrie Central C.I.• Enrolment is increasing, at 98% of its capacity.• FCI reaches PTR by 2017.• Learning environment requires review.
Current Strategy:•Business case submitted to the Ministry under the Capital Priorities Template.•Replacement school.•Opening date proposed for 2013.•Benchmark funding for a 915 pupil place school, plus the inclusion of non EDC’able site costs and demolition:
Proposed Funding source:PTR: $25,833,600
Barrie Central CI
0.00%5.00%
10.00%
15.00%
20.00%
25.00%
30.00%
35.00%
40.00%
45.00%
50.00%
55.00%
60.00%
65.00%
70.00%
75.00%
80.00%
FCI P
erce
ntag
e
2008/2009 2013/2014 2018/2019
#
#
#
#
#
BARRIE CENTRAL CI
N
Planning Review AreaSecondary PanelStudy Area 1SCBarrie
0
200
400
600
800
1,000
1,200
1,400
2003
2004
2005
2006
2007
2008
2009
2010
2011
2012
2013
2014
2015
2016
2017
2018
Years
Projected ADE Historical ADE Capacity
Effective Capacity/ Enrolment History and ProjectionsBarrie Central C.I.
11
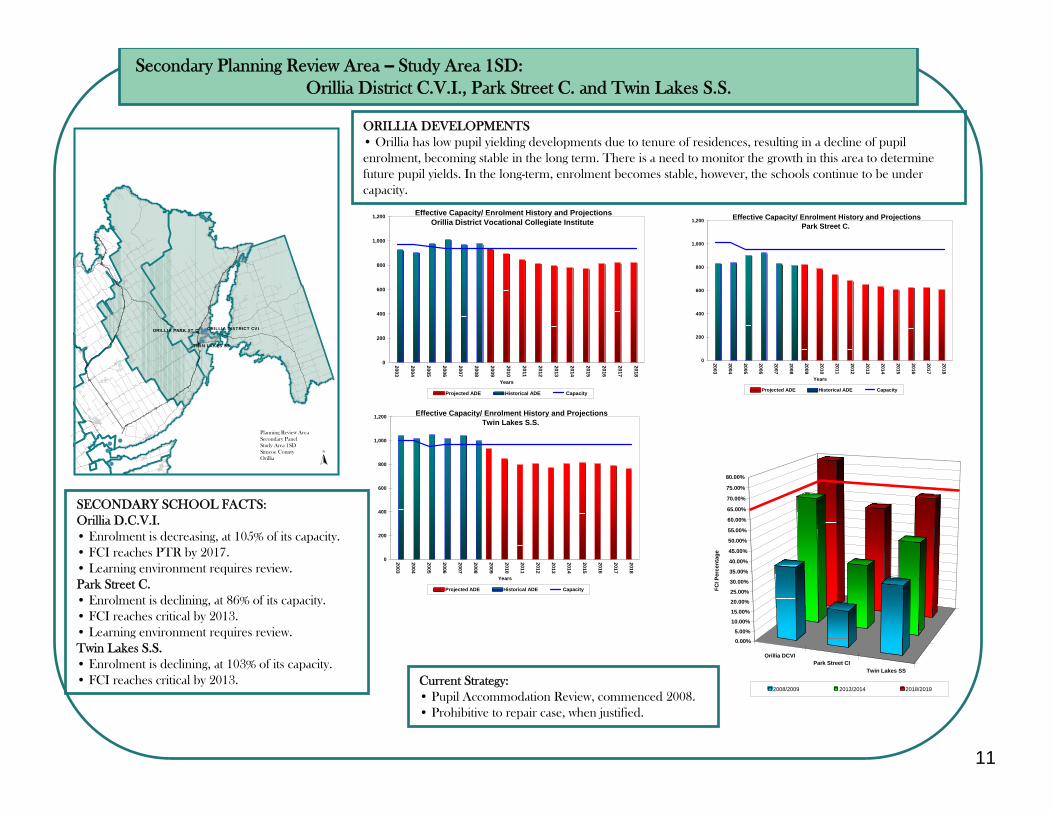
Secondary Planning Review Area – Study Area 1SD:Orillia District C.V.I., Park Street C. and Twin Lakes S.S.
ORILLIA DEVELOPMENTS• Orillia has low pupil yielding developments due to tenure of residences, resulting in a decline of pupil enrolment, becoming stable in the long term. There is a need to monitor the growth in this area to determine future pupil yields. In the long-term, enrolment becomes stable, however, the schools continue to be under capacity.
SECONDARY SCHOOL FACTS:Orillia D.C.V.I.• Enrolment is decreasing, at 105% of its capacity.• FCI reaches PTR by 2017.• Learning environment requires review.Park Street C.• Enrolment is declining, at 86% of its capacity.• FCI reaches critical by 2013.• Learning environment requires review.Twin Lakes S.S.• Enrolment is declining, at 103% of its capacity.• FCI reaches critical by 2013. Current Strategy:
• Pupil Accommodation Review, commenced 2008.• Prohibitive to repair case, when justified.
##
#
#
##
#TWIN LAKES SS
ORILLIA PARK ST C ORILLIA DISTRICT CVI
N
Planning Review AreaSecondary PanelStudy Area 1SDSimcoe CountyOrillia
Orillia DCVIPark Street CI
Twin Lakes SS
0.00%5.00%
10.00%
15.00%
20.00%
25.00%
30.00%
35.00%
40.00%
45.00%
50.00%
55.00%
60.00%
65.00%
70.00%
75.00%
80.00%
FCI P
erce
ntag
e
2008/2009 2013/2014 2018/2019
0
200
400
600
800
1,000
1,200
2003
2004
2005
2006
2007
2008
2009
2010
2011
2012
2013
2014
2015
2016
2017
2018
Years
Projected ADE Historical ADE Capacity
Effective Capacity/ Enrolment History and ProjectionsOrillia District Vocational Collegiate Institute
0
200
400
600
800
1,000
1,200
2003
2004
2005
2006
2007
2008
2009
2010
2011
2012
2013
2014
2015
2016
2017
2018
Years
Projected ADE Historical ADE Capacity
Effective Capacity/ Enrolment History and ProjectionsPark Street C.
0
200
400
600
800
1,000
1,200
2003
2004
2005
2006
2007
2008
2009
2010
2011
2012
2013
2014
2015
2016
2017
2018
Years
Projected ADE Historical ADE Capacity
Effective Capacity/ Enrolment History and ProjectionsTwin Lakes S.S.
12
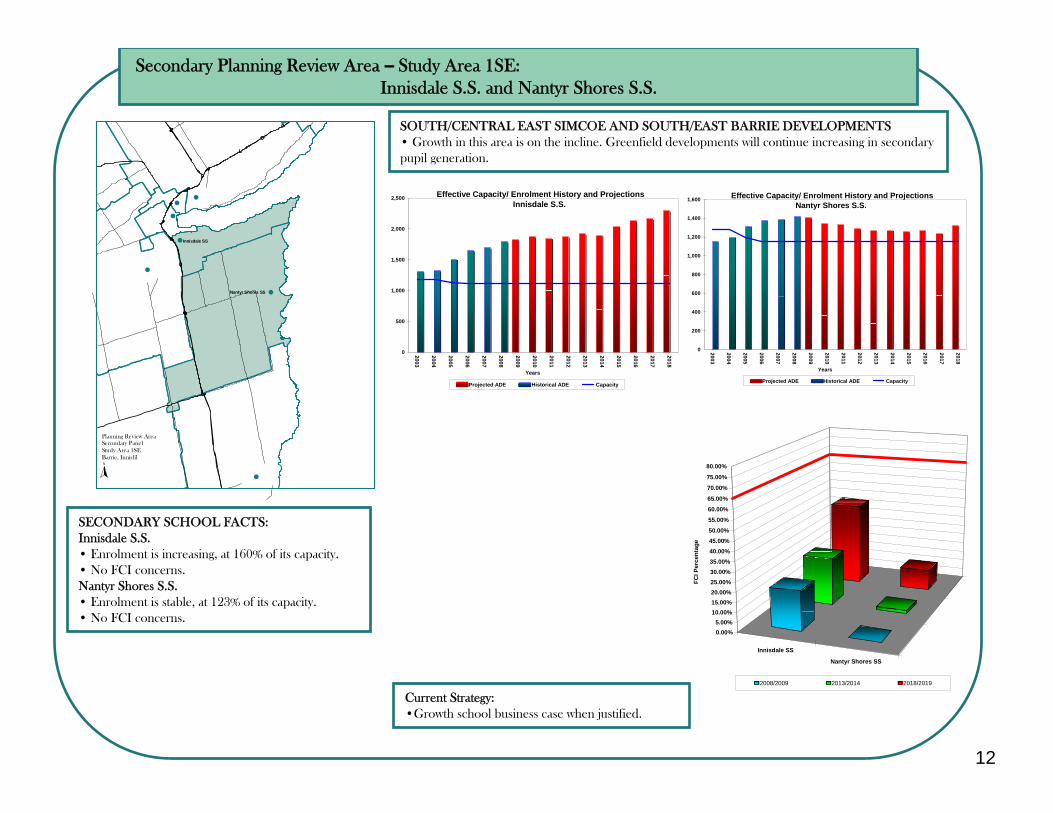
Secondary Planning Review Area – Study Area 1SE:Innisdale S.S. and Nantyr Shores S.S.
SOUTH/CENTRAL EAST SIMCOE AND SOUTH/EAST BARRIE DEVELOPMENTS• Growth in this area is on the incline. Greenfield developments will continue increasing in secondary pupil generation.
SECONDARY SCHOOL FACTS:Innisdale S.S.• Enrolment is increasing, at 160% of its capacity.• No FCI concerns.Nantyr Shores S.S.• Enrolment is stable, at 123% of its capacity.• No FCI concerns.
Current Strategy:•Growth school business case when justified.
Innisdale SS
Nantyr Shores SS
0.00%5.00%
10.00%15.00%20.00%25.00%30.00%35.00%40.00%45.00%50.00%
55.00%
60.00%
65.00%
70.00%
75.00%
80.00%
FCI P
erce
ntag
e
2008/2009 2013/2014 2018/2019
#
#
#
#
#
#
#
Innisdale SS
Nantyr Shores SS
N
Planning Review AreaSecondary PanelStudy Area 1SEBarrie, Innisfil
0
500
1,000
1,500
2,000
2,500
2003
2004
2005
2006
2007
2008
2009
2010
2011
2012
2013
2014
2015
2016
2017
2018
Years
Projected ADE Historical ADE Capacity
Effective Capacity/ Enrolment History and ProjectionsInnisdale S.S.
0
200
400
600
800
1,000
1,200
1,400
1,600
2003
2004
2005
2006
2007
2008
2009
2010
2011
2012
2013
2014
2015
2016
2017
2018
Years
Projected ADE Historical ADE Capacity
Effective Capacity/ Enrolment History and ProjectionsNantyr Shores S.S.
13
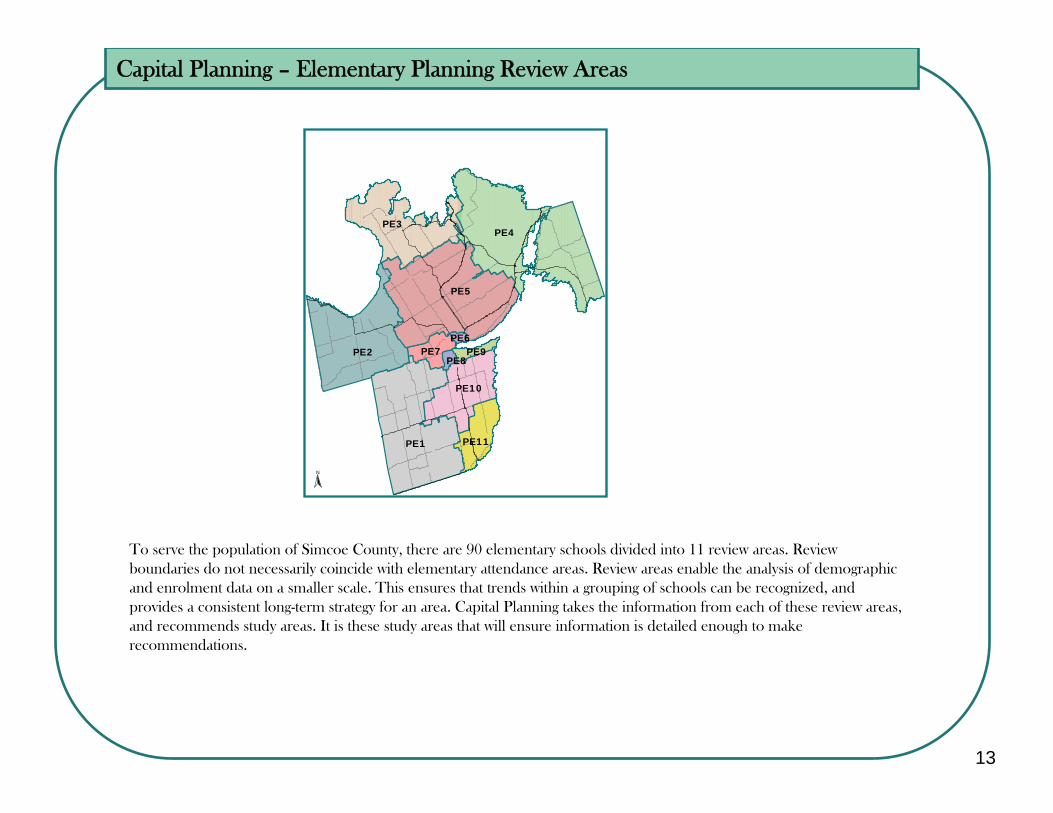
Capital Planning – Elementary Planning Review Areas
PE5
PE1
PE2
PE4PE3
PE10
PE7
PE11
PE9PE8
PE6
N
To serve the population of Simcoe County, there are 90 elementary schools divided into 11 review areas. Review boundaries do not necessarily coincide with elementary attendance areas. Review areas enable the analysis of demographic and enrolment data on a smaller scale. This ensures that trends within a grouping of schools can be recognized, and provides a consistent long-term strategy for an area. Capital Planning takes the information from each of these review areas, and recommends study areas. It is these study areas that will ensure information is detailed enough to make recommendations.
14
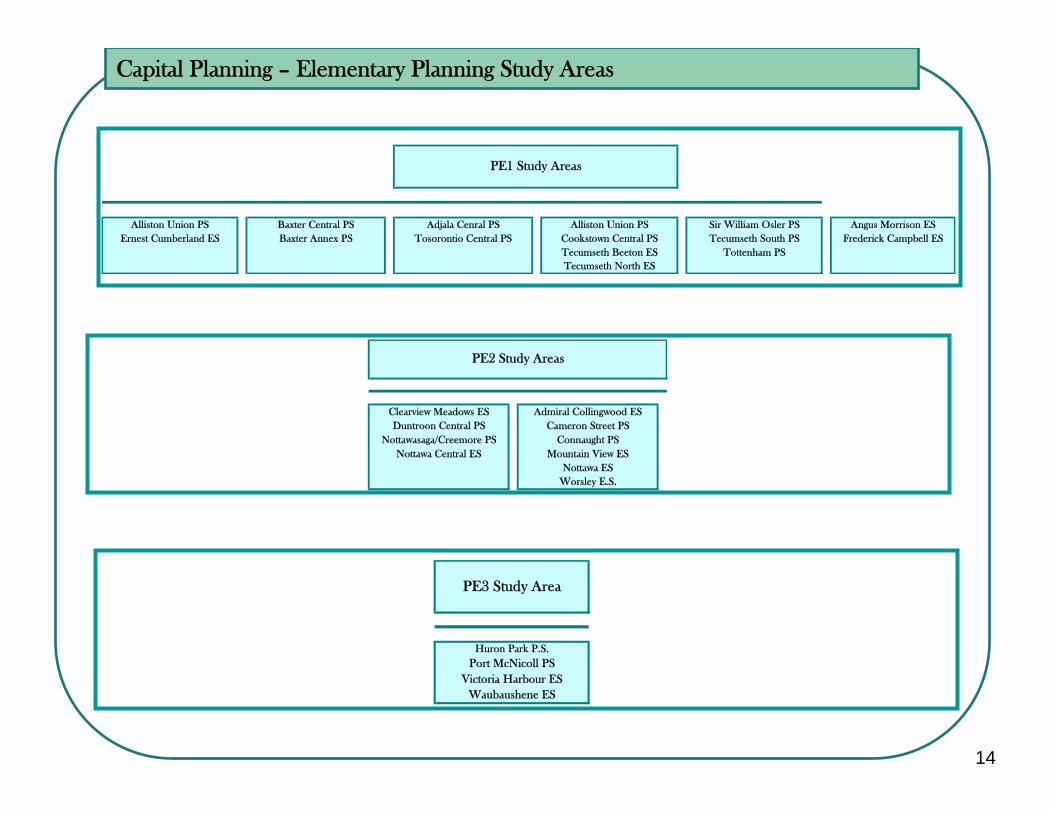
Capital Planning – Elementary Planning Study Areas
Alliston Union PS Baxter Central PS Adjala Cenral PS Alliston Union PS Sir William Osler PS Angus Morrison ESErnest Cumberland ES Baxter Annex PS Tosorontio Central PS Cookstown Central PS Tecumseth South PS Frederick Campbell ES
Tecumseth Beeton ES Tottenham PSTecumseth North ES
PE1 Study Areas
Clearview Meadows ES Admiral Collingwood ESDuntroon Central PS Cameron Street PS
Nottawasaga/Creemore PS Connaught PSNottawa Central ES Mountain View ES
Nottawa ESWorsley E.S.
PE2 Study Areas
PE3 Study Area
Huron Park P.S.Port McNicoll PS
Victoria Harbour ESWaubaushene ES
15
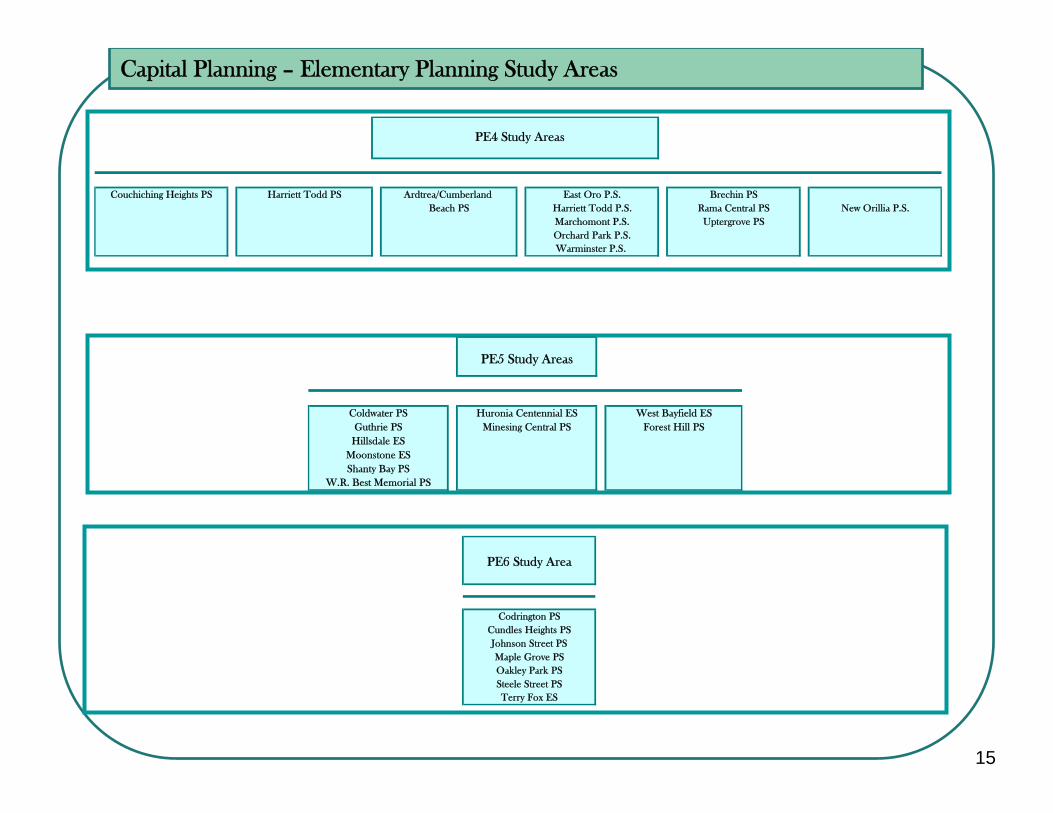
Capital Planning – Elementary Planning Study Areas
PE6 Study Area
Codrington PSCundles Heights PSJohnson Street PSMaple Grove PSOakley Park PSSteele Street PSTerry Fox ES
PE5 Study Areas
Coldwater PS Huronia Centennial ES West Bayfield ESGuthrie PS Minesing Central PS Forest Hill PS
Hillsdale ESMoonstone ESShanty Bay PS
W.R. Best Memorial PS
Couchiching Heights PS Harriett Todd PS Ardtrea/Cumberland East Oro P.S. Brechin PSBeach PS Harriett Todd P.S. Rama Central PS
Marchomont P.S. Uptergrove PSOrchard Park P.S.Warminster P.S.
New Orillia P.S.
PE4 Study Areas
16
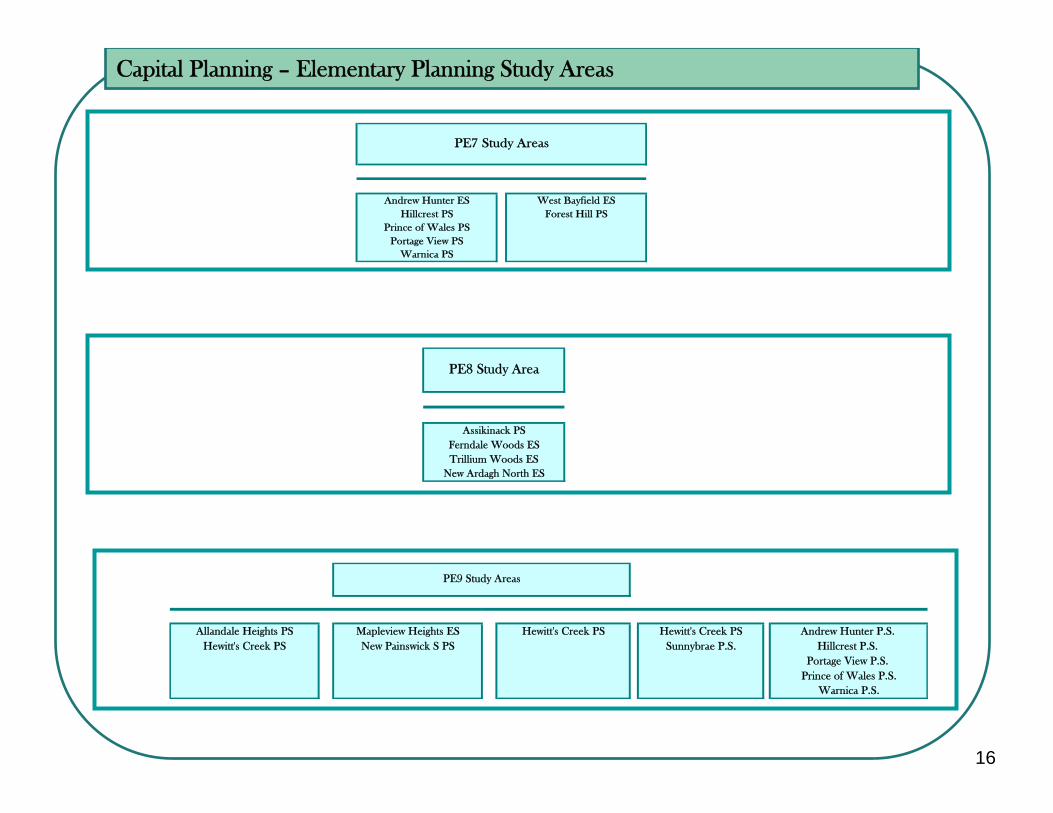
Capital Planning – Elementary Planning Study Areas
Andrew Hunter ES West Bayfield ESHillcrest PS Forest Hill PS
Prince of Wales PSPortage View PS
Warnica PS
PE7 Study Areas
Assikinack PSFerndale Woods ESTrillium Woods ES
New Ardagh North ES
PE8 Study Area
Allandale Heights PS Mapleview Heights ES Hewitt's Creek PS Hewitt's Creek PS Andrew Hunter P.S. Hewitt's Creek PS New Painswick S PS Sunnybrae P.S. Hillcrest P.S.
Portage View P.S. Prince of Wales P.S.
Warnica P.S.
PE9 Study Areas
17
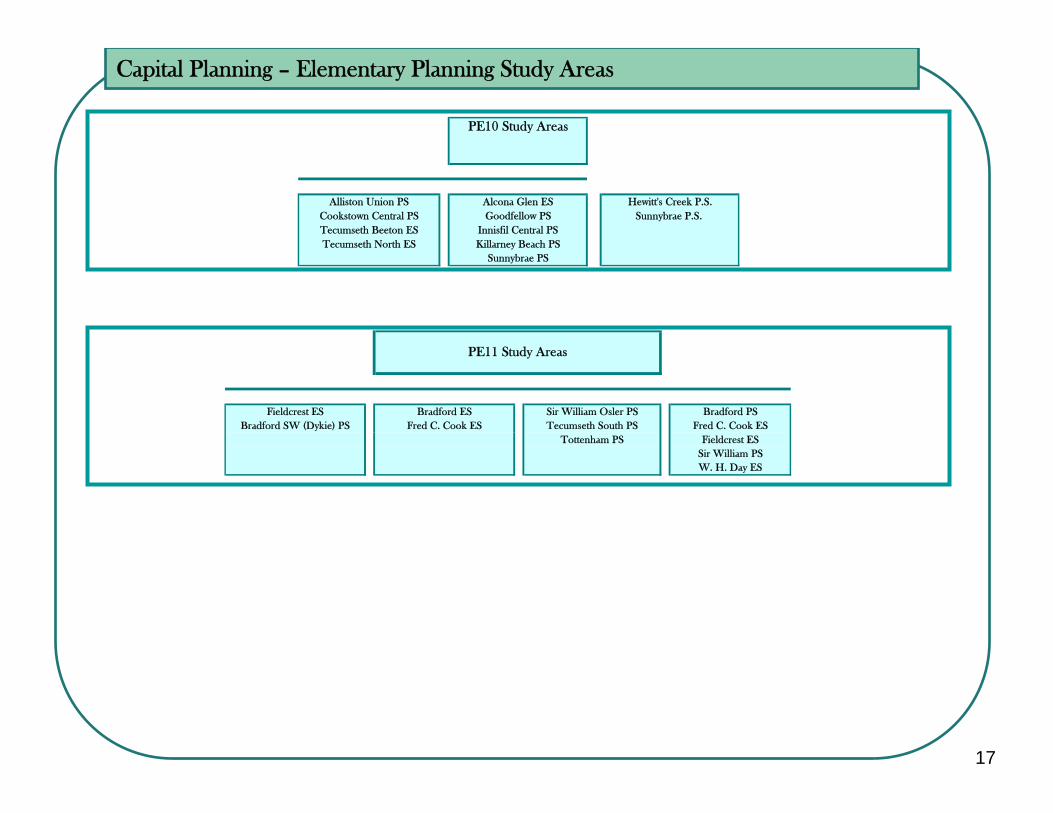
Capital Planning – Elementary Planning Study Areas
Fieldcrest ES Bradford ES Sir William Osler PS Bradford PSBradford SW (Dykie) PS Fred C. Cook ES Tecumseth South PS Fred C. Cook ES
Tottenham PS Fieldcrest ESSir William PSW. H. Day ES
PE11 Study Areas
PE10 Study Areas
Alliston Union PS Alcona Glen ES Hewitt's Creek P.S.Cookstown Central PS Goodfellow PS Sunnybrae P.S. Tecumseth Beeton ES Innisfil Central PSTecumseth North ES Killarney Beach PS
Sunnybrae PS
18
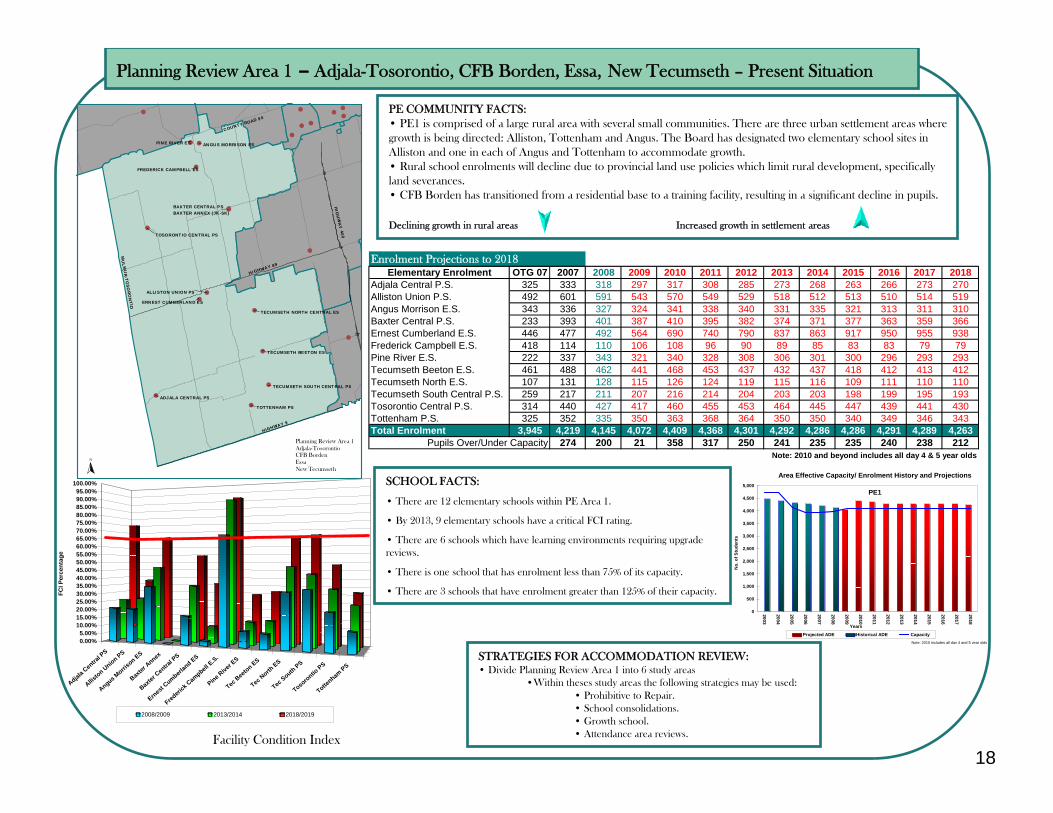
Planning Review Area 1 – Adjala-Tosorontio, CFB Borden, Essa, New Tecumseth – Present Situation
Facility Condition Index
PE COMMUNITY FACTS:• PE1 is comprised of a large rural area with several small communities. There are three urban settlement areas where growth is being directed: Alliston, Tottenham and Angus. The Board has designated two elementary school sites in Alliston and one in each of Angus and Tottenham to accommodate growth.• Rural school enrolments will decline due to provincial land use policies which limit rural development, specifically land severances.• CFB Borden has transitioned from a residential base to a training facility, resulting in a significant decline in pupils.
Declining growth in rural areas Increased growth in settlement areas
STRATEGIES FOR ACCOMMODATION REVIEW:• Divide Planning Review Area 1 into 6 study areas
•Within theses study areas the following strategies may be used:• Prohibitive to Repair.• School consolidations.• Growth school.• Attendance area reviews.
##
#
#
#
#
#
#
#
#
#
#
#
# ##
#
#
#
#
#
#
#
MU
LM
UR
-TO
SO
RO
NT
IO
HIG
HW
AY
400
HIGHWAY 89
HIGHWAY 9
COUNTY ROAD 90
#
FREDERICK CAMPBELL ES
#
BAXTER CENTRAL PSBAXTER ANNEX (JK-SK)
#PINE RIVER ES # ANGUS MORRISON ES
#
ERNEST CUMBERLAND ES
#
ADJALA CENTRAL PS# TOTTENHAM PS
# TECUMSETH SOUTH CENTRAL PS
# TECUMSETH BEETON ES
# TECUMSETH NORTH CENTRAL ES
#ALLISTON UNION PS
#
TOSORONTIO CENTRAL PS
N
Planning Review Area 1Adjala-TosorontioCFB BordenEssaNew Tecumseth
SCHOOL FACTS:
• There are 12 elementary schools within PE Area 1.
• By 2013, 9 elementary schools have a critical FCI rating.
• There are 6 schools which have learning environments requiring upgrade reviews.
• There is one school that has enrolment less than 75% of its capacity.
• There are 3 schools that have enrolment greater than 125% of their capacity.
Enrolment Projections to 2018Elementary Enrolment OTG 07 2007 2008 2009 2010 2011 2012 2013 2014 2015 2016 2017 2018
Adjala Central P.S. 325 333 318 297 317 308 285 273 268 263 266 273 270Alliston Union P.S. 492 601 591 543 570 549 529 518 512 513 510 514 519Angus Morrison E.S. 343 336 327 324 341 338 340 331 335 321 313 311 310Baxter Central P.S. 233 393 401 387 410 395 382 374 371 377 363 359 366Ernest Cumberland E.S. 446 477 492 564 690 740 790 837 863 917 950 955 938Frederick Campbell E.S. 418 114 110 106 108 96 90 89 85 83 83 79 79Pine River E.S. 222 337 343 321 340 328 308 306 301 300 296 293 293Tecumseth Beeton E.S. 461 488 462 441 468 453 437 432 437 418 412 413 412Tecumseth North E.S. 107 131 128 115 126 124 119 115 116 109 111 110 110Tecumseth South Central P.S. 259 217 211 207 216 214 204 203 203 198 199 195 193Tosorontio Central P.S. 314 440 427 417 460 455 453 464 445 447 439 441 430Tottenham P.S. 325 352 335 350 363 368 364 350 350 340 349 346 343Total Enrolment 3,945 4,219 4,145 4,072 4,409 4,368 4,301 4,292 4,286 4,286 4,291 4,289 4,263
274 200 21 358 317 250 241 235 235 240 238 212Note: 2010 and beyond includes all day 4 & 5 year olds
Pupils Over/Under Capacity
Adjala Centra
l PS
Alliston Union PS
Angus Morri
son ES
Baxter
Annex
Baxter
Central P
S
Ernest Cumberl
and ES
Frederi
ck Campbell E.S.
Pine River
ES
Tec Bee
ton ES
Tec North
ES
Tec South PS
Tosorontio PS
Tottenham
PS
0.00%5.00%
10.00%15.00%20.00%25.00%30.00%35.00%40.00%45.00%50.00%55.00%60.00%65.00%70.00%75.00%80.00%85.00%90.00%95.00%
100.00%
FCI P
erce
ntag
e
2008/2009 2013/2014 2018/2019
0
500
1,000
1,500
2,000
2,500
3,000
3,500
4,000
4,500
5,000
2003
2004
2005
2006
2007
2008
2009
2010
2011
2012
2013
2014
2015
2016
2017
2018
Years
No.
of S
tude
nts
Projected ADE Historical ADE Capacity
Area Effective Capacity/ Enrolment History and Projections
PE1
Note: 2010 includes all day 4 and 5 year olds
19
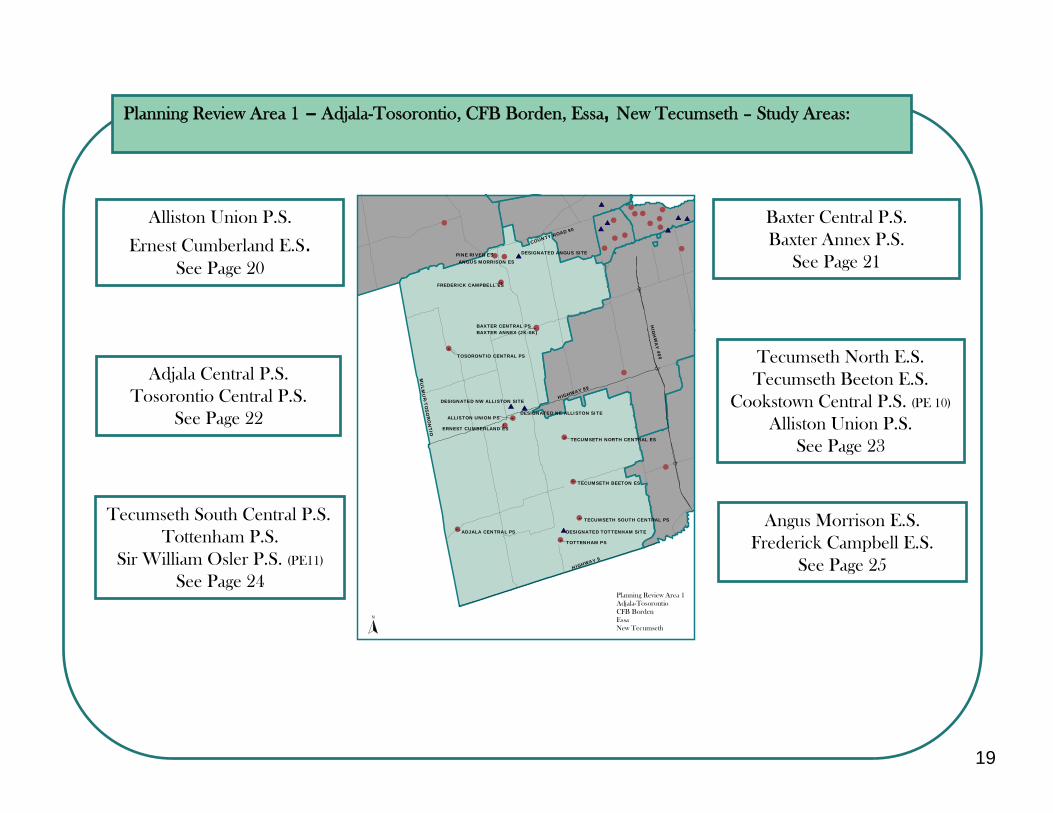
Planning Review Area 1 – Adjala-Tosorontio, CFB Borden, Essa, New Tecumseth – Study Areas:
Alliston Union P.S.
Ernest Cumberland E.S.See Page 20
Angus Morrison E.S.Frederick Campbell E.S.
See Page 25
Baxter Central P.S.Baxter Annex P.S.
See Page 21
Tecumseth North E.S.Tecumseth Beeton E.S.
Cookstown Central P.S. (PE 10)
Alliston Union P.S.See Page 23
Tecumseth South Central P.S.Tottenham P.S.
Sir William Osler P.S. (PE11)
See Page 24
Adjala Central P.S.Tosorontio Central P.S.
See Page 22 ##
#
#
#
#
#
#
#
#
#
#
#
#
# ##
#
##
#
#
#
#
#
#
#
#$T
$T
$T
$T
$T
$T$T
$T $T
$T
MU
LMU
R-T
OS
OR
ON
TIO
HIG
HW
AY
400HIGHWAY 89
HIGHWAY 9
COUNTY ROAD 90
#
FREDERICK CAMPBELL ES
#BAXTER CENTRAL PSBAXTER ANNEX (JK-SK)
#PINE RIVER ES
#
ERNEST CUMBERLAND ES
#
ADJALA CENTRAL PS# TOTTENHAM PS
# TECUMSETH SOUTH CENTRAL PS
# TECUMSETH BEETON ES
# TECUMSETH NORTH CENTRAL ES
#ALLISTON UNION PS
#
TOSORONTIO CENTRAL PS
DESIGNATED NE ALLISTON SITE
DESIGNATED NW ALLISTON SITE
DESIGNATED TOTTENHAM SITE
DESIGNATED ANGUS SITE
ANGUS MORRISON ES
N
Planning Review Area 1Adjala-TosorontioCFB BordenEssaNew Tecumseth
20
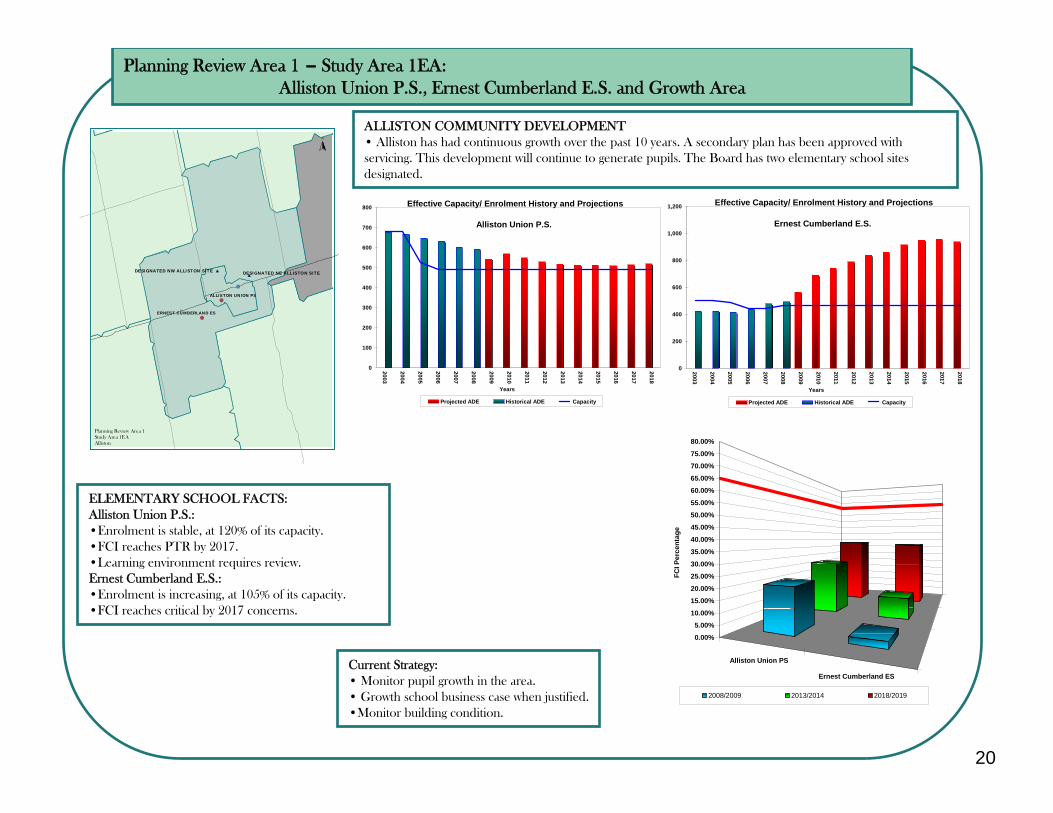
Planning Review Area 1 – Study Area 1EA:Alliston Union P.S., Ernest Cumberland E.S. and Growth Area
ALLISTON COMMUNITY DEVELOPMENT• Alliston has had continuous growth over the past 10 years. A secondary plan has been approved with servicing. This development will continue to generate pupils. The Board has two elementary school sites designated.
ELEMENTARY SCHOOL FACTS:Alliston Union P.S.:•Enrolment is stable, at 120% of its capacity.•FCI reaches PTR by 2017.•Learning environment requires review.Ernest Cumberland E.S.: •Enrolment is increasing, at 105% of its capacity.•FCI reaches critical by 2017 concerns.
Current Strategy:• Monitor pupil growth in the area. • Growth school business case when justified.•Monitor building condition.
#
#
#
$$
ALLISTON UNION PS
ERNEST CUMBERLAND ES
DESIGNATED NE ALLISTON SITEDESIGNATED NW ALLISTON SITE
N
Planning Review Area 1Study Area 1EAAlliston
Alliston Union PS
Ernest Cumberland ES
0.00%
5.00%
10.00%
15.00%
20.00%
25.00%
30.00%
35.00%
40.00%
45.00%
50.00%
55.00%
60.00%
65.00%
70.00%
75.00%
80.00%
FCI P
erce
ntag
e
2008/2009 2013/2014 2018/2019
0
100
200
300
400
500
600
700
800
2003
2004
2005
2006
2007
2008
2009
2010
2011
2012
2013
2014
2015
2016
2017
2018
Years
Projected ADE Historical ADE Capacity
Effective Capacity/ Enrolment History and Projections
Alliston Union P.S.
0
200
400
600
800
1,000
1,200
2003
2004
2005
2006
2007
2008
2009
2010
2011
2012
2013
2014
2015
2016
2017
2018
Years
Projected ADE Historical ADE Capacity
Effective Capacity/ Enrolment History and Projections
Ernest Cumberland E.S.
21
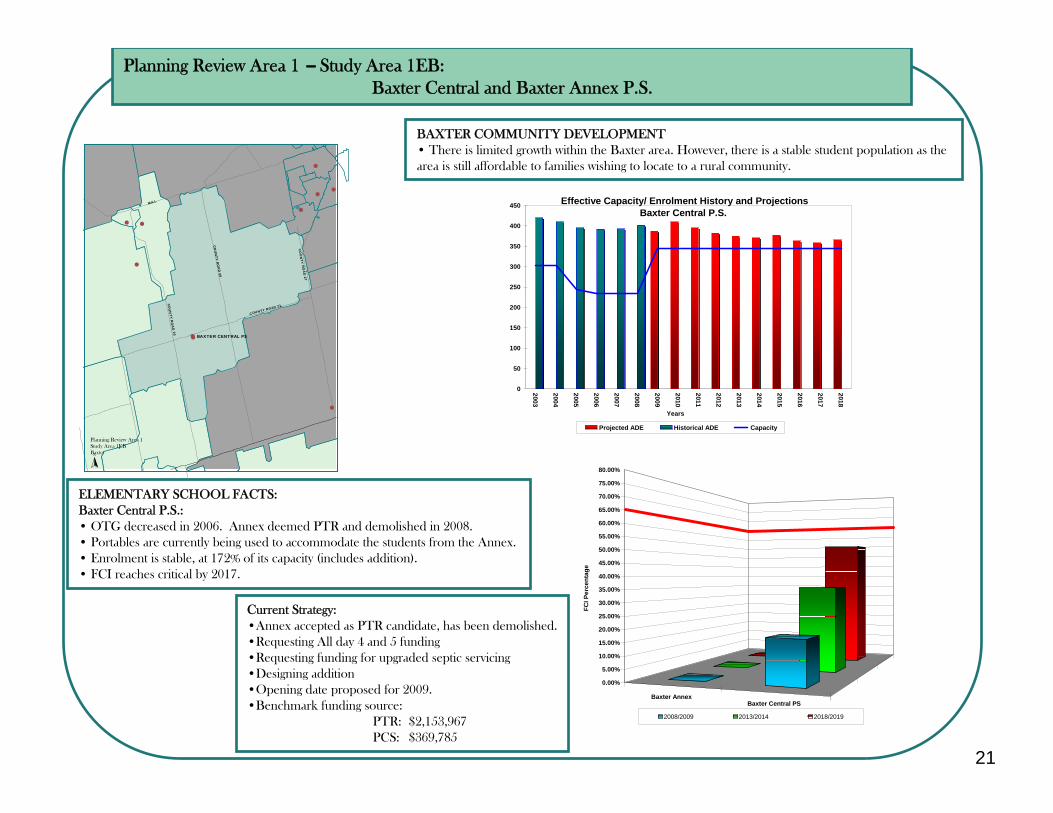
Planning Review Area 1 – Study Area 1EB:Baxter Central and Baxter Annex P.S.
BAXTER COMMUNITY DEVELOPMENT• There is limited growth within the Baxter area. However, there is a stable student population as the area is still affordable to families wishing to locate to a rural community.
ELEMENTARY SCHOOL FACTS:Baxter Central P.S.: • OTG decreased in 2006. Annex deemed PTR and demolished in 2008. • Portables are currently being used to accommodate the students from the Annex. • Enrolment is stable, at 172% of its capacity (includes addition).• FCI reaches critical by 2017.
Current Strategy:•Annex accepted as PTR candidate, has been demolished.•Requesting All day 4 and 5 funding•Requesting funding for upgraded septic servicing•Designing addition•Opening date proposed for 2009.•Benchmark funding source:
PTR: $2,153,967PCS: $369,785
#
#
#
#
#
#
#
#
#
#
#
BAXTER CENTRAL PS
COUNTY ROAD 21
CO
UN
TY
RO
AD
5 6
MILL
CO
UN
TY
RO
AD
2 7
CO
UN
TY
RO
AD
10
N
Planning Review Area 1Study Area 1EBBaxter
Baxter AnnexBaxter Central PS
0.00%
5.00%
10.00%
15.00%
20.00%
25.00%
30.00%
35.00%
40.00%
45.00%
50.00%
55.00%
60.00%
65.00%
70.00%
75.00%
80.00%
FCI P
erce
ntag
e
2008/2009 2013/2014 2018/2019
0
50
100
150
200
250
300
350
400
450
2003
2004
2005
2006
2007
2008
2009
2010
2011
2012
2013
2014
2015
2016
2017
2018
Years
Projected ADE Historical ADE Capacity
Effective Capacity/ Enrolment History and ProjectionsBaxter Central P.S.
22
Planning Review Area 1 – Study Area 1EC:Adjala Central P.S. and Tosorontio Central P.S.
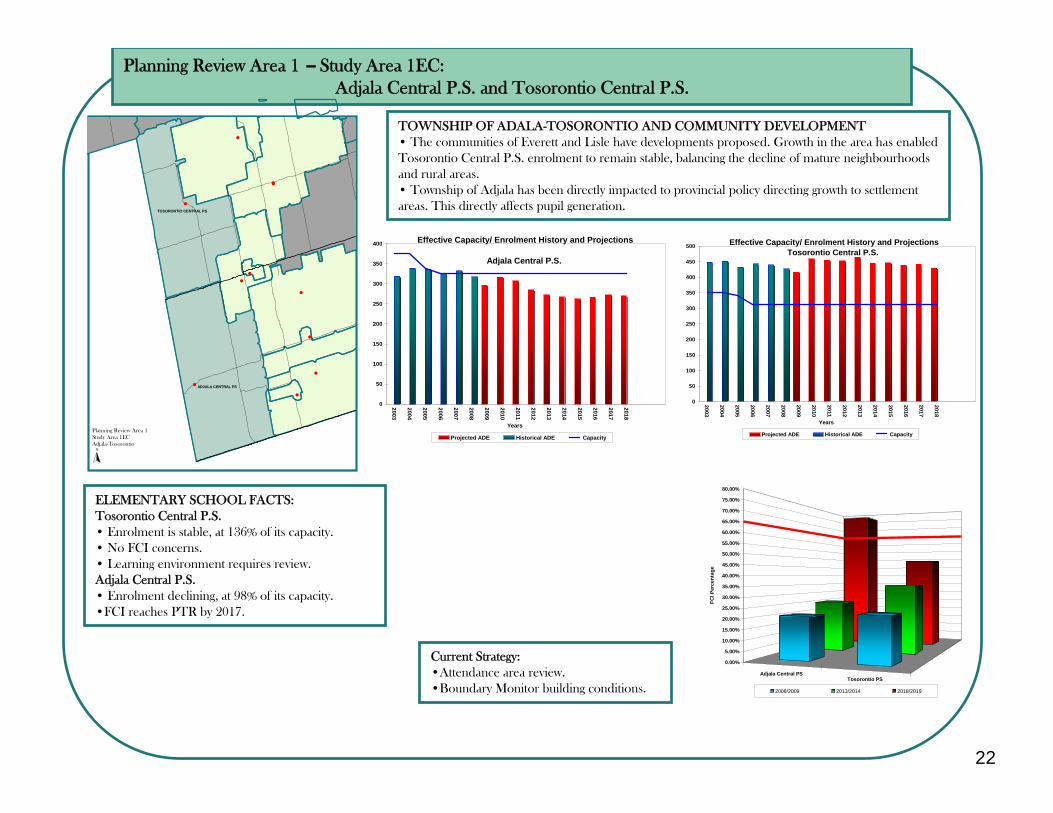
TOWNSHIP OF ADALA-TOSORONTIO AND COMMUNITY DEVELOPMENT• The communities of Everett and Lisle have developments proposed. Growth in the area has enabled Tosorontio Central P.S. enrolment to remain stable, balancing the decline of mature neighbourhoodsand rural areas.• Township of Adjala has been directly impacted to provincial policy directing growth to settlement areas. This directly affects pupil generation.
ELEMENTARY SCHOOL FACTS:Tosorontio Central P.S. • Enrolment is stable, at 136% of its capacity.• No FCI concerns.• Learning environment requires review.Adjala Central P.S.• Enrolment declining, at 98% of its capacity.•FCI reaches PTR by 2017.
Current Strategy:•Attendance area review.•Boundary Monitor building conditions.
Adjala Central PSTosorontio PS
0.00%
5.00%
10.00%
15.00%
20.00%
25.00%
30.00%
35.00%
40.00%
45.00%
50.00%
55.00%
60.00%
65.00%
70.00%
75.00%
80.00%
FCI P
erce
ntag
e
2008/2009 2013/2014 2018/2019
0
50
100
150
200
250
300
350
400
2003
2004
2005
2006
2007
2008
2009
2010
2011
2012
2013
2014
2015
2016
2017
2018Years
Projected ADE Historical ADE Capacity
Effective Capacity/ Enrolment History and Projections
Adjala Central P.S.
0
50
100
150
200
250
300
350
400
450
500
2003
2004
2005
2006
2007
2008
2009
2010
2011
2012
2013
2014
2015
2016
2017
2018
Years
Projected ADE Historical ADE Capacity
Effective Capacity/ Enrolment History and ProjectionsTosorontio Central P.S.
#
#
#
#
#
#
#
#
#
#
#
TOSORONTIO CENTRAL PS
ADJALA CENTRAL PS
Planning Review Area 1Study Area 1ECAdjala-Tosorontio
N
23
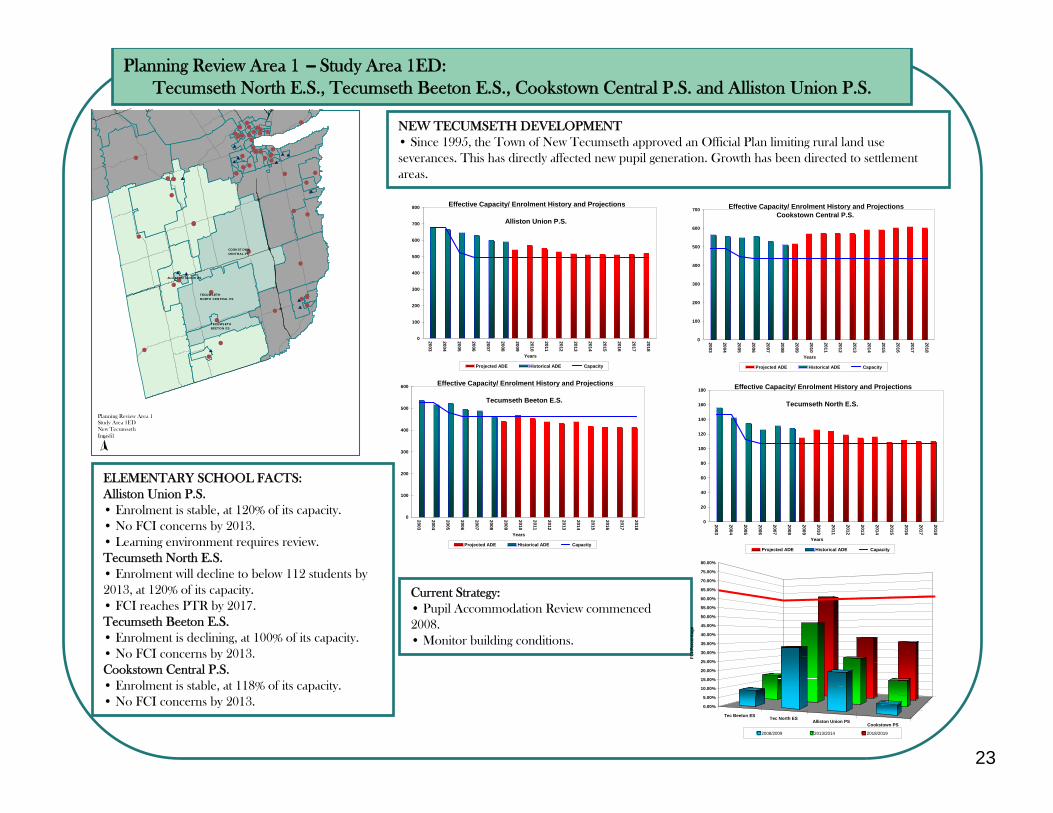
Planning Review Area 1 – Study Area 1ED:Tecumseth North E.S., Tecumseth Beeton E.S., Cookstown Central P.S. and Alliston Union P.S.
NEW TECUMSETH DEVELOPMENT• Since 1995, the Town of New Tecumseth approved an Official Plan limiting rural land use severances. This has directly affected new pupil generation. Growth has been directed to settlement areas.
ELEMENTARY SCHOOL FACTS:Alliston Union P.S. • Enrolment is stable, at 120% of its capacity.• No FCI concerns by 2013.• Learning environment requires review.Tecumseth North E.S.• Enrolment will decline to below 112 students by 2013, at 120% of its capacity.• FCI reaches PTR by 2017.Tecumseth Beeton E.S.• Enrolment is declining, at 100% of its capacity.• No FCI concerns by 2013.Cookstown Central P.S.• Enrolment is stable, at 118% of its capacity.• No FCI concerns by 2013.
Current Strategy:• Pupil Accommodation Review commenced 2008.• Monitor building conditions.
N
#
##
#
#
#
#
# #
##
#
#
#
#
#
####
#
#
#
#
#
#
#
####
#
#
#
# #
# ##
#
#
#
#
#
#
#
#
#
##
#
$
$
$
$
$
$
$$
$ $
$
$
$
COOKSTOWN CENTRAL PS
TECUMSETH NORTH CENTRAL ES
TECUMSETH BEETON ES
ALLISTON UNION PS
Planning Review Area 1Study Area 1EDNew TecumsethInnisfil
Tec Beeton ES Tec North ESAlliston Union PS
Cookstown PS
0.00%
5.00%
10.00%
15.00%
20.00%
25.00%
30.00%
35.00%
40.00%
45.00%
50.00%
55.00%
60.00%
65.00%
70.00%
75.00%
80.00%
FCI P
erce
ntag
e
2008/2009 2013/2014 2018/2019
0
100
200
300
400
500
600
700
800
2003
2004
2005
2006
2007
2008
2009
2010
2011
2012
2013
2014
2015
2016
2017
2018
Years
Projected ADE Historical ADE Capacity
Effective Capacity/ Enrolment History and Projections
Alliston Union P.S.
0
20
40
60
80
100
120
140
160
180
2003
2004
2005
2006
2007
2008
2009
2010
2011
2012
2013
2014
2015
2016
2017
2018
Years
Projected ADE Historical ADE Capacity
Effective Capacity/ Enrolment History and Projections
Tecumseth North E.S.
0
100
200
300
400
500
600
2003
2004
2005
2006
2007
2008
2009
2010
2011
2012
2013
2014
2015
2016
2017
2018
Years
Projected ADE Historical ADE Capacity
Effective Capacity/ Enrolment History and Projections
Tecumseth Beeton E.S.
0
100
200
300
400
500
600
700
2003
2004
2005
2006
2007
2008
2009
2010
2011
2012
2013
2014
2015
2016
2017
2018
Years
Projected ADE Historical ADE Capacity
Effective Capacity/ Enrolment History and ProjectionsCookstown Central P.S.
24
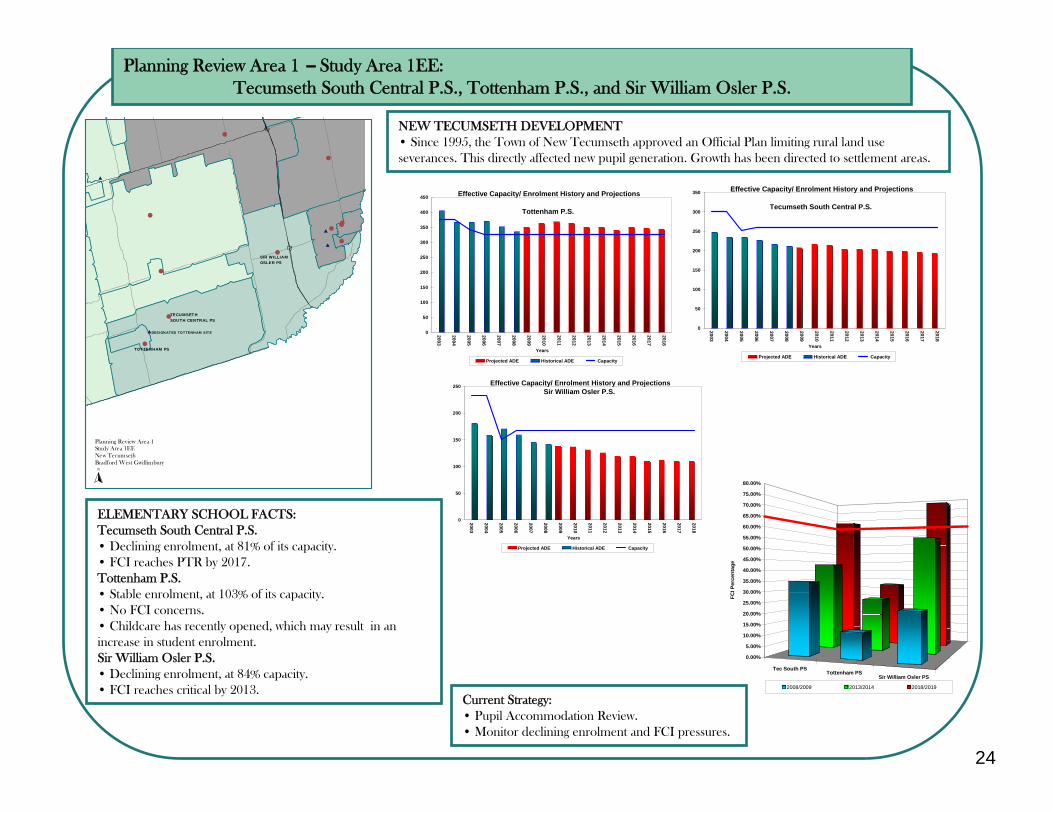
Planning Review Area 1 – Study Area 1EE:Tecumseth South Central P.S., Tottenham P.S., and Sir William Osler P.S.
NEW TECUMSETH DEVELOPMENT• Since 1995, the Town of New Tecumseth approved an Official Plan limiting rural land use severances. This directly affected new pupil generation. Growth has been directed to settlement areas.
ELEMENTARY SCHOOL FACTS:Tecumseth South Central P.S.• Declining enrolment, at 81% of its capacity.• FCI reaches PTR by 2017.Tottenham P.S.• Stable enrolment, at 103% of its capacity.• No FCI concerns.• Childcare has recently opened, which may result in an increase in student enrolment.Sir William Osler P.S.• Declining enrolment, at 84% capacity.• FCI reaches critical by 2013.
Current Strategy:• Pupil Accommodation Review.• Monitor declining enrolment and FCI pressures.
N
#
#
#
#
#
#
###
#
#
$
$
$
$
TECUMSETH SOUTH CENTRAL PS
SIR WILLIAM OSLER PS
TOTTENHAM PS
DESIGNATED TOTTENHAM SITE
Planning Review Area 1Study Area 1EENew TecumsethBradford West Gwillimbury
Tec South PSTottenham PS
Sir William Osler PS
0.00%
5.00%
10.00%
15.00%
20.00%
25.00%
30.00%
35.00%
40.00%
45.00%
50.00%
55.00%
60.00%
65.00%
70.00%
75.00%
80.00%
FCI P
erce
ntag
e
2008/2009 2013/2014 2018/2019
0
50
100
150
200
250
300
350
2003
2004
2005
2006
2007
2008
2009
2010
2011
2012
2013
2014
2015
2016
2017
2018
Years
Projected ADE Historical ADE Capacity
Effective Capacity/ Enrolment History and Projections
Tecumseth South Central P.S.
0
50
100
150
200
250
300
350
400
450
2003
2004
2005
2006
2007
2008
2009
2010
2011
2012
2013
2014
2015
2016
2017
2018
Years
Projected ADE Historical ADE Capacity
Effective Capacity/ Enrolment History and Projections
Tottenham P.S.
0
50
100
150
200
250
2003
2004
2005
2006
2007
2008
2009
2010
2011
2012
2013
2014
2015
2016
2017
2018
Years
Projected ADE Historical ADE Capacity
Effective Capacity/ Enrolment History and ProjectionsSir William Osler P.S.
25
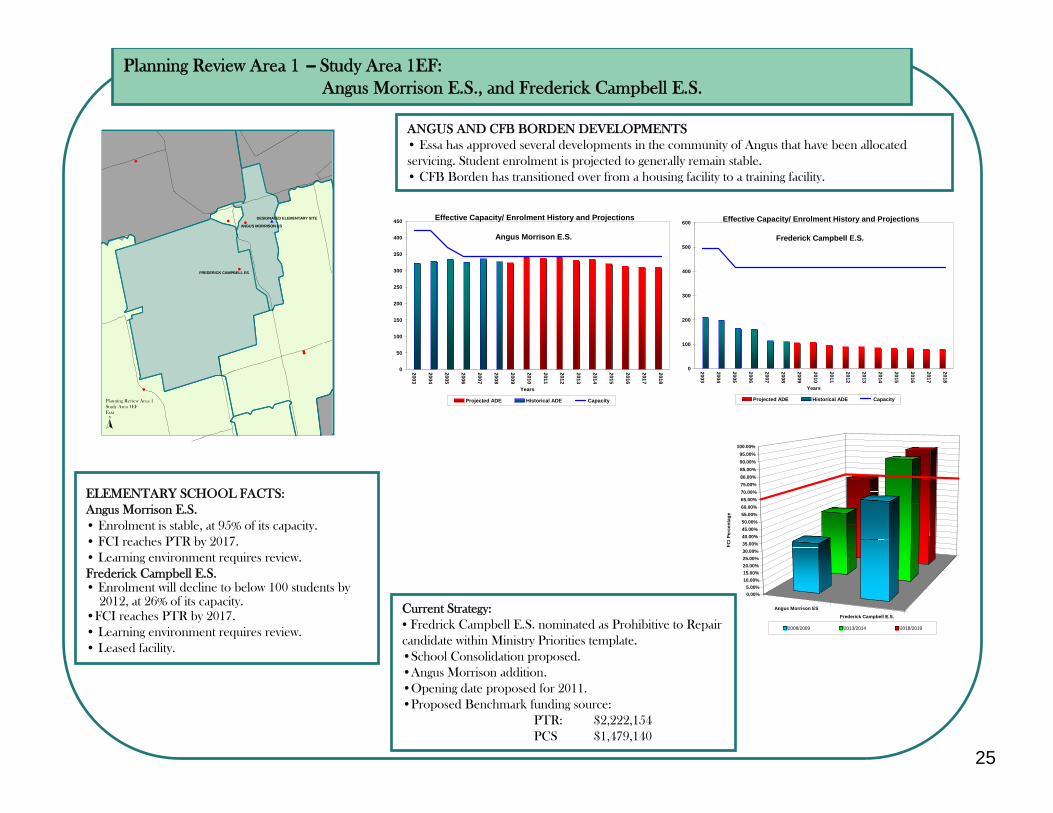
Planning Review Area 1 – Study Area 1EF:Angus Morrison E.S., and Frederick Campbell E.S.
ANGUS AND CFB BORDEN DEVELOPMENTS• Essa has approved several developments in the community of Angus that have been allocated servicing. Student enrolment is projected to generally remain stable. • CFB Borden has transitioned over from a housing facility to a training facility.
ELEMENTARY SCHOOL FACTS:Angus Morrison E.S.• Enrolment is stable, at 95% of its capacity.• FCI reaches PTR by 2017.• Learning environment requires review.Frederick Campbell E.S.• Enrolment will decline to below 100 students by
2012, at 26% of its capacity.•FCI reaches PTR by 2017.• Learning environment requires review.• Leased facility.
Current Strategy:• Fredrick Campbell E.S. nominated as Prohibitive to Repair candidate within Ministry Priorities template.•School Consolidation proposed.•Angus Morrison addition.•Opening date proposed for 2011.•Proposed Benchmark funding source:
PTR: $2,222,154PCS $1,479,140
0
50
100
150
200
250
300
350
400
450
2003
2004
2005
2006
2007
2008
2009
2010
2011
2012
2013
2014
2015
2016
2017
2018Years
Projected ADE Historical ADE Capacity
Effective Capacity/ Enrolment History and Projections
Angus Morrison E.S.
0
100
200
300
400
500
600
2003
2004
2005
2006
2007
2008
2009
2010
2011
2012
2013
2014
2015
2016
2017
2018
Years
Projected ADE Historical ADE Capacity
Effective Capacity/ Enrolment History and Projections
Frederick Campbell E.S.
#
#
#
#
#
#
#
$ANGUS MORRISON ES
FREDERICK CAMPBELL ES
DESIGNATED ELEMENTARY SITE
Planning Review Area 1Study Area 1EFEssa
N
Angus Morrison ES
Frederick Campbell E.S.
0.00%5.00%
10.00%15.00%20.00%25.00%30.00%35.00%40.00%45.00%50.00%55.00%60.00%65.00%70.00%75.00%80.00%85.00%90.00%95.00%
100.00%
FCI P
erce
ntag
e
2008/2009 2013/2014 2018/2019
26
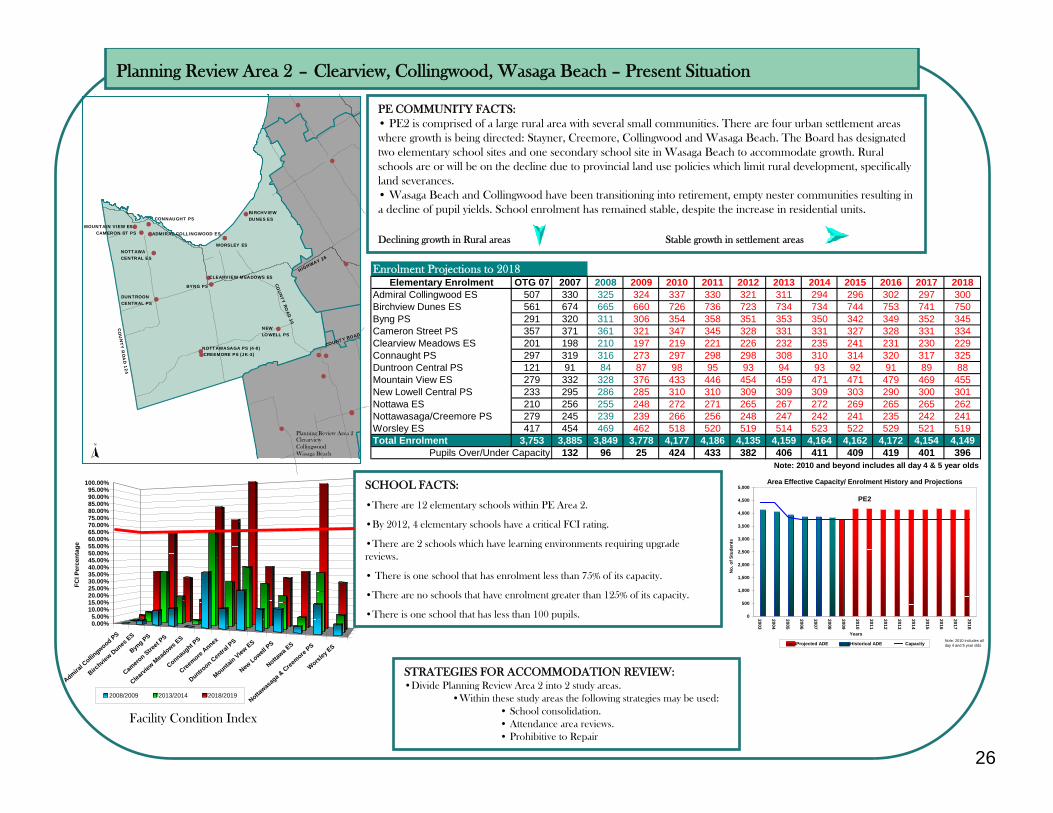
Planning Review Area 2 – Clearview, Collingwood, Wasaga Beach – Present Situation
Facility Condition Index
PE COMMUNITY FACTS:• PE2 is comprised of a large rural area with several small communities. There are four urban settlement areas where growth is being directed: Stayner, Creemore, Collingwood and Wasaga Beach. The Board has designated two elementary school sites and one secondary school site in Wasaga Beach to accommodate growth. Rural schools are or will be on the decline due to provincial land use policies which limit rural development, specifically land severances.• Wasaga Beach and Collingwood have been transitioning into retirement, empty nester communities resulting in a decline of pupil yields. School enrolment has remained stable, despite the increase in residential units.
Declining growth in Rural areas Stable growth in settlement areas
SCHOOL FACTS:
•There are 12 elementary schools within PE Area 2.
•By 2012, 4 elementary schools have a critical FCI rating.
•There are 2 schools which have learning environments requiring upgrade reviews.
• There is one school that has enrolment less than 75% of its capacity.
•There are no schools that have enrolment greater than 125% of its capacity.
•There is one school that has less than 100 pupils.
STRATEGIES FOR ACCOMMODATION REVIEW:•Divide Planning Review Area 2 into 2 study areas.
•Within these study areas the following strategies may be used:• School consolidation.• Attendance area reviews.• Prohibitive to Repair
N
#
#
#
#
#
#
##
#
#
#
##
#
#
#
#
#
#
#
#
#
CONNAUGHT PS
ADMIRAL COLLINGWOOD ES
NOTTAWA CENTRAL ES
CAMERON ST PSMOUNTAIN VIEW ES
BIRCHVIEW DUNES ES
WORSLEY ES
CLEARVIEW MEADOWS ES
BYNG PS
DUNTROON CENTRAL PS
NOTTAWASAGA PS (4-8)CREEMORE PS (JK-3)
NEW LOWELL PS
HIGHWAY 26
COU
NTY
ROAD
10
COUNTY ROAD
CO
UN
TY R
OA
D 1 24
Planning Review Area 2ClerarviewCollingwoodWasaga Beach
Enrolment Projections to 2018Elementary Enrolment OTG 07 2007 2008 2009 2010 2011 2012 2013 2014 2015 2016 2017 2018
Admiral Collingwood ES 507 330 325 324 337 330 321 311 294 296 302 297 300Birchview Dunes ES 561 674 665 660 726 736 723 734 734 744 753 741 750Byng PS 291 320 311 306 354 358 351 353 350 342 349 352 345Cameron Street PS 357 371 361 321 347 345 328 331 331 327 328 331 334Clearview Meadows ES 201 198 210 197 219 221 226 232 235 241 231 230 229Connaught PS 297 319 316 273 297 298 298 308 310 314 320 317 325Duntroon Central PS 121 91 84 87 98 95 93 94 93 92 91 89 88Mountain View ES 279 332 328 376 433 446 454 459 471 471 479 469 455New Lowell Central PS 233 295 286 285 310 310 309 309 309 303 290 300 301Nottawa ES 210 256 255 248 272 271 265 267 272 269 265 265 262Nottawasaga/Creemore PS 279 245 239 239 266 256 248 247 242 241 235 242 241Worsley ES 417 454 469 462 518 520 519 514 523 522 529 521 519Total Enrolment 3,753 3,885 3,849 3,778 4,177 4,186 4,135 4,159 4,164 4,162 4,172 4,154 4,149
132 96 25 424 433 382 406 411 409 419 401 396Note: 2010 and beyond includes all day 4 & 5 year olds
Pupils Over/Under Capacity
Admiral C
ollingwood PS
Birchvie
w Dunes ES
Byng PS
Camero
n Street P
S
Clearvi
ew M
eadows E
S
Connaught P
S
Creemore Annex
Duntroon Centra
l PS
Mountain View
ES
New Lowell
PS
Nottawa E
S
Nottawas
aga &
Creemore
PS
Worsley ES
0.00%5.00%
10.00%15.00%20.00%25.00%30.00%35.00%40.00%45.00%50.00%55.00%60.00%65.00%70.00%75.00%80.00%85.00%90.00%95.00%
100.00%
FCI P
erce
ntag
e
2008/2009 2013/2014 2018/2019
0
500
1,000
1,500
2,000
2,500
3,000
3,500
4,000
4,500
5,000
2003
2004
2005
2006
2007
2008
2009
2010
2011
2012
2013
2014
2015
2016
2017
2018
Years
No.
of S
tude
nts
Projected ADE Historical ADE Capacity
Area Effective Capacity/ Enrolment History and Projections
PE2
Note: 2010 includes all day 4 and 5 year olds
27
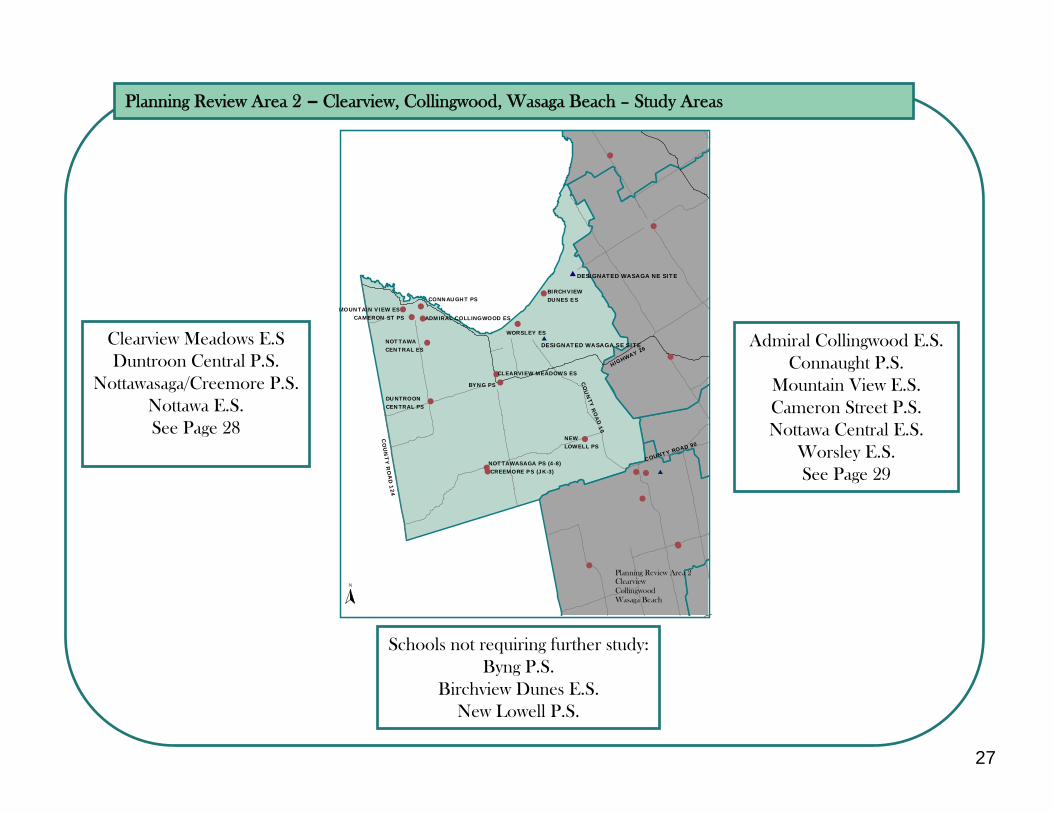
Planning Review Area 2 – Clearview, Collingwood, Wasaga Beach – Study Areas
Clearview Meadows E.SDuntroon Central P.S.
Nottawasaga/Creemore P.S.Nottawa E.S.See Page 28
Admiral Collingwood E.S.Connaught P.S.
Mountain View E.S.Cameron Street P.S.Nottawa Central E.S.
Worsley E.S.See Page 29
Schools not requiring further study:Byng P.S.
Birchview Dunes E.S.New Lowell P.S.
N
#
#
#
#
#
#
##
#
#
#
##
#
#
#
#
#
#
#
#
#
$
$
CONNAUGHT PS
ADMIRAL COLLINGWOOD ES
NOTTAWA CENTRAL ES
CAMERON ST PSMOUNTAIN VIEW ES
BIRCHVIEW DUNES ES
WORSLEY ES
CLEARVIEW MEADOWS ES
BYNG PS
DUNTROON CENTRAL PS
NOTTAWASAGA PS (4-8)CREEMORE PS (JK-3)
NEW LOWELL PS
HIGHWAY 26
CO
UN
TY R
OA
D 10
COUNTY ROAD 90
CO
UN
TY
RO
AD
124
DESIGNATED WASAGA SE SITE
DESIGNATED WASAGA NE SITE$
Planning Review Area 2ClearviewCollingwoodWasaga Beach
28
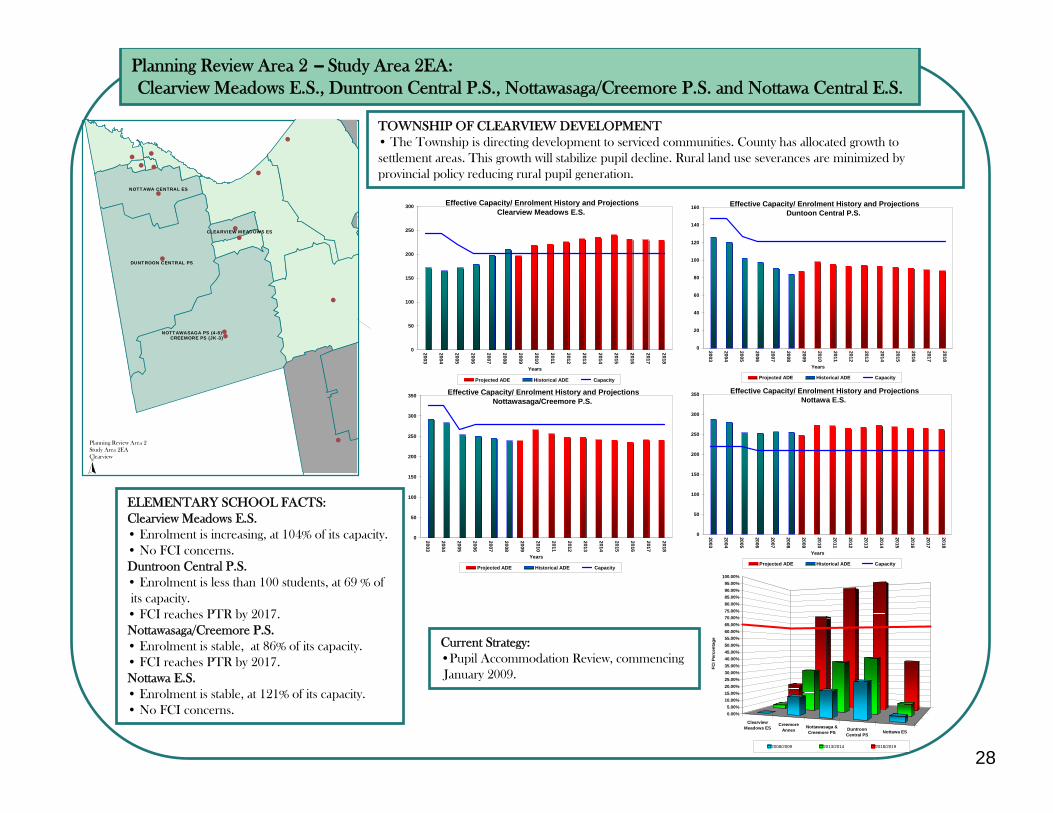
Planning Review Area 2 – Study Area 2EA:Clearview Meadows E.S., Duntroon Central P.S., Nottawasaga/Creemore P.S. and Nottawa Central E.S.
TOWNSHIP OF CLEARVIEW DEVELOPMENT• The Township is directing development to serviced communities. County has allocated growth to settlement areas. This growth will stabilize pupil decline. Rural land use severances are minimized by provincial policy reducing rural pupil generation.
ELEMENTARY SCHOOL FACTS:Clearview Meadows E.S.• Enrolment is increasing, at 104% of its capacity.• No FCI concerns.Duntroon Central P.S.• Enrolment is less than 100 students, at 69 % of its capacity.
• FCI reaches PTR by 2017.Nottawasaga/Creemore P.S.• Enrolment is stable, at 86% of its capacity.• FCI reaches PTR by 2017.Nottawa E.S.• Enrolment is stable, at 121% of its capacity.• No FCI concerns.
Current Strategy:•Pupil Accommodation Review, commencing January 2009.
Planning Review Area 2Study Area 2EAClearviewN
#
#
#
#
#
#
#
##
#
#
#
#
#
NOTTAWA CENTRAL ES
CLEARVIEW MEADOWS ES
DUNTROON CENTRAL PS
NOTTAWASAGA PS (4-8)CREEMORE PS (JK-3)
0
50
100
150
200
250
300
2003
2004
2005
2006
2007
2008
2009
2010
2011
2012
2013
2014
2015
2016
2017
2018
Years
Projected ADE Historical ADE Capacity
Effective Capacity/ Enrolment History and ProjectionsClearview Meadows E.S.
0
20
40
60
80
100
120
140
160
2003
2004
2005
2006
2007
2008
2009
2010
2011
2012
2013
2014
2015
2016
2017
2018
Years
Projected ADE Historical ADE Capacity
Effective Capacity/ Enrolment History and ProjectionsDuntoon Central P.S.
0
50
100
150
200
250
300
350
2003
2004
2005
2006
2007
2008
2009
2010
2011
2012
2013
2014
2015
2016
2017
2018
Years
Projected ADE Historical ADE Capacity
Effective Capacity/ Enrolment History and ProjectionsNottawasaga/Creemore P.S.
0
50
100
150
200
250
300
350
2003
2004
2005
2006
2007
2008
2009
2010
2011
2012
2013
2014
2015
2016
2017
2018
Years
Projected ADE Historical ADE Capacity
Effective Capacity/ Enrolment History and ProjectionsNottawa E.S.
ClearviewMeadows ES
CreemoreAnnex
Nottawasaga &Creemore PS
DuntroonCentral PS Nottawa ES
0.00%5.00%
10.00%15.00%20.00%25.00%30.00%35.00%40.00%45.00%50.00%55.00%60.00%65.00%70.00%75.00%80.00%85.00%90.00%95.00%
100.00%
FCI P
erce
ntag
e
2008/2009 2013/2014 2018/2019
29
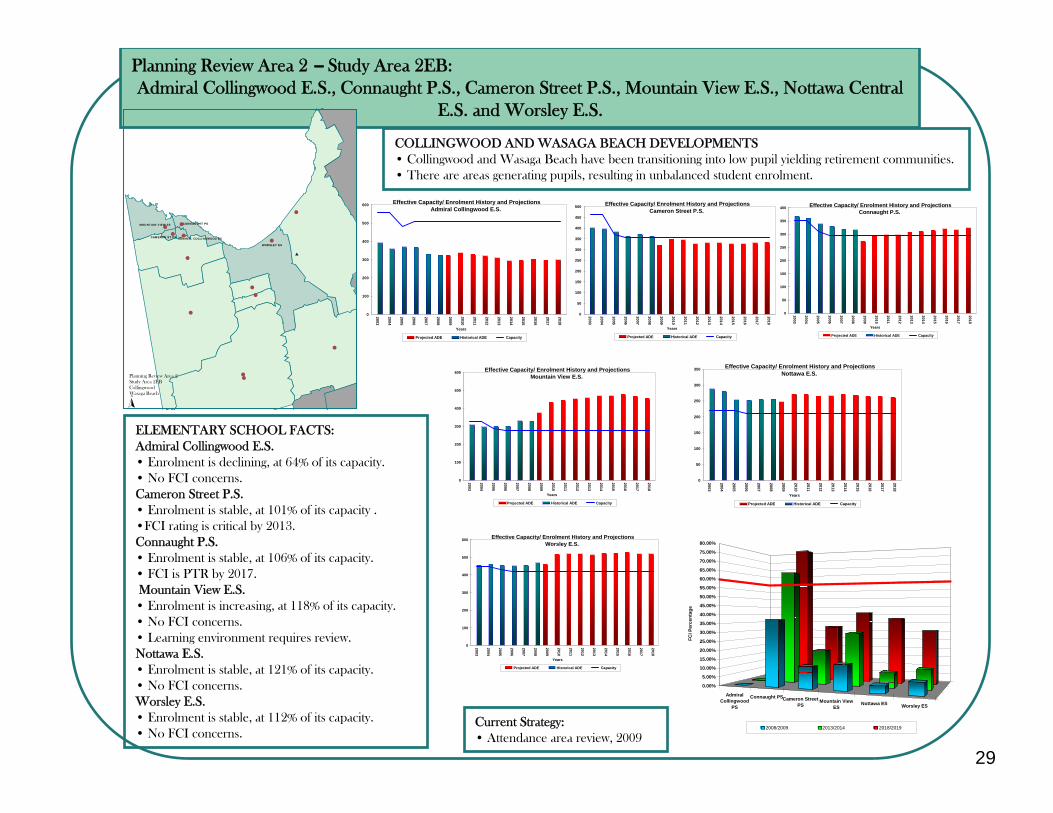
Planning Review Area 2 – Study Area 2EB:Admiral Collingwood E.S., Connaught P.S., Cameron Street P.S., Mountain View E.S., Nottawa Central
E.S. and Worsley E.S.
COLLINGWOOD AND WASAGA BEACH DEVELOPMENTS• Collingwood and Wasaga Beach have been transitioning into low pupil yielding retirement communities.• There are areas generating pupils, resulting in unbalanced student enrolment.
ELEMENTARY SCHOOL FACTS:Admiral Collingwood E.S.• Enrolment is declining, at 64% of its capacity.• No FCI concerns.Cameron Street P.S.• Enrolment is stable, at 101% of its capacity .•FCI rating is critical by 2013.Connaught P.S.• Enrolment is stable, at 106% of its capacity.• FCI is PTR by 2017.Mountain View E.S.
• Enrolment is increasing, at 118% of its capacity.• No FCI concerns.• Learning environment requires review.Nottawa E.S.• Enrolment is stable, at 121% of its capacity.• No FCI concerns.Worsley E.S.• Enrolment is stable, at 112% of its capacity.• No FCI concerns.
Current Strategy:• Attendance area review, 2009
#
#
##
#
#
#
##
#
#
#
#
$
CONNAUGHT PS
ADMIRAL COLLINGWOOD ESCAMERON ST PS
MOUNTAIN VIEW ES
WORSLEY ES
Planning Review Area 2Study Area 2EBCollingwoodWasaga BeachN
0
100
200
300
400
500
600
2003
2004
2005
2006
2007
2008
2009
2010
2011
2012
2013
2014
2015
2016
2017
2018
Years
Projected ADE Historical ADE Capacity
Effective Capacity/ Enrolment History and ProjectionsAdmiral Collingwood E.S.
0
50
100
150
200
250
300
350
400
2003
2004
2005
2006
2007
2008
2009
2010
2011
2012
2013
2014
2015
2016
2017
2018
Years
Projected ADE Historical ADE Capacity
Effective Capacity/ Enrolment History and ProjectionsConnaught P.S.
0
100
200
300
400
500
600
2003
2004
2005
2006
2007
2008
2009
2010
2011
2012
2013
2014
2015
2016
2017
2018
Years
Projected ADE Historical ADE Capacity
Effective Capacity/ Enrolment History and ProjectionsMountain View E.S.
0
50
100
150
200
250
300
350
400
450
500
2003
2004
2005
2006
2007
2008
2009
2010
2011
2012
2013
2014
2015
2016
2017
2018
Years
Projected ADE Historical ADE Capacity
Effective Capacity/ Enrolment History and ProjectionsCameron Street P.S.
0
100
200
300
400
500
600
2003
2004
2005
2006
2007
2008
2009
2010
2011
2012
2013
2014
2015
2016
2017
2018
Years
Projected ADE Historical ADE Capacity
Effective Capacity/ Enrolment History and ProjectionsWorsley E.S.
0
50
100
150
200
250
300
350
2003
2004
2005
2006
2007
2008
2009
2010
2011
2012
2013
2014
2015
2016
2017
2018
Years
Projected ADE Historical ADE Capacity
Effective Capacity/ Enrolment History and ProjectionsNottawa E.S.
AdmiralCollingwood
PS
Connaught PSCameron StreetPS
Mountain ViewES
Nottawa ES Worsley ES
0.00%
5.00%
10.00%
15.00%
20.00%
25.00%
30.00%
35.00%
40.00%
45.00%
50.00%
55.00%
60.00%
65.00%
70.00%
75.00%
80.00%
FCI P
erce
ntag
e
2008/2009 2013/2014 2018/2019
30
Planning Review Area 3 – Tay, Tiny, Midland, Penetanguishene – Present Situation
Facility Condition Index
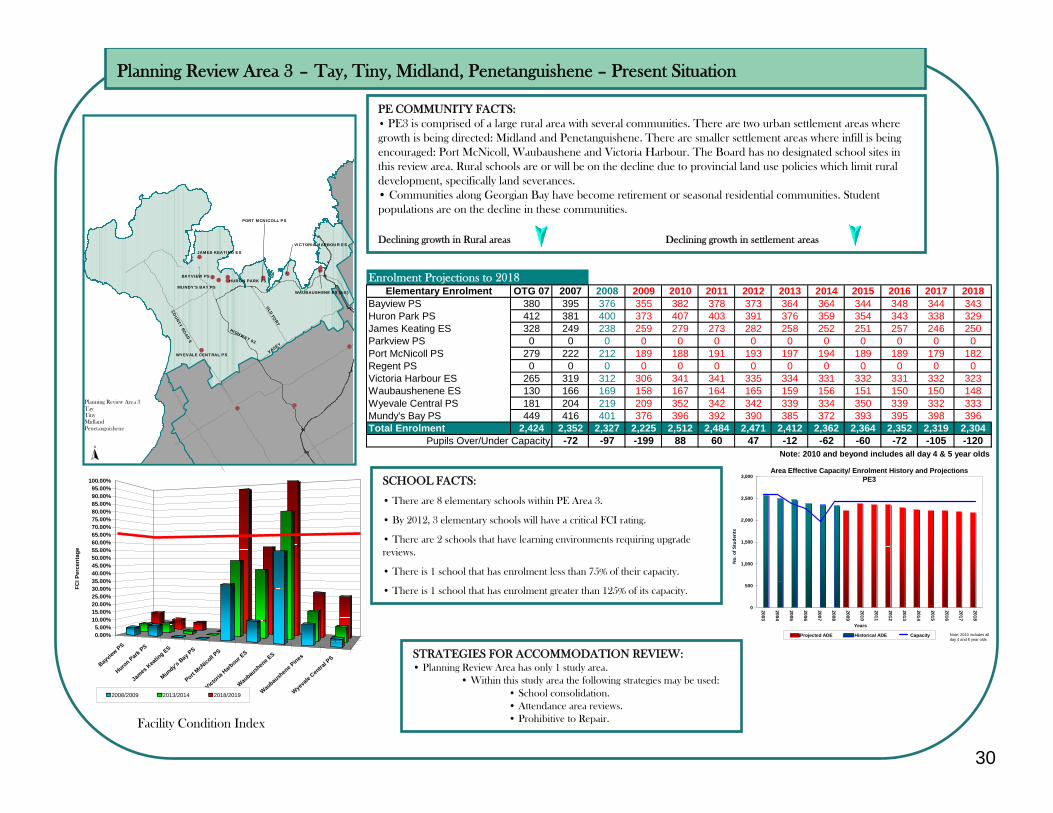
PE COMMUNITY FACTS:• PE3 is comprised of a large rural area with several communities. There are two urban settlement areas where growth is being directed: Midland and Penetanguishene. There are smaller settlement areas where infill is being encouraged: Port McNicoll, Waubaushene and Victoria Harbour. The Board has no designated school sites in this review area. Rural schools are or will be on the decline due to provincial land use policies which limit rural development, specifically land severances.• Communities along Georgian Bay have become retirement or seasonal residential communities. Student populations are on the decline in these communities.
Declining growth in Rural areas Declining growth in settlement areas
SCHOOL FACTS:
• There are 8 elementary schools within PE Area 3.
• By 2012, 3 elementary schools will have a critical FCI rating.
• There are 2 schools that have learning environments requiring upgrade reviews.
• There is 1 school that has enrolment less than 75% of their capacity.
• There is 1 school that has enrolment greater than 125% of its capacity.
STRATEGIES FOR ACCOMMODATION REVIEW:• Planning Review Area has only 1 study area.
• Within this study area the following strategies may be used:• School consolidation.• Attendance area reviews.• Prohibitive to Repair.
N
Planning Review Area 3TayTiny MidlandPenetanguishene
##
#
##
#
#
##
# #
#
#
JAMES KEATING ES
BAYVIEW PS
MUNDY'S BAY PSHURON PARK PS
#
VICTORIA HARBOUR ES
#
WAUBAUSHENE ES (4-8)
#
PORT MCNICOLL PS
VASEY
HIGHWAY 93
OLD
FOR
T
COUN
TY ROAD 6
WYEVALE CENTRAL PS
Enrolment Projections to 2018Elementary Enrolment OTG 07 2007 2008 2009 2010 2011 2012 2013 2014 2015 2016 2017 2018
Bayview PS 380 395 376 355 382 378 373 364 364 344 348 344 343Huron Park PS 412 381 400 373 407 403 391 376 359 354 343 338 329James Keating ES 328 249 238 259 279 273 282 258 252 251 257 246 250Parkview PS 0 0 0 0 0 0 0 0 0 0 0 0 0Port McNicoll PS 279 222 212 189 188 191 193 197 194 189 189 179 182Regent PS 0 0 0 0 0 0 0 0 0 0 0 0 0Victoria Harbour ES 265 319 312 306 341 341 335 334 331 332 331 332 323Waubaushenene ES 130 166 169 158 167 164 165 159 156 151 150 150 148Wyevale Central PS 181 204 219 209 352 342 342 339 334 350 339 332 333Mundy's Bay PS 449 416 401 376 396 392 390 385 372 393 395 398 396Total Enrolment 2,424 2,352 2,327 2,225 2,512 2,484 2,471 2,412 2,362 2,364 2,352 2,319 2,304
-72 -97 -199 88 60 47 -12 -62 -60 -72 -105 -120Note: 2010 and beyond includes all day 4 & 5 year olds
Pupils Over/Under Capacity
Bayview PS
Huron Park PS
James Keatin
g ES
Mundy's Bay P
S
Port McN
icoll PS
Victoria Harbour E
S
Waubaushene E
S
Waubaushene Pines
Wyevale
Central P
S
0.00%5.00%
10.00%15.00%20.00%25.00%30.00%35.00%40.00%45.00%50.00%55.00%60.00%65.00%70.00%75.00%80.00%85.00%90.00%95.00%
100.00%
FCI P
erce
ntag
e
2008/2009 2013/2014 2018/2019
0
500
1,000
1,500
2,000
2,500
3,000
2003
2004
2005
2006
2007
2008
2009
2010
2011
2012
2013
2014
2015
2016
2017
2018
Years
No.
of S
tude
nts
Projected ADE Historical ADE Capacity
Area Effective Capacity/ Enrolment History and ProjectionsPE3
Note: 2010 includes all day 4 and 5 year olds
31
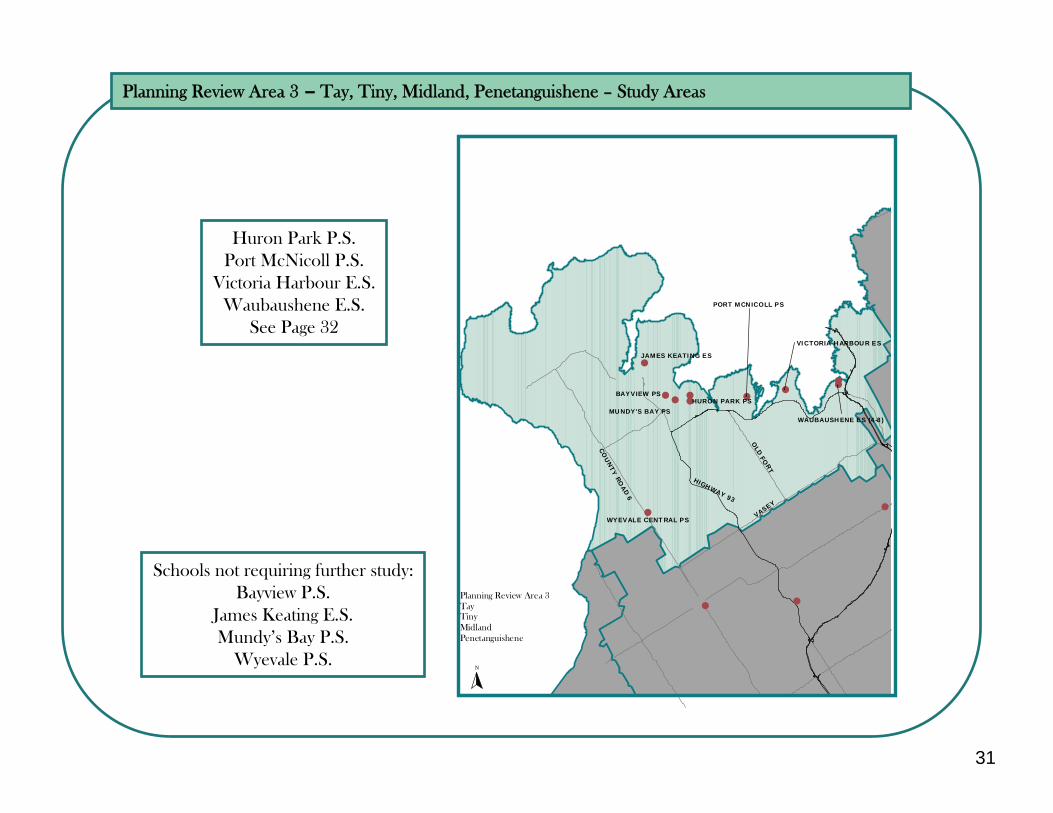
Planning Review Area 3 – Tay, Tiny, Midland, Penetanguishene – Study Areas
Huron Park P.S.Port McNicoll P.S.
Victoria Harbour E.S.Waubaushene E.S.
See Page 32
Schools not requiring further study:Bayview P.S.
James Keating E.S.Mundy’s Bay P.S.
Wyevale P.S.N
Planning Review Area 3TayTiny MidlandPenetanguishene
##
#
##
#
#
##
# #
#
#
JAMES KEATING ES
BAYVIEW PS
MUNDY'S BAY PSHURON PARK PS
#
VICTORIA HARBOUR ES
#
WAUBAUSHENE ES (4-8)
#
PORT MCNICOLL PS
VASEY
HIGHWAY 93
OLD
FOR
T
COU
NTY
ROAD
6
WYEVALE CENTRAL PS
32
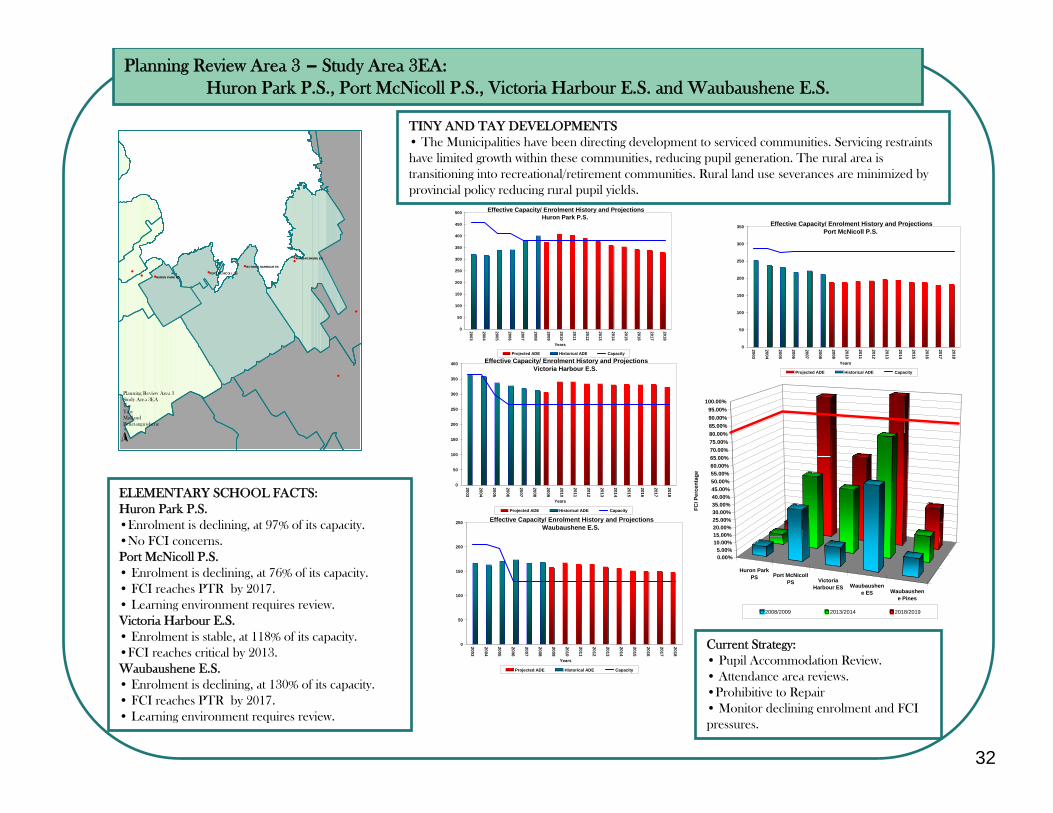
Planning Review Area 3 – Study Area 3EA:Huron Park P.S., Port McNicoll P.S., Victoria Harbour E.S. and Waubaushene E.S.
TINY AND TAY DEVELOPMENTS• The Municipalities have been directing development to serviced communities. Servicing restraints have limited growth within these communities, reducing pupil generation. The rural area is transitioning into recreational/retirement communities. Rural land use severances are minimized by provincial policy reducing rural pupil yields.
ELEMENTARY SCHOOL FACTS:Huron Park P.S.•Enrolment is declining, at 97% of its capacity.•No FCI concerns.Port McNicoll P.S.• Enrolment is declining, at 76% of its capacity.• FCI reaches PTR by 2017.• Learning environment requires review.Victoria Harbour E.S.• Enrolment is stable, at 118% of its capacity.•FCI reaches critical by 2013.Waubaushene E.S.• Enrolment is declining, at 130% of its capacity.• FCI reaches PTR by 2017.• Learning environment requires review.
Current Strategy:• Pupil Accommodation Review.• Attendance area reviews.•Prohibitive to Repair• Monitor declining enrolment and FCI pressures.
0
50
100
150
200
250
300
350
2003
2004
2005
2006
2007
2008
2009
2010
2011
2012
2013
2014
2015
2016
2017
2018
Years
Projected ADE Historical ADE Capacity
Effective Capacity/ Enrolment History and ProjectionsPort McNicoll P.S.
0
50
100
150
200
250
300
350
400
2003
2004
2005
2006
2007
2008
2009
2010
2011
2012
2013
2014
2015
2016
2017
2018
Years
Projected ADE Historical ADE Capacity
Effective Capacity/ Enrolment History and ProjectionsVictoria Harbour E.S.
0
50
100
150
200
250
2003
2004
2005
2006
2007
2008
2009
2010
2011
2012
2013
2014
2015
2016
2017
2018
Years
Projected ADE Historical ADE Capacity
Effective Capacity/ Enrolment History and ProjectionsWaubaushene E.S.
0
50
100
150
200
250
300
350
400
450
500
2003
2004
2005
2006
2007
2008
2009
2010
2011
2012
2013
2014
2015
2016
2017
2018
Years
Projected ADE Historical ADE Capacity
Effective Capacity/ Enrolment History and ProjectionsHuron Park P.S.
#
#
#
#
#
#
#
#
#
HURON PARK PSPORT MCNICOLL PS
VICTORIA HARBOUR ES
WAUBAUSHENE ES
N
Planning Review Area 3Study Area 3EATayTinyMidlandPenetanguishene
Huron ParkPS Port McNicoll
PS VictoriaHarbour ES Waubaushen
e ES Waubaushene Pines
0.00%5.00%
10.00%15.00%20.00%25.00%30.00%35.00%40.00%45.00%50.00%55.00%60.00%65.00%70.00%75.00%80.00%85.00%90.00%95.00%
100.00%
FCI P
erce
ntag
e
2008/2009 2013/2014 2018/2019
33
Planning Review Area 4 – Severn, Ramara, Orillia – Present Situation
Facility Condition Index
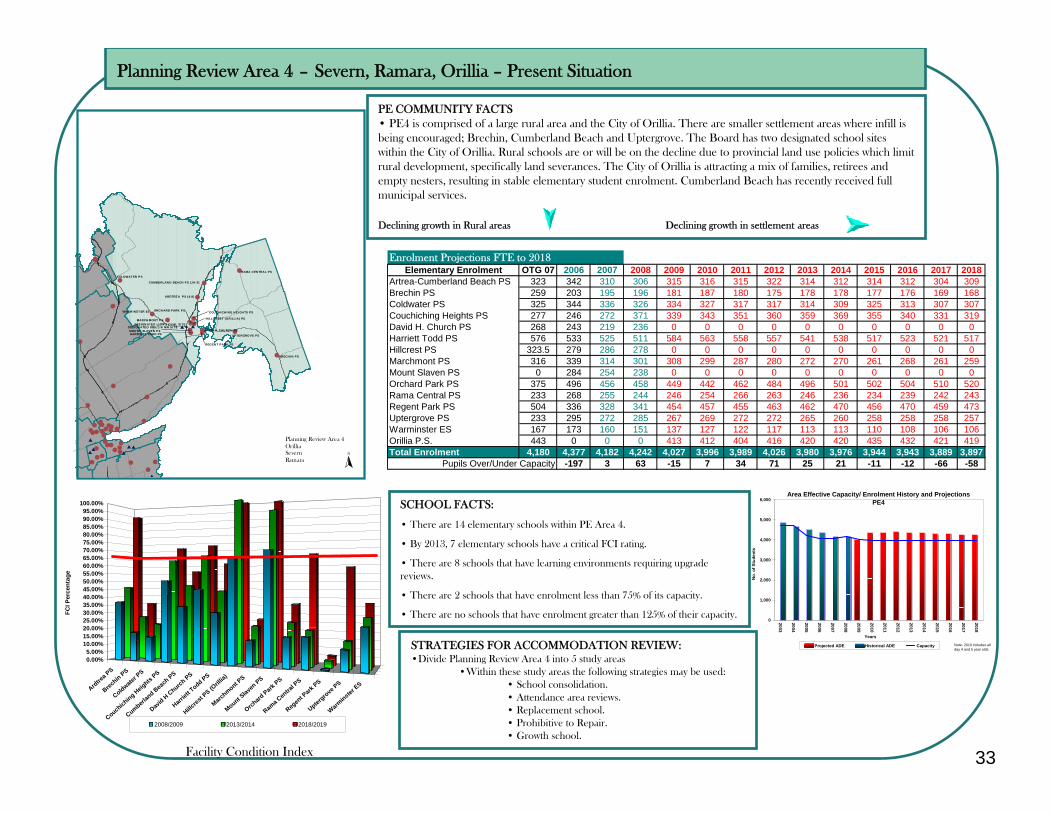
PE COMMUNITY FACTS• PE4 is comprised of a large rural area and the City of Orillia. There are smaller settlement areas where infill is being encouraged; Brechin, Cumberland Beach and Uptergrove. The Board has two designated school sites within the City of Orillia. Rural schools are or will be on the decline due to provincial land use policies which limit rural development, specifically land severances. The City of Orillia is attracting a mix of families, retirees and empty nesters, resulting in stable elementary student enrolment. Cumberland Beach has recently received full municipal services.
Declining growth in Rural areas Declining growth in settlement areas
STRATEGIES FOR ACCOMMODATION REVIEW:•Divide Planning Review Area 4 into 5 study areas
•Within these study areas the following strategies may be used:• School consolidation.• Attendance area reviews.• Replacement school.• Prohibitive to Repair.• Growth school.
SCHOOL FACTS:
• There are 14 elementary schools within PE Area 4.
• By 2013, 7 elementary schools have a critical FCI rating.
• There are 8 schools that have learning environments requiring upgrade reviews.
• There are 2 schools that have enrolment less than 75% of its capacity.
• There are no schools that have enrolment greater than 125% of their capacity.
#
#
#
# #
#
#
#
#
#
##
#
#
#
#
# ##
#
#
#
####
#
##
##
# ##
#
#
###
## ##
#
#
#
#
#
##
#
$
$
$
$$
$$
$ $
COLDWATER PS
WARMINSTER ES
RAMA CENTRAL PS
CUMBERLAND BEACH PS (JK-3)
ARDTREA PS (4-8)
BRECHIN PS
UPTERGROVE PS
DAVID H CHURCH PS#HARRIETT TODD PS
#MOUNT SLAVEN PS
#
HILLCREST (ORILLIA) PS#
COUCHICHING HEIGHTS PS
#
ORCHARD PARK PS
MARCHMONT PS
#
REGENT PARK PS
DESIGNATED ORILLIA NW SITEDESIGNATED LION'S OVAL SITE
Planning Review Area 4OrilliaSevernRamara
N
Ardtrea P
S
Brechin PS
Coldwater P
S
Couchiching Heig
hts PS
Cumberlan
d Beach
PS
David H Church PS
Harriett T
odd PS
Hillcrest
PS (Orill
ia)
Marchmont PS
Mount Slave
n PS
Orchard
Park PS
Rama Cen
tral P
S
Regen
t Park
PS
Uptergrove PS
Warminster
ES
0.00%5.00%
10.00%15.00%20.00%25.00%30.00%35.00%40.00%45.00%50.00%55.00%60.00%65.00%70.00%75.00%80.00%85.00%90.00%95.00%
100.00%
FCI P
erce
ntag
e
2008/2009 2013/2014 2018/2019
0
1,000
2,000
3,000
4,000
5,000
6,000
2003
2004
2005
2006
2007
2008
2009
2010
2011
2012
2013
2014
2015
2016
2017
2018
Years
No.
of S
tude
nts
Projected ADE Historical ADE Capacity
Area Effective Capacity/ Enrolment History and ProjectionsPE4
Note: 2010 includes all day 4 and 5 year olds
Enrolment Projections FTE to 2018Elementary Enrolment OTG 07 2006 2007 2008 2009 2010 2011 2012 2013 2014 2015 2016 2017 2018
Artrea-Cumberland Beach PS 323 342 310 306 315 316 315 322 314 312 314 312 304 309Brechin PS 259 203 195 196 181 187 180 175 178 178 177 176 169 168Coldwater PS 325 344 336 326 334 327 317 317 314 309 325 313 307 307Couchiching Heights PS 277 246 272 371 339 343 351 360 359 369 355 340 331 319David H. Church PS 268 243 219 236 0 0 0 0 0 0 0 0 0 0Harriett Todd PS 576 533 525 511 584 563 558 557 541 538 517 523 521 517Hillcrest PS 323.5 279 286 278 0 0 0 0 0 0 0 0 0 0Marchmont PS 316 339 314 301 308 299 287 280 272 270 261 268 261 259Mount Slaven PS 0 284 254 238 0 0 0 0 0 0 0 0 0 0Orchard Park PS 375 496 456 458 449 442 462 484 496 501 502 504 510 520Rama Central PS 233 268 255 244 246 254 266 263 246 236 234 239 242 243Regent Park PS 504 336 328 341 454 457 455 463 462 470 456 470 459 473Uptergrove PS 233 295 272 285 267 269 272 272 265 260 258 258 258 257Warminster ES 167 173 160 151 137 127 122 117 113 113 110 108 106 106Orillia P.S. 443 0 0 0 413 412 404 416 420 420 435 432 421 419Total Enrolment 4,180 4,377 4,182 4,242 4,027 3,996 3,989 4,026 3,980 3,976 3,944 3,943 3,889 3,897
-197 3 63 -15 7 34 71 25 21 -11 -12 -66 -58Pupils Over/Under Capacity
34
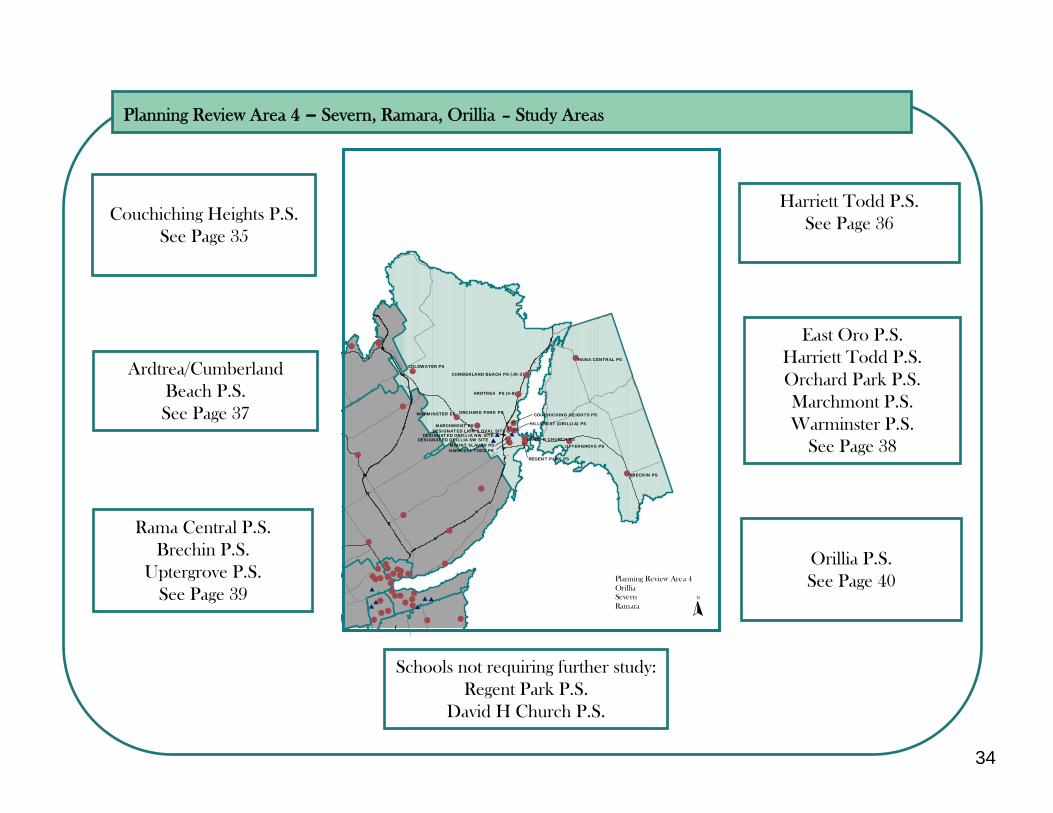
Planning Review Area 4 – Severn, Ramara, Orillia – Study Areas
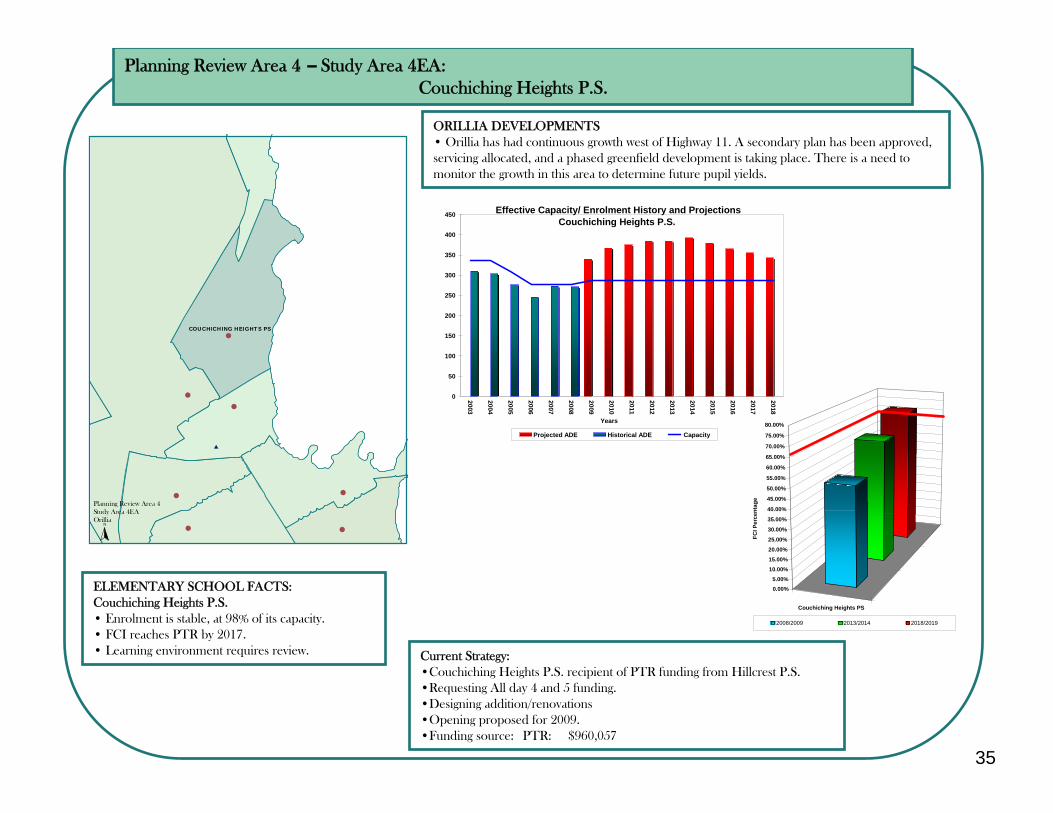
Couchiching Heights P.S.See Page 35
Rama Central P.S.Brechin P.S.
Uptergrove P.S.See Page 39
Harriett Todd P.S.See Page 36
Ardtrea/Cumberland Beach P.S.See Page 37
Schools not requiring further study:Regent Park P.S.
David H Church P.S.
East Oro P.S.Harriett Todd P.S.Orchard Park P.S.Marchmont P.S.Warminster P.S.
See Page 38
# #
#
#
# #
#
#
#
#
#
##
#
#
#
#
# #
#
#
#
####
#
##
##
# ##
#
#
###
## ##
#
#
#
#
#
##
#$
$
$$
$$
$ $
COLDWATER PS
WARMINSTER ES
RAMA CENTRAL PS
CUMBERLAND BEACH PS (JK-3)
ARDTREA PS (4-8)
BRECHIN PS
UPTERGROVE PSDAVID H CHURCH PS
#
HILLCREST (ORILLIA) PS#
COUCHICHING HEIGHTS PS
#
ORCHARD PARK PS
MARCHMONT PS
#
REGENT PARK PS
DESIGNATED ORILLIA NW SITEDESIGNATED LION'S OVAL SITE
DESIGNATED ORILLIA SW SITE $
HARRIETT TODD PSMOUNT SLAVEN PS
Planning Review Area 4OrilliaSevernRamara
N
Orillia P.S.See Page 40
35
Planning Review Area 4 – Study Area 4EA:Couchiching Heights P.S.
ORILLIA DEVELOPMENTS• Orillia has had continuous growth west of Highway 11. A secondary plan has been approved, servicing allocated, and a phased greenfield development is taking place. There is a need to monitor the growth in this area to determine future pupil yields.
ELEMENTARY SCHOOL FACTS:Couchiching Heights P.S.• Enrolment is stable, at 98% of its capacity.• FCI reaches PTR by 2017.• Learning environment requires review. Current Strategy:
•Couchiching Heights P.S. recipient of PTR funding from Hillcrest P.S.•Requesting All day 4 and 5 funding.•Designing addition/renovations•Opening proposed for 2009.•Funding source: PTR: $960,057
#
#
#
#
#
#
#
$
COUCHICHING HEIGHTS PS
N
Planning Review Area 4Study Area 4EAOrillia
Couchiching Heights PS
0.00%5.00%
10.00%
15.00%
20.00%
25.00%
30.00%
35.00%
40.00%
45.00%
50.00%
55.00%
60.00%
65.00%
70.00%
75.00%
80.00%
FCI P
erce
ntag
e
2008/2009 2013/2014 2018/2019
0
50
100
150
200
250
300
350
400
450
2003
2004
2005
2006
2007
2008
2009
2010
2011
2012
2013
2014
2015
2016
2017
2018
Years
Projected ADE Historical ADE Capacity
Effective Capacity/ Enrolment History and ProjectionsCouchiching Heights P.S.
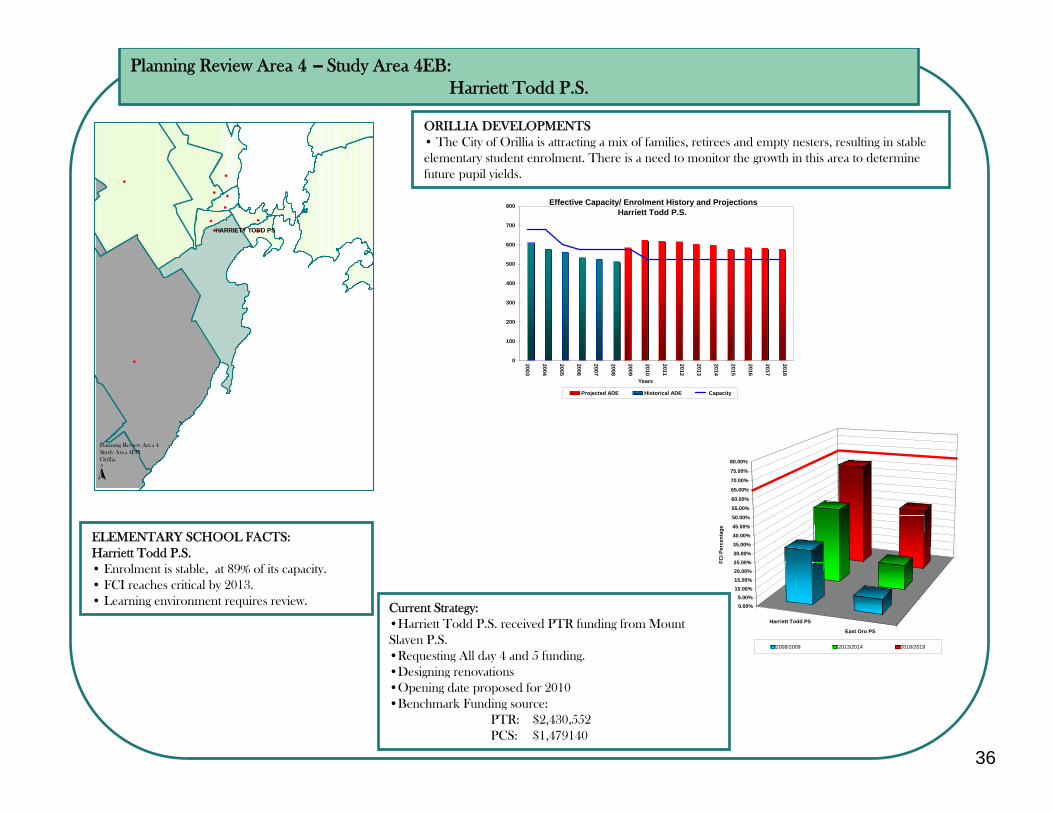
36
Planning Review Area 4 – Study Area 4EB:Harriett Todd P.S.
ORILLIA DEVELOPMENTS• The City of Orillia is attracting a mix of families, retirees and empty nesters, resulting in stable elementary student enrolment. There is a need to monitor the growth in this area to determine future pupil yields.
ELEMENTARY SCHOOL FACTS:Harriett Todd P.S.• Enrolment is stable, at 89% of its capacity.• FCI reaches critical by 2013.• Learning environment requires review. Current Strategy:
•Harriett Todd P.S. received PTR funding from Mount Slaven P.S.•Requesting All day 4 and 5 funding.•Designing renovations•Opening date proposed for 2010•Benchmark Funding source:
PTR: $2,430,552PCS: $1,479140
Harriett Todd PS
East Oro PS
0.00%5.00%
10.00%15.00%20.00%25.00%30.00%35.00%40.00%45.00%50.00%
55.00%
60.00%
65.00%
70.00%
75.00%
80.00%
FCI P
erce
ntag
e
2008/2009 2013/2014 2018/2019
0
100
200
300
400
500
600
700
800
2003
2004
2005
2006
2007
2008
2009
2010
2011
2012
2013
2014
2015
2016
2017
2018
Years
Projected ADE Historical ADE Capacity
Effective Capacity/ Enrolment History and ProjectionsHarriett Todd P.S.
#
#
#
##
#
#
#
#
#
HARRIETT TODD PS
N
Planning Review Area 4Study Area 4EBOrillia
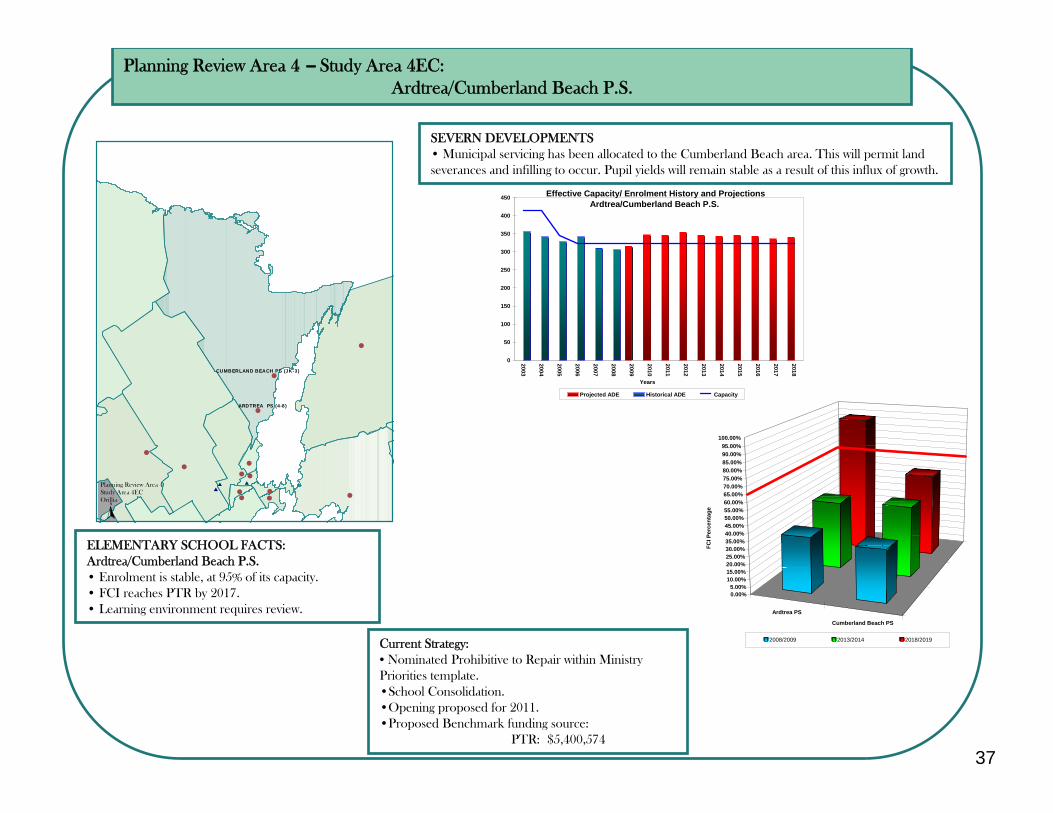
37
Planning Review Area 4 – Study Area 4EC:Ardtrea/Cumberland Beach P.S.
SEVERN DEVELOPMENTS• Municipal servicing has been allocated to the Cumberland Beach area. This will permit land severances and infilling to occur. Pupil yields will remain stable as a result of this influx of growth.
ELEMENTARY SCHOOL FACTS:Ardtrea/Cumberland Beach P.S.• Enrolment is stable, at 95% of its capacity.• FCI reaches PTR by 2017.• Learning environment requires review.
Current Strategy:• Nominated Prohibitive to Repair within Ministry Priorities template.•School Consolidation.•Opening proposed for 2011.•Proposed Benchmark funding source:
PTR: $5,400,574
#
#
#
#
#
#
#
##
##
##
$ $
CUMBERLAND BEACH PS (JK-3)
ARDTREA PS (4-8)
Planning Review Area 4Study Area 4ECOrillia
N
$
0
50
100
150
200
250
300
350
400
450
2003
2004
2005
2006
2007
2008
2009
2010
2011
2012
2013
2014
2015
2016
2017
2018
Years
Projected ADE Historical ADE Capacity
Effective Capacity/ Enrolment History and ProjectionsArdtrea/Cumberland Beach P.S.
Ardtrea PS
Cumberland Beach PS
0.00%5.00%
10.00%15.00%20.00%25.00%30.00%35.00%40.00%45.00%50.00%55.00%60.00%65.00%70.00%75.00%80.00%85.00%90.00%95.00%
100.00%
FCI P
erce
ntag
e
2008/2009 2013/2014 2018/2019
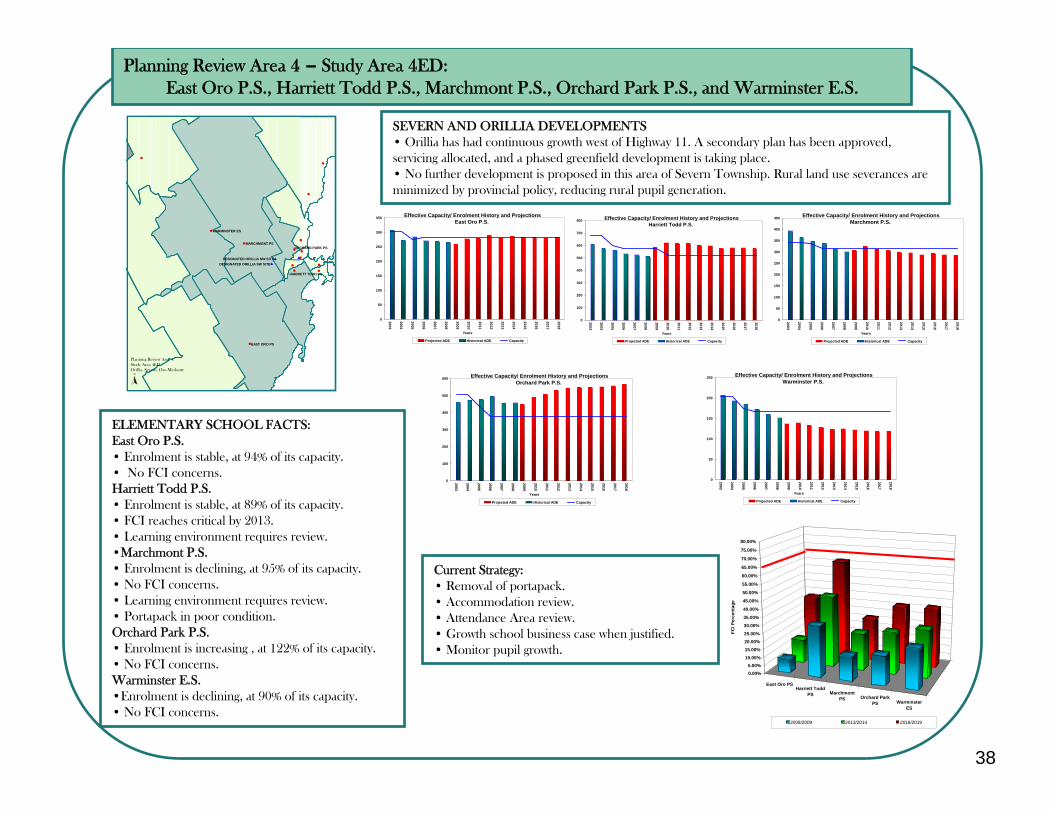
38
Planning Review Area 4 – Study Area 4ED:East Oro P.S., Harriett Todd P.S., Marchmont P.S., Orchard Park P.S., and Warminster E.S.
SEVERN AND ORILLIA DEVELOPMENTS• Orillia has had continuous growth west of Highway 11. A secondary plan has been approved, servicing allocated, and a phased greenfield development is taking place. • No further development is proposed in this area of Severn Township. Rural land use severances are minimized by provincial policy, reducing rural pupil generation.
ELEMENTARY SCHOOL FACTS:East Oro P.S.• Enrolment is stable, at 94% of its capacity.• No FCI concerns.Harriett Todd P.S.• Enrolment is stable, at 89% of its capacity.• FCI reaches critical by 2013.• Learning environment requires review.•Marchmont P.S.• Enrolment is declining, at 95% of its capacity.• No FCI concerns.• Learning environment requires review.• Portapack in poor condition.Orchard Park P.S.• Enrolment is increasing , at 122% of its capacity.• No FCI concerns.Warminster E.S.•Enrolment is declining, at 90% of its capacity.• No FCI concerns.
Current Strategy:• Removal of portapack.• Accommodation review.• Attendance Area review.• Growth school business case when justified.• Monitor pupil growth.
0
50
100
150
200
250
300
350
2003
2004
2005
2006
2007
2008
2009
2010
2011
2012
2013
2014
2015
2016
2017
2018
Years
Projected ADE Historical ADE Capacity
Effective Capacity/ Enrolment History and ProjectionsEast Oro P.S.
0
50
100
150
200
250
300
350
400
450
2003
2004
2005
2006
2007
2008
2009
2010
2011
2012
2013
2014
2015
2016
2017
2018
Years
Projected ADE Historical ADE Capacity
Effective Capacity/ Enrolment History and ProjectionsMarchmont P.S.
0
100
200
300
400
500
600
2003
2004
2005
2006
2007
2008
2009
2010
2011
2012
2013
2014
2015
2016
2017
2018
Years
Projected ADE Historical ADE Capacity
Effective Capacity/ Enrolment History and ProjectionsOrchard Park P.S.
0
50
100
150
200
250
2003
2004
2005
2006
2007
2008
2009
2010
2011
2012
2013
2014
2015
2016
2017
2018
Years
Projected ADE Historical ADE Capacity
Effective Capacity/ Enrolment History and ProjectionsWarminster P.S.
East Oro PSHarriett Todd
PS MarchmontPS Orchard Park
PS WarminsterES
0.00%5.00%
10.00%
15.00%20.00%25.00%
30.00%
35.00%
40.00%
45.00%
50.00%
55.00%
60.00%
65.00%
70.00%
75.00%
80.00%
FCI P
erce
ntag
e
2008/2009 2013/2014 2018/2019
0
100
200
300
400
500
600
700
800
2003
2004
2005
2006
2007
2008
2009
2010
2011
2012
2013
2014
2015
2016
2017
2018
Years
Projected ADE Historical ADE Capacity
Effective Capacity/ Enrolment History and ProjectionsHarriett Todd P.S.
#
#
#
#
#
#
#
##
#
#
#
#
#$ $
WARMINSTER ES
MARCHMONT PSORCHARD PARK PS
HARRIETT TODD PS
EAST ORO PS
$DESIGNATED ORILLIA NW SITE
DESIGNATED ORILLIA SW SITE
Planning Review Area 4Study Area 4EDOrillia, Severn, Oro-Medonte
N
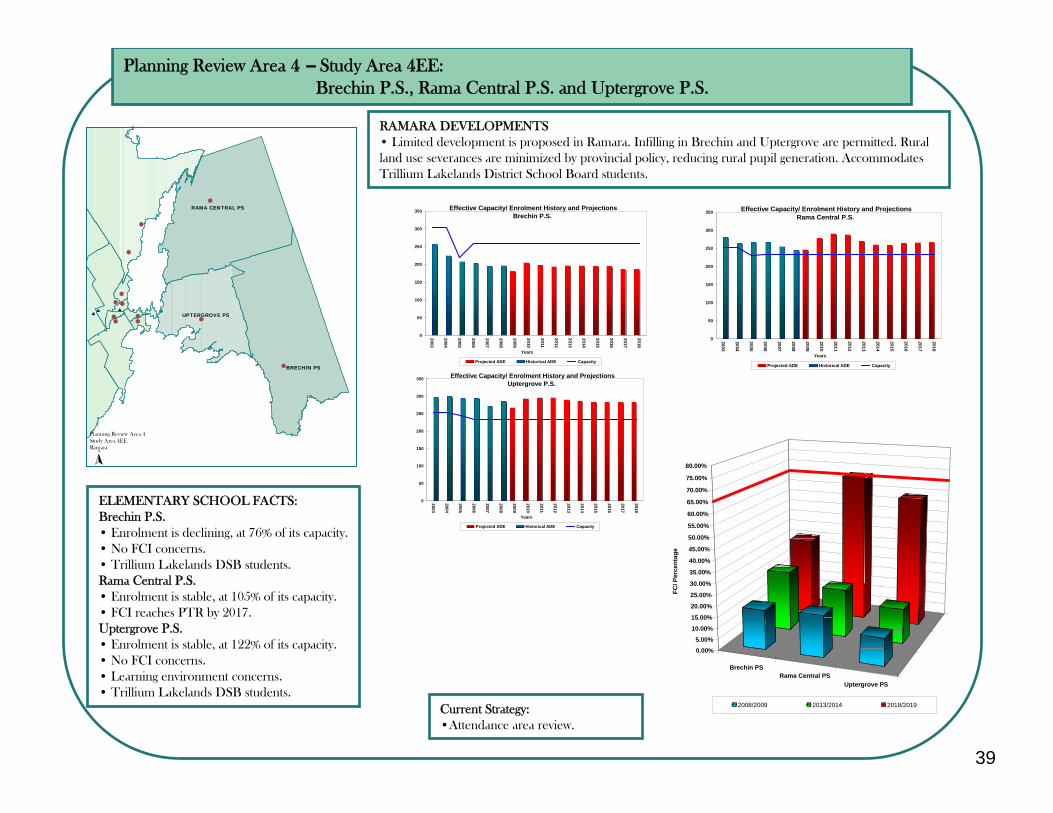
39
Planning Review Area 4 – Study Area 4EE:Brechin P.S., Rama Central P.S. and Uptergrove P.S.
RAMARA DEVELOPMENTS• Limited development is proposed in Ramara. Infilling in Brechin and Uptergrove are permitted. Rural land use severances are minimized by provincial policy, reducing rural pupil generation. Accommodates Trillium Lakelands District School Board students.
ELEMENTARY SCHOOL FACTS:Brechin P.S.• Enrolment is declining, at 76% of its capacity.• No FCI concerns.• Trillium Lakelands DSB students.Rama Central P.S.• Enrolment is stable, at 105% of its capacity.• FCI reaches PTR by 2017.Uptergrove P.S.• Enrolment is stable, at 122% of its capacity.• No FCI concerns.• Learning environment concerns.• Trillium Lakelands DSB students.
Current Strategy:•Attendance area review.
#
#
#
#
#
#
##
##
##
$ $
RAMA CENTRAL PS
UPTERGROVE PS
BRECHIN PS
Planning Review Area 4Study Area 4EERamara
N
$
Brechin PSRama Central PS
Uptergrove PS
0.00%
5.00%
10.00%
15.00%
20.00%
25.00%
30.00%
35.00%
40.00%
45.00%
50.00%
55.00%
60.00%
65.00%
70.00%
75.00%
80.00%
FCI P
erce
ntag
e
2008/2009 2013/2014 2018/2019
0
50
100
150
200
250
300
350
2003
2004
2005
2006
2007
2008
2009
2010
2011
2012
2013
2014
2015
2016
2017
2018
Years
Projected ADE Historical ADE Capacity
Effective Capacity/ Enrolment History and ProjectionsRama Central P.S.
0
50
100
150
200
250
300
350
2003
2004
2005
2006
2007
2008
2009
2010
2011
2012
2013
2014
2015
2016
2017
2018
Years
Projected ADE Historical ADE Capacity
Effective Capacity/ Enrolment History and ProjectionsBrechin P.S.
0
50
100
150
200
250
300
350
2003
2004
2005
2006
2007
2008
2009
2010
2011
2012
2013
2014
2015
2016
2017
2018
Years
Projected ADE Historical ADE Capacity
Effective Capacity/ Enrolment History and ProjectionsUptergrove P.S.
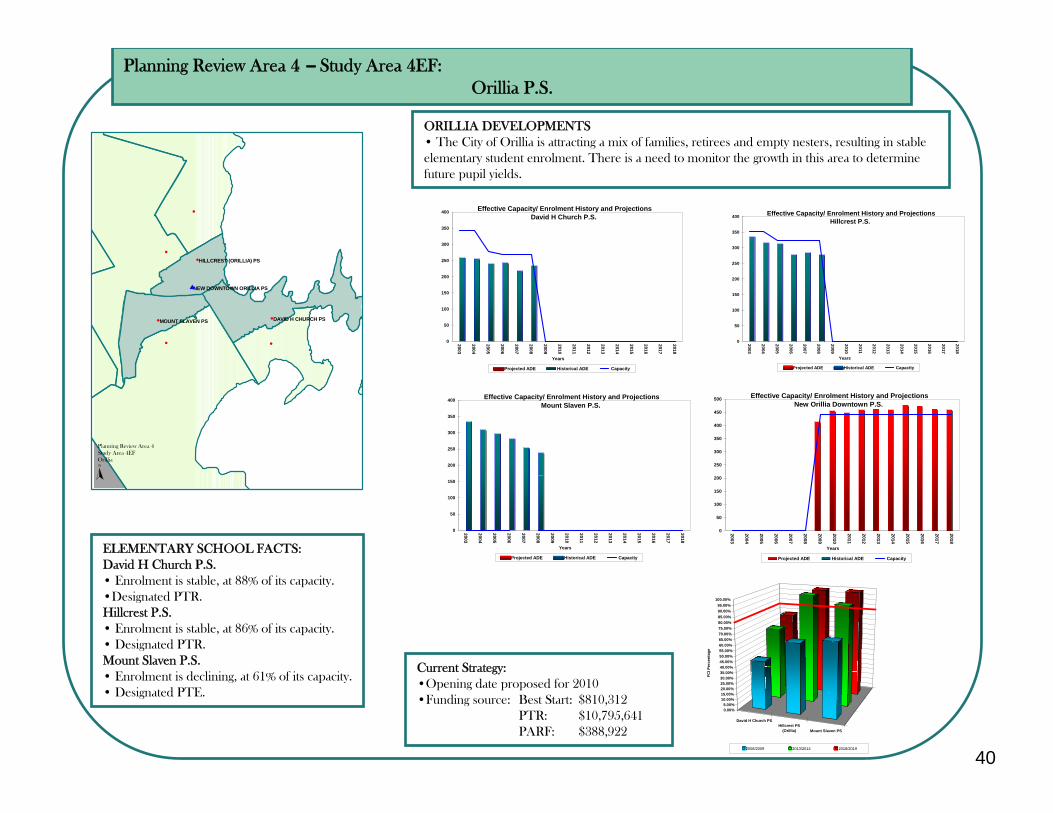
40
Planning Review Area 4 – Study Area 4EF:Orillia P.S.
ORILLIA DEVELOPMENTS• The City of Orillia is attracting a mix of families, retirees and empty nesters, resulting in stable elementary student enrolment. There is a need to monitor the growth in this area to determine future pupil yields.
Current Strategy:•Opening date proposed for 2010•Funding source: Best Start: $810,312
PTR: $10,795,641PARF: $388,922
0
50
100
150
200
250
300
350
400
450
500
2003
2004
2005
2006
2007
2008
2009
2010
2011
2012
2013
2014
2015
2016
2017
2018
Years
Projected ADE Historical ADE Capacity
Effective Capacity/ Enrolment History and ProjectionsNew Orillia Downtown P.S.
0
50
100
150
200
250
300
350
400
2003
2004
2005
2006
2007
2008
2009
2010
2011
2012
2013
2014
2015
2016
2017
2018
Years
Projected ADE Historical ADE Capacity
Effective Capacity/ Enrolment History and ProjectionsMount Slaven P.S.
0
50
100
150
200
250
300
350
400
2003
2004
2005
2006
2007
2008
2009
2010
2011
2012
2013
2014
2015
2016
2017
2018
Years
Projected ADE Historical ADE Capacity
Effective Capacity/ Enrolment History and ProjectionsHillcrest P.S.
0
50
100
150
200
250
300
350
400
2003
2004
2005
2006
2007
2008
2009
2010
2011
2012
2013
2014
2015
2016
2017
2018
Years
Projected ADE Historical ADE Capacity
Effective Capacity/ Enrolment History and ProjectionsDavid H Church P.S.
ELEMENTARY SCHOOL FACTS:David H Church P.S.• Enrolment is stable, at 88% of its capacity.•Designated PTR.Hillcrest P.S.• Enrolment is stable, at 86% of its capacity.• Designated PTR.Mount Slaven P.S.• Enrolment is declining, at 61% of its capacity.• Designated PTE.
David H Church PSHillcrest PS
(Orillia) Mount Slaven PS
0.00%5.00%
10.00%15.00%20.00%25.00%30.00%35.00%40.00%45.00%50.00%55.00%60.00%65.00%70.00%75.00%80.00%85.00%90.00%95.00%
100.00%
FCI P
erce
ntag
e
2008/2009 2013/2014 2018/2019
#
#
#
#
#
#
#
#
MOUNT SLAVEN PS
NEW DOWNTOWN ORILLIA PS
DAVID H CHURCH PS
HILLCREST (ORILLIA) PS
$
N
Planning Review Area 4Study Area 4EFOrillia
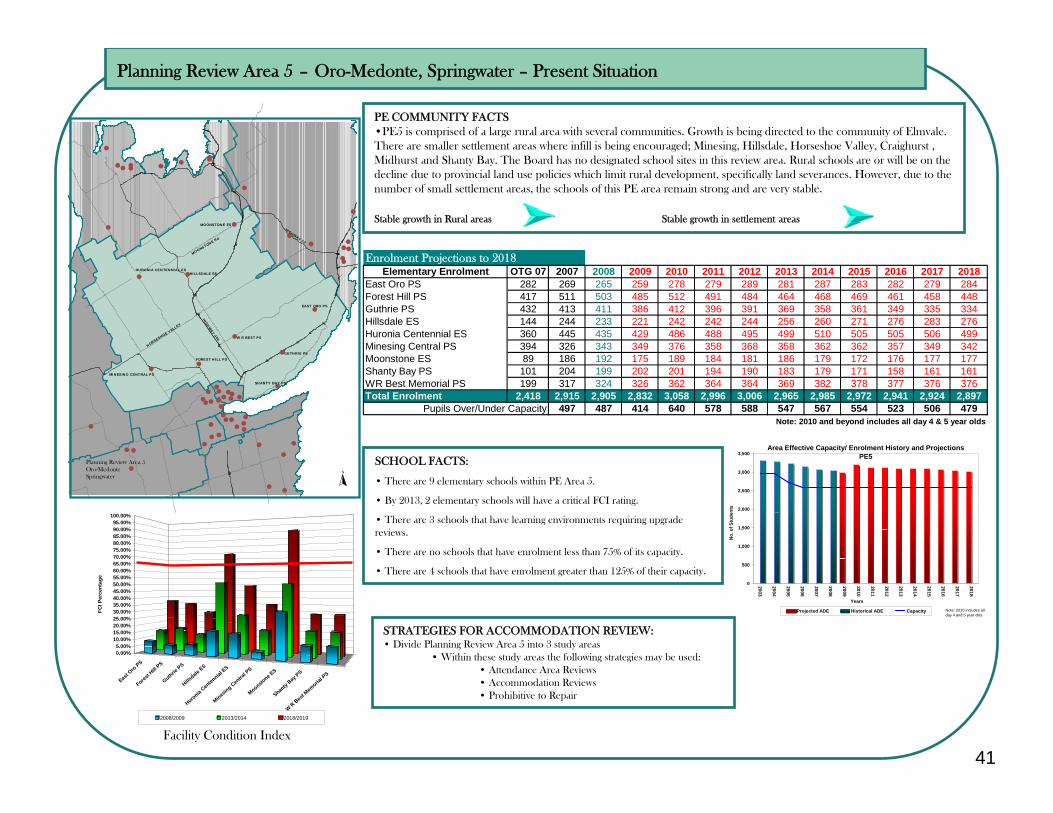
41
Planning Review Area 5 – Oro-Medonte, Springwater – Present Situation
Facility Condition Index
SCHOOL FACTS:
• There are 9 elementary schools within PE Area 5.
• By 2013, 2 elementary schools will have a critical FCI rating.
• There are 3 schools that have learning environments requiring upgrade reviews.
• There are no schools that have enrolment less than 75% of its capacity.
• There are 4 schools that have enrolment greater than 125% of their capacity.
STRATEGIES FOR ACCOMMODATION REVIEW:• Divide Planning Review Area 5 into 3 study areas
• Within these study areas the following strategies may be used:• Attendance Area Reviews• Accommodation Reviews• Prohibitive to Repair
PE COMMUNITY FACTS•PE5 is comprised of a large rural area with several communities. Growth is being directed to the community of Elmvale. There are smaller settlement areas where infill is being encouraged; Minesing, Hillsdale, Horseshoe Valley, Craighurst , Midhurst and Shanty Bay. The Board has no designated school sites in this review area. Rural schools are or will be on the decline due to provincial land use policies which limit rural development, specifically land severances. However, due to the number of small settlement areas, the schools of this PE area remain strong and are very stable.
Stable growth in Rural areas Stable growth in settlement areas
N
##
#
##
##
#
#
#
#
#
#
#
#
#
#
####
# #
##
#
#
#
#
#
#
####
#
#
#
# #
# ##
#
#
###
##
#
#
#
#
#
#
#
#
##
#
HILLSDALE ES
MOONSTONE ES
HURONIA CENTENNIAL ES
MINESING CENTRAL PS
FOREST HILL PS
W R BEST PS
GUTHRIE PS
EAST ORO PS
SHANTY BAY PS
HIGHW
AY 400
MOONSTONE Rd
HORSESHOE VALLEY
HIGHWAY 12
Planning Review Area 5Oro-MedonteSpringwater
Enrolment Projections to 2018Elementary Enrolment OTG 07 2007 2008 2009 2010 2011 2012 2013 2014 2015 2016 2017 2018
East Oro PS 282 269 265 259 278 279 289 281 287 283 282 279 284Forest Hill PS 417 511 503 485 512 491 484 464 468 469 461 458 448Guthrie PS 432 413 411 386 412 396 391 369 358 361 349 335 334Hillsdale ES 144 244 233 221 242 242 244 256 260 271 276 283 276Huronia Centennial ES 360 445 435 429 486 488 495 499 510 505 505 506 499Minesing Central PS 394 326 343 349 376 358 368 358 362 362 357 349 342Moonstone ES 89 186 192 175 189 184 181 186 179 172 176 177 177Shanty Bay PS 101 204 199 202 201 194 190 183 179 171 158 161 161WR Best Memorial PS 199 317 324 326 362 364 364 369 382 378 377 376 376Total Enrolment 2,418 2,915 2,905 2,832 3,058 2,996 3,006 2,965 2,985 2,972 2,941 2,924 2,897
497 487 414 640 578 588 547 567 554 523 506 479Note: 2010 and beyond includes all day 4 & 5 year olds
Pupils Over/Under Capacity
East Oro PS
Forest H
ill PS
Guthrie PS
Hillsdale
ES
Huronia Centen
nial ES
Minesing Cen
tral P
S
Moonstone E
S
Shanty
Bay PS
W R Best Mem
orial P
S
0.00%5.00%
10.00%15.00%20.00%25.00%30.00%35.00%40.00%45.00%50.00%55.00%60.00%65.00%70.00%75.00%80.00%85.00%90.00%95.00%
100.00%
FCI P
erce
ntag
e
2008/2009 2013/2014 2018/2019
0
500
1,000
1,500
2,000
2,500
3,000
3,500
2003
2004
2005
2006
2007
2008
2009
2010
2011
2012
2013
2014
2015
2016
2017
2018
Years
No.
of S
tude
nts
Projected ADE Historical ADE Capacity
Area Effective Capacity/ Enrolment History and ProjectionsPE5
Note: 2010 includes all day 4 and 5 year olds
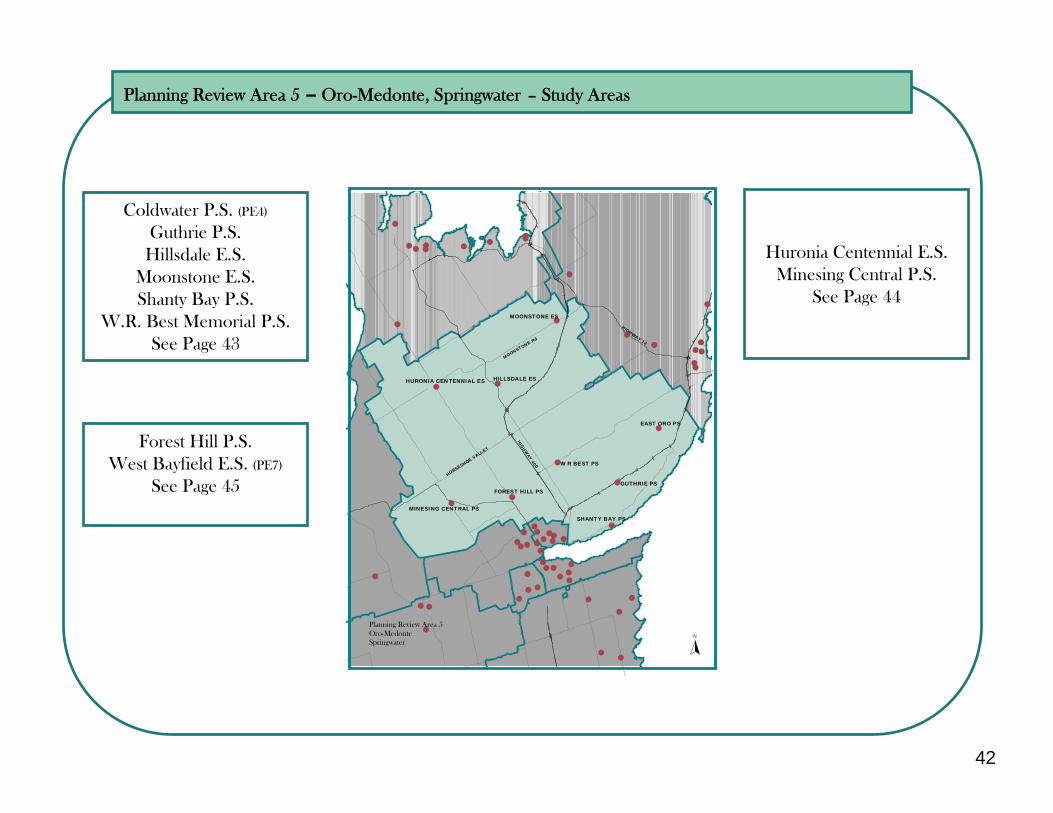
42
Planning Review Area 5 – Oro-Medonte, Springwater – Study Areas
Huronia Centennial E.S.Minesing Central P.S.
See Page 44
Coldwater P.S. (PE4)
Guthrie P.S.Hillsdale E.S.
Moonstone E.S.Shanty Bay P.S.
W.R. Best Memorial P.S.See Page 43
Forest Hill P.S.West Bayfield E.S. (PE7)
See Page 45
N
##
#
##
##
#
#
#
#
#
#
#
#
#
#
####
# #
##
#
#
#
#
#
#
####
#
#
#
# #
# ##
#
#
###
##
#
#
#
#
#
#
#
#
##
#
HILLSDALE ES
MOONSTONE ES
HURONIA CENTENNIAL ES
MINESING CENTRAL PS
FOREST HILL PS
W R BEST PS
GUTHRIE PS
EAST ORO PS
SHANTY BAY PS
HIGHW
AY 400
MOONSTONE Rd
HORSESHOE VALLEY
HIGHWAY 12
Planning Review Area 5Oro-MedonteSpringwater
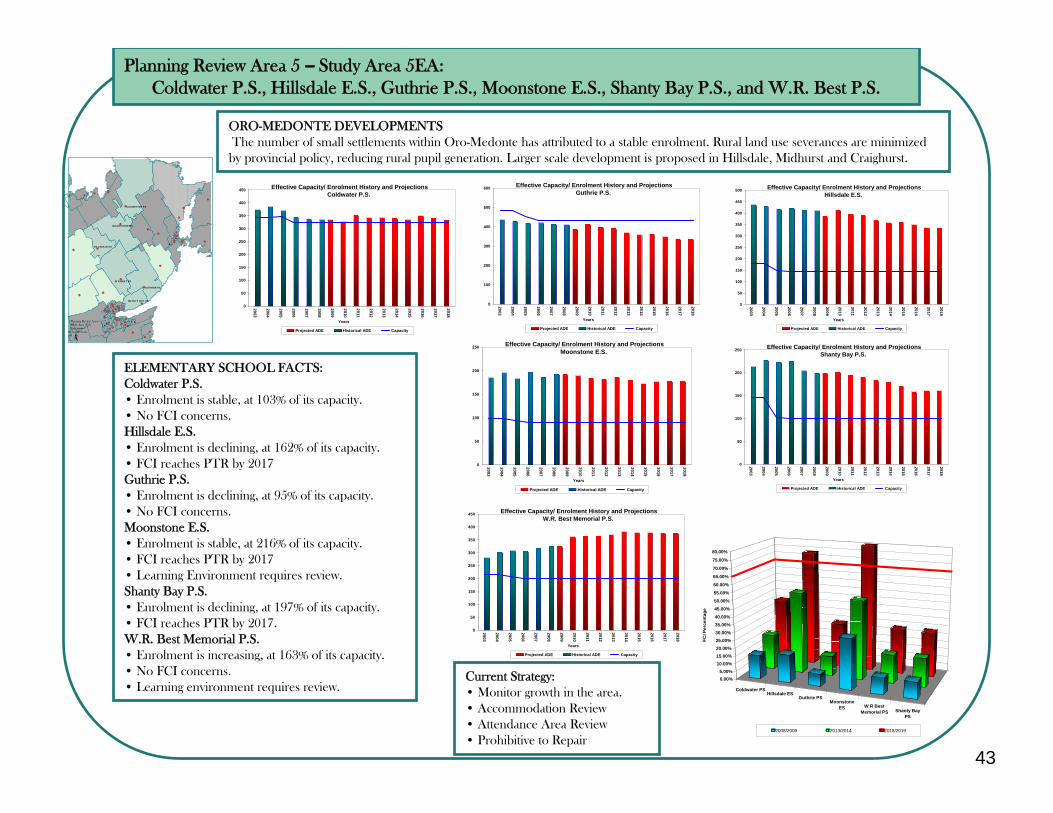
43
Planning Review Area 5 – Study Area 5EA:Coldwater P.S., Hillsdale E.S., Guthrie P.S., Moonstone E.S., Shanty Bay P.S., and W.R. Best P.S.
ORO-MEDONTE DEVELOPMENTSThe number of small settlements within Oro-Medonte has attributed to a stable enrolment. Rural land use severances are minimized
by provincial policy, reducing rural pupil generation. Larger scale development is proposed in Hillsdale, Midhurst and Craighurst.
ELEMENTARY SCHOOL FACTS:Coldwater P.S.• Enrolment is stable, at 103% of its capacity.• No FCI concerns.Hillsdale E.S.• Enrolment is declining, at 162% of its capacity.• FCI reaches PTR by 2017Guthrie P.S.• Enrolment is declining, at 95% of its capacity.• No FCI concerns.Moonstone E.S.• Enrolment is stable, at 216% of its capacity.• FCI reaches PTR by 2017• Learning Environment requires review.Shanty Bay P.S.• Enrolment is declining, at 197% of its capacity.• FCI reaches PTR by 2017.W.R. Best Memorial P.S.• Enrolment is increasing, at 163% of its capacity.• No FCI concerns.• Learning environment requires review.
Current Strategy:• Monitor growth in the area.• Accommodation Review• Attendance Area Review• Prohibitive to Repair
##
#
##
##
# #
#
#
#
#
#
#
#
#
#
#
##
# ##
#
#
#
#
####
#
#
#
# #
# ##
#
#
###
## ##
#
#
#
#
#
##
#
$
$
$
$$
$ $
$
$
$
COLDWATER PS
MOONSTONE ES
HILLSDALE ES
W R BEST PS
GUTHRIE PS
SHANTY BAY PS
N
Planning Review Area 5Study Area 5EASpringwaterOro-Medonte
Coldwater PSHillsdale ES
Guthrie PSMoonstone
ES W R BestMemorial PS Shanty Bay
PS
0.00%5.00%
10.00%15.00%20.00%25.00%30.00%
35.00%40.00%
45.00%
50.00%
55.00%
60.00%
65.00%
70.00%
75.00%
80.00%
FCI P
erce
ntag
e
2008/2009 2013/2014 2018/2019
0
50
100
150
200
250
300
350
400
450
500
2003
2004
2005
2006
2007
2008
2009
2010
2011
2012
2013
2014
2015
2016
2017
2018
Years
Projected ADE Historical ADE Capacity
Effective Capacity/ Enrolment History and ProjectionsHillsdale E.S.
0
50
100
150
200
250
2003
2004
2005
2006
2007
2008
2009
2010
2011
2012
2013
2014
2015
2016
2017
2018
Years
Projected ADE Historical ADE Capacity
Effective Capacity/ Enrolment History and ProjectionsShanty Bay P.S.
0
50
100
150
200
250
300
350
400
450
2003
2004
2005
2006
2007
2008
2009
2010
2011
2012
2013
2014
2015
2016
2017
2018
Years
Projected ADE Historical ADE Capacity
Effective Capacity/ Enrolment History and ProjectionsW.R. Best Memorial P.S.
0
50
100
150
200
250
2003
2004
2005
2006
2007
2008
2009
2010
2011
2012
2013
2014
2015
2016
2017
2018
Years
Projected ADE Historical ADE Capacity
Effective Capacity/ Enrolment History and ProjectionsMoonstone E.S.
0
100
200
300
400
500
600
2003
2004
2005
2006
2007
2008
2009
2010
2011
2012
2013
2014
2015
2016
2017
2018
Years
Projected ADE Historical ADE Capacity
Effective Capacity/ Enrolment History and ProjectionsGuthrie P.S.
0
50
100
150
200
250
300
350
400
450
2003
2004
2005
2006
2007
2008
2009
2010
2011
2012
2013
2014
2015
2016
2017
2018
Years
Projected ADE Historical ADE Capacity
Effective Capacity/ Enrolment History and ProjectionsColdwater P.S.
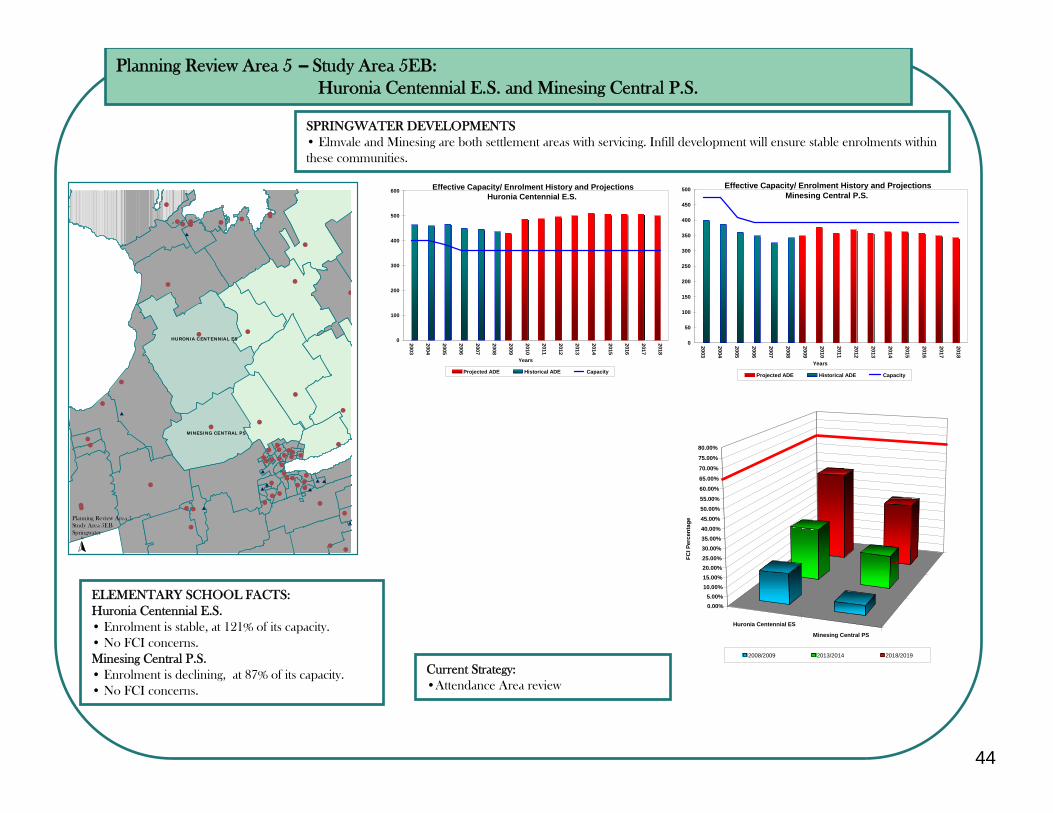
44
Planning Review Area 5 – Study Area 5EB:Huronia Centennial E.S. and Minesing Central P.S.
SPRINGWATER DEVELOPMENTS• Elmvale and Minesing are both settlement areas with servicing. Infill development will ensure stable enrolments within these communities.
ELEMENTARY SCHOOL FACTS:Huronia Centennial E.S.• Enrolment is stable, at 121% of its capacity.• No FCI concerns.Minesing Central P.S.• Enrolment is declining, at 87% of its capacity.• No FCI concerns.
Current Strategy:•Attendance Area review
#
#
##
#
##
##
#
#
#
#
#
#
#
####
#
##
#
#
##
#
#
#
#
#
####
#
#
#
##
# ##
#
#
#
#
#
#
#
#
#
#
#
##
#
$
$
$
$$
$ $
$
$
$
HURONIA CENTENNIAL ES
MINESING CENTRAL PS
Planning Review Area 5Study Area 5EBSpringwater
N
Huronia Centennial ES
Minesing Central PS
0.00%5.00%
10.00%15.00%20.00%25.00%30.00%35.00%40.00%45.00%50.00%55.00%
60.00%
65.00%
70.00%
75.00%
80.00%
FCI P
erce
ntag
e
2008/2009 2013/2014 2018/2019
0
50
100
150
200
250
300
350
400
450
500
2003
2004
2005
2006
2007
2008
2009
2010
2011
2012
2013
2014
2015
2016
2017
2018
Years
Projected ADE Historical ADE Capacity
Effective Capacity/ Enrolment History and ProjectionsMinesing Central P.S.
0
100
200
300
400
500
600
2003
2004
2005
2006
2007
2008
2009
2010
2011
2012
2013
2014
2015
2016
2017
2018
Years
Projected ADE Historical ADE Capacity
Effective Capacity/ Enrolment History and ProjectionsHuronia Centennial E.S.
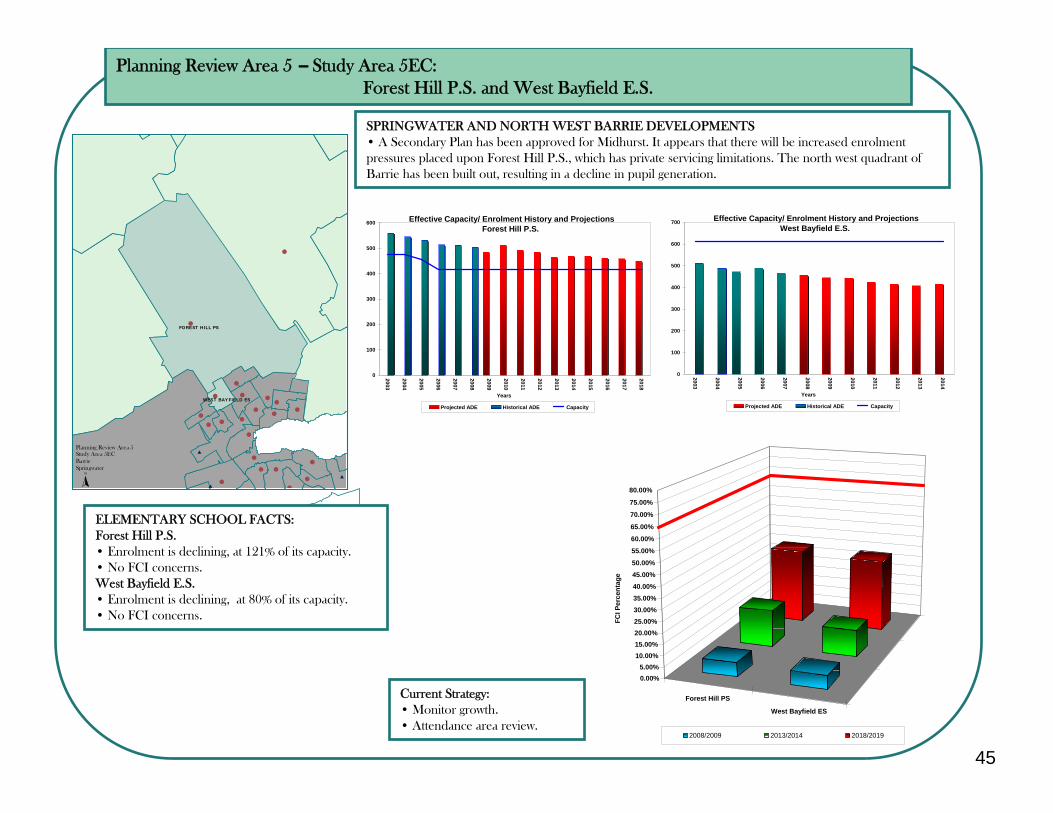
45
Planning Review Area 5 – Study Area 5EC:Forest Hill P.S. and West Bayfield E.S.
SPRINGWATER AND NORTH WEST BARRIE DEVELOPMENTS• A Secondary Plan has been approved for Midhurst. It appears that there will be increased enrolment pressures placed upon Forest Hill P.S., which has private servicing limitations. The north west quadrant of Barrie has been built out, resulting in a decline in pupil generation.
ELEMENTARY SCHOOL FACTS:Forest Hill P.S.• Enrolment is declining, at 121% of its capacity.• No FCI concerns.West Bayfield E.S.• Enrolment is declining, at 80% of its capacity.• No FCI concerns.
Current Strategy:• Monitor growth.• Attendance area review.
#
#
#
#
#
#
##
#
#
#
#
#
#
##
#
#
#
#
#
#
$
$
$
FOREST HILL PS
WEST BAYFIELD ES
N
Planning Review Area 5Study Area 5ECBarrieSpringwater
Forest Hill PS
West Bayfield ES
0.00%5.00%
10.00%15.00%20.00%25.00%30.00%35.00%40.00%45.00%50.00%
55.00%
60.00%
65.00%
70.00%
75.00%
80.00%
FCI P
erce
ntag
e
2008/2009 2013/2014 2018/2019
0
100
200
300
400
500
600
700
2003
2004
2005
2006
2007
2008
2009
2010
2011
2012
2013
2014
Years
Projected ADE Historical ADE Capacity
Effective Capacity/ Enrolment History and ProjectionsWest Bayfield E.S.
0
100
200
300
400
500
600
2003
2004
2005
2006
2007
2008
2009
2010
2011
2012
2013
2014
2015
2016
2017
2018
Years
Projected ADE Historical ADE Capacity
Effective Capacity/ Enrolment History and ProjectionsForest Hill P.S.
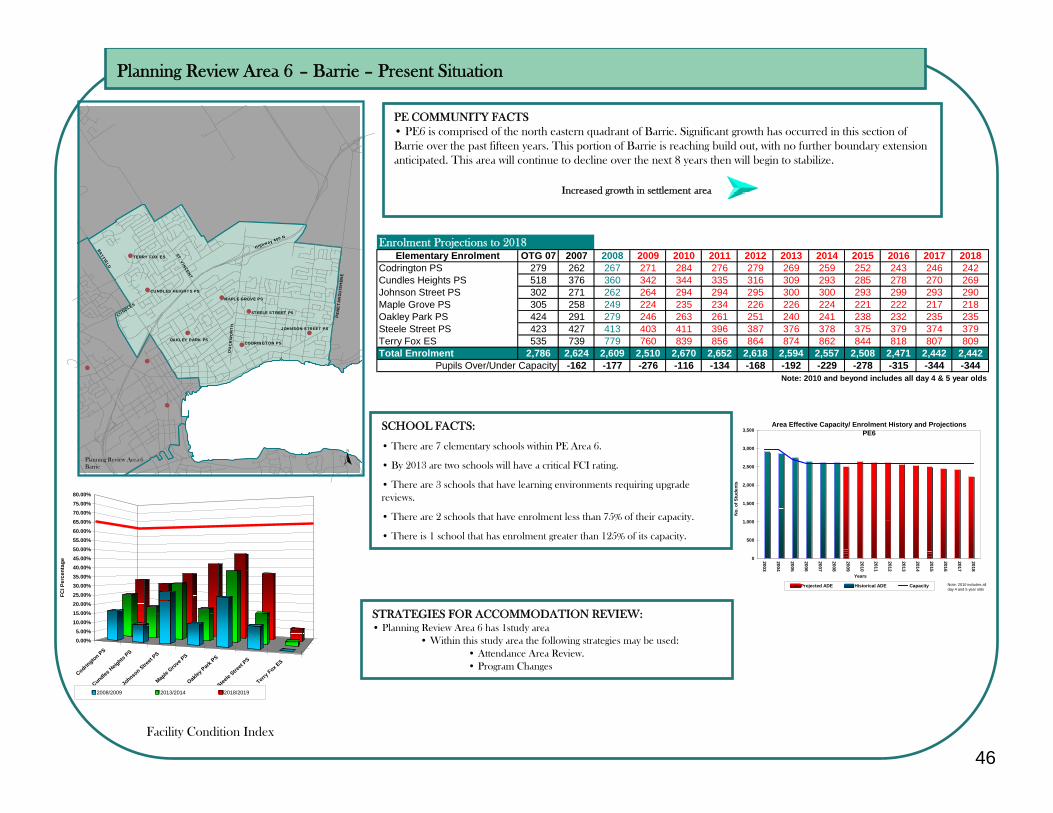
46
Planning Review Area 6 – Barrie – Present Situation
Facility Condition Index
SCHOOL FACTS:
• There are 7 elementary schools within PE Area 6.
• By 2013 are two schools will have a critical FCI rating.
• There are 3 schools that have learning environments requiring upgrade reviews.
• There are 2 schools that have enrolment less than 75% of their capacity.
• There is 1 school that has enrolment greater than 125% of its capacity.
STRATEGIES FOR ACCOMMODATION REVIEW:• Planning Review Area 6 has 1study area
• Within this study area the following strategies may be used:• Attendance Area Review.• Program Changes
PE COMMUNITY FACTS• PE6 is comprised of the north eastern quadrant of Barrie. Significant growth has occurred in this section of Barrie over the past fifteen years. This portion of Barrie is reaching build out, with no further boundary extension anticipated. This area will continue to decline over the next 8 years then will begin to stabilize.
Increased growth in settlement area
#
#
#
#
#
#
#
#
#
#TERRY FOX ES
CUNDLES HEIGHTS PS
OAKLEY PARK PS
MAPLE GROVE PS
STEELE STREET PS
CODRINGTON PS
JOHNSON STREET PS
Highway 400 N
ST. VINCENT
BAYFIELD
CUNDLES
DU
CK
WO
RT
H
PE
NE
TA
NG
UIS
HEN
E
N
Planning Review Area 6Barrie
Codrington PS
Cundles Heig
hts PS
Johnso
n Street
PS
Maple
Grove PS
Oakley
Park PS
Steele
Street
PS
Terry F
ox ES
0.00%5.00%
10.00%15.00%20.00%25.00%30.00%35.00%40.00%45.00%50.00%55.00%60.00%65.00%70.00%75.00%80.00%
FCI P
erce
ntag
e
2008/2009 2013/2014 2018/2019
Enrolment Projections to 2018Elementary Enrolment OTG 07 2007 2008 2009 2010 2011 2012 2013 2014 2015 2016 2017 2018
Codrington PS 279 262 267 271 284 276 279 269 259 252 243 246 242Cundles Heights PS 518 376 360 342 344 335 316 309 293 285 278 270 269Johnson Street PS 302 271 262 264 294 294 295 300 300 293 299 293 290Maple Grove PS 305 258 249 224 235 234 226 226 224 221 222 217 218Oakley Park PS 424 291 279 246 263 261 251 240 241 238 232 235 235Steele Street PS 423 427 413 403 411 396 387 376 378 375 379 374 379Terry Fox ES 535 739 779 760 839 856 864 874 862 844 818 807 809Total Enrolment 2,786 2,624 2,609 2,510 2,670 2,652 2,618 2,594 2,557 2,508 2,471 2,442 2,442
-162 -177 -276 -116 -134 -168 -192 -229 -278 -315 -344 -344Note: 2010 and beyond includes all day 4 & 5 year olds
Pupils Over/Under Capacity
0
500
1,000
1,500
2,000
2,500
3,000
3,500
2003
2004
2005
2006
2007
2008
2009
2010
2011
2012
2013
2014
2015
2016
2017
2018
Years
No.
of S
tude
nts
Projected ADE Historical ADE Capacity
Area Effective Capacity/ Enrolment History and ProjectionsPE6
Note: 2010 includes all day 4 and 5 year olds
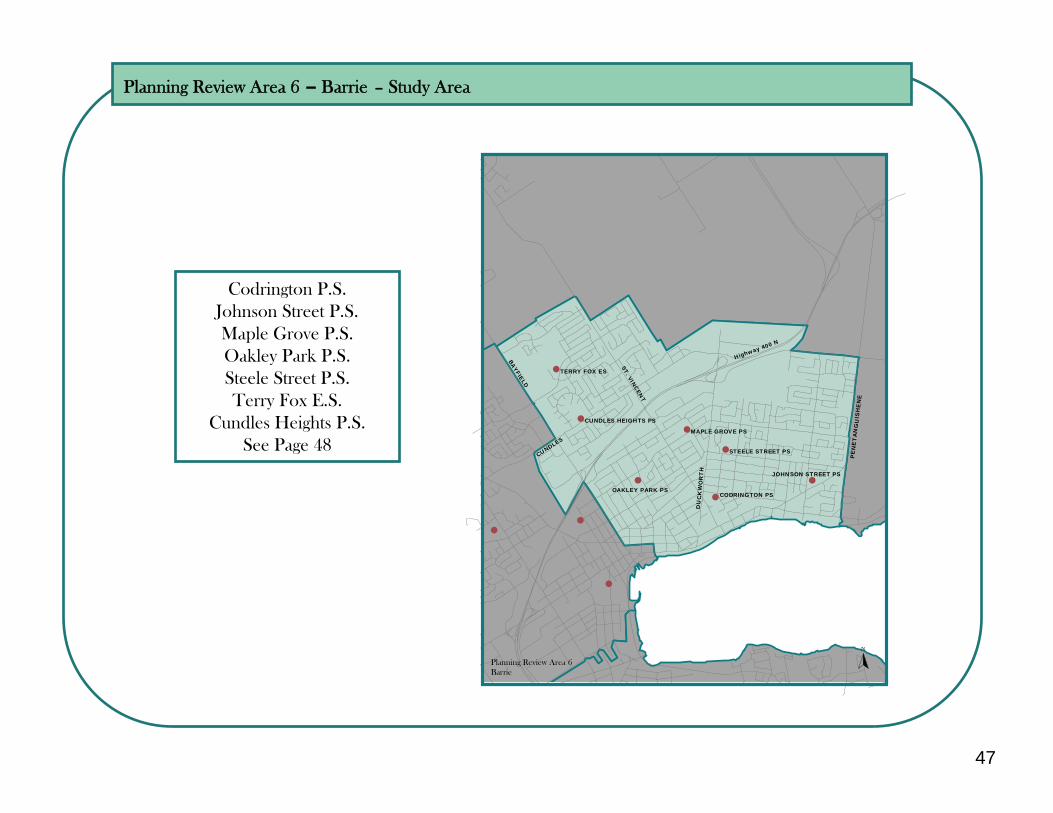
47
Planning Review Area 6 – Barrie – Study Area
Codrington P.S.Johnson Street P.S.Maple Grove P.S.Oakley Park P.S.Steele Street P.S.Terry Fox E.S.
Cundles Heights P.S.See Page 48
#
#
#
#
#
#
#
#
#
#TERRY FOX ES
CUNDLES HEIGHTS PS
OAKLEY PARK PS
MAPLE GROVE PS
STEELE STREET PS
CODRINGTON PS
JOHNSON STREET PS
Highway 400 N
ST. VINCENT
BAYFIELD
CUNDLES
DU
CK
WO
RT
H
PE
NE
TA
NG
UIS
HE
NE
N
Planning Review Area 6Barrie
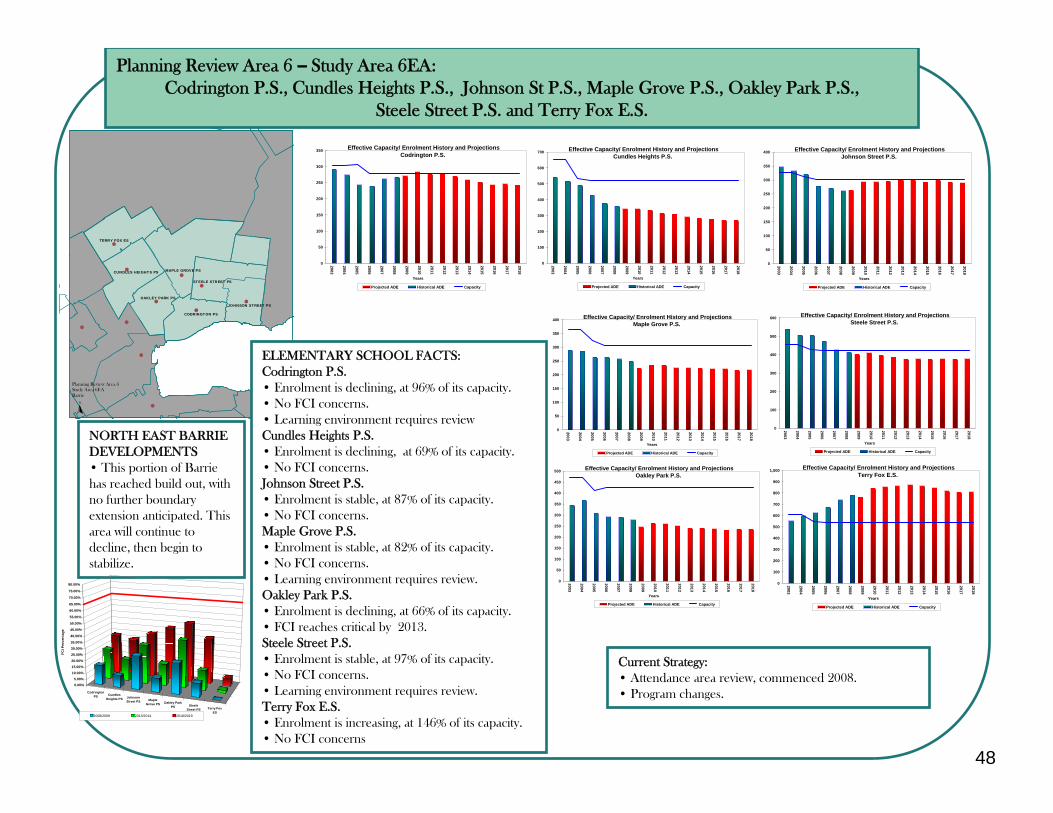
48
Planning Review Area 6 – Study Area 6EA:Codrington P.S., Cundles Heights P.S., Johnson St P.S., Maple Grove P.S., Oakley Park P.S.,
Steele Street P.S. and Terry Fox E.S.
NORTH EAST BARRIE DEVELOPMENTS• This portion of Barrie has reached build out, with no further boundary extension anticipated. This area will continue to decline, then begin to stabilize.
Current Strategy:• Attendance area review, commenced 2008.• Program changes.
#
#
#
#
#
#
#
#
#
#
#
#TERRY FOX ES
CUNDLES HEIGHTS PS
OAKLEY PARK PS
MAPLE GROVE PS
STEELE STREET PS
JOHNSON STREET PS
CODRINGTON PS
Planning Review Area 6Study Area 6EABarrie
N
ELEMENTARY SCHOOL FACTS:Codrington P.S.• Enrolment is declining, at 96% of its capacity.• No FCI concerns.• Learning environment requires reviewCundles Heights P.S.• Enrolment is declining, at 69% of its capacity.• No FCI concerns.Johnson Street P.S.• Enrolment is stable, at 87% of its capacity.• No FCI concerns.Maple Grove P.S.• Enrolment is stable, at 82% of its capacity.• No FCI concerns.• Learning environment requires review.Oakley Park P.S.• Enrolment is declining, at 66% of its capacity.• FCI reaches critical by 2013.Steele Street P.S.• Enrolment is stable, at 97% of its capacity.• No FCI concerns.• Learning environment requires review.Terry Fox E.S.• Enrolment is increasing, at 146% of its capacity.• No FCI concerns
CodringtonPS Cundles
Heights PS JohnsonStreet PS Maple
Grove PS Oakley ParkPS Steele
Street PS Terry FoxES
0.00%5.00%
10.00%
15.00%
20.00%
25.00%
30.00%
35.00%
40.00%
45.00%
50.00%
55.00%
60.00%
65.00%
70.00%
75.00%
80.00%
FCI P
erce
ntag
e
2008/2009 2013/2014 2018/2019
0
50
100
150
200
250
300
350
2003
2004
2005
2006
2007
2008
2009
2010
2011
2012
2013
2014
2015
2016
2017
2018
Years
Projected ADE Historical ADE Capacity
Effective Capacity/ Enrolment History and ProjectionsCodrington P.S.
0
50
100
150
200
250
300
350
400
2003
2004
2005
2006
2007
2008
2009
2010
2011
2012
2013
2014
2015
2016
2017
2018
Years
Projected ADE Historical ADE Capacity
Effective Capacity/ Enrolment History and ProjectionsJohnson Street P.S.
0
50
100
150
200
250
300
350
400
450
500
2003
2004
2005
2006
2007
2008
2009
2010
2011
2012
2013
2014
2015
2016
2017
2018
Years
Projected ADE Historical ADE Capacity
Effective Capacity/ Enrolment History and ProjectionsOakley Park P.S.
0
100
200
300
400
500
600
2003
2004
2005
2006
2007
2008
2009
2010
2011
2012
2013
2014
2015
2016
2017
2018
Years
Projected ADE Historical ADE Capacity
Effective Capacity/ Enrolment History and ProjectionsSteele Street P.S.
0
100
200
300
400
500
600
700
800
900
1,000
2003
2004
2005
2006
2007
2008
2009
2010
2011
2012
2013
2014
2015
2016
2017
2018
Years
Projected ADE Historical ADE Capacity
Effective Capacity/ Enrolment History and ProjectionsTerry Fox E.S.
0
50
100
150
200
250
300
350
400
2003
2004
2005
2006
2007
2008
2009
2010
2011
2012
2013
2014
2015
2016
2017
2018
Years
Projected ADE Historical ADE Capacity
Effective Capacity/ Enrolment History and ProjectionsMaple Grove P.S.
0
100
200
300
400
500
600
700
2003
2004
2005
2006
2007
2008
2009
2010
2011
2012
2013
2014
2015
2016
2017
2018
Years
Projected ADE Historical ADE Capacity
Effective Capacity/ Enrolment History and ProjectionsCundles Heights P.S.
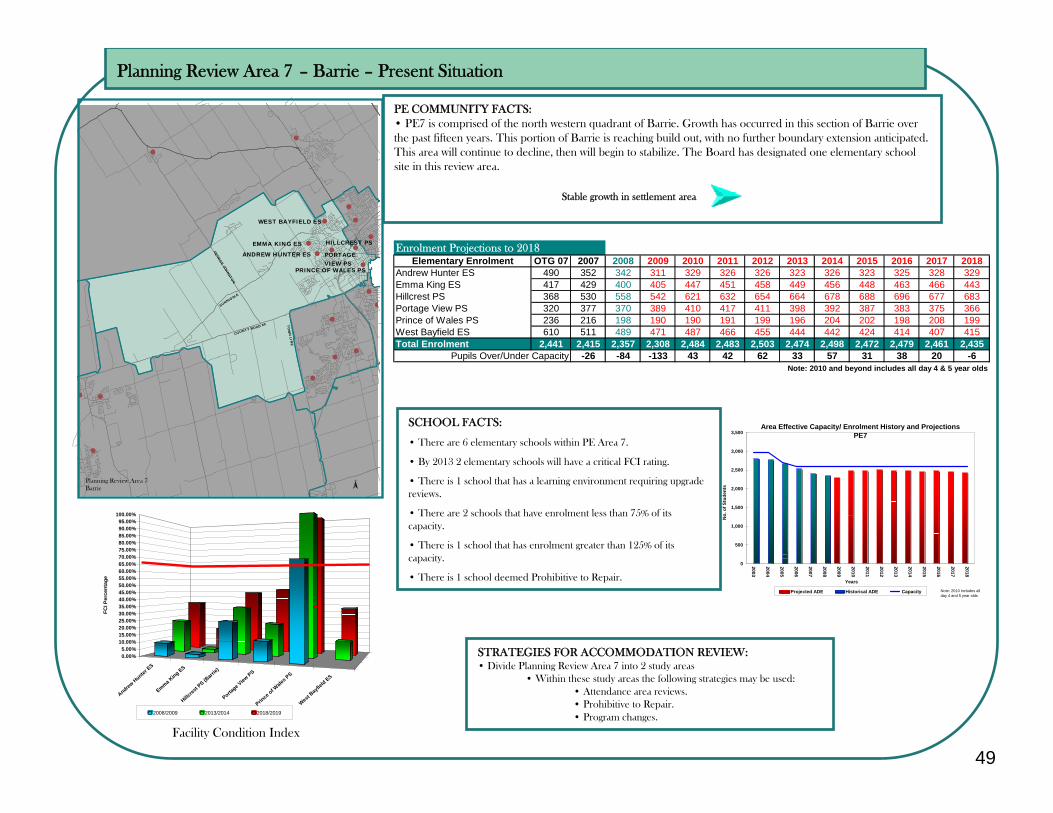
49
Planning Review Area 7 – Barrie – Present Situation
Facility Condition Index
SCHOOL FACTS:
• There are 6 elementary schools within PE Area 7.
• By 2013 2 elementary schools will have a critical FCI rating.
• There is 1 school that has a learning environment requiring upgrade reviews.
• There are 2 schools that have enrolment less than 75% of its capacity.
• There is 1 school that has enrolment greater than 125% of its capacity.
• There is 1 school deemed Prohibitive to Repair.
STRATEGIES FOR ACCOMMODATION REVIEW:• Divide Planning Review Area 7 into 2 study areas
• Within these study areas the following strategies may be used:• Attendance area reviews.• Prohibitive to Repair.• Program changes.
PE COMMUNITY FACTS:• PE7 is comprised of the north western quadrant of Barrie. Growth has occurred in this section of Barrie over the past fifteen years. This portion of Barrie is reaching build out, with no further boundary extension anticipated. This area will continue to decline, then will begin to stabilize. The Board has designated one elementary school site in this review area.
Stable growth in settlement area
N
#
#
#
#
#
#
##
#
#
#
#
#
#
#
#
#
#
#
#
EMMA KING ES
ANDREW HUNTER ES PORTAGE VIEW PS
WEST BAYFIELD ES
HILLCREST PS
PRINCE OF WALES PS
GEOR
GE JOHN
STO
N
SUNNIDALE
COUNTY ROAD 90 TO
WN
LI NE
Planning Review Area 7Barrie
N
Enrolment Projections to 2018Elementary Enrolment OTG 07 2007 2008 2009 2010 2011 2012 2013 2014 2015 2016 2017 2018
Andrew Hunter ES 490 352 342 311 329 326 326 323 326 323 325 328 329Emma King ES 417 429 400 405 447 451 458 449 456 448 463 466 443Hillcrest PS 368 530 558 542 621 632 654 664 678 688 696 677 683Portage View PS 320 377 370 389 410 417 411 398 392 387 383 375 366Prince of Wales PS 236 216 198 190 190 191 199 196 204 202 198 208 199West Bayfield ES 610 511 489 471 487 466 455 444 442 424 414 407 415Total Enrolment 2,441 2,415 2,357 2,308 2,484 2,483 2,503 2,474 2,498 2,472 2,479 2,461 2,435
-26 -84 -133 43 42 62 33 57 31 38 20 -6Note: 2010 and beyond includes all day 4 & 5 year olds
Pupils Over/Under Capacity
Andrew Hunter
ES
Emma King ES
Hillcres
t PS (B
arrie)
Portage V
iew PS
Prince
of Wale
s PS
West Bayfi
eld ES
0.00%5.00%
10.00%15.00%20.00%25.00%30.00%35.00%40.00%45.00%50.00%55.00%60.00%65.00%70.00%75.00%80.00%85.00%90.00%95.00%
100.00%
FCI P
erce
ntag
e
2008/2009 2013/2014 2018/2019
0
500
1,000
1,500
2,000
2,500
3,000
3,500
2003
2004
2005
2006
2007
2008
2009
2010
2011
2012
2013
2014
2015
2016
2017
2018
Years
No.
of S
tude
nts
Projected ADE Historical ADE Capacity
Area Effective Capacity/ Enrolment History and ProjectionsPE7
Note: 2010 includes all day 4 and 5 year olds
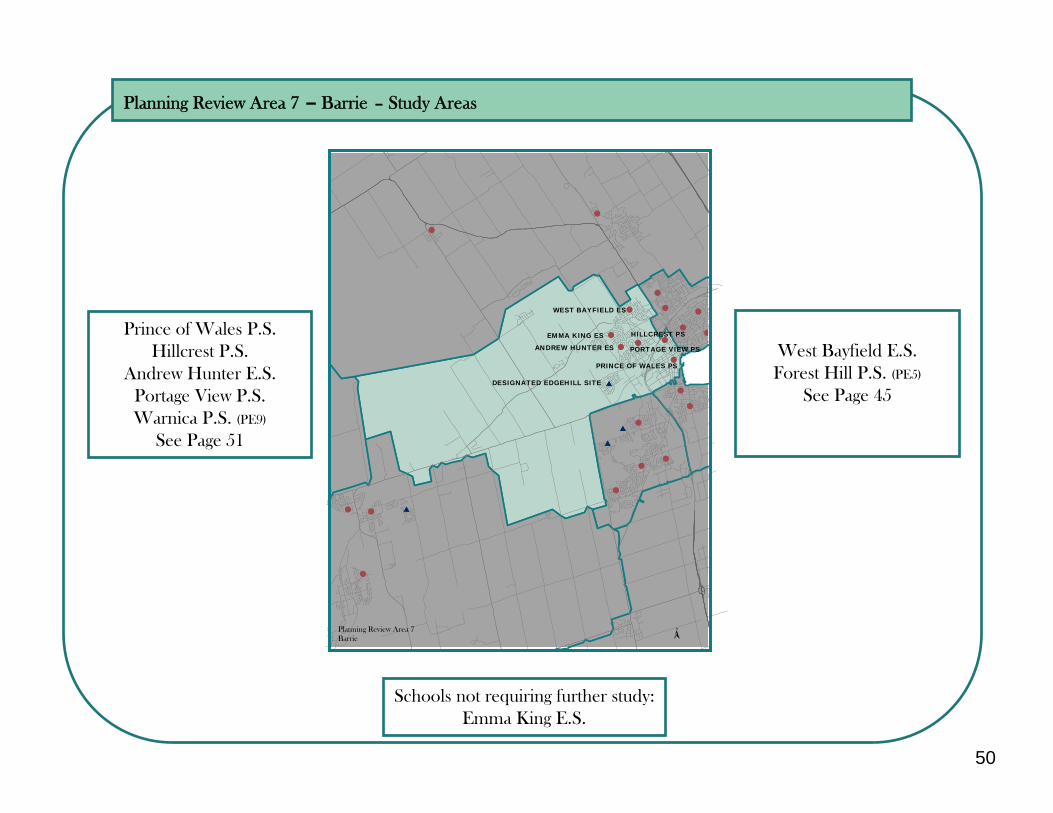
50
Planning Review Area 7 – Barrie – Study Areas
West Bayfield E.S.Forest Hill P.S. (PE5)
See Page 45
Schools not requiring further study:Emma King E.S.
Prince of Wales P.S.Hillcrest P.S.
Andrew Hunter E.S.Portage View P.S.Warnica P.S. (PE9)
See Page 51
N
#
#
#
#
#
#
##
#
#
#
#
#
#
#
#
#
#
#
#
#
#
$
$
$
$
EMMA KING ES
ANDREW HUNTER ES PORTAGE VIEW PS
WEST BAYFIELD ES
HILLCREST PS
PRINCE OF WALES PS
DESIGNATED EDGEHILL SITE
Planning Review Area 7Barrie
N
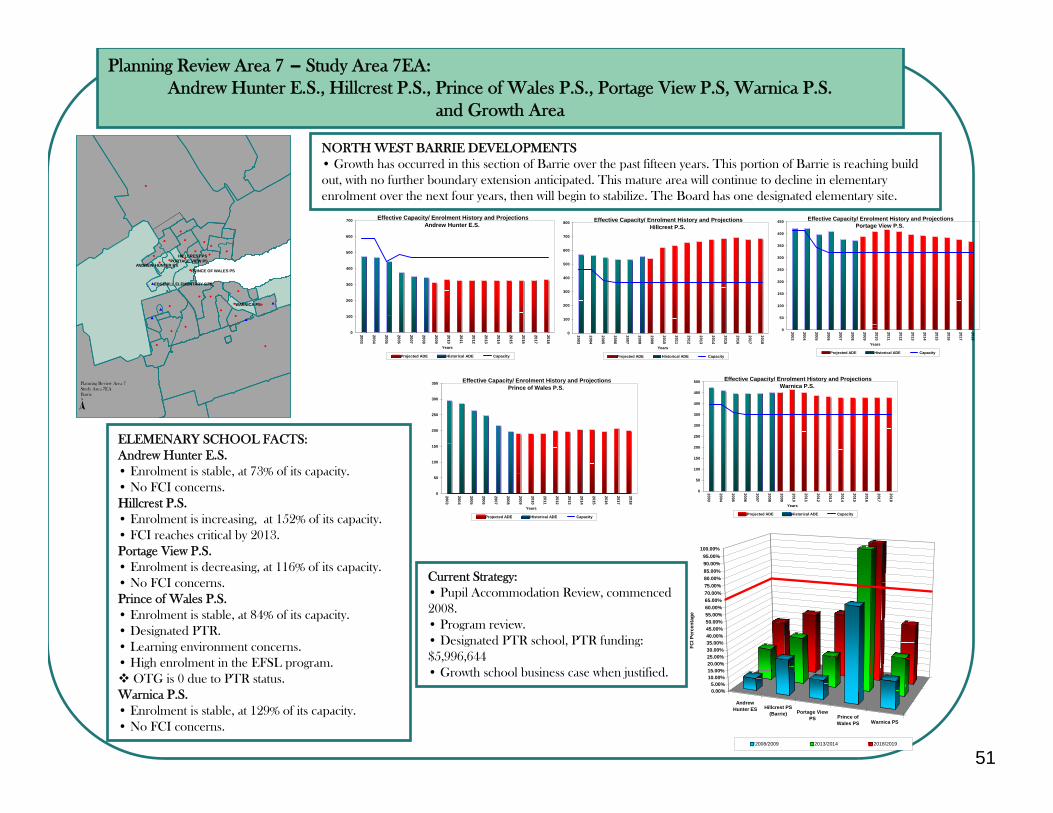
51
Planning Review Area 7 – Study Area 7EA:Andrew Hunter E.S., Hillcrest P.S., Prince of Wales P.S., Portage View P.S, Warnica P.S.
and Growth Area
NORTH WEST BARRIE DEVELOPMENTS• Growth has occurred in this section of Barrie over the past fifteen years. This portion of Barrie is reaching build out, with no further boundary extension anticipated. This mature area will continue to decline in elementary enrolment over the next four years, then will begin to stabilize. The Board has one designated elementary site.
ELEMENARY SCHOOL FACTS:Andrew Hunter E.S.• Enrolment is stable, at 73% of its capacity.• No FCI concerns.Hillcrest P.S.• Enrolment is increasing, at 152% of its capacity.• FCI reaches critical by 2013.Portage View P.S.• Enrolment is decreasing, at 116% of its capacity.• No FCI concerns.Prince of Wales P.S.• Enrolment is stable, at 84% of its capacity.• Designated PTR.• Learning environment concerns.• High enrolment in the EFSL program.
OTG is 0 due to PTR status.Warnica P.S.• Enrolment is stable, at 129% of its capacity.• No FCI concerns.
Current Strategy:• Pupil Accommodation Review, commenced 2008.• Program review.• Designated PTR school, PTR funding: $5,996,644• Growth school business case when justified.
#
#
#
#
#
#
##
#
#
#
#
#
##
#
#
#
#
#
#
#
#
#
#
#
$
$
$
$
$WARNICA PS
PRINCE OF WALES PS
HILLCREST PSPORTAGE VIEW PS
ANDREW HUNTER ES
EDGEHILL ELEMENTARY SITE
N
Planning Review Area 7Study Area 7EABarrie
AndrewHunter ES Hillcrest PS
(Barrie) Portage ViewPS Prince of
Wales PS Warnica PS
0.00%5.00%
10.00%15.00%20.00%25.00%30.00%35.00%40.00%45.00%50.00%55.00%60.00%65.00%70.00%75.00%80.00%85.00%90.00%95.00%
100.00%
FCI P
erce
ntag
e
2008/2009 2013/2014 2018/2019
0
50
100
150
200
250
300
350
2003
2004
2005
2006
2007
2008
2009
2010
2011
2012
2013
2014
2015
2016
2017
2018
Years
Projected ADE Historical ADE Capacity
Effective Capacity/ Enrolment History and ProjectionsPrince of Wales P.S.
0
50
100
150
200
250
300
350
400
450
2003
2004
2005
2006
2007
2008
2009
2010
2011
2012
2013
2014
2015
2016
2017
2018
Years
Projected ADE Historical ADE Capacity
Effective Capacity/ Enrolment History and ProjectionsPortage View P.S.
0
100
200
300
400
500
600
700
2003
2004
2005
2006
2007
2008
2009
2010
2011
2012
2013
2014
2015
2016
2017
2018
Years
Projected ADE Historical ADE Capacity
Effective Capacity/ Enrolment History and ProjectionsAndrew Hunter E.S.
0
100
200
300
400
500
600
700
800
2003
2004
2005
2006
2007
2008
2009
2010
2011
2012
2013
2014
2015
2016
2017
2018
Years
Projected ADE Historical ADE Capacity
Effective Capacity/ Enrolment History and ProjectionsHillcrest P.S.
0
50
100
150
200
250
300
350
400
450
500
2003
2004
2005
2006
2007
2008
2009
2010
2011
2012
2013
2014
2015
2016
2017
2018
Years
Projected ADE Historical ADE Capacity
Effective Capacity/ Enrolment History and ProjectionsWarnica P.S.
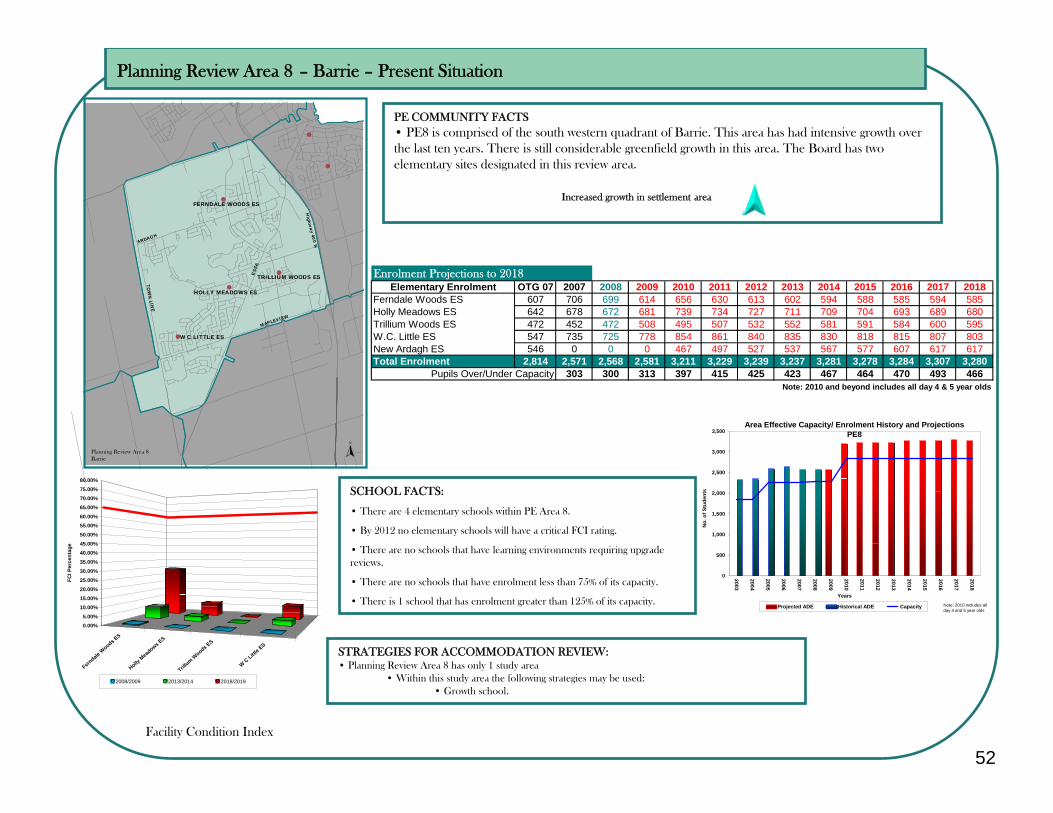
52
Planning Review Area 8 – Barrie – Present Situation
Facility Condition Index
SCHOOL FACTS:
• There are 4 elementary schools within PE Area 8.
• By 2012 no elementary schools will have a critical FCI rating.
• There are no schools that have learning environments requiring upgrade reviews.
• There are no schools that have enrolment less than 75% of its capacity.
• There is 1 school that has enrolment greater than 125% of its capacity.
STRATEGIES FOR ACCOMMODATION REVIEW:• Planning Review Area 8 has only 1 study area
• Within this study area the following strategies may be used:• Growth school.
PE COMMUNITY FACTS• PE8 is comprised of the south western quadrant of Barrie. This area has had intensive growth over the last ten years. There is still considerable greenfield growth in this area. The Board has two elementary sites designated in this review area.
Increased growth in settlement area
N
#
#
#
#
#
#
HOLLY MEADOWS ES
TRILLIUM WOODS ES
FERNDALE WOODS ES
ESS
A
Highw
ay 400 N
MAPLEVIEW
TOW
N L IN
E
ARDAGH
W C LITTLE ES
N
Planning Review Area 8Barrie
Ferndale
Woods ES
Holly M
eadows ES
Trillum W
oods ES
W C Little E
S
0.00%5.00%
10.00%15.00%20.00%25.00%30.00%35.00%40.00%45.00%50.00%55.00%60.00%
65.00%70.00%75.00%80.00%
FCI P
erce
ntag
e
2008/2009 2013/2014 2018/2019
Enrolment Projections to 2018Elementary Enrolment OTG 07 2007 2008 2009 2010 2011 2012 2013 2014 2015 2016 2017 2018
Ferndale Woods ES 607 706 699 614 656 630 613 602 594 588 585 594 585Holly Meadows ES 642 678 672 681 739 734 727 711 709 704 693 689 680Trillium Woods ES 472 452 472 508 495 507 532 552 581 591 584 600 595W.C. Little ES 547 735 725 778 854 861 840 835 830 818 815 807 803New Ardagh ES 546 0 0 0 467 497 527 537 567 577 607 617 617Total Enrolment 2,814 2,571 2,568 2,581 3,211 3,229 3,239 3,237 3,281 3,278 3,284 3,307 3,280
303 300 313 397 415 425 423 467 464 470 493 466Note: 2010 and beyond includes all day 4 & 5 year olds
Pupils Over/Under Capacity
0
500
1,000
1,500
2,000
2,500
3,000
3,500
2003
2004
2005
2006
2007
2008
2009
2010
2011
2012
2013
2014
2015
2016
2017
2018
Years
No.
of S
tude
nts
Projected ADE Historical ADE Capacity
Area Effective Capacity/ Enrolment History and ProjectionsPE8
Note: 2010 includes all day 4 and 5 year olds
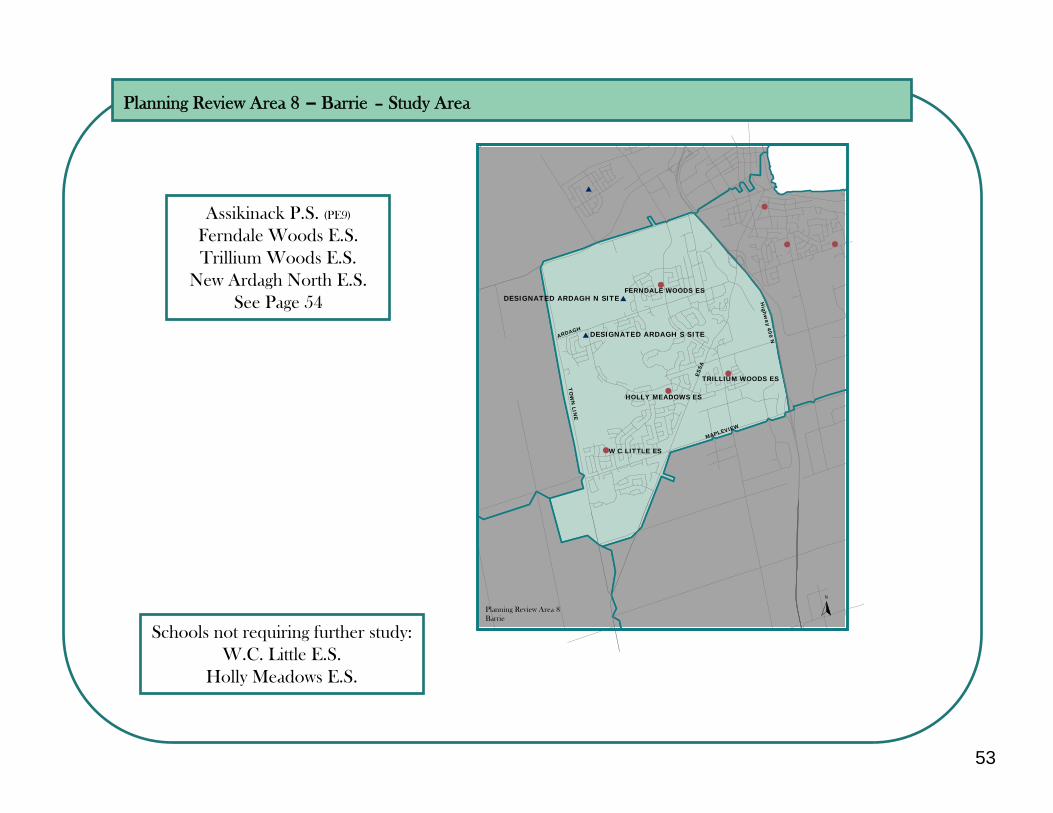
53
Planning Review Area 8 – Barrie – Study Area
Schools not requiring further study:W.C. Little E.S.
Holly Meadows E.S.
Assikinack P.S. (PE9)
Ferndale Woods E.S.Trillium Woods E.S.
New Ardagh North E.S.See Page 54
N
# #
#
#
#
#
#
$
$
$
HOLLY MEADOWS ES
TRILLIUM WOODS ES
FERNDALE WOODS ESDESIGNATED ARDAGH N SITE
DESIGNATED ARDAGH S SITE
ESSA
Highw
ay 400 N
MAPLEVIEW
TO
WN
LI NE
ARDAGH
W C LITTLE ES
N
Planning Review Area 8Barrie
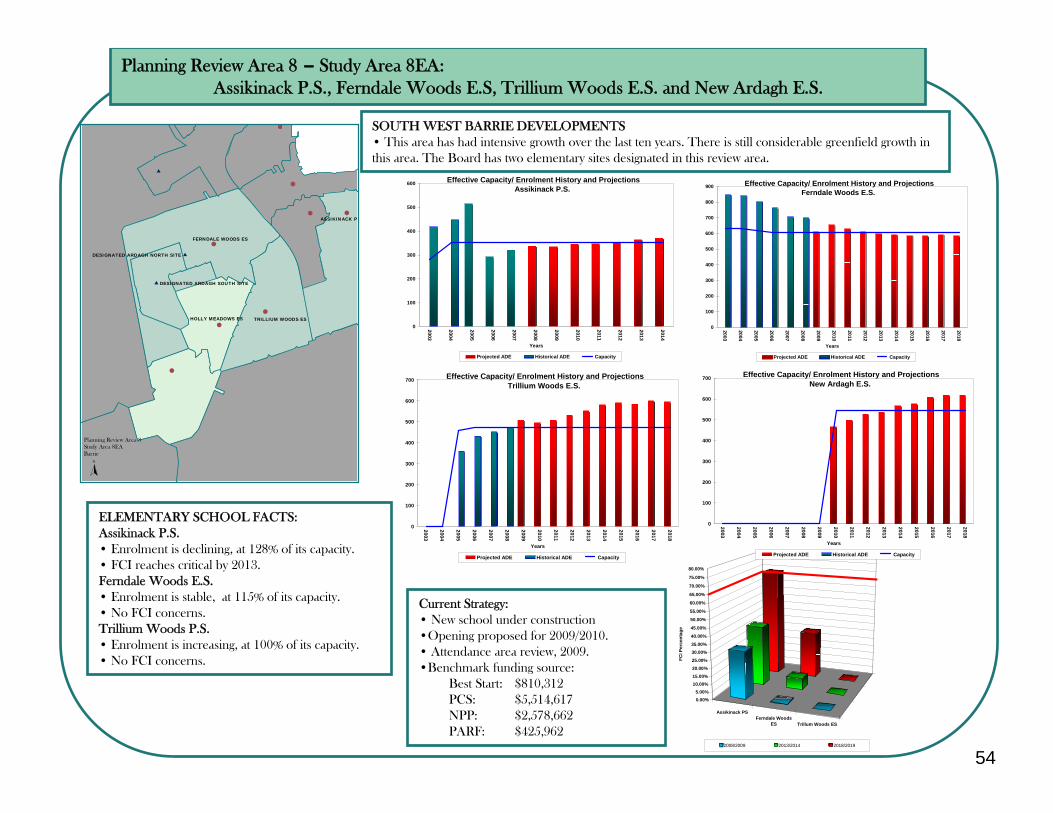
54
Planning Review Area 8 – Study Area 8EA:Assikinack P.S., Ferndale Woods E.S, Trillium Woods E.S. and New Ardagh E.S.
SOUTH WEST BARRIE DEVELOPMENTS• This area has had intensive growth over the last ten years. There is still considerable greenfield growth in this area. The Board has two elementary sites designated in this review area.
ELEMENTARY SCHOOL FACTS:Assikinack P.S.• Enrolment is declining, at 128% of its capacity.• FCI reaches critical by 2013.Ferndale Woods E.S.• Enrolment is stable, at 115% of its capacity.• No FCI concerns.Trillium Woods P.S.• Enrolment is increasing, at 100% of its capacity.• No FCI concerns.
Current Strategy:• New school under construction•Opening proposed for 2009/2010.• Attendance area review, 2009.•Benchmark funding source:
Best Start: $810,312PCS: $5,514,617NPP: $2,578,662PARF: $425,962
$
$
$
# #
#
#
#
#
#
#
DESIGNATED ARDAGH NORTH SITE
HOLLY MEADOWS ES TRILLIUM WOODS ES
FERNDALE WOODS ES
DESIGNATED ARDAGH SOUTH SITE
ASSIKINACK P
Planning Review Area 8Study Area 8EABarrie
N
Assikinack PSFerndale Woods
ES Trillum Woods ES
0.00%5.00%
10.00%15.00%20.00%25.00%
30.00%35.00%
40.00%
45.00%
50.00%
55.00%
60.00%
65.00%
70.00%
75.00%
80.00%
FCI P
erce
ntag
e
2008/2009 2013/2014 2018/2019
0
100
200
300
400
500
600
700
2003
2004
2005
2006
2007
2008
2009
2010
2011
2012
2013
2014
2015
2016
2017
2018
Years
Projected ADE Historical ADE Capacity
Effective Capacity/ Enrolment History and ProjectionsTrillium Woods E.S.
0
100
200
300
400
500
600
700
2003
2004
2005
2006
2007
2008
2009
2010
2011
2012
2013
2014
2015
2016
2017
2018
Years
Projected ADE Historical ADE Capacity
Effective Capacity/ Enrolment History and ProjectionsNew Ardagh E.S.
0
100
200
300
400
500
600
2003
2004
2005
2006
2007
2008
2009
2010
2011
2012
2013
2014
Years
Projected ADE Historical ADE Capacity
Effective Capacity/ Enrolment History and ProjectionsAssikinack P.S.
0
100
200
300
400
500
600
700
800
900
2003
2004
2005
2006
2007
2008
2009
2010
2011
2012
2013
2014
2015
2016
2017
2018
Years
Projected ADE Historical ADE Capacity
Effective Capacity/ Enrolment History and ProjectionsFerndale Woods E.S.
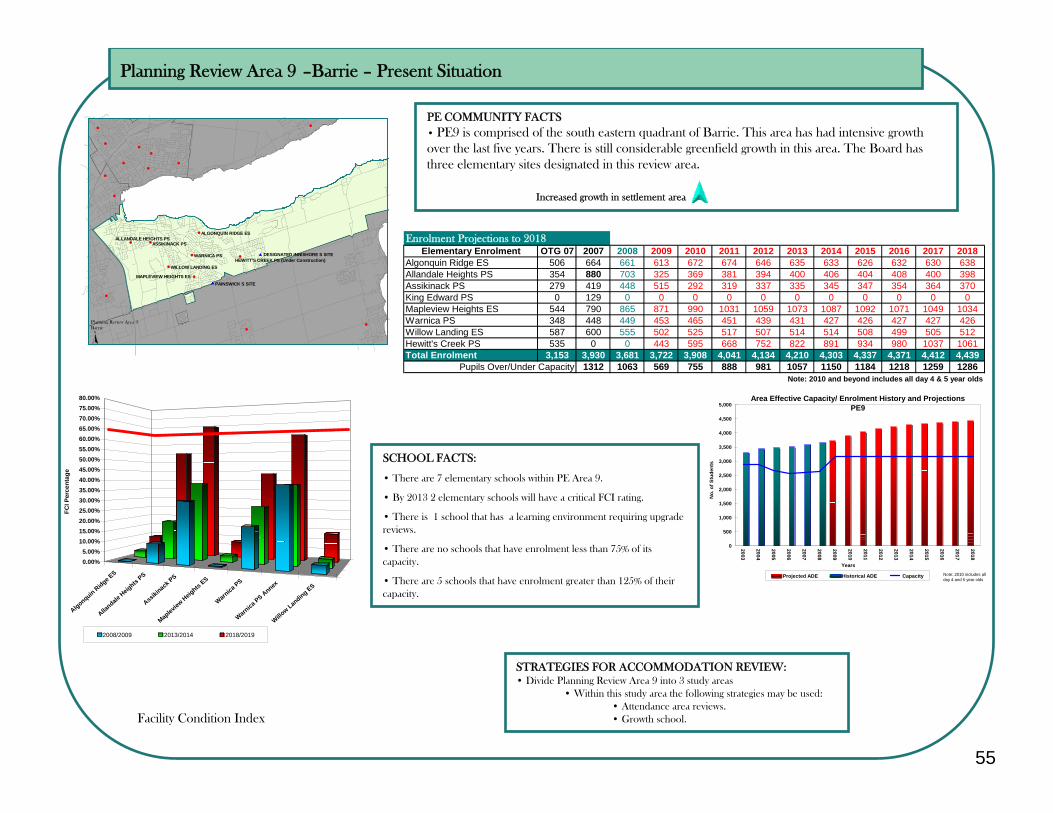
55
Planning Review Area 9 –Barrie – Present Situation
Facility Condition Index
SCHOOL FACTS:
• There are 7 elementary schools within PE Area 9.
• By 2013 2 elementary schools will have a critical FCI rating.
• There is 1 school that has a learning environment requiring upgrade reviews.
• There are no schools that have enrolment less than 75% of its capacity.
• There are 5 schools that have enrolment greater than 125% of their capacity.
STRATEGIES FOR ACCOMMODATION REVIEW:• Divide Planning Review Area 9 into 3 study areas
• Within this study area the following strategies may be used:• Attendance area reviews.• Growth school.
PE COMMUNITY FACTS• PE9 is comprised of the south eastern quadrant of Barrie. This area has had intensive growth over the last five years. There is still considerable greenfield growth in this area. The Board has three elementary sites designated in this review area.
Increased growth in settlement area
Algonquin Ridge ES
Allandale
Heights
PS
Assikinack
PS
Maplev
iew Heig
hts ES
Warnica
PS
Warnica PS Annex
Willow Lan
ding ES
0.00%5.00%
10.00%15.00%20.00%25.00%30.00%35.00%40.00%45.00%50.00%55.00%60.00%65.00%70.00%75.00%80.00%
FCI P
erce
ntag
e
2008/2009 2013/2014 2018/2019
#
#
#
# #
#
#
#
#
#
#
#
#
#
#
#
#
#
#
#
$
$
ALLANDALE HEIGHTS PSASSIKINACK PS
ALGONQUIN RIDGE ES
WARNICA PS
MAPLEVIEW HEIGHTS ES
WILLOW LANDING ESHEWITT'S CREEK PS (Under Construction)
DESIGNATED INNISHORE S SITE
PAINSWICK S SITE
Planning Review Area 9Barrie
N
Enrolment Projections to 2018Elementary Enrolment OTG 07 2007 2008 2009 2010 2011 2012 2013 2014 2015 2016 2017 2018
Algonquin Ridge ES 506 664 661 613 672 674 646 635 633 626 632 630 638Allandale Heights PS 354 880 703 325 369 381 394 400 406 404 408 400 398Assikinack PS 279 419 448 515 292 319 337 335 345 347 354 364 370King Edward PS 0 129 0 0 0 0 0 0 0 0 0 0 0Mapleview Heights ES 544 790 865 871 990 1031 1059 1073 1087 1092 1071 1049 1034Warnica PS 348 448 449 453 465 451 439 431 427 426 427 427 426Willow Landing ES 587 600 555 502 525 517 507 514 514 508 499 505 512Hewitt's Creek PS 535 0 0 443 595 668 752 822 891 934 980 1037 1061Total Enrolment 3,153 3,930 3,681 3,722 3,908 4,041 4,134 4,210 4,303 4,337 4,371 4,412 4,439
1312 1063 569 755 888 981 1057 1150 1184 1218 1259 1286Note: 2010 and beyond includes all day 4 & 5 year olds
Pupils Over/Under Capacity
0
500
1,000
1,500
2,000
2,500
3,000
3,500
4,000
4,500
5,000
2003
2004
2005
2006
2007
2008
2009
2010
2011
2012
2013
2014
2015
2016
2017
2018
Years
No.
of S
tude
nts
Projected ADE Historical ADE Capacity
Area Effective Capacity/ Enrolment History and ProjectionsPE9
Note: 2010 includes all day 4 and 5 year olds
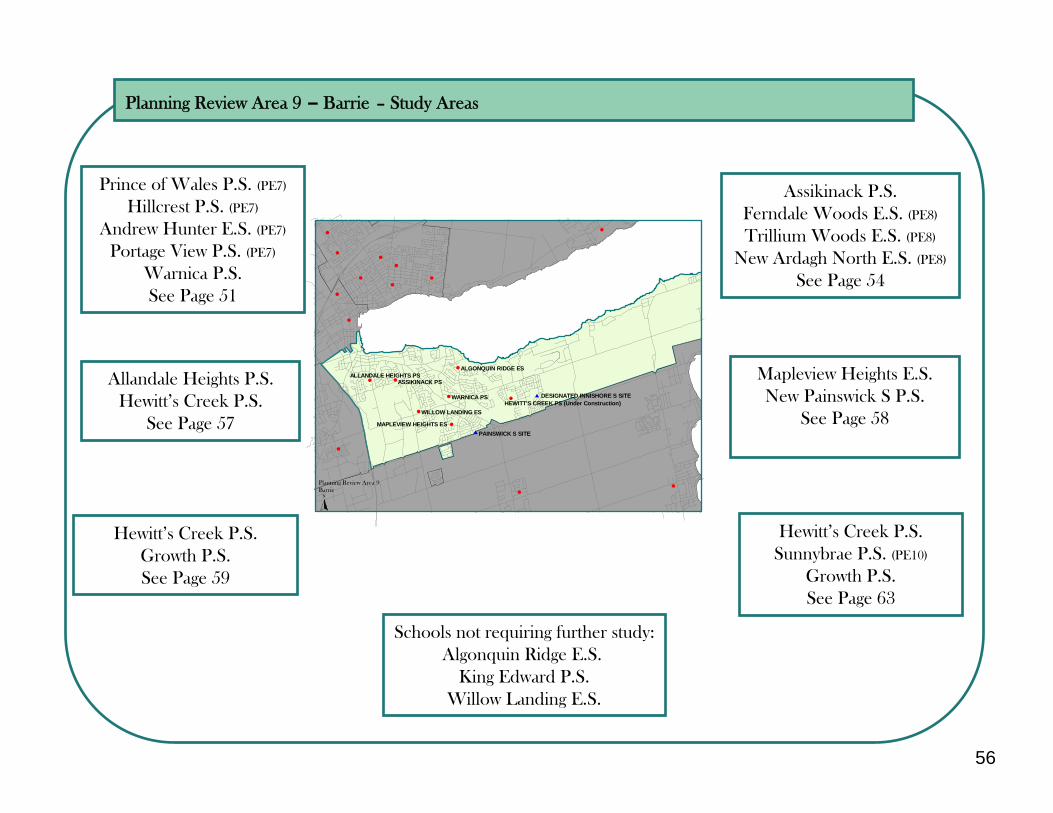
56
Planning Review Area 9 – Barrie – Study Areas
Schools not requiring further study:Algonquin Ridge E.S.
King Edward P.S.Willow Landing E.S.
Allandale Heights P.S.Hewitt’s Creek P.S.
See Page 57
Hewitt’s Creek P.S.Growth P.S.See Page 59
Mapleview Heights E.S.New Painswick S P.S.
See Page 58
Hewitt’s Creek P.S.Sunnybrae P.S. (PE10)
Growth P.S.See Page 63
#
##
# #
#
#
#
#
#
#
#
#
#
#
#
#
#
#
#
$
$
ALLANDALE HEIGHTS PSASSIKINACK PS
ALGONQUIN RIDGE ES
WARNICA PS
MAPLEVIEW HEIGHTS ES
WILLOW LANDING ESHEWITT'S CREEK PS (Under Construction)
DESIGNATED INNISHORE S SITE
PAINSWICK S SITE
Planning Review Area 9Barrie
N
Prince of Wales P.S. (PE7)
Hillcrest P.S. (PE7)
Andrew Hunter E.S. (PE7)
Portage View P.S. (PE7)
Warnica P.S. See Page 51
Assikinack P.S. Ferndale Woods E.S. (PE8)
Trillium Woods E.S. (PE8)
New Ardagh North E.S. (PE8)
See Page 54
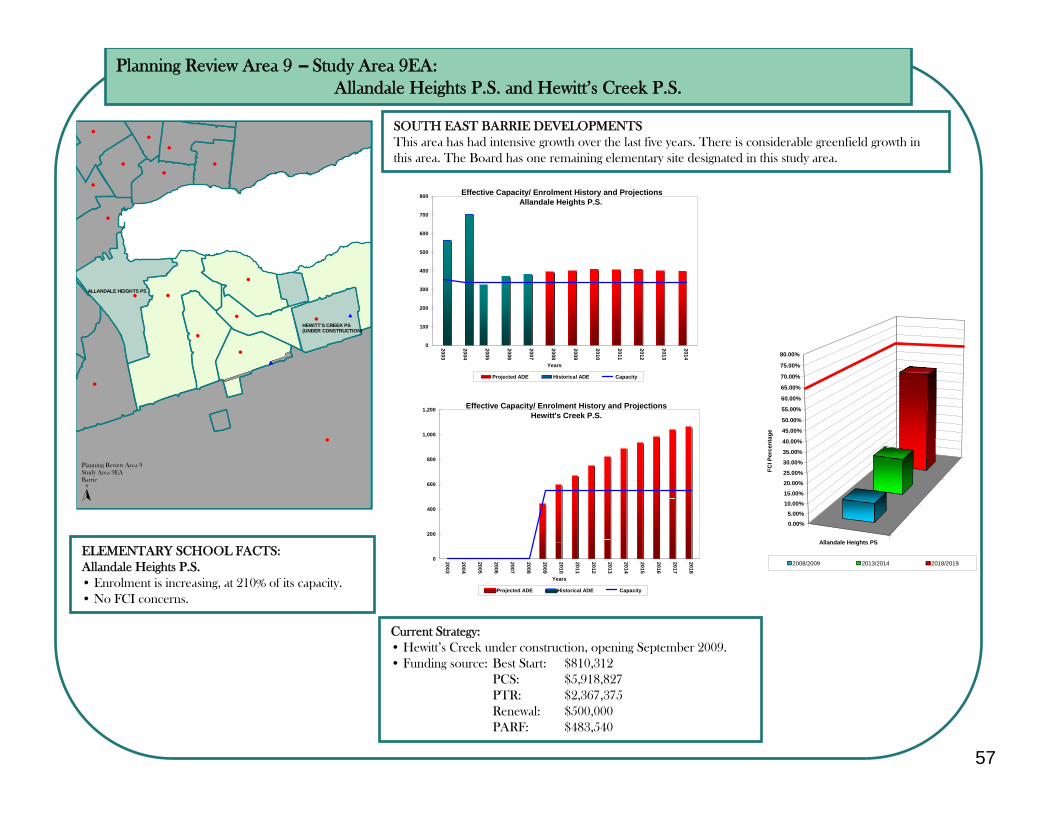
57
Planning Review Area 9 – Study Area 9EA:Allandale Heights P.S. and Hewitt’s Creek P.S.
SOUTH EAST BARRIE DEVELOPMENTSThis area has had intensive growth over the last five years. There is considerable greenfield growth in this area. The Board has one remaining elementary site designated in this study area.
ELEMENTARY SCHOOL FACTS:Allandale Heights P.S.• Enrolment is increasing, at 210% of its capacity.• No FCI concerns.
Current Strategy:• Hewitt’s Creek under construction, opening September 2009.• Funding source: Best Start: $810,312
PCS: $5,918,827PTR: $2,367,375Renewal: $500,000PARF: $483,540
Allandale Heights PS
0.00%5.00%
10.00%15.00%
20.00%
25.00%
30.00%
35.00%
40.00%
45.00%
50.00%
55.00%
60.00%
65.00%
70.00%
75.00%
80.00%
FCI P
erce
ntag
e
2008/2009 2013/2014 2018/2019
0
100
200
300
400
500
600
700
800
2003
2004
2005
2006
2007
2008
2009
2010
2011
2012
2013
2014Years
Projected ADE Historical ADE Capacity
Effective Capacity/ Enrolment History and ProjectionsAllandale Heights P.S.
#
# #
#
#
#
#
#
#
#
#
#
#
#
#
#
#
$
$
ALLANDALE HEIGHTS PS
HEWITT'S CREEK PS(UNDER CONSTRUCTION)
Planning Review Area 9Study Area 9EABarrie
N
0
200
400
600
800
1,000
1,200
2003
2004
2005
2006
2007
2008
2009
2010
2011
2012
2013
2014
2015
2016
2017
2018
Years
Projected ADE Historical ADE Capacity
Effective Capacity/ Enrolment History and Projections Hewitt's Creek P.S.
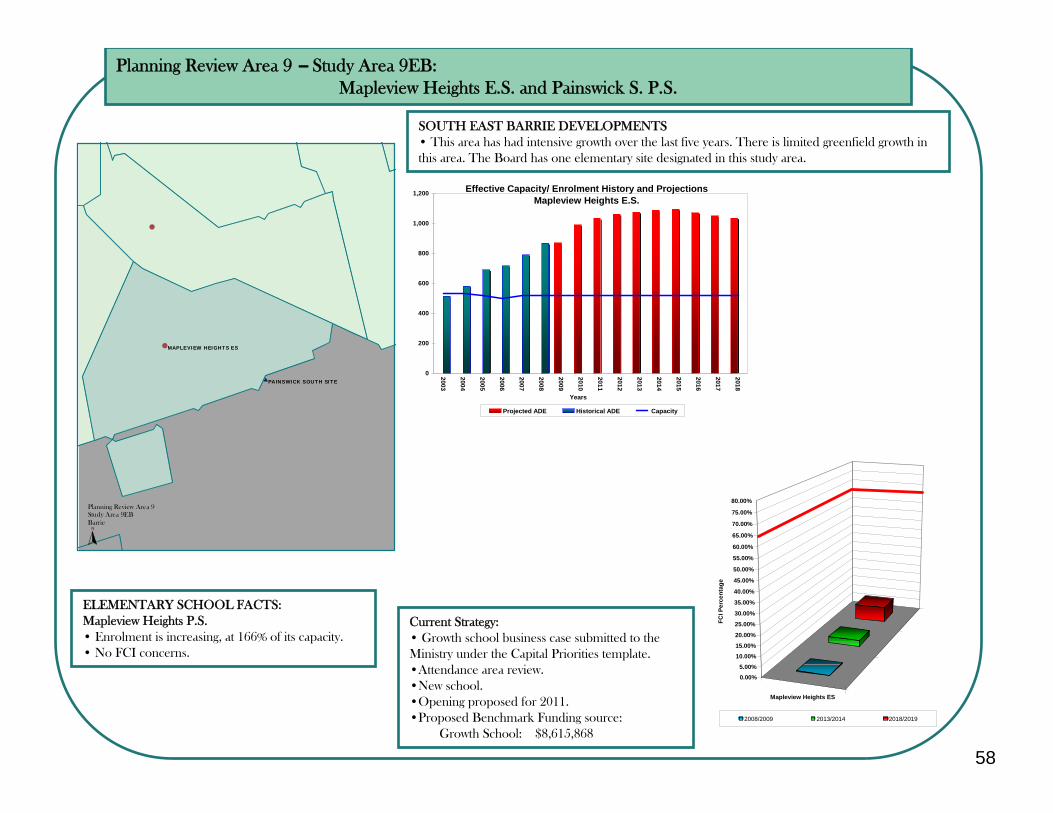
58
Planning Review Area 9 – Study Area 9EB:Mapleview Heights E.S. and Painswick S. P.S.
SOUTH EAST BARRIE DEVELOPMENTS• This area has had intensive growth over the last five years. There is limited greenfield growth in this area. The Board has one elementary site designated in this study area.
ELEMENTARY SCHOOL FACTS:Mapleview Heights P.S.• Enrolment is increasing, at 166% of its capacity.• No FCI concerns.
Current Strategy:• Growth school business case submitted to the Ministry under the Capital Priorities template.•Attendance area review.•New school.•Opening proposed for 2011.•Proposed Benchmark Funding source:
Growth School: $8,615,868
$
#
#MAPLEVIEW HEIGHTS ES
PAINSWICK SOUTH SITE
Planning Review Area 9Study Area 9EBBarrie
N
Mapleview Heights ES
0.00%5.00%
10.00%15.00%
20.00%
25.00%
30.00%
35.00%
40.00%
45.00%
50.00%
55.00%
60.00%
65.00%
70.00%
75.00%
80.00%
FCI P
erce
ntag
e2008/2009 2013/2014 2018/2019
0
200
400
600
800
1,000
1,200
2003
2004
2005
2006
2007
2008
2009
2010
2011
2012
2013
2014
2015
2016
2017
2018
Years
Projected ADE Historical ADE Capacity
Effective Capacity/ Enrolment History and Projections Mapleview Heights E.S.
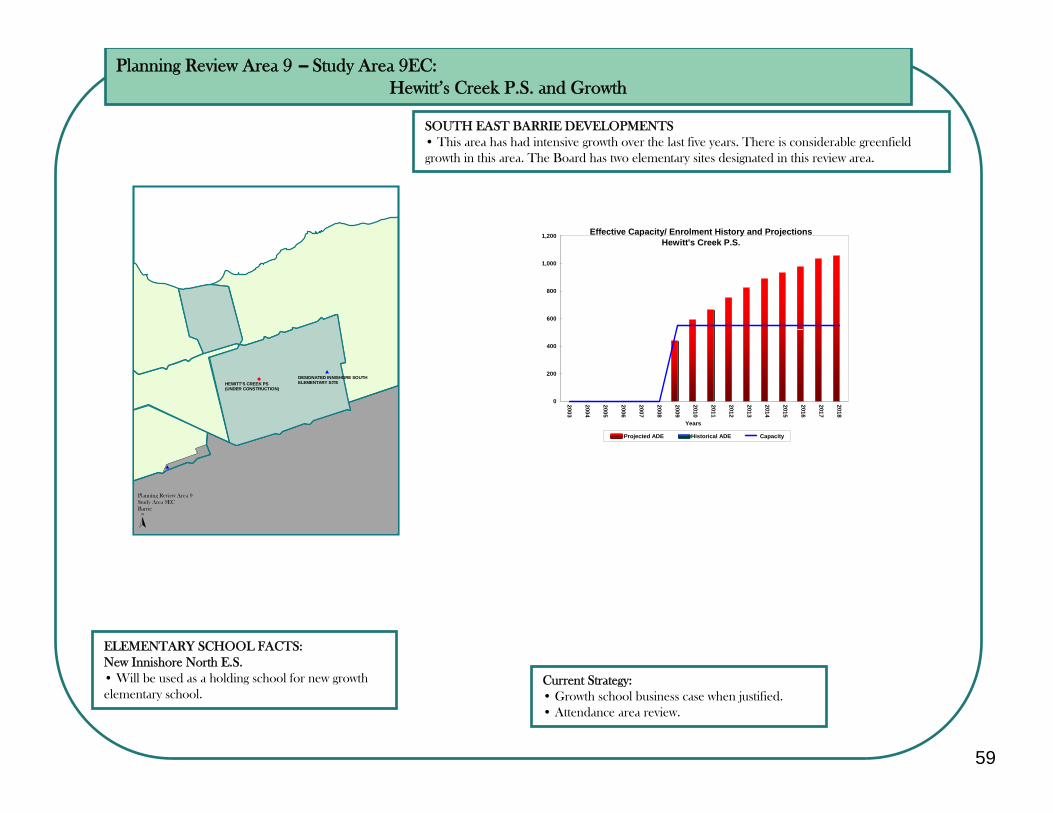
59
Planning Review Area 9 – Study Area 9EC:Hewitt’s Creek P.S. and Growth
SOUTH EAST BARRIE DEVELOPMENTS• This area has had intensive growth over the last five years. There is considerable greenfieldgrowth in this area. The Board has two elementary sites designated in this review area.
ELEMENTARY SCHOOL FACTS:New Innishore North E.S.• Will be used as a holding school for new growth elementary school.
Current Strategy:• Growth school business case when justified.• Attendance area review.
#
$
$
HEWITT'S CREEK PS(UNDER CONSTRUCTION)
DESIGNATED INNISHORE SOUTHELEMENTARY SITE
Planning Review Area 9Study Area 9ECBarrie
N
0
200
400
600
800
1,000
1,200
2003
2004
2005
2006
2007
2008
2009
2010
2011
2012
2013
2014
2015
2016
2017
2018
Years
Projected ADE Historical ADE Capacity
Effective Capacity/ Enrolment History and Projections Hewitt's Creek P.S.
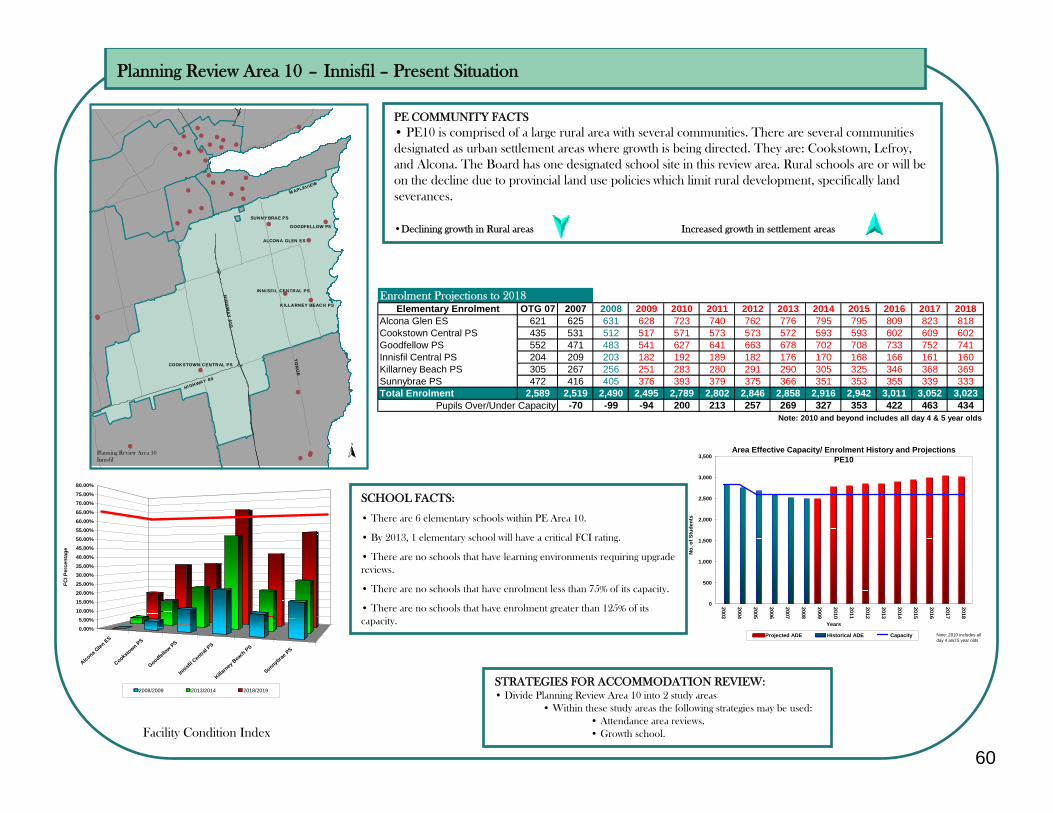
60
Planning Review Area 10 – Innisfil – Present Situation
Facility Condition Index
SCHOOL FACTS:
• There are 6 elementary schools within PE Area 10.
• By 2013, 1 elementary school will have a critical FCI rating.
• There are no schools that have learning environments requiring upgrade reviews.
• There are no schools that have enrolment less than 75% of its capacity.
• There are no schools that have enrolment greater than 125% of its capacity.
STRATEGIES FOR ACCOMMODATION REVIEW:• Divide Planning Review Area 10 into 2 study areas
• Within these study areas the following strategies may be used:• Attendance area reviews.• Growth school.
PE COMMUNITY FACTS• PE10 is comprised of a large rural area with several communities. There are several communities designated as urban settlement areas where growth is being directed. They are: Cookstown, Lefroy, and Alcona. The Board has one designated school site in this review area. Rural schools are or will be on the decline due to provincial land use policies which limit rural development, specifically land severances.
•Declining growth in Rural areas Increased growth in settlement areas
N
#
#
# #
##
#
#
#
###
#
#
#
#
###
#
#
#
#
##
# ##
#
#
#
#
#
#
#
#
#
#
ALCONA GLEN ES
GOODFELLOW PS
SUNNYBRAE PS
INNISFIL CENTRAL PS
KILLARNEY BEACH PS
COOKSTOWN CENTRAL PS
HIG
HW
AY
400
YO
NG
E
MAPLEVIEW
HIGHWAY 89
Planning Review Area 10Innisfil
Alcona G
len ES
Cookstown PS
Goodfellow PS
Innisfil Cen
tral P
S
Killarney B
each
PS
Sunnybrae PS
0.00%5.00%
10.00%15.00%20.00%25.00%30.00%35.00%40.00%45.00%50.00%55.00%60.00%65.00%70.00%75.00%80.00%
FCI P
erce
ntag
e
2008/2009 2013/2014 2018/2019
Enrolment Projections to 2018Elementary Enrolment OTG 07 2007 2008 2009 2010 2011 2012 2013 2014 2015 2016 2017 2018
Alcona Glen ES 621 625 631 628 723 740 762 776 795 795 809 823 818Cookstown Central PS 435 531 512 517 571 573 573 572 593 593 602 609 602Goodfellow PS 552 471 483 541 627 641 663 678 702 708 733 752 741Innisfil Central PS 204 209 203 182 192 189 182 176 170 168 166 161 160Killarney Beach PS 305 267 256 251 283 280 291 290 305 325 346 368 369Sunnybrae PS 472 416 405 376 393 379 375 366 351 353 355 339 333Total Enrolment 2,589 2,519 2,490 2,495 2,789 2,802 2,846 2,858 2,916 2,942 3,011 3,052 3,023
-70 -99 -94 200 213 257 269 327 353 422 463 434Note: 2010 and beyond includes all day 4 & 5 year olds
Pupils Over/Under Capacity
0
500
1,000
1,500
2,000
2,500
3,000
3,500
2003
2004
2005
2006
2007
2008
2009
2010
2011
2012
2013
2014
2015
2016
2017
2018
Years
No.
of S
tude
nts
Projected ADE Historical ADE Capacity
Area Effective Capacity/ Enrolment History and ProjectionsPE10
Note: 2010 includes all day 4 and 5 year olds
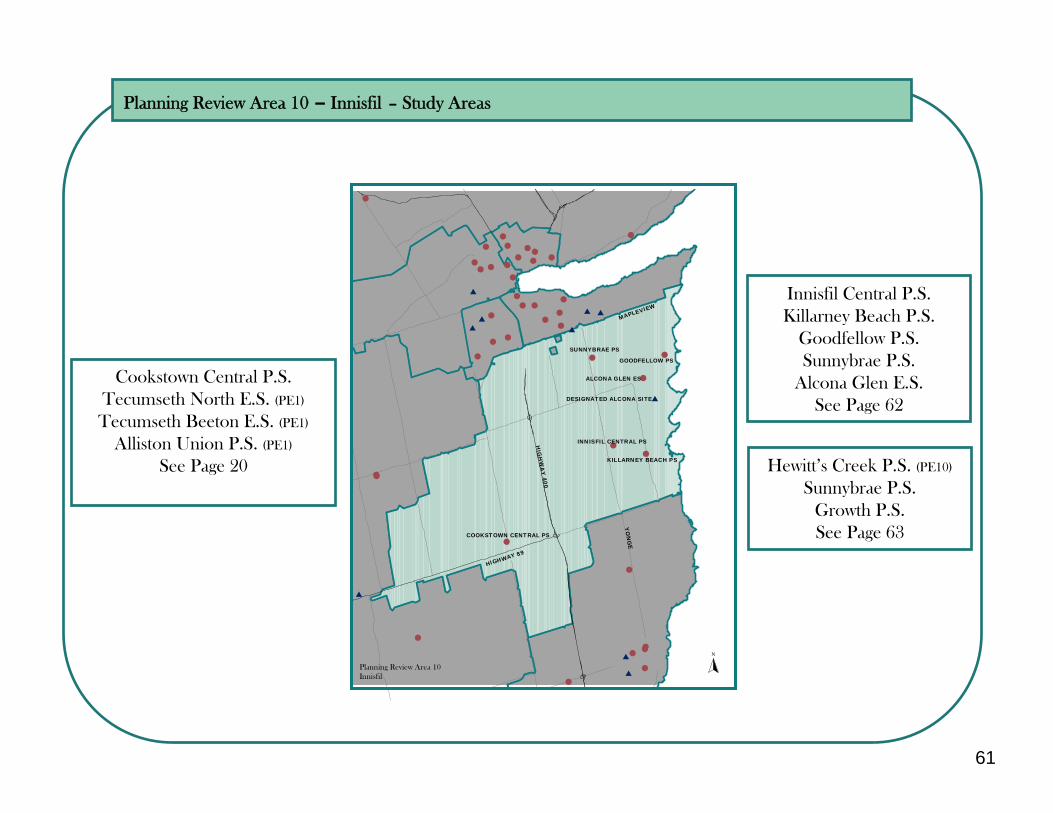
61
Planning Review Area 10 – Innisfil – Study Areas
Cookstown Central P.S.Tecumseth North E.S. (PE1)
Tecumseth Beeton E.S. (PE1)
Alliston Union P.S. (PE1)
See Page 20
Innisfil Central P.S.Killarney Beach P.S.
Goodfellow P.S.Sunnybrae P.S.
Alcona Glen E.S.See Page 62
N
#
#
#
# #
##
#
#
#
###
#
#
#
#
#
#
###
#
#
#
#
##
# ##
#
#
#
#
#
#
#
##
#
$
$
$
$
$$
$ $
$
$
ALCONA GLEN ES
GOODFELLOW PS
SUNNYBRAE PS
INNISFIL CENTRAL PS
KILLARNEY BEACH PS
COOKSTOWN CENTRAL PS
DESIGNATED ALCONA SITE
HIG
HW
AY
400
YO
NG
E
MAPLEVIEW
HIGHWAY 89
Planning Review Area 10Innisfil
Hewitt’s Creek P.S. (PE10)
Sunnybrae P.S. Growth P.S. See Page 63
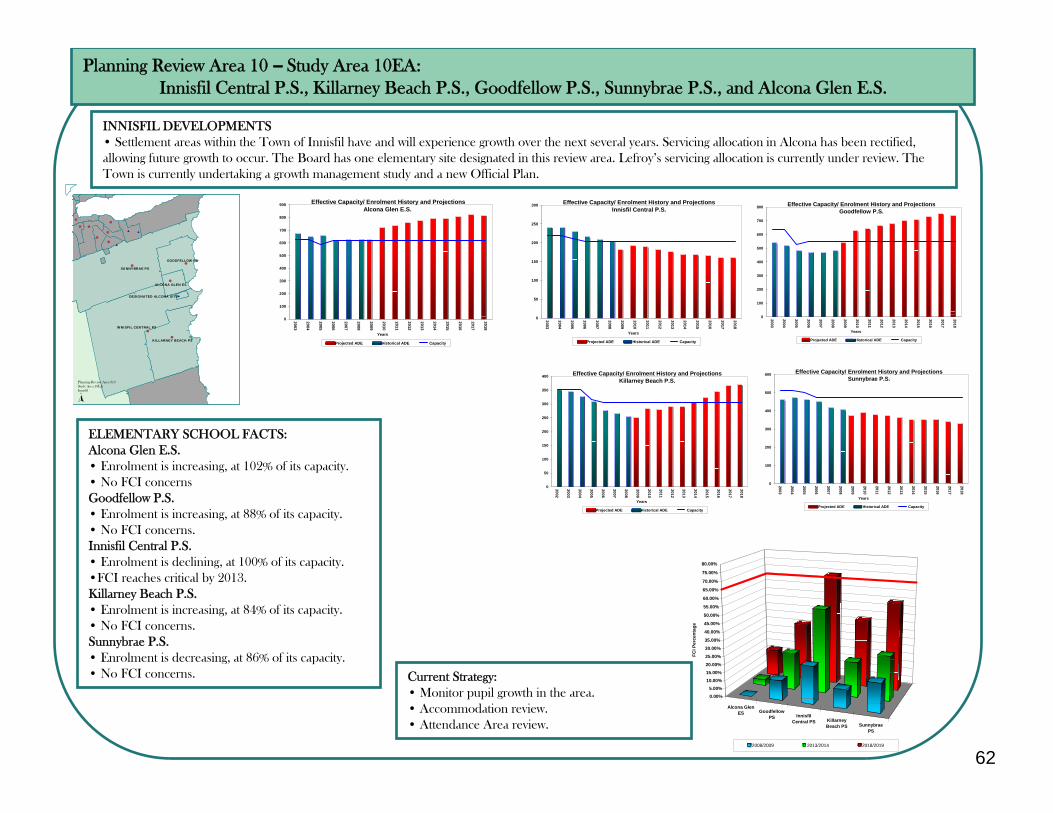
62
Planning Review Area 10 – Study Area 10EA:Innisfil Central P.S., Killarney Beach P.S., Goodfellow P.S., Sunnybrae P.S., and Alcona Glen E.S.
INNISFIL DEVELOPMENTS• Settlement areas within the Town of Innisfil have and will experience growth over the next several years. Servicing allocation in Alcona has been rectified, allowing future growth to occur. The Board has one elementary site designated in this review area. Lefroy’s servicing allocation is currently under review. The Town is currently undertaking a growth management study and a new Official Plan.
ELEMENTARY SCHOOL FACTS:Alcona Glen E.S.• Enrolment is increasing, at 102% of its capacity.• No FCI concernsGoodfellow P.S.• Enrolment is increasing, at 88% of its capacity.• No FCI concerns.Innisfil Central P.S.• Enrolment is declining, at 100% of its capacity.•FCI reaches critical by 2013.Killarney Beach P.S.• Enrolment is increasing, at 84% of its capacity.• No FCI concerns.Sunnybrae P.S.• Enrolment is decreasing, at 86% of its capacity.• No FCI concerns. Current Strategy:
• Monitor pupil growth in the area.• Accommodation review.• Attendance Area review.
$
$
$ $
##
#
#
#
# #
#
#
#
#
#
GOODFELLOW PS
SUNNYBRAE PS
INNISFIL CENTRAL PS
KILLARNEY BEACH PS
ALCONA GLEN ES
DESIGNATED ALCONA SITE
Planning Review Area 910Study Area 10EAInnisfil
N
Alcona GlenES Goodfellow
PS InnisfilCentral PS Killarney
Beach PS SunnybraePS
0.00%5.00%
10.00%15.00%20.00%
25.00%
30.00%
35.00%
40.00%
45.00%
50.00%
55.00%
60.00%
65.00%
70.00%
75.00%
80.00%
FCI P
erce
ntag
e
2008/2009 2013/2014 2018/2019
0
50
100
150
200
250
300
2003
2004
2005
2006
2007
2008
2009
2010
2011
2012
2013
2014
2015
2016
2017
2018
Years
Projected ADE Historical ADE Capacity
Effective Capacity/ Enrolment History and Projections Innisfil Central P.S.
0
100
200
300
400
500
600
700
800
2003
2004
2005
2006
2007
2008
2009
2010
2011
2012
2013
2014
2015
2016
2017
2018
Years
Projected ADE Historical ADE Capacity
Effective Capacity/ Enrolment History and Projections Goodfellow P.S.
0
100
200
300
400
500
600
2003
2004
2005
2006
2007
2008
2009
2010
2011
2012
2013
2014
2015
2016
2017
2018
Years
Projected ADE Historical ADE Capacity
Effective Capacity/ Enrolment History and Projections Sunnybrae P.S.
0
50
100
150
200
250
300
350
400
2002
2003
2004
2005
2006
2007
2008
2009
2010
2011
2012
2013
2014
2015
2016
2017
2018
Years
Projected ADE Historical ADE Capacity
Effective Capacity/ Enrolment History and Projections Killarney Beach P.S.
0
100
200
300
400
500
600
700
800
900
2003
2004
2005
2006
2007
2008
2009
2010
2011
2012
2013
2014
2015
2016
2017
2018
Years
Projected ADE Historical ADE Capacity
Effective Capacity/ Enrolment History and ProjectionsAlcona Glen E.S.
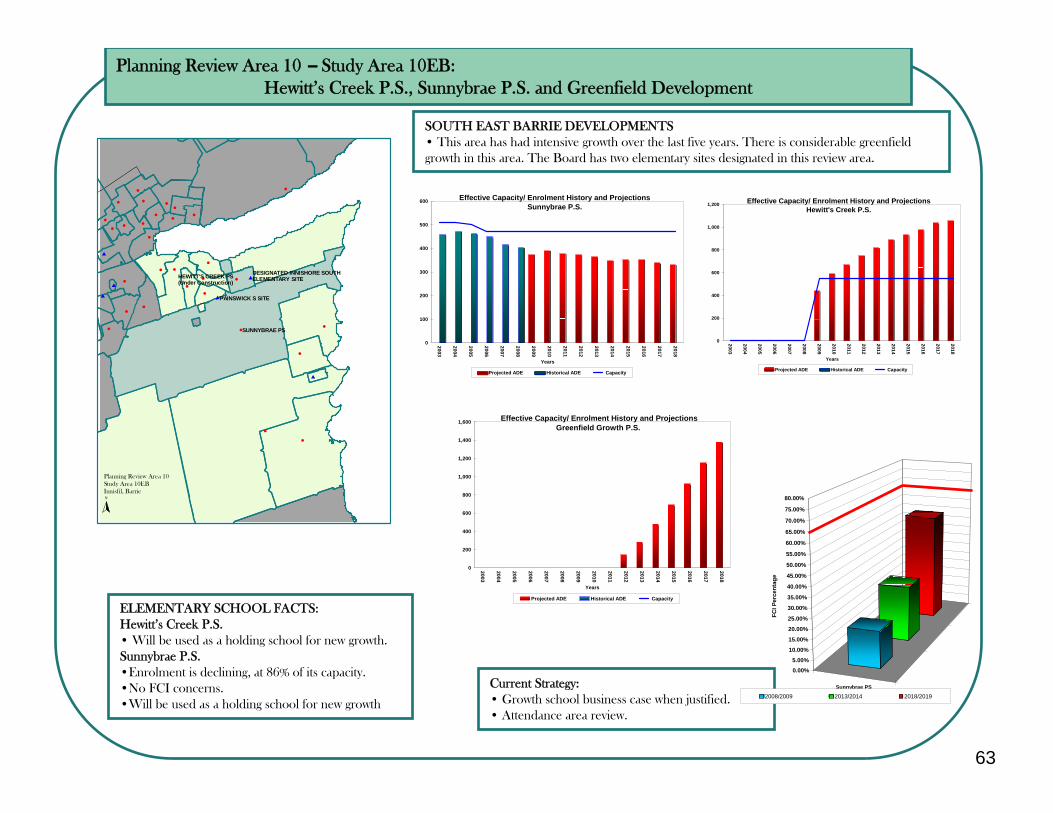
63
Planning Review Area 10 – Study Area 10EB:Hewitt’s Creek P.S., Sunnybrae P.S. and Greenfield Development
SOUTH EAST BARRIE DEVELOPMENTS• This area has had intensive growth over the last five years. There is considerable greenfieldgrowth in this area. The Board has two elementary sites designated in this review area.
ELEMENTARY SCHOOL FACTS:Hewitt’s Creek P.S.• Will be used as a holding school for new growth. Sunnybrae P.S.•Enrolment is declining, at 86% of its capacity.•No FCI concerns.•Will be used as a holding school for new growth
Current Strategy:• Growth school business case when justified.• Attendance area review.
0
200
400
600
800
1,000
1,200
1,400
1,600
2003
2004
2005
2006
2007
2008
2009
2010
2011
2012
2013
2014
2015
2016
2017
2018
Years
Projected ADE Historical ADE Capacity
Effective Capacity/ Enrolment History and ProjectionsGreenfield Growth P.S.
0
100
200
300
400
500
600
2003
2004
2005
2006
2007
2008
2009
2010
2011
2012
2013
2014
2015
2016
2017
2018
Years
Projected ADE Historical ADE Capacity
Effective Capacity/ Enrolment History and Projections Sunnybrae P.S.
Sunnybrae PS
0.00%
5.00%
10.00%
15.00%
20.00%
25.00%
30.00%
35.00%
40.00%
45.00%
50.00%
55.00%
60.00%
65.00%
70.00%
75.00%
80.00%
FCI P
erce
ntag
e
2008/2009 2013/2014 2018/2019
#
##
#
#
#
#
#
#
#
##
#
#
#
#
#
##
#
#
#
#
#
#
#
#
#
#
#
$
$
$
$
$
$HEWITT'S CREEK PS(Under Construction)
SUNNYBRAE PS
DESIGNATED INNISHORE SOUTHELEMENTARY SITE
PAINSWICK S SITE
N
Planning Review Area 10Study Area 10EBInnisfil, Barrie
0
200
400
600
800
1,000
1,200
2003
2004
2005
2006
2007
2008
2009
2010
2011
2012
2013
2014
2015
2016
2017
2018
Years
Projected ADE Historical ADE Capacity
Effective Capacity/ Enrolment History and Projections Hewitt's Creek P.S.
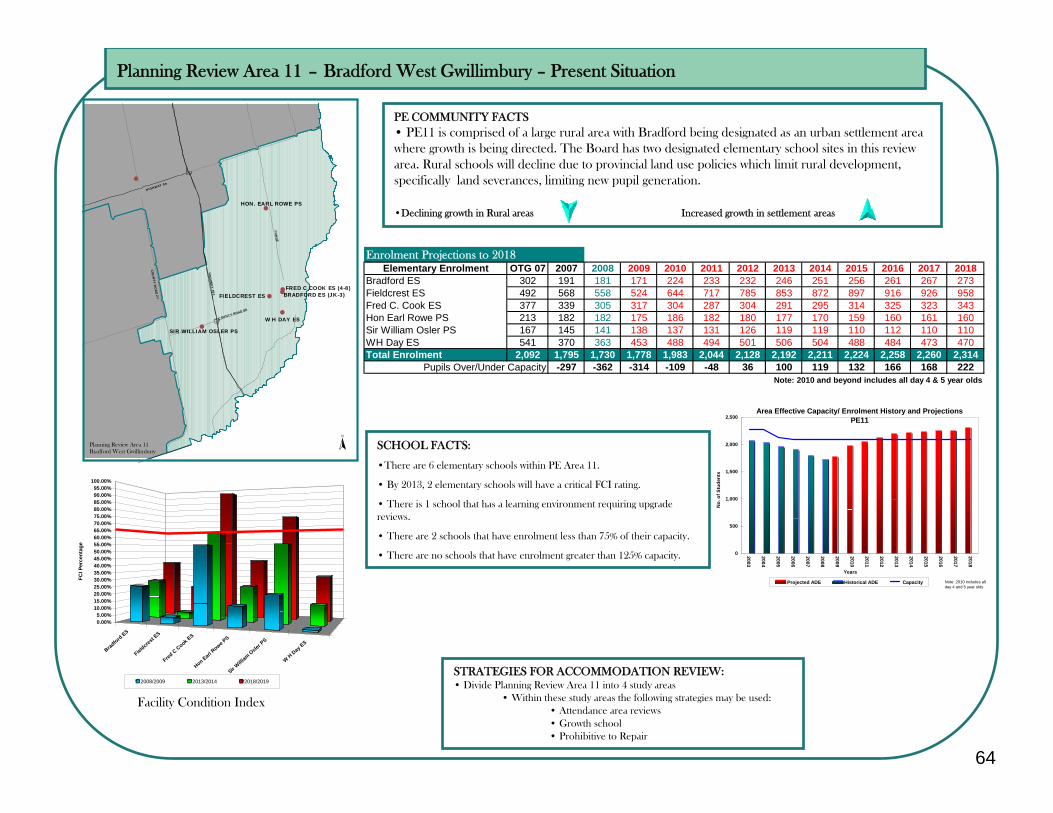
64
Planning Review Area 11 – Bradford West Gwillimbury – Present Situation
Facility Condition Index
SCHOOL FACTS:
•There are 6 elementary schools within PE Area 11.
• By 2013, 2 elementary schools will have a critical FCI rating.
• There is 1 school that has a learning environment requiring upgrade reviews.
• There are 2 schools that have enrolment less than 75% of their capacity.
• There are no schools that have enrolment greater than 125% capacity.
STRATEGIES FOR ACCOMMODATION REVIEW:• Divide Planning Review Area 11 into 4 study areas
• Within these study areas the following strategies may be used:• Attendance area reviews• Growth school• Prohibitive to Repair
PE COMMUNITY FACTS• PE11 is comprised of a large rural area with Bradford being designated as an urban settlement area where growth is being directed. The Board has two designated elementary school sites in this review area. Rural schools will decline due to provincial land use policies which limit rural development, specifically land severances, limiting new pupil generation.
•Declining growth in Rural areas Increased growth in settlement areas
#
#
###
#
#
HON. EARL ROWE PS
FRED C COOK ES (4-8)BRADFORD ES (JK-3)
W H DAY ES
FIELDCREST ES
SIR WILLIAM OSLER PS
YO
NG
E
HIG
HW
AY
400
COUNTY ROAD 88
CO
UN
TY
RO
AD
27
HIGHWAY 89
N
Planning Review Area 11Bradford West Gwillimbury
Enrolment Projections to 2018Elementary Enrolment OTG 07 2007 2008 2009 2010 2011 2012 2013 2014 2015 2016 2017 2018
Bradford ES 302 191 181 171 224 233 232 246 251 256 261 267 273Fieldcrest ES 492 568 558 524 644 717 785 853 872 897 916 926 958Fred C. Cook ES 377 339 305 317 304 287 304 291 295 314 325 323 343Hon Earl Rowe PS 213 182 182 175 186 182 180 177 170 159 160 161 160Sir William Osler PS 167 145 141 138 137 131 126 119 119 110 112 110 110WH Day ES 541 370 363 453 488 494 501 506 504 488 484 473 470Total Enrolment 2,092 1,795 1,730 1,778 1,983 2,044 2,128 2,192 2,211 2,224 2,258 2,260 2,314
-297 -362 -314 -109 -48 36 100 119 132 166 168 222Note: 2010 and beyond includes all day 4 & 5 year olds
Pupils Over/Under Capacity
Bradford ES
Fieldcre
st ES
Fred C Cook E
S
Hon Earl Rowe P
S
Sir Willi
am O
sler P
S
W H Day ES
0.00%5.00%
10.00%15.00%20.00%25.00%30.00%35.00%40.00%45.00%50.00%55.00%60.00%65.00%70.00%75.00%80.00%85.00%90.00%95.00%
100.00%
FCI P
erce
ntag
e
2008/2009 2013/2014 2018/2019
0
500
1,000
1,500
2,000
2,500
2003
2004
2005
2006
2007
2008
2009
2010
2011
2012
2013
2014
2015
2016
2017
2018
Years
No.
of S
tude
nts
Projected ADE Historical ADE Capacity
Area Effective Capacity/ Enrolment History and ProjectionsPE11
Note: 2010 includes all day 4 and 5 year olds
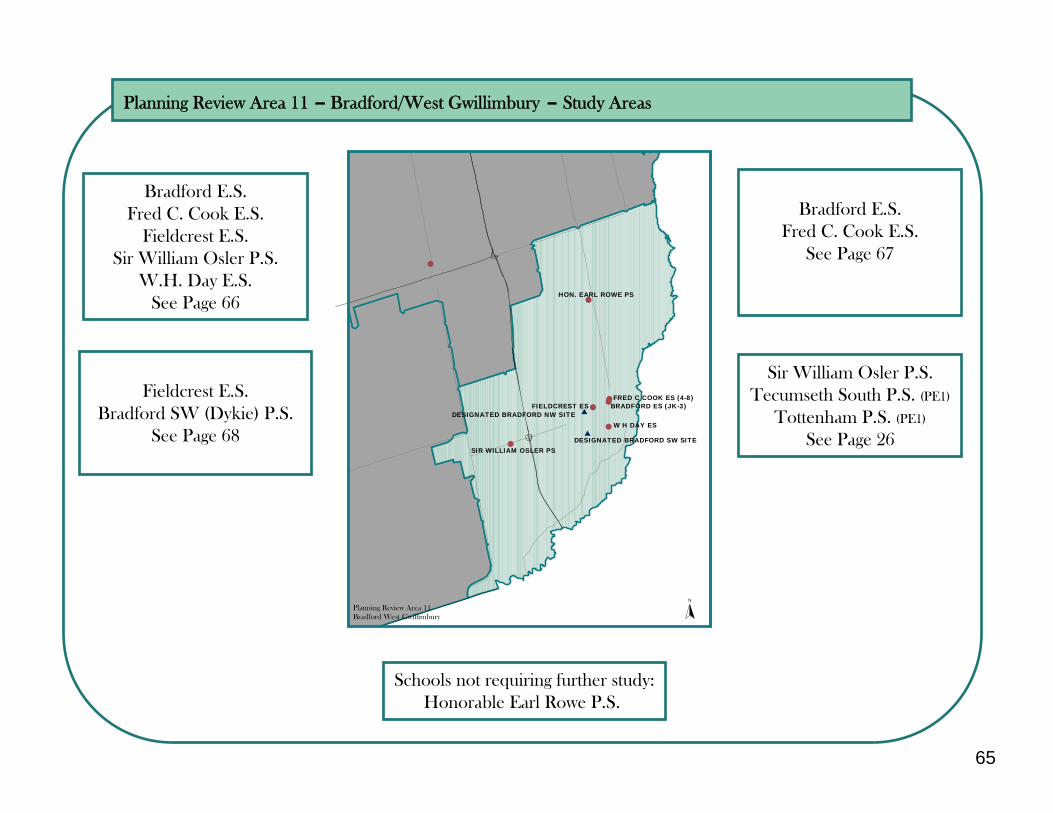
65
Planning Review Area 11 – Bradford/West Gwillimbury – Study Areas
Schools not requiring further study:Honorable Earl Rowe P.S.
Bradford E.S.Fred C. Cook E.S.
Fieldcrest E.S.Sir William Osler P.S.
W.H. Day E.S.See Page 66
Sir William Osler P.S.Tecumseth South P.S. (PE1)
Tottenham P.S. (PE1)
See Page 26
Bradford E.S.Fred C. Cook E.S.
See Page 67
Fieldcrest E.S.Bradford SW (Dykie) P.S.
See Page 68
#
#
###
#
#
$
$
HON. EARL ROWE PS
FRED C COOK ES (4-8)BRADFORD ES (JK-3)
W H DAY ES
FIELDCREST ES
SIR WILLIAM OSLER PS
DESIGNATED BRADFORD NW SITE
DESIGNATED BRADFORD SW SITE
N
Planning Review Area 11Bradford West Gwillimbury
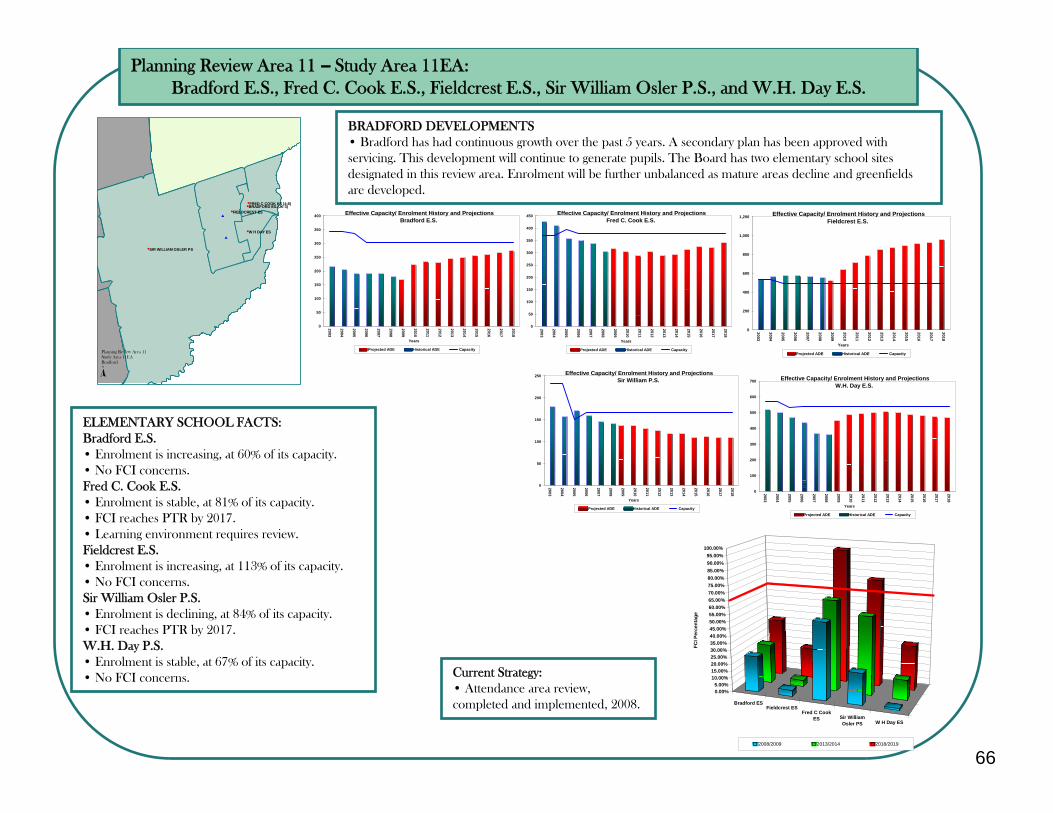
66
Planning Review Area 11 – Study Area 11EA:Bradford E.S., Fred C. Cook E.S., Fieldcrest E.S., Sir William Osler P.S., and W.H. Day E.S.
BRADFORD DEVELOPMENTS• Bradford has had continuous growth over the past 5 years. A secondary plan has been approved with servicing. This development will continue to generate pupils. The Board has two elementary school sites designated in this review area. Enrolment will be further unbalanced as mature areas decline and greenfieldsare developed.
ELEMENTARY SCHOOL FACTS:Bradford E.S.• Enrolment is increasing, at 60% of its capacity.• No FCI concerns.Fred C. Cook E.S.• Enrolment is stable, at 81% of its capacity.• FCI reaches PTR by 2017.• Learning environment requires review.Fieldcrest E.S.• Enrolment is increasing, at 113% of its capacity.• No FCI concerns.Sir William Osler P.S.• Enrolment is declining, at 84% of its capacity.• FCI reaches PTR by 2017.W.H. Day P.S.• Enrolment is stable, at 67% of its capacity.• No FCI concerns. Current Strategy:
• Attendance area review, completed and implemented, 2008.
0
50
100
150
200
250
300
350
400
2003
2004
2005
2006
2007
2008
2009
2010
2011
2012
2013
2014
2015
2016
2017
2018
Years
Projected ADE Historical ADE Capacity
Effective Capacity/ Enrolment History and ProjectionsBradford E.S.
0
50
100
150
200
250
300
350
400
450
2003
2004
2005
2006
2007
2008
2009
2010
2011
2012
2013
2014
2015
2016
2017
2018
Years
Projected ADE Historical ADE Capacity
Effective Capacity/ Enrolment History and ProjectionsFred C. Cook E.S.
0
200
400
600
800
1,000
1,200
2003
2004
2005
2006
2007
2008
2009
2010
2011
2012
2013
2014
2015
2016
2017
2018
Years
Projected ADE Historical ADE Capacity
Effective Capacity/ Enrolment History and ProjectionsFieldcrest E.S.
0
100
200
300
400
500
600
700
2003
2004
2005
2006
2007
2008
2009
2010
2011
2012
2013
2014
2015
2016
2017
2018
Years
Projected ADE Historical ADE Capacity
Effective Capacity/ Enrolment History and ProjectionsW.H. Day E.S.
0
50
100
150
200
250
2003
2004
2005
2006
2007
2008
2009
2010
2011
2012
2013
2014
2015
2016
2017
2018
Years
Projected ADE Historical ADE Capacity
Effective Capacity/ Enrolment History and ProjectionsSir William P.S.
##
#
#
#
$
$
SIR WILLIAM OSLER PS
W H DAY ES
FIELDCREST ESBRADFORD ES (JK-3)FRED C COOK ES (4-8)
N
Planning Review Area 11Study Area 11EABradford
Bradford ESFieldcrest ES
Fred C CookES Sir William
Osler PS W H Day ES
0.00%5.00%
10.00%15.00%20.00%25.00%30.00%35.00%40.00%45.00%50.00%55.00%60.00%65.00%70.00%75.00%80.00%85.00%90.00%95.00%
100.00%
FCI P
erce
ntag
e
2008/2009 2013/2014 2018/2019
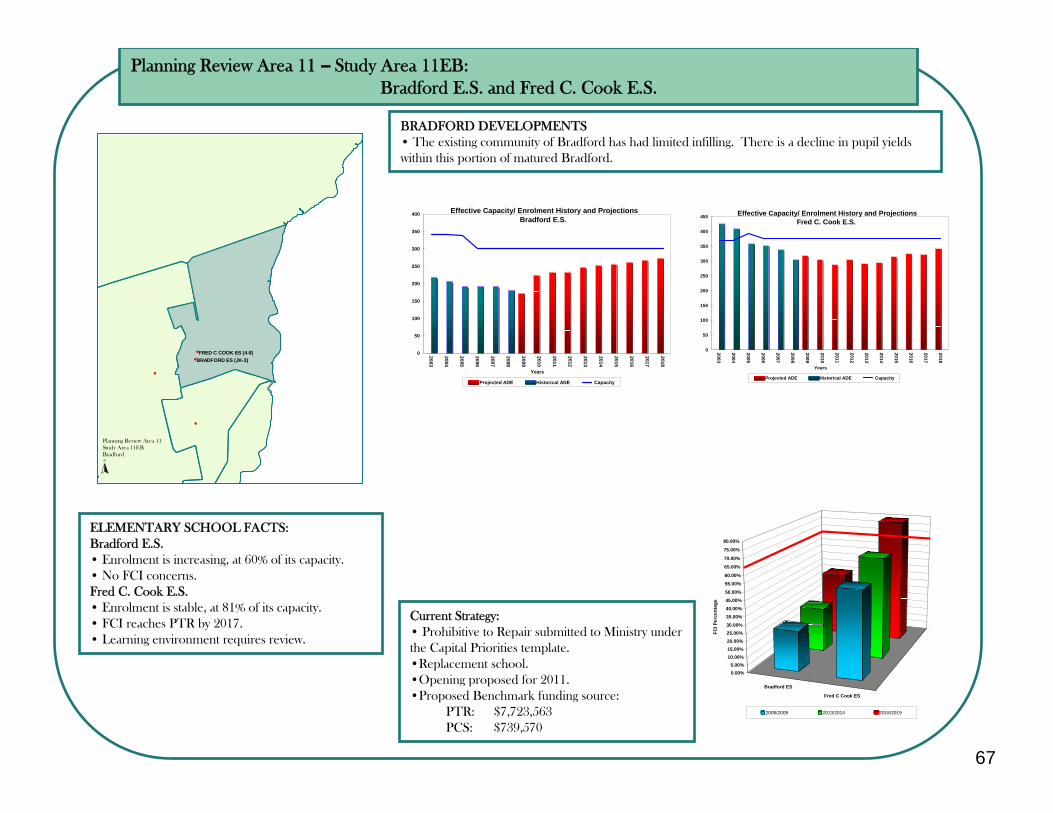
67
Planning Review Area 11 – Study Area 11EB:Bradford E.S. and Fred C. Cook E.S.
BRADFORD DEVELOPMENTS• The existing community of Bradford has had limited infilling. There is a decline in pupil yields within this portion of matured Bradford.
ELEMENTARY SCHOOL FACTS:Bradford E.S.• Enrolment is increasing, at 60% of its capacity.• No FCI concerns.Fred C. Cook E.S.• Enrolment is stable, at 81% of its capacity.• FCI reaches PTR by 2017.• Learning environment requires review.
Current Strategy:• Prohibitive to Repair submitted to Ministry under the Capital Priorities template.•Replacement school.•Opening proposed for 2011.•Proposed Benchmark funding source:
PTR: $7,723,563PCS: $739,570
Bradford ES
Fred C Cook ES
0.00%5.00%
10.00%15.00%20.00%25.00%30.00%35.00%40.00%45.00%50.00%
55.00%
60.00%
65.00%
70.00%
75.00%
80.00%
FCI P
erce
ntag
e2008/2009 2013/2014 2018/2019
0
50
100
150
200
250
300
350
400
2003
2004
2005
2006
2007
2008
2009
2010
2011
2012
2013
2014
2015
2016
2017
2018
Years
Projected ADE Historical ADE Capacity
Effective Capacity/ Enrolment History and ProjectionsBradford E.S.
0
50
100
150
200
250
300
350
400
450
2003
2004
2005
2006
2007
2008
2009
2010
2011
2012
2013
2014
2015
2016
2017
2018
Years
Projected ADE Historical ADE Capacity
Effective Capacity/ Enrolment History and ProjectionsFred C. Cook E.S.
#
#
#
#
FRED C COOK ES (4-8)BRADFORD ES (JK-3)
N
Planning Review Area 11Study Area 11EBBradford
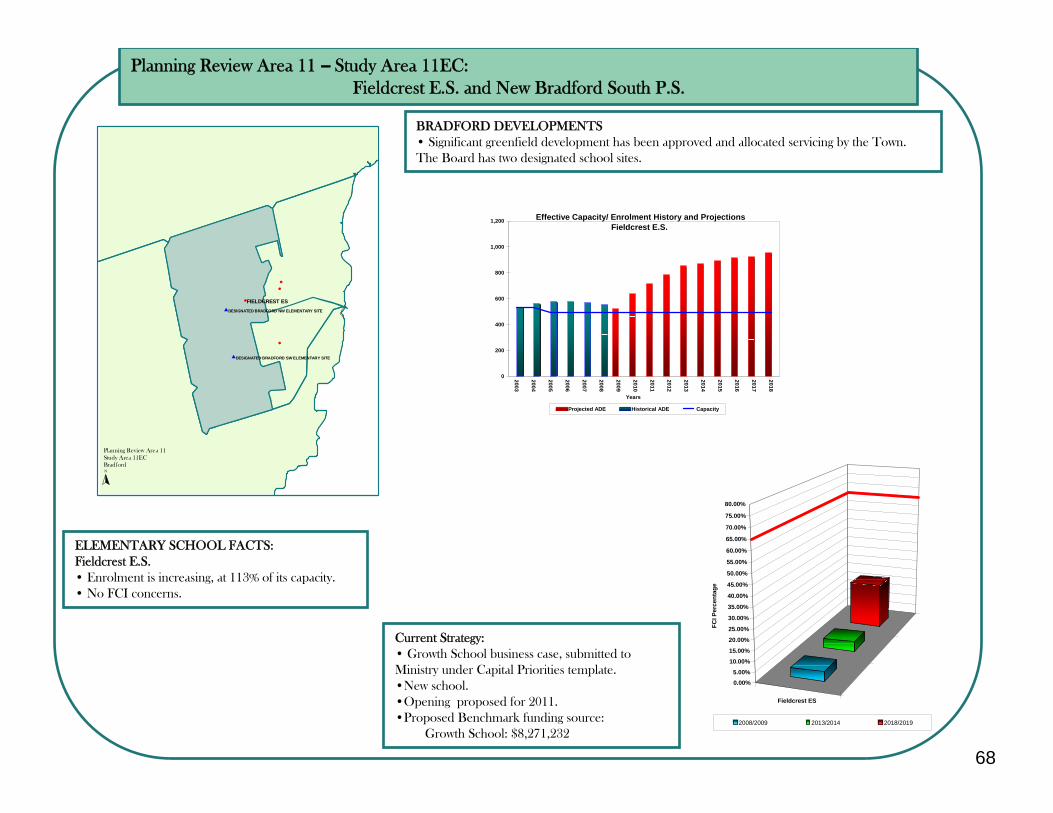
68
Planning Review Area 11 – Study Area 11EC:Fieldcrest E.S. and New Bradford South P.S.
BRADFORD DEVELOPMENTS• Significant greenfield development has been approved and allocated servicing by the Town. The Board has two designated school sites.
ELEMENTARY SCHOOL FACTS:Fieldcrest E.S.• Enrolment is increasing, at 113% of its capacity.• No FCI concerns.
Current Strategy:• Growth School business case, submitted to Ministry under Capital Priorities template.•New school.•Opening proposed for 2011.•Proposed Benchmark funding source:
Growth School: $8,271,232
Fieldcrest ES
0.00%5.00%
10.00%
15.00%
20.00%
25.00%
30.00%
35.00%
40.00%
45.00%
50.00%
55.00%
60.00%
65.00%
70.00%
75.00%
80.00%
FCI P
erce
ntag
e2008/2009 2013/2014 2018/2019
0
200
400
600
800
1,000
1,200
2003
2004
2005
2006
2007
2008
2009
2010
2011
2012
2013
2014
2015
2016
2017
2018
Years
Projected ADE Historical ADE Capacity
Effective Capacity/ Enrolment History and ProjectionsFieldcrest E.S.
#
#
#
#
$
$
FIELDCREST ESDESIGNATED BRADFORD NW ELEMENTARY SITE
DESIGNATED BRADFORD SW ELEMENTARY SITE
N
Planning Review Area 11Study Area 11ECBradford
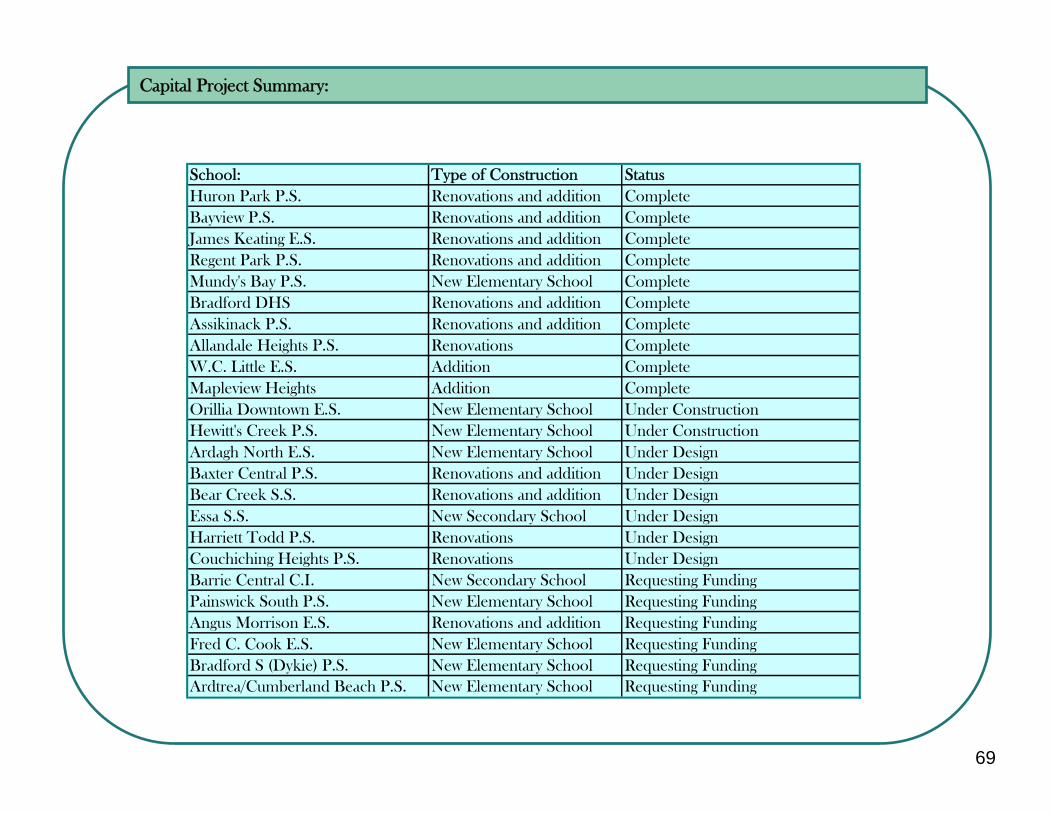
69
Capital Project Summary:
School: Type of Construction StatusHuron Park P.S. Renovations and addition CompleteBayview P.S. Renovations and addition CompleteJames Keating E.S. Renovations and addition CompleteRegent Park P.S. Renovations and addition CompleteMundy's Bay P.S. New Elementary School CompleteBradford DHS Renovations and addition CompleteAssikinack P.S. Renovations and addition CompleteAllandale Heights P.S. Renovations CompleteW.C. Little E.S. Addition CompleteMapleview Heights Addition CompleteOrillia Downtown E.S. New Elementary School Under ConstructionHewitt's Creek P.S. New Elementary School Under ConstructionArdagh North E.S. New Elementary School Under DesignBaxter Central P.S. Renovations and addition Under DesignBear Creek S.S. Renovations and addition Under DesignEssa S.S. New Secondary School Under DesignHarriett Todd P.S. Renovations Under DesignCouchiching Heights P.S. Renovations Under DesignBarrie Central C.I. New Secondary School Requesting FundingPainswick South P.S. New Elementary School Requesting FundingAngus Morrison E.S. Renovations and addition Requesting FundingFred C. Cook E.S. New Elementary School Requesting FundingBradford S (Dykie) P.S. New Elementary School Requesting FundingArdtrea/Cumberland Beach P.S. New Elementary School Requesting Funding