Embed Size (px)
Citation preview
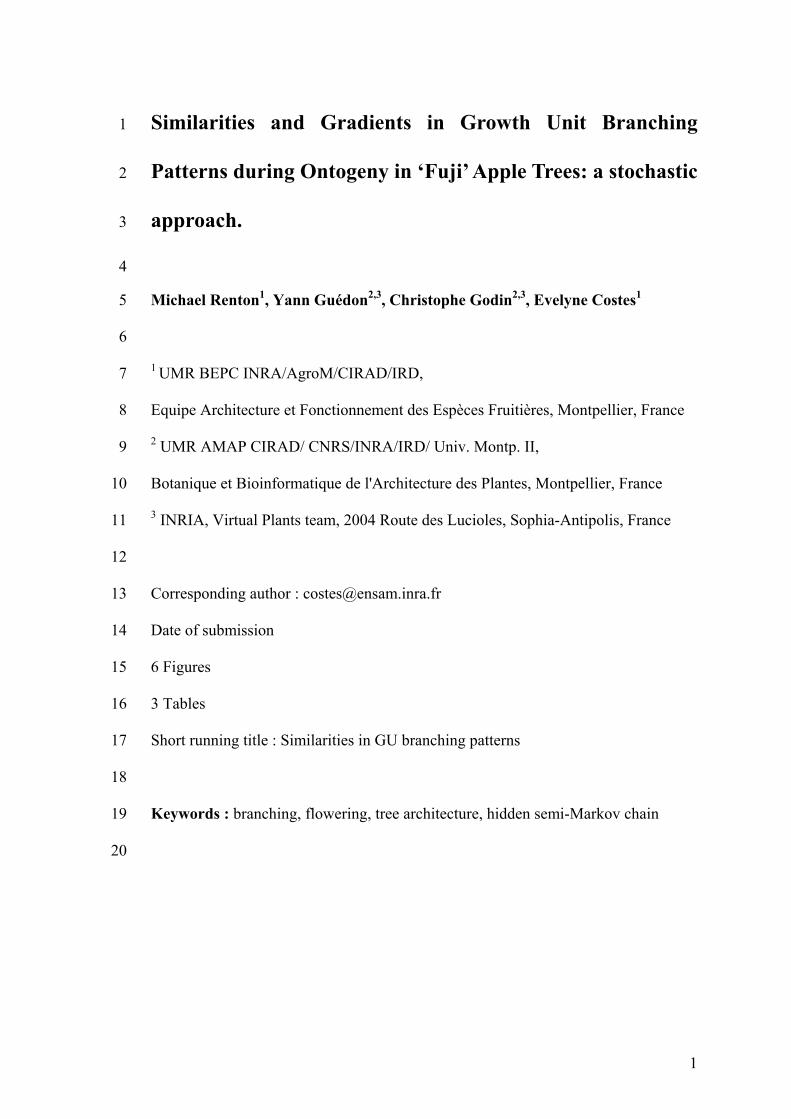
Similarities and Gradients in Growth Unit Branching
Patterns during Ontogeny in ‘Fuji’ Apple Trees: a stochastic
approach.
1
2
3
4
5
6
7
8
9
10
11
12
13
14
15
16
17
18
19
20
Michael Renton1, Yann Guédon2,3, Christophe Godin2,3, Evelyne Costes1
1 UMR BEPC INRA/AgroM/CIRAD/IRD,
Equipe Architecture et Fonctionnement des Espèces Fruitières, Montpellier, France
2 UMR AMAP CIRAD/ CNRS/INRA/IRD/ Univ. Montp. II,
Botanique et Bioinformatique de l'Architecture des Plantes, Montpellier, France
3 INRIA, Virtual Plants team, 2004 Route des Lucioles, Sophia-Antipolis, France
Corresponding author : [email protected]
Date of submission
6 Figures
3 Tables
Short running title : Similarities in GU branching patterns
Keywords : branching, flowering, tree architecture, hidden semi-Markov chain
1

Summary 1
2
3
4
5
6
7
8
9
10
11
12
13
14
15
16
17
18
19
20
21
22
23 24
25
26
This study aims to explore and model the changes in growth unit (GU) branching
patterns during tree ontogeny. The question was addressed in apple trees cv. ‘Fuji’,
by analysing the relative impact of GU length and within-tree position. The
development of two six-year-old trees was recorded over six years. The fate of
axillary buds along each GU was represented as a sequence of symbols
corresponding to five types of lateral growth: latent buds, short, medium, long, and
floral lateral GUs. Based on an exploratory analysis of data and a priori hypotheses,
a hidden semi-Markov chain was estimated from all of these GU sequences. This
model was composed of six transient states representing successive branching zones
along the GUs. The accuracy of this global model was a posteriori assessed by fitting
the characteristic distributions computed from model parameters to the
corresponding empirical characteristic distributions extracted from the observed
sequences. The observed sequences were then grouped hierarchically according to
the GU length, year of growth and branching order. Comparing model parameters
between these sub-groups revealed similarities between GUs. These similarities were
based on particular branching zones whose composition and relative position within
the GUs remained invariant across the sub-groups: the latent zones, floral zone and
short-lateral zone. The probability of occurrence of the floral zone varied with the
year, showing the alternate fruiting of ‘Fuji’. We show that, during tree ontogeny, as
GU length decreases, branching patterns tend to progressively simplify due to the
disappearance of the most central zones and a progressive reduction in the length of
the floral zone.
2
Introduction 1
2
3
4
5
6
7
8
9
10
11
12
13
14
15
16
17
18
19
20
21
22
23
24
25
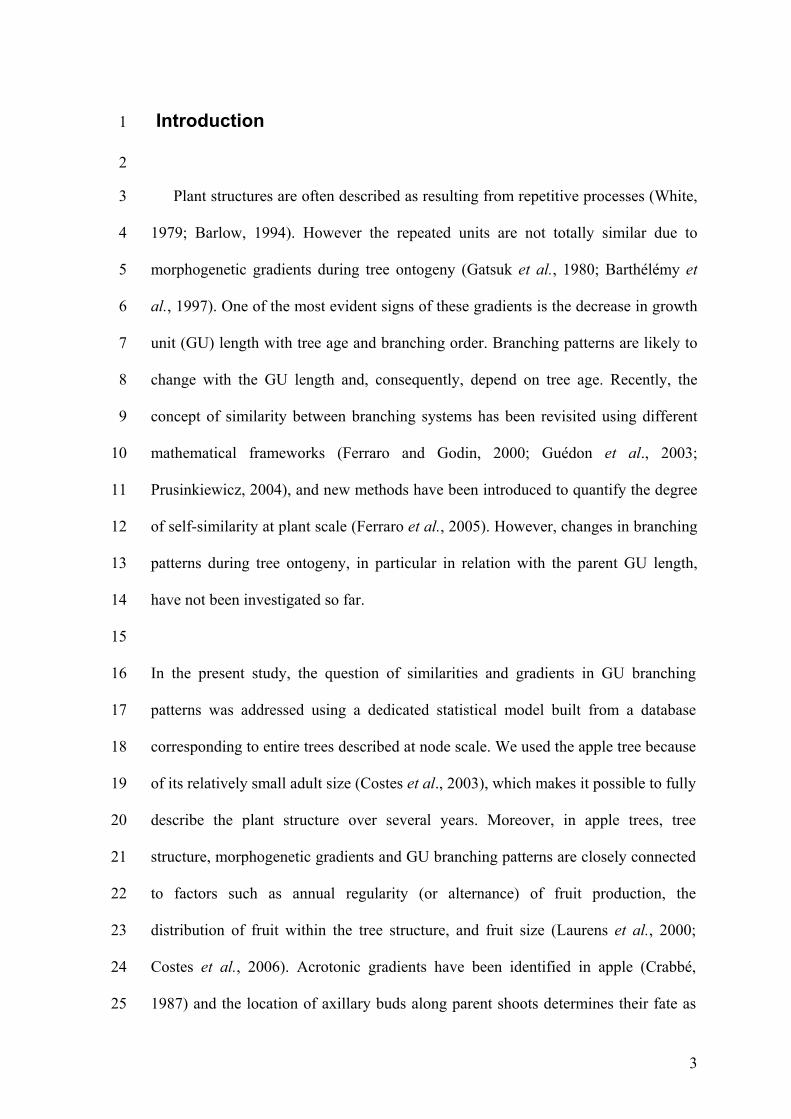
Plant structures are often described as resulting from repetitive processes (White,
1979; Barlow, 1994). However the repeated units are not totally similar due to
morphogenetic gradients during tree ontogeny (Gatsuk et al., 1980; Barthélémy et
al., 1997). One of the most evident signs of these gradients is the decrease in growth
unit (GU) length with tree age and branching order. Branching patterns are likely to
change with the GU length and, consequently, depend on tree age. Recently, the
concept of similarity between branching systems has been revisited using different
mathematical frameworks (Ferraro and Godin, 2000; Guédon et al., 2003;
Prusinkiewicz, 2004), and new methods have been introduced to quantify the degree
of self-similarity at plant scale (Ferraro et al., 2005). However, changes in branching
patterns during tree ontogeny, in particular in relation with the parent GU length,
have not been investigated so far.
In the present study, the question of similarities and gradients in GU branching
patterns was addressed using a dedicated statistical model built from a database
corresponding to entire trees described at node scale. We used the apple tree because
of its relatively small adult size (Costes et al., 2003), which makes it possible to fully
describe the plant structure over several years. Moreover, in apple trees, tree
structure, morphogenetic gradients and GU branching patterns are closely connected
to factors such as annual regularity (or alternance) of fruit production, the
distribution of fruit within the tree structure, and fruit size (Laurens et al., 2000;
Costes et al., 2006). Acrotonic gradients have been identified in apple (Crabbé,
1987) and the location of axillary buds along parent shoots determines their fate as
3

short or long laterals (Kaini et al., 1984; Ouellette and Young, 1994). The mesotonic
location of sylleptic shoots has also been demonstrated in this species (Crabbé, 1984;
Costes and Guédon, 1997). Moreover, branching patterns along the first GU show a
succession of homogenous branching zones in different apple cultivars. These
patterns have been modelled using a particular class of stochastic models referred to
as hidden semi-Markov chains (Costes and Guédon, 2002).
1
2
3
4
5
6
7
8
9
10
11
12
13
14
15
16
17
18
19
20
21
22
23
24
Hidden semi-Markov chains are particularly useful for identifying homogeneous
zones within sequences and detecting transitions between zones. They have been
applied in various biological contexts, such as gene finding (Burge and Karlin, 1997;
Lukashin and Borodovsky, 1998), protein secondary structure prediction (Schmidler
et al., 2000) and the analysis of branching and flowering patterns in plants (Guédon
et al., 2001). Hidden semi-Markov chains generalize hidden Markov chains (see
Ephraim and Merhav (2002) for a tutorial about hidden Markovian models) with the
distinctive property of explicitly modelling the length of each zone. A hidden semi-
Markov chain is constructed from a semi-Markov chain which represents both the
succession of zones and the length of each zone while observation distributions
attached to each state of the semi-Markov chain represent the observed composition
within each zone. For gene finding, the possible zones include the exons and introns
which are characterized by different compositions in terms of the nucleotides. In
plants, the branching zones are characterized by different compositions in terms of
branching types. For instance, a zone characterized by a mixture of latent buds and
shorts shoots may be followed by a zone characterized by a mixture of latent buds,
short shoots and floral shoots. The fact that latent buds and short shoots can be
4

1
2
3
4
5
6
7
8
9
10
11
12
13
14
15
observed in different branching zones entails that the branching zones are not
directly observable (hence the “hidden” qualifier of the model).
In this paper we explore the similarities and gradients in GU branching patterns
during tree ontogeny. We tested the possibility of capturing all branching patterns
observed within the trees in a single global model. We then used this global model to
evaluate the degree of similarity in the branching patterns by using the invariance of
sub-sets of parameters as indicators of common patterns. In addition, we investigated
the impact of morphogenetic gradients during tree ontogeny on the stability of model
parameters. The gradients were characterised by (i) GU length in number of nodes
which represents the potential growth of the corresponding axis when it developed
and (ii) the position of the GU within the tree, represented by its year of growth and
its branching order.
5

Methods 1 2
3
4
5
6
7
8
9
10
11
12
13
14
15
16
17
18
1. 19
20
21
22
23
2. 24
25
Extracting sequences from the encoded database of measured tree structures
The database consists of recorded measurements for two six-year-old Fuji apple trees
(Costes et al., 2003). The observed trees were grafted on ‘M9 Pajam 1’ rootstock in
the nursery and were planted when they were 1-year old at 2x5 m at the INRA
experimental station near Montpellier, France. Development over the six years was
deduced using morphological markers such as leaf scars, according to a method fully
described by Costes et al. (2003). Within this database, four types of GUs were
considered: short (less than 5cm), medium (more than 5cm and less than 20 cm),
long (more than 20 cm), and floral GUs. A sequence of symbols representing the fate
of the axillary buds along the GU, from the base to the top, was then extracted for
every GU in the database, resulting in a new database of GU sequences. Five types of
lateral growth were considered: latent buds, short lateral GUs, medium lateral GUs,
long lateral GUs, and floral GUs.
Representing branching patterns with a hidden semi-Markov chain
The statistical modelling of the branching patterns relies on the following
assumptions which have to be validated a posteriori, i.e. after model estimation:
Well defined zones with stable branching types can be identified in all the
GUs, (i.e. branching types do not change substantially within each zone but
change markedly between zones.) In particular, the branching types within the
different zones are assumed to be independent of GU length, year of growth and
branching order,
Each branching zone may be present or absent depending on GU length, year
of growth and branching order,
6

3. 1
2
3
4
5
6
7
8
9
10
11
12
13
14
15
16
17
18
19
20
21
22
23
24
25
Some branching zones may be longer or shorter, depending on GU length.
We therefore built a single hidden semi-Markov chain for the branching patterns
of all the GUs observed in the tree (based on the first assumption). Then we
investigated the stability of model parameters across different groups of GUs. We
classified the GUs into groups by considering different potential growth (represented
by GU length in number of nodes) and positions (represented by the year of growth
and the branching order). “Contextual” model parameters inferred from these sub-
groups of sequences were then compared in order to investigate the similarities and
gradients in GU branching patterns.
In the estimated hidden semi-Markov chain, “time” refers to the index parameter of
the sequence which is, in our application, the node rank and each zone is represented
by a mathematical object called a state. The possible successions of zones and the
length of each zone (in number of nodes) are both represented by the semi-Markov
chain while the proportion of branching types observed within a zone is represented
by observation distributions attached to each state of the semi-Markov chain
(Guédon et al., 2001). A hidden semi-Markov chain is thus defined by four sub-sets
of parameters:
- Initial probabilities to model which is the first zone occurring in a GU,
- Transition probabilities to model the succession of zones along the GUs,
- Occupancy distributions attached to non-absorbing states to represent the
zone length in number of nodes, (a state is said to be absorbing, if after entering this
state, it is impossible to leave it),
- Observation distributions to model the composition properties within the
zones (proportions of different branching types).
7

1
2
3
4
5
6
7
8
9
10
11
12
13
14
15
16
17
18
19
20
21
22
23
24
25
Our main assumptions entail that the first three sub-sets of parameters - initial
probabilities, transition probabilities and occupancy distributions - depend on the
studied factors (GU length, year of growth and branching order), while the
observation distributions do not depend on these factors.
It is generally assumed while using hidden semi-Markov chains, that the sequence
length is independent of the process that is supposed to have generated the sequence
(Guédon, 2003). This assumption entails that the time spent in the last visited state is
“censored” or truncated, i.e. the most distal branching zone was randomly truncated
by the growth cessation. In this study, we instead chose to assume that the end of an
observed sequence systematically coincides with the transition from the current state
to an extra absorbing “end” state. To fulfil this requirement, each observed sequence
was completed with an extra symbol. Hence, at the end of an observed sequence, the
process systematically jumps to the absorbing “end” state. In this way, the sequence
length distribution is implicitly modelled by a combination of the state occupancy
distributions (Guédon, 2005); see also Durbin et al. (1998), chapter 3 for further
discussions of this modelling in the case of hidden Markov chains.
The model specification relies in a crucial way on the choice of the number of states
(i.e. zones). On the basis of both an exploratory analysis and previous studies (Costes
and Guédon, 2002), we a priori selected a range of possible values for the number of
states and estimated a hidden semi-Markov chain for each possible number of states
(from 5 to 7). For each estimated hidden semi-Markov chain, the accuracy was a
posteriori assessed by fitting the characteristic distributions computed from model
parameters to the corresponding empirical characteristic distributions extracted from
8

1
2
3
4
5
6
7
8
9
10
11
12
13
14
15
16
17
18
19
20
21
22
23
24
25
the observed sequences. The main characteristic distributions used were the intensity
characteristics i.e. the probabilities of the different branching types as a function of
the node rank (see Guédon (2003) where this point is illustrated with another apple
tree data set). Finally, we selected a hidden semi-Markov chain composed of 6
successive transient states and an absorbing “end” state. The semi-Markov chain was
left-right, i.e. transitions from a given state to following states were possible while
transitions to states already visited were not possible. We also made the assumption
that only latent buds can be observed in the first state (state 0), which corresponds to
the basal unbranched zone of the GUs, which, in turn, corresponds partly to the
preformed part of the GUs (Costes, 2003).
The maximum likelihood estimation of the parameters of a hidden semi-Markov
chain requires an iterative optimization technique, which is an application of the
Expectation-Maximization (EM) algorithm (Guédon 2003; 2005). The hidden semi-
Markov chain was estimated on the basis of 699 sequences of cumulated length
48930. The 44 independent parameters consisted of 2 independent initial
probabilities, 12 independent transition probabilities, 12 parameters for the
occupancy distributions attached to the six nonabsorbing states (all these occupancy
distributions were negative binomial distributions defined by two parameters) and 18
independent observation probabilities.
Grouping sequences according to morphogenetic gradients
In order to explore the changes in GU branching patterns during tree ontogeny, GU
sequences were grouped hierarchically according to their length, year of growth and
branching order (Fig. 1). Each group thus represents the GUs with a certain growth
9

1
2
3
4
5
6
7
8
9
10
11
12
13
14
15
16
17
18
19
20
21
22
23
24
25
that can be observed at the different positions within the trees. In the original dataset
there was a fundamental distinction between medium and long GUs, considered as
two different developmental stages (short GUs, which correspond to a third stage,
were not considered since they are usually not branched). We therefore began by
grouping sequences into medium and long categories, with a threshold of 15 nodes
which corresponds approximately to the mean number of preformed organs within
winter axillary buds (Costes, 2003). Each sub-group of sequences was then further
divided according to their year of growth, from year 1 to year 5, with years 1 and 2
grouped together. The sixth year GUs had been recorded to provide the information
for the fifth year GU sequences, but these sixth year GUs were not yet branched. The
distinction between GUs was again refined by considering their branching order (0
for trunks, 1 for branches borne along the trunks and so on). This procedure resulted
in a set of ‘GU sequence groups’. In most cases, the number of sequences in a group
was more than 10 and the sequence group was therefore included in the analysis for
comparison of the model parameters with other groups (Table 1). Even though the
group of long GUs in year 2 comprised only ten members, it was included in the
analysis because it contained all the information regarding the oldest and most
central GUs in the trees.
Comparing contextual model parameters
“Contextual” models were inferred from each GU group so that their parameters
could be compared across the groups. This was done in the following way. First, the
most probable state sequence was computed for each observed sequence on the basis
of the estimated global model. Here, the most probable state sequence can be
interpreted as the optimal segmentation of the corresponding observed sequence into
successive branching zones. Second, bivariate sequences were built by associating
10
1
2
3
4
5
6
7
8
9
10
11
12
13
14
15
16
17
18
19
20
21
22
23
24
each observed sequence with the corresponding most probable state sequence. For
each sub-group of bivariate sequences, counts for the transition between states, the
“time” spent in each state and the branching types observed in each state were
extracted. Third, the contextual parameters estimated from these counts were
compared to the global parameters and to contextual parameters of other groups in
order to assess which parameters are conserved or modified according to the context.
It is important to notice that contextual parameters are estimated conditionally to the
global estimated model, since the most probable state sequences from which the
counts are extracted were computed on the basis of this global model. Three sets of
contextual parameters regarding the GU structure in terms of zones were compared
between sub-groups of GUs: (i) the probability of occurrence of each zone, (ii) the
zone length distributions (i.e. contextual occupancy distributions) and, (iii) the
transition probabilities between zones. In addition, we compared the branching type
distributions (i.e. contextual observation distributions) for each zone that was present
in the considered groups of GUs.
Zone length distributions, which were often asymmetric and thus not normally
distributed, were compared using the Wilcoxon-Mann-Whitney test (with p < 0.05).
Branching type distributions were compared using chi-square tests for contingency
tables (with p < 0.05) since the observed variable is qualitative (the types of axillary
production cannot be ordered in a meaningful way because of the floral shoots). All
the statistical analyses were carried out using the Stat module of the AMAPmod
software (Godin et al., 1997).
11

Results 1
2
3
4
5
6
7
8
9
10
11
12
13
14
15
16
17
18
19
20
21
22
23
24
25
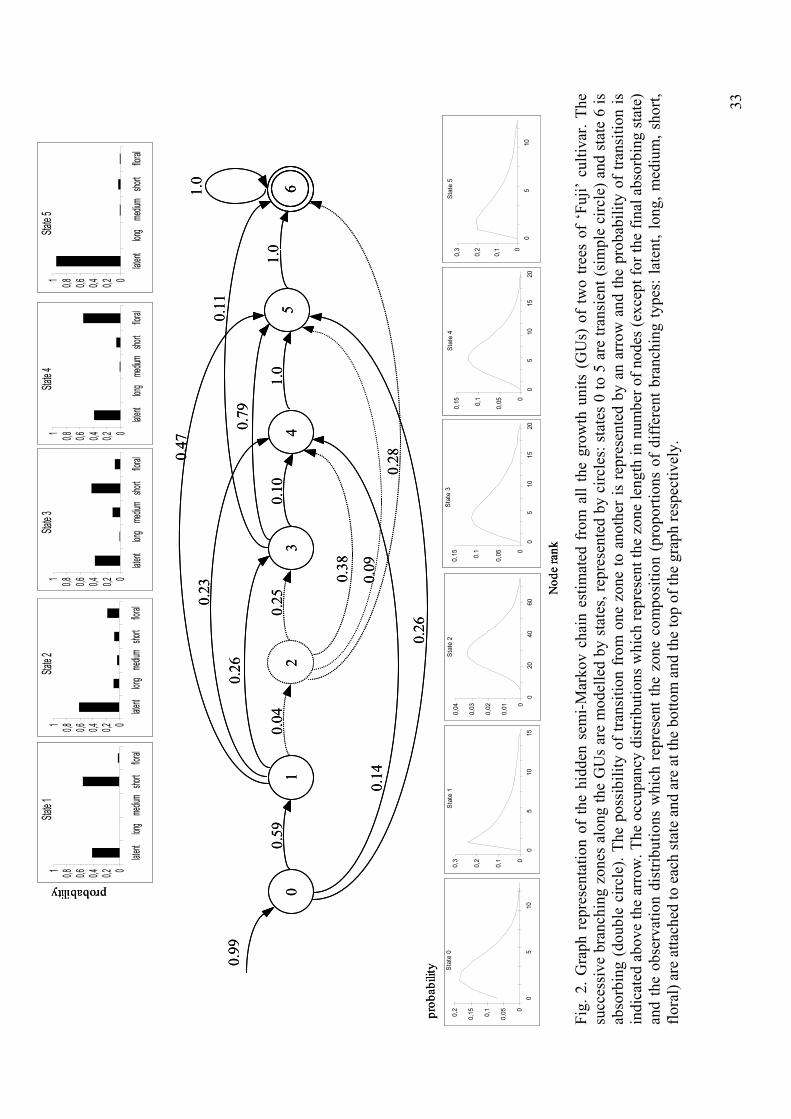
Global model
The global hidden semi-Markov chain estimated using all sequences grouped
together had seven states, corresponding to six homogeneous zones along the GUs
and an absorbing “end” state (Fig. 2). The states were defined on the basis of their
respective observation distributions:
- State 0 corresponds to the initial zone that contains only latent buds and is
always present at the base of the GUs (in the following this state will be
referred to as the basal latent zone);
- State 1 corresponds to a mixture of short lateral and latent buds (referred to as
the short-lateral zone);
- State 2 is a poorly branched zone with a mixture of all four possible lateral
GUs (the long diffuse zone);
- State 3 corresponds to a second short/latent zone which differs from state 1
by the possible presence of lateral medium GUs (the short-medium zone) ;
- State 4 corresponds to the floral zone, with lateral floral GUs mixed with
latent buds and short GUs (the floral zone);
- State 5 contains a large majority of latent buds mixed with a few short laterals
(the top latent zone);
- State 6 is the absorbing "end" state that corresponds to the extra symbol
added at the end of the sequences; this state, which does not correspond to a
zone in the GU, will be considered only if necessary in the following.
Each zone, modelled by a state, covered 3 to 5 successive nodes on average, except
the long diffuse branching zone whose length was about 20 nodes on average. A high
12
1
2
3
4
5
6
7
8
9
10
11
12
13
14
15
16
17
18
19
20
21
22
23
24
25
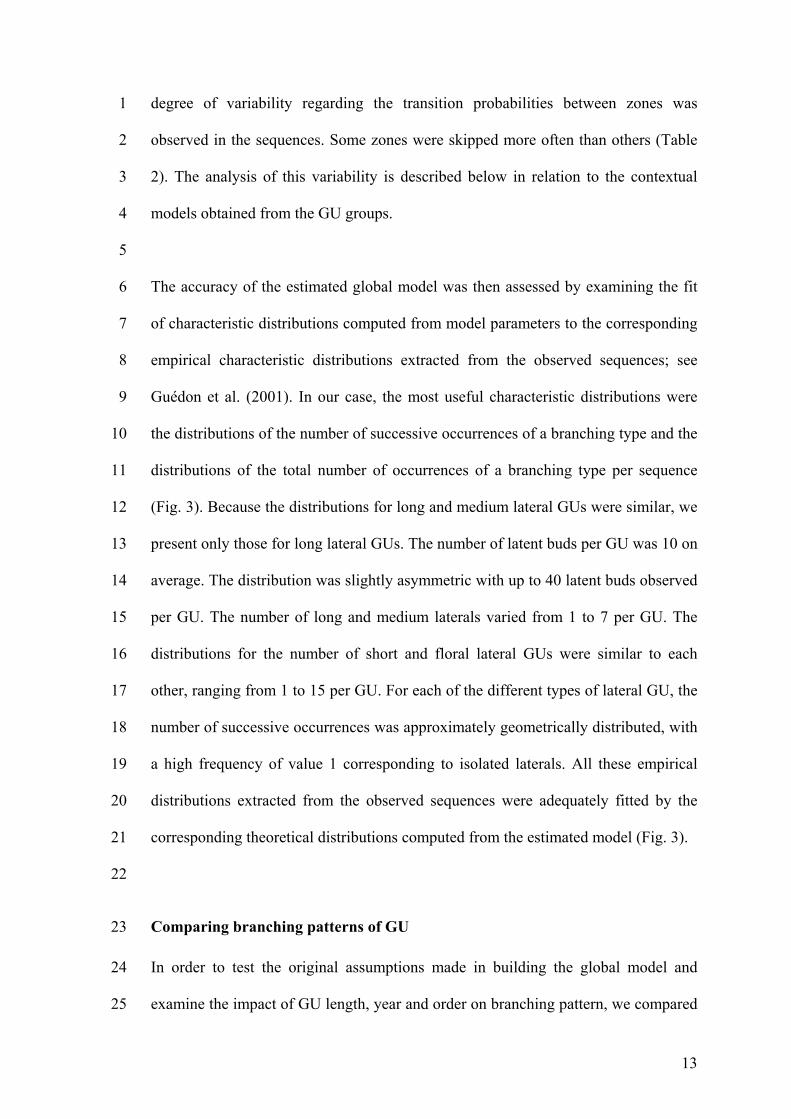
degree of variability regarding the transition probabilities between zones was
observed in the sequences. Some zones were skipped more often than others (Table
2). The analysis of this variability is described below in relation to the contextual
models obtained from the GU groups.
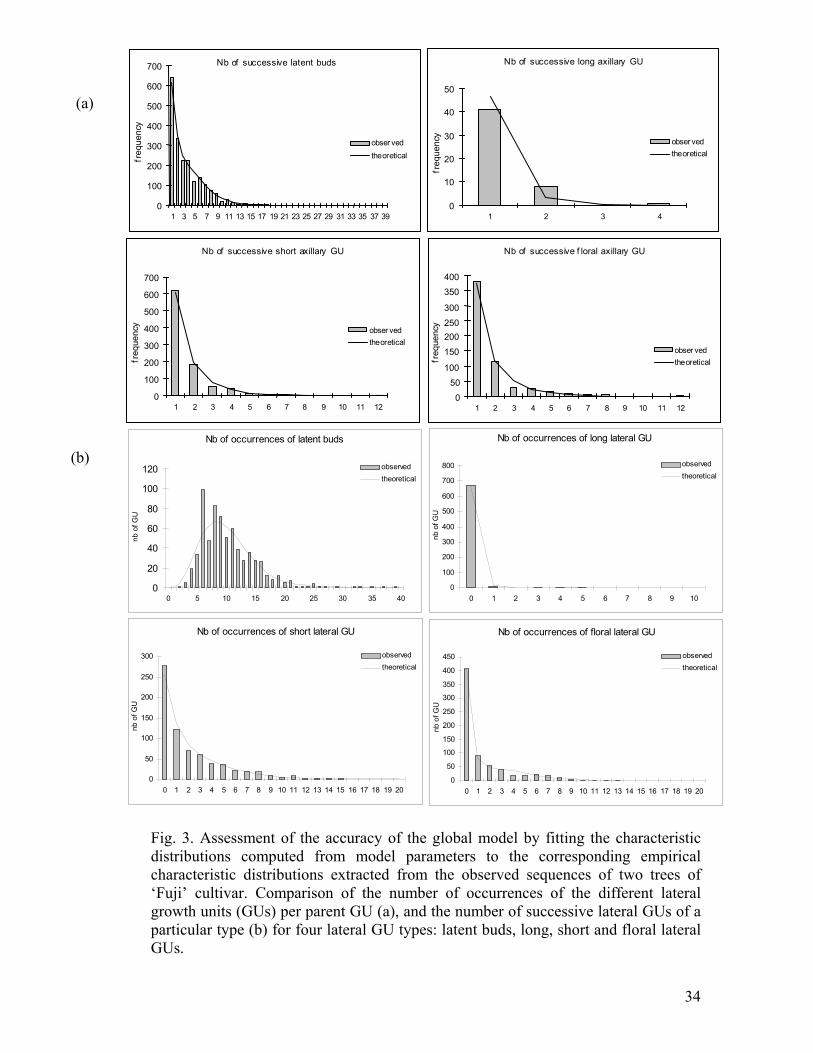
The accuracy of the estimated global model was then assessed by examining the fit
of characteristic distributions computed from model parameters to the corresponding
empirical characteristic distributions extracted from the observed sequences; see
Guédon et al. (2001). In our case, the most useful characteristic distributions were
the distributions of the number of successive occurrences of a branching type and the
distributions of the total number of occurrences of a branching type per sequence
(Fig. 3). Because the distributions for long and medium lateral GUs were similar, we
present only those for long lateral GUs. The number of latent buds per GU was 10 on
average. The distribution was slightly asymmetric with up to 40 latent buds observed
per GU. The number of long and medium laterals varied from 1 to 7 per GU. The
distributions for the number of short and floral lateral GUs were similar to each
other, ranging from 1 to 15 per GU. For each of the different types of lateral GU, the
number of successive occurrences was approximately geometrically distributed, with
a high frequency of value 1 corresponding to isolated laterals. All these empirical
distributions extracted from the observed sequences were adequately fitted by the
corresponding theoretical distributions computed from the estimated model (Fig. 3).
Comparing branching patterns of GU
In order to test the original assumptions made in building the global model and
examine the impact of GU length, year and order on branching pattern, we compared
13

1
2
3
4
5
6
7
8
9
10
11
12
13
14
15
16
17
18
19
20
21
22
23
24
25
the “contextual” parameters obtained from the different sub-groups of GUs (Fig. 1).
Refining the strategy of grouping led us to consider smaller numbers of GUs with
similar length and position within the tree (Table 1). Since years and orders are
closely linked in the first years of growth, subgroups of GUs classified by length,
years and orders were compared only from year 3 to year 5 and from order 0-1 to
order 4. In each case, the three characteristics dealing with the GU branching
structure in terms of zones (i.e. the probability of occurrence of each zone, the length
distributions and the transition probabilities between zones) and the branching type
distributions for each zone were compared between the sub-groups of GUs.
Occurrence of the different zones
Except for the two latent zones, the probability of occurrence of a zone varied with
the length category, the year and the branching order (Table 2; Fig. 4). The short-
lateral and floral zones occurred less frequently in the medium GUs than in the long
GUs. In addition, the long diffuse branching zone and the short-medium zone
sometimes occurred in the long GUs while these zones were almost entirely absent in
the medium GUs. This led to different branching patterns between long and medium
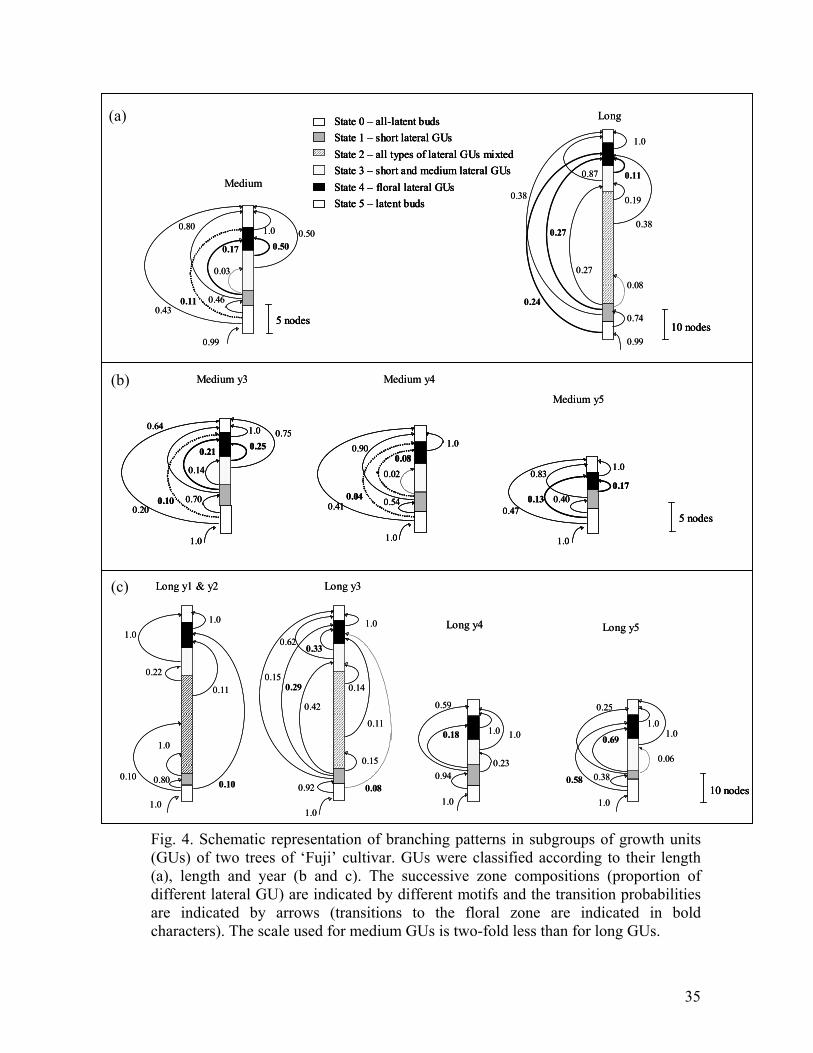
GUs (Fig.4a). In the medium GUs, 43% of the sequences were unbranched (direct
transitions from all-latent basal zone to the latent zone at the top) and about half of
the sequences contained only a median branched zone between the two latent zones.
This median zone was either floral (11% of the sequences) or vegetative (37% of the
sequences) with almost only short laterals. Few sequences exhibited both short-
lateral and floral zones in succession. In long GUs (Fig. 4a), no sequences were
unbranched. About half the long GUs contained a single median zone, either floral or
vegetative (24% and 28% of the sequences respectively). In all other long GUs
14

1
2
3
4
5
6
7
8
9
10
11
12
13
14
15
16
17
18
19
20
21
22
23
24
25
several zones in succession were observed between the two latent zones. In 20% of
these sequences, the short-lateral zone was followed by the floral zone, while in
another 20%, it was followed by the short-medium-lateral zone. In this later case,
since the observation distribution for these short-lateral and short-medium-lateral
zones are quite similar, they may have been difficult to clearly separate. Only 8% of
the sequences contained a long diffuse branching zone (zone 2). The observation of
three zones in succession was particularly rare but still possible.
Regarding changes by year, the main differences were observed for the long diffuse
branching zone and the floral zone (Table 2, Fig. 4b and c). For long GUs, the
diffuse branching zone was observed with a high probability (p = 0.9) in the first two
years of growth, while it was rarely observed in the third year (p = 0.13) and not
observed at all in subsequent years. It was never observed in medium GUs. Thus, the
long diffuse branching zone is characteristic of the long GUs that developed in the
first two years of growth and is rare in the global sample. The probability of
occurrence of the floral zone was alternatively high and low over successive years
(Table 2). These fluctuations highlight the alternate fruiting of Fuji trees. All the GUs
of the trees, whether long or medium, had a similar alternate behaviour over
successive years. In addition, the probability of occurrence of the short-lateral and
short-medium lateral zones tended to decrease over successive years, in particular in
medium GUs (Table 2, Fig. 4b and c).
Branching order impacted the probability of occurrence of the long diffuse branching
zone and the short-medium zone (Table 2). The long diffuse zone was observed only
in long GUs and only until year 3. Moreover, it only occurred in year 3 at order 0 or
15

1
2
3
4
5
6
7
8
9
10
11
12
13
14
15
16
17
18
19
20
21
22
23
24
25
1 and was absent at order 2. Similarly, the occurrence of the short-medium zone in
long GUs in year 4 decreased as the order increased from 0-1 to 3. In year 5, this
zone was observed only in the GUs at order 0 or 1. This means that both these zones
were observed only in the GUs that were the continuation of the trunk or the main
branches. The occurrence of the short-lateral zone in the long GUs also tended to
decrease with branching order, but in year 5 only. The occurrence of the latent and
floral zones showed no obvious variation with order.
Variation in zone length
The lengths of the six zones were significantly different for long and medium GUs
(Table 3). The mean zone lengths were higher in long GUs than in medium GUs. In
particular, the floral zone was twice as long in long GUs as in medium GUs. We thus
investigated, at the level of individual sequences, whether the zone lengths were
correlated with the total GU length. A high positive correlation coefficient (0.79) was
found between the length of the diffuse branching zone and the total GU length (Fig.
5). The length of the floral zone also tended to increase with the total GU length, but
only for sequences with less than 25 nodes (Fig. 5). However, the correlation
coefficient was quite low (0.60). No correlation existed for latent and vegetative
zones (states 0, 1, 3 and 5; data not shown). Thus, zone length increases, at least to
some extent, with the total GU length in the two zones that contained lateral floral
GUs. In all the other zones, the zone length could be considered as being
independent of the total GU length.
The zone length distributions did not show large differences between sub-samples of
sequences classified per year or branching orders (Table 3). In fact, the differences
16

1
2
3
4
5
6
7
8
9
10
11
12
13
14
15
16
17
18
19
20
21
22
23
24
25
between length categories were far more pronounced than those related to the year or
order. Even though significant differences between length distributions were found in
the latent zones and the short-lateral zones (states 0, 5 and 1) in long GUs according
to the year, these differences did not involve more than 3 internodes on average and
did not correspond to a systematic variation with years or orders. In medium GUs,
the zone length distributions did not show any significant difference in any year. In
particular, the floral zone had similar length distributions regardless of the year
within each length category.
Zone composition
The branching type distribution for the three zones that were present in all of the
different GU subgroups (corresponding to short-lateral, short/medium and floral
zones respectively) were compared. In both long and medium GU sub-groups, the
distributions for the short-lateral zone were almost the same, with a large number of
short laterals mixed with latent buds and very few floral laterals (Fig. 6). However, a
significant difference between the medium and long GUs was highlighted by a non-
parametric Kruskal-Wallis test. This was interpreted as resulting mainly from the
very high numbers of observed sequences (more than 1000). In the two other zones
(short-medium and floral), the branching type distributions were similar and no
significant difference was detected by the statistical test (illustrated only for floral
zone in Fig. 6).
Similarly, the branching type distributions for the short-lateral, short-medium and
floral zones were found to be essentially not significantly different across different
years (years 3, 4 and 5) within length categories (Fig. 6b and c). As mentioned
17

1
2
3
4
5
6
7
8
9
10
11
previously, the short-lateral zone contained a slightly higher proportion of latent buds
in long GUs than in medium GUs, but this was only true for years 4 and 5 (data not
shown). The only significant difference was in the composition of the floral zone in
long GUs since the “off year” (year 3) contained a lower proportion of lateral floral
GU. However, this difference concerned only 12% of the lateral GUs within the
zone.
When GUs were grouped by order, the zones had similar branching type distributions
(data not shown). In particular, the floral zone which occurred with greater or lower
probability depending on the year, always had the same composition
18
Discussion 1 2
3
4
5
6
7
8
9
10
11
12
13
14
15
16
17
18
19
20
21
22
23
24
25
GU branching patterns were represented by 6 successive zones defined by
substantially different branching types. This zonal structure results from the impact
of the node position (distance from the basis and the apex) on the axillary bud fate
during shoot ontogeny (Sachs, 1999) and possibly from an hormonal equilibrium
involving auxin and cytokinin fluxes (Cline, 2000; Wilson, 2000; Cook et al., 2001).
Four zones constitute a common theme within the trees: the basal and sub-apical
latent zones, the short lateral zone and the floral zone. These zones were also present
along the one-year-old trunks of ‘Fuji’ (Costes and Guédon, 2002). However, two of
the zones previously observed along trunks were not identified here: the median zone
with sylleptic lateral GUs and the sub-apical zone with long lateral GU which
corresponds to the acrotonic distribution of branching (Crabbé, 1987) were not
observed. The absence of sylleptic laterals may result from a difference in growing
conditions of the plant material. Indeed, the rootstock used, ‘Pajam 1’, is known to
be dwarfing (Ferree, 1988) and may have reduced the expression of syllepsis.
Moreover, in our earlier study, plants were cut back after one year of growth (Costes
and Guédon, 1997), which may have enhanced sylleptic branching. In other locations
within the trees besides the trunk, the absence of syllepsis in the dataset may be
interpreted as a consequence of the decrease in annual shoot growth with increasing
tree age, which suppresses syllepsis in the case of apple trees, as shown by Crabbé
(1987).
The vegetative long or medium lateral GUs were located in a median position along
the parent GUs (in states 1, 2 and 3), which may appear to contradict the acrotonic
19

1
2
3
4
5
6
7
8
9
10
11
12
13
14
15
16
17
18
19
20
21
22
23
24
25
branching pattern usually described in apple trees. However, this median position of
vegetative lateral GUs probably results from the orientation of the GUs in space,
since most of the analysed GUs were subjected to bending (except trunks, which are
rare in our set of sequences). This orientation may impact the branching pattern by
decreasing apical growth and promoting vegetative re-growth on the curved portions
of the stem (Wareing and Nasr, 1961). Even though the branch response to bending
depends on both time and genotype (Lauri and Lespinasse, 2001), our results suggest
that, in the case of ‘Fuji’, bending promoted vegetative regrowth in zones located
below the floral zone, i.e. in the short-medium zone (which is the only zone with
medium lateral GUs). Interestingly, the position of the floral zone remained
unchanged since it was still located in the upper third of the GUs.
The within-tree changes in GU branching patterns were explored by analysing the
relative impact of the length of the parent GU and of different positions in the trees
(year of growth and branching orders). These three factors were not independent,
since GU length decreases with both year and order (Costes et al., 2003). However,
each grouping provided its own insight: parent GU length had the strongest impact
on branching patterns, followed by year and then by branching order. GU length
clearly impacted both the number of branching zones and the length of branching
zones. As GU length decreased with tree age, the zones located in median positions,
which contained vegetative long and medium lateral GUs tended to disappear. By
contrast, the zones located at the upper and basal ends of the GUs remained
unchanged in both length and composition. A similar dependency of the branching
structure upon GU length, with median zones disappearing progressively, has been
observed previously in the peach tree (Fournier et al., 1998). This suggests that the
20
1
2
3
4
5
6
7
8
9
10
11
12
13
14
15
16
17
18
19
20
21
22
23
24
shoot structure and succession of zones are closely related to the shoot growth
periods during the growth season. This assumption is supported by previous studies
that have analysed axillary meristem fates in relation to shoot growth rate, in
particular for syllepsis (Powell and Vescio, 1986; Génard et al., 1994) and axillary
flowering (Costes and Lauri, 1995). A second dependency concerns parent GU
length and zone length. This type of dependency has been shown previously in oak
tree (Heuret et al., 2003). In ‘Fuji’ apple trees, this relationship was only evident for
the long diffuse branching zone and, to a lesser extent, for the floral zone, the only
two zones containing lateral floral GUs. This suggests that changes in GU length
mainly impact the flowering zone while the latent and vegetative zones are less
dependent upon GU length.
Growth year mostly impacted the probability of occurrence of the floral zone while
its length and composition remained almost unchanged. This is consistent with the
alternate fruiting of ‘Fuji’ (Ferree and Smid, 2000). Climatic conditions and within-
tree competition (between developing organs and with floral initiations for the next
year) are likely to be involved in biennial bearing (Jonkers, 1979). The present study
provides new insight into where and how it occurs within entire trees: the variation
had the same intensity (same probability of occurrence of the floral zone) and was
synchronous in all of the GUS of the tree, whatever their branching order and length
category. However, focusing on branching patterns, the present study accounted only
for axillary flowering on one-year-old GUs which is usually considered as having a
relatively low impact on the total fruit production (Wunsche et al., 1996). Despite
this limitation, the general conclusion regarding the correlation between flowering
21

1
2
3
4
5
6
7
8
9
10
11
12
13
14
15
16
17
18
19
20
21
22
23
24
25
and year on all the GUs remains consistent with previous results obtained on the
same trees that included both terminal and axillary flowering (Costes et al., 2003).
The impact of branching order was relatively low compared to the two previous
factors. It was quite similar to that of GU length, since it mainly concerned the
progressive disappearance of the long diffuse and short-medium branching zones.
However, this disappearance was less rapid in the GUs that continued the trunk and
the main branches than in GUs at higher branching orders. This is consistent with a
slower decrease in growth on the trunk and main branches than in higher orders, as
previously shown in both ‘Fuji’ and ‘Braeburn’ cultivars (Costes et al., 2003).
Despite the relative variability of its occurrence probability and length, the floral
zone had a remarkable stable position along its parent GU. It was always located in
the upper third of the GU. A similar location has also been observed in peach trees
(Fournier, 1998) and on a set of apple cultivars (Costes and Guédon, 2002) whose
fruiting types ranged from Type I to Type IV according to Lespinasse’s classification
(Lespinasse, 1977). Thus, the location of the axillary flowering zone appears stable
with both the genotype and within-tree GU position. This stability provides new
insights into the timing of floral differentiation in apple tree. Some authors have
estimated this event could occur between 3 to 6 weeks after full bloom (Foster et al.,
2003), while others have estimated it to occur much later (Fulford, 1966a; Fulford,
1966b). However, considering that floral differentiation is a continuous process in
axillary buds under formation, our results suggest that axillary floral differentiation
may be more related to the parent GU growth than to a particular period of time.
Indeed, medium and long GUs cease growing at different times (unpublished
22

1
2
3
4
5
6
7
8
9
10
11
12
13
14
15
16
17
18
19
20
21
22
23
24
25
personal observation) and therefore the period of floral differentiation in their
axillary buds is likely to occur earlier in medium than in long GUs. More precisely,
floral differentiation in axillary buds could occur when the plastochronic index
(defined as the time spent between the emergence of two successive leaf primordia)
is slowing down, after a fast growing period during which syllepsis occurs and
before growth cessation (Fulford, 1965; Crabbé and Escobedo-Alvarez, 1991). This
interpretation remains consistent with the dependency upon node position and GU
hormonal equilibrium mentioned previously. Our results suggest that the concept of
“node counting”, proposed by Sachs (1999) to account for the transition between the
juvenile and adult stages on annual plants, could be extended to the different GUs of
a tree. Finally, axillary flowering appears to be a two-step process: (i) a global
flowering potential which determines the occurrence of the flowering zone, seems to
be defined each year at the whole tree level while (ii) a local induction of axillary
buds determines the length of the flowering zone at the level of each GU, depending
on its within-tree location.
To summarise, GU branching patterns exhibited both similarities and gradients
during tree ontogeny. We showed that the degree of similarity of GUs over the years
depends on them sharing certain zones, in particular the latent bud zones, the floral
and the short-lateral zones. A progressive simplification of the branching patterns
was observed when moving from the centre of the trees towards their periphery.
Complex branching structures with more than one median branched zone (either
vegetative or floral) tended to decrease in number towards the periphery while the
percentage of unbranched medium GUs progressively increased. Two phenomena
contributed to this simplification: first, the two median states disappeared with
23
1
2
3
4 5 6
7
8
9
10 11 12 13 14 15 16 17 18 19 20 21 22 23 24 25 26 27 28 29 30 31 32 33 34 35 36 37 38 39
increasing tree age and branching order; second, the floral zone length decreased
with the parent GU length.
Acknowledgements M. Renton’s postdoc was granted by the INRA Department of Genetics and Plant
Breeding. We gratefully thank J.C. Salles, G. Garcia and S. Ploquin for their
contribution in field observations.
References Barlow PW. 1994. From cell to system: repetitive units of growth in the
developement of roots and shoots. In: Growth Patterns in Vascular Plants. M. Iqbal Ed. Portland Oregon: Dioscorides Press, 19-58.
Barthélémy D, Caraglio Y, Costes E. 1997. Architecture, morphogenetic gradients and physiological age of plants. In: Modélisation et simulation de l'architecture des vegetaux. Bouchon J eds. Montpellier: INRA, 89-136.
Burge C, Karlin S. 1997. Prediction of complete gene structures in human genomic DNA. Journal of Molecular Biology 268, 78-94.
Cline, M. G. 2000. The role of hormons and apical dominance. New approaches to an old problem in plant development. Physiologia plantarum 90, 230-237.
Cook, N. C., Bellstedt, D. U. and Jacobs, G. 2001. Endogeneous cytokinin distribution patterns at budburst in Granny Smith and Braeburn apple shoots in relation to shoot growth. Scientia Horticulturae 87, 53-63.
Costes, E. 2003. Winter Bud Content According to Position in Three-year-old Branching Systems of 'Granny Smith' Apple Cultivar. Annals of Botany 92, 581-588.
Costes E, Guédon Y. 1997. Modeling the sylleptic branching on one-year-old trunks of apple cultivars. Journal of the American Society for Horticultural Science 122, 53-62.
Costes E, Guédon Y. 2002. Modelling branching patterns on 1-year-old trunks of six apple cultivars. Annals of Botany 89, 513-524.
Costes E, Lauri PE. 1995. Processus de croissance en relation avec la ramification sylleptique et la floraison chez le pommier. In: Architecture des arbres fruitiers et forestiers, Bouchon J eds. Montpellier (France): INRA Editions 74, 41-50.
Costes E, Lauri PE, Regnard JL. 2006. Analysing Fruit Tree Architecture - Consequences for tree management and fruit production. In: Horticultural Reviews, Janick J eds 32, 1-61.
24
Costes E, Sinoquet H, Kelner JJ, Godin C. 2003. Exploring within-tree architectural development of two apple tree cultivars over 6 years. Annals of Botany 91, 91-104.
1 2 3 4 5 6 7 8 9
10 11 12 13 14 15 16 17 18 19 20 21 22 23 24 25 26 27 28 29 30 31 32 33 34 35 36 37 38 39 40 41 42 43 44 45 46 47 48
Crabbé, J. 1984. Vegetative vigor control over location and fate of flower buds, in fruit trees. Acta Horticulturae 149, 55-63.
Crabbé J. 1987. Aspects particuliers de la morphogenèse caulinaire des végétaux ligneux et introduction à leur étude quantitative. Editions IRSIA, Bruxelles.
Crabbé J, Escobedo-Alvarez JA. 1991. Activités méristématiques et cadre temporel assurant la transformation florale des bourgeons chez le Pommier (Malus x Domestica Borkh., cv. Golden Delicious). In: L'Arbre: Biologie et Developpement, C. Edelin eds, Naturalia Monspeliensia, 369-379.
Durbin R, Eddy SR, Krogh A, Mitchison, GJ. 1998. Biological sequence analysis: probabilistic models of proteins and nucleic acids. Cambridge University Press, Cambridge.
Ephraim Y, Merhav N. 2002. Hidden Markov processes. IEEE Transactions on Information Theory, 48(6), 1518-1569.
Ferraro P, Godin C. 2000. A distance measure between plant architectures. Annals of Forest Science 57, 445-461.
Ferraro P, Godin C, Prusinkiewicz P. 2005. Toward a quantification of self-similarity in plants. Fractals 13, 91-109.
Ferree DC. 1988. Role of rootstocks and spur-type scions for controlling vegetative growth of apple and peach trees. HortScience 23, 464-467.
Ferree, D. and Schmid, J. 2000. Chemical thinning 'Fuji' apple in the Midwest. Journal of American Pomological Society 54, 61-67.
Foster T, Johnston R, Seleznyova A. 2003. A morphological and quantitative characterization of early floral development in apple (Malus x domestica Borkh.). Annals of Botany 92, 199-206.
Fournier D, Guédon Y, Costes E. 1998 A comparison of different fruiting shoots of peach trees. Acta Horticulturae 495, 557-565.
Fulford RM. 1965. The morphogenesis of apple buds. I. The activity of the apical meristem. Annals of Botany 29, 167-180.
Fulford RM. 1966a. The morphogenesis of apple buds. II. The development of the bud. Annals of Botany 30, 27-38.
Fulford RM. 1966b. The morphogenesis of apple buds. III. The inception of flowers. Annals of Botany 30, 207-219.
Gatsuk LE, Smirnova OV, Vorontzova LI, Zaugolnova LB, Zhukova LA. 1980. Age states of plants of various growth forms: a review. Journal of Ecology 68, 675-696.
Génard M, Pagès L, Kervella J. 1994. Relationship between sylleptic branching and components of parent shoot development in the peach tree. Annals of Botany 74, 465-470.
Godin C, Guédon Y, Costes E, Caraglio Y. 1997 Measuring and analyzing plants with the AMAPmod software. In: Michalewicz M (ed) Advances in computational life science. CSIRO, Melbourne, 53-84
Guédon Y. 2003. Estimating hidden semi-Markov chains from discrete sequences. Journal of Computational and Graphical Statistics 12, 604-639.
Guédon Y. 2005. Hidden hybrid Markov/semi-Markov chains. Computational Statistics and Data Analysis 49, 663-688.
25

Guédon Y, Barthélémy D, Caraglio Y, Costes E 2001. Pattern analysis in branching and axillary flowering sequences. Journal of Theoretical Biology 212, 481-520.
1 2 3 4 5 6
Guédon Y, Heuret P, Costes E. 2003. Comparison methods for branching and axillary flowering sequences. Journal of Theoretical Biology 225, 301-325.
Heuret P, Guédon Y, Guérard N, Barthélémy D. 2003. Branching pattern modelling in young red oak (Quercus rubra L., Fagaceae) trees in plantation. Annals of Botany 91, 479-492.
7 8 9
10 11 12 13 14 15 16 17 18 19 20 21 22 23 24 25 26 27 28 29 30 31 32 33 34 35 36 37 38 39 40 41 42 43 44 45 46 47 48 49
Jonkers J. 1979. Biennal bearing in apple and pear: a literature survey. Scientia Horticulturae 11, 303-317.
Kaini, B. R., Jackson, D. I. and Rowe, R. N. 1984. Studies on shoot growth patterns in Lincoln canopy apples. Journal of Horticultural Science 59, 141-149.
Lacointe A, Deleens E, Ameglio T, Saint-Joanis B, Lelarge C, Vandame M, Song GC, Daudet FA. 2004. Testing the branch autonomy theory: a C-13/C-14 double-labelling experiment on differentially shaded branches. Plant Cell and Environment 27, 1159-1168.
Laurens F, Audergon JM, Claverie J, Duval H, Germain E, Kervella J, Lelezec M, Lauri PE, Lespinasse JM. 2000. Integration of architectural types in French programmes of ligneous fruit species genetic improvement. Fruits 55, 141-152.
Lauri PE, Lespinasse JM. 2001. Genotype of apple trees affects growth and fruiting responses to shoot bending at various times of year. Journal of the American Society for Horticultural Science 126, 169-174.
Lespinasse, J. M. 1977. La conduite du Pommier. I - Types de fructification. Incidence sur la conduite de l'arbre: I.N.V.U.F.L.E.C. Paris.
Lukashin AV, Borodovsky M. 1998. GeneMark.hmm: new solutions for gene finding. Nucleic Acids Research 26, 1107-1115.
Powell GR, Vescio SA. 1986. Syllepsis in Larix laricina: occurence and distribution of sylleptic long shoots and their relationships with age and vigour in young plantation-grown trees. Canadian Journal of Forest Research 16, 597-560.
Prusinkiewicz P. 2004. Self-similarity in plants: Integrating mathematical and biological perspectives. In: Thinking in Patterns: Fractals and Related Phenomena in Nature. M. Novak ed., 103-118.
Sachs T. 1999. 'Node counting': an internal control of balanced vegetative and reproductive development. Plant, Cell and Environment 22, 757-766.
Schmidler SC, Liu JS and Brutlag DL. 2000. Bayesian segmentation of protein secondary structure. Journal of Computational Biology 7, 233-248.
Wareing PF, Nasr TAA. 1961. Gravimorphism in trees. 1. Effect of gravity on growth and apical dominance in fruit trees. Annals of Botany 25, 321-340.
White J. 1979. The plant as a metapopulation. Annual Review of Ecological Systems 10, 109-145.
Wilson, B. F. 2000. Apical control of branch growth and angle in woody plants. American Journal of Botany 87, 601-607.
Wünsche, J. N., Lakso, A. N., Robinson, T. L., Lenz, F. and Denning, S. S. 1996. The bases of productivity in apple production systems: The role of light interception by different shoot types. Journal of the American Society for Horticultural Science 121, 886-893.
26

Figure captions 1 2
3
4
5
6
7
8
9
10
11
12
13
14
15
16
17
18
19
20
21
22
23
24
25
26
Fig. 1. Diagrammatic representation of the ways that sequences were grouped to
explore the within-tree variability of branching patterns.
Fig. 2. Graph representation of the hidden semi-Markov chain estimated from all the
growth units (GUs) of two trees of ‘Fuji’ cultivar. The successive branching zones
along the GUs are modelled by states, represented by circles: states 0 to 5 are
transient (simple circle) and state 6 is absorbing (double circle). The possibility of
transition from one zone to another is represented by an arrow and the probability of
transition is indicated above the arrow. The occupancy distributions which represent
the zone length in number of nodes (except for the final absorbing state) and the
observation distributions which represent the zone composition (proportions of
different branching types: latent, long, medium, short, floral) are attached to each
state and are at the bottom and the top of the graph respectively.
Fig. 3. Assessment of the accuracy of the global model by fitting the characteristic
distributions computed from model parameters to the corresponding empirical
characteristic distributions extracted from the observed sequences of two trees of
‘Fuji’ cultivar. Comparison of the number of occurrences of the different lateral
growth units (GUs) per parent GU (a), and the number of successive lateral GUs of a
particular type (b) for four lateral GU types: latent buds, long, short and floral lateral
GUs.
Fig. 4. Schematic representation of branching patterns in subgroups of growth units
(GUs) of two trees of ‘Fuji’ cultivar. GU were classified according to their length (a),
27

1
2
3
4
5
6
7
8
9
10
11
12
13
14
15
16
17
18
19
20
length and years (b and c). The successive zone compositions (proportion of different
lateral GUs) are indicated by different motifs and the transition probabilities are
indicated by arrows (transitions to the floral zone are indicated in bold characters).
The scale used for medium GUs is two-fold less than for long GUs.
Fig. 5 – Linear correlation between the length of the long diffuse branching zone
(state 2) and the floral zone (state 4) versus the total length of the parent GU. Both
variables represent the number of nodes. Correlation coefficients were calculated
from all the sequences for the long diffuse branching zone, and from sequences with
less than 25 nodes for the floral zone.
Fig. 6. Branching type distributions for the short-lateral zone (state 1, left) and floral
zone (state 4, right) built from the most probable state sequences computed from the
hidden semi-Markov chain of two trees of ‘Fuji’ cultivar. Growth units (GUs) were
classified into subgroups according to their length (a), length and years (b and c).
Distribution comparisons were performed using chi-square tests between medium
and long GUs (a, here n represents the number of GUs per category length in which
the considered state was observed); between years for medium GUs (b) and long Gus
(c). (NS : test non significant with p > 0.05; * test significant with 0.01 < p <0.05; **
test highly significant with p < 0.01).
28

Table 1. Number of growth units observed for two ‘Fuji’ apple trees, and classified per length category, year and order. Years
Total 1-2 3 4 5 All seq. 699 10 93 220 376 Long 252 10 52 106 84 Medium 447 - 41 114 292 Orders
Year 0-1 2 3 4 5 All seq. 699 186 228 215 65 5 Long 1-2 10 10 - - - -
3 52 37 15 - - - 4 106 30 47 29 - - 5 84 21 37 23 3 -
Medium 1-2 - - - - - - 3 41 25 16 - - -
4 114 18 52 41 3 - 5 292 45 61 122 59 5
29
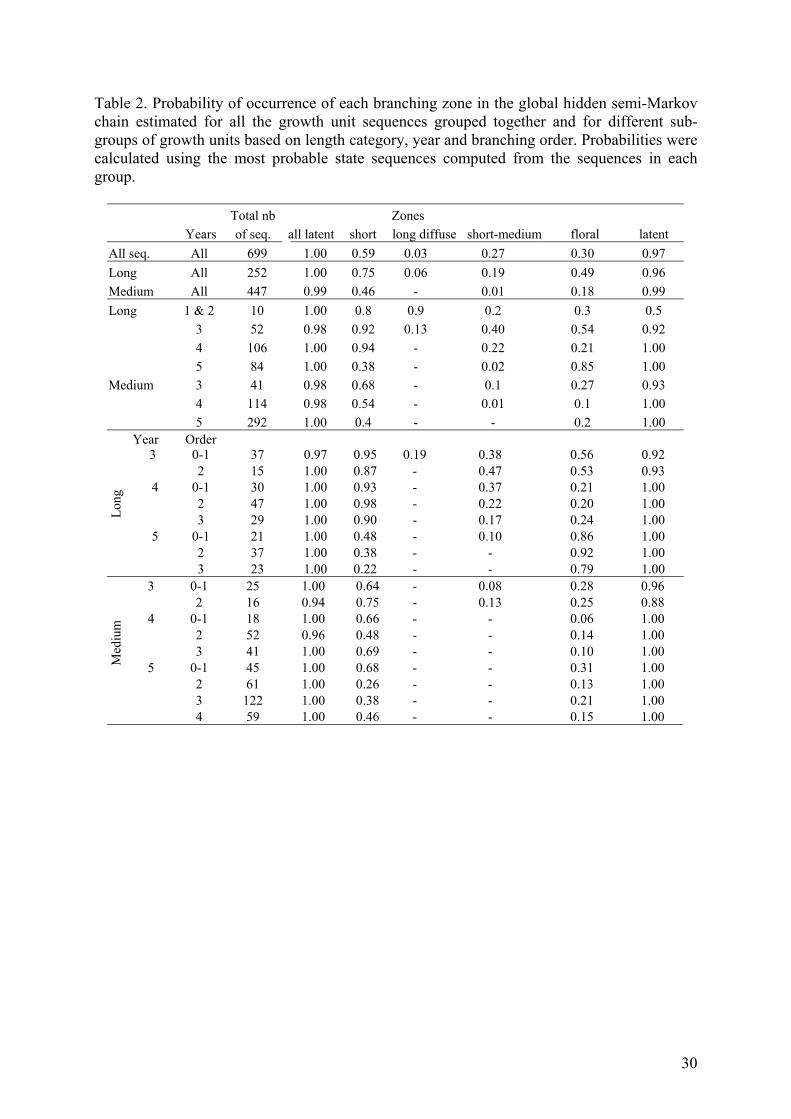
Table 2. Probability of occurrence of each branching zone in the global hidden semi-Markov chain estimated for all the growth unit sequences grouped together and for different sub-groups of growth units based on length category, year and branching order. Probabilities were calculated using the most probable state sequences computed from the sequences in each group.
Total nb Zones Years of seq. all latent short long diffuse short-medium floral latent All seq. All 699 1.00 0.59 0.03 0.27 0.30 0.97 Long All 252 1.00 0.75 0.06 0.19 0.49 0.96 Medium All 447 0.99 0.46 - 0.01 0.18 0.99 Long 1 & 2 10 1.00 0.8 0.9 0.2 0.3 0.5 3 52 0.98 0.92 0.13 0.40 0.54 0.92 4 106 1.00 0.94 - 0.22 0.21 1.00 5 84 1.00 0.38 - 0.02 0.85 1.00 Medium 3 41 0.98 0.68 - 0.1 0.27 0.93 4 114 0.98 0.54 - 0.01 0.1 1.00 5 292 1.00 0.4 - - 0.2 1.00
Year 3
Order 0-1 37 0.97 0.95 0.19 0.38 0.56 0.92
2 15 1.00 0.87 - 0.47 0.53 0.93 4 0-1 30 1.00 0.93 - 0.37 0.21 1.00 2 47 1.00 0.98 - 0.22 0.20 1.00 3 29 1.00 0.90 - 0.17 0.24 1.00
5 0-1 21 1.00 0.48 - 0.10 0.86 1.00 2 37 1.00 0.38 - - 0.92 1.00
Long
3 23 1.00 0.22 - - 0.79 1.00 3 0-1 25 1.00 0.64 - 0.08 0.28 0.96 2 16 0.94 0.75 - 0.13 0.25 0.88
4 0-1 18 1.00 0.66 - - 0.06 1.00 2 52 0.96 0.48 - - 0.14 1.00 3 41 1.00 0.69 - - 0.10 1.00
5 0-1 45 1.00 0.68 - - 0.31 1.00 2 61 1.00 0.26 - - 0.13 1.00
Med
ium
3 122 1.00 0.38 - - 0.21 1.00 4 59 1.00 0.46 - - 0.15 1.00
30

Tabl
e 3.
Par
amet
ers
of th
e zo
ne le
ngth
, i.e
. zon
e le
ngth
dis
tribu
tions
est
imat
ed f
rom
sub
-gro
ups
of g
row
th u
nits
, cla
ssifi
ed a
ccor
ding
to th
eir
leng
th (
long
and
med
ium
), ye
ar a
nd o
rder
: num
ber
of o
bser
ved
sequ
ence
s in
the
zone
(n)
; mea
n va
lue
(M)
and
stan
dard
dev
iatio
n (s
td)
of th
e zo
ne le
ngth
. Sig
nific
ant d
iffer
ence
s bet
wee
n ye
ars w
ithin
a le
ngth
cat
egor
y, a
nd a
ccor
ding
to a
non
-par
amet
ric W
ilcox
on-M
ann-
Whi
tney
test
, are
in
dica
ted
by d
iffer
ent l
ette
rs (i
n ca
pita
l whe
n p
< 0.
01 a
nd n
on c
apita
l whe
n 0.
01 <
p <
0.0
5). (1
) Test
s wer
e pe
rfor
med
onl
y fo
r n >
10.
Zone
s
GU
gro
up
All
late
nt
Shor
t-lat
ent
Long
diff
use(1
) Sh
ort-m
ed(1
)
Flor
al (1
) A
ll-la
tent
(1)
Len
gth
Yea
rs
n M
std
n
n
M
Mst
d st
d n
Mst
d n
M
std
nM
st
d Lo
ng
y1 &
2
10
5.9
1.91
8
2.
882.
36
935
.22
13.3
62
9.00
0 3
7.67
1.
535
6.00
4.
53
y3
51
5.45
B
3.41
48
4.92
B4.
87
735
.14
10.4
521
6.67
a2.
7628
9.07
3.74
485.
19b
4.22
y4
10
64.
44B
2.
60
100
7.74
A4.
90
--
- 23
9.09
a5.
4822
7.32
2.57
106
6.22
a
3.72
y5
84
7.
29A
2.
33
323.
56B
3.39
-
--
211
.00
4.24
718.
01ns
2.49
844.
65b
2.46
M
ediu
my3
404.
952.
11
282.
752.
41
--
- 4
5.00
0.81
114.
002.
0538
2.42
b1.
24
y4
11
24.
28
1.54
62
3.29
2.38
-
--
15.
000.
0011
3.00
1.18
114
3.17
a
1.63
y5
292
4.58
ns
1.63
11
72.
87
ns2.
29
--
- -
--
573.
95ns
1.53
29
23.
05
a1.
52
Yea
rO
rder
y3
0-
136
4.97
2.44
35
5.23
5.23
7
37.1
4 10
.44
146.
142.
1420
8.95
3.55
345.
154.
37
2
15
6.6
ns
4.97
13
4.08
ns3.
82
--
- 7
7.71
3.68
89.
38
4.43
145.
29ns
3.97
y4
0-1
30
3.37
B
1.
88
287.
57b
4.71
-
--
89.
254.
276
6.17
1.
6030
5.67
3.98
2
47
5.21
A
3.
13
467.
00b
5.41
-
--
1010
.70
6.90
98.
00
2.69
476.
813.
90
329
4.
31
A
1.83
26
9.23
a3.
88
--
- 5
5.60
2.07
77.
43
3.05
295.
83ns
3.09
y5
0-1
21
6.62
2.46
10
3.20
3.42
-
--
211
.00
4.24
188.
222.
4121
4.10
2.05
2
37
7.59
ns
2.
11
142.
713.
27
--
- -
--
348.
002.
0637
4.95
2.79
Long
323
7.
392.
46
56.
00ns
3.30
-
--
--
- 18
7.94
ns3.
3723
4.78
ns2.
35
y30-
125
5.56
a 2.
14
162.
251.
84
--
- 2
4.50
0.71
74.
42
2.14
242.
541.
41
215
3.
93
b 1.
67
123.
42ns
2.97
-
--
25.
500.
714
3.25
1.
8914
2.21
ns0.
89
y40-
118
3.
61
b 1.
85
124.
08a
2.23
-
--
--
- 1
5.00
0.
0018
3.17
1.50
2
50
4.74
a
1.64
25
2.76
b1.
92
--
- -
--
73.
29
1.38
523.
061.
60
341
3.
98
b 1.
23
243.
42ab
2.86
-
--
--
- 4
2.50
0.
5841
3.27
ns1.
75
y50-
145
4.73
AB
2.0
2 26
3.04
2.18
-
--
--
- 14
4.36
1.34
453.
02ab
1.47
2
61
5.15
A
1.
57
162.
063.
27
--
- -
--
83.
631.
0661
3.70
a1.
94
Medium
312
24.
42
B
1.66
46
3.04
2.57
-
--
--
- 26
3.92
1.83
122
2.97
b
1.40
4
594.
27B
1.
23
272.
85
ns
1.77
-
--
--
- 9
3.67
ns
1.22
592.
64b
1.13
31

YY
All sequences
Medium Gus Long Gus
Year 1 and 2ear 3 Year 4 Year 5 Year 3 Year 4 Year 5
O 0&1O2
O 0&1O2
O3
O 0&1O2
O3
O 0&1O2
O3
O 0&1
O2O3
O 0&1
O2O3
O4
All sequences
Medium Gus Long Gus
Year 1 and 2ear 3 Year 4 Year 5 Year 3 Year 4 Year 5
O 0&1O2
O 0&1O2
O3
O 0&1O2
O3
O 0&1O2
O3
O 0&1
O2O3
O 0&1
O2O3
O4
Fig. 1. Diagrammatic representation of the ways that sequences were grouped to explore the within-tree variability of branching patterns.
32
00,20,40,60,81
latent
longme
diumsho
rtflor
al
State 2
00,20,40,60,81
latent
long
mediu
msho
rtflor
al
State 3
00,20,40,60,81
latent
long
mediu
msho
rtflor
al
State 4
00,20,40,60,81
latent
long
mediu
msho
rtflor
al
State 5
01
23
46
0.59
0.04
0.25
0.10
1.0
0.38
1.0
0.99
0.14
0.26
51.
0
0.26
0.23
0.47
0.09
0.28
0.79
0.11
00,20,40,60,81
latent
longme
dium
short
floral
State 1
prob
abili
ty
Nod
e ra
nk
probability
Sta
te 1
0
0,1
0,2
0,3
05
1015
0
0,050,1
0,150,2
05
10
Stat
e 0
Sta
te 2
0
0,01
0,02
0,03
0,04
020
4060
Stat
e 3
0
0,050,1
0,15
05
1015
20
Stat
e 4
0
0,050,1
0,15
05
1015
20
Stat
e 5
0
0,1
0,2
0,3
05
10
00,20,40,60,81
latent
longme
diumsho
rtflor
al
State 2
00,20,40,60,81
latent
long
mediu
msho
rtflor
al
State 3
00,20,40,60,81
latent
long
mediu
msho
rtflor
al
State 4
00,20,40,60,81
latent
long
mediu
msho
rtflor
al
State 5
01
23
466
0.59
0.04
0.25
0.10
1.0
0.38
1.0
0.99
0.14
0.26
51.
0
0.26
0.23
0.47
0.09
0.28
0.79
0.11
00,20,40,60,81
latent
longme
dium
short
floral
State 1
prob
abili
ty
Nod
e ra
nk
probability
Sta
te 1
0
0,1
0,2
0,3
05
1015
0
0,050,1
0,150,2
05
10
Stat
e 0
Sta
te 2
0
0,01
0,02
0,03
0,04
020
4060
Stat
e 3
0
0,050,1
0,15
05
1015
20
Stat
e 4
0
0,050,1
0,15
05
1015
20
Stat
e 5
0
0,1
0,2
0,3
05
10
Fig.
2. G
raph
rep
rese
ntat
ion
of th
e hi
dden
sem
i-Mar
kov
chai
n es
timat
ed f
rom
all
the
grow
th u
nits
(G
Us)
of
two
trees
of
‘Fuj
i’ cu
ltiva
r. Th
e su
cces
sive
bra
nchi
ng z
ones
alo
ng th
e G
Us
are
mod
elle
d by
sta
tes,
repr
esen
ted
by c
ircle
s: s
tate
s 0
to 5
are
tran
sien
t (si
mpl
e ci
rcle
) and
sta
te 6
is
abso
rbin
g (d
oubl
e ci
rcle
). Th
e po
ssib
ility
of t
rans
ition
fro
m o
ne z
one
to a
noth
er is
rep
rese
nted
by
an a
rrow
and
the
prob
abili
ty o
f tra
nsiti
on is
in
dica
ted
abov
e th
e ar
row
. The
occ
upan
cy d
istri
butio
ns w
hich
repr
esen
t the
zon
e le
ngth
in n
umbe
r of n
odes
(exc
ept f
or th
e fin
al a
bsor
bing
stat
e)
and
the
obse
rvat
ion
dist
ribut
ions
whi
ch r
epre
sent
the
zone
com
posi
tion
(pro
porti
ons
of d
iffer
ent b
ranc
hing
type
s: la
tent
, lon
g, m
ediu
m, s
hort,
flo
ral)
are
atta
ched
to e
ach
stat
e an
d ar
e at
the
botto
m a
nd th
e to
p of
the
grap
h re
spec
tivel
y.
33
Nb of successive latent buds
0
100
200
300
400
500
600
700
1 3 5 7 9 11 13 15 17 19 21 23 25 27 29 31 33 35 37 39
freq
uenc
yobser vedtheoretical
Nb of successive long axillary GU
0
10
20
30
40
50
1 2 3 4
freq
uenc
y
obser vedtheoretical
Nb of successive short axillary GU
0
100
200
300
400
500
600
700
1 2 3 4 5 6 7 8 9 10 11 12
freq
uenc
y
obser vedtheoretical
Nb of successive f loral axillary GU
0
50100
150
200250
300
350400
1 2 3 4 5 6 7 8 9 10 11 12
freq
uenc
y
obser vedtheoretical
Nb of successive latent buds
0
100
200
300
400
500
600
700
1 3 5 7 9 11 13 15 17 19 21 23 25 27 29 31 33 35 37 39
freq
uenc
yobser vedtheoretical
Nb of successive long axillary GU
0
10
20
30
40
50
1 2 3 4
freq
uenc
y
obser vedtheoretical
Nb of successive latent buds
0
100
200
300
400
500
600
700
1 3 5 7 9 11 13 15 17 19 21 23 25 27 29 31 33 35 37 39
freq
uenc
yobser vedtheoretical
Nb of successive long axillary GU
0
10
20
30
40
50
1 2 3 4
freq
uenc
y
obser vedtheoretical
Nb of successive short axillary GU
0
100
200
300
400
500
600
700
1 2 3 4 5 6 7 8 9 10 11 12
freq
uenc
y
obser vedtheoretical
Nb of successive f loral axillary GU
0
50100
150
200250
300
350400
1 2 3 4 5 6 7 8 9 10 11 12
freq
uenc
y
obser vedtheoretical
(a)
Nb of occurrences of latent buds
0
20
40
60
80
100
120
0 5 10 15 20 25 30 35 40
nb o
f GU
observedtheoretical
Nb of occurrences of long lateral GU
0
100
200
300
400
500
600
700
800
0 1 2 3 4 5 6 7 8 9 10
nb o
f GU
observedtheoretical
Nb of occurrences of short lateral GU
0
50
100
150
200
250
300
0 1 2 3 4 5 6 7 8 9 10 11 12 13 14 15 16 17 18 19 20
nb o
f GU
observedtheoretical
Nb of occurrences of floral lateral GU
0
50
100
150
200
250
300
350
400
450
0 1 2 3 4 5 6 7 8 9 10 11 12 13 14 15 16 17 18 19 20
nb o
f GU
observedtheoretical
(b)
Fig. 3. Assessment of the accuracy of the global model by fitting the characteristic distributions computed from model parameters to the corresponding empirical characteristic distributions extracted from the observed sequences of two trees of ‘Fuji’ cultivar. Comparison of the number of occurrences of the different lateral growth units (GUs) per parent GU (a), and the number of successive lateral GUs of a particular type (b) for four lateral GU types: latent buds, long, short and floral lateral GUs.
34
0.0.
Medium
0.46
0.03
43
0.80
0.11
0.17
0.501.0
0.50
0.99
5 nodes
Medium
0.46
0.03
43
0.80
0.11
0.17
0.501.0
0.50
0.99
5 nodes5 nodes
Long
0.38
0.74
0.08
0.19
1.0
0.24
0.27
0.110.87
0.27
0.38
0.9910 nodes
Long
0.38
0.74
0.08
0.19
1.0
0.24
0.27
0.110.87
0.27
0.38
0.9910 nodes10 nodes
State 0 – all-latent buds
State 4 – floral lateral GUsState 3 – short and medium lateral GUsState 2 – all types of lateral GUs mixtedState 1 – short lateral GUs
State 5 – latent buds
State 0 – all-latent budsState 0 – all-latent buds
State 4 – floral lateral GUsState 4 – floral lateral GUsState 3 – short and medium lateral GUsState 3 – short and medium lateral GUsState 2 – all types of lateral GUs mixtedState 2 – all types of lateral GUs mixtedState 1 – short lateral GUsState 1 – short lateral GUs
State 5 – latent budsState 5 – latent buds
(a)
Medium y5
0.54
0.02
0.41
0.90
0.04
0.081.0
1.0
Medium y4Medium y3
0.70
0.14
0.20
0.64
0.10
0.21
0.751.0
1.0
0.25
0.400.47
0.83
0.130.17
1.0
1.0
5 nodes
Medium y5
0.54
0.02
0.41
0.90
0.04
0.081.0
1.0
0.54
0.02
0.41
0.90
0.04
0.081.0
1.0
Medium y4Medium y3
0.70
0.14
0.20
0.64
0.10
0.21
0.751.0
1.0
0.25
0.70
0.14
0.20
0.64
0.10
0.21
0.751.0
1.0
0.25
0.400.47
0.83
0.130.17
1.0
1.0
0.400.47
0.83
0.130.17
1.0
1.0
5 nodes5 nodes
(b)
LL 0.0.
ong y1 & y2
1.0
0.1080
0.11
1.0
0.22
1.01.0
0.10
Long y3
Long y4
0.940.23
1.0
1.0
0.92
0.11
0.15
0.14
1.0
0.08
0.42
0.330.62
0.290.15
Long y5
0.38
0.06
0.25
0.18 1.0
0.58
0.69
1.01.0
1.0 1.0
0.59
10 nodes
ong y1 & y2
1.0
0.1080
0.11
1.0
0.22
1.01.0
0.10
Long y3
Long y4
0.940.23
1.0
1.0
0.92
0.11
0.15
0.14
1.0
0.08
0.42
0.330.62
0.290.15
Long y5
0.38
0.06
0.25
0.18 1.0
0.58
0.69
1.01.0
1.0 1.0
0.59
10 nodes10 nodes
(c)
Fig. 4. Schematic representation of branching patterns in subgroups of growth units (GUs) of two trees of ‘Fuji’ cultivar. GUs were classified according to their length (a), length and year (b and c). The successive zone compositions (proportion of different lateral GU) are indicated by different motifs and the transition probabilities are indicated by arrows (transitions to the floral zone are indicated in bold characters). The scale used for medium GUs is two-fold less than for long GUs.
35
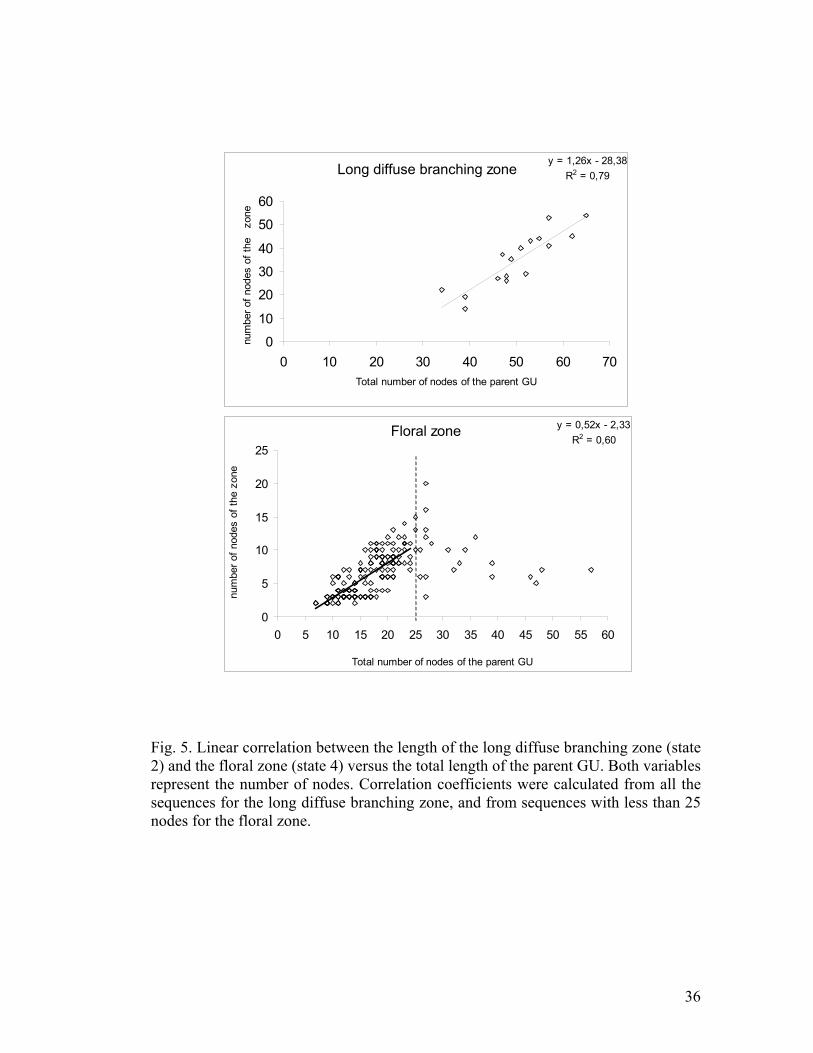
Long diffuse branching zone
y = 1,26x - 28,38R2 = 0,79
0
10
20
30
40
50
60
0 10 20 30 40 50 60 70Total number of nodes of the parent GU
num
ber o
f nod
es o
f the
zo
ne
Floral zone y = 0,52x - 2,33R2 = 0,60
0
5
10
15
20
25
0 5 10 15 20 25 30 35 40 45 50 55 60
Total number of nodes of the parent GU
num
ber o
f nod
es o
f the
zon
e
Fig. 5. Linear correlation between the length of the long diffuse branching zone (state 2) and the floral zone (state 4) versus the total length of the parent GU. Both variables represent the number of nodes. Correlation coefficients were calculated from all the sequences for the long diffuse branching zone, and from sequences with less than 25 nodes for the floral zone.
36

11 00 11
00
State 1
0
0,2
0,4
0,6
0,8
1
latent long medium short floral
prob
abilit
ymedium n = 617long n = 1147
** p = 1.3 10-8
parent GUState 4
0
0,2
0,4
0,6
0,8
1
latent long medium short floral
prob
abilit
y
medium n = 302long n = 1007
ns p = 0.29
parent GU
(c)
State 1
0,2
0,4
0,6
0,8
latent long medium short f loral
prob
abilit
y
Med-y3Med-y4Med-y5
NS p = 0.22
parent GU State 4
0
0,2
0,4
0,6
0,8
1
latent long medium short floral
prob
abilit
y
Med-y3Med-y4Med-y5
NS p = 0.85
parent GU
State 1
0,2
0,4
0,6
0,8
latent long medium short f loral
prob
abilit
y
Long-y3Long-y4Long-y5
NS p = 0.29
parent GU State 4
0
0,2
0,4
0,6
0,8
1
latent long medium short f loral
prob
abilit
y
Long-y3Long-y4Long-y5
* p = 0.003
parent GU
(b)
(a) State 1
0
0,2
0,4
0,6
0,8
1
latent long medium short floral
prob
abilit
ymedium n = 617long n = 1147
** p = 1.3 10-8
parent GUState 4
0
0,2
0,4
0,6
0,8
1
latent long medium short floral
prob
abilit
y
medium n = 302long n = 1007
ns p = 0.29
parent GU
(c)
State 1
0,2
0,4
0,6
0,8
latent long medium short f loral
prob
abilit
y
Med-y3Med-y4Med-y5
NS p = 0.22
parent GU State 4
0
0,2
0,4
0,6
0,8
1
latent long medium short floral
prob
abilit
y
Med-y3Med-y4Med-y5
NS p = 0.85
parent GU
State 1
0,2
0,4
0,6
0,8
latent long medium short f loral
prob
abilit
y
Long-y3Long-y4Long-y5
NS p = 0.29
parent GU State 4
0
0,2
0,4
0,6
0,8
1
latent long medium short f loral
prob
abilit
y
Long-y3Long-y4Long-y5
* p = 0.003
parent GU
(b)
(a)
Fig. 6. Branching type distributions for the short-lateral zone (state 1, left) and floral zone (state 4, right) built from the most probable state sequences computed from the hidden semi-Markov chain of two trees of ‘Fuji’ cultivar. Growth units were classified into subgroups according to their length (a), length and years (b and c). Distribution comparisons were performed using chi-square tests between medium and long GUs (a, here n represents the number of GUs per category length in which the considered state was observed); between years for medium GUs (b) and long Gus (c). (NS : test non significant with p > 0.05; * test significant with 0.01 < p <0.05; ** test highly significant with p < 0.01).
37