Embed Size (px)
DESCRIPTION
Similarity Measure Based on Partial Information of Time Series. Advisor : Dr. Hsu Graduate : You-Cheng Chen Author : Xiaoming Jin Yuchang Lu Chunyi Shi. Outline. Motivation Objective Introduction Retrieval and Representation of partial Information - PowerPoint PPT Presentation
Citation preview

Similarity Measure Based on Partial Information of Time Series
Advisor : Dr. HsuGraduate : You-Cheng ChenAuthor : Xiaoming Jin
Yuchang Lu Chunyi Shi

Motivation Objective Introduction Retrieval and Representation of partial Information System Setup Results and Discussion Conclusions Personal Opinion
Outline

Motivation
A “good” similarity measurement is determined by human.

Objective
To propose a model for the retrieval and representation of the partial information in time series.

Introduction
The model has three objects: Get the partial information Represent partial information in a compressed form Most similarity model could be applied

Retrieval and Representation of Partial Information
3.1 General Description
Definition 1: Use a rule F to decompose X into a set of time series
))(),...,1(( NXXX
),...,( ''1 TXXX

3.1 General Description
Definition 2: (1) Segment X into a set of sub-series
))(),...,1(( jrXrjrXX j
(2) X’jk is the k-th F-based component of sub-series Xj
Use mapping rule T to map each X’jk to a value Rk
(j)

3.1 General Description
),...,( 1 WKKK is the orders of all the representing sequences of interest.
Definition 3:
),...,( 1 Wk AAA where An is the degree of user’s interest to n-th component
is portion of partial information of interest
n KnKnXA )( '

3.1 General Description
Definition 4:
)()( /),(),( wmKK KRAmRwmMODwmMOD
is the full representing sequence(FRS) of the partialinformation
n KnKnXA )( '

Definition 5: Given two time series X,Y
3.1 General Description
))(),((),( YFRSXFRSDYXMD

Sum up, a representing model for partial informationcan be summarized by
3.1 General Description
Decomposition method F Representation method T Distance measurement
D

3.1 General Description
Example 1

3.1 General Description
Use F to decompose time series to two components
(1) Local fluctuating movement S’1 (2) Global movement S’2
nfluctuatioS
otherwise
j
jR
1'
01 )(
FRS(X)=R1 and the length of the FRS(X)=200/8

3.2 Practial Method
Let H is transform matrix of a given orthonormaldiscrete transform
So Tj=H*Xj
We denote the results of discrete transform of timeSeries Xj and Yj by DT(Xj)=XTj, DT(Yj)=YTj

3.2 Practial Method
))1/(()()( /' rrnnIBkTnX krnn
T
mrmmm HHHIB
1
,11
,11,0
The k-th component of X is
)()( kTmR mk The k-th representing sequence isThen FRS(X) can be calculated as:
)()( ),(/),( WmMODwmK KTAmRwmMOD

Here we use DCT(discrete Cosine transform) in ourexperiments
3.2 Practial Method
W
n
W
nKnKnKnKn AYAXL
1 1
''2 ),(
q
j
W
nKnnjnj AKYTKXTYXMD
1 1
22))()((),(
W
n
W
nKnKnKnKn AYAXL
1 1
''2 ),(

4. System Setup
4.1 Evaluation of Similarity Measurement Based on Partial Information
We use hierarchical agglomerative clustering(HAC) to cluster FRSs.
)/(2),( jijiji SCSCSCSim
kSCSimSCSimi
jij
/,max),(

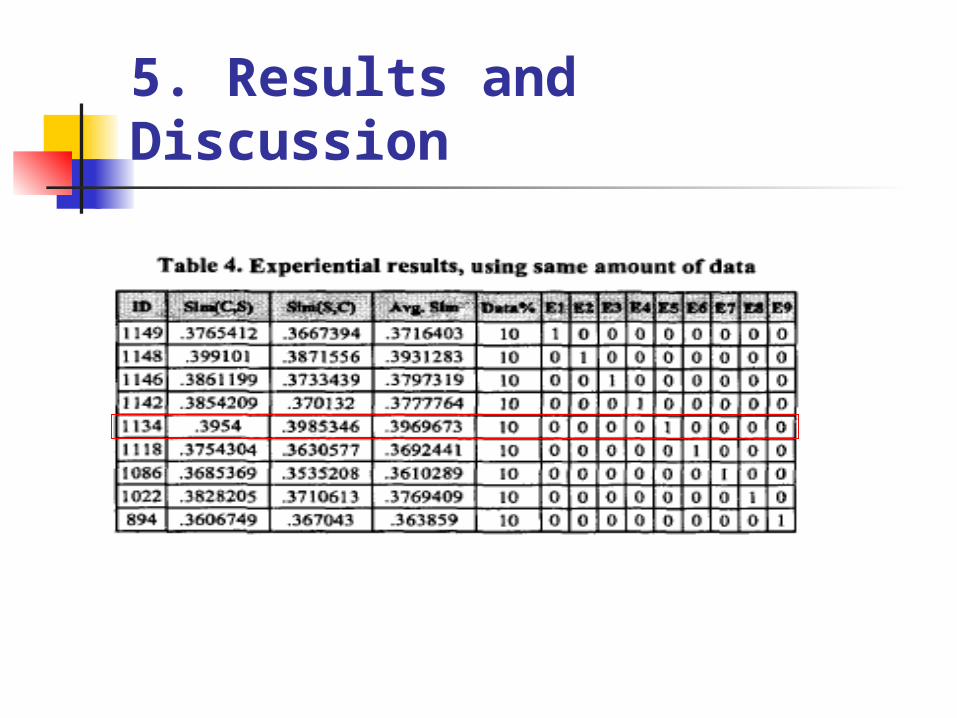
5. Results and Discussion
We used historical stock data and only considered the time series of closing price. Step 1: use DCT to decompose time series and to represent partial information.
Step 2: E=(E1,…,Er) to represent the chosen portion.
Step 3: E was used to calculate K and together with A Then FRSs of each time series were generatedStep 4: calculating MD and clustering

5. Results and Discussion
11,15,14,10,19,10,14,17,14 3, 3, 3, 3, 2, 4, 4, 5, 5
5. Results and Discussion

Conclusions
The experimental results could help designing a more effective and more efficient similarity measurement

Personal Opinion
The similarity measurement can be improvedbetter by increasing the weight of the meaningfulcomponent.