Embed Size (px)
Citation preview
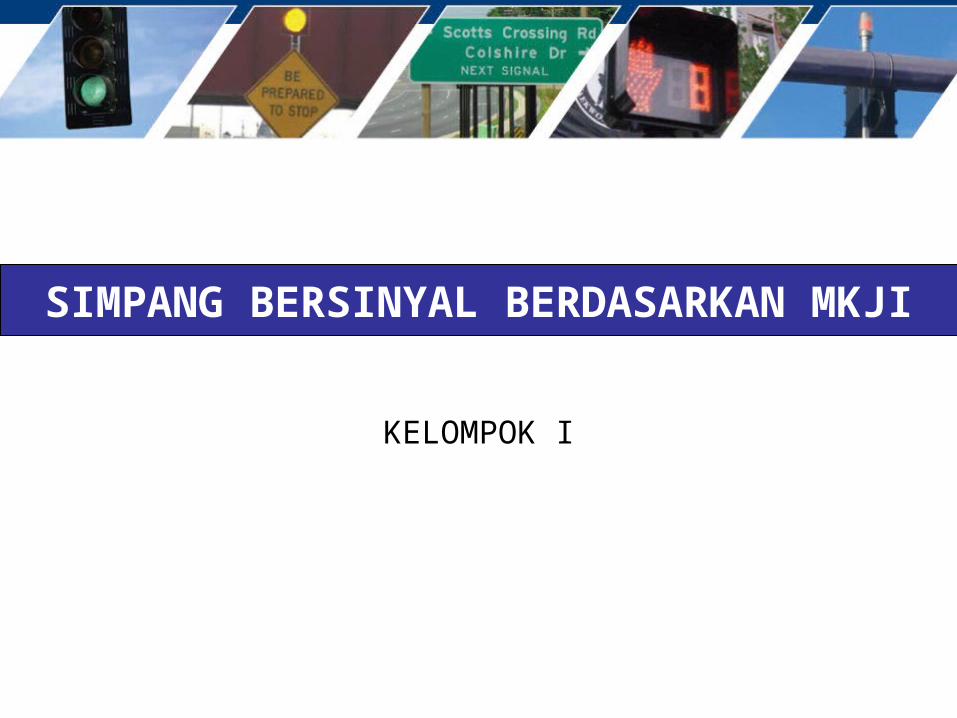
SIMPANG BERSINYAL BERDASARKAN MKJI
KELOMPOK I
MANUAL KAPASITAS JALAN INDONESIA
Signalized Intersection Safety Strategies
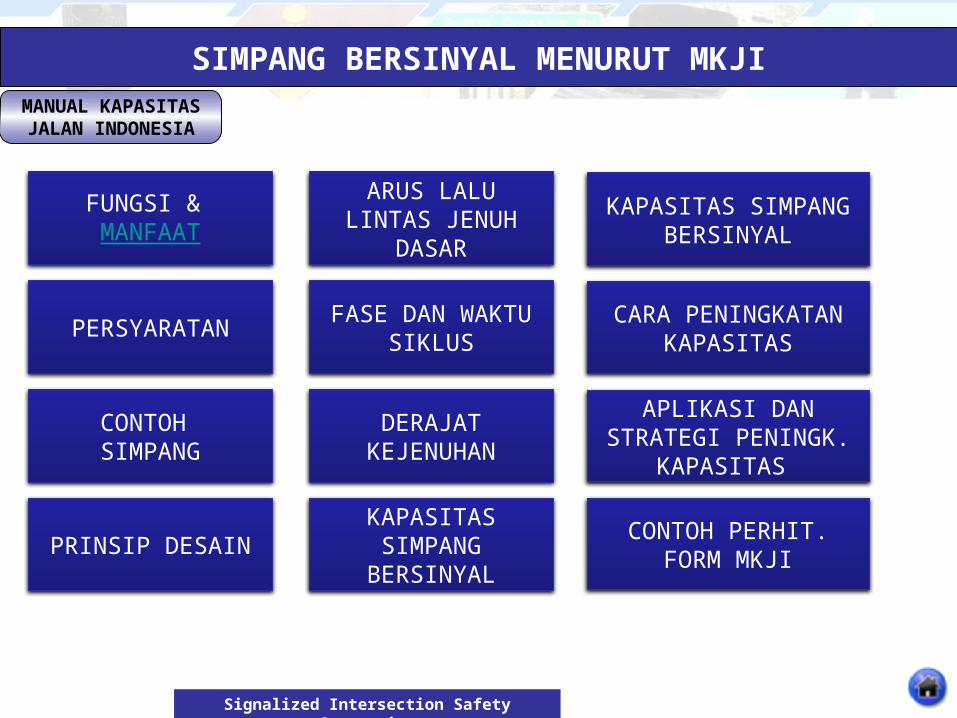
SIMPANG BERSINYAL MENURUT MKJI
FUNGSI & MANFAAT
PERSYARATAN
CONTOH SIMPANG
PRINSIP DESAIN
ARUS LALU LINTAS JENUH DASAR
FASE DAN WAKTU SIKLUS
DERAJAT KEJENUHAN
KAPASITAS SIMPANG
BERSINYAL
KAPASITAS SIMPANG BERSINYAL
CARA PENINGKATAN KAPASITAS
APLIKASI DAN STRATEGI PENINGK.
KAPASITAS
CONTOH PERHIT. FORM MKJI
MANUAL KAPASITAS JALAN INDONESIA
Signalized Intersection Safety Strategies
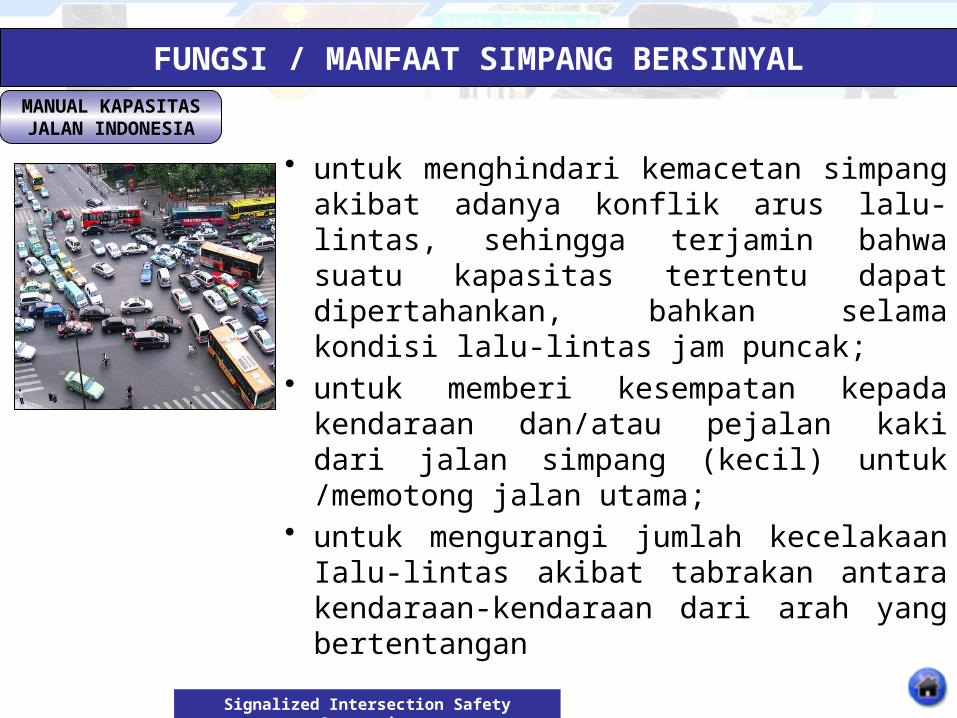
FUNGSI / MANFAAT SIMPANG BERSINYAL
• untuk menghindari kemacetan simpang akibat adanya konflik arus lalu-lintas, sehingga terjamin bahwa suatu kapasitas tertentu dapat dipertahankan, bahkan selama kondisi lalu-lintas jam puncak;
• untuk memberi kesempatan kepada kendaraan dan/atau pejalan kaki dari jalan simpang (kecil) untuk /memotong jalan utama;
• untuk mengurangi jumlah kecelakaan Ialu-lintas akibat tabrakan antara kendaraan-kendaraan dari arah yang bertentangan
Signalized Intersection Safety Strategies
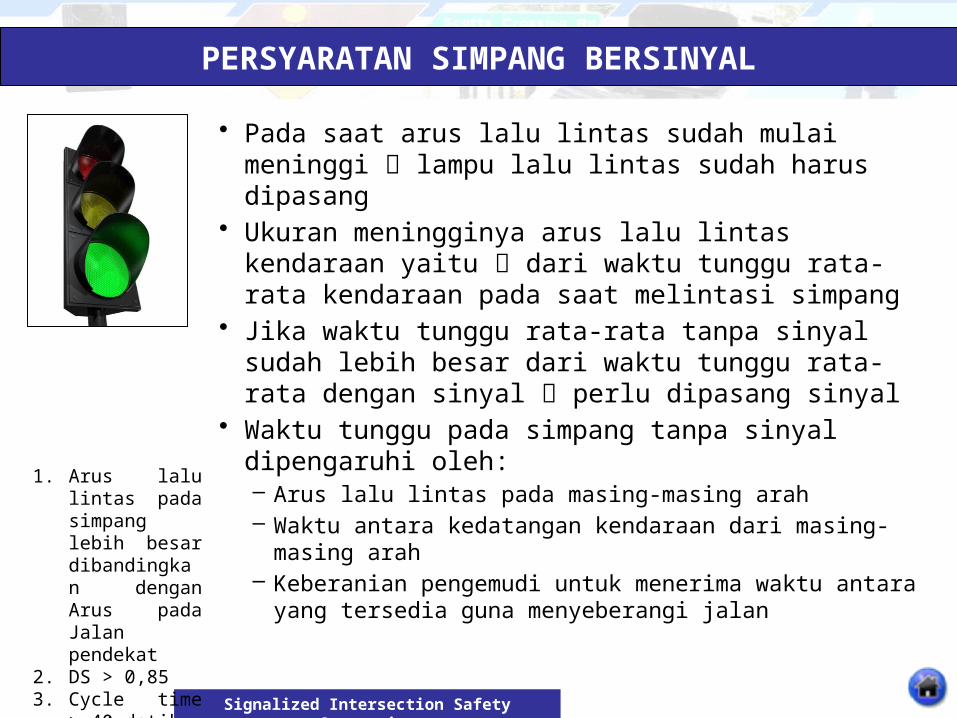
PERSYARATAN SIMPANG BERSINYAL
• Pada saat arus lalu lintas sudah mulai meninggi lampu lalu lintas sudah harus dipasang
• Ukuran meningginya arus lalu lintas kendaraan yaitu dari waktu tunggu rata-rata kendaraan pada saat melintasi simpang
• Jika waktu tunggu rata-rata tanpa sinyal sudah lebih besar dari waktu tunggu rata-rata dengan sinyal perlu dipasang sinyal
• Waktu tunggu pada simpang tanpa sinyal dipengaruhi oleh:– Arus lalu lintas pada masing-masing arah– Waktu antara kedatangan kendaraan dari masing-masing arah– Keberanian pengemudi untuk menerima waktu antara yang
tersedia guna menyeberangi jalan
1. Arus lalu lintas pada simpang lebih besar dibandingkan dengan Arus pada Jalan pendekat
2. DS > 0,853. Cycle time > 40
detik
Signalized Intersection Safety Strategies
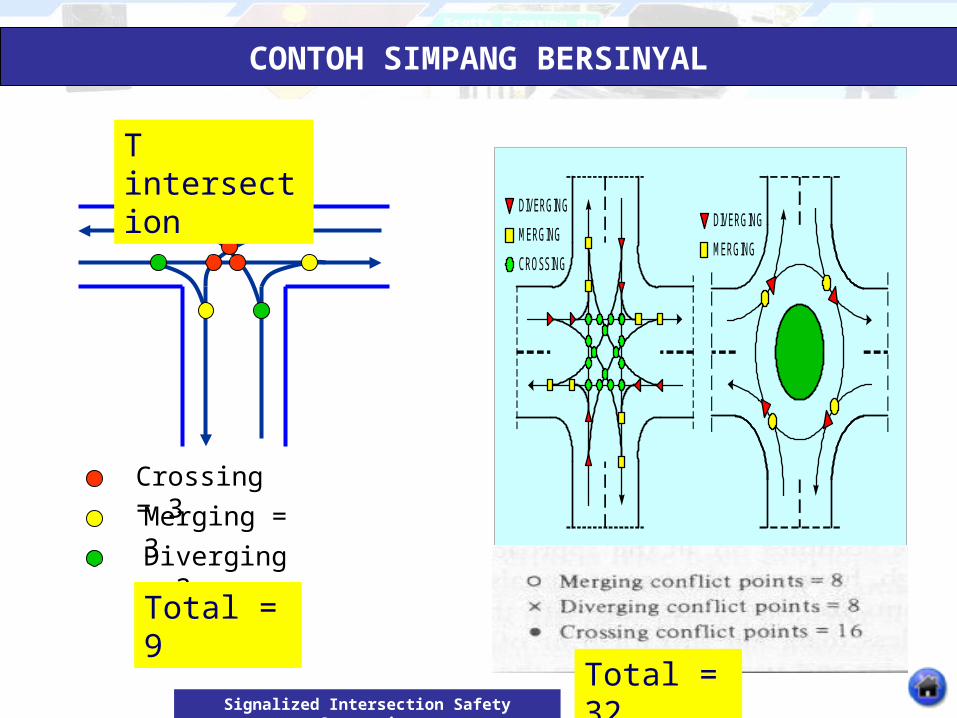
CONTOH SIMPANG BERSINYAL
T intersection
Crossing = 3
Merging = 3
Diverging = 3
Total = 9
DIVERGING
MERGING
DIVERGING
MERGING
CROSSING
Total = 32
Signalized Intersection Safety Strategies
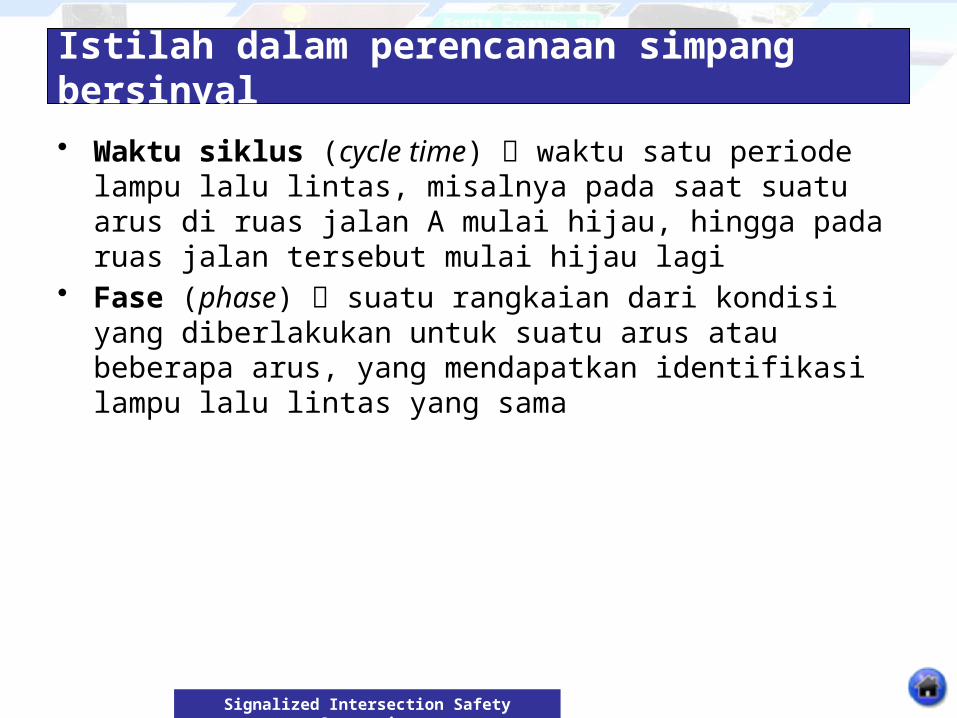
Istilah dalam perencanaan simpang bersinyal• Waktu siklus (cycle time) waktu satu periode lampu lalu lintas, misalnya
pada saat suatu arus di ruas jalan A mulai hijau, hingga pada ruas jalan tersebut mulai hijau lagi
• Fase (phase) suatu rangkaian dari kondisi yang diberlakukan untuk suatu arus atau beberapa arus, yang mendapatkan identifikasi lampu lalu lintas yang sama
Signalized Intersection Safety Strategies
Prinsip-prinsip desain simpang secara umum di Indonesia
• Jari-jari tikungan berkisar antara 6 s/d 9 meter
• Hindari jari-jari terlalu kecil kendala manuver bagi bus & truk
• Fasilitas penyeberang jalan (zebra cross) 2,5 s/d 5 meter sejarak 2 meter didepan garis henti
• Panjang pelebaran harus lebih besar dari probabilitas panjang antrian terbesar
Signalized Intersection Safety Strategies
Prinsip-prinsip desain simpang secara umum di Indonesia
• Jalur khusus bus berakhir pada awal panjang antrian terbesar
• Jika arus lalulintas belok kanan cukup besar, perlu dibuatkan jalur khusus belok kanan dilengkapi dengan rambu dan marka yang sesuai
Signalized Intersection Safety Strategies
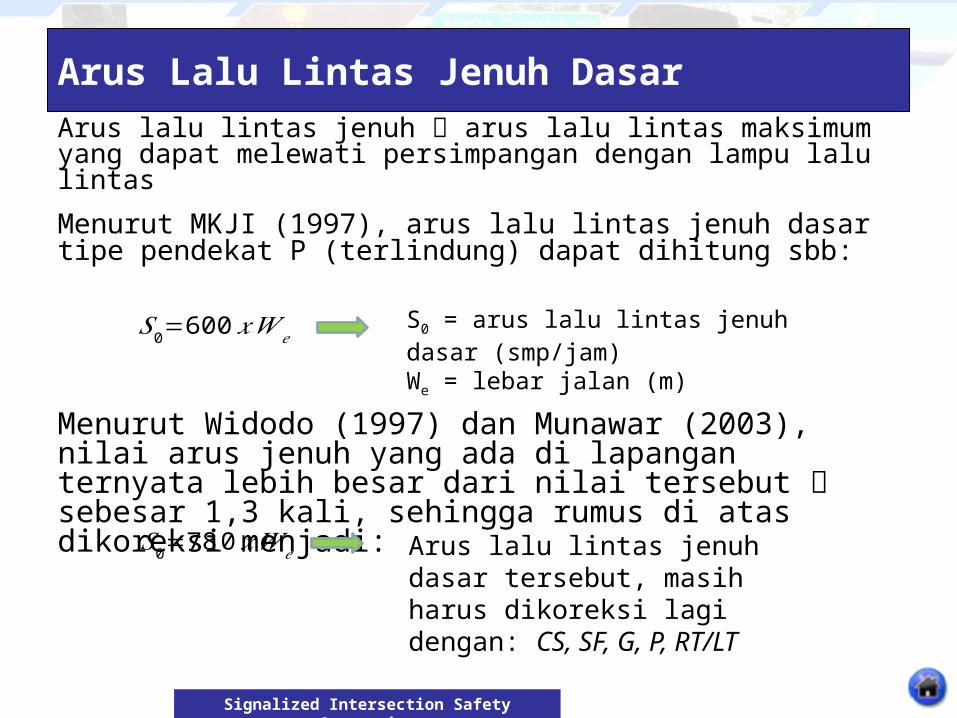
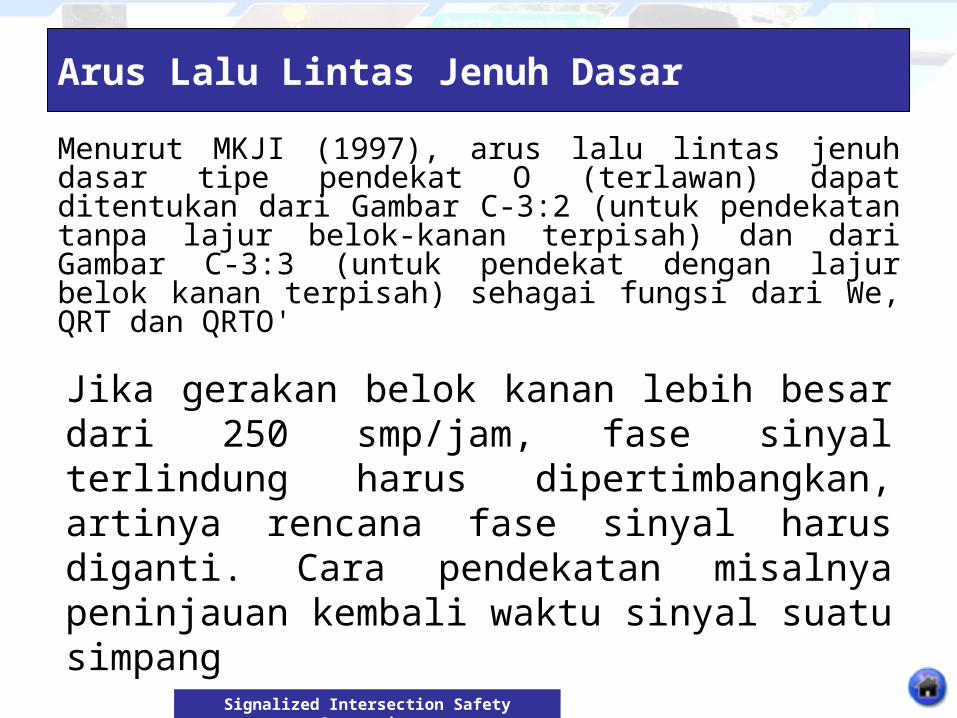
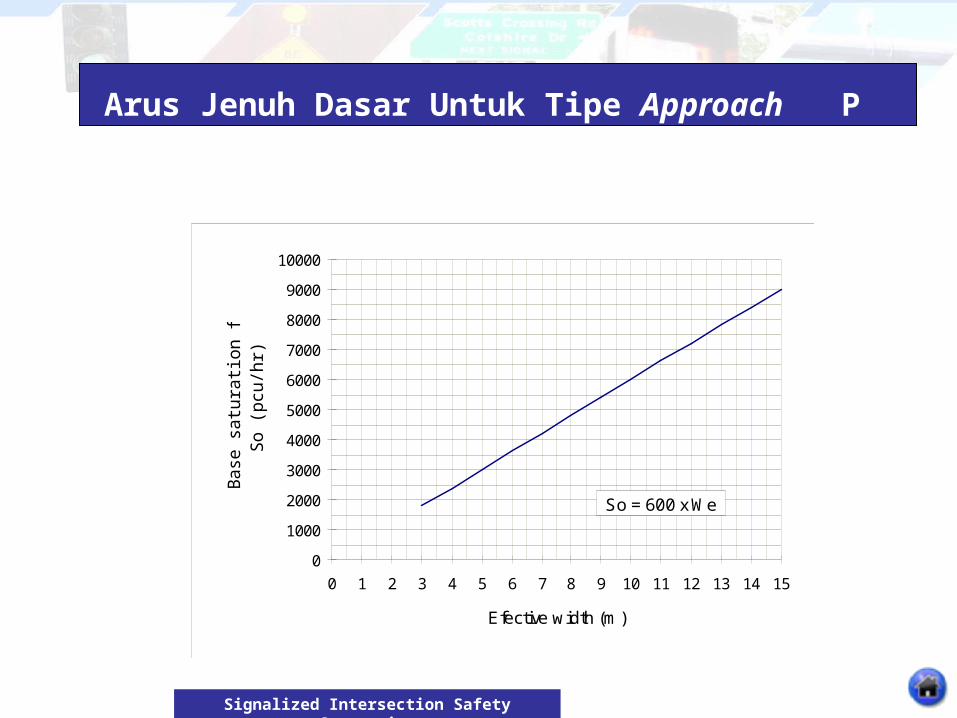
Arus Lalu Lintas Jenuh Dasar
Arus lalu lintas jenuh arus lalu lintas maksimum yang dapat melewati persimpangan dengan lampu lalu lintasMenurut MKJI (1997), arus lalu lintas jenuh dasar tipe pendekat P (terlindung) dapat dihitung sbb:
𝑆0=600𝑥𝑊𝑒S0 = arus lalu lintas jenuh dasar (smp/jam)We = lebar jalan (m)
Menurut Widodo (1997) dan Munawar (2003), nilai arus jenuh yang ada di lapangan ternyata lebih besar dari nilai tersebut sebesar 1,3 kali, sehingga rumus di atas dikoreksi menjadi:
𝑆0=78 0𝑥𝑊𝑒 Arus lalu lintas jenuh dasar tersebut, masih harus dikoreksi lagi dengan: CS, SF, G, P, RT/LT
Signalized Intersection Safety Strategies
Arus Lalu Lintas Jenuh Dasar
Menurut MKJI (1997), arus lalu lintas jenuh dasar tipe pendekat O (terlawan) dapat ditentukan dari Gambar C-3:2 (untuk pendekatan tanpa lajur belok-kanan terpisah) dan dari Gambar C-3:3 (untuk pendekat dengan lajur belok kanan terpisah) sehagai fungsi dari We, QRT dan QRTO'
Jika gerakan belok kanan lebih besar dari 250 smp/jam, fase sinyal terlindung harus dipertimbangkan, artinya rencana fase sinyal harus diganti. Cara pendekatan misalnya peninjauan kembali waktu sinyal suatu simpang
Signalized Intersection Safety Strategies
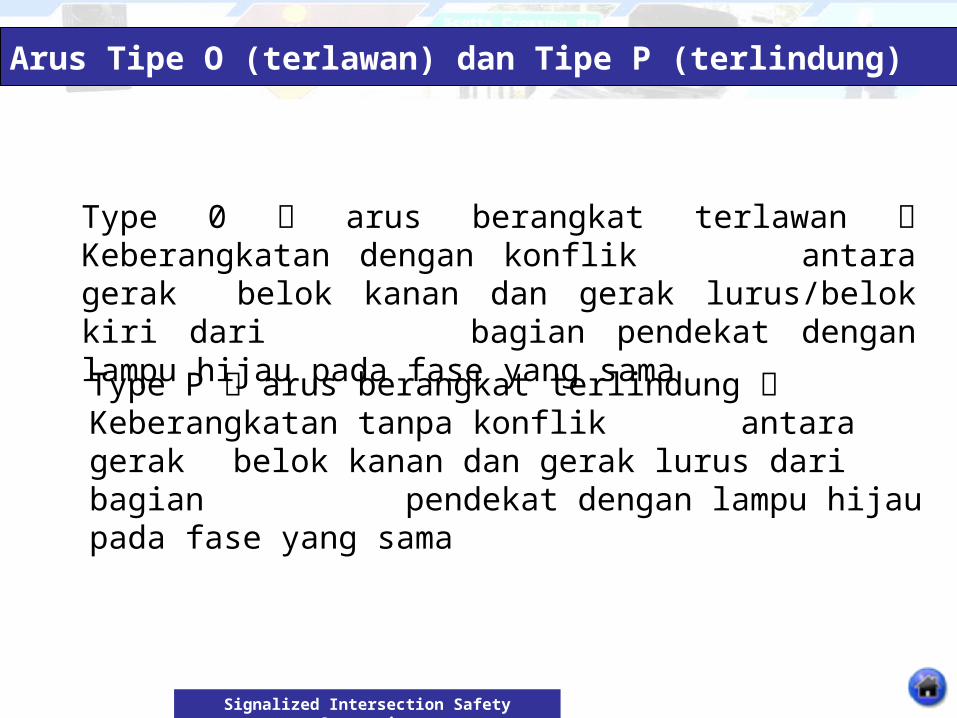
Arus Tipe O (terlawan) dan Tipe P (terlindung)
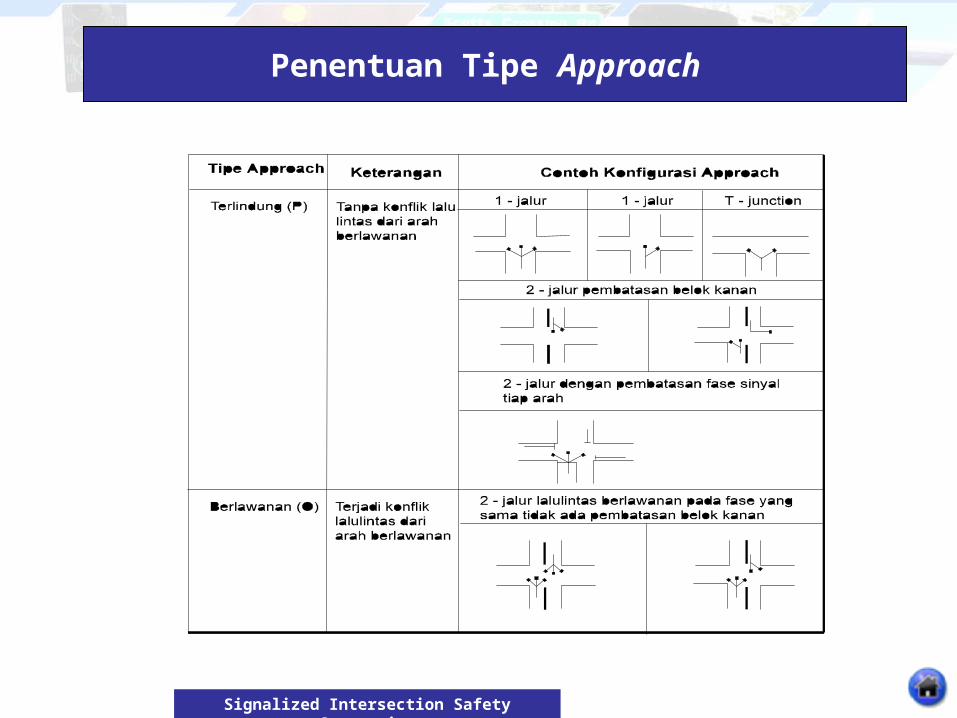
Type 0 arus berangkat terlawan Keberangkatan dengan konflik antara gerak belok kanan dan gerak lurus/belok kiri dari bagian pendekat dengan lampu hijau pada fase yang sama
Type P arus berangkat terlindung Keberangkatan tanpa konflik antara gerak belok kanan dan gerak lurus dari bagian pendekat dengan lampu hijau pada fase yang sama
Signalized Intersection Safety Strategies
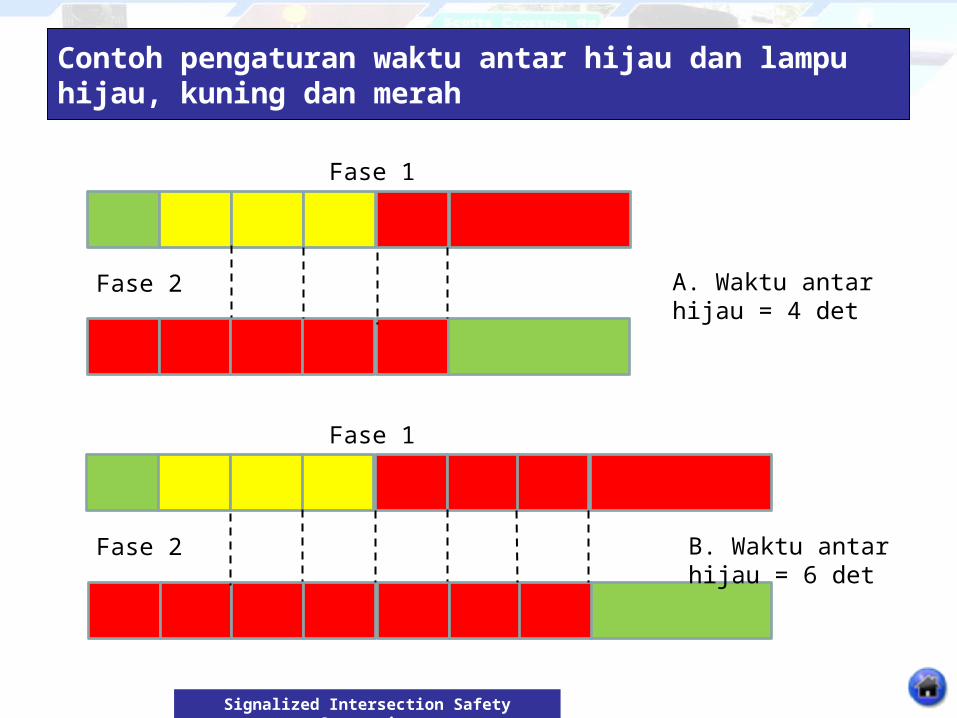
Contoh pengaturan waktu antar hijau dan lampu hijau, kuning dan merah
Fase 2
Fase 2
Fase 1
Fase 1
A. Waktu antar hijau = 4 det
B. Waktu antar hijau = 6 det
Signalized Intersection Safety Strategies
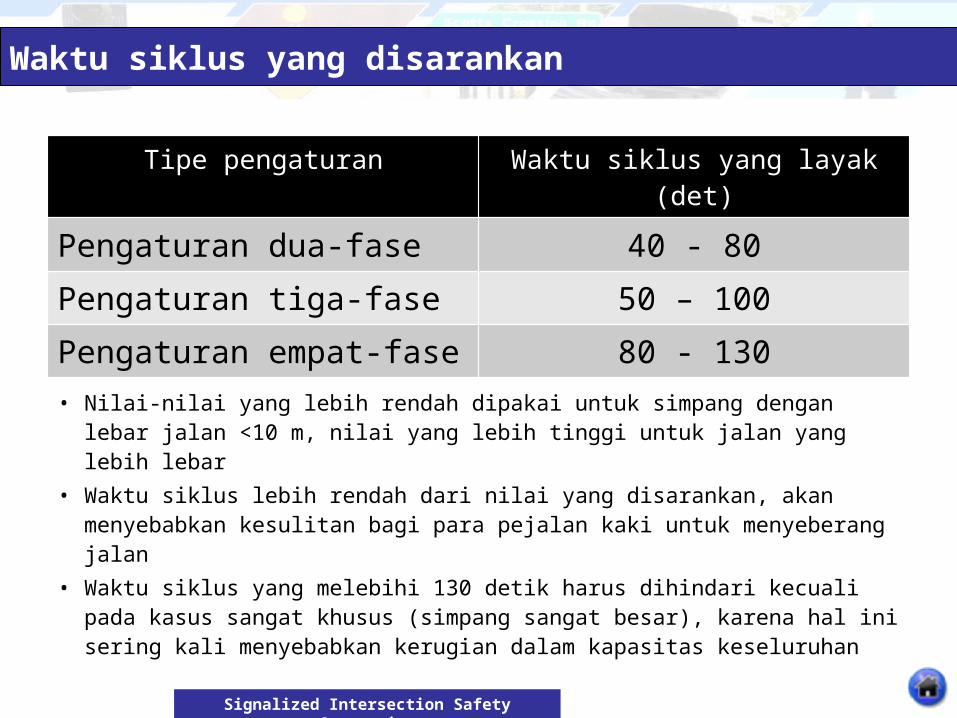
Waktu siklus yang disarankan
Tipe pengaturan Waktu siklus yang layak(det)
Pengaturan dua-fase 40 - 80Pengaturan tiga-fase 50 – 100Pengaturan empat-fase 80 - 130
• Nilai-nilai yang lebih rendah dipakai untuk simpang dengan lebar jalan <10 m, nilai yang lebih tinggi untuk jalan yang lebih lebar
• Waktu siklus lebih rendah dari nilai yang disarankan, akan menyebabkan kesulitan bagi para pejalan kaki untuk menyeberang jalan
• Waktu siklus yang melebihi 130 detik harus dihindari kecuali pada kasus sangat khusus (simpang sangat besar), karena hal ini sering kali menyebabkan kerugian dalam kapasitas keseluruhan
Signalized Intersection Safety Strategies
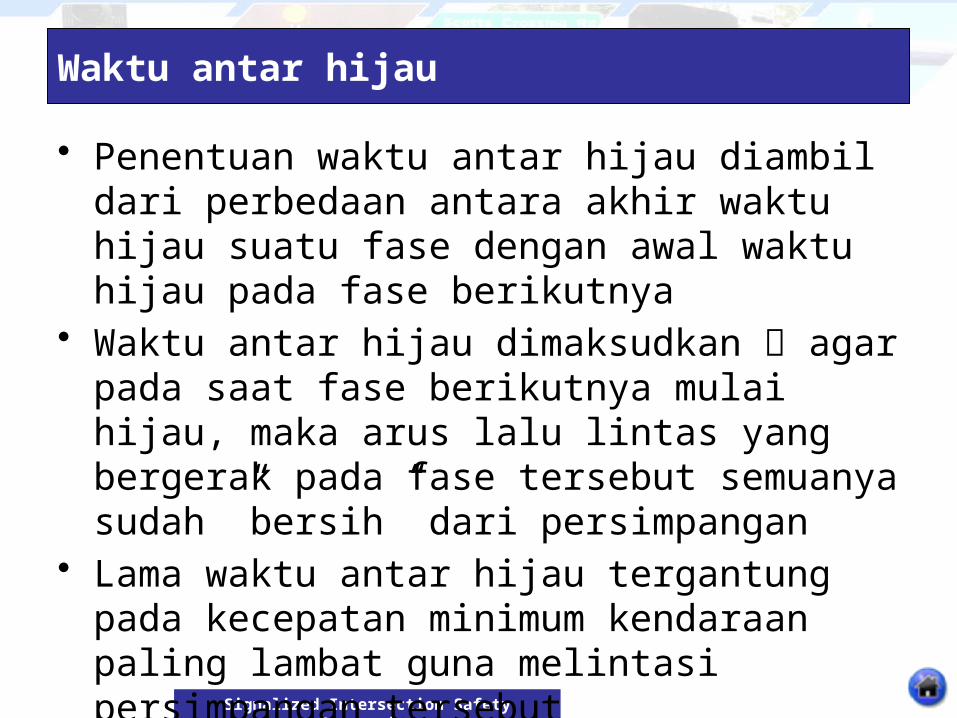
Waktu antar hijau
• Penentuan waktu antar hijau diambil dari perbedaan antara akhir waktu hijau suatu fase dengan awal waktu hijau pada fase berikutnya
• Waktu antar hijau dimaksudkan agar pada saat fase berikutnya mulai hijau, maka arus lalu lintas yang bergerak pada fase tersebut semuanya sudah ”bersih” dari persimpangan
• Lama waktu antar hijau tergantung pada kecepatan minimum kendaraan paling lambat guna melintasi persimpangan tersebut
Signalized Intersection Safety Strategies
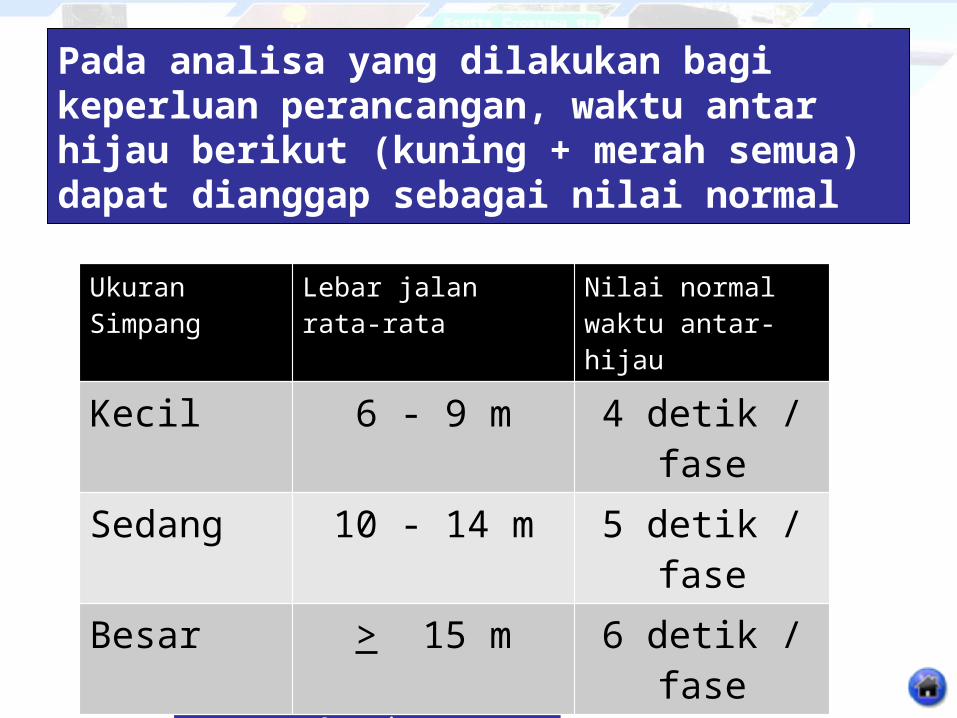
Pada analisa yang dilakukan bagi keperluan perancangan, waktu antar hijau berikut (kuning + merah semua) dapat dianggap sebagai nilai normal
Ukuran Simpang
Lebar jalan rata-rata
Nilai normalwaktu antar-hijau
Kecil 6 - 9 m 4 detik / faseSedang 10 - 14 m 5 detik / faseBesar > 15 m 6 detik / fase
Signalized Intersection Safety Strategies
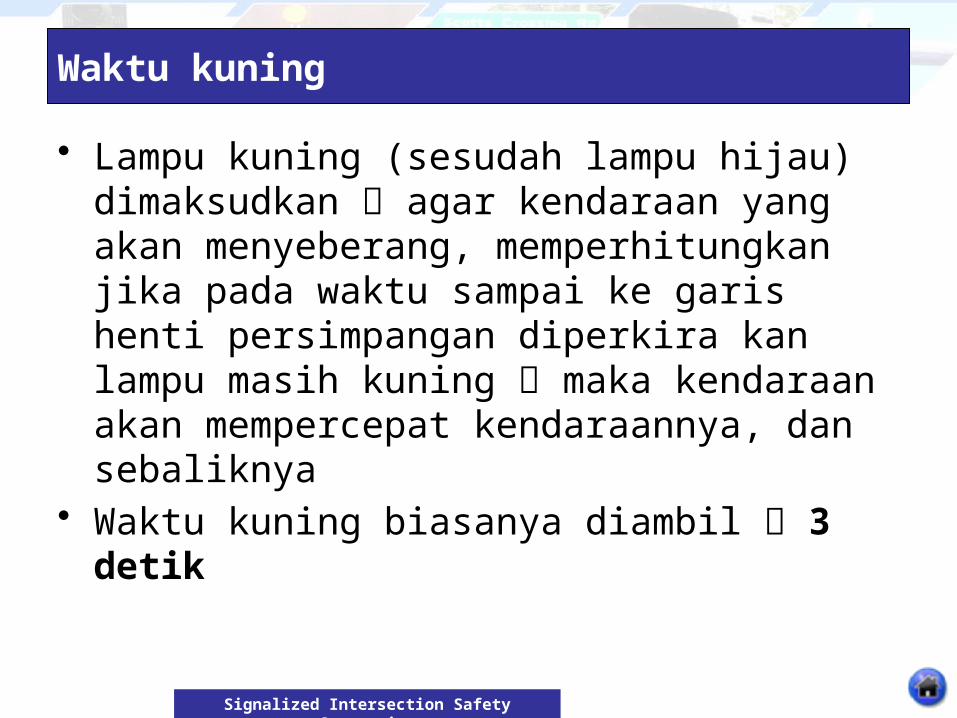
Waktu kuning
• Lampu kuning (sesudah lampu hijau) dimaksudkan agar kendaraan yang akan menyeberang, memperhitungkan jika pada waktu sampai ke garis henti persimpangan diperkira kan lampu masih kuning maka kendaraan akan mempercepat kendaraannya, dan sebaliknya
• Waktu kuning biasanya diambil 3 detik
Signalized Intersection Safety Strategies
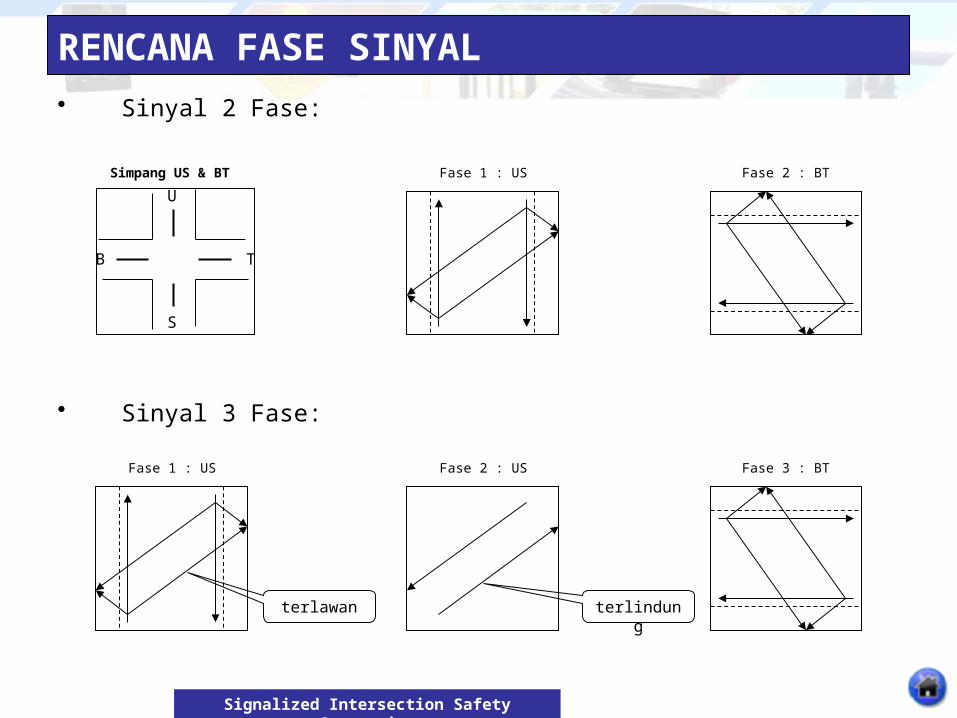
RENCANA FASE SINYAL• Sinyal 2 Fase:
• Sinyal 3 Fase:
B
U
T
S
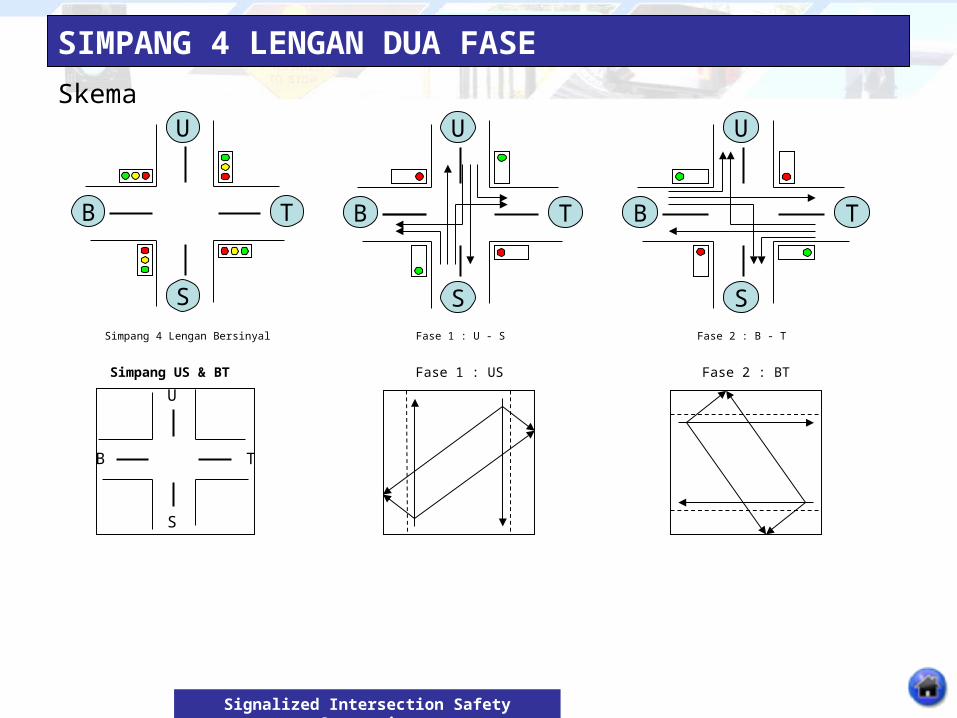
Simpang US & BT Fase 1 : US Fase 2 : BT
Fase 1 : US Fase 2 : US Fase 3 : BT
terlindungterlawan
Signalized Intersection Safety Strategies
B
U
T
S
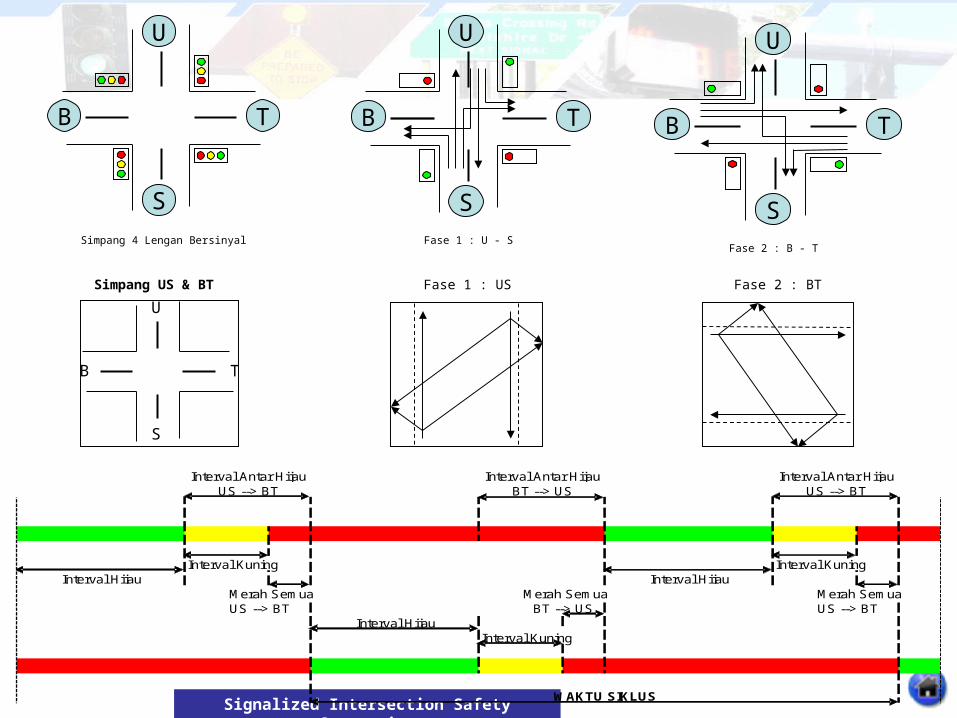
Simpang 4 Lengan Bersinyal
B
U
T
SFase 1 : U - S
B
U
T
SFase 2 : B - T
SIMPANG 4 LENGAN DUA FASE
Skema
B
U
T
S
Simpang US & BT Fase 1 : US Fase 2 : BT
Signalized Intersection Safety Strategies
Interval Kuning Interval Kuning
Merah Semua Merah Semua Merah SemuaUS --> BT US --> BT
Interval Kuning
Interval Antar HijauUS --> BT
WAKTU SIKLUS
Interval HijauBT --> US
Interval Hijau Interval Hijau
BT --> USUS --> BTInterval Antar Hijau Interval Antar Hijau
B
U
T
S
Simpang US & BT Fase 1 : US Fase 2 : BT
B
U
T
S
Simpang 4 Lengan Bersinyal
B
U
T
SFase 1 : U - S
B
U
T
SFase 2 : B - T
Signalized Intersection Safety Strategies
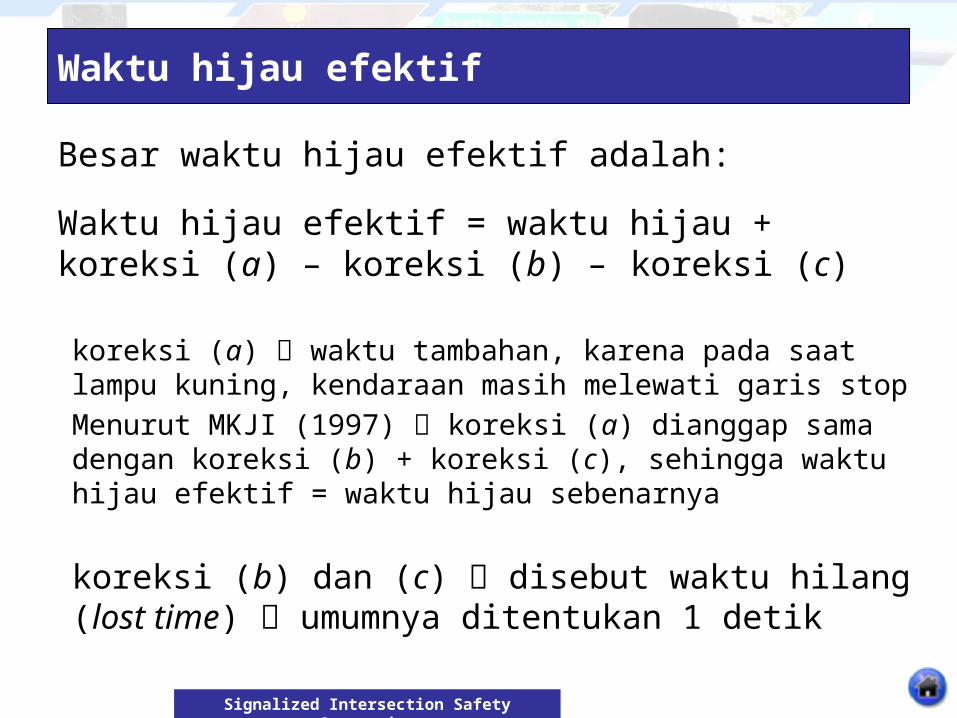
Waktu hijau efektif, dihitung berdasarkan:
• Pada waktu lampu kuning (sesudah lampu hijau), maka arus lalu lintas masih akan terus menyeberang jalan
• Walaupun demikian, pada saat lampu kuning, arus lalu lintas yang lewat tidak sebanyak pada saat lampu masih hijau sebagian pengemudi ada yang ragu-ragu, akan terus atau berhenti
• Pada saat awal lampu hijau, pengemudi masih perlu waktu untuk bereaksi untuk mulai menyeberang jalan
Signalized Intersection Safety Strategies
Waktu hijau efektif
Besar waktu hijau efektif adalah:
Waktu hijau efektif = waktu hijau + koreksi (a) – koreksi (b) – koreksi (c)
koreksi (a) waktu tambahan, karena pada saat lampu kuning, kendaraan masih melewati garis stopMenurut MKJI (1997) koreksi (a) dianggap sama dengan koreksi (b) + koreksi (c), sehingga waktu hijau efektif = waktu hijau sebenarnya
koreksi (b) dan (c) disebut waktu hilang (lost time) umumnya ditentukan 1 detik
Signalized Intersection Safety Strategies
Penentuan Waktu Sinyal
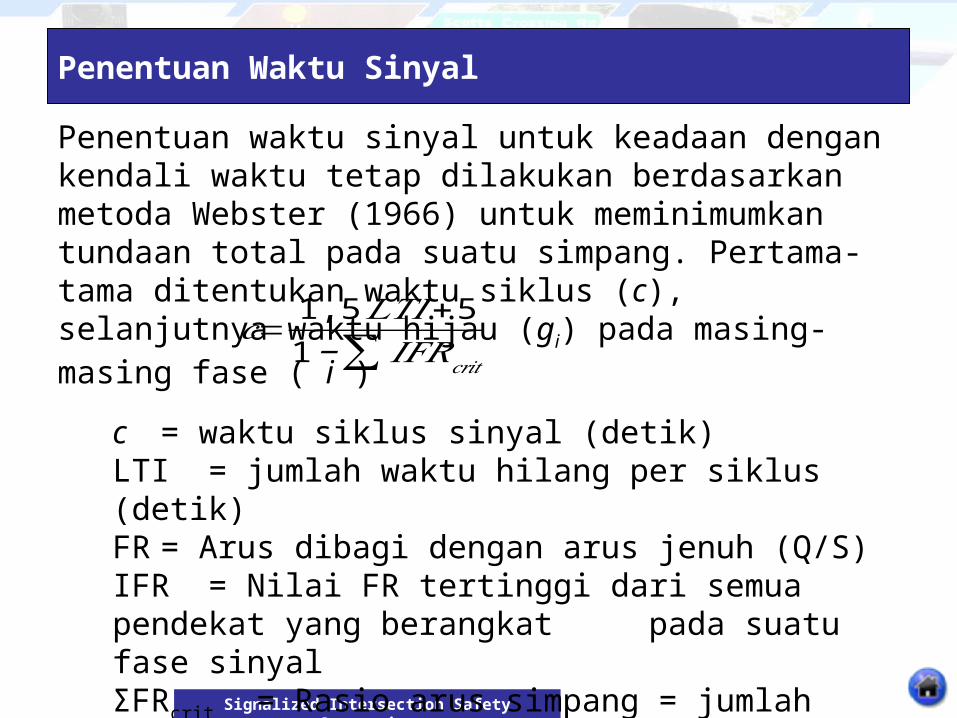
Penentuan waktu sinyal untuk keadaan dengan kendali waktu tetap dilakukan berdasarkan metoda Webster (1966) untuk meminimumkan tundaan total pada suatu simpang. Pertama-tama ditentukan waktu siklus (c), selanjutnya waktu hijau (gi) pada masing-masing fase ( i )
c = waktu siklus sinyal (detik)LTI = jumlah waktu hilang per siklus (detik)FR = Arus dibagi dengan arus jenuh (Q/S)IFR = Nilai FR tertinggi dari semua pendekat yang berangkat
pada suatu fase sinyalΣFRcrit = Rasio arus simpang = jumlah FRcrit dari semua fase
pada siklus tersebut
𝑐=1,5𝐿𝑇𝐼+5
1 −∑ 𝐼𝐹𝑅𝑐𝑟𝑖𝑡
Signalized Intersection Safety Strategies
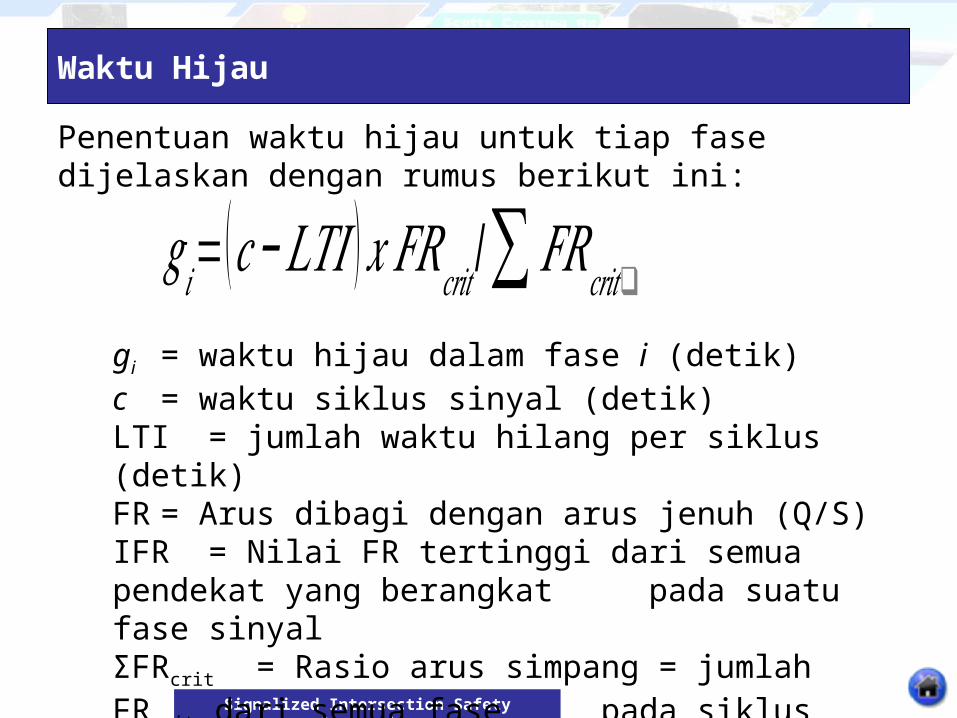
Waktu Hijau
Penentuan waktu hijau untuk tiap fase dijelaskan dengan rumus berikut ini:
𝑔𝑖= (𝑐−𝐿𝑇𝐼 ) 𝑥 𝐹𝑅𝑐𝑟𝑖𝑡 /∑ 𝐹𝑅𝑐𝑟𝑖𝑡❑gi = waktu hijau dalam fase i (detik)c = waktu siklus sinyal (detik) LTI = jumlah waktu hilang per siklus (detik)FR = Arus dibagi dengan arus jenuh (Q/S)IFR = Nilai FR tertinggi dari semua pendekat yang berangkat
pada suatu fase sinyalΣFRcrit = Rasio arus simpang = jumlah FRcrit dari semua fase
pada siklus tersebut
Signalized Intersection Safety Strategies
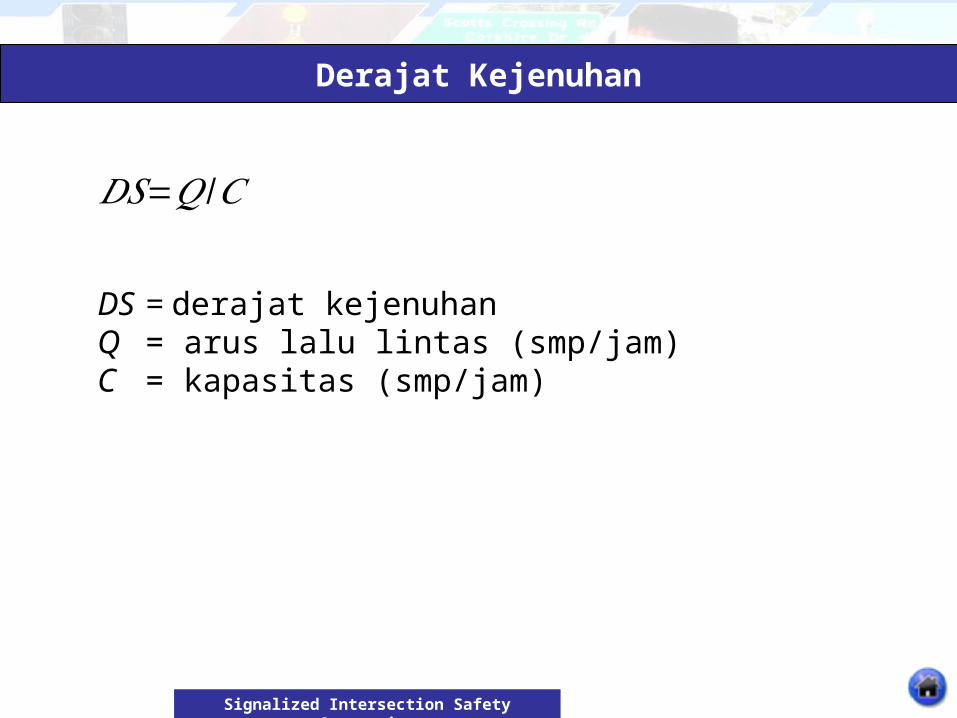
Derajat Kejenuhan
𝐷𝑆=𝑄/𝐶
DS = derajat kejenuhanQ = arus lalu lintas (smp/jam)C = kapasitas (smp/jam)
Signalized Intersection Safety Strategies
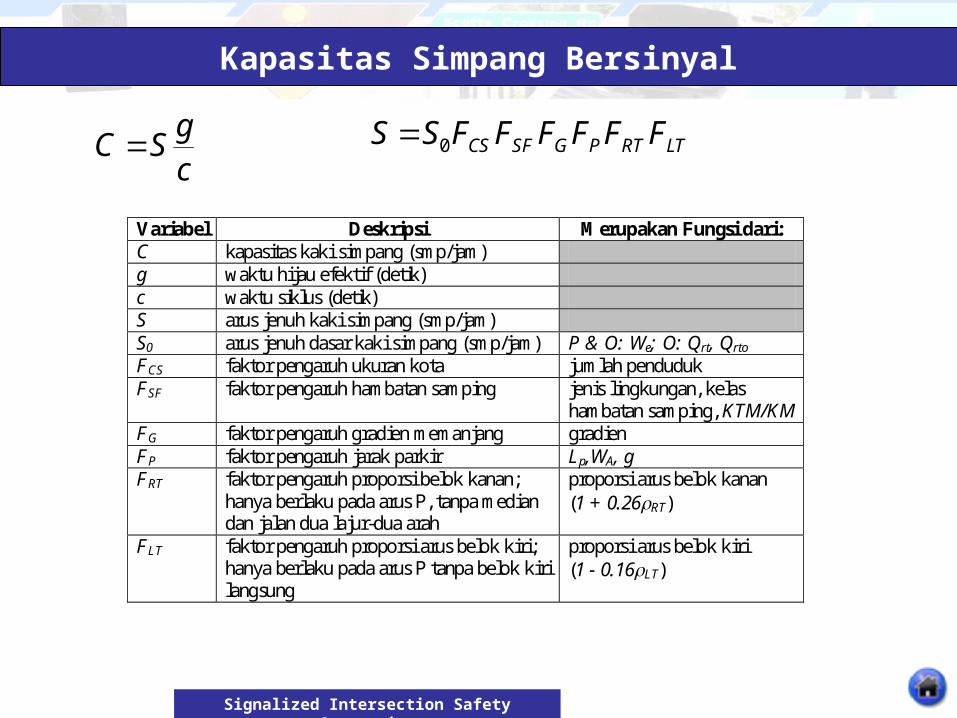
KAPASITAS SIMPANG BERSINYAL
Signalized Intersection Safety Strategies
Kapasitas Simpang Bersinyal
cg
SC LTRTPGSFCS FFFFFFSS 0
Variabel Deskripsi Merupakan Fungsi dari: C kapasitas kaki simpang (smp/jam) g waktu hijau efektif (detik) c waktu siklus (detik) S arus jenuh kaki simpang (smp/jam) S0 arus jenuh dasar kaki simpang (smp/jam) P & O: We; O: Qrt, Qrto
FCS faktor pengaruh ukuran kota jumlah penduduk FSF faktor pengaruh hambatan samping jenis lingkungan, kelas
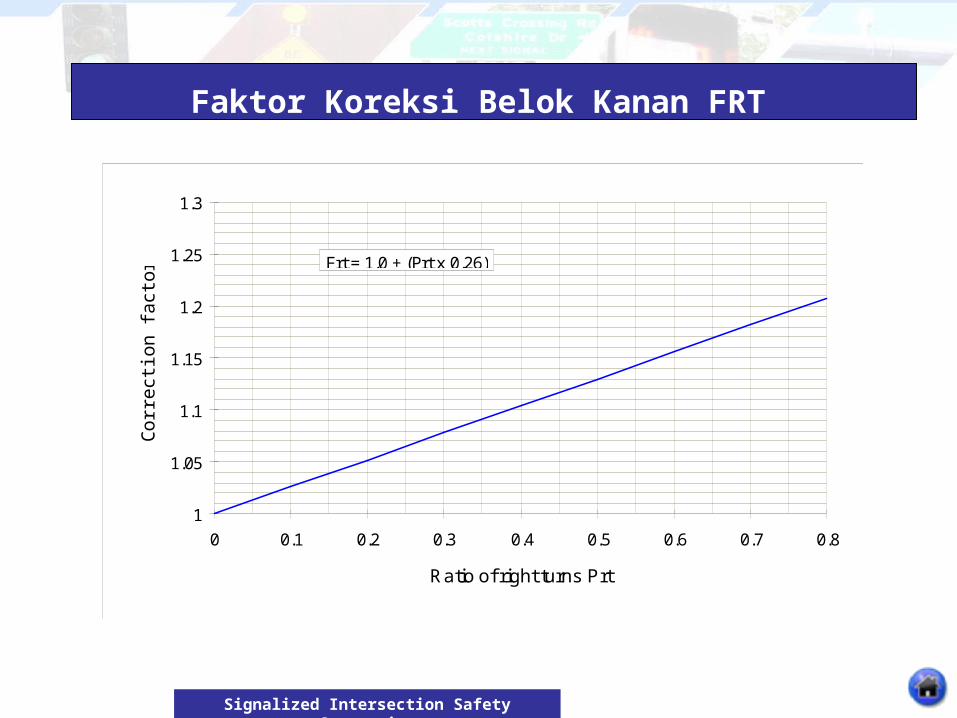
hambatan samping, KTM/KM FG faktor pengaruh gradien memanjang gradien FP faktor pengaruh jarak parkir Lp,WA, g FRT faktor pengaruh proporsi belok kanan;
hanya berlaku pada arus P, tanpa median dan jalan dua lajur-dua arah
proporsi arus belok kanan (1 + 0.26RT)
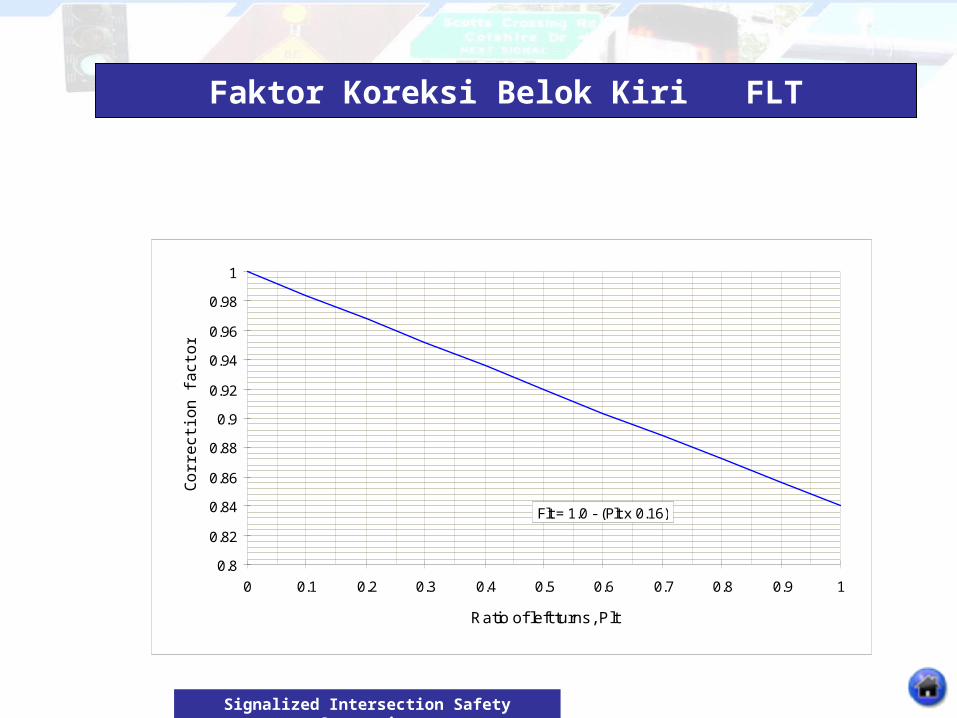
FLT faktor pengaruh proporsi arus belok kiri; hanya berlaku pada arus P tanpa belok kiri langsung
proporsi arus belok kiri (1 - 0.16LT)
Signalized Intersection Safety Strategies
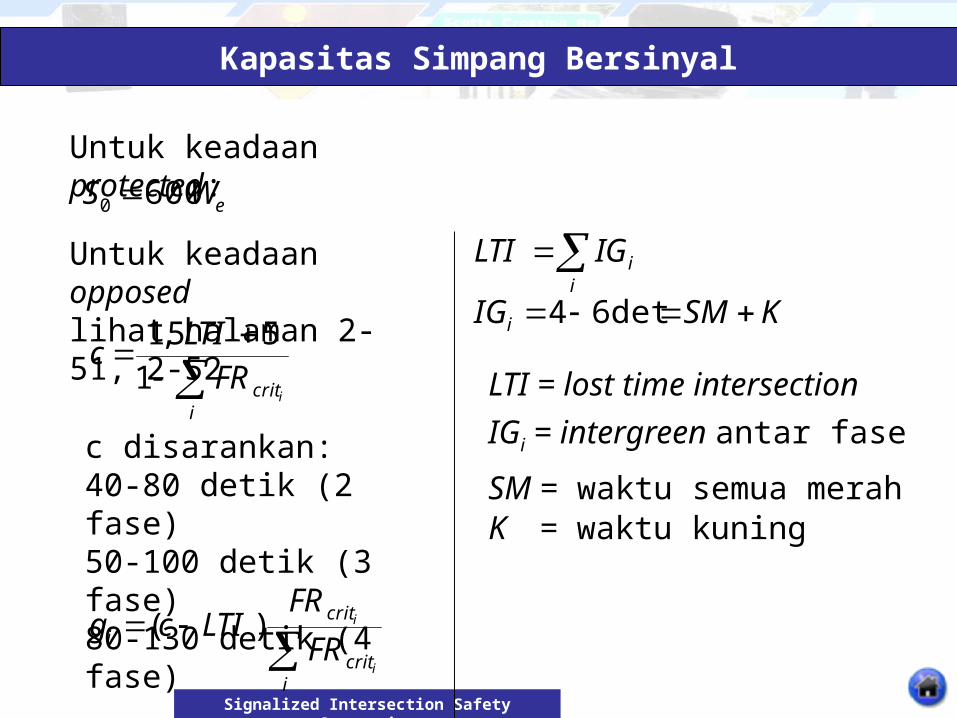
Kapasitas Simpang Bersinyal
Untuk keadaan protected:
eWS 6000
Untuk keadaan opposedlihat halaman 2-51, 2-52
icriti
FRLTI
c1
55,1
c disarankan:40-80 detik (2 fase) 50-100 detik (3 fase) 80-130 detik (4 fase)
icrit
criti
i
i
FR
FRLTIcg )(
i
iIGLTI
KSMIGi det64
LTI = lost time intersection
IGi = intergreen antar fase
SM = waktu semua merahK = waktu kuning
Signalized Intersection Safety Strategies
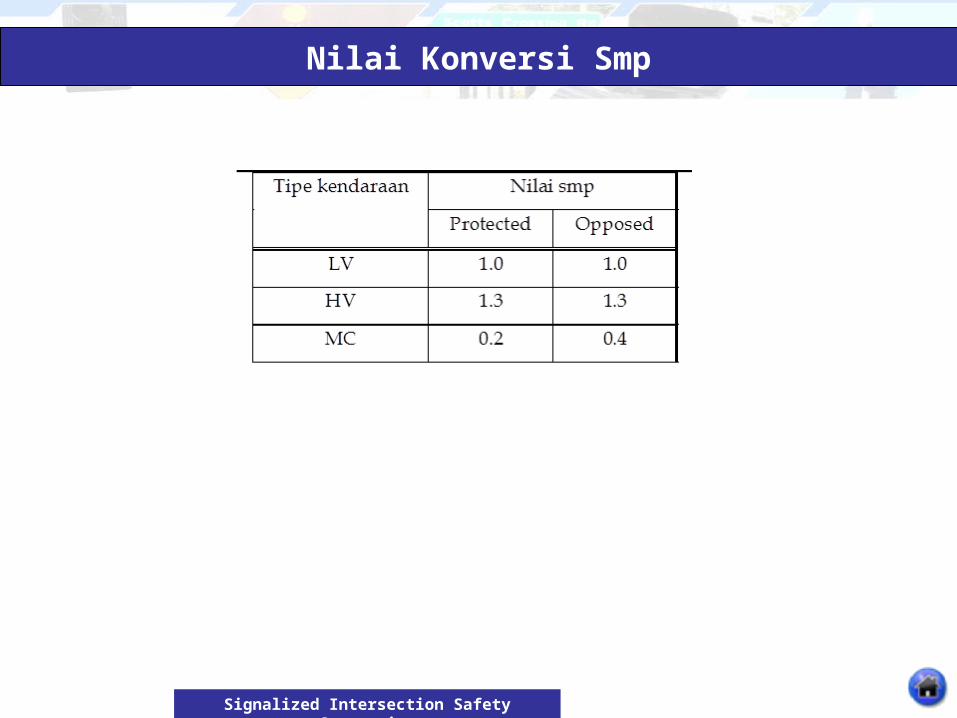
Nilai Konversi Smp
Signalized Intersection Safety Strategies
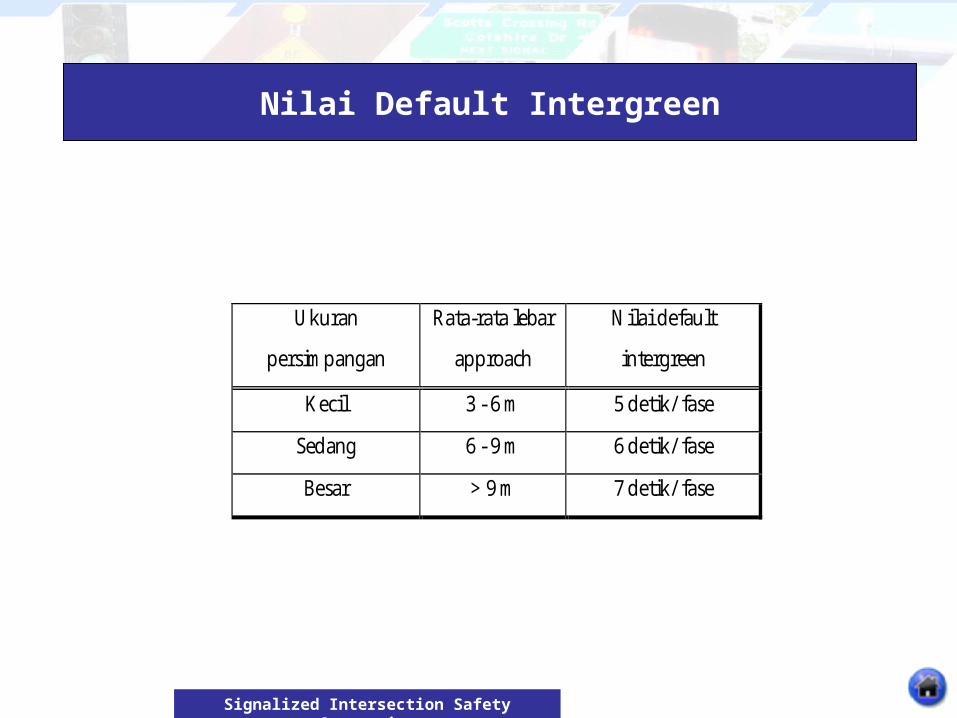
Nilai Default Intergreen
Ukuran
persimpangan
Rata-rata lebar
approach
Nilai default
intergreen
Kecil 3 - 6 m 5 detik/ fase
Sedang 6 - 9 m 6 detik/ fase
Besar > 9 m 7 detik/ fase
Signalized Intersection Safety Strategies
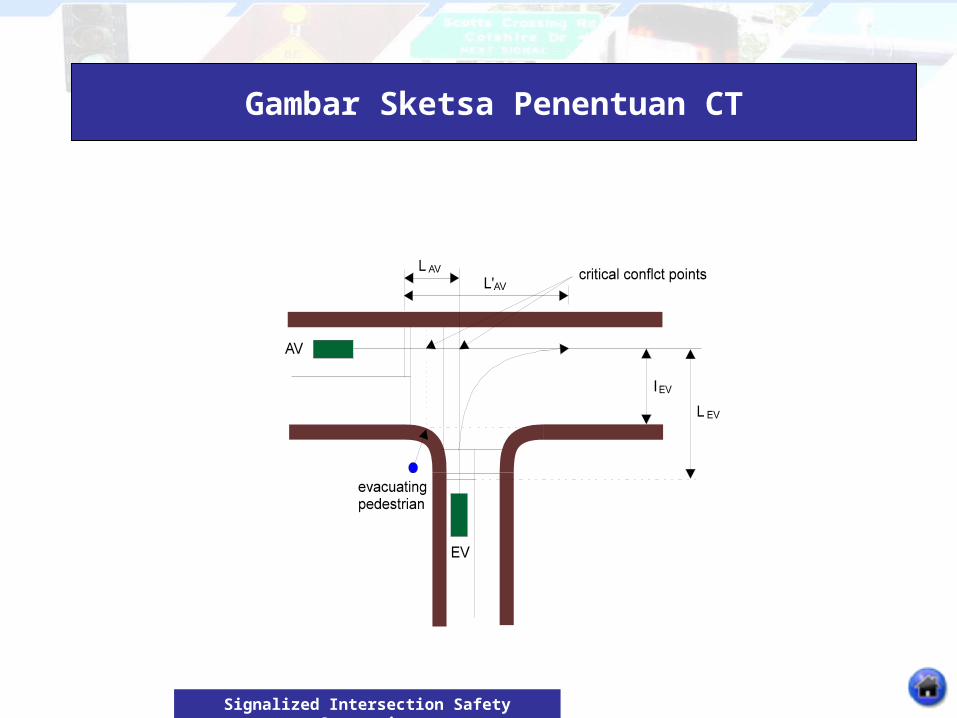
Gambar Sketsa Penentuan CT
Signalized Intersection Safety Strategies
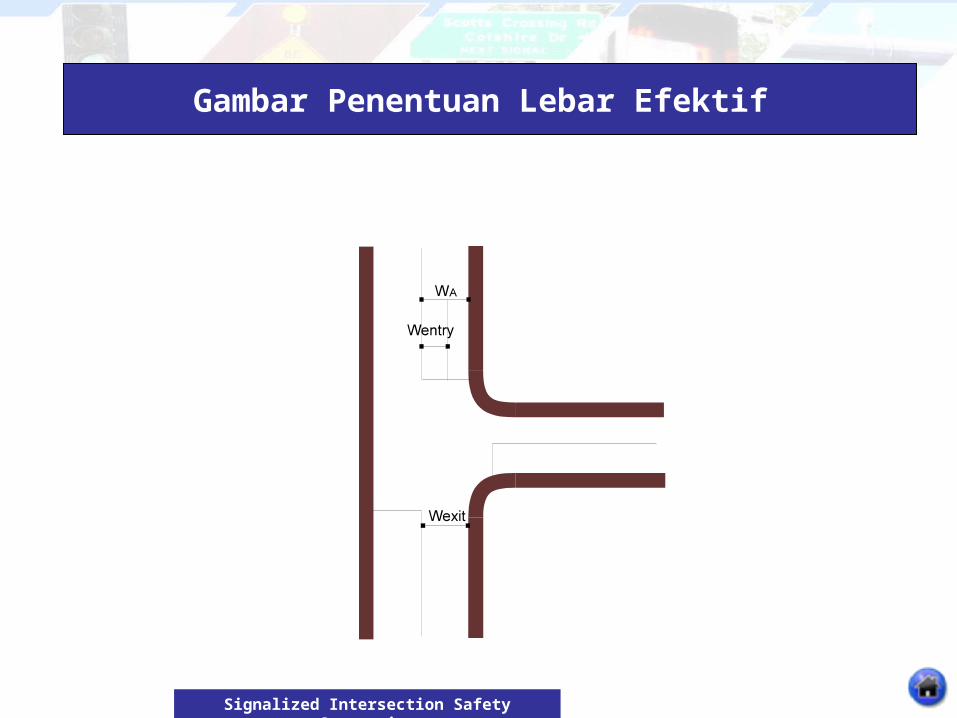
Gambar Penentuan Lebar Efektif
Signalized Intersection Safety Strategies
Arus Jenuh Dasar Untuk Tipe Approach P
0
1000
2000
3000
4000
5000
6000
7000
8000
9000
10000
0 1 2 3 4 5 6 7 8 9 10 11 12 13 14 15
Efective width (m)
Ba
se s
atu
ratio
n fl
ow
So
(p
cu/h
r)
So = 600 x We
Signalized Intersection Safety Strategies
Penentuan Tipe Approach
Signalized Intersection Safety Strategies
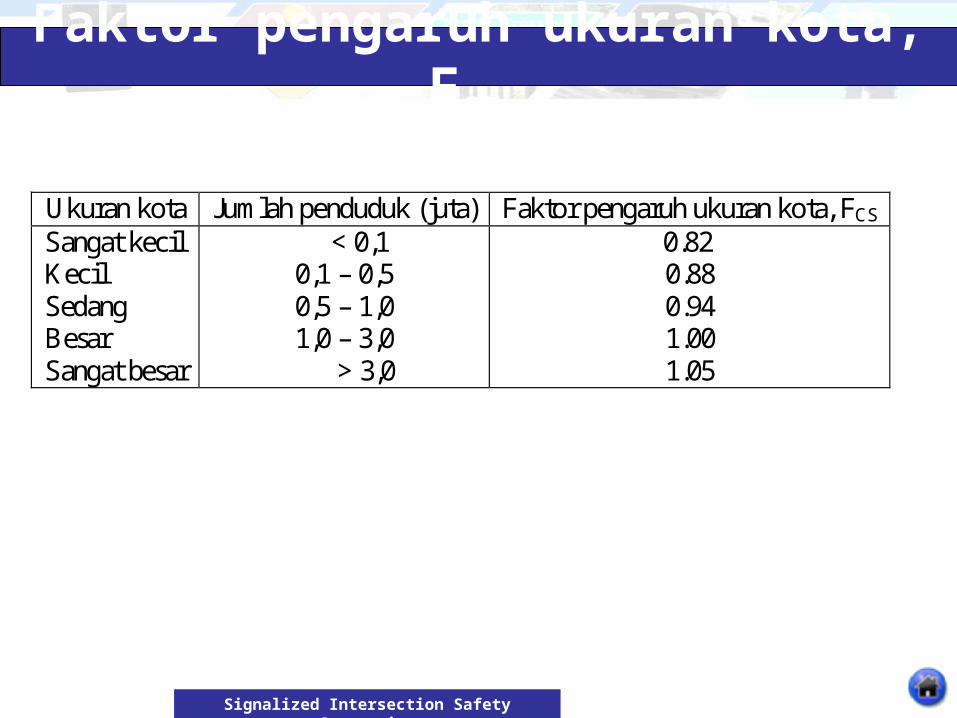
Faktor pengaruh ukuran kota, FCS
Ukuran kota Jumlah penduduk (juta) Faktor pengaruh ukuran kota, FCS Sangat kecil Kecil Sedang Besar Sangat besar
< 0,1 0,1 – 0,5 0,5 – 1,0 1,0 – 3,0 > 3,0
0.82 0.88 0.94 1.00 1.05
Signalized Intersection Safety Strategies
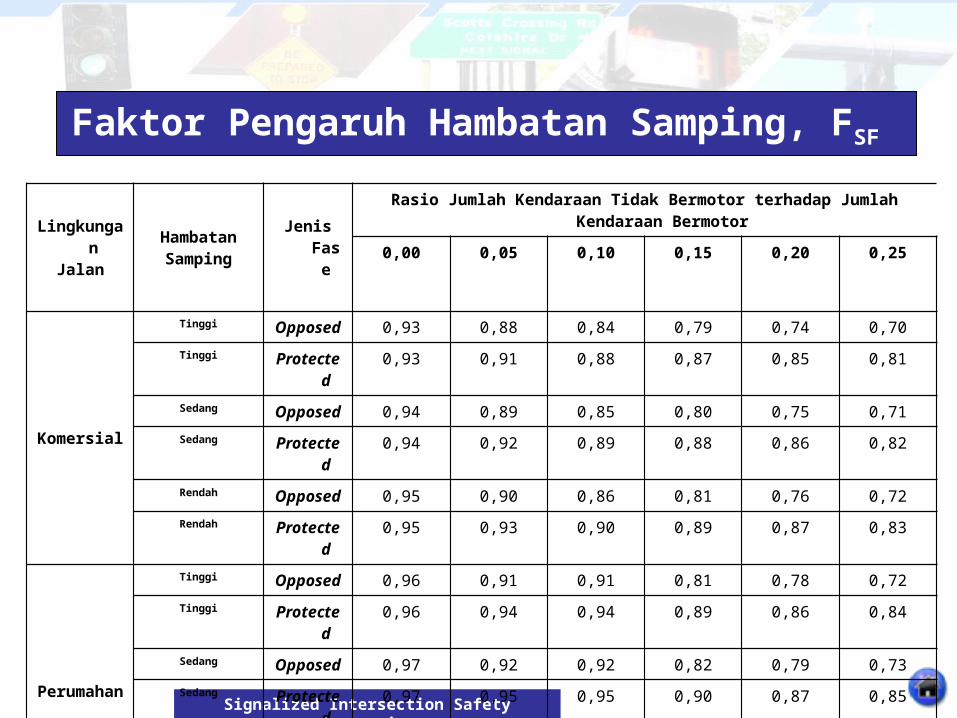
Faktor Pengaruh Hambatan Samping, FSF
Lingkungan Jalan
HambatanSamping
Jenis Fase
Rasio Jumlah Kendaraan Tidak Bermotor terhadap Jumlah Kendaraan Bermotor
0,00 0,05 0,10 0,15 0,20 0,25
Komersial
Tinggi Opposed 0,93 0,88 0,84 0,79 0,74 0,70
Tinggi Protected 0,93 0,91 0,88 0,87 0,85 0,81
Sedang Opposed 0,94 0,89 0,85 0,80 0,75 0,71
Sedang Protected 0,94 0,92 0,89 0,88 0,86 0,82
Rendah Opposed 0,95 0,90 0,86 0,81 0,76 0,72
Rendah Protected 0,95 0,93 0,90 0,89 0,87 0,83
Perumahan
Tinggi Opposed 0,96 0,91 0,91 0,81 0,78 0,72
Tinggi Protected 0,96 0,94 0,94 0,89 0,86 0,84
Sedang Opposed 0,97 0,92 0,92 0,82 0,79 0,73
Sedang Protected 0,97 0,95 0,95 0,90 0,87 0,85
Rendah Opposed 0,98 0,93 0,93 0,83 0,80 0,74
Rendah Protected 0,98 0,96 0,96 0,91 0,88 0,86
AksesTerbatas
Tinggi/ Sedang/ Rendah Opposed 1,00 0,95 0,90 0,85 0,80 0,75
Tinggi/ Sedang/ Rendah Protected 1,00 0,98 0,95 0,93 0,90 0,88
Signalized Intersection Safety Strategies
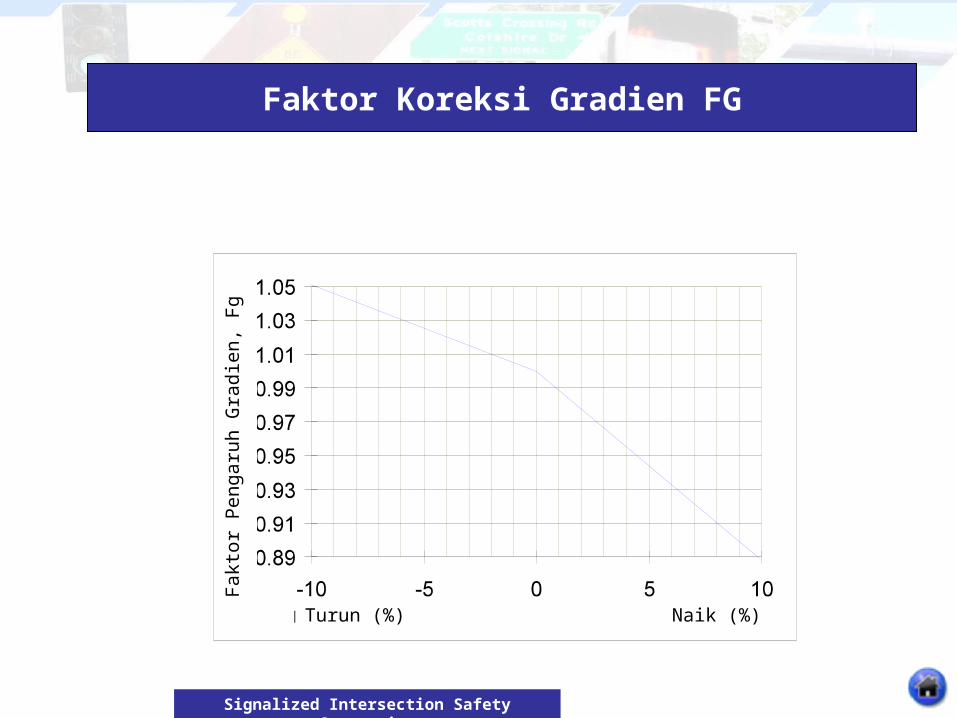
Faktor Koreksi Gradien FG
Naik (%)Turun (%)Fak
tor
Pen
garu
h G
radi
en, F
g
Naik (%)
Signalized Intersection Safety Strategies
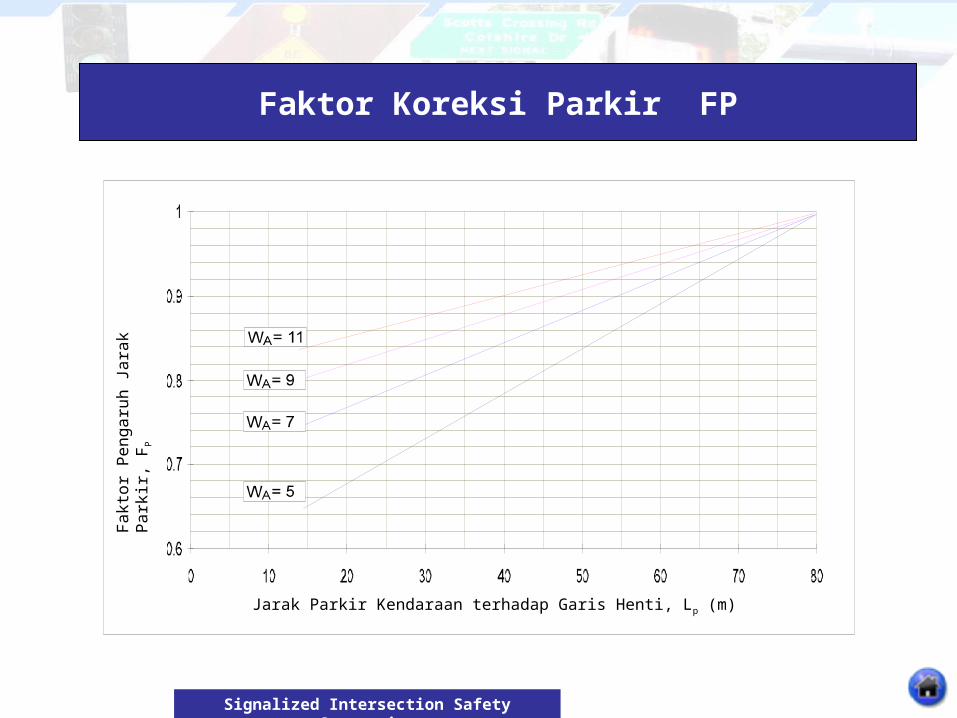
Faktor Koreksi Parkir FP
Jarak Parkir Kendaraan terhadap Garis Henti, Lp (m)
Fak
tor
Pen
garu
h Ja
rak
Par
kir,
FP
Signalized Intersection Safety Strategies
Faktor Koreksi Belok Kanan FRT
1
1.05
1.1
1.15
1.2
1.25
1.3
0 0.1 0.2 0.3 0.4 0.5 0.6 0.7 0.8
Ratio of right turns Prt
Co
rre
ctio
n fa
cto
r, F
rt
Frt = 1.0 + (Prt x 0.26)
Signalized Intersection Safety Strategies
Faktor Koreksi Belok Kiri FLT
0.8
0.82
0.84
0.86
0.88
0.9
0.92
0.94
0.96
0.98
1
0 0.1 0.2 0.3 0.4 0.5 0.6 0.7 0.8 0.9 1
Ratio of left turns, Plt
Co
rre
ctio
n fa
cto
r, F
lt
Flt = 1.0 - (Plt x 0.16)
Signalized Intersection Safety Strategies
Penentuan Waktu Siklus
0
30
60
90
120
150
180
210
240
270
300
330
360
0 0.1 0.2 0.3 0.4 0.5 0.6 0.7 0.8 0.9 1
Intersection flow ratio IFR
Cyc
le ti
me
(se
con
d) LT = 20
LT = 15
LT = 10
LT = 5
Signalized Intersection Safety Strategies
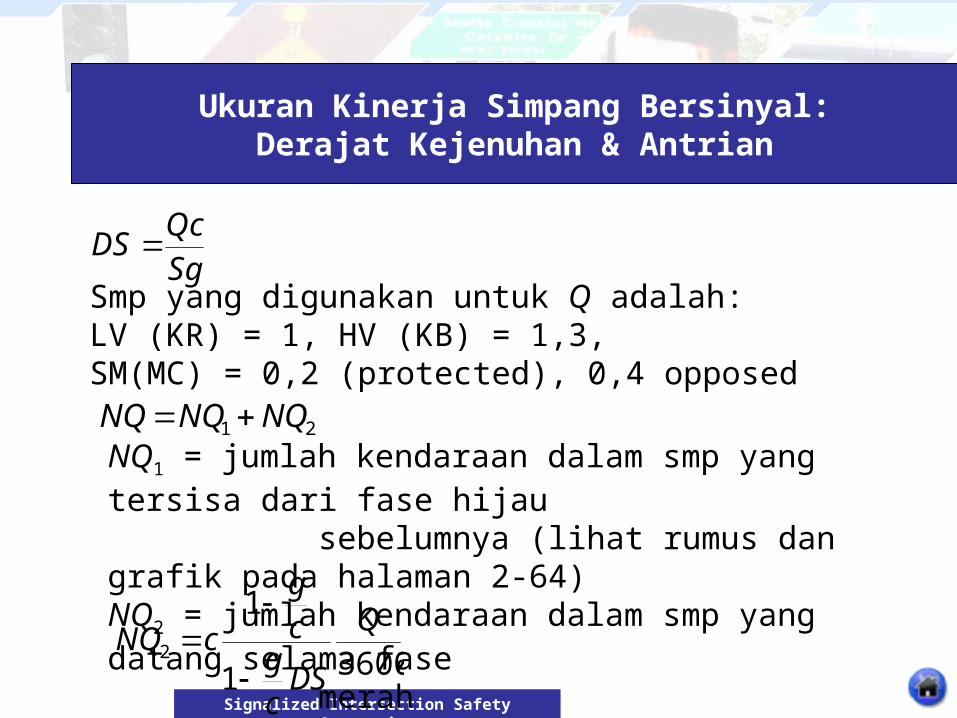
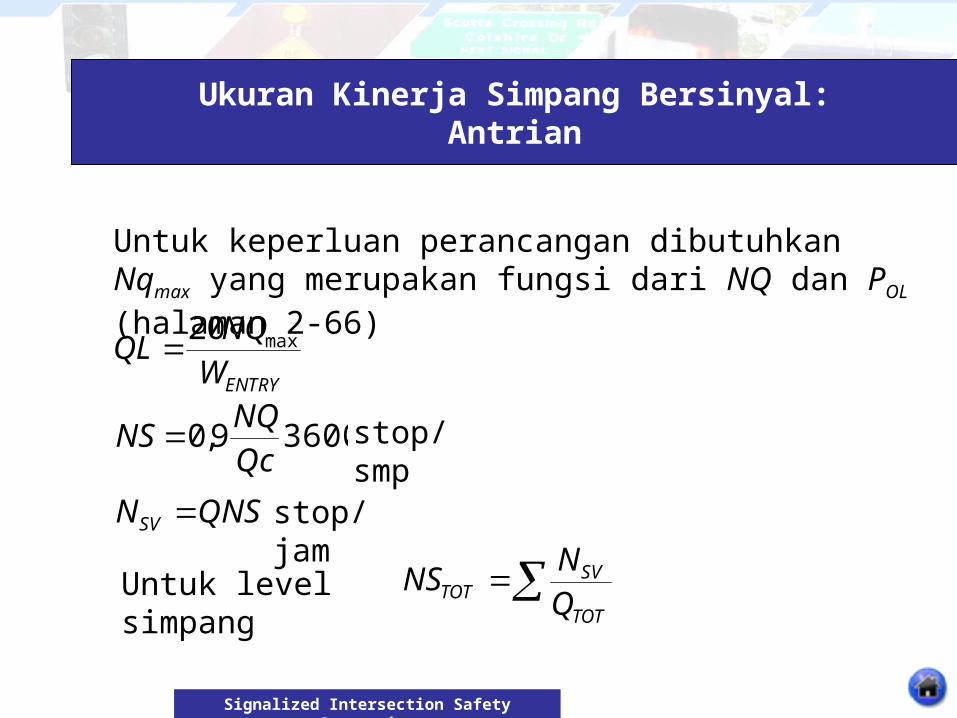
Ukuran Kinerja Simpang Bersinyal:Derajat Kejenuhan & Antrian
SgQc
DS
Smp yang digunakan untuk Q adalah:LV (KR) = 1, HV (KB) = 1,3, SM(MC) = 0,2 (protected), 0,4 opposed
21 NQNQNQ NQ1 = jumlah kendaraan dalam smp yang tersisa dari fase hijau sebelumnya (lihat rumus dan grafik pada halaman 2-64)NQ2 = jumlah kendaraan dalam smp yang datang selama fase merah
36001
1
2
Q
DScg
cg
cNQ
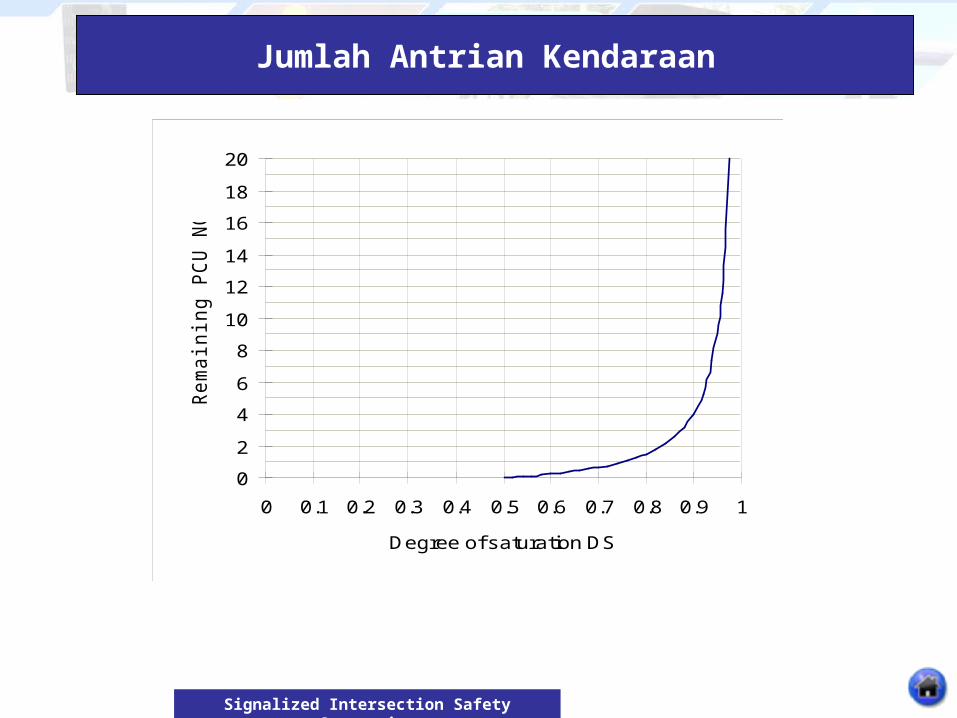
Signalized Intersection Safety Strategies
Jumlah Antrian Kendaraan
0
2
4
6
8
10
12
14
16
18
20
0 0.1 0.2 0.3 0.4 0.5 0.6 0.7 0.8 0.9 1
Degree of saturation DS
Re
ma
inin
g P
CU
NQ
1
Signalized Intersection Safety Strategies
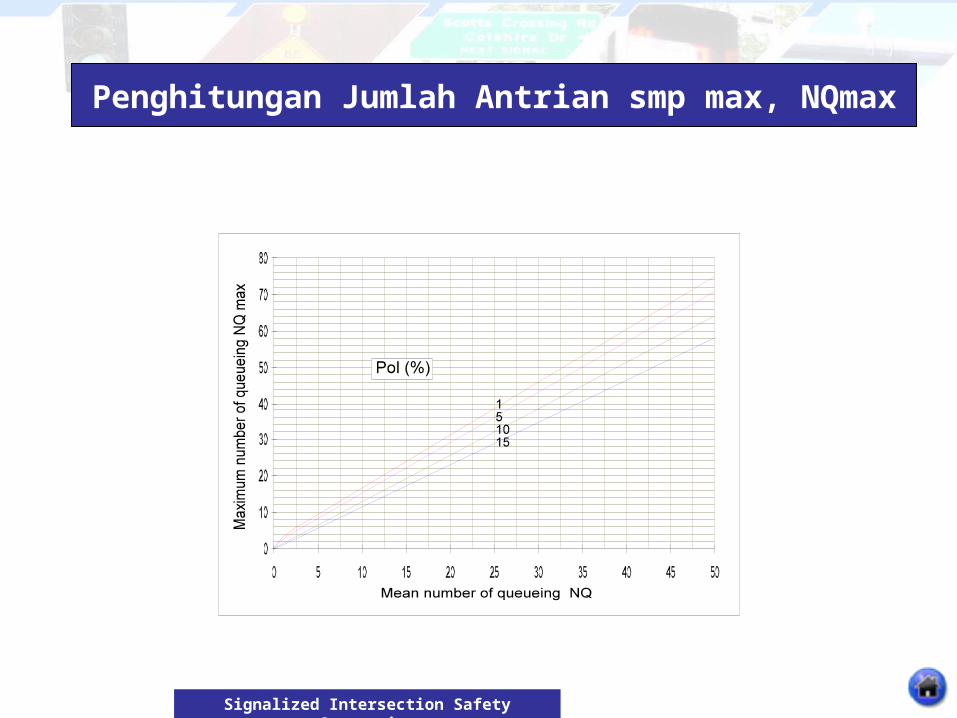
Penghitungan Jumlah Antrian smp max, NQmax
Signalized Intersection Safety Strategies
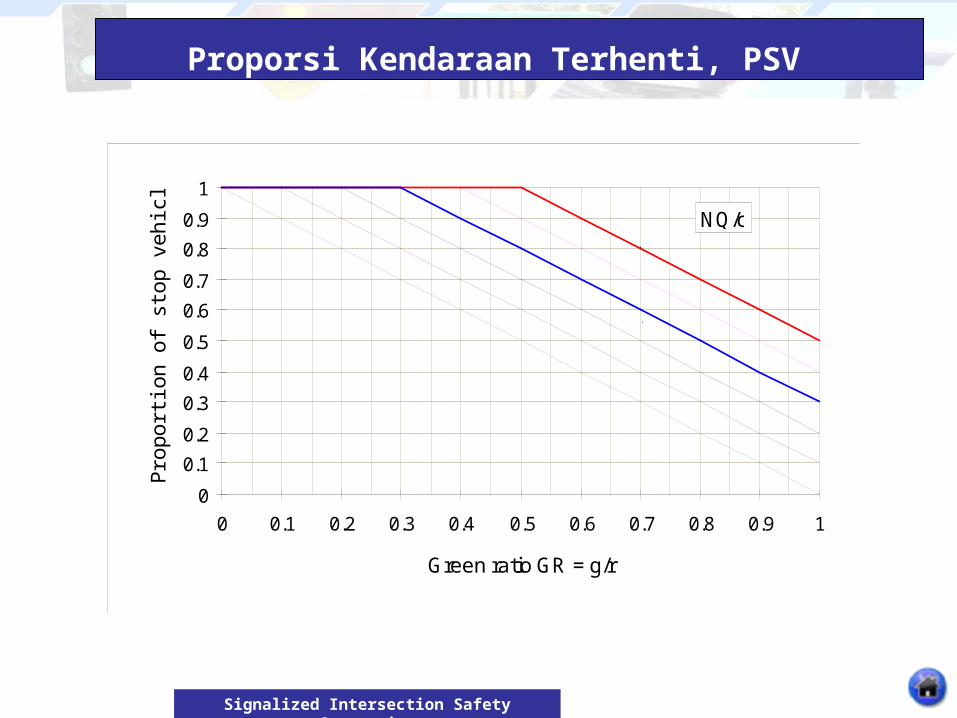
Proporsi Kendaraan Terhenti, PSV
0
0.1
0.2
0.3
0.4
0.5
0.6
0.7
0.8
0.9
1
0 0.1 0.2 0.3 0.4 0.5 0.6 0.7 0.8 0.9 1
Green ratio GR = g/r
Pro
po
rtio
n o
f sto
p v
eh
icle
Psv NQ/c0.5
0.4
0.3
0.2
0.1
0
Signalized Intersection Safety Strategies
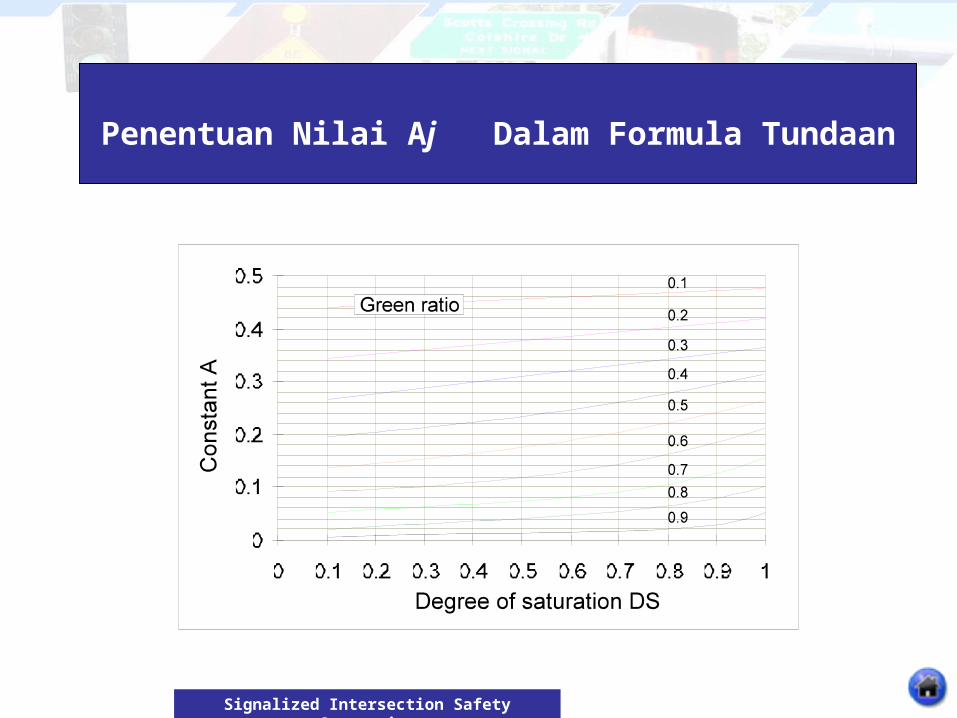
Penentuan Nilai Aj Dalam Formula Tundaan
Signalized Intersection Safety Strategies
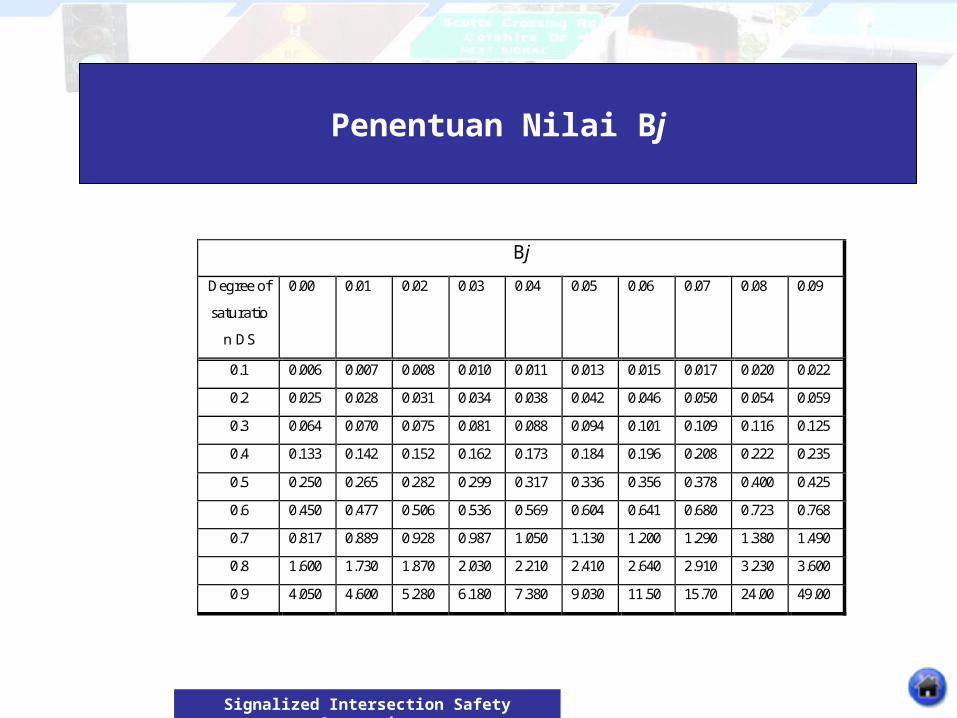
Penentuan Nilai Bj
Bj
Degree of
saturatio
n DS
0.00 0.01 0.02 0.03 0.04 0.05 0.06 0.07 0.08 0.09
0.1 0.006 0.007 0.008 0.010 0.011 0.013 0.015 0.017 0.020 0.022
0.2 0.025 0.028 0.031 0.034 0.038 0.042 0.046 0.050 0.054 0.059
0.3 0.064 0.070 0.075 0.081 0.088 0.094 0.101 0.109 0.116 0.125
0.4 0.133 0.142 0.152 0.162 0.173 0.184 0.196 0.208 0.222 0.235
0.5 0.250 0.265 0.282 0.299 0.317 0.336 0.356 0.378 0.400 0.425
0.6 0.450 0.477 0.506 0.536 0.569 0.604 0.641 0.680 0.723 0.768
0.7 0.817 0.889 0.928 0.987 1.050 1.130 1.200 1.290 1.380 1.490
0.8 1.600 1.730 1.870 2.030 2.210 2.410 2.640 2.910 3.230 3.600
0.9 4.050 4.600 5.280 6.180 7.380 9.030 11.50 15.70 24.00 49.00
Signalized Intersection Safety Strategies
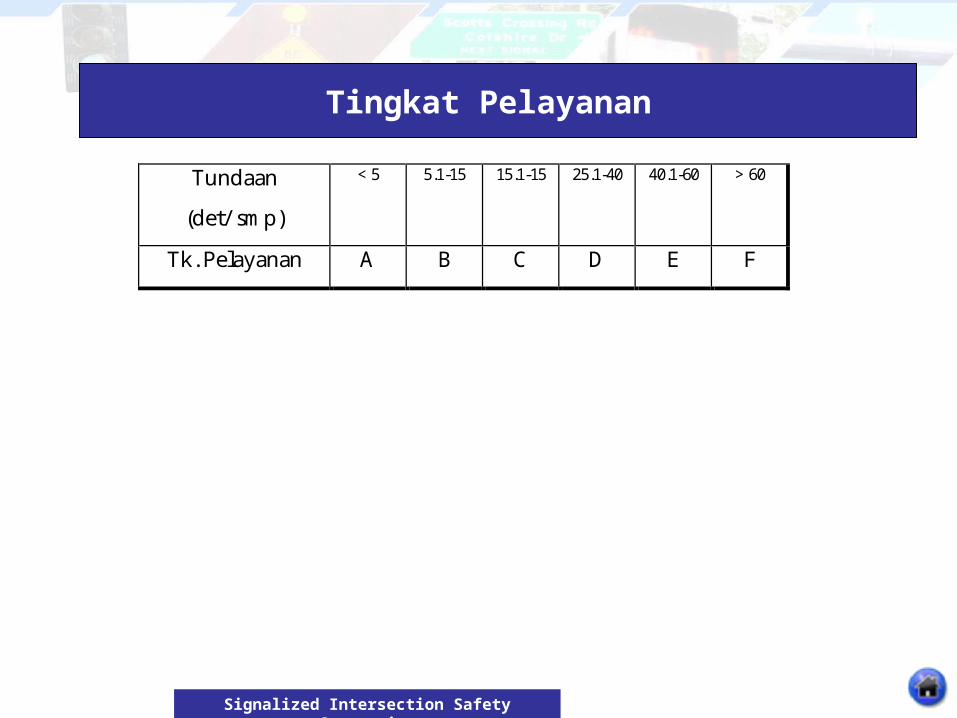
Tingkat Pelayanan
Tundaan
(det/ smp)
< 5 5.1-15 15.1-15 25.1-40 40.1-60 > 60
Tk. Pelayanan A B C D E F
Signalized Intersection Safety Strategies
Ukuran Kinerja Simpang Bersinyal:Antrian
Untuk keperluan perancangan dibutuhkan Nqmax yang merupakan fungsi dari NQ dan POL (halaman 2-66)
ENTRYW
NQQL max20
36009,0QcNQ
NS stop/smp
QNSNSV stop/jam
Untuk level simpang TOT
SVTOT Q
NNS
Signalized Intersection Safety Strategies
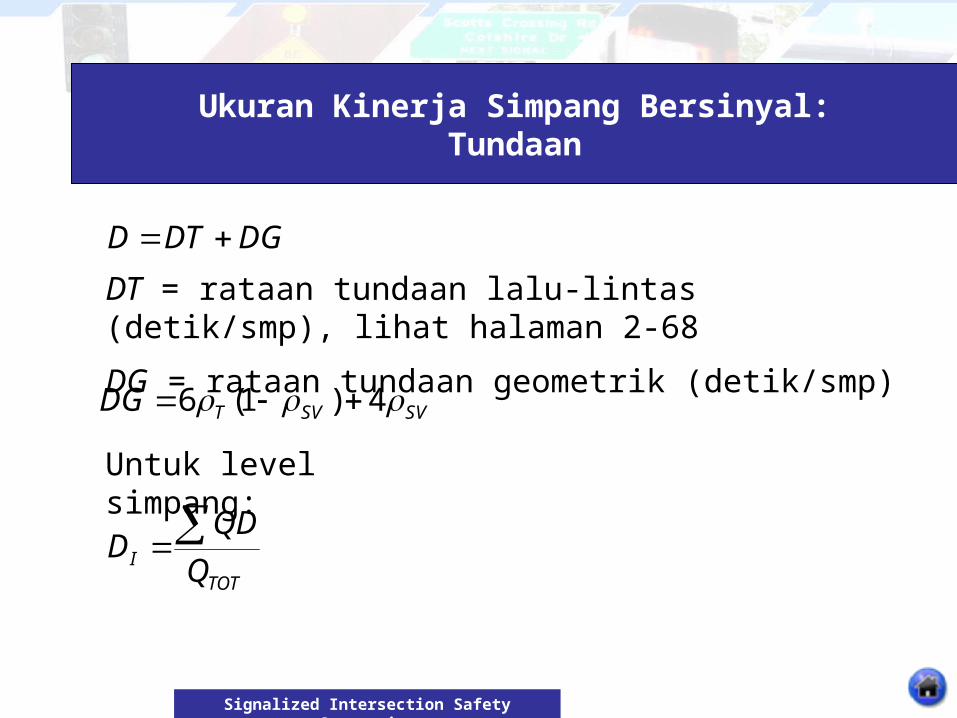
Ukuran Kinerja Simpang Bersinyal:Tundaan
DT = rataan tundaan lalu-lintas (detik/smp), lihat halaman 2-68
DG = rataan tundaan geometrik (detik/smp)
DGDTD
SVSVTDG 4)1(6
Untuk level simpang:
TOTI Q
QDD
Signalized Intersection Safety Strategies
Perbaikan Kinerja Simpang Bersinyal
• Bila c sangat besar dan DS > 0,85, maka kinerja simpang menjadi kurang baik.
• Bentuk upaya perbaikan harus terkait dengan sebab rendahnya kinerja simpang.
Signalized Intersection Safety Strategies
Cara-cara untuk meningkatkan kapasitas Simpang Bersinyal
• Pelebaran lengan pendekatKapasitas tergantung pada arus jenuh yang melewati garis henti (lebar lengan pendekat).Melebarkan lengan pendekat meningkatkan kapasitas persimpangan.Panjang dari pelebaran lengan pendekat juga sangat penting untuk diperhatikan.
Signalized Intersection Safety Strategies
Cara-cara untuk meningkatkan kapasitas Simpang Bersinyal
• Menaikkan waktu siklussemakin lama waktu siklus semakin besar kapasitas persimpangan semakin tinggi antrian dan tundaan yang terjadiMenurut MKJI 1997 [p.2-60] kisaran waktu siklus adalah 40 s/d 130 detikPada kondisi tertentu “terpaksa” digunakan waktu siklus > 130 detik.
Signalized Intersection Safety Strategies
Cara-cara untuk meningkatkan kapasitas Simpang Bersinyal
• Perubahan pola fasePerlu dilakukan simulasi untuk mendapatkan pola fase yang paling efisien.Semakin sedikit fase semakin tinggi kapasitas persimpangan semakin besar kemungkinan konflik yang dapat terjadi.Umumnya jumlah fase yang digunakan berkisar antara 2 s/d 4.Siklus dengan 2 fase umumnya dilengkapi dengan early cut-off atau late-start. persimpangan Raya Darmo – Polisi Istimewa
Signalized Intersection Safety Strategies
Cara-cara untuk meningkatkan kapasitas Simpang Bersinyal
• Meminimalkan waktu antar-hijauWaktu antar-hijau diperlukan untuk menjamin keamanan kendaraan yang melewati simpang pada saat detik akhir hijau, agar tidak tertabrak kendaraan yang mendapatkan fase hijau berikutnya.Meminimalkan waktu hijau mendekatkan garis henti dengan pusat persimpangan.
Signalized Intersection Safety Strategies
Cara-cara untuk meningkatkan kapasitas Simpang Bersinyal
• Larangan belok kananMeningkatkan kapasitas akibat pengurangan fase.Namun harus dilakukan manajemen lalulintas untuk melayani kendaraan yang hendak belok kanan dengan menyediakan U-turn atau Re-routing.
Signalized Intersection Safety Strategies
Strategy Categories
A. Traffic control and operational improvementsB. Geometric improvementsC. Improve sight distanceD. Improve driver awarenessE. Improve driver complianceF. Improve access managementG. Improve safety through other infrastructure treatments
Signalized Intersection Safety Strategies
Explanation of Time, Cost, and Effectiveness
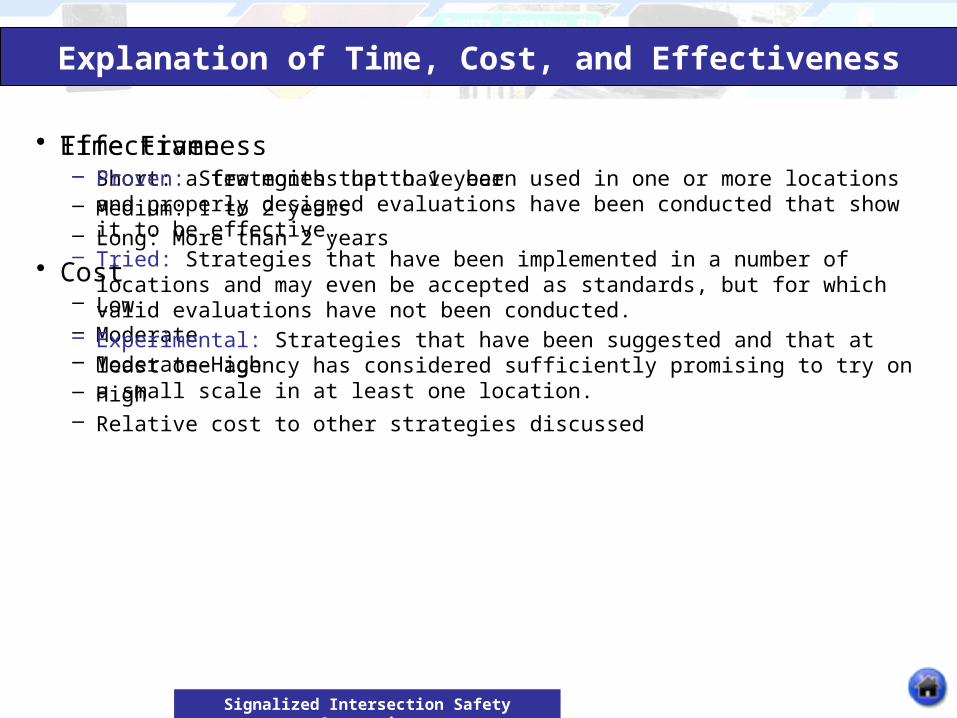
• Time Frame– Short: a few months up to 1 year– Medium: 1 to 2 years– Long: More than 2 years
• Cost– Low– Moderate– Moderate-High– High– Relative cost to other strategies discussed
• Effectiveness– Proven: Strategies that have been used in one or more locations and properly
designed evaluations have been conducted that show it to be effective.– Tried: Strategies that have been implemented in a number of locations and
may even be accepted as standards, but for which valid evaluations have not been conducted.
– Experimental: Strategies that have been suggested and that at least one agency has considered sufficiently promising to try on a small scale in at least one location.
MANUAL KAPASITAS JALAN INDONESIA
Signalized Intersection Safety Strategies
Cost:Time Frame:Effectiveness:
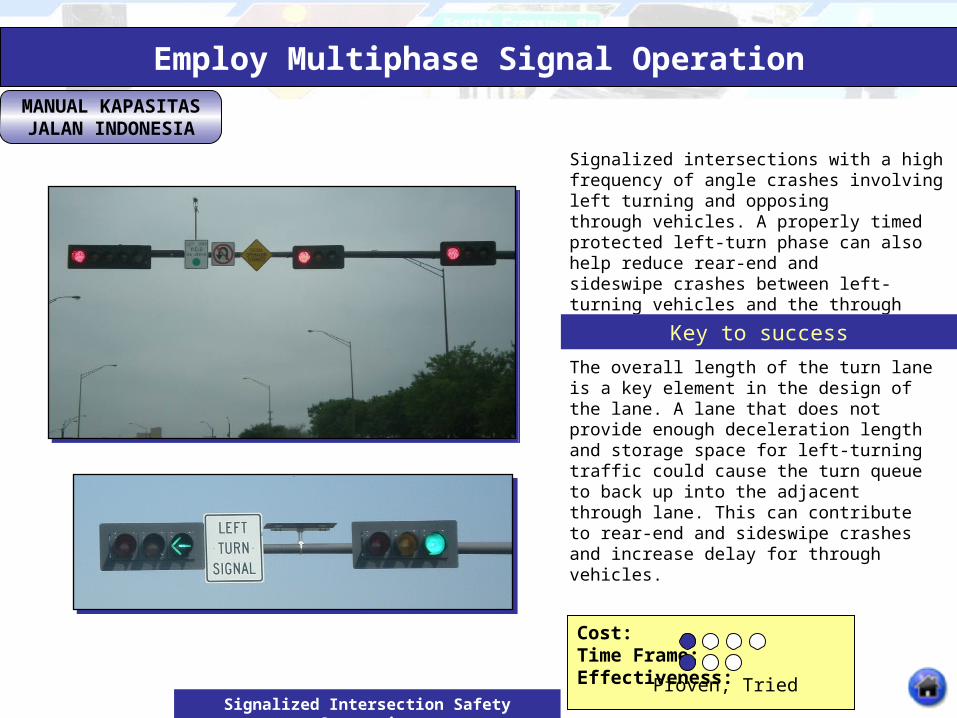
Employ Multiphase Signal Operation
Proven, Tried
Signalized intersections with a high frequency of angle crashes involving left turning and opposingthrough vehicles. A properly timed protected left-turn phase can also help reduce rear-end andsideswipe crashes between left-turning vehicles and the through vehicles behind them.
The overall length of the turn lane is a key element in the design of the lane. A lane that does not provide enough deceleration length and storage space for left-turning traffic could cause the turn queue to back up into the adjacent through lane. This can contribute to rear-end and sideswipe crashes and increase delay for through vehicles.
Key to success
MANUAL KAPASITAS JALAN INDONESIA
Signalized Intersection Safety Strategies
Cost:Time Frame:Effectiveness:
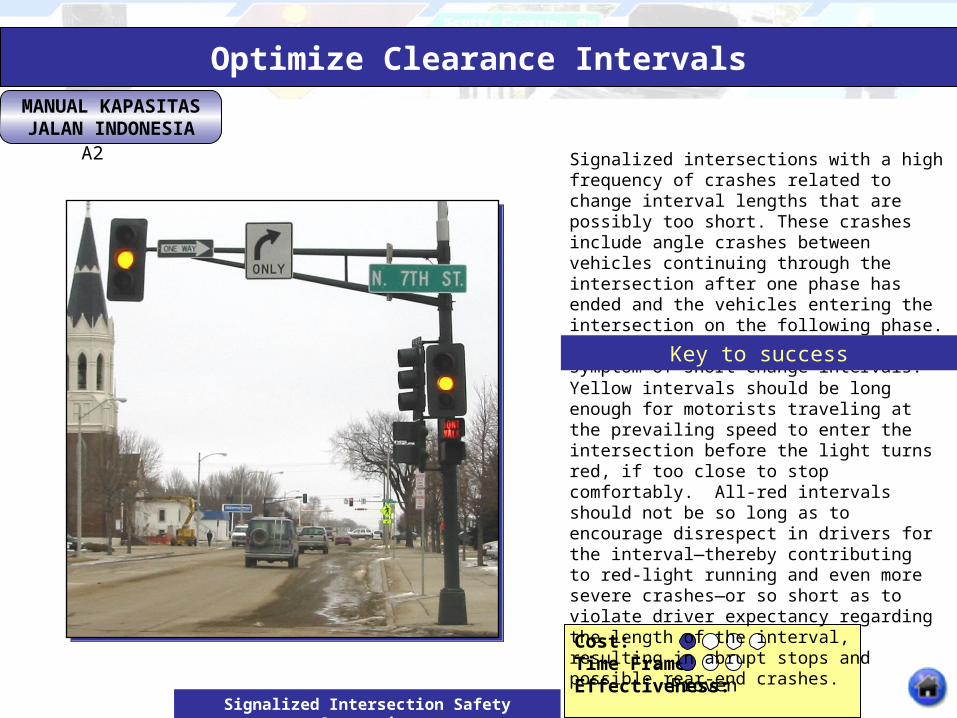
Optimize Clearance Intervals
A2
Proven
Signalized intersections with a high frequency of crashes related to change interval lengths that are possibly too short. These crashes include angle crashes between vehicles continuing through the intersection after one phase has ended and the vehicles entering the intersection on the following phase. Rear-end crashes may also be a symptom of short change intervals.
Yellow intervals should be long enough for motorists traveling at the prevailing speed to enter the intersection before the light turns red, if too close to stop comfortably. All-red intervals should not be so long as to encourage disrespect in drivers for the interval—thereby contributing to red-light running and even more severe crashes—or so short as to violate driver expectancy regarding the length of the interval, resulting in abrupt stops and possible rear-end crashes.
Key to success
MANUAL KAPASITAS JALAN INDONESIA
Signalized Intersection Safety Strategies
Cost:Time Frame:Effectiveness:
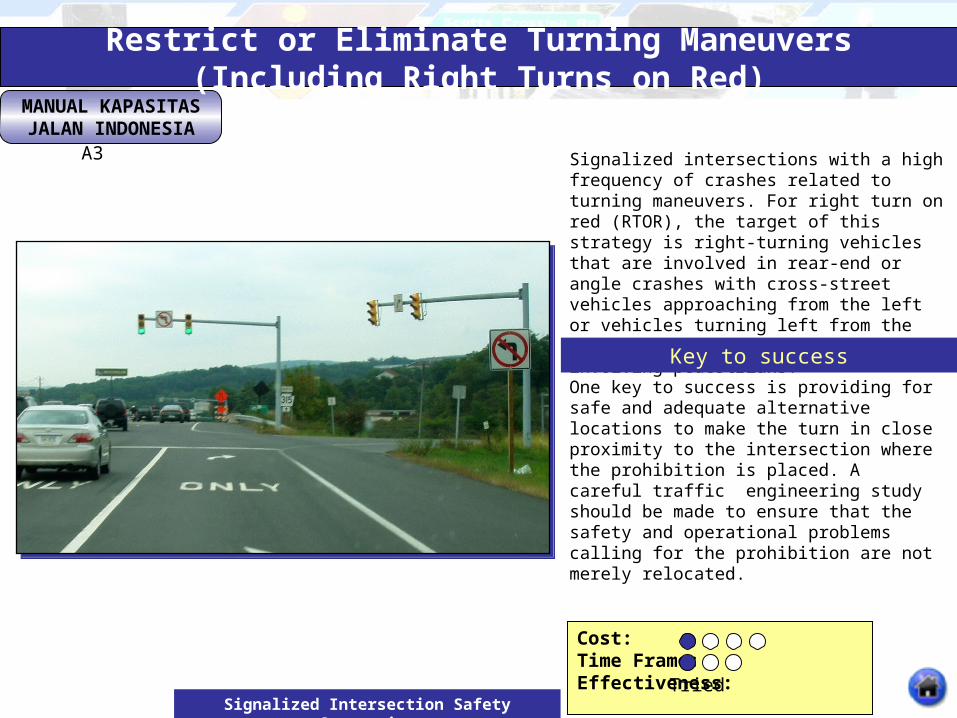
Restrict or Eliminate Turning Maneuvers (Including Right Turns on Red)
A3
Tried
Signalized intersections with a high frequency of crashes related to turning maneuvers. For right turn on red (RTOR), the target of this strategy is right-turning vehicles that are involved in rear-end or angle crashes with cross-street vehicles approaching from the left or vehicles turning left from the opposing approach, and crashes involving pedestrians.
One key to success is providing for safe and adequate alternative locations to make the turn in close proximity to the intersection where the prohibition is placed. A careful traffic engineering study should be made to ensure that the safety and operational problems calling for the prohibition are not merely relocated.
Key to success
MANUAL KAPASITAS JALAN INDONESIA
Signalized Intersection Safety Strategies
Cost:Time Frame:Effectiveness:
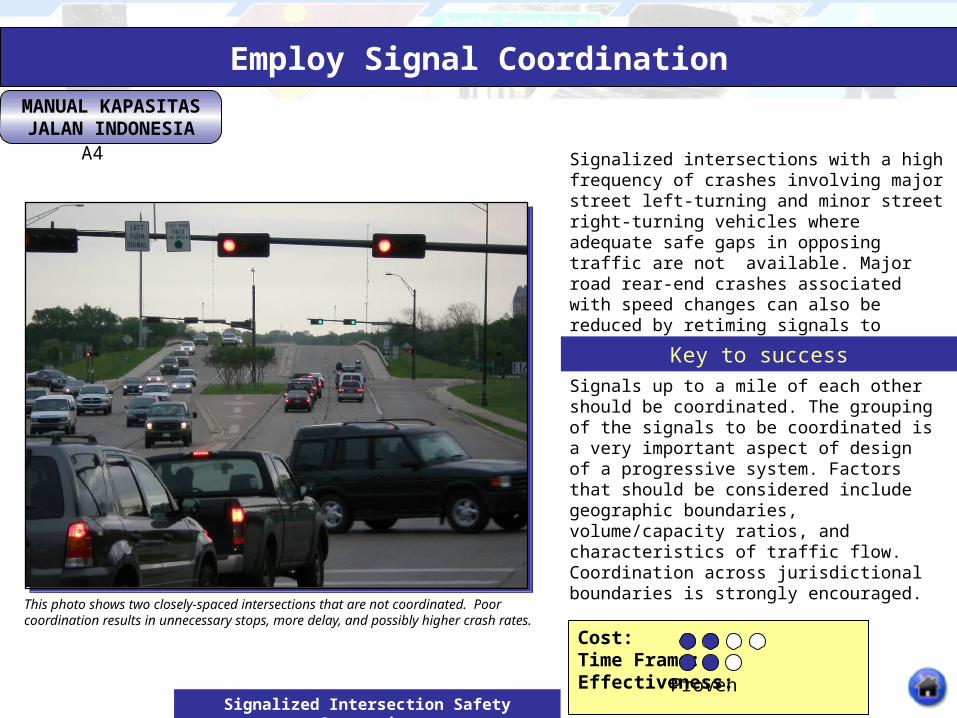
Employ Signal Coordination
A4
Proven
Signalized intersections with a high frequency of crashes involving major street left-turning and minor street right-turning vehicles where adequate safe gaps in opposing traffic are not available. Major road rear-end crashes associated with speed changes can also be reduced by retiming signals to promote platooning.
Signals up to a mile of each other should be coordinated. The grouping of the signals to be coordinated is a very important aspect of design of a progressive system. Factors that should be considered include geographic boundaries, volume/capacity ratios, and characteristics of traffic flow. Coordination across jurisdictional boundaries is strongly encouraged.
This photo shows two closely-spaced intersections that are not coordinated. Poor coordination results in unnecessary stops, more delay, and possibly higher crash rates.
Key to success
MANUAL KAPASITAS JALAN INDONESIA
Signalized Intersection Safety Strategies
Cost:Time Frame:Effectiveness:
Employ Emergency Vehicle Preemption
A5
Proven
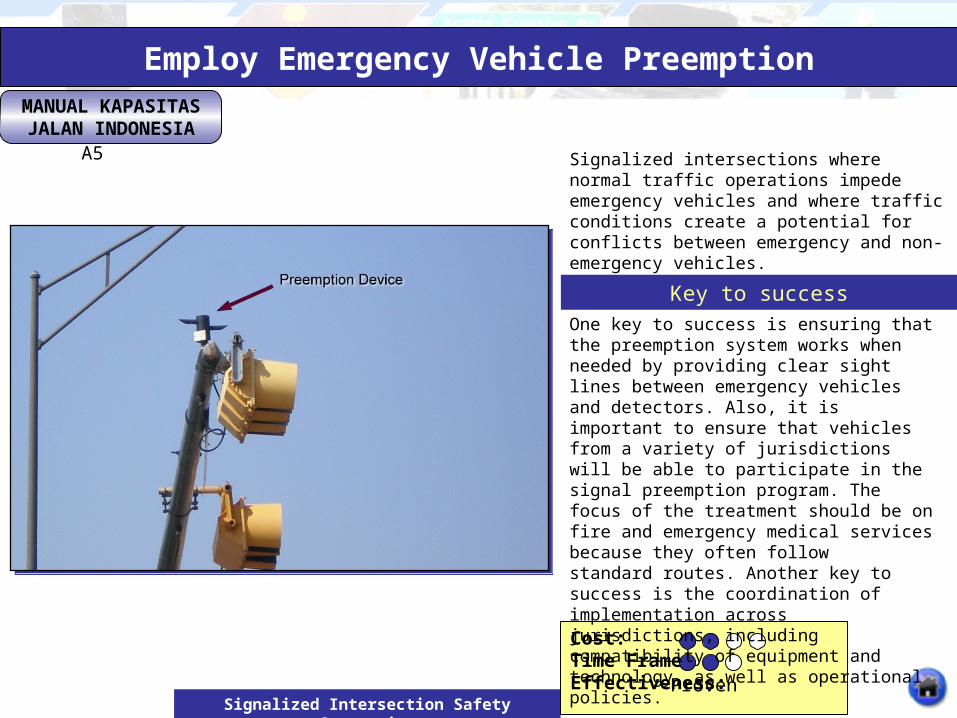
Signalized intersections where normal traffic operations impede emergency vehicles and where traffic conditions create a potential for conflicts between emergency and non-emergency vehicles.
One key to success is ensuring that the preemption system works when needed by providing clear sight lines between emergency vehicles and detectors. Also, it is important to ensure that vehicles from a variety of jurisdictions will be able to participate in the signal preemption program. The focus of the treatment should be on fire and emergency medical services because they often followstandard routes. Another key to success is the coordination of implementation across jurisdictions, including compatibility of equipment and technology, as well as operational policies.
Key to success
MANUAL KAPASITAS JALAN INDONESIA
Signalized Intersection Safety Strategies
Cost:Time Frame:Effectiveness:
Improve Operation of Pedestrian andBicycle Facilities at Signalized Intersections
A6
Proven, Tried
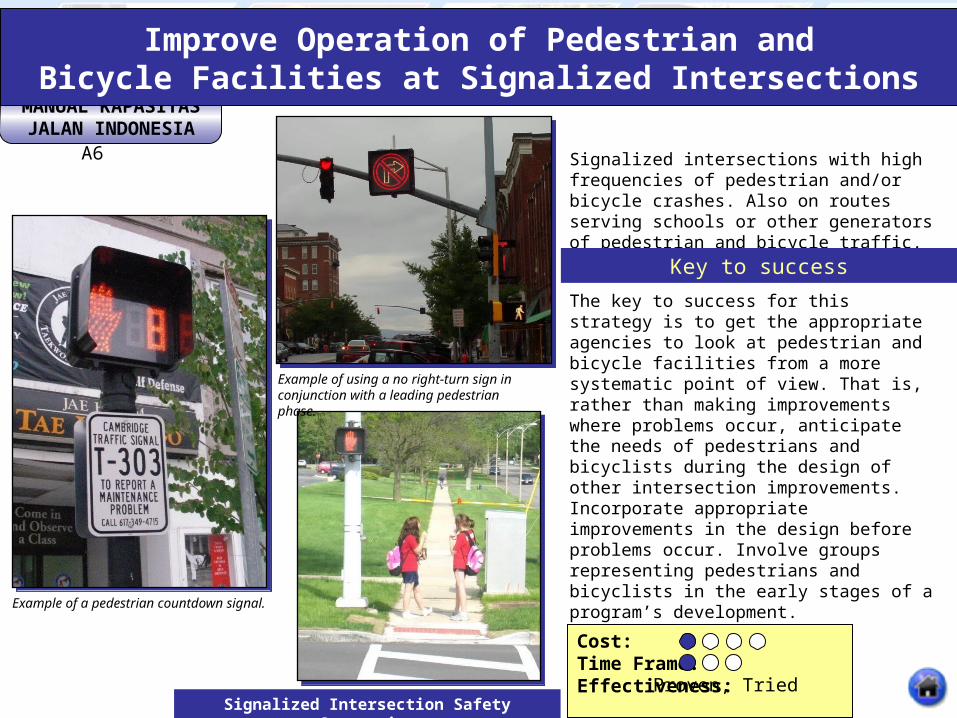
Signalized intersections with high frequencies of pedestrian and/or bicycle crashes. Also on routes serving schools or other generators of pedestrian and bicycle traffic.
The key to success for this strategy is to get the appropriate agencies to look at pedestrian and bicycle facilities from a more systematic point of view. That is, rather than making improvements where problems occur, anticipate the needs of pedestrians and bicyclists during the design of other intersection improvements. Incorporate appropriate improvements in the design before problems occur. Involve groups representing pedestrians and bicyclists in the early stages of a program’s development.
Example of a pedestrian countdown signal.
Example of using a no right-turn sign in conjunction with a leading pedestrian phase.
Key to success
MANUAL KAPASITAS JALAN INDONESIA
Signalized Intersection Safety Strategies
Cost:Time Frame:Effectiveness:
Remove Unwarranted Signal
A7
Proven
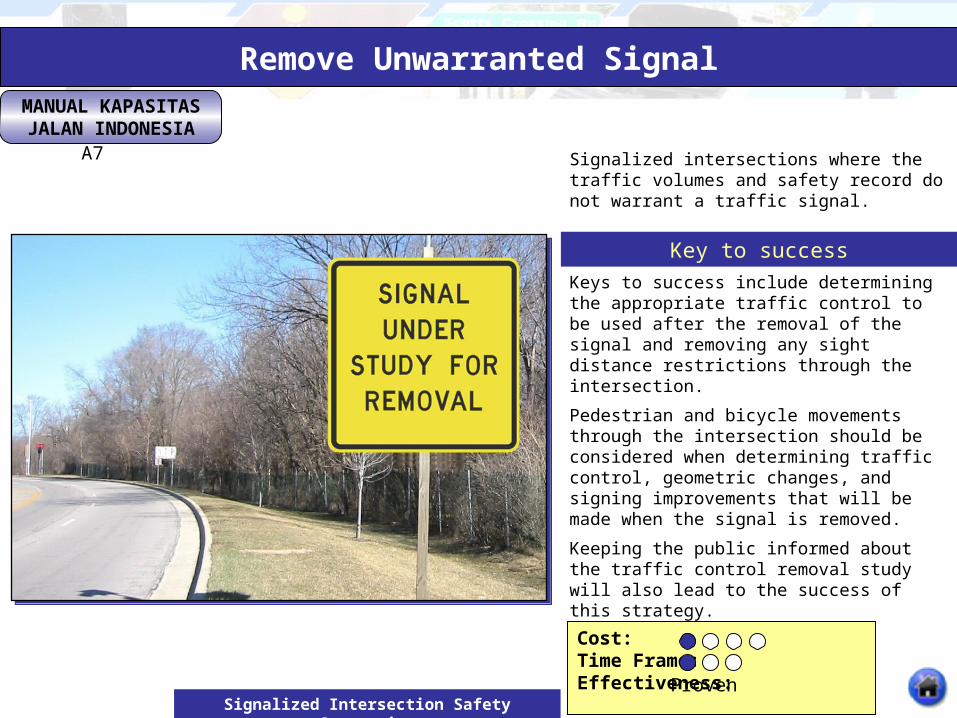
Signalized intersections where the traffic volumes and safety record do not warrant a traffic signal.
Keys to success include determining the appropriate traffic control to be used after the removal of the signal and removing any sight distance restrictions through the intersection.
Pedestrian and bicycle movements through the intersection should be considered when determining traffic control, geometric changes, and signing improvements that will be made when the signal is removed.
Keeping the public informed about the traffic control removal study will also lead to the success of this strategy.
Key to success
MANUAL KAPASITAS JALAN INDONESIA
Signalized Intersection Safety Strategies
Cost:Time Frame:Effectiveness:
Provide/Improve Left-Turn Channelization
B1
Tried/Proven
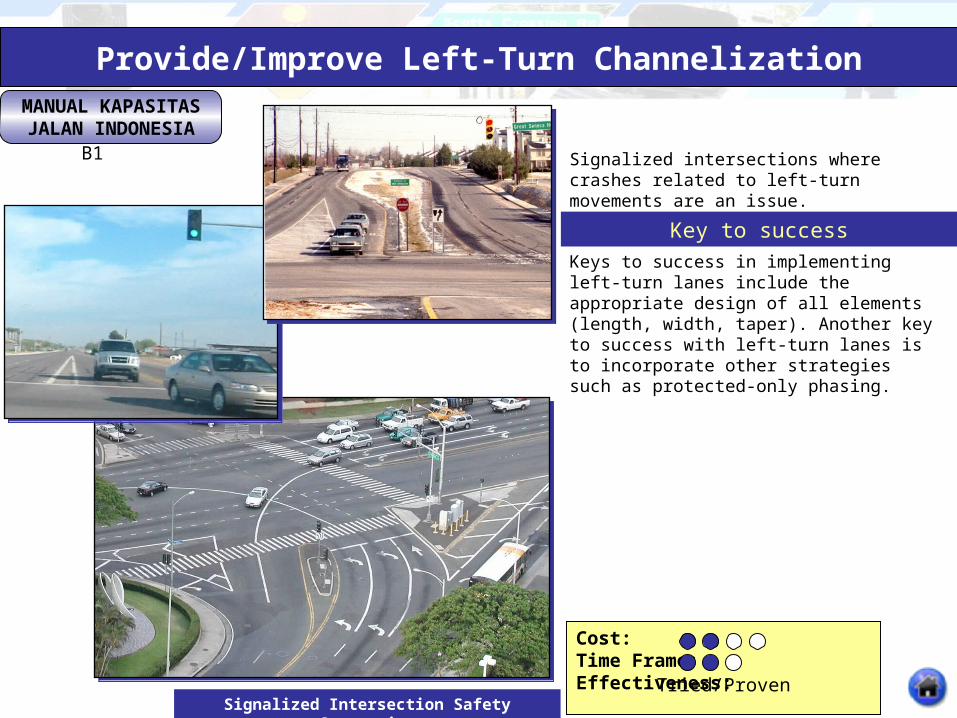
Signalized intersections where crashes related to left-turn movements are an issue.
Keys to success in implementing left-turn lanes include the appropriate design of all elements (length, width, taper). Another key to success with left-turn lanes is to incorporate other strategies such as protected-only phasing.
Key to success
MANUAL KAPASITAS JALAN INDONESIA
Signalized Intersection Safety Strategies
Cost:Time Frame:Effectiveness:
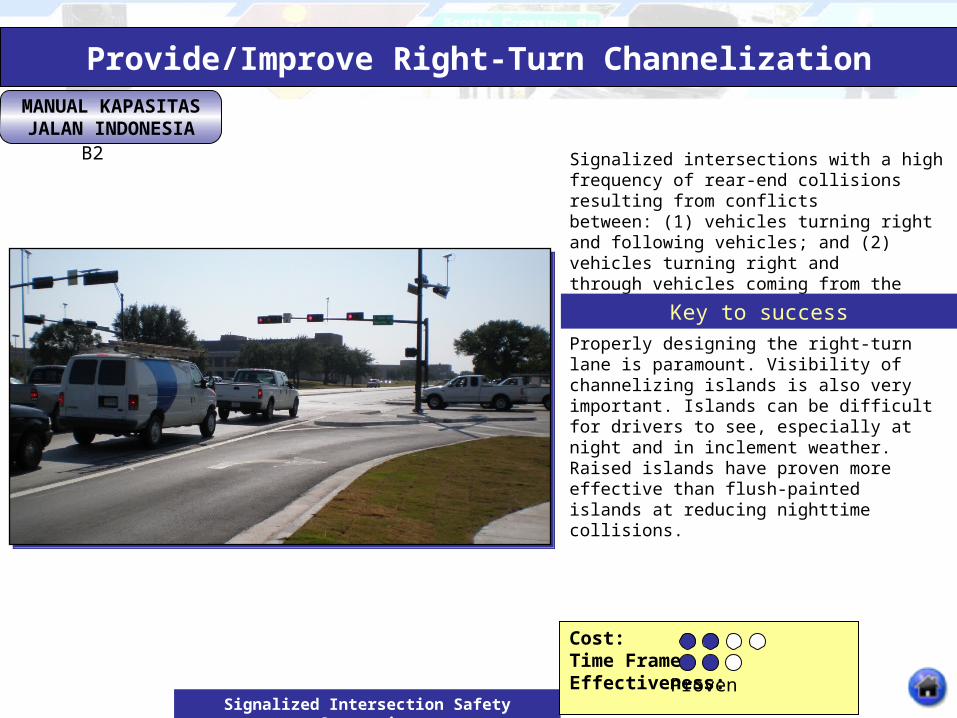
Provide/Improve Right-Turn Channelization
B2
Proven
Signalized intersections with a high frequency of rear-end collisions resulting from conflictsbetween: (1) vehicles turning right and following vehicles; and (2) vehicles turning right andthrough vehicles coming from the left on the cross street.
Properly designing the right-turn lane is paramount. Visibility of channelizing islands is also very important. Islands can be difficult for drivers to see, especially at night and in inclement weather. Raised islands have proven more effective than flush-painted islands at reducing nighttime collisions.
Key to success
MANUAL KAPASITAS JALAN INDONESIA
Signalized Intersection Safety Strategies
Cost:Time Frame:Effectiveness:
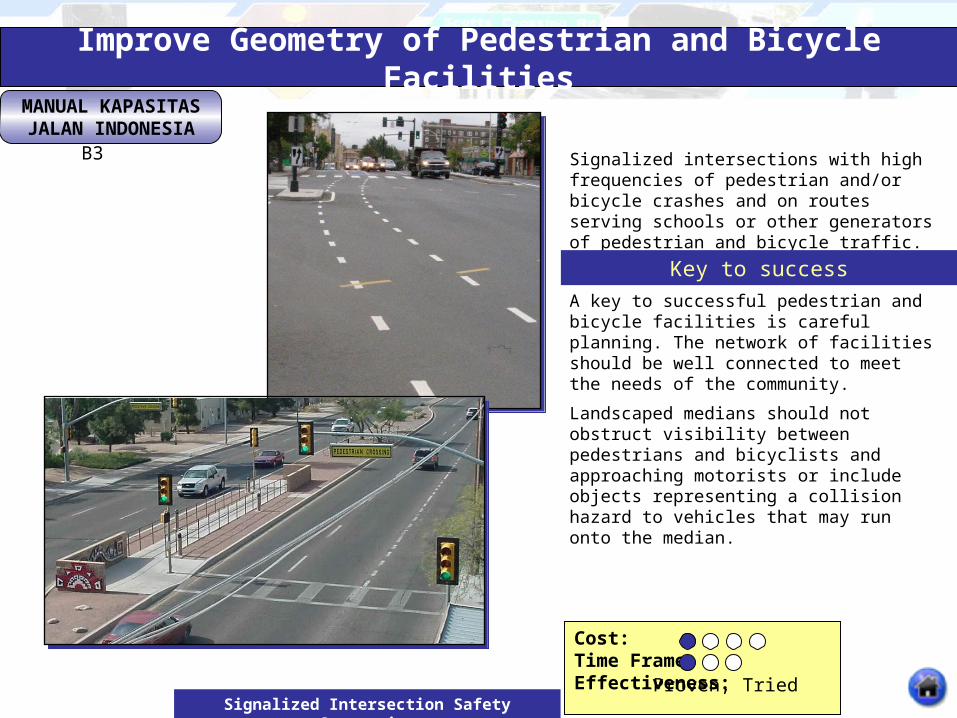
Improve Geometry of Pedestrian and Bicycle Facilities
B3
Proven, Tried
Signalized intersections with high frequencies of pedestrian and/or bicycle crashes and on routes serving schools or other generators of pedestrian and bicycle traffic.
A key to successful pedestrian and bicycle facilities is careful planning. The network of facilities should be well connected to meet the needs of the community.
Landscaped medians should not obstruct visibility between pedestrians and bicyclists and approaching motorists or include objects representing a collision hazard to vehicles that may run onto the median.
Key to success
MANUAL KAPASITAS JALAN INDONESIA
Signalized Intersection Safety Strategies
Cost:Time Frame:Effectiveness:
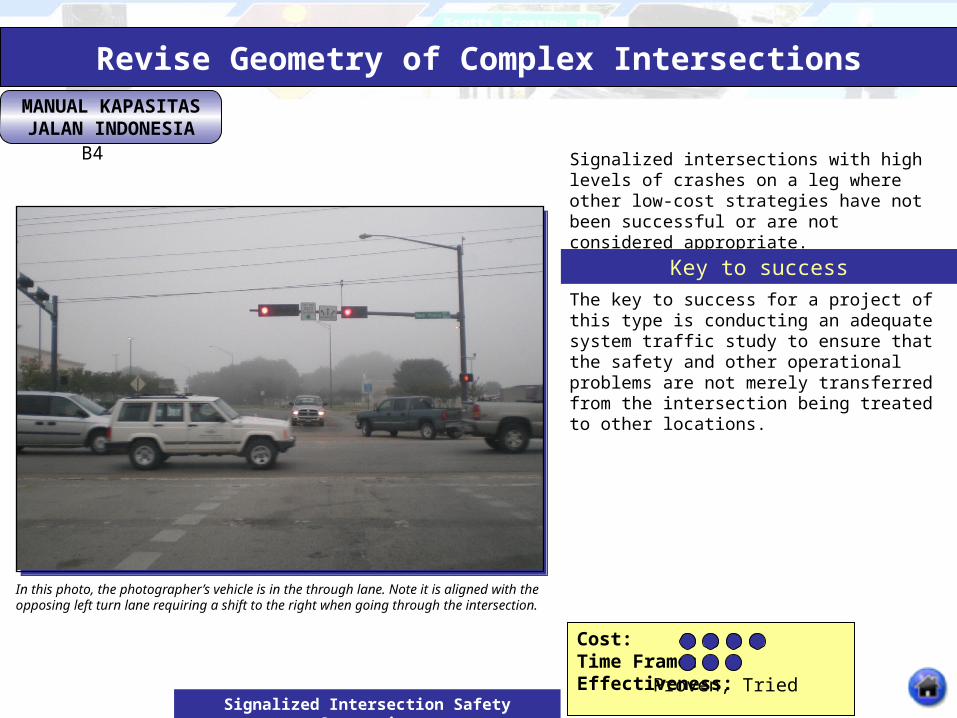
Revise Geometry of Complex Intersections
B4
Proven, Tried
Signalized intersections with high levels of crashes on a leg where other low-cost strategies have not been successful or are not considered appropriate.
The key to success for a project of this type is conducting an adequate system traffic study to ensure that the safety and other operational problems are not merely transferred from the intersection being treated to other locations.
In this photo, the photographer’s vehicle is in the through lane. Note it is aligned with the opposing left turn lane requiring a shift to the right when going through the intersection.
Key to success
MANUAL KAPASITAS JALAN INDONESIA
Signalized Intersection Safety Strategies
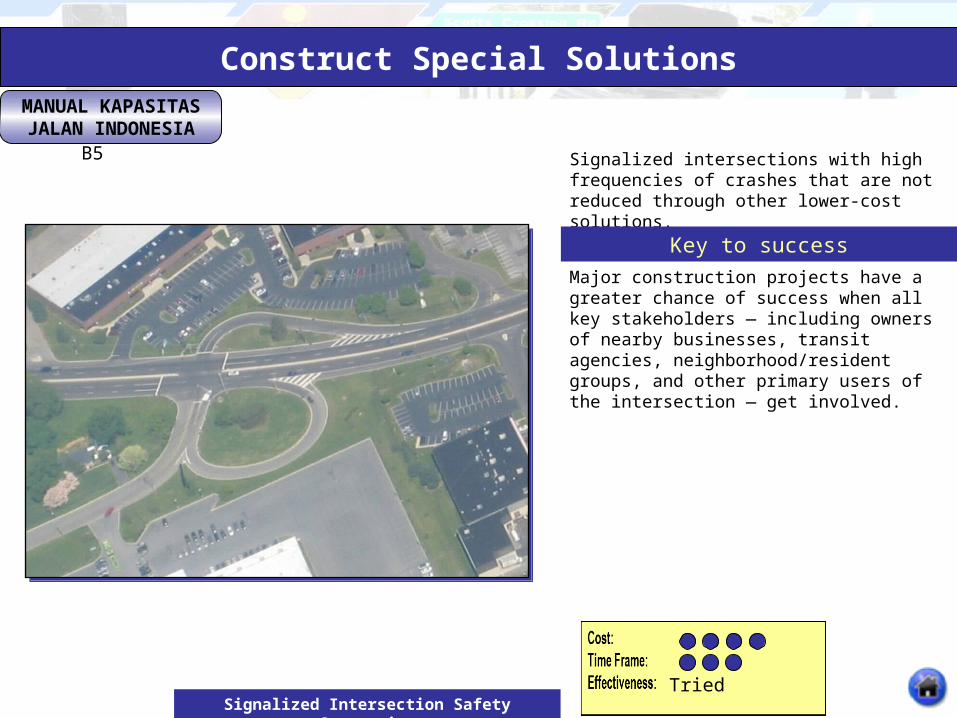
Construct Special Solutions
B5
Tried
Signalized intersections with high frequencies of crashes that are not reduced through other lower-cost solutions.
Major construction projects have a greater chance of success when all key stakeholders — including owners of nearby businesses, transit agencies, neighborhood/resident groups, and other primary users of the intersection — get involved.
Key to success
MANUAL KAPASITAS JALAN INDONESIA
Signalized Intersection Safety Strategies
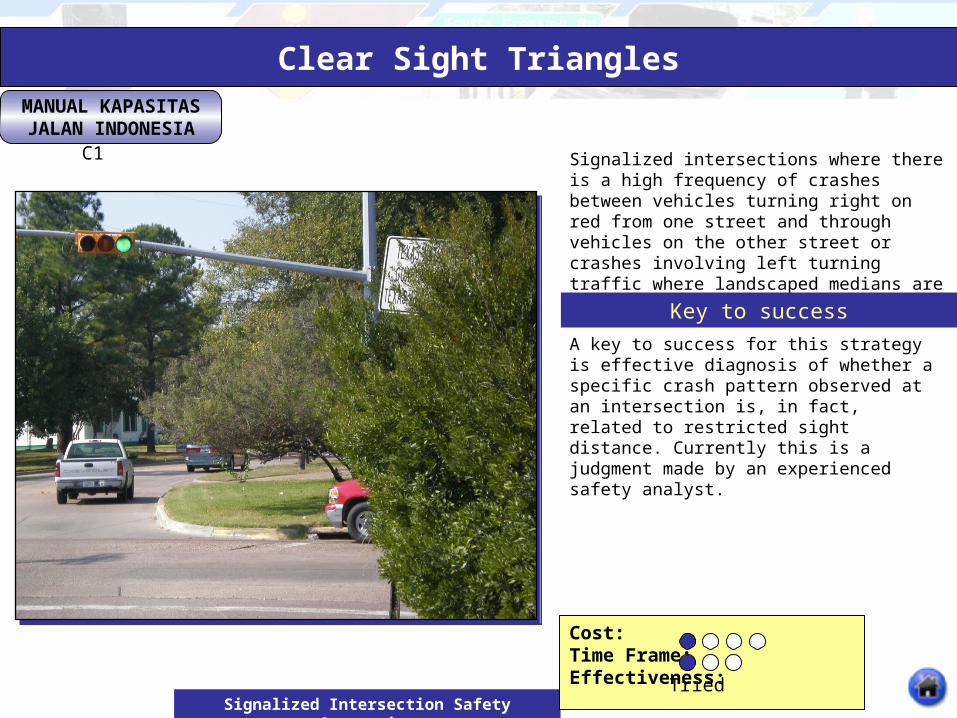
Cost:Time Frame:Effectiveness:
Clear Sight Triangles
C1
Tried
Signalized intersections where there is a high frequency of crashes between vehicles turning right on red from one street and through vehicles on the other street or crashes involving left turning traffic where landscaped medians are present.
A key to success for this strategy is effective diagnosis of whether a specific crash pattern observed at an intersection is, in fact, related to restricted sight distance. Currently this is a judgment made by an experienced safety analyst.
Key to success
MANUAL KAPASITAS JALAN INDONESIA
Signalized Intersection Safety Strategies
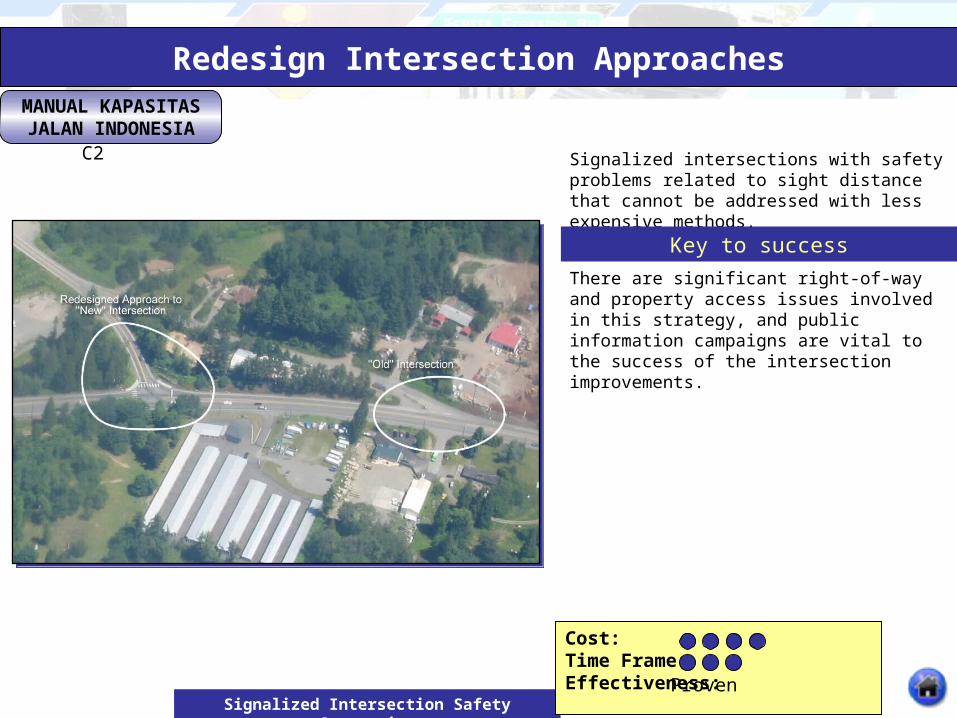
Cost:Time Frame:Effectiveness:
Redesign Intersection Approaches
C2
Proven
Signalized intersections with safety problems related to sight distance that cannot be addressed with less expensive methods.
There are significant right-of-way and property access issues involved in this strategy, and public information campaigns are vital to the success of the intersection improvements.
Key to success
MANUAL KAPASITAS JALAN INDONESIA
Signalized Intersection Safety Strategies
Cost:Time Frame:Effectiveness:
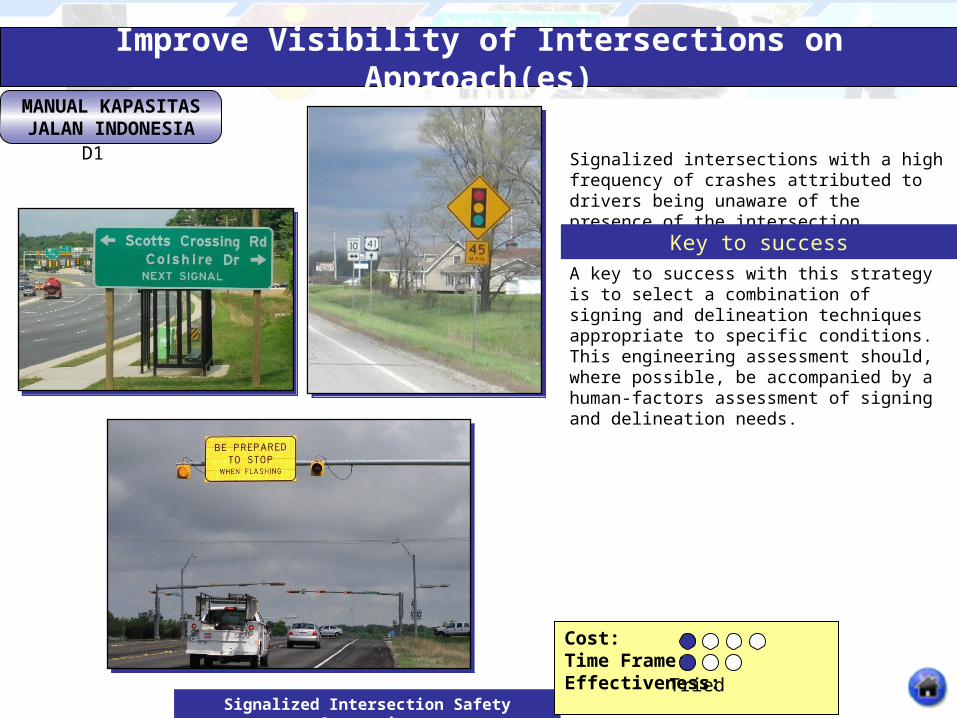
Improve Visibility of Intersections on Approach(es)
D1
Tried
Signalized intersections with a high frequency of crashes attributed to drivers being unaware of the presence of the intersection.
A key to success with this strategy is to select a combination of signing and delineation techniques appropriate to specific conditions. This engineering assessment should, where possible, be accompanied by a human-factors assessment of signing and delineation needs.
Key to success
MANUAL KAPASITAS JALAN INDONESIA
Signalized Intersection Safety Strategies
Cost:Time Frame:Effectiveness:
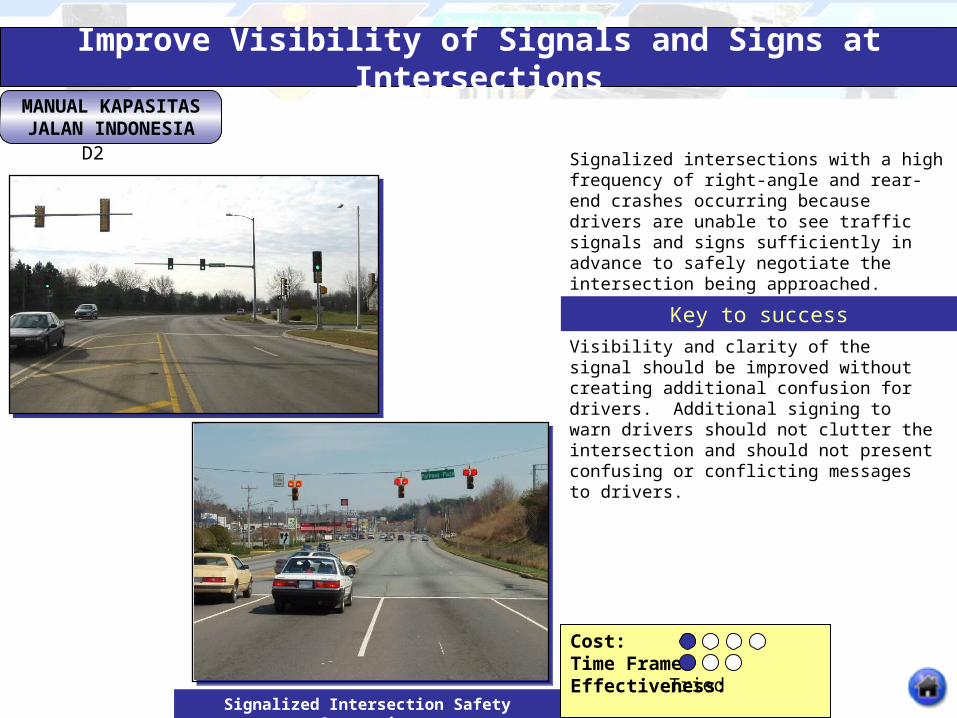
Improve Visibility of Signals and Signs at Intersections
D2
Tried
Signalized intersections with a high frequency of right-angle and rear-end crashes occurring because drivers are unable to see traffic signals and signs sufficiently in advance to safely negotiate the intersection being approached.
Visibility and clarity of the signal should be improved without creating additional confusion for drivers. Additional signing to warn drivers should not clutter the intersection and should not present confusing or conflicting messages to drivers.
Key to success
MANUAL KAPASITAS JALAN INDONESIA
Signalized Intersection Safety Strategies
Cost:Time Frame:Effectiveness:
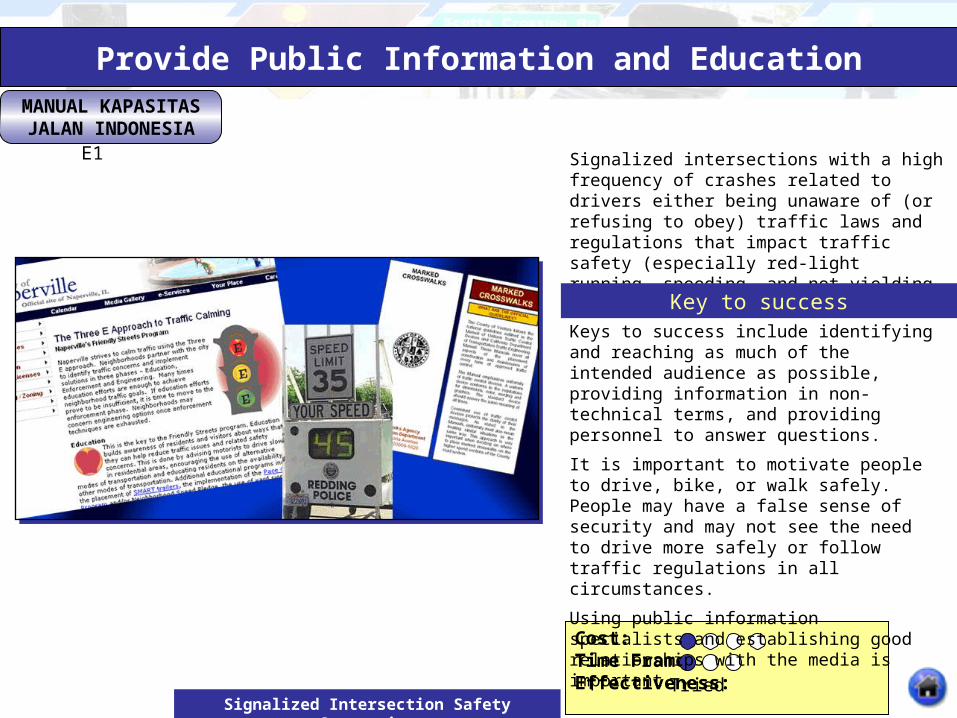
Provide Public Information and Education
E1
Tried
Signalized intersections with a high frequency of crashes related to drivers either being unaware of (or refusing to obey) traffic laws and regulations that impact traffic safety (especially red-light running, speeding, and not yielding to pedestrians).
Keys to success include identifying and reaching as much of the intended audience as possible, providing information in non-technical terms, and providing personnel to answer questions.
It is important to motivate people to drive, bike, or walk safely. People may have a false sense of security and may not see the need to drive more safely or follow traffic regulations in all circumstances.
Using public information specialists and establishing good relationships with the media is important.
Key to success
MANUAL KAPASITAS JALAN INDONESIA
Signalized Intersection Safety Strategies
Cost:Time Frame:Effectiveness:
Provide Targeted Conventional Enforcement of Traffic Laws
E2
Tried
Signalized intersections with a high frequency of crashes related to drivers either being unaware of (or refusing to obey) traffic laws and regulations that impact traffic safety.
It is important to correctly identify intersections that would benefit from enforcement. Care should be taken to first ensure that the existing signals are operating properly, are visible, and meet Manual on Uniform Traffic Control Devices requirements, as well as that timing plans—including clearance intervals—are appropriate. Analysis of crash statistics can help with this process, as can spot speed or conflict studies. In some cases, public input or observations by law enforcement personnel may suggest that a location should be targeted for enforcement.
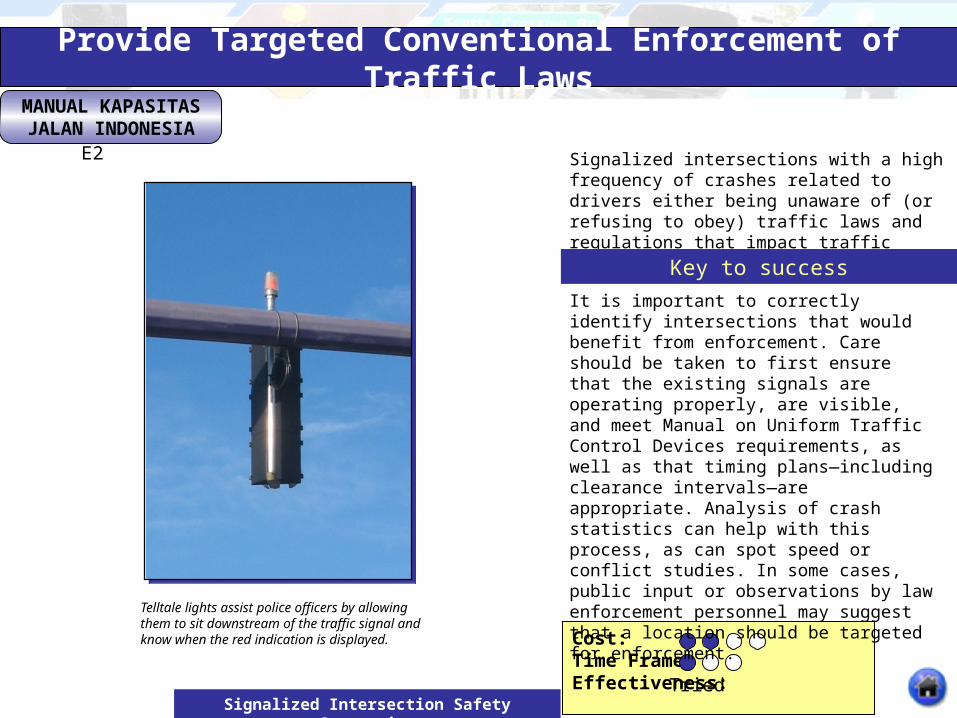
Telltale lights assist police officers by allowing them to sit downstream of the traffic signal and know when the red indication is displayed.
Key to success
MANUAL KAPASITAS JALAN INDONESIA
Signalized Intersection Safety Strategies
Cost:Time Frame:Effectiveness:
Implement Automated Enforcement of Red-Light Running (Cameras)
E3
Proven
Signalized intersections with a high frequency of right-angle and rear-end crashes attributed to drivers who intentionally disobey red signal indications.
Acceptance by local stakeholders—including officials, the public, and local law enforcement — is key to successful red-light running programs. A public information campaign explaining the program, the need for it, how the cameras work, and the potential benefits are key to successful implementation. Signs informing the public that automated enforcement is being used are frequently used.
Successful red-light camera programs have generally begun as safety improvement programs. Programs that are perceived as revenue generators are generally not well accepted.
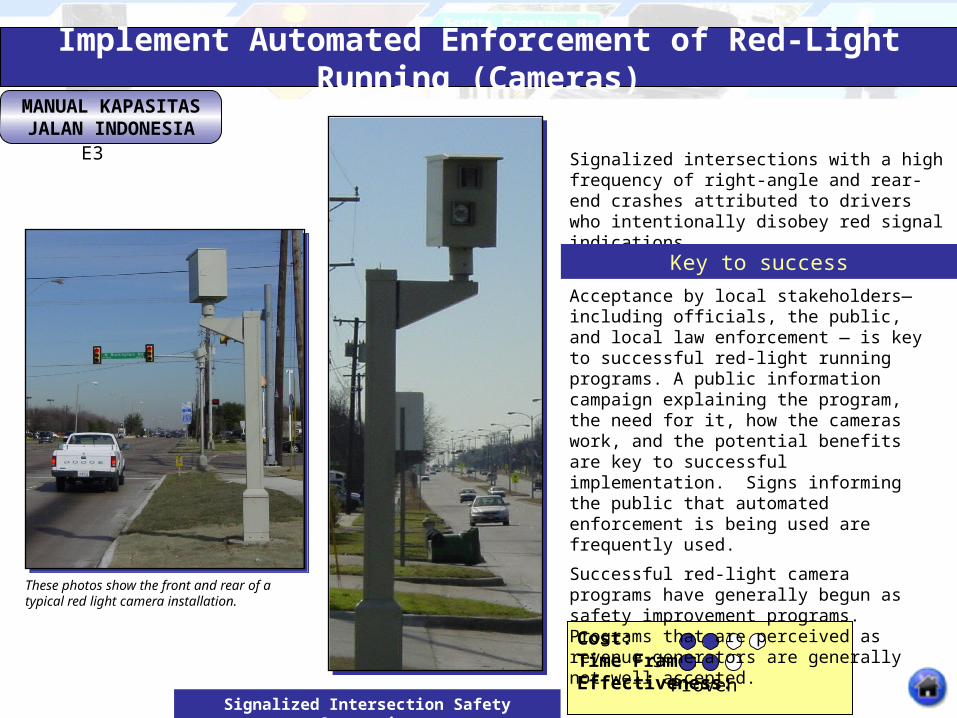
These photos show the front and rear of a typical red light camera installation.
Key to success
MANUAL KAPASITAS JALAN INDONESIA
Signalized Intersection Safety Strategies
Cost:Time Frame:Effectiveness:
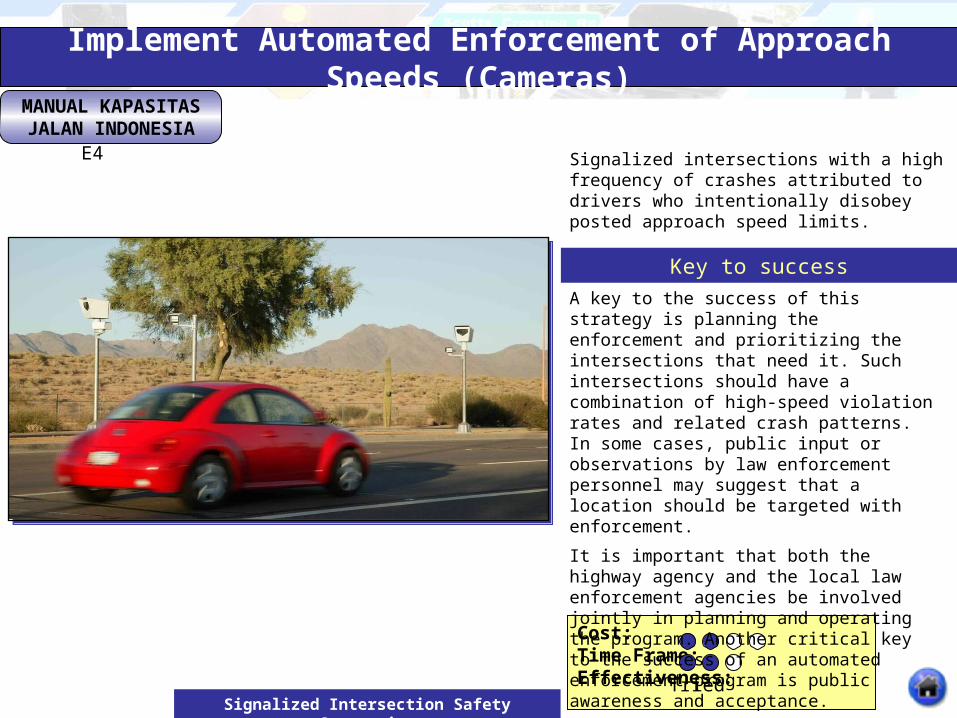
Implement Automated Enforcement of Approach Speeds (Cameras)
E4
Tried
Signalized intersections with a high frequency of crashes attributed to drivers who intentionally disobey posted approach speed limits.
A key to the success of this strategy is planning the enforcement and prioritizing the intersections that need it. Such intersections should have a combination of high-speed violation rates and related crash patterns. In some cases, public input or observations by law enforcement personnel may suggest that a location should be targeted with enforcement.
It is important that both the highway agency and the local law enforcement agencies be involved jointly in planning and operating the program. Another critical key to the success of an automated enforcement program is public awareness and acceptance.
Key to success
MANUAL KAPASITAS JALAN INDONESIA
Signalized Intersection Safety Strategies
Cost:Time Frame:Effectiveness:
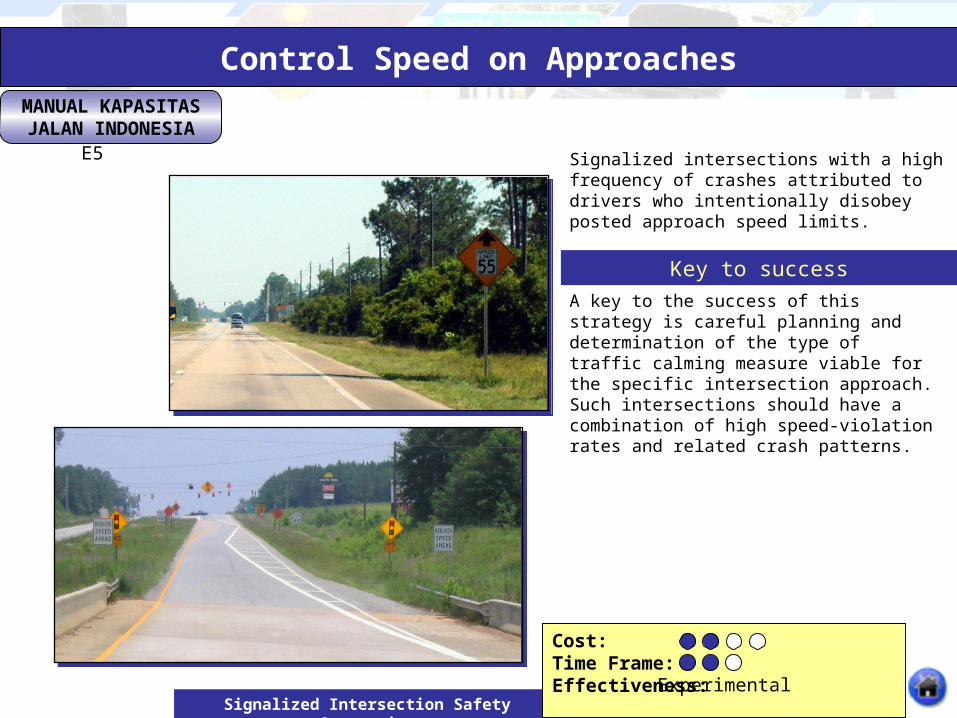
Control Speed on Approaches
E5
Experimental
Signalized intersections with a high frequency of crashes attributed to drivers who intentionally disobey posted approach speed limits.
A key to the success of this strategy is careful planning and determination of the type of traffic calming measure viable for the specific intersection approach. Such intersections should have a combination of high speed-violation rates and related crash patterns.
Key to success
MANUAL KAPASITAS JALAN INDONESIA
Signalized Intersection Safety Strategies
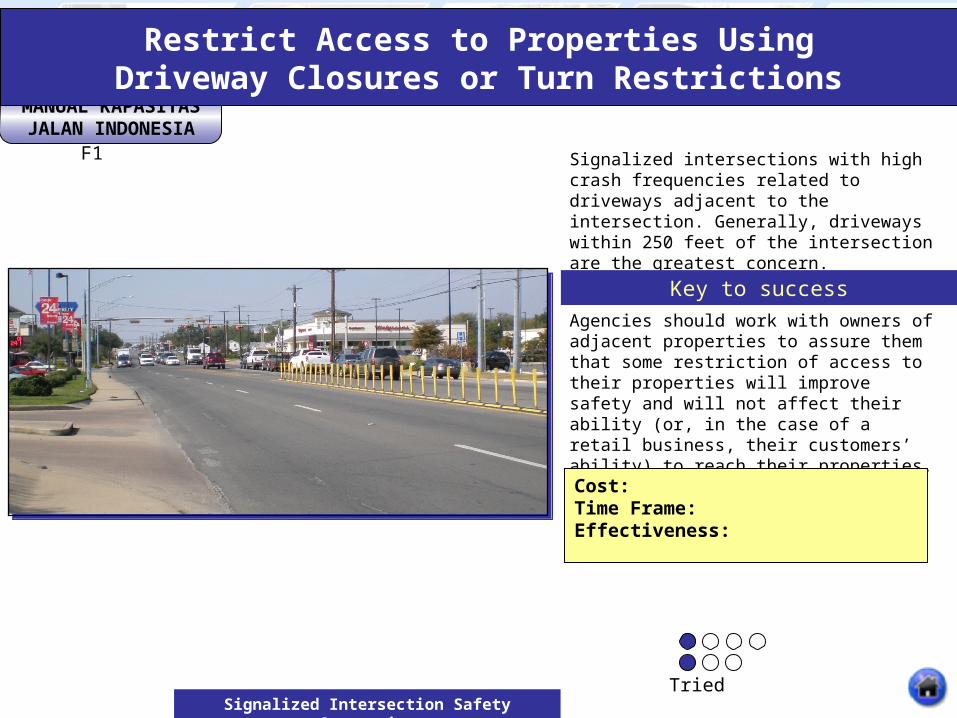
Restrict Access to Properties UsingDriveway Closures or Turn Restrictions
F1
Tried
Signalized intersections with high crash frequencies related to driveways adjacent to the intersection. Generally, driveways within 250 feet of the intersection are the greatest concern.
Agencies should work with owners of adjacent properties to assure them that some restriction of access to their properties will improve safety and will not affect their ability (or, in the case of a retail business, their customers’ ability) to reach their properties. Where practical, these strategies should be implemented as part of a comprehensive corridor access management plan.
Key to success
Cost:Time Frame:Effectiveness:
MANUAL KAPASITAS JALAN INDONESIA
Signalized Intersection Safety Strategies
Cost:Time Frame:Effectiveness:
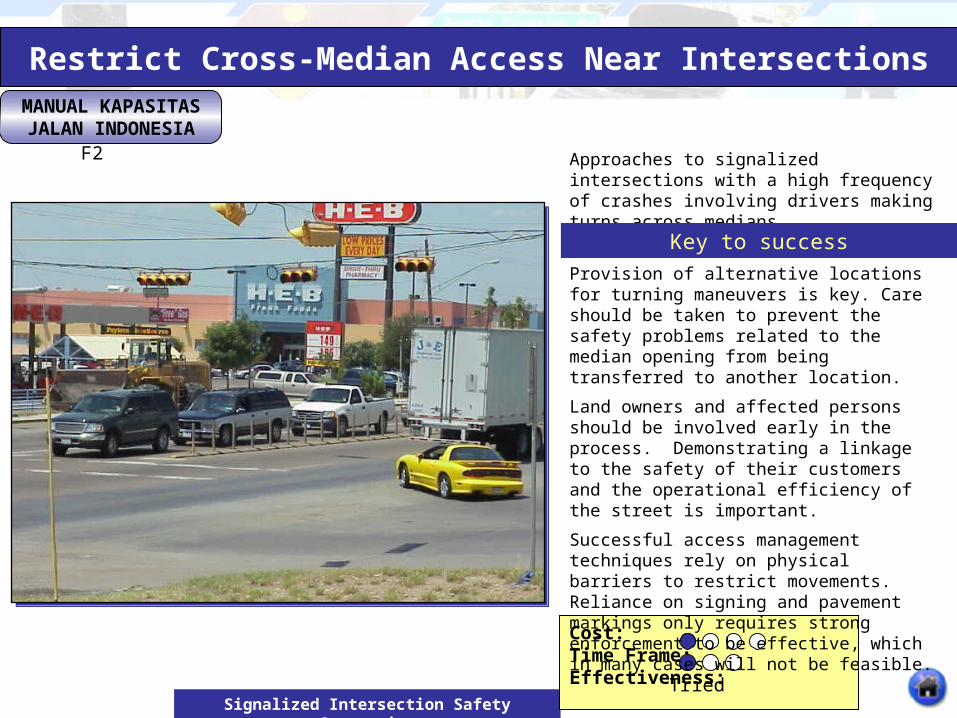
Restrict Cross-Median Access Near Intersections
F2
Tried
Approaches to signalized intersections with a high frequency of crashes involving drivers making turns across medians.
Provision of alternative locations for turning maneuvers is key. Care should be taken to prevent the safety problems related to the median opening from being transferred to another location.
Land owners and affected persons should be involved early in the process. Demonstrating a linkage to the safety of their customers and the operational efficiency of the street is important.
Successful access management techniques rely on physical barriers to restrict movements. Reliance on signing and pavement markings only requires strong enforcement to be effective, which in many cases will not be feasible.
Key to success
MANUAL KAPASITAS JALAN INDONESIA
Signalized Intersection Safety Strategies
Cost:Time Frame:Effectiveness:
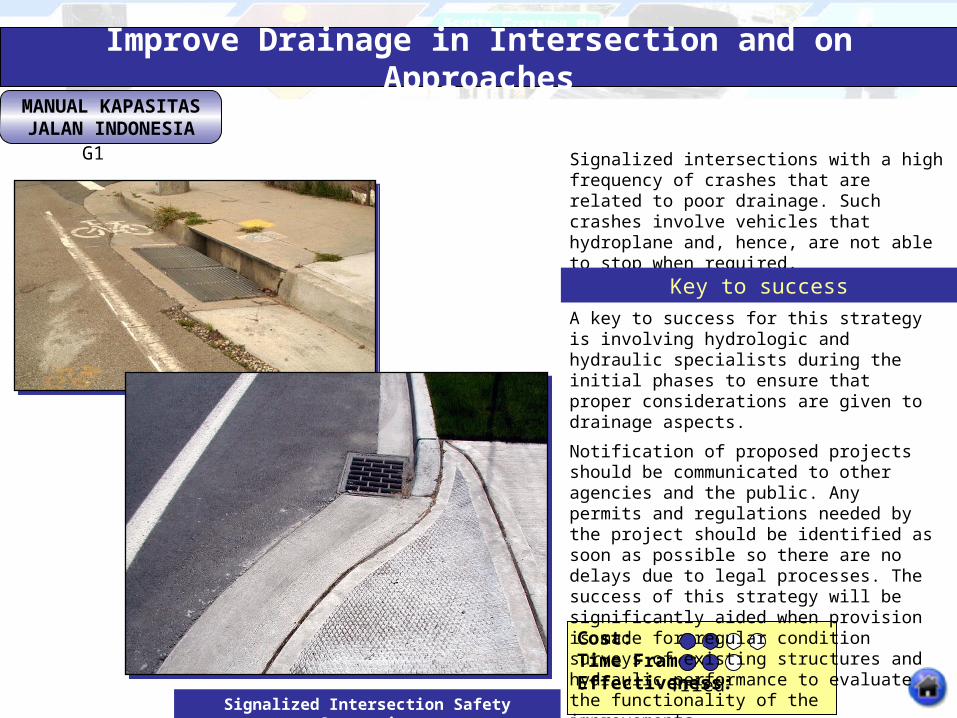
Improve Drainage in Intersection and on Approaches
G1
Tried
Signalized intersections with a high frequency of crashes that are related to poor drainage. Such crashes involve vehicles that hydroplane and, hence, are not able to stop when required.
A key to success for this strategy is involving hydrologic and hydraulic specialists during the initial phases to ensure that proper considerations are given to drainage aspects.
Notification of proposed projects should be communicated to other agencies and the public. Any permits and regulations needed by the project should be identified as soon as possible so there are no delays due to legal processes. The success of this strategy will be significantly aided when provision is made for regular condition surveys of existing structures and hydraulic performance to evaluate the functionality of the improvements.
Key to success
MANUAL KAPASITAS JALAN INDONESIA
Signalized Intersection Safety Strategies
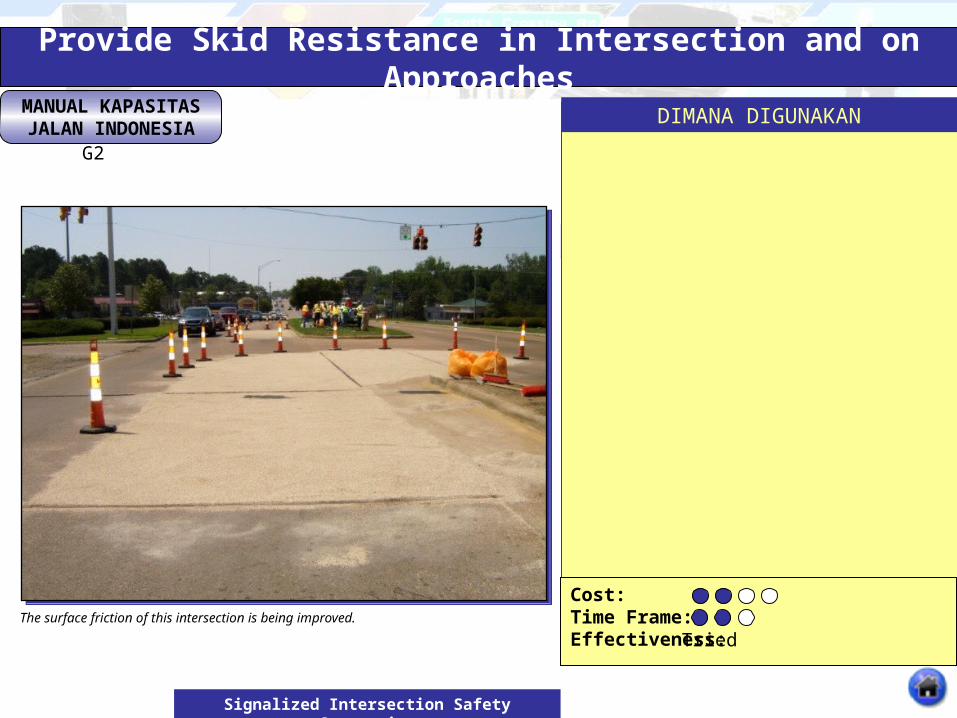
Provide Skid Resistance in Intersection and on Approaches
G2 Signalized intersection approaches where skidding is determined to be a problem, especially in wet conditions.
Monitoring the skid resistance of pavement requires incremental checks of pavement conditions. Evaluation must identify ruts and the occurrence of polishing. Recent research has suggested that the surface should be restored between 5 and 10 years in order to retain surface friction, but the life span is affected by site characteristics, such as traffic volume.
The surface friction of this intersection is being improved.
Key to success
DIMANA DIGUNAKAN
Cost:Time Frame:Effectiveness: Tried
MANUAL KAPASITAS JALAN INDONESIA
Signalized Intersection Safety Strategies
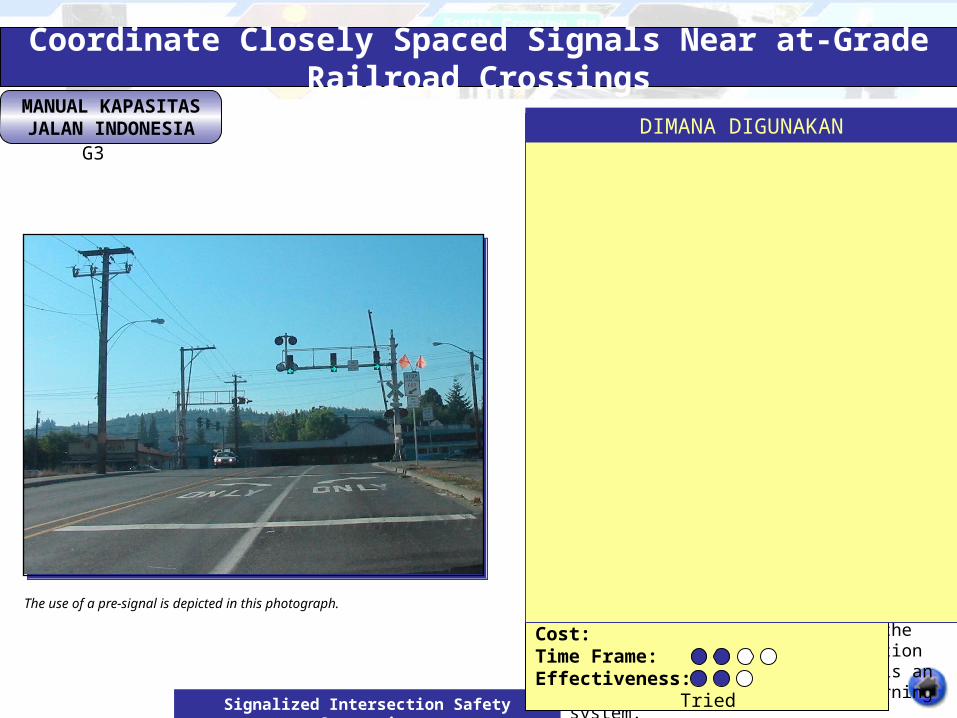
Coordinate Closely Spaced Signals Near at-Grade Railroad Crossings
G3
The use of a pre-signal is depicted in this photograph.
Signalized intersections in close proximity to at-grade railroad crossings with a high frequency of crashes. This situation presents a significant potential for vehicle-train crashes, but vehicle-vehicle crashes could also occur if drivers try to speed through an intersection to avoid waiting in a queue near the railroad crossing.
A key to success is the compatibility of the traffic signal and railroad active warning devices in order to safely control vehicle, train, bicycle, and pedestrian movements. Vehicles must be provided with adequate green time to clear the railroad tracks when a train is approaching. This means that potential queue lengths during congested periods must be considered and train detection systems provided on the railroad tracks far enough upstream of the crossing for the signal preemption to clear all vehicles. A gate is an integral part of the active warning system.
Key to success
Cost:Time Frame:Effectiveness:
DIMANA DIGUNAKAN
Tried
MANUAL KAPASITAS JALAN INDONESIA
Signalized Intersection Safety Strategies
Cost:Time Frame:Effectiveness:
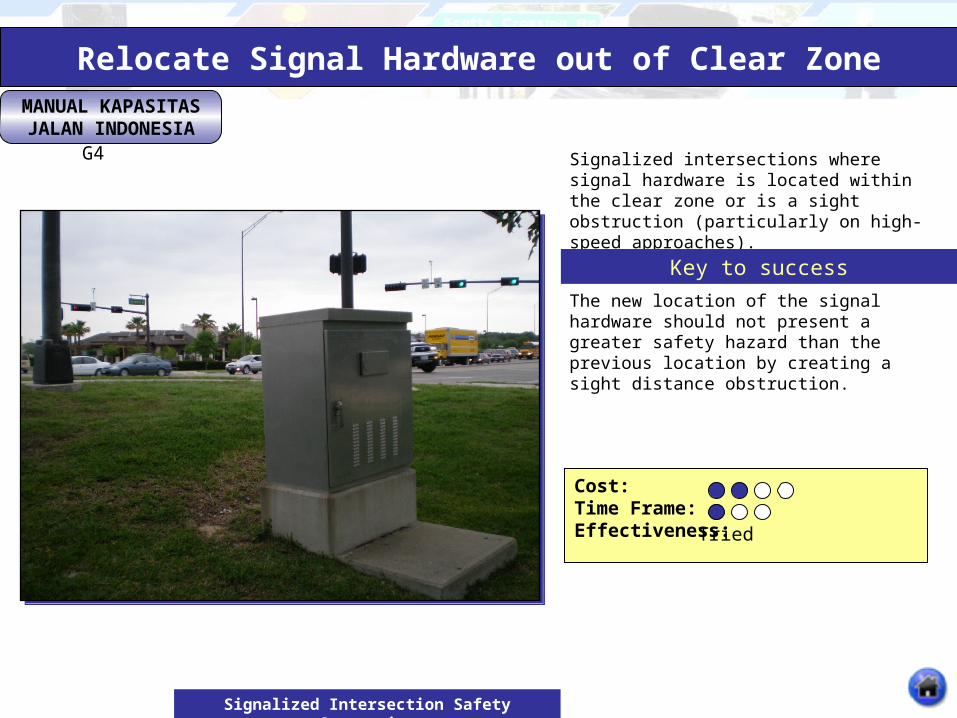
Relocate Signal Hardware out of Clear Zone
G4
Tried
Signalized intersections where signal hardware is located within the clear zone or is a sight obstruction (particularly on high-speed approaches).
The new location of the signal hardware should not present a greater safety hazard than the previous location by creating a sight distance obstruction.
Key to success
MANUAL KAPASITAS JALAN INDONESIA
Signalized Intersection Safety Strategies
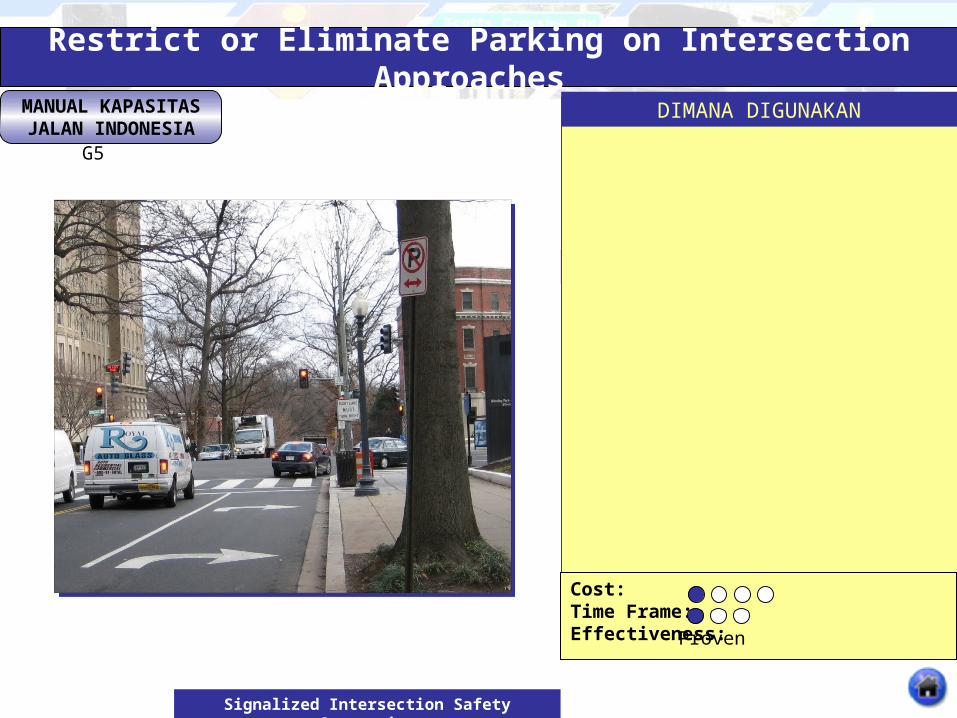
Restrict or Eliminate Parking on Intersection Approaches
G5 Signalized intersections with permitted parking on the approaches that may present a safety hazard either by blocking sight distance or due to parking maneuvers.
Parking regulation signs need to be posted conspicuously. Consistent and rigorous enforcement of these regulations is necessary as well. Working with owners of adjacent properties to communicate the reasons for prohibiting parking is also essential to achieving success.
Key to success
DIMANA DIGUNAKAN
Cost:Time Frame:Effectiveness: Proven