Embed Size (px)
Citation preview
PROCEEDINGS, 41st Workshop on Geothermal Reservoir Engineering
Stanford University, Stanford, California, February 22-24, 2016
SGP-TR-209
1
Simple Method to Use Spectral Remote Sensing Data in Geothermal Exploration
Glenn Melosh
2685 Sunrise Ave. Santa Rosa, CA 95409
Keywords: Remote Sensing, Alteration, Exploration
ABSTRACT
Several methods that apply remote sensing data to geothermal exploration were compared in Chile. Recommendations based on these
tests include use of immediately available, low-cost or free ASTER (Advanced Spaceborne Thermal Emission and Reflection
Radiometer) data, application of classification processing in easily-used, free Multispec software, performance of processing,
interpretation, and field checks by a general geothermal geologist, and field mapping of alteration. Data types in the test were limited to
low cost data including air photos, Landsat, and ASTER data with the intent to escalate to more expensive, higher spectral resolution
data depending on selection of a methodology and demonstration of efficacy. Escalation was not expected to be cost-effective based on
this test. Data were obtained, processed, and applied to exploration in three field areas, Puchuldiza, Alitar, and Tolhuaca. Processing
methods applied standard mineral industry advanced processing, expert custom processing using a variety of approaches, collection of
field spectra and visual inspection of samples, expert interpretation, and simple classification. Results helped locate areas to field check
for alteration. Comparisons of data types, methods, and results as applied to Tolhuaca, Chile are reported here.
1. INTRODUCTION
Use of air photos and other remote image data to identify hydrothermal alteration is a well-established method in mineral exploration.
A range of data types, scanners for field spectrum validation, software, and specialized expertise are available to successfully help
identify mineral deposits (e.g. CSIRO, 2015).
Application of this method to geothermal exploration is less effective due to the low grade, limited area, and scattered distribution of
surface-exposed alteration associated with an active hydrothermal system. Interpretation suffers from geologic noise associated with
stronger signals from older, better exposed, extinct hydrothermal systems, original rock type variation that affects alteration mineralogy,
weathering, and vegetative cover. Weathering is problematic for identification of argillic alteration because they both produce smectite
clays. Vegetative cover can obscure mineral-based alteration reflections, even though vegetation can also provide its own alteration
signal.
Geologic noise in images produced for geothermal exploration limits application of these data to providing support for planning of field
alteration mapping. Historically the data, software, and expertise to perform this method have been expensive and time-consuming such
that the method was not cost-effective or timely. Instead geologists commonly used air photos to identify whitish de-vegetated areas
and then surface alteration was identified in the field either during mapping or by geophysical crews. Currently remote sensing spectral
data can often be obtained for free. Low cost and free, easily-used, sophisticated image processing software has also become available.
These tools have been applied in a comparative study of various techniques to help design a method to be applied to geothermal
exploration. The capability of the resultant method to deliver low-cost, easily understood, preliminary results within a day through work
by a general geothermal geologist can create value through timely application to planning for field mapping, geochemical sampling, and
geophysical surveys or supporting later field work to verify whether a conductor that comes to the surface is related to alteration.
2. DATA
Landsat, ASTER, and color air photo data can be freely downloaded from sources on the internet for many areas (including from the
entire USA). The ASTER Volcanic Archive (AVA, http://ava.jpl.nasa.gov/) is particularly useful for geothermal exploration since it
allows easy selection of free data with high spectral and spatial resolution relative to Landsat. The AVA site includes data from 1549
recently active volcanoes worldwide, many with geothermal potential. The catalog includes all of the available images for each volcano
such that high quality, complete data with low cloud cover can be selected. This site has images already processed to identify alteration
for at least 100 of the volcanoes (Mars et al, 2015).
High spectral resolution existing Hyperion data were not available for this test. The shorter history of this satellite limits areas with
available data and cloud-free images. However the method and software proposed here are directly applicable to these data where they
are available. Downloadable EO-1 Hyperion and other data can be sought at http://earthexplorer.usgs.gov/.
Although Google Earth orthophotos can be obtained worldwide, they have been modified to provide a more unified tone. In the test
area described below orthophoto data from a regional environmental study showed better color range and quality than Google Earth
data.

Melosh
2
3. SOFTWARE
Multispec (Purdue Research Foundation) is a free image processing software written and documented by Landgrebe and Biehl (2011).
This package allows image enhancement processing including rescaling color ranges, principle components, band ratios and functions,
and classification on Macintosh or PC-Windows computers with modest capabilities. There are a series of tutorial documents that
provide simple, step-by-step examples of processes.
A single multiband file (or an association of files) of ASTER data is required for classification processing in Multispec. This can be
assembled from the sets of three band files obtained from AVA. The longer wavelength thermal bands have to be resampled in
Multispec to have the same number of pixels as the shorter wavelength data before the files are combined. Knowledge about alteration,
rock types, vegetation types, and other surfaces in the area as well as the visual band image are needed to guide selection of training
areas for classification. Multiple areas can be used to define the spectrum for each class. Usually it takes several attempts to get
training area sets that appear to effectively classify the image. Multispec provides statistics on the classification as well as a probability
image that displays the likelihood that the specific area is the same as the training area of the associated class.
Photoshop Elements is a simplified cousin of Adobe Photoshop. It is capable of more limited enhancement and is restricted to use on
photos. However it can classify color air photo data. This software can be applied without any previous training or tutorials.
PDF Maps (Avenza Systems) is free software for smart phones and tablets that allows display of enhanced images and maps when
formatted as GeoPDF. During field work the GPS capability of a smart phone or tablet will show a current location on the map or
image. This can be very useful when field checking areas with suspected alteration. Although samples can be collected to verify
alteration mineralogy, it is often adequate to determine whether the rock is altered or not based on outcrop or sample visual inspection.
Global Mapper (Blue Marble Geographics) was used to assemble and overlay maps and images for this work and export GeoPDF files.
At about $450 per license it was by far the most expensive software used for this work.
4. COMPARATIVE STUDY
Study of data, software, processing methods, and field techniques was performed on three areas in Chile in the context of a country-
wide geothermal exploration program from 2006 through 2012 by GeoGlobal Energy. This effort was inspired by the limited vegetative
cover and low atmospheric influence due to high elevation in northern Chile but then also applied in southern Chile in a glaciated
prospect above the tree line. Methods developed in Chile have more recently been tested on prospects in Kenya.
The study focused on the use of ASTER data because of the higher data and processing costs of higher spectral resolution airborne data.
The original plan was to extend the technique to higher cost data if it could be justified based on the initial results.
ASTER data were obtained for three prospects in Chile: Puchuldiza, Alitar, and Tolhuaca. Processing was performed differently in each
case and all cases were compared to air photo interpretation and field checked. Unfortunately images from Puchuldiza and Alitar are
not available for this publication, which focuses on publically available data.
Processing methods included:
Method 1: Use standardized processing designed to highlight areas with absorption and reflection patterns of specific alteration minerals
and assemblages. Processing provided by Geoimage (http://www.geoimage.com.au/) was built for the mineral industry, tested in
mineral prospect areas, and applied to Puchuldiza in this comparative study. At Tolhuaca similarly processed results for argillic
alteration are available from the AVA site. In this case the processing was field checked at Shasta and Pico de Orizaba volcanoes (Mars
et al, 2015).
Method 2 Use of an image processing expert to delineate alteration with custom processing based on the statistical characteristics of the
particular ASTER scene and spectral ground-truth scans obtained from altered field samples. A full range of advanced methods were
applied including principle components. At Alitar field spectra were collected using an ASD FieldSpec Spectroradiometer.
Method 3 Use of classification to identify areas with similar spectra using color air orthophoto and ASTER data based on areas with
known altered fumaroles. Classification simply refers to methods that identify what areas look the same across the available spectrum.
The first two methods showed significant noise that required later field checking in spite of the well-established and relatively expensive
methodologies. Field review of interpreted alteration showed that volcanic tuff and lake sediments were commonly mis-identified as
alteration. In all three areas the cost and time required were on the order of one to three thousand dollars and several months. The result
from Mars et al (2015) at Tolhuaca identified only a small amount of alteration. Classification also showed significant noise. The more
elaborate alteration image enhancement (methods 1 and 2) did not provide significant advantages over image classification.
4.1 Tolhuaca, Southern Chile
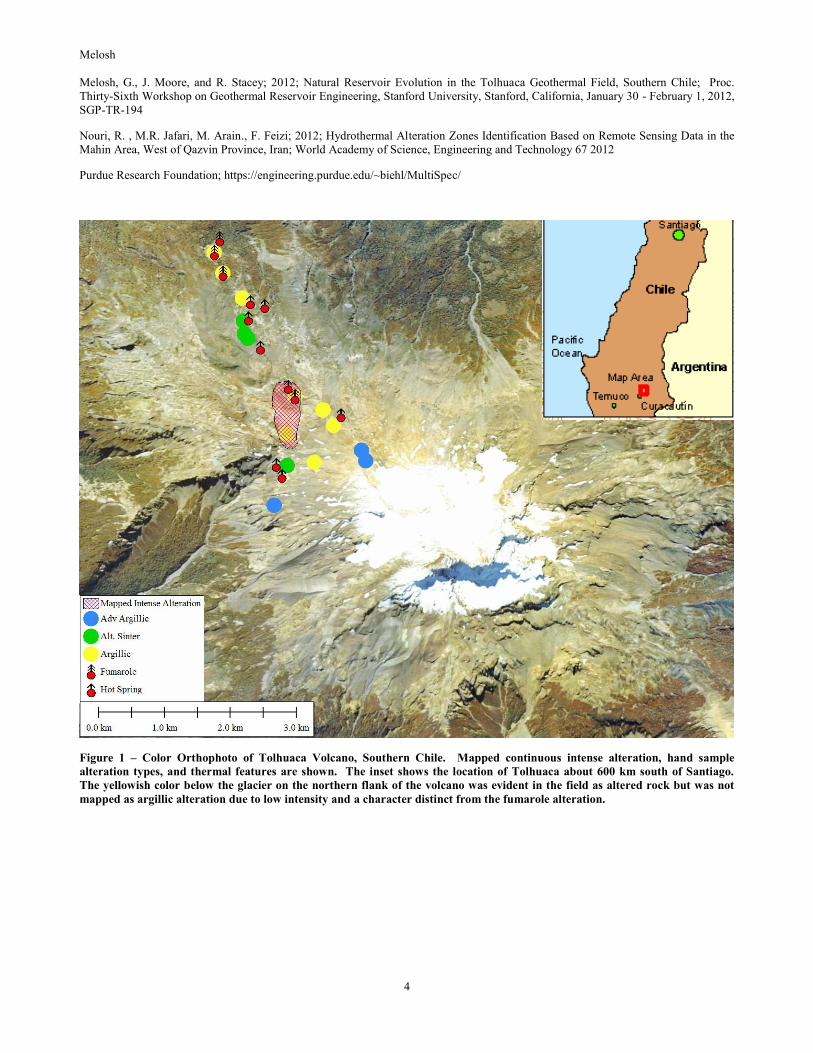
Alteration at Tolhuaca includes intense argillic alteration at the fumaroles with an assemblage characterized by smectite and by areas of
weaker advanced argillic alteration closer to the summit of the volcano (but below the glacier) characterized by alunite and kaolinite
(Figure 1). (All figures are shown after the body of text). Preliminary mapping while sampling the southern fumarole showed an
extensive intense alteration area. Alteration mineralogy types for hand samples from Tolhuaca based on hand sample reflection spectra
are shown in Figure 1. The zonation of argillic to advanced argillic alteration toward the summit on the surface is consistent with
reservoir gas chemical patterns that reveal more strongly magmatic conditions toward the summit (Melosh et al, 2012).

Melosh
3
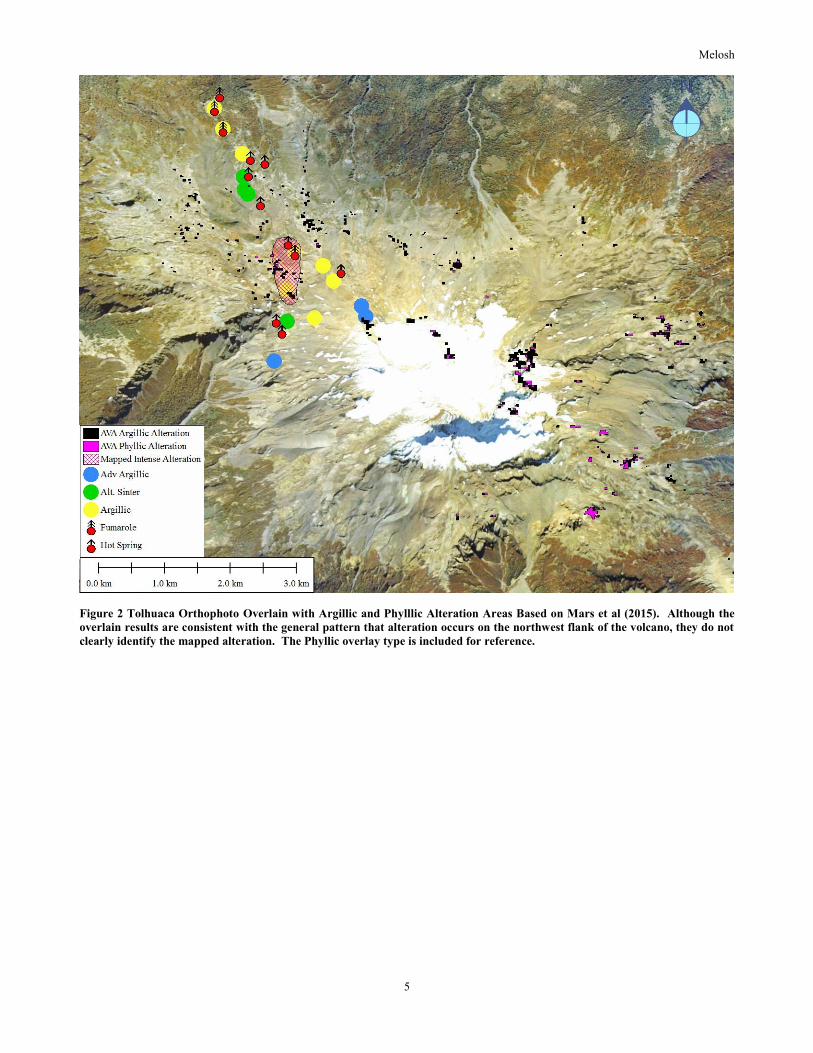
The alteration image from Mars et al (2015) (method 1) for Tolhuaca shows limited areas of alteration identified as either argillic or
phyllic (Figure 2). The overlay from this image does not appear to correlate with known alteration areas although the general pattern
that alteration occurs on the northwest flank of the volcano is evident.
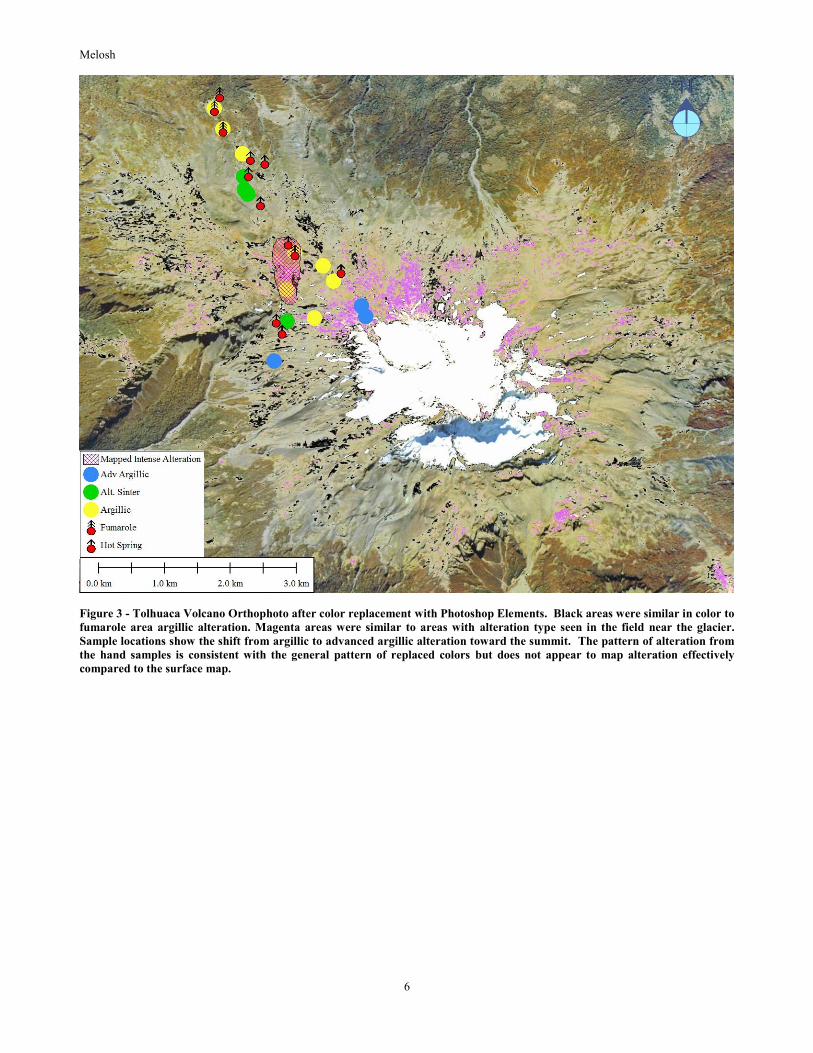
Classification (method 3) initially used the Enhancement/Adjust Color/Replace Color function in Photoshop Elements software on the
air photo (Figure 3). This process was performed twice by selecting training areas first at the fumaroles and then nearer the summit of
the volcano (but below the glacier) because of strong color differences between these areas in the photo. This result also showed the
general pattern of alteration but was otherwise not useful.
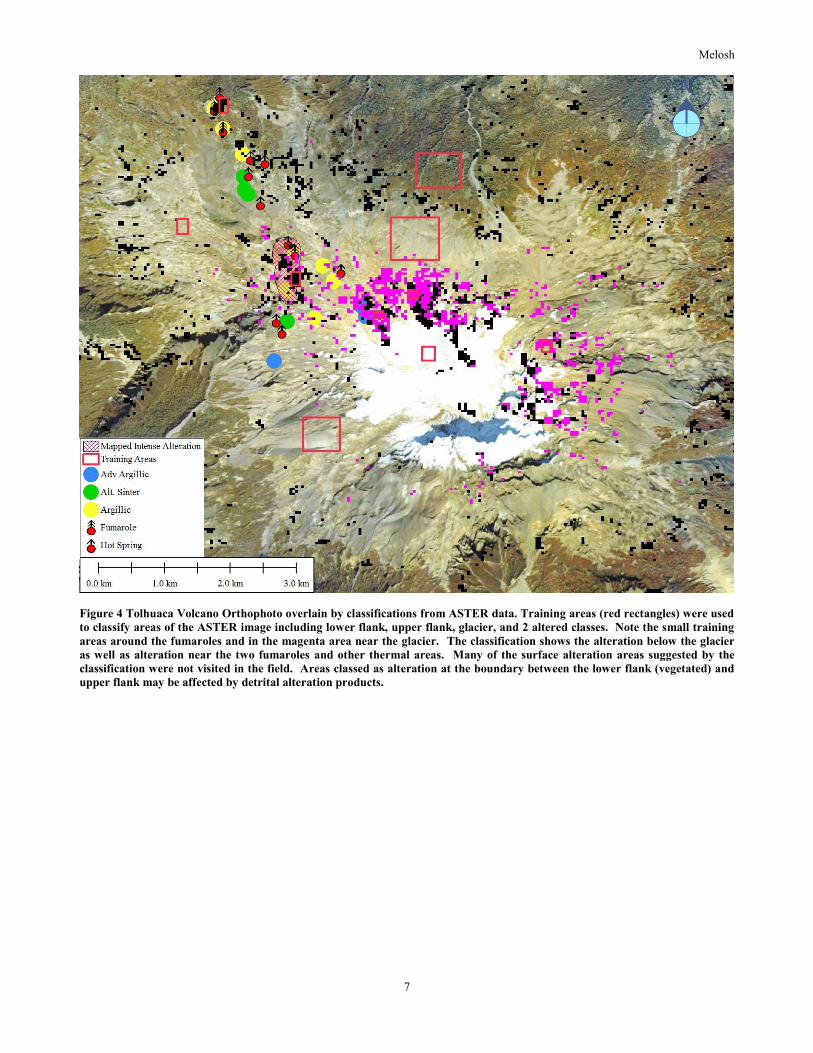
After Multispec software was obtained, classification of an AVA ASTER scene was performed (Figure 4). Two training areas were
selected to represent known alteration types and other training areas were selected to classify the other parts of the image. In this case
the general pattern and alteration preliminarily mapped at the surface were identified.
5. DISCUSSION
ASTER Classification outperformed methods that attempt to identify specific alteration mineral reflections for purposes of geothermal
exploration primarily because the results can be obtained immediately, are simply understood, and can be easily updated to reflect field
checks. Tests at Tolhuaca and other areas show that valuable, albeit limited information can be obtained from this method. In many
cases classification processing can be performed and updated with a limited effort at no external cost.
Although classification of ASTER data is still subject to significant noise including steep slope angles, near surface water, and
vegetation changes it limits noise from vegetative cover, original rock composition, and regional air quality because it is based on
known (and potentially vegetated) alteration in the same image. In addition classification uses the entire available bandwidth, which in
the case of ASTER data includes thermal radiation. Ideally the number and extent of the alteration class areas are small enough to be
checked in a reasonable time in the field as well as large enough to be meaningful to the alteration interpretation. This processing
should be followed by alteration mapping to provide a low noise result
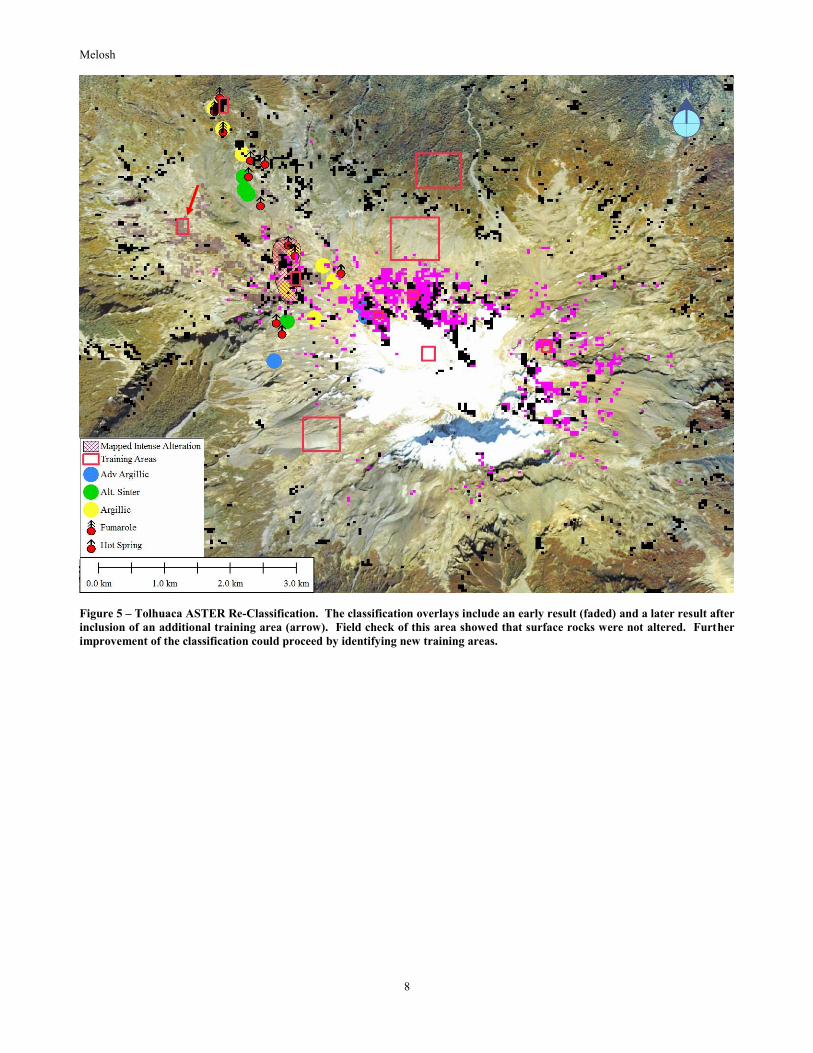
Classification processing provides opportunities to tune the area of the classes. For example Figure 5 shows Multispec classification
results before and after definition of a new training area. This area had been found to be unaltered during a field traverse.
In areas known to contain widespread intense alteration, classification should consider the possibility that these areas are related to an
earlier, eroded, and probably extinct system. Large intense alteration areas might be treated as a separate class.
Classification depends on specific information on the locations of existing thermal areas and is consequently not appropriate for initial
prospect identification. However the spatial extent of an ASTER scene is broad enough that classification from thermal areas in one
prospect might identify alteration nearby to reveal new prospects.
5. RECOMMENDATIONS
ASTER classification based on training areas at thermal features and known alteration should be part of the initial exploration work plan
for any high temperature geothermal prospect when image data is available. Any available existing alteration and geologic maps should
be applied to the initial interpretation.
Field checking should proceed to refine the classification prior to application of the results to geophysical survey planning, alteration
mapping, validation of geophysically-defined surface conductors, or conceptual interpretation.
The images are sensitive to many surface characteristics including rock types, vegetation, and moisture. Selection of an appropriate
classification result depends on knowledge of the field area. Consequently processing should be performed and updated by the area
geologist rather than an office-based GIS engineer.
REFERENCES
Avenza Systems; http://www.avenza.com/pdf-maps
Blue Marble Geographics, http://www.bluemarblegeo.com/products/global-mapper.php
CSIRO; 2015; http://csiro.au/en/Research/MRF/Areas/Mineral-exploration-and-discovery/Exploration-through-cover/ASTER, CSIRO
website
Langrebe, D. and L. Biehl; 2002; MultiSpec—a tool for multispectral–hyperspectral image data analysis, Computers and Geosciences,
Vol 28, Issue 10, pp. 1153-1159
Landgrebe, D. and L. Biehl; 2011; An Introduction & Reference For Multispec;
inhttps://engineering.purdue.edu/~biehl/MultiSpec/MultiSpec_Intro_9_11.pdf
Mars, J., B. Hubbard, D, Pieri, and J. Linick; 2015; Alteration, Slope-Classified Alteration, and Potential Lahar Inundation Maps of
Volcanoes for the Advanced Spaceborne Thermal Emission and Reflection Radiometer (ASTER) Volcanoes Archive; USGS Scientific
Investigations Report 2015-5035, 19 pp.
Melosh
4
Melosh, G., J. Moore, and R. Stacey; 2012; Natural Reservoir Evolution in the Tolhuaca Geothermal Field, Southern Chile; Proc.
Thirty-Sixth Workshop on Geothermal Reservoir Engineering, Stanford University, Stanford, California, January 30 - February 1, 2012,
SGP-TR-194
Nouri, R. , M.R. Jafari, M. Arain., F. Feizi; 2012; Hydrothermal Alteration Zones Identification Based on Remote Sensing Data in the
Mahin Area, West of Qazvin Province, Iran; World Academy of Science, Engineering and Technology 67 2012
Purdue Research Foundation; https://engineering.purdue.edu/~biehl/MultiSpec/
Figure 1 – Color Orthophoto of Tolhuaca Volcano, Southern Chile. Mapped continuous intense alteration, hand sample
alteration types, and thermal features are shown. The inset shows the location of Tolhuaca about 600 km south of Santiago.
The yellowish color below the glacier on the northern flank of the volcano was evident in the field as altered rock but was not
mapped as argillic alteration due to low intensity and a character distinct from the fumarole alteration.
Melosh
5
Figure 2 Tolhuaca Orthophoto Overlain with Argillic and Phylllic Alteration Areas Based on Mars et al (2015). Although the
overlain results are consistent with the general pattern that alteration occurs on the northwest flank of the volcano, they do not
clearly identify the mapped alteration. The Phyllic overlay type is included for reference.
Melosh
6
Figure 3 - Tolhuaca Volcano Orthophoto after color replacement with Photoshop Elements. Black areas were similar in color to
fumarole area argillic alteration. Magenta areas were similar to areas with alteration type seen in the field near the glacier.
Sample locations show the shift from argillic to advanced argillic alteration toward the summit. The pattern of alteration from
the hand samples is consistent with the general pattern of replaced colors but does not appear to map alteration effectively
compared to the surface map.
Melosh
7
Figure 4 Tolhuaca Volcano Orthophoto overlain by classifications from ASTER data. Training areas (red rectangles) were used
to classify areas of the ASTER image including lower flank, upper flank, glacier, and 2 altered classes. Note the small training
areas around the fumaroles and in the magenta area near the glacier. The classification shows the alteration below the glacier
as well as alteration near the two fumaroles and other thermal areas. Many of the surface alteration areas suggested by the
classification were not visited in the field. Areas classed as alteration at the boundary between the lower flank (vegetated) and
upper flank may be affected by detrital alteration products.
Melosh
8
Figure 5 – Tolhuaca ASTER Re-Classification. The classification overlays include an early result (faded) and a later result after
inclusion of an additional training area (arrow). Field check of this area showed that surface rocks were not altered. Further
improvement of the classification could proceed by identifying new training areas.