Embed Size (px)
Citation preview

THIS IS THE TEXT OF AN ESSAY IN THE WEB SITE “THE DISCOVERY OF GLOBAL WARMING” BY SPENCER
WEART, HTTP://WWW.AIP.ORG/HISTORY/CLIMATE. JANUARY 2012. HYPERLINKS WITHIN THAT SITE ARE
NOT INCLUDED IN THIS FILE. FOR AN OVERVIEW SEE THE BOOK OF THE SAME TITLE (HARVARD UNIV. PRESS,
REV. ED. 2008). COPYRIGHT © 2003-2011 SPENCER WEART & AMERICAN INSTITUTE OF PHYSICS.
Simple Models of Climate Change
What determines the climate? Explanations proliferated—models for climate built out of littlemore than basic physics, a few equations aided by hand-waving. All began with a traditionalpicture of a stable system, self-regulated by natural feedbacks. A few nineteenth-centuryscientists suggested that a change in the level of carbon dioxide gas might cause an ice age orglobal warming, but most scientists thought the gas could not possibly have such effects. Yetclimate did change, as proven by past ice ages. Some pointed out that feedbacks did notnecessarily bring stability: in particular, changes in snow cover might amplify rather thandampen a climate shift. In the 1950s, an ingenious (although faulty) model involving changes inthe Arctic Ocean suggested a disturbing possibility of arbitrary shifts. Experiments with fluidsmade that more plausible. Apparently the interlinked system of atmosphere, ice sheets, andoceans could swing in regular cycles or even in random jerks. Worse, around 1970 highlysimplified computer models raised the specter of a catastrophic climate runaway. In the 1980s,the center of research shifted to large and complex computer models. These did not show arunaway, but reinforced what many simpler models had been suggesting: the next century wouldprobably see significant greenhouse warming. Meanwhile the simple models remained useful forexploring questions that the large models could not handle efficiently.
Basic general greenhouse effect ideas and observations are covered in the core essay on TheCarbon Dioxide Greenhouse Effect. Technical calculations on how radiation and heat movethrough levels of the atmosphere are described in a supplementary essay on Basic RadiationCalculations. For the large-scale computer work, see the essay on General Circulation Modelsof the Atmosphere.
BASIC IDEAS, RIGHT AND WRONG - ELEMENTARY PHYSICS (19TH CENTURY) - ARRHENIUS:CARBON DIOXIDE AS CONTROL KNOB - CHAMBERLIN AND THE CARBON SYSTEM - AFUNDAMENTALLY STABLE SYSTEM? - MANY SORTS OF MODELS (1900-1930S) - DISHPAN
EXPERIMENTS - EWING AND DONN’S UNSTABLE CLIMATE - FEEDBACK CATASTROPHES? (1960S) -BUDYKO AND SELLERS - OTHER PLANETS: VENUS, MARS, ICE-AGE EARTH (1970S) - FROM SMALL
MODELS TO BIG COMPUTERS (1980S) - THE PERSISTENCE OF SIMPLE MODELS (1980S) - SIMPLE
MODELS VS. SKEPTICS (1990S-2000S) - A TOOL WITH MANY USES
“This is a difficult subject: by long tradition the happy hunting ground for robust speculation, itsuffers much because so few can separate fact from fancy.” — G.S. Callendar1
Callendar (1961), p. 2.1

Weart DGW 1/12 Simple Models - 2
“Meteorology is a branch of physics,” a weather expert remarked in 1939, “and physics makesuse of two powerful tools: experiment and mathematics. The first of these tools is denied to themeteorologist and the second does not prove of much use to him in climatological problems.” Somany interrelated factors affected climate, he explained, that you couldn't write it all downmathematically without making so many simplifying assumptions that the result would nevermatch reality. It wasn’t even possible to calculate from first principles the average temperatureof a place, let alone how the temperature might change in future years. And “without numericalvalues our deductions are only opinions.”1
That didn’t stop people from putting forth explanations of climate change. A scientist wouldcome up with an idea about how certain factors worked and explain it all in a page or two,helped along by some waving of hands. Some scientists went on to build a few equations andcalculate a few numbers. At best they could show only that the factors they invoked could haveeffects of roughly the right magnitude. There was no way to prove that some other explanation,perhaps not yet thought of, would not work better. These mostly qualitative “theories” (in fact,merely plausible stories) were all anyone had to offer until digital computers came into theirown, late in the 20th century. Until then, the climate community had good reason to keep theoryat arms’ length. Even those who tried to think in general physical terms hesitated to callthemselves “theorists,” an almost pejorative term in meteorology.
The science did have a foundation, at least potentially, in simple ideas based on undeniablephysical principles. The structures that scientists tried to build on these principles were oftencalled “models” rather than “theories.” Sometimes that was just an attempt to hide uncertainty (apaleontologist complained that “‘model’... is just a word for people who cannot spell‘hypothesis’”). But calling a structure of ideas a “model” did emphasize the scientist’s desire to2
deal with a simplified system that one could almost physically construct on aworkbench—something that embodied a hands-on feeling for processes. The great trick ofscience is that you don’t have to understand everything at once. Scientists are not like the peoplewho have to make decisions in, say, business or politics. Scientists can pare down a system intosomething so simple that they have a chance to understand it.
Basic Ideas, Right and Wrong
The first job of a model was to explain, however crudely, the world’s climates as presently seenin all their variety. After all, the main business of climatologists until the mid-20th century wasthe simple drudgery of compiling statistics. Knowledge of average and extreme temperaturesand rainfall and the like was important to farmers, civil engineers, and others in their practicalaffairs—never mind guessing at explanations. But people could not resist trying to explain the
Simpson (1939-40), p. 191.1
Ager (1993), p. xvi.2

Weart DGW 1/12 Simple Models - 3
numbers. A textbook would start off with the main factor, the way sunlight and thus warmthvaries with latitude (perhaps with some calculations and charts). There would follow sections onthe prevailing winds that brought rain, and how mountain ranges and ocean currents could affectthe winds, and so forth. It was all soundly based on elementary physics. It was a dry exercise,however, not so much a theory of climate as a static regional description. 1
Asked about changes in climate, most climatologists at mid-century would think of the extremesthat people should plan for—the worst heat wave to be expected or the “hundred-year flood.” Ifthere was any pattern to such changes, experts believed it would be cyclical. Rather than try tobuild a physical theory, those who took any interest in the question mostly looked to numericalstudies. Perhaps eventually someone would find correlations that pointed to a simple physicalexplanation. The varying number of sunspots, for example, might signal changes in the Sun thatcorrelated with climate cycles.
The simplest and most widely accepted model of climate change was self-regulation, whichmeant that changes were only temporary excursions from some natural equilibrium. Through thefirst half of the 20th century, textbooks of climatology treated climate in a basically staticfashion. The word “climate” itself was defined as the long-term average weather conditions, thestable point around which annual temperature and rainfall fluctuated. After all, in their records2
of reliable observations the meteorologists found only minor fluctuations from decade to decade.These records went back less than a century, but they supposed that one century was much likethe next (aside from changes that took place over many thousands of years, like the ice ages,which were themselves seen as excursions from the very long-term average). Climatologistsexpanded this idea into a “doctrine,” as one critic called it, “that the present causes of climaticinstability are not competent to produce anything more than temporary variations, whichdisappear within a few years.” A leading climatologist put it straightforwardly in 1946: “We can3
safely accept the past performance as an adequate guide for the future.”4
Almost everyone believed in the natural world’s propensity to automatically compensate forchange in a self-sustaining “balance.” If climate ever diverged toward an extreme, before long itwould restore itself to its “normal” state. As evidence, the atmosphere had not changed—or at
A mid-century example of a technical text is Haurwitz and Austin (1944); and a more1
popular work, Hare (1953).
E.g., “By 'climate' we mean the sum total of the meteorological phenomena that2
characterise the average condition of the atmosphere at any one place on the Earth’s surface.”Hann (1903), p. 1; I surveyed a sample of climate literature and textbooks, including, e.g., Blair(1942), pp. 90-94, 100-101; George C. Simpson, preface to Brooks (1922a), pp. 7-8.
Huntington (1914), p. 479.3
Landsberg (1946), pp. 297-98; for the history in general see Lamb (1995), pp. 1-3.4
Weart DGW 1/12 Simple Models - 4
least not extremely radically—over the past half-billion years. And scientists came up with1
plausible regulating mechanisms (some of them are described below). The approach expressed agenerally sound intuition about the nature of climate as a process governed by a complex set ofinteractions, all feeding back on one another. But romantic views that stability was guaranteedby the supra human, benevolent power of Nature gave a false confidence that every feature ofour environment would stay within limits suitable for human civilization. Issues of complexityand stability in the social structure of climate science are explored in a supplementary essay onClimatology as a Profession.
Of course, there was abundant historical evidence of variations lasting a few decades orcenturies, random swings or (as some thought) regular cycles. Perhaps periods of drought likethe American Dust Bowl of the 1930s recurred on some schedule, or perhaps not. Far moreimpressive were the ice ages of the past few million years, undeniable proof that climate couldchange enormously. Looking farther back, geologists found evidence of much earlier ice ages, aswell as periods when most of the Earth had basked in tropical warmth. Understanding thesegreat alterations of the far past posed a fascinating scientific puzzle, with no apparent practicalvalue whatsoever.
Elementary Physics (19th century)
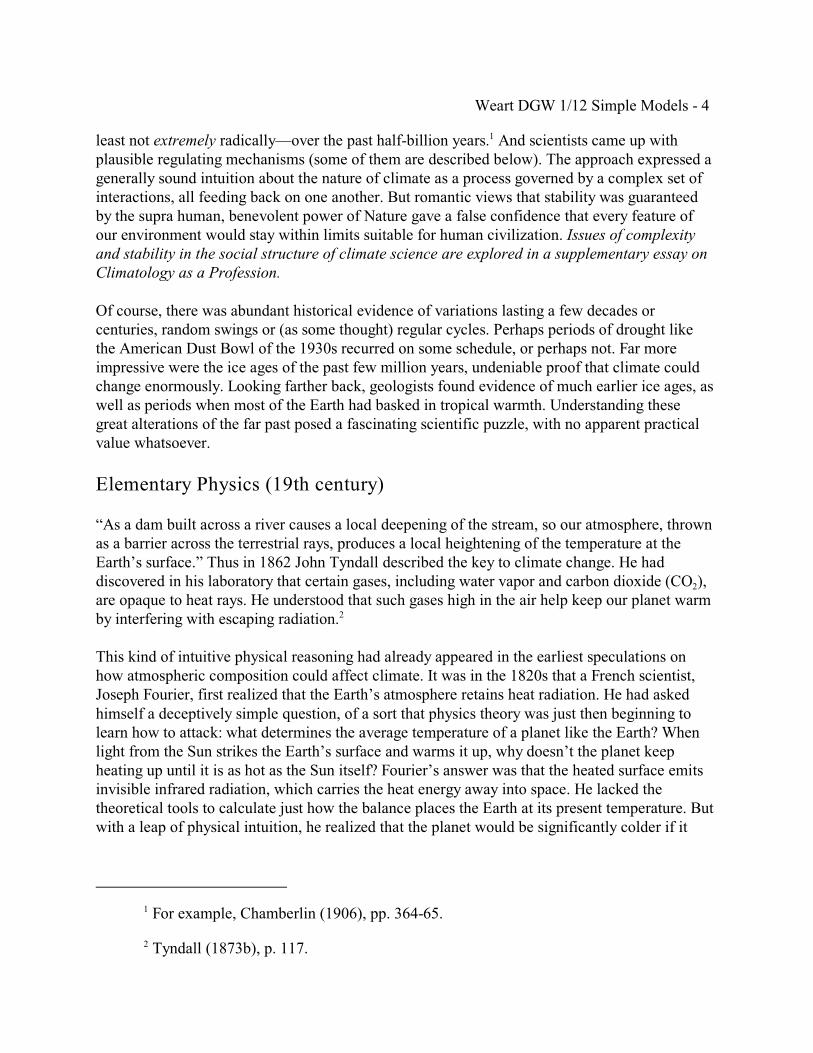
“As a dam built across a river causes a local deepening of the stream, so our atmosphere, thrownas a barrier across the terrestrial rays, produces a local heightening of the temperature at theEarth’s surface.” Thus in 1862 John Tyndall described the key to climate change. He had
2discovered in his laboratory that certain gases, including water vapor and carbon dioxide (CO ),are opaque to heat rays. He understood that such gases high in the air help keep our planet warmby interfering with escaping radiation.2
This kind of intuitive physical reasoning had already appeared in the earliest speculations onhow atmospheric composition could affect climate. It was in the 1820s that a French scientist,Joseph Fourier, first realized that the Earth’s atmosphere retains heat radiation. He had askedhimself a deceptively simple question, of a sort that physics theory was just then beginning tolearn how to attack: what determines the average temperature of a planet like the Earth? Whenlight from the Sun strikes the Earth’s surface and warms it up, why doesn’t the planet keepheating up until it is as hot as the Sun itself? Fourier’s answer was that the heated surface emitsinvisible infrared radiation, which carries the heat energy away into space. He lacked thetheoretical tools to calculate just how the balance places the Earth at its present temperature. Butwith a leap of physical intuition, he realized that the planet would be significantly colder if it
For example, Chamberlin (1906), pp. 364-65.1
Tyndall (1873b), p. 117.2
Weart DGW 1/12 Simple Models - 5
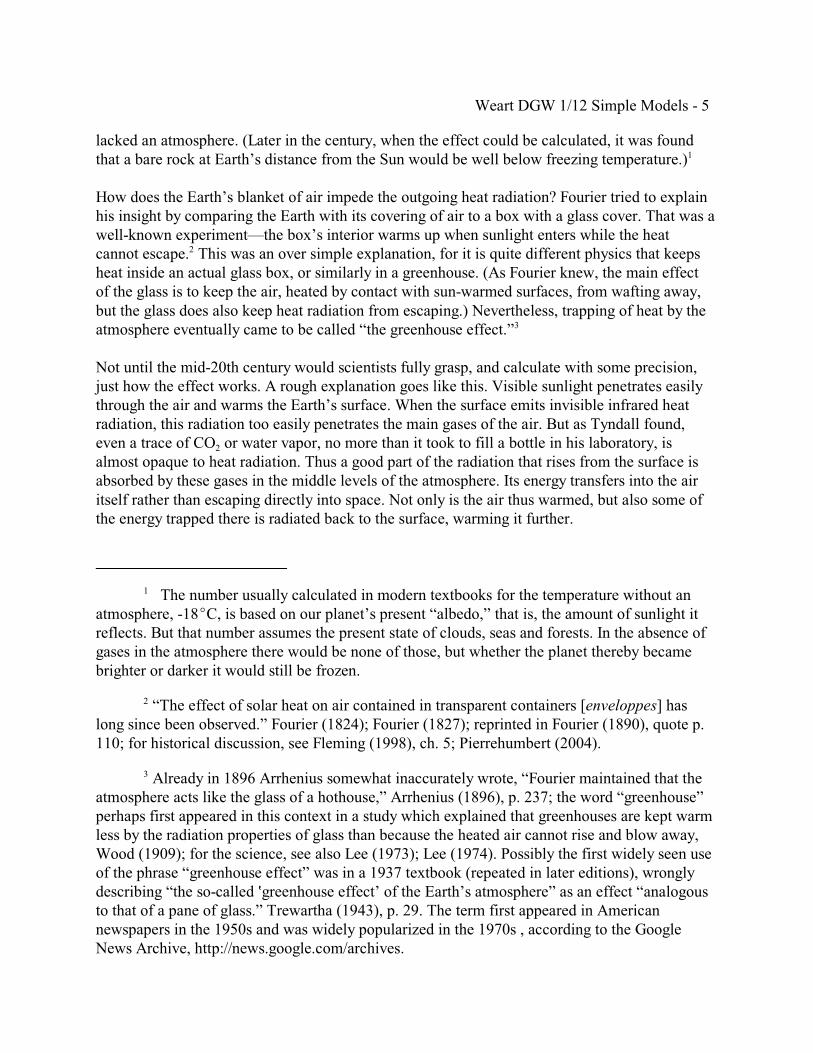
lacked an atmosphere. (Later in the century, when the effect could be calculated, it was foundthat a bare rock at Earth’s distance from the Sun would be well below freezing temperature.)1
How does the Earth’s blanket of air impede the outgoing heat radiation? Fourier tried to explainhis insight by comparing the Earth with its covering of air to a box with a glass cover. That was awell-known experiment—the box’s interior warms up when sunlight enters while the heatcannot escape. This was an over simple explanation, for it is quite different physics that keeps2
heat inside an actual glass box, or similarly in a greenhouse. (As Fourier knew, the main effectof the glass is to keep the air, heated by contact with sun-warmed surfaces, from wafting away,but the glass does also keep heat radiation from escaping.) Nevertheless, trapping of heat by theatmosphere eventually came to be called “the greenhouse effect.” 3
Not until the mid-20th century would scientists fully grasp, and calculate with some precision,just how the effect works. A rough explanation goes like this. Visible sunlight penetrates easilythrough the air and warms the Earth’s surface. When the surface emits invisible infrared heatradiation, this radiation too easily penetrates the main gases of the air. But as Tyndall found,
2even a trace of CO or water vapor, no more than it took to fill a bottle in his laboratory, isalmost opaque to heat radiation. Thus a good part of the radiation that rises from the surface isabsorbed by these gases in the middle levels of the atmosphere. Its energy transfers into the airitself rather than escaping directly into space. Not only is the air thus warmed, but also some ofthe energy trapped there is radiated back to the surface, warming it further.
The number usually calculated in modern textbooks for the temperature without an1
atmosphere, -18EC, is based on our planet’s present “albedo,” that is, the amount of sunlight itreflects. But that number assumes the present state of clouds, seas and forests. In the absence ofgases in the atmosphere there would be none of those, but whether the planet thereby becamebrighter or darker it would still be frozen.
“The effect of solar heat on air contained in transparent containers [enveloppes] has2
long since been observed.” Fourier (1824); Fourier (1827); reprinted in Fourier (1890), quote p.110; for historical discussion, see Fleming (1998), ch. 5; Pierrehumbert (2004).
Already in 1896 Arrhenius somewhat inaccurately wrote, “Fourier maintained that the3
atmosphere acts like the glass of a hothouse,” Arrhenius (1896), p. 237; the word “greenhouse”perhaps first appeared in this context in a study which explained that greenhouses are kept warmless by the radiation properties of glass than because the heated air cannot rise and blow away,Wood (1909); for the science, see also Lee (1973); Lee (1974). Possibly the first widely seen useof the phrase “greenhouse effect” was in a 1937 textbook (repeated in later editions), wronglydescribing “the so-called <greenhouse effect’ of the Earth’s atmosphere” as an effect “analogousto that of a pane of glass.” Trewartha (1943), p. 29. The term first appeared in Americannewspapers in the 1950s and was widely popularized in the 1970s , according to the GoogleNews Archive, http://news.google.com/archives.

Weart DGW 1/12 Simple Models - 6
That’s a shorthand way of explaining the greenhouse effect—seeing it from below, from“inside” the atmosphere. Unfortunately, shorthand arguments can be misleading if you pushthem too far. Fourier, Tyndall and most other scientists for nearly a century used this approach,looking at warming from ground level, so to speak, asking about the radiation that reaches andleaves the surface of the Earth. So they tended to think of the atmosphere overhead as a unit, asif it were a single sheet of glass. (Thus the “greenhouse” analogy.) But this is not how globalwarming actually works, if you look at the process in detail.
What happens to infrared radiation emitted by the Earth’s surface? As it moves up layer by layerthrough the atmosphere, some is stopped in each layer. (To be specific: a molecule of carbondioxide, water vapor or some other greenhouse gas absorbs a bit of energy from the radiation.The molecule may radiate the energy back out again in a random direction. Or it may transferthe energy into velocity in collisions with other air molecules, so that the layer of air where it sitsgets warmer.) The layer of air radiates some of the energy it has absorbed back toward theground, and some upwards to higher layers. As you go higher, the atmosphere gets thinner andcolder. Eventually the energy reaches a layer so thin that radiation can escape into space.
What happens if we add more carbon dioxide? In the layers so high and thin that much of theheat radiation from lower down slips through, adding more greenhouse gas means the layer willabsorb more of the rays. So the place from which most of the heat energy finally leaves the Earthwill shift to higher layers. Those are colder layers, so they do not radiate heat as well. The planetas a whole is now taking in more energy than it radiates (which is in fact our current situation).As the higher levels radiate some of the excess downwards, all the lower levels down to thesurface warm up. The imbalance must continue until the high levels get warmer and radiate outmore energy. As in Tyndall’s analogy of a dam on a river, the barrier thrown across the outgoingradiation forces the level of temperature everywhere beneath it to rise until there is enoughradiation pushing out to balance what the Sun sends in.
While that may sound fairly simple once it is explained, the process is not obvious if you havestarted by thinking of the atmosphere from below as a single slab. The correct way of thinkingeluded nearly all scientists for more than a century after Fourier. Physicists learned onlygradually how to describe the greenhouse effect. To do so, they had to make detailedcalculations of a variety of processes in each layer of the atmosphere. (For more on absorptionof infrared by gas molecules, see the essay on Basic Radiation Calculations.)
Despite Fourier’s exceptional prowess in mathematics and physics, he lacked the knowledge tomake even the simplest numerical calculation of how radiation is absorbed in the atmosphere. A1
few other 19th-century scientists attempted crude calculations and confirmed that at the Earth’s
Fourier admitted that “we are no longer guided in this study [of the temperature effects1
of the atmosphere] by a regular mathematical theory” Fourier (1827) (also in his 1824 paper);reprinted in Fourier (1890), p. 110.
Weart DGW 1/12 Simple Models - 7
distance from the Sun, our planet would be frozen and lifeless without its blanket of air .1
Tyndall followed with rich Victorian prose, arguing that water vapor “is a blanket morenecessary to the vegetable life of England than clothing is to man. Remove for a single summer-night the aqueous vapour from the air... and the sun would rise upon an island held fast in theiron grip of frost.” Tyndall needed no equations, but only simple logic, to see what many since2
him overlooked: it is at night that the gases are most important in blocking heat radiation fromescape, so it is night-time temperatures that the greenhouse effect raises the most.
Arrhenius: Carbon Dioxide as Control Knob
These elementary ideas were developed much further by the Swedish physical chemist Svante
2Arrhenius, in his pioneering 1896 study of how changes in the amount of CO may affectclimate. Following the same line of reasoning as Tyndall, Arrhenius pointed out that an increasein the blocking of heat radiation would make for a smaller temperature difference betweensummer and winter and between the tropics and the poles.
Arrhenius’s model used an “energy budget,” getting temperatures by adding up how much solarenergy was received, absorbed, and reflected. This resembled what his predecessors had donewith less precise physics. But Arrhenius’s equations went well beyond that by taking intoaccount another physical concept, elementary but subtle, and essential for modeling real climatechange. This was what one turn-of-the-century textbook called “the mutual reaction of thephysical conditions”—today we would call it “feedback.”3
An early example had been worked out by James Croll, a self-taught British scientist who hadworked as a janitor and clerk in institutions where he could be near the books he needed todevelop his theory of the ice ages. Croll noted how the ice sheets themselves would influenceclimate. When snow and ice had covered a region, they would reflect most of the sunlight backinto space. Sunlight would warm bare, dark soil and trees, but a snowy region would tend toremain cool. If India were somehow covered with ice (or anything white), its summers would becolder than England’s. Croll further argued that when a region became cooler, the pattern ofwinds would change, which would in turn change ocean currents, perhaps removing more heatfrom the region. Once something started an ice age, the pattern could become self-sustaining.4
Pouillet (1838).1
Tyndall (1863a), pp. 204-05.2
For energy budget models, see Kutzbach (1996). “Mutual reaction:” Hann (1903), p.3
389.
Croll (1875).4
Weart DGW 1/12 Simple Models - 8
Arrhenius stripped this down to the simple idea that a drop of temperature in an Arctic regioncould mean that some of the ground that had been bare in summer would become covered withsnow year-round. With less of the dark tundra exposed, the region would have a higher “albedo”(reflectivity), that is, the ground would reflect more sunlight away from the Earth. That wouldlower the temperature still more, leaving more snow on the ground, which would reflect moresunlight, and so on. This kind of amplifying cycle would today be called “positive feedback” (incontrast to “negative feedback,” a reaction that acts to hold back a change). Such a cycle,Arrhenius suggested, could turn minor cooling into an ice age. These processes were far beyondhis power to calculate, however, and it would be a big enough job to find the immediate effect of
2a change in CO .
Arrhenius showed his physical insight at its best when he realized that he could not set asideanother simple feedback, one that would immediately and crucially exaggerate the influence ofany change. Warmer air would hold more moisture. Since water vapor is itself a greenhouse gas,the increase of water vapor in the atmosphere would augment the temperature rise. Arrheniustherefore built into his model an assumption that the amount of water vapor contained in the airwould rise or fall with temperature. He supposed this would happen in such a way that relativehumidity would remain constant. That oversimplified the actual changes in water vapor, butmade it possible for Arrhenius to roughly incorporate the feedback into his calculations. The
2basic idea was sound. The consequences of adding CO and warming the planet a bit wouldindeed be amplified because warmer air held more water vapor. In a sense, raising or lowering
2 2CO acted mainly as a throttle to raise or lower the really important greenhouse gas, H O.
2Then why pay attention at all to CO , when water was far more abundant? Although Arrheniusunderstood the answer intuitively, it would take a century for it to be explained in thoroughlystraightforward language and confirmed as a central feature of even the most elaborate computermodels. The answer, in brief, is that the Earth is a wet planet. Water cycles in and out of the air,oceans, and soils in a matter of days, exquisitely sensitive to fluctuations in temperature. By
2contrast CO (and other, less important greenhouse gases like methane) linger in the atmospherefor centuries. Thus it is these gases that act as the “control knob” that sets the level of water
2vapor. If all the CO were somehow removed, the temperature at first would fall only a little. Butthen less water would evaporate into the air, and some would fall as rain. With less water vapor(and also less clouds retaining heat at night) the air would cool further, bringing more rain... andthen snow. Within weeks, the air would be entirely dry and the Earth would settle into the frozenstate that Fourier had calculated for a planet with no greenhouse gases.1
“Control knob”: Lacis et al. (2010). They describe “water vapor and clouds as the fast1
feedback processes in the climate system,” whereas the “noncondensing greenhouse gases...provide the stable temperature structure that sustains the current levels of atmospheric watervapor and clouds” (p. 356); in terms of direct effects on radiation, they estimate water vapor
2accounts for about half the greenhouse effect, clouds for about a quarter, CO for 20% and othergreenhouse gases 5%.

Weart DGW 1/12 Simple Models - 9
2It was no simple matter to calculate how changing the level of CO would alter radiation andthus surface temperature, and how that would in turn affect the level of water vapor, and howthat would bring a further cascade of changes until the atmosphere reached a new equilibrium.The numerical computations cost Arrhenius month after month of laborious pencil work as heestimated the energy balance for each zone of latitude. It seems he undertook the massive taskpartly as an escape from melancholy: he had just been through a divorce, losing not only his wifebut custody of their little boy. The countless computations could hardly be justifiedscientifically, given the large uncertainties in the available data—for example, the details of howthe atmosphere absorbs radiation in different regions of the infrared spectrum were largelyunknown. Moreover his model was crude, neglecting a variety of important effects. Neverthelesshe came up with numbers that he published with some confidence.1
“I should certainly not have undertaken these tedious calculations,” Arrhenius wrote, “if anextraordinary interest had not been connected with them.” The prize sought by Arrhenius was2
2the solution to the riddle of the ice ages. He focused on a decrease in CO as a possible cause ofcooling, and found that cutting the level in half could indeed bring an ice age. But he also tookthe trouble to estimate what might happen if the amount of gas in the atmosphere, at somedistant time in the past or future, was double its present value. He computed that would bringroughly 5 or 6 EC of global warming.
This result is not far from the range that scientists would compute a century later using
2vastly better models—the current estimate is that a doubling of CO will bring some 3 degrees ofwarming, give or take a degree or two. Did Arrhenius end up in the same range by sheer luck?Partly, but not entirely. In the sort of simple physics and chemistry calculations where Arrheniushad made his name, you can expect to come out roughly right if you address a powerful physicaleffect in a straightforward way, starting with decent data. The data Arrhenius fed into hiscalculations (based on Samuel P. Langley’s measurements of solar radiation reaching the Earth’ssurface) were mostly in the right range. And Arrhenius included all the obvious physics theory.
But climate is not a simple physical system. A true calculation of greenhouse effect warmingrequires measurements far more accurate and far more complete than Langley’s. The details of
2exactly what bands of radiation are absorbed by CO and water molecules might have happenedto be arranged so as to produce a markedly higher or lower amount of warming. As for theory,Arrhenius’s model planet was mostly static. He deliberately left aside factors he could notcalculate, such as the way cloudiness might change over the real Earth when the temperaturerose. He left aside the huge quantities of heat carried from the tropics to the poles byatmospheric movements and ocean currents, which also might well change when the climatechanged. Most important, he left aside the way updrafts would carry heat from a warmer surface
Arrhenius (1896); see Crawford (1996), chap. 10; Crawford (1997); reprinted with1
further articles in Rodhe and Charlson (1998).
Arrhenius (1896), p 267.2

Weart DGW 1/12 Simple Models - 10
into the upper atmosphere. In 1963, when a scientist made a calculation roughly similar toArrhenius’s, but with the aid of improved data on the absorption of radiation and an electroniccomputer, he found a far greater greenhouse warming—indeed impossibly greater. Arrhenius’s assumptions left out too much that was necessary to get a valid answer.1
Yet Arrhenius understood that he had not overlooked any terribly potent effect. Calculationsaside, since the atmosphere keeps the surface of the Earth warm—in fact, roughly 40EC warmerthan a bare rock at the same distance from the Sun—a few degrees sounded like about the righteffect for a change in the atmosphere that modestly altered the balance of radiation. Arrheniusalso knew that in past geological ages the Earth’s climate had in fact undergone changes of afew degrees up or down, not many tens of degrees nor mere tenths of a degree. While neither
2Arrhenius nor anyone for the next half-century had the tools to show what an increase of COwould really do to climate, he had given a strong hint of what it could possibly do.
Chamberlin and the Carbon System
2A crude idea of how the amount of CO could affect radiation was only the first half of acalculation of global warming. The other half would be a model for figuring how the amount of
2CO itself might change. A colleague of Arrhenius, Arvid Högbom, had already published somepreliminary ideas. Arrhenius’s 1896 paper stimulated an American geologist and bold thinker,Thomas C. Chamberlin, to look into the planet’s carbon system more deeply. In 1897 hepublished “a paper which, I am painfully aware, is very speculative...” The speculations revolvedaround ways that the ice ages might be, as Chamberlin later remarked,“intimately associatedwith a long chain of other phenomena to which at first they appeared to have no relationship.”He was the first to demonstrate that the only way to understand climate change was tounderstand almost everything about the planet together—not just the air but the oceans, thevolcanoes bringing gases from the deep interior, the chemistry of how minerals graduallydisintegrated under weathering, and more.
Chamberlin’s novel hypothesis was that ice ages might follow a self-oscillating cycle driven by
2feedbacks involving CO . Drawing on Arrhenius’s intuition, Chamberlin explained clearly how
2the gas acts as the long-term regulator of the daily atmospheric fluctuations of water vapor. CO ,he noted, was injected into the atmosphere in spates of volcanic activity. It was graduallywithdrawn as it combined with minerals during the weathering of rocks and soil. If the volcanicactivity faltered, then as minerals slowly leached the gas out of the atmosphere, the planet would
If Langley’s measurements had been entirely accurate, Arrhenius would have come1
even closer to the warming given by current estimates, according to Ramanathan and Vogelman(1997). But S. Manabe (personal communication) points out that Arrhenius got reasonableresults in large part because he underestimated the absorptivity of water vapor, and thusunderestimated the crucial influence of water vapor feedback on the heat balance, a feedbackkept within bounds in the real world by the upward convection of heat.

Weart DGW 1/12 Simple Models - 11
cool. Feedbacks could make a temporary dip spiral into a self-reinforcing decline. For one thing,as the land cooled, bogs and the like would decompose more slowly, which meant they would
2lock up carbon in frozen peat, further lowering the amount of CO in the air. Moreover, as theoceans cooled, they too would take up the gas—warm water evaporates a gas out, cold waterabsorbs it. The process would stop by itself once ice sheets spread across the land, for there
2would then be less exposed rock and bogs taking up CO . Reversing the process could bring awarming cycle.1
Chamberlin seemed only to be adding to the tall pile of speculations about ice ages, but alongthe way he had pioneered the modeling of global movements of carbon. He made roughcalculations of how much carbon was stored up in rocks, oceans, and organic reservoirs such asforests. He went on to point out that compared with these stockpiles, the atmosphere contained
2only a minor fraction—and most of that CO cycled in and out of the atmosphere every fewthousand years. It was a delicate balance, he warned. Climate conditions “congenial to life”might be short-lived on geological time scales. Chamberlin quickly added that “This threat ofdisaster is not, however, a scientific argument...” He was offering the idea more for its value “inawakening interest and neutralizing inherited prejudice,” namely, the assumption that theatmosphere is stable. 2
A Fundamentally Stable System?
Other scientists were not awakened. While some admitted that geological processes could alter
2the CO concentration, on any time scale less than millions of years the atmosphere seemed to beunchanging and unchangeable. After all, nearly all of the carbon in Chamberlin’s system waslocked up in sea water and minerals. Any emissions humans might produce seemed a negligible
2addition. The CO model, “recommended to us by the brilliant advocacy and high authority ofProf. T.C. Chamberlin,” did briefly become a popular theory to explain the ice ages and otherslow climate changes of the past—better known, in fact, than Arrhenius’s complicatedcalculation. But within a few years scientists dismissed the entire theory for what seemedinsuperable problems.3
2According to a simple experiment, there was already enough CO in the air so that its effect oninfrared radiation was “saturated”— meaning that all the radiation that the gas could block was
Chamberlin (1897), “speculative” p. 653; see also Chamberlin (1898); Chamberlin1
(1899), “long chain” pp. 546-47; Tolman (1899); Fleming (1998), p. 90; Chamberlin (1923); forChamberlin’s work more generally, Fleming (2000); for Högbom’s contribution, Berner (1995).
Chamberlin (1897), quote p. 655.2
Gregory (1908), quote p. 347; similarly, “one can scarcely study it [the Chamberlin3
model] without profound admiration... Nevertheless, we are unable to accept it in full...,”Huntington and Visher (1922), p. 42; for further background, Mudge (1997).

Weart DGW 1/12 Simple Models - 12
already being absorbed, so that adding more gas could make little difference. Moreover, watervapor also absorbed heat rays, and water was enormously more abundant in the atmosphere than
2 2 2CO . How could adding CO affect radiation in parts of the spectrum that H O (not to mention
2the CO itself) already entirely blocked?
These studies with the crude techniques of the early 20th century were inaccurate. Modern data
2show that even in the parts of the infrared spectrum where water vapor and CO are effective,only a fraction of the heat radiation emitted from the surface of the Earth is blocked before itescapes into space. And that is beside the point anyway. The greenhouse process worksregardless of whether the passage of radiation is saturated in lower layers. As explained above,the energy received at the Earth’s surface must eventually work its way back up to the higherlayers where radiation does slip out easily. Adding some greenhouse gas to those high, thinlayers must warm the planet no matter what happens lower down.
This had been described correctly already in 1901: “radiation from the earth into space does notgo directly from the ground,” Nils Ekholm explained, “but on the average from a layer of theatmosphere having a considerable height above sea-level... The greater is the absorbing power ofthe air for heat rays emitted from the ground, the higher will that layer be. But the higher thelayer, the lower is its temperature relatively to the ground; and as the radiation from the layerinto space is the less the lower its temperature is, it follows that the ground will be hotter thehigher the radiating layer is.”1
Ekholm’s explanation was published in a leading meteorological journal, yet it was almostentirely overlooked. Through the first half of the 20th century, hardly any of the few scientistswho took an interest in the topic thought in this fashion. They were convinced by the subtlyflawed viewpoint that looked at the atmosphere as a single slab. Even Chamberlin concludedthat Arrhenius had failed to get his physics right. After all, was it reasonable to imagine thathumans could alter something as grand as the world’s climate by changing a tiny fraction of theatmosphere’s content? The notion clashed with common ideas that everyone found persuasive.Confident that the climate was self-regulating on any human timescale, scientists readilydismissed Arrhenius’s peculiar speculation about global warming from fossil fuels.
While most people thought it was obvious from everyday observation that the climate was self-regulating, scientists had not identified the mechanisms of regulation. They had several tochoose from.
Through the first half of the 20th century, one common objection to the idea of a future global
2warming was that only a little of the CO on the planet’s surface was in the air. Vastly more waslocked up in sea water, in equilibrium with the gas in the atmosphere. The oceans would absorbany excess from the atmosphere, or evaporate gas to fill out any deficiency. This was a mainreason for dismissing Arrhenius’s speculation about future global warming: the relatively puny
Ekholm (1901).1

Weart DGW 1/12 Simple Models - 13
byproducts of human industry would no doubt be dissolved in the oceans as fast as they were
2emitted. (In fact, at the rate industry was producing CO around 1900 that was a reasonableguess.) “The sea acts as a vast equalizer,” as one scientist wrote, making sure all fluctuations“are ironed out and moderated.”1
If the oceans somehow failed to stabilize the system, there was another large reservoir of carbonstored up in organic matter such as forests and peat bogs. That too seemed likely to provide what
2one scientist called “homeostatic regulation.” For if more CO entered the atmosphere, it would2
act as fertilizer to help plants grow more lushly, and this would lock up the excess carbon in soiland other organic reservoirs.
Beginning in the 1950s, a few scientists attempted to work out real numbers to check the idea.They constructed primitive models representing the total carbon contained in an ocean layer, inthe air, in vegetation, and so forth, with elementary equations for the fluxes of carbon betweenthese reservoirs. These were only one of a number of “bookkeeping” studies, begun early in thecentury and increasingly common by the 1950s, that added up the entire atmosphere’s stock ofheat, energy, and various chemicals. The implicit aim was to balance each budget in an assumedequilibrium. There was little solid data for any of these things, least of all the biological effects.3
2Scientists could easily adjust numbers until their models showed self-stabilization by way of COfertilization, as expected.
2Regardless of the CO budget, scientists expected other feedbacks would regulate the world’stemperature. In particular, any increase of temperature would allow the air to hold moremoisture, where it would create more clouds, which would reflect sunlight away, moderating theheat and doubtless restoring the equilibrium. Such was the view of no less an authority than thePresident of the Royal Meteorological Society, Sir George Simpson, K.C.B., F.R.S. In 1939 heexplained that “the change in the cloud amount is the predominating factor in the regulation ofthe temperature of the atmosphere. The atmosphere appears to act as a great thermostat, keepingthe temperature nearly constant by changing the amount of cloud.” That was about as simple as4
a physical model could get.
Lotka (1924), pp. 222-24.1
Redfield (1958), 221, referring to atmospheric oxygen and other elements but not2
carbon.
Nebeker (1995), pp. 123-24.3
Simpson (1939-40), p. 213; the “rather surprising” conclusion that even a change in4
solar output could be thus compensated was still accepted in 1956 by Rossby (1959), p. 11.

Weart DGW 1/12 Simple Models - 14
Many Sorts of Models (1900-1930s)
Yet climates had undoubtedly changed in the past, and slightly more complicated models wereneeded to explain that. The most widely accepted style of explanation invoked altered “weatherpatterns.” The atmosphere could shift to a different arrangement of winds, lasting decades orperhaps centuries, with different storm tracks and precipitation. Such changes could plausibly becaused by slow geological movements. The raising or lowering of a mountain range wouldobviously alter winds and temperatures, and opening or closing a strait would of course redirectocean currents. Perhaps changes of geography were all that geologists needed to explain the1
major climate changes in the Earth’s history.
These changes would be mostly regional, not global, but many experts thought of climatechanges as mostly local affairs in any case. This view was in line with the traditionalclimatology that explained the current distribution of deserts, rain forests, and ice caps in termsof the location of mountain ranges and warm or cold ocean currents. It was only necessary totake the reasoning about prevailing winds, the tracks followed by storms, and so forth, and applyit to a different geography. The result was what one expert described as “a large amount ofliterature which is both geological and meteorological.” 2
Through the first half of the 20th century, scientific theories on climate change continued torevolve mainly around attempts to explain the ice ages. The explanations by geologicalrearrangements remained the favorite type of theory, “never seriously challenged,” as oneauthority said in 1922. On the other hand, nobody ever made these explanations precise, and3
they remained more a kind of story-telling than useful science.
An important example of work on the topic was an idea developed by the meteorologist AlfredWegener in the 1920s. It happened that Wegener loved geology as much as meteorology (he wasalso dedicated to studies in Greenland, where he disappeared on an expedition in his fiftiethyear). In collaboration with another meteorologist, Wladimir Köppen, Wegener worked throughthe geological evidence of radical climate change. Traces of ancient ice caps were found in rockbeds near the equator, and fossils of tropical plants in rocks near the poles. Wegener hoped toresolve the puzzle with his controversial claim that continents drifted about from tropics toArctic and back. Along the way the two meteorologists worked out a climate change theory.
E.g., deflection of the Gulf Stream by a continent in the Antilles, Hull (1897); glaciation1
from the raising of mountains, Gregory (1908).
Harmer (1925), quote in discussion by Napier Shaw, p. 258.2
Brooks (1922a), p. 23.3
Weart DGW 1/12 Simple Models - 15
They started off from Arrhenius’s idea that the key variable, albedo, depended on whether snowmelted or persisted through the summer. The great sheets of ice that reflected away sunlightcould persist only if they rested on land, not ocean. So the authors figured that the recent epochof ice ages had begun when the North Pole wandered over Greenland, and ice ages had ceasedonce it moved on into the Arctic Ocean.
Wegener and Köppen went into further detail using a theory that had been hanging around sincethe 19th century. Croll had suggested that ice ages could be linked with regular cycles in theEarth’s orbit, the kind of thing astronomers computed. Over many centuries these shifts causedminor variations in the amount of sunlight that reached a given latitude on the Earth. Thevariations gave rise to ice ages, Croll argued, whenever enfeebled sunlight allowed excess snowaccumulation. In the 1920s a Serbian engineer, Milutin Milankovitch, began to develop theseastronomical calculations and plugged them into equations that simulated the global climate. Hisenergy budget model was like Arrhenius’s, but paid closer attention to how much sunlight wasreceived at each latitude in each season, and what that would mean for ice and snow.Milankovitch found that it was summers with weaker sunlight, in other words colder summers,that counted for keeping the reflective snow in place—not cold winters, as Croll had supposed.Wegener and Köppen took up these ideas, insisting that they were “nearly self-evident, and yetcontested by some authors!” 1
From then on, everyone who worked on climate change took into account possible changes inalbedo due to ice and snow in northern latitudes. For example, when G.S. Callendar took up thequestion of greenhouse warming in 1938, in a discussion at a meeting of the RoyalMeteorological Society he noted that in recent decades temperatures had been rising noticeably
2in the Arctic. That led him to suggest cryptically that an increase of CO might be acting “as apromoter to start a series of imminent changes in the northern ice conditions.” 2
Some experts offered more specific elaboration, backed up by a few primitive calculations. Themost striking came from a respected British scientist, C.E.P. Brooks. He argued that once anArctic ice cap formed it would chill the overlying air, which would flow down upon thesurrounding regions. Behind these frigid winds the snows would swiftly advance to lowerlatitudes. Wind patterns would thus redouble the impact of the familiar cooling feedback causedby increasing reflection of sunlight. Only two stable states of the polar climate were possible,Brooks asserted—one with little ice, the other with a vast white cap on the planet. A shift fromone state to the other might be caused by a comparatively slight perturbation, say, a change of
Köppen and Wegener (1924), “fast selbstverständliche und dennoch von einigen1
Autoren angefochtene,” p. 3; Milankovitch published some of his ideas in a work to whichKöppen and Wegener referred, Milankovitch (1920); for the full theory, see Milankovitch(1930); on energy-budget models 1920s-1960s, see Kutzbach (1996), p. 357-60.
Callendar (1938), p. 239.2
Weart DGW 1/12 Simple Models - 16
ocean currents that put a little extra heat into the Arctic Ocean. Such a shift, he warned, might beshockingly abrupt. 1
Scientists were beginning to recognize that feedback might grossly magnify the smallest change.The meteorologist W. J. Humphreys, for one, wrote in Atlantic magazine in 1932 that the currentsituation was close to the conditions where ice sheets had ruled. Thus “we must be just teeteringon an ice age which some relatively mild geologic action would be sufficient to start going.” Asan example, he suggested that if a very wide sea-level canal were built across Panama, currentsflowing through it might shut off the Gulf Stream, bringing “utterly destructive glaciation” toNorthern Europe. Or dust thrown into the air by a series of volcanic eruptions, like the famousKrakatau explosion of 1883, might block enough sunlight to allow the formation of ice sheets.This ice, scientists now understood, might reflect enough sunlight to sustain the cold.
Humphreys also mentioned (following Chamberlin and others) that additional feedbacks couldreduce the main greenhouse gases: colder oceans would evaporate less water vapor into the air,
2and the colder water would also tend to take up more of the “Earth’s blanket” of CO . However,
2like nearly all the scientists of his time, Humphreys did not consider changes in CO particularlyimportant. Believing that adding or subtracting the gas could have little effect on radiation, intheir speculations about climate change they concentrated on volcanic dust, reflective ice sheetsand the like. 2
These models evidently left much room for chance. Some pointed out that ice sheets should beself-sustaining only in certain geological periods, when gross geographical changes such asuplifting of mountain ranges had created a suitable configuration. Even then, Brooks pointedout, “if the Arctic ice could once be swept away, it might find some difficulty in re-establishingitself.” He told a Life magazine reporter in 1950 that the Arctic ice had declined to a “critical3
size” and might no longer be able to chill the air enough to maintain itself. Melting mightincrease, and over centuries the seas might rise by tens of meters. 4
Experts sometimes worked these ideas up in a few equations, but the results were qualitativerather than numerically meaningful. Overall, theory remained in much the same speculative statethat Simpson, as Director of the British Meteorological Office, had criticized back in 1922.Writers on climate, he had said, each pushed their own individual theory, and biased the
Brooks (1925); Brooks (1949), chaps. 1, 8.1
Humphreys (1932); in his well-known textbook, Humphreys flatly denied the2
2greenhouse activity of CO , Humphreys (1940), p. 585.
Brooks (1949), quote. p. 41, see chap. 12; Brooks (1951), p. 1013.3
Coughlan (1950). The cause would be melting of ice on Greenland and other land4
masses, since the melting of floating ice would not change sea level.

Weart DGW 1/12 Simple Models - 17
evidence in their own favor. “There are so many theories and radically different points of view,”he complained, “And new theories are always being propounded.”1
Simpson himself did not resist the temptation to propound a personal theory, which can serve asan example of the general style of argument of the times. In 1937 he pointed out that,paradoxically, an increase of solar radiation might bring on an ice age. The logic wasstraightforward. A rise in the Sun’s radiation would warm the equator more than the poles. Morewater would evaporate from the tropics and the rate of the general circulation of the atmospherewould increase. This would bring more snowfall in the higher latitudes, snow that wouldaccumulate into ice sheets. The albedo of the ice sheets would cool the polar regions, whilewandering icebergs would cool the oceans more broadly. Of course, if the Sun grew brighterstill, the ice sheets would melt. Simpson worked out a complicated model of double-peakedglacial cycles, driven by a supposed long-term cycling in the level of solar radiation. It was no2
more nor less convincing than anyone else’s ideas. At a time when scientists could not explainthe observed general circulation of the atmosphere, not even the trade winds, theories aboutclimate change could be little more than an amusement.
Dishpan Experiments
To wrestle with complex systems, for centuries scientists had imagined mechanical models, andsome had physically constructed actual models. If you put a fluid in a rotating pan, you mightlearn something about the circulation of fluids in any rotating system—like the ocean currents ortrade winds of the rotating Earth. You might even heat the edge of the pan to mimic thetemperature gradient from equator to pole. Various scientists had tried their hand at this fromtime to time since the turn of the century. The results seemed encouraging to the leading3
meteorologist Carl-Gustav Rossby, who invited young Athelstan Spilhaus to join him in such anexperiment at the Woods Hole Oceanographic Institution in the 1930s. In their pan theyproduced a miniature current with eddies. If this represented an ocean, the current would havelooked like the Gulf Stream; if an atmosphere, like a jet stream (a phenomenon not understoodat that time). But they could not make a significant connection with the real world.4
Simpson, preface to Brooks (1922a), pp. 8-9.1
Simpson (1934); Simpson (1937); “ice which enters:” Simpson (1939-40), p. 215;2
Willett (1949) elaborated Simpson’s theory: each solar maximum would produce a single iceage, not two.
References to work by Aitken, Exner, Taylor, Spilhaus, etc. are in Fultz (1949); for a3
historical treatment, see Fultz et al. (1959), pp. 3-5.
A. Spilhaus, interview by Ron Doel, Nov. 1989.4

Weart DGW 1/12 Simple Models - 18
Rossby persevered after he moved to the University of Chicago in 1942 and built up animportant school of meteorologists. His group was the pioneer in developing simplemathematical fluid-dynamics models for climate, taking climate as an average of the weatherseen in the daily circulation of the atmosphere. They averaged weather charts over periods of 5to 30 days to extract the general features, and sought to analyze these using basic hydrodynamicprinciples. The group had to make radical simplifying assumptions, ignoring essential buttransient weather effects like the movements of water vapor and the dissipation of wind energy.Still, they began to get a feeling for how large-scale features of the general circulation mightarise from simple dynamical principles. In the 1950s, Rossby’s students and others moved this1
work onto computers.
Meanwhile, to get another peephole into the physics, Rossby encouraged Dave Fultz and othersto experiment with rotating mechanical systems. Funding came from the Geophysics ResearchDirectorate of the U.S. Air Force, always keen to get a handle on weather patterns. The Chicagogroup started with a layer of water trapped between hemispheres (made by sawing down twoglass flasks). They were delighted to see flow patterns that strongly resembled the Earth’spattern of trade winds, and even, what was wholly unexpected, miniature cyclonic storms. Thegroup moved on to rotate a simple aluminum dishpan. They heated the dishpan at the outer rim(and later also cooled it in the middle), injecting dye to reveal the flow patterns. The results, asanother meteorologist recalled, were “exciting and often mystifying.” The crude, physical2
model showed something rather like the wavering polar fronts that dominate much of the realworld’s weather. 3
Meanwhile a group at Cambridge University carried out experiments with water held betweentwo concentric cylinders, one of which they heated, rotating on a turntable. Their original ideahad been to mimic the dynamics of the Earth’s fluid core in hopes of learning about terrestrialmagnetism. But the features that turned up looked more like meteorology. “The similaritybetween these motions and some of the main features of the general atmospheric circulation isstriking,” reported the experimenter. The water had something like a little jet stream and apattern of circulation that vacillated among different states, sometimes interrupted by “intensecyclones.” It seemed reminiscent of certain changing wind patterns at middle latitudes that4
Rossby had earlier observed in the atmosphere and had explained theoretically with a simpletwo-dimensional mathematical model (the “Rossby waves” seen in the meanderings of the jetstream and elsewhere).
Stringer (1972), p. 10.1
Exciting: Smagorinsky (1972), p. 27.2
Fultz (1949); Fultz (1952); see also Faller (1956); for background Lorenz (1967), p.3
118; Lorenz (1993), pp. 86-94.
Hide (1953).4

Weart DGW 1/12 Simple Models - 19
Following up with his own apparatus, Fultz reported in 1959 the most interesting result of all.His rotating fluid sometimes showed a symmetric circulation regime, resembling the realworld’s “Hadley” cells that bring the regular mid-latitude westerly winds. But at other times thepattern looked more like a “Rossby” regime with a regular set of wiggles. This pattern wassomewhat like the standing waves that form in swift water downstream from a rock (in the realEarth, the Rocky Mountains act as the rock). Perturb the rotating fluid by stirring it with apencil, and when it settled down again it might have flipped from one regime to the other. Itcould also flip between a Rossby system with four standing waves and one with five. In short,different configurations were equally stable under the given external conditions. This was1
realistic, for the circulation of the actual atmosphere shifts among quite different states (thegreat trade winds in particular come and go with the seasons). Larger shifts in the circulationpattern might represent long-term climate changes.
Fultz hoped that this kind of work would lead meteorologists to “the type of close and fruitfulinteraction between theory and experiment, mostly lacking in the past, that is characteristic ofthe older sciences.” But in fact, fluid theory was wretchedly incapable of calculating the2
behavior of even this extremely simplified model system. Anyway the model was only a crudecartoon of the atmosphere, interesting to be sure, but unable to lead to anything definite aboutour actual planet. The real contribution of the “dishpan” experiments was to show plainly thatthere was a simple physical logic hidden within the complexities of weather, creating regularclimate patterns—albeit disturbingly unstable ones.
The behavior of the physical models reinforced a growing suspicion that it was futile to attemptto model the pattern of global winds on a page of equations, in the way a physicist mightrepresent the orbits of planets. This mathematical research plan, pursued ever since the 19thcentury, aimed to deduce from first principles the general scheme of atmospheric circulation.But nobody managed to derive a set of mathematical functions whose behavior approximatedthat of the real atmosphere. The huge ignorance of scientists was nakedly visible to the public,3
which looked with bemusement on the farrago of simplistic theories that science reporters dugout and displayed in magazines and newspapers.
Ewing and Donn’s Unstable Climate
The most influential new theory was deployed by two scientists at the Lamont GeologicalObservatory in New York, Maurice Ewing and William Donn. They had been interested for
Fultz et al. (1959); Fultz et al. (1964); some of the results are shown in Lorenz (1967),1
see pp. 120-126.
Fultz et al. (1959), p. 102.2
Eliassen and Kleinschmidt (1957) reviews mathematical approaches and their3
frustrations.
Weart DGW 1/12 Simple Models - 20
some time in natural catastrophes such as hurricanes and tsunamis. Provoked by recent1
observations of a surprisingly abrupt end to the last ice age, they sought a mechanism that couldproduce rapid change. Also influencing them was recent work in geology—indications that overmillions of years the Earth’s poles had wandered, just as Wegener had claimed. Probably Ewingand Donn had also heard about speculations by Russian scientists that diverting rivers thatflowed into the Arctic Ocean might change the climate of Siberia. In 1956, all these strandscame together in a radically new idea.2
Our current epoch of ice ages, Ewing and Donn argued, had begun when the North Polewandered into the Arctic Ocean basin. The ocean, cooling but still free of ice, had evaporatedmoisture and promoted a pattern of severe weather. Heavy snows fell all around the Arctic,building continental ice sheets. That withdrew water from the world’s oceans, and the sea leveldropped. This blocked the shallow channels through which warm currents flowed into the ArcticOcean, so the ocean froze over. That meant the continental ice sheets were deprived of stormsbringing moisture evaporated from the Arctic Ocean, so the sheets began to dwindle. The seasrose, warm currents spilled back into the Arctic Ocean, and its ice cover melted. And so, in agreat tangle of feedbacks, a new cycle began. 3
The theory was especially interesting in view of reports that northern regions had beennoticeably warming and ice was retreating. Ewing and Donn suggested that the polar oceanmight become ice-free, and launch us into a new ice age, within the next few thousand years—oreven the next few hundred years.
This theory was provocative, to say the least. “You will probably enjoy some criticism,” acolleague wrote Ewing, and indeed scientists promptly contested what struck many as a far-fetched scheme. “The ingenuity of this argument cannot be denied,” as one textbook authorwrote, “but it involves such a bewildering array of assumptions that one scarcely knows where to
In 1954, they sent foundations a proposal to study geophysical catastrophes, which1
could be “more deadly than wars.” Folder “Donn, William,” Individual Files Series, prelim. box242, Maurice Ewing Collection, Center for American History, University of Texas at Austin.
Ewing and Donn cited in particular 1955 papers on continental drift by S.K. Runcorn.2
According to Lamb (1977), p. 661, the first to recognize that an ice-free Arctic Ocean wouldlead to more snow near the ocean (based on observations of 20th century warm years) and thatthis could lead to onset of glaciation was O.A. Drozdov; the work was not published at once, andLamb cites a later publication, Drozdov (1966).
The process was accelerated because dark, open water absorbed more sunlight. Ewing3
and Donn (1956a); Ewing and Donn (1956b). Besides this albedo effect, which Ewing and Donndid not stress, it was later noted that sea ice is an excellent insulator, so that the air over the iceis tens of degrees colder in winter than if the air were exposed to the water.
Weart DGW 1/12 Simple Models - 21
begin.” Talk about a swift onset of glaciation seemed only too likely to reinforce popular1
misconceptions about apocalyptic catastrophes, and contradicted everything known about thepace of climate change. Critics pointed out specific scientific problems (for example, the straitsare in fact deep enough so that the Arctic and Atlantic Oceans would exchange water even in themidst of an ice age). Ewing and Donn worked to patch up the holes in their theory by invokingadditional phenomena, and for a while many scientists found the idea intriguing, even partlyplausible. But ultimately the scheme won no more credence than most other theories of the iceages. “Your initial idea was truly a great one,” a colleague wrote Ewing years later, “...a2
beautiful idea which just didn’t stand the test of time.” 3
Ewing and Donn’s theory was nevertheless important. Picked up by journalists who warned thatice sheets might advance within the next few hundred years, the theory gave the public for thefirst time a respectable scientific backing for images of disastrous climate change. The4
discussions also pushed scientists to inspect data for new kinds of information. For example, thetheory stimulated studies to find out whether, as Ewing and Donn claimed, the Arctic Ocean hadever been ice-free during the past hundred thousand years (evidently not). These studies includedwork on ancient ice that would eventually provide crucial clues about climate change. Above all,the daring Ewing-Donn theory rejuvenated speculation about the ice ages, provoking scientists tothink broadly about possible mechanisms for climate change in general. As anotheroceanographer recalled, Donn would “go around and give lectures that made everybody mad.But in making them angry, they really started getting into it.”5
Feedback Catastrophes? (1960s)
Norbert Wiener, a mathematical prodigy, had interests ranging from electronic computers to theorganization of animals’ nervous systems. It was while working on automatic control systems forantiaircraft guns during the Second World War that he had his most famous insights. The result
“enjoy”: C. Emiliani to Ewing, 10 Oct. 1956, folder “Ice ages Paper,” prelim. box 52,1
Ewing Papers, University of Texas. Contested: e.g., Schell (1957); “ingenuity” Crowe (1971), p.493.
Typical critiques: Sellers (1965), p. 213; and Crowe (1971), p. 493; Ewing and Donn2
(1958); see also Donn and Shaw (1966).
Wallace Broecker to Ewing, 20 Jan. 1969, “Ewing” file, Office Files of Wallace3
Broecker, Lamont Doherty Geophysical Observatory, Palisades, NY.
e.g., Science Newsletter (1956).4
W. Broecker, interview by Weart, Nov. 1997, AIP; data: e.g., a biologist reported pollen5
evidence that there was no open polar sea in the Wisconsin glacial period. Colinvaux (1964).

Weart DGW 1/12 Simple Models - 22
was a theory, and a popular book published in 1948, on something he called “cybernetics.”1
Wiener’s book drew attention to feedbacks and the stability or collapse of systems. These weretimely topics in an era when electronics opened possibilities ranging from automated factories tonovel modes of social communication and control. Through the 1950s, the educated public gotused to thinking in cybernetic terms. Climate scientists were swimming with the tide when theydirected their attention to feedback mechanisms, whereby a small and gradual change mighttrigger a big and sudden transition.
At the start of the 1960s, a few scientists began to think about transitions between differentstates of the oceans. Study of cores drilled from the seabed showed that water temperaturescould shift more quickly than expected. A rudimentary model of ocean circulation constructedby Henry Stommel suggested that under some conditions only a small perturbation might shiftthe entire pattern of deep currents from one state to another. It was reminiscent of the shifts inthe dishpan fluid models. All this was reinforced by the now familiar concept that fluctuations2
in ice sheets and snow cover might set off a rapid change in the Earth’s surface conditions. 3
Similar ideas had been alive in the Soviet Union since the 1950s, connected to fabulousspeculations about deliberate climate modification—making Siberia bloom by damming theBering Straits, or by spreading soot across the Arctic snows to absorb sunlight. According to theusual ideas invoking snow albedo, if you just gave a push at the right point, feedback would dothe rest. These speculations led the Leningrad climatologist Mikhail Budyko to privatelyadvance worries about how feedbacks might amplify human influences. His entry-point was astudy on a global scale. Computing the balance of incoming and outgoing radiation energyaccording to latitude, Budyko found the heat balance worked very differently in the snowy highlatitudes as compared with more temperate zones. It took him some time, Budyko later recalled,to understand the importance of this simple calculation. It led him to wonder, before almost any4
other scientist, about the potentially huge consequences of fossil fuel burning as well as moredeliberate human interventions.
In 1961, Budyko published a generalized warning that the exponential growth of humanity’s useof energy will inevitably heat the planet. The next year he followed up with more specific, if stillquite simple, calculations of the Earth’s energy budget. His equations suggested that climatechanges could be extreme. In the nearer term, he advised that the Arctic icepack might disappear
Heims (1980); Wiener (1956b); Wiener (1948).1
Stommel (1961).2
E.g., Weertman offered calculations of ice cap instability in support of Ewing-Donn,3
Weertman (1961).
Budyko, interview by Weart, March 1990, AIP. Smagorinsky, interview by Weart,4
March 1989, AIP, credits Budyko for introducing snow-albedo feedback with “hand-waving”.
Weart DGW 1/12 Simple Models - 23
quickly if something temporarily perturbed the heat balance. Budyko did not see an ice-freeArctic as a problem so much as a grand opportunity for the Soviet Union, allowing it to becomea maritime power (although he admitted the longer-term consequences might be lessbeneficial). 1
Even setting aside ice-albedo effects, interest in feedbacks was growing. Improvements in digitalcomputers were the main driving force. Now it was possible to compute feedback interactions ofradiation and temperature along the lines Arrhenius had attempted, but without spending monthsgrinding away at the arithmetic. A few scientists took a new look at the old ideas about thegreenhouse effect. Nobody fully grasped that the arguments about “saturation” of absorption ofradiation were irrelevant, since adding more gas would make a difference in the crucial high,thin layers from which radiation did escape into space. But the way radiation traversed the layerswas attracting increasing scientific attention. As spectroscopic data and theoreticalunderstanding improved, a few physicists decided that it was worth their time to calculate whathappened to the radiation in detail, layer by layer up through the atmosphere. (The details arediscussed in the essay on Basic Radiation Calculations.)
In 1963, building on pioneering work by Gilbert Plass, Fritz Möller produced a model for whathappens in a column of typical air (that is, a “one-dimensional global-average” model). His keyassumption was that the water vapor content of the atmosphere should increase with increasingtemperature. To put this into the calculations he held the relative humidity constant, which wasjust what Arrhenius had done long ago. As the temperature rose more water vapor would remain2
in the air, adding its share to the greenhouse effect.
When he finished his calculation, Möller was astounded by the result. Under some reasonable
2assumptions, doubling the CO could bring a temperature rise of 10EC—or perhaps even higher,for the mathematics would allow an arbitrarily high rise. More and more water would evaporatefrom the oceans until the atmosphere filled with steam! Möller himself found this result soimplausible that he doubted the whole theory. Yet others thought his calculation was worthnoticing. The model, as one expert noted, “served to increase confusion as to the real effect of
2varying the CO concentrations.” 3
Confusion is valuable when it pushes scientists to get a better answer. Möller’s disturbingcalculation was one stimulus for taking up the challenging job of building full-scale computermodels that would take better account of key processes. By 1967 a team in Princeton led bySyukuro Manabe and Richard Wetherald had removed the runaway by adding more realism to aone-dimensional model. They continued to assume constant average relative humidity. But
Budyko (1961); Budyko (1962).1
Möller (1963); Arrhenius (1896), p. 263.2
Eriksson (1968), p. 74.3
Weart DGW 1/12 Simple Models - 24
unlike Möller and nearly everyone else back to Arrhenius, they added equations to show how airheated at the surface would rise to higher, cooler levels in the familiar process of convection:that was what kept the surface temperature from rising indefinitely. Still, it would take anotherdecade or two of hard work before computer models would offer a reasonably convincingsimulacrum of the global climate as it existed, let alone a changing climate 1
Crude models of climate change became common during the 1960s, and some of them showeduncomfortably plausible possibilities for disaster. One reason these drew attention was thatclimate scientists were beginning to admit that there was no such thing as a “normal” climate.By now they had good long-term weather records, and analysis showed that weather patterns didnot always swing back and forth around a stable average. The traditional model of a self-regulating balance of nature was gradually yielding to a picture in which climate continuallychanged. Feedbacks were no longer seen as invariably helpful, ever restoring an equilibrium.Rather, they might push the system into a fatal runaway.
The scientists were not causing a change of attitude so much as reflecting one that was sweepingthrough the world public. Many people were taking up the idea that humanity was liable to bringdown global disaster on itself, one way or another. Crude calculations pointed to ruinousconsequences from the spread of pesticides, radioactive materials, and above all nuclear war.People no longer saw all this as mere science fiction for teenagers, but as plain scientificpossibility.
Alongside the occasional models of spectacular climate catastrophes, scientists continued todevelop more workaday studies of how this or that force or feedback might influence climate.The subject remained a minor out-of-the-way field, salted with individualists who dreamed ofwinning honor by discovering the key to the ice ages or a way to predict droughts. As theDirector of Research of the United Kingdom Meteorological Office remarked in 1963, nobodyhad yet produced a quantitative model that could show even “that the climate of the Earth shouldbe distributed as it is.” Without such a model for the present state of climate, so much the worsefor understanding climate change—any discussion “is necessarily conjectural and inconclusive.”That was no wonder, he pointed out, when even the most basic data, like the Earth’s budget ofincoming and outgoing radiation energy, were known only approximately. “With theory sorudimentary and the data so incomplete... the subject has largely been left as a topic for armchairspeculation.”2
Another expert tallied significant theories about causes of climate change extant in 1960 andcame up with 54 distinct hypotheses. When a colleague looked again in 1968, he found the totalhad mounted to 60. “There is nothing to suggest that an end to the speculation on climaticchange is in sight,” he sighed. “It seems that we have a long way to go before the correct answer
Manabe and Wetherald (1967). Stimulus: cited by Manabe and Wetherald (1975).1
Sutcliffe (1963), pp. 276-78.2
Weart DGW 1/12 Simple Models - 25
can be affirmed.” The few and scattered scientists who tried to do scientific work on climate1
change usually distrusted all the primitive models, including their own. Hardly anyone pursued agiven idea except the author, who usually just presented a paper or two before moving on tomore productive work.
As the 1960s proceeded, scientists found it harder to get any respect at all for a physical modelunless it incorporated at least a few equations and numerical results. Such calculations,
2involving ice sheets or CO or whatever, became increasingly common, even if the product wasoften little better than hand-waving dressed up with graphs. As the power of computers rose,people began to think about building models that would calculate out the whole three-dimensional general circulation of the atmosphere. The main impetus was to predict dailyweather, but some hoped eventually to learn something about climate. The early models did givea recognizable climate, but it was more qualitative than quantitative, no close reproduction ofthe Earth’s actual climate. One problem was that computers were too slow to handle millions ofnumbers in a reasonable time. But a worse problem was pure ignorance of how to build ageneral circulation model. An infinitely fast computer would be no use unless it began with thecorrect equations for complex effects like the way moisture in the air became raindrops orsnowflakes.
Many people preferred to keep on developing simple models of climate instability. Such modelswere easy and satisfying to grasp, and however qualitative and speculative they might be, theyoffered genuine insights. The best of these insights would eventually be incorporated into thegigantic computer models. Meanwhile some climate scientists took advantage of computers in aless expensive and arduous way, putting them to work on simple models and working out thenumbers in minutes instead of weeks.
Budyko and Sellers
Among various simplified models that were written down in a few equations and run through acalculation, the most important was built in the late 1960s by Budyko. He continued to worryabout the climate modification proposals that had concerned Soviet climatologists since the1950s, the grand schemes to divert rivers from Siberia or spread soot over the icepack. Budykoand his colleagues recognized that existing models were far too primitive to predict how suchactivities might alter climate. At first, they tried instead to make predictions using the simplestsort of empirical model. They would study past climates, compiling statistics on what hadhappened during years when the ice pack was a bit smaller, the temperatures a bit warmer, theatmosphere a bit dustier. The way weather patterns had shifted in the past might well indicatehow they would shift in response to future interventions. This resembled the traditional weatherprediction method of “modeling” tomorrow’s weather by looking up maps that represented daysof similar weather in the past. The approach was also a natural extension of traditional
Eriksson (1968), p. 68; the earlier source he cites was Schwarzbach (1963).1

Weart DGW 1/12 Simple Models - 26
climatology, with its piles of statistics and its idea of climate change as a simple question ofchanged weather patterns.
In service of this program, Budyko’s institute in Leningrad had been laboriously compiling oldtemperature figures from around the world. He noticed an apparent correlation over the pastcentury between fluctuations in global temperature and variations in atmospheric transparency,due to dust from occasional volcanic eruptions. Other climatologists reported similar findings inthe late 1960s. Apparently temperature was sensitive to any haze of particles that lingered in theatmosphere. Budyko was well aware of vigorous ongoing debates over the general warmingtrend that had been reported for some regions, and he already expected that human industrywould cause an accelerated warming. Moreover, studying new satellite data on the albedo ofdifferent parts of the Earth, he found dramatic differences depending on snow cover. Combiningthese separate concerns, he worried that a change in sea ice, or a similar feedback mechanism,“can multiply a comparatively small initial change in air temperature created by men’sactivities.”1
To pin down the idea, in the mid 1960s Budyko constructed a highly simplified mathematicalmodel. It was a “zero-dimensional” model that looked at the heat balance of the Earth as awhole, summing up radiation and albedo over all latitudes. When he plugged plausible numbersinto his equations, Budyko found that for a planet under given conditions—that is, a particularatmosphere and a particular amount of radiation from the Sun—more than one state ofglaciation was possible. If the planet had arrived at the present after cooling down from awarmer climate, the albedo of sea and soil would be relatively low, and the planet could remainentirely free of ice. (In particular, as Donn was continuing to insist, once the Arctic Ocean wasfree of its ice pack it would be less likely to freeze over in winter). But the Earth had come to2
the present by warming up from an ice age, keeping some snow and ice that reflected sunlight,and so it could retain its chilly ice caps.
Under present conditions, the Earth’s climate looked stable in Budyko’s model. But not too farabove the present temperatures and snow cover, the equations reached a “critical point.” Theglobal temperature would shoot up as the ice melted away entirely. That would give a uniformlyand enduringly warm planet with high ocean levels, as seen in the time of the dinosaurs. And ifthe temperature dropped not too far below present conditions, the equations hit another criticalpoint. Here temperature could drop precipitously as more and more water froze, until the Earthreached a stable state of total glaciation—the oceans entirely frozen over, the Earth transformedpermanently into a gleaming ball of ice! Budyko thought it possible that our era was one of
Volcanoes: Budyko (1969); his interest in the observed warming is reported by1
Kondratyev (1988), p. 4; quotes and satellite data in Budyko (1972), p. 869.
Donn and Shaw (1966).2
Weart DGW 1/12 Simple Models - 27
“coming climatic catastrophe... higher forms of organic life on our planet may beexterminated.” 1
Others were on the same trail, independently of Budyko’s work in Leningrad—communicationswere sporadic across the Cold War frontiers. Already in 1964, a New Zealand ice expert, AlexWilson, had offered some thought-provoking if schematic calculations. Antarctic ice sheetsmight be unstable enough to collapse so that icebergs would spread across vast tracts of thesouthern oceans, then melt away, raising and then lowering the Earth’s albedo. He proposed thatthis “provides the ‘flip-flop’ mechanism to drive the Earth into and out of an ice age.” The2
following year Erik Eriksson in Stockholm wrote a set of differential equations involvingtemperature and ice cover. The mathematics revealed instabilities that might lead to either “anexplosive growth” or “a very rapid retreat of ice.” As Eriksson explained in a 1965 conferenceon climate change, the system had a “‘flip-flop’ mechanism.”3
That was an extreme example of what the American meteorologist Edward Lorenz had begun tocall “intransitive” effects. Under given external conditions, the atmospheric system could getitself locked into one persistent state or into another and quite different state. The choice mightdepend on only minor variations in the starting-point. These ideas were no doubt provocative,but so blatantly primitive and speculative that few scientists spent much time thinking aboutthem.
What did at last catch attention was the drastic outcome of an energy-budget model published in1969. The author, William Sellers at the University of Arizona, built on Budyko’s and Eriksson’sideas. Rather than attempt another grand but rudimentary global model, Sellers computedpossible variations from the average state of the actual atmosphere, separately for each latitudezone. The model was still “relatively crude,” as Sellers admitted (adding that this wasunfortunately “true of all present models”), but it was straightforward and elegant.Climatologists were impressed to see that although Sellers used equations different fromBudyko’s, his model too could approximately reproduce the present climate—and that it tooshowed a cataclysmic sensitivity to small changes. If the energy received from the Sun declinedby 2% or so, whether because of solar variations or increased dust in the atmosphere, it mightbring on another ice age. Beyond that, Budyko’s nightmare of a totally ice-covered Earth seemed
Budyko (1968); Budyko (1969), quote p. 618.1
Wilson (1964), p. 148; he pointed out that buildup of the Antarctic ice sheets was one2
of the few features of the Earth with a time constant that might match the long Milankovitchperiods, Wilson (1969).
The model was only mentioned casually at the conference, not as the main point of3
Eriksson’s presentation, was not published until 1968, and attracted little notice aside fromhelping to stimulate Sellers’ work. Eriksson (1968), “flip-flop” p. 77.
Weart DGW 1/12 Simple Models - 28
truly possible. At the other extreme, Sellers suggested, “man’s increasing industrial activitiesmay eventually lead to a global climate much warmer than today.” 1
The striking results published by Budyko and Sellers kindled increased interest in simplemodels. While some scientists gave them no credence, others felt that such models werevaluable “educational toys”—a helpful starting point for testing assumptions, and for identifyingspots where future work could be fruitful. But did the Budyko-Sellers catastrophes reflect real2
properties of the global climate system? That was a matter of brisk debate. 3
Other Planets: Venus, Mars, Ice-Age Earth (1970s)
In the early 1970s, some scientists did find it plausible that feedbacks could build up acontinental ice sheet more rapidly than had been supposed, as Ewing continued to insist. Otherclimate experts consistently rejected the idea. Aside from specific details, many continued todoubt the basic picture of a climate sensitive to small perturbations. For example, a 1971climatology textbook pointed out that the Arctic Ocean occupied less than 5% of the globe’ssurface, and asked, “Is it not inherently improbable that the freezing and thawing of this surfaceshould have major repercussions over the whole globe?” Whether such magnified consequences4
were truly improbable got different answers from different scientists. Some went so far as totake seriously the idea offered by C.E.P. Brooks back in the 1920s, that thanks to feedback,frigid winds sweeping down from snow fields could move the snowline rapidly southward yearby year. Such a runaway freeze might possibly be triggered soon, according to some, as smog5
and smoke emitted by human industry increasingly shaded the Earth. 6
The opposite extreme—a self-sustaining heating of the planet—might be even morecatastrophic, according to another set of calculations from simplified equations. In the early1960s, telescope measurements had revealed that the planet Venus was at a temperature far
2above the boiling point of water. A dense blanket of water vapor and CO maintained aferociously strong greenhouse effect. The furnace-like conditions not only kept water vaporized
Sellers (1969), quote p. 392, “rapid transition to an ice-covered Earth” p. 398.1
Robinson (1971), pp. 209, 214; cited with approval e.g. by Schneider and Dickinson2
(1974).
Budyko (1972); Sellers (1973); North (1975).3
Crowe (1971), p. 493.4
Ives (1957); see also Ives (1958); Ives (1962); wind feedback: Lamb and Woodroffe5
(1970).
Rasool and Schneider (1971); Lockwood (1979), p. 162.6
Weart DGW 1/12 Simple Models - 29
2in the atmosphere but also kept the CO there, for the hot surface minerals would not absorb thegas. The system was thus self-perpetuating. Perhaps Venus had originally been similar to theEarth, only just enough warmer to begin evaporating gases into its atmosphere—greenhousegases that had produced further warming, and so forth. If so, the end had been a “runawaygreenhouse.” According to one calculation, the Earth would need to be only a little warmer forenough water to evaporate to tilt the balance here as well. If our planet had been formed only 6%closer to the Sun, the authors announced, “it may also have become a hot and sterile planet.”This was published in 1969, the same time as the work of Budyko and Sellers. 1
By 1971, the risks to climate were under vigorous discussion in the small community of climatescientists. When Budyko presided over a large meeting in Leningrad, a rare occasion when mostof the leading American, Western European and Soviet experts all met together, he put the issueto them forcefully. At the conclusion of the conference, where the organizer would traditionallysum up with some bland remarks, “Instead of general words,” Budyko recalled, “I presented inshort form an idea which proved to be absolutely unacceptable to everybody: the idea that globalwarming is unavoidable... The result was a sensation. Everybody had very strong feelings, andextremely unfavorable... A few very prominent men said, first, that it was absolutely impossibleto have any [effect] of man’s activity on the climate... And absolutely impossible to predict anyclimate change.” It was not pleasant, Budyko later recalled, to present unconventional ideas and2
provoke negative feelings, but the risk to the planet seemed so grave that it was important toprovoke scientists to study the question and find whether the ideas were valid.3
Budyko was not in fact alone in his concerns. They were taken up in an influential report (the“SMIC report”) as the consensus of a major scientific meeting held in Stockholm that same year,1971. The experts concluded that there was a possibility that a mere 2% increase or decrease ofsolar radiation, helped by albedo feedback, could leave the planet either totally ice-free or totallyfrozen. Budyko, Sellers, and others pressed ahead, finding that under a variety of simple4
assumptions, any model that gave a good representation of the Earth’s present climate lookedunstable and could just as easily produce a radically different climate. In 1972, Budyko5
Ingersoll (1969); Rasool and de Bergh (1970).1
Symposium on Physical and Dynamical Climatology, as described in Budyko, interview2
by Weart, March 1990, AIP.
Budyko, interview by Weart, March 1990, AIP.3
For support they pointed to semi-empirical studies of the way polar ice had rapidly4
disappeared during the warming of the 1930s. Wilson and Matthews (1971), pp. 125-29; theycite Budyko (1971).
Out of five possible states, “The only completely stable climate is one for which the5
Earth is ice-covered,” according to Faegre (1972), p. 4; “multiple steady states do exist,” and
Weart DGW 1/12 Simple Models - 30
calculated that a mere few tenths of a percent increase in solar radiation input could melt theicecaps. More important still, changing the level of greenhouse gases in the atmosphere wouldhave an effect similar to changing the Sun’s radiation. His model indicated that a 50% increase
2in CO would melt all the polar ice, whereas reduction of the gas by half “can lead to a complete
2glaciation of the Earth.” Budyko went on to note that any changes in CO caused by naturalgeological processes had been overtaken by human activity. At some time “comparatively soon(probably not later than a hundred years)... a substantial rise in air temperature will take place.”As early as 2050, he calculated, the Arctic Ocean’s ice cover could be melted away entirely. 1
Scientists tended to be skeptical about this entire genre of models. A mathematical model likethose of Budyko and Sellers, built out of only a few simple equations, is quite likely to predictsharp changes. The more complex processes of the real world, however, might become saturatedat some point, or react so as to counter any big shift. As one expert later remarked, many in the1970s thought the Budyko-Sellers instability was a nuisance—“an artifact of the idealizedmodels, and the usual approach was to dismiss it or introduce additional ad hoc mechanisms thatwould remove it.” The few who pursued the calculations found no easy way to avoid the2
catastrophic instability, but they understood that it would take a much larger and more completecomputer model to produce credible results. Sellers himself developed a somewhat more3
elaborate model (although it still took only 18 seconds on the computer to work out a year ofclimate change), and again he got a planet that was highly sensitive to perturbations. But headmitted that resolving the question must wait for some future “super-computer.” Besides, in4
the early 1970s the public had become agitated about possible climate shifts, and it could seemirresponsible to talk too loudly about world doom predicted by patently deficient models.
For generations meteorologists had found good reason to dismiss the hand-waving of theorists.Traditionalists did not like to see funds that could be spent gathering empirical data diverted towhat they saw as airy speculation. The disagreement would continue for decades as a graduallyshrinking minority of reputable experts decried all mathematical climate modeling, with orwithout computers, as fundamentally worthless. But the new generation was getting used toworking with a “hierarchy” of models, ranging upward in complexity to intricate computersystems while always beginning with the proverbial “back of an envelope” equations. In a 1972meeting the theorist Stephen Schneider, an advocate of these methods, jokingly introduced a
which one would be found at a given time depended on the previous history, concluded Sellers(1973), p. 253.
Budyko (1972).1
North (1984), p. 3390; see also North (1975), p. 1307.2
North (1984).3
Sellers (1973), p. 241.4

Weart DGW 1/12 Simple Models - 31
simple energy-balance model by scribbling equations on the back of an actual envelope. “Somepeople were laughing,” he recalled, but others “were humorless and hostile.”1
Some senior climatologists, attacking “the glibly pessimistic pronouncements about theimminent collapse of our terrestrial environment,” stuck by their traditional intuitive model ofclimate as a self-regulating system. They continued to expect, for example, that a negativefeedback from cloudiness would stabilize global temperature. But others were taking a new viewof their field. Not only theoretical studies, but a flood of data on past climate changes were hardto reconcile with the old definition of “climate” as a long-term average of weather. An averagemade sense only if you calculated it over a period where things were roughly the same during thefirst half as during the second half. But was there ever such a period? As one prominentclimatologist explained, “it cannot be ruled out... that [climate] varies on all scales of time.” Headmitted that “it can be argued that the very concept of climate is sterile,” unless you gave up“the classical concept of something static.”2
In 1973, studies in wholly different fields brought new credence to the idea that positivefeedbacks could defeat stability, with drastic results. A spacecraft reached Mars and sent backimages with dramatic evidence that although the planet was now in a deep freeze, in the pastthere had been floods of water. Carl Sagan and his collaborators calculated that the planet hadtwo stable states, and ice albedo feedback helped to drive the shift between them. Enormousflips of climate were apparently not a mere theoretical possibility but something that hadactually befallen our neighboring planet. For more on the way studies of other planets3
supported ideas of radical climate change, see the supplementary essay on Mars and Venus.
Another field of study produced even more telling news. By the mid 1970s, analysis of layers ofclay extracted from the seabed gave unassailable evidence that ice ages had come and gone in a100,000-year cycle, closely matching Milankovitch’s astronomical computations of periodicshifts in the Earth’s orbit. Yet the subtle orbital changes in the amount of sunlight that reached4
the Earth seemed far too small to have a direct effect on climate. The only reasonableexplanation was that there were other natural cycles that resonated at roughly the same time-scale. The minor variations of external sunlight evidently served as a “pacemaker” that pinneddown the exact timing of internally-driven feedback cycles.
Schneider (2009) p. 37, see 36-41.1
Senior climatologists: e.g., Kellogg (1971), pp. 131-32; concept of climate: Mitchell2
(1971), pp. 134-35.
Sagan et al. (1973).3
Especially Hays et al. (1976).4
Weart DGW 1/12 Simple Models - 32
What were the natural cycles that fell into step with the shifts of sunlight? The most obvioussuspect was the continental ice sheets. It took many thousands of years for snowfall to build upuntil the ice began to flow outward. A related suspect was the solid crust of the Earth. On ageological scale it was not truly solid, but flowed like tar. The crust sluggishly sagged where thegreat masses of ice weighed it down, and sluggishly rebounded when the ice melted.(Scandinavia, relieved of its icy burden some twenty thousand years ago, is still rising a fewmillimeters a year.) Since the 1950s, scientists had speculated that the timing of glacial periodsmight be set by these slow plastic flows, the spreading of ice and the warping of crustal rock.1
Starting around the mid 1970s, scientists in a variety of institutions around the world, fromTasmania to Vladivostok, devised numerical models that indicted how 100,000-year cyclesmight be driven by feedbacks among ice buildup and flow, with the associated movements of theEarth’s crust, albedo changes, and rise or fall of sea level. They rarely agreed on the details oftheir models, which of necessity included speculative elements. But taken as a group, the2
numerical models made it plausible that ice-sheet feedbacks could somehow amplify even theweak Milankovitch sunlight changes (and perhaps other slight variations too?) into full-blownice ages.
From Small Models to Big Computers (1980s)
Many scientists had converted by now to a new view of climate. No longer did they see it as apassive system responding to the (name your favorite) driving force. Now they saw climate asalmost a living thing, a complex of numerous interlocking feedbacks prone to radical self-sustaining changes. It might even be so delicately balanced that some changes would be“chaotic,” unpredictable. To be sure, many people stuck to earlier views. In 1976 the Director-General of the United Kingdom Meteorological Office told the public that “sensational warningsof imminent catastrophe” were utterly without foundation. “The atmosphere is a robust systemwith a built-in capacity to counteract any perturbation,” he insisted. That was becoming a3
minority opinion.
E.g., Emiliani and Geiss (1959). They emphasize these ideas were not especially1
original with them.
Examples: Weertman (1976a) (Northwestern Univ., IL, and the U.S. Army Cold2
Regions Research and Engineering Laboratory, Hanover, NH); note also his pioneeringcalculation of ice sheet buildup and shrinkage times, Weertman (1964); Sergin (1979)(Laboratory for Mathematical Modeling of the Climate, Pacific Institute of Geography ofAcademy of Sciences, Vladivostok, but written while visiting NCAR, Boulder, CO); Budd andSmith (1981) (Meteorology Dept., U. Melbourne); as a perhaps more typical example, Young(1979) (Antarctic Division, Dept. of Science and Technology, Kingston, Tasmania)conservatively showed a response time of perhaps 20,000 years; an especially influential modelinvolving ice sheet buildup delay was Imbrie and Imbrie (1980); a good review is Budd (1981).
Mason (1977), p. 23; see Gribbin (1976).3

Weart DGW 1/12 Simple Models - 33
While models of ice-albedo and ice-sheet flow gave the most spectacular results, scientistsdeveloped a variety of other simple models. The most important and technically challengingmodels calculated how radiation was transferred through a column of the atmosphere. Theseincreasingly accurate one-dimensional calculations were the underpinning for simplified energy-
2budget models incorporating changes in ice cover, atmospheric CO , and so forth. Such modelsalso provided basic elements to build into the proliferating full-scale computer models of thegeneral circulation.
The huge computer models were taking over the field from simpler models. By the mid 1970s,everyone understood that it was hopeless to try to understand how climate changed by looking atjust one or another feature, or even several features: you had to take into account all the mutuallyinteracting forces at once. Digital computers were reaching a point where they might be able todo just that. Work increasingly concentrated on developing simple models of specific featuresthat could be incorporated as components of more comprehensive models. Some scientistsnevertheless continued to build elementary stand-alone models of various features, using them togarner insights that would be necessary to grasp the full climate system.
The most outstanding difficulty was the intricate problem of clouds. Everyone had assumed withlittle thought that more clouds obviously would reflect sunlight, and necessarily cool the Earth.But in the one-dimensional 1967 calculation mentioned earlier, Manabe and Wetherald hadincluded the way that clouds not only reflected incoming sunlight but also intercepted radiationrising from below. Like greenhouse gases, the clouds could radiate heat back downward—or asone writer put it, “trap” heat on the surface. (After all, it’s common experience that a cloudynight will typically be warmer than a clear one.) Also, by absorbing some of the radiationcoming from above or below, clouds would warm the layer of atmosphere where they floated.Furthermore, as the authoritative 1971 SMIC report noted, a climate change might alter not onlythe amount of clouds but also their average height. The height determined the temperature of thecloud surfaces, which affected how they radiated heat both upward and downward. The authorsconcluded that “clouds could act as a feedback mechanism” responding to global warming, “butthe direction of feedback remains to be determined.”1
In 1972 Stephen Schneider published a suggestive attempt to discuss the complexities in detail.He argued that while a greater amount of cloud cover would lead to net cooling, an increase inthe height of the cloud tops would lead to warming. Overall his model was highly sensitive tosmall changes—not to mention being sensitive to its simplifying assumptions. Further2
rudimentary calculations showed that all sorts of subtle and complex influences woulddetermine whether a given type of cloud brought warming or cooling.
Wilson and Matthews (1971), p. 122.1
Schneider (1972).2

Weart DGW 1/12 Simple Models - 34
Another problem that needed much more work was smoke, dust, and other aerosols. Tinyatmospheric particles not only strongly influenced the formation of clouds, but interacted withradiation on their own. Some observations and primitive calculations showed that aerosols fromvolcanoes, and perhaps from human activity too, would have to be included in any realisticclimate model. By the late 1970s, groups studying aerosols had built simple one-dimensionalmodels and slightly more advanced models that averaged over zones of latitude. The modelsgave important results: the net effect of injecting aerosols would be global cooling.
Confidence in the results was bolstered when James Hansen’s group used a simple model tocompute the temporary cooling caused by the haze from a volcano that had erupted back in1963; their results matched real-world data remarkably well. In particular, the model calculatedthat the higher layer of atmosphere (the “stratosphere”) should temporarily warm up while thelower atmosphere cooled, which was just what had been observed. To be sure, knowledge ofaerosols was so uncertain, and the normal fluctuations in climate were so great, that the volcano“experiment” could not prove anything for certain. “Nevertheless,” as one reviewer commented,“the good agreement is rather satisfying.”1
Another essential problem that people studied in simple models was the circulation of theoceans, which computers could not yet handle as part of a full-scale global simulation. Somemodelers recognized that real understanding of long-term climate change would require modelsthat coupled the atmosphere and oceans. They continued to offer hand-waving models to suggesthow the interaction might behave. For example, in 1974 Reginald Newell offered someprovocative ideas about rapid switching between two distinct configurations for heat transportby ocean currents—yet another way the entire system might lurch unexpectedly. Newell’singenious mechanism involved the spread of sea ice over the ocean, but he noted that there couldalso be important Budyko-style albedo feedbacks, and other effects such as changes in thepattern of winds. His suggestions were “speculative,” Newell admitted, “as indeed are allprevious suggestions concerning the course of the ice ages.” 2
Simple models also remained necessary for studying conditions beyond the range of generalcirculation models. The big computer models had a problem. Any tiny initial error in the physicsor climate data tended to accumulate, adding up through the millions of numerical operations togive an impossible final result. The models gave stable results only when their initial parameterswere adjusted (“tuned”) until the outcome simulated current conditions realistically within agiven range of conditions. Such a model was problematic outside its range.
Examples of useful techniques are Wang and Domoto (1974); Coakley and Chylek1
(1975); volcano: Hansen et al. (1978); reviewed by Ramanathan and Coakley (1978), quote p.484; Charlock and Sellers (1980); Coakley et al. (1983).
Newell (1974), p. 126.2

Weart DGW 1/12 Simple Models - 35
By 1976, a full-scale model had been built that not only simulated current climate but also, withthe addition of continental ice sheets and other readjustments, gave a rough reproduction ofconditions at the peak of the last ice age. (It was good enough to confirm the long-heldassumption that ice and snow albedo were indeed important for sustaining an ice age.) But todynamically compute the whole range of climates as ice ages came and went was far beyond thisor any model’s capacity. By the 1980s, the strangely regular cycles of ice sheet advance andretreat over the past several hundred thousand years were well determined, thanks to coresdrilled from seabeds and icecaps. Scientists who took up the old challenge of explaining thecycles still had no recourse but simple models—a few equations including the time-delay for
2laying down and melting ice sheets, plus feedbacks such as changes in the level of CO in theatmosphere. 1
Going to even more extreme conditions, only simple models could deal with the runawaychanges in temperatures and greenhouse gas concentrations that might make a totally glaciated“snowball Earth.” In the 1980s, this threatening scenario became more credible. It hadincreasingly puzzled computer modelers that their simulations had a strong tendency to wanderinto this mode. Some began to wonder why it had not actually happened. Now geological2
evidence turned up indicating that at least once in the very distant past, the Earth’s oceans reallyhad frozen over, or mostly so.
The Persistence of Simple Models (1980s)
For analyzing climate under current conditions, mammoth supercomputer models took over thefield toward the end of the 1970s. The last great contribution of primitive one-dimensional andtwo-dimensional calculations was to provide a check. The most complex three-dimensionalcomputer models seemed more plausible once they were found to behave much the same as thesimple models. Tests using a variety of small models came up with numbers close to the onesprinted out by the biggest ones. In short, introducing the myriad complexities of a full-scalemodel did not change the plain lesson of global warming contained in the elementary physicsthat stretched back to Arrhenius.
During the 1980s, many scientists came to believe that the Earth was getting warmer. But thatsaid nothing about the cause. A search got underway for “fingerprints”—specific patterns ofclimate change that would either point to the greenhouse effect, or point away from it to someother cause. By 1988, “a number of intriguing candidates are appearing that might be part of afingerprint,” a Science magazine report said, but “no one is claiming a certain identification ofthe greenhouse signal.”3
Pisias and Shackleton (1984).1
Gleick (1987), p. 170.2
Kerr (1988), p. 560.3

Weart DGW 1/12 Simple Models - 36
Whatever the cause of warming, elementary reasoning could predict some importantconsequences. Warming would not mean a slightly higher temperature on every day, but aserious increase in “heat waves,” runs of days of extreme heat—harmful in many ways butespecially to farmers. That was one of the things that attentive journalists picked up from James1
Hansen’s widely reported 1988 testimony to the U.S. Congress: the number of deadly heat waveswould shoot up. Furthermore, a warmer atmosphere would hold more moisture, so it seemed2
likely that the whole grand cycle of weather from evaporation to precipitation would intensify.The effects were debatable, but most experts felt that a warmer world would have worsedroughts, worse floods, and worse storms— possibly all very much worse—although nobodycould say just how bad these disasters could be, let alone where they might strike. 3
A wholly different approach was to “model” the greenhouse world on similar climates of thepast. Paleontologists had traditionally studied rocks and fossils to find whether a region had oncebeen jungle, prairie or desert. In the 1980s, Budyko encouraged Soviet geologists to extend thisline of work into a detailed mapping of the last warm interglacial period, especially in theterritory of the Soviet Union itself. They hoped that this would give an idea of how the world’sclimate map would appear during global warming in the 21st century. This program was largely4
overtaken by much more detailed data deduced from studies of ocean floor mud, data preciseenough to combine with computer models of climate. Still, the Soviet studies did help todemonstrate that a warmer planet was likely to have a very different geographical distribution ofwarm, cold, wet and dry regions than at present.
A completely different group of simple models was meanwhile joining the discussion. It wasessential to understand how biological systems interacted with both global warming and an
2increased CO level. What would changes in gases and temperature and precipitation do toforests, wetlands, and so forth? In particular, what would changes in vegetation mean for the
2emission of methane gas, the absorption of CO or the amount of dust in the air? This wasimportant to climate science because such things could react back on the climate system itself,perhaps in a vicious circle.
Mearns et al. (1984).1
Hansen (1988).2
Hurricanes (50% higher “destructive potential” in future): Emanuel (1987); a trend had3
been detected of greater storminess in the North Atlantic 1962-1988, Carter and Draper (1988);for more recent work, e.g., Knutson et al. (1998); droughts (“severe drought, 5% frequencytoday, will occur about 50% of the time by the 2050s” in the U.S.): Rind et al. (1990); Karl et al.(1995) reported a rise in extreme precipitation events; for debate over whether the hydrologicalcycle will intensify see Ohmura and Wild (2002).
Zubakov and Borzenkova (1990), pp. ix, 5-7.4
Weart DGW 1/12 Simple Models - 37
Most people were more interested in another question: what might climate change mean foragriculture, forestry, the spread of tropical diseases, and other matters of human concern? By theearly 1980s, some scientists found the risk of climate change great enough to justify an effort towork out preliminary answers. Simple models could give at least a rough idea as to how globalwarming might affect, say, the production of wheat in North America. A new area of researchgot underway with the customary features—research grants, conferences, articles ininterdisciplinary journals like Climatic Change.1
Specialists in a variety of fields approached the issues with computer models. They plugged inequations and data on such things as how farmers might be forced to change the crops they grew,or how higher temperatures might affect electricity production or wildlife. “Impact studies,” asthis field came to be called, was rudimentary compared with atmospheric modeling. Theunderlying data came from only a few acres of woods or fields at a few locations, and theequations did not go far beyond hand-waving. Another and even simpler approach was the onepioneered by Budyko’s Leningrad group, finding what the weather had been like in a givenregion during past periods of warmer climate, and asking how such weather might affect modernlife. Here too the data were sketchy, and extrapolation to our own future little more than aguess. What these studies did show was that it was more likely than not that a few degrees of2
warming would have important consequences for both natural ecosystems and human society—mostly nasty consequences.
Nobody would be able to predict precisely how the atmosphere would change, nor what theimpacts of the change would be, without understanding all the interactions. Such studiesrequired expertise in botany or agronomy or sociology as much as in geophysics. The climatescience community dreamed of a grand model computing every factor together, not just thephysics and chemistry but the biology (would trees and grass grow more abundantly and absorb
2extra CO as “fertilizer”?) and economics (would a rise of temperature promote more fossil fuelburning, or less?). Such a comprehensive model lay far in the future. Devising its multitude ofcomponent parts would take many years of development using simple models.
Simple Models vs. Skeptics (1990s-2000s)
There had always been a range of approaches to modeling. At one extreme were people whoaimed for the most realistic and comprehensive maps of climate that could possibly becontrived, building ever more complex systems of parameters. At the other extreme were peoplefascinated by the dynamics of the system, who would rather play around with an idealizedmodel, running it repeatedly while tweaking this or that feature to see what would happen.
For example, Kellogg and Schware (1981); Rosenzweig (1985); Emanuel et al. (1985).1
IPCC (2001), p. 748 includes 1980s references.2

Weart DGW 1/12 Simple Models - 38
Despite the rapid improvement in the huge general-circulation computer models, the lovers ofsimple models continued to find useful things to do.1
For one thing, simple models could lend conviction when critics disputed the incomprehensiblyintricate computer models. As statisticians sought a definitive “fingerprint” to demonstrate thearrival of greenhouse warming, of course they compared their observations with the predictionsfrom big models. But the conclusions seemed more solid when they showed features thatTyndall and Arrhenius had long ago predicted from elementary and ironclad principles. Inparticular, the simplest physical logic said that the blocking action of greenhouse gases would bemost effective where outward radiation was most important for cooling the Earth: warmingwould come especially at night. And indeed a rise in the daily minimum temperature, mainly dueto rising night-time temperatures, was plainly observed world-wide from the 1950s onward. The2
predicted increase in extreme climate events also seemed to be showing up in statistics, at leastfor the United States. Not long after, an increase of heat waves, floods, droughts and otherimpacts long predicted by simple models began to be tentatively observed around the world.3
Other climate changes that could be deduced easily from an enhanced greenhouse effect, but thatwould not follow from other influences, would likewise show up unambiguously in the earlyyears of the 21st century. For example, if extra greenhouse gases in the lower atmosphere wereindeed absorbing radiation coming up from the surface, that should cause a cooling of thestratosphere above these layers. A greenhouse-effect stratospheric cooling was not only plausibleon elementary grounds but was calculated in 1967 by the first widely accepted global computermodel, and all the more elaborate subsequent models. On the other hand, if the observed surfacewarming was due to a more active Sun, or many other possible causes, the atmosphere ought towarm up more uniformly. By the mid 2000s a stratospheric cooling was unequivocally observed:an unmistakable fingerprint of greenhouse-effect warming.4
No less persuasive, Arrhenius and everyone since had calculated that the Arctic must warm morethan other parts of the globe. The main reason was that even a little warming would melt someof the snow and ice, exposing dark soil and water that would absorb sunlight. Enhanced Arcticwarming was a solid feature of models from the simplest hand-waving to the most sophisticated
Dalmedico (2007), p. 138.1
Karl et al. (1986); Karl et al. (1991); Easterling et al. (1997). More studies are being2
published every year. Warming should likewise be seen more in winter than in summer, andthere are some indications this is happening.
Karl et al. (1996). More recent work is summarized in IPCC (2007a) and IPCC (2007c).3
Predicted: Manabe and Wetherald (1967); confirmed: e.g., Thompson and Solomon4
(2005).

Weart DGW 1/12 Simple Models - 39
computer studies. And in fact, it was in places like the Arctic Ocean, Scandinavia, and Siberia1
that global warming became most noticeable in the 1990s. The area of ocean covered by icedeclined sharply, so did the thickness of the icepack, treelines moved higher, and so forth.Studies mustering large amounts of data from around the Arctic showed that the 20th-centurywarming far exceeded anything seen for at least the past 400 years. Humanity’s “large scale2
geophysical experiment,” as Roger Revelle had called it back in 1957, was producing dataalmost as if we had put the Earth on a laboratory bench to observe the effects of addinggreenhouse gases. The data uniformly confirmed the basic theories.
These “fingerprints” of the greenhouse effect, combined with more elaborate computer studiesand with the evident global surface temperature rise, did much to convince scientists andattentive members of the public that global warming was underway. Nevertheless, as a fewcritics pointed out, the pattern of modest temperature rise might be caused by other influences inthe complex climate system. If computer models agreed with old hand-waving arguments, that3
did not alter the fact that the modelers were still far from certain about the interactions withcloudiness and so forth.4
People who doubted that greenhouse warming was truly a problem continued to devise simplemodels of their own. Well into the 21st century, one or another critic (typically a person withsome scientific training but no experience in the climate field itself) would labor through asimplistic calculation and claim it proved that the entire greenhouse warming theory was a sham.One bizarre example was an effort by John Sununu, chief of staff to President George H.W.Bush. He had heard criticism that climate models did not calculate the mixing of heat into theoceans correctly, and therefore grossly overestimated future atmospheric warming. In 1990 heasked one of the government’s top modeling teams to give him a one-dimensional climate modelthat he could run on his Compaq 386 personal computer. “Sununu did not trust our big climatemodels,” recalled Warren Washington, the team’s leader. “He wanted to do the computationshimself within the White House.” The team did their best to give the powerful politician a
The effect is much less in Antarctica, whose thick ice cover is not easily changed.1
Arctic warming is also enhanced by increased transport of heat energy in moisture carried fromlower latitudes, and by thinner sea ice, which allows greater conduction of heat from the ArcticOcean into the air. The first large model to demonstrate polar sensitivity was Manabe andStouffer (1980); a more recent example is Manabe and Stouffer (1993).
Overpeck et al. (1997).2
Singer (1999).3
Wang and Key (2003) subsequently indicated that in fact circulation rather than4
radiation effects predominated in the arctic warming.

Weart DGW 1/12 Simple Models - 40
usable model, but of course in the end he was unable to disprove (or probably even tounderstand) their calculations.1
The best actual scientific criticism came from a respected Massachusetts Institute of Technologymeteorologist, Richard Lindzen. Around 1990 he began to challenge the way modelers allowedfor water vapor feedback. This was the crucial calculation showing how a warmer atmospherewould carry more water vapor , which would in turn amplify any greenhouse effect. Lindzenbelieved the climate system somehow avoided that. He offered an alternative scenario involvingchanges in the way drafts of air carried moisture up and down between layers of the atmosphere.While Lindzen’s detailed argument was complex and partly impressionistic, he said his thinkingrested on a simple philosophical conviction—over the long run, natural self-regulation mustalways win out. His work also became, he confessed, “a matter of being stuck with a role.” Itwas important for somebody to point out the uncertainties.
Few scientists found Lindzen’s technical arguments convincing. Observations suggested that theway the modelers handled water vapor, although far from perfect, was not wildly astray. But itwas only around this time that satellite instruments began to measure with any precision thegreenhouse effect feedback between surface temperature and water vapor, and there was plentyof room to debate how clouds formed and moved water around. It took more than a decade to getobservations that showed convincingly that moisture varied with temperature just as the modelshad predicted—the old assumption of constant relative humidity that all the modelers had usedwas indeed valid. In short, Lindzen’s scenario was flat wrong. If anything, the feedback from2
water vapor appeared to be positive, that is, a bit of extra vapor would accumulate in theatmosphere at higher temperatures, tending to accelerate the greenhouse warming.3
Washington (2007), pp. 96-105.1
Lindzen’s essential argument was that warming would make an increase in tropical2
thunderstorm clouds, whose downdrafts would remove moisture from the upper atmosphere.Lindzen (1990); Kerr (1989a); “stuck with a role,” quoted Grossman (2001); Lindzen has beenaccused of obfuscation, taking extreme ideological positions, and unjust ad hominem attacks,see Gelbspan (1997), pp. 49-54; but the accusation that Lindzen has been in the pay of industryis based only on lecture fees that Lindzen received. For the water vapor argument and other areasof debate with Lindzen, see Hansen et al. (2000a), pp. 154-59. Corrections: Del Genio et al.(1991); Raval and Ramanathan (1989) found that satellite infrared measurements ga ve“compelling evidence for the positive feedback between surface temperature, water vapour andthe greenhouse effect; the magnitude of the feedback is consistent with that predicted by climatemodels;” similarly Rind et al. (1991), p. 500; Sun and Held (1996); and the final nail in thecoffin, Soden et. al. (2005). Gettelman and Fu (2008) give a direct comparison betweenobservations and general circulation models.
Dessler et al. (2008); a brief review is Dessler and Sherwood (2009).3

Weart DGW 1/12 Simple Models - 41
Lindzen remained convinced that all climate models had so many uncertainties that theirfindings were meaningless, and he kept looking for some demonstrable flaw. Taking up the oldidea that a warmer ocean should generate more clouds that would shade the planet, he dug upsome data that tended to support his idea that the climate system thus stabilizes itself. The data,1
however, came only from a limited region of the tropical Pacific Ocean where the effect wasespecially likely to be seen. Hardly any other expert thought Lindzen was right at last.Nevertheless his skepticism served a valuable purpose, provoking efforts to check theassumptions of the models. The results were disappointing for those who hoped clouds wouldsolve the greenhouse problem. By 2010 several studies were published confirming that cloudfeedback was within the range that the models had expected. If anything it seemed to bepositive, that is, tending not to retard but to accelerate global warming. 2
Still, nobody could dismiss out of hand Lindzen’s complaint that computer results were based onuncertain assumptions. Although the models passed many rigorous tests, they also showedsignificant errors, deviating in various details from one another and from the actual climate.Evidently the modelers had not properly represented all the real-world mechanisms. Simplequalitative arguments would continue to be needed for checking the plausibility of any bigmodel.
A Tool with Many Uses
Back-of-the-envelope calculations also continued to be useful for circumstances beyond therange of the big computer models. Tuned to match current conditions, they had a hard timereproducing any situation too different. Above all there was the old problem of explaining iceages—what conditions made a glacial epoch, and within such an epoch just what drove thecyclic ebb and flow of ice? To be sure, modelers could plant an ice cap on the planet and get areasonable simulation of an ice-age climate. But that was a static snapshot, not a dynamicsequence showing what made the ice wax and wane over tens of millennia. The usualcombination of plausible arguments and simple equations was applied in a variety of models,which now incorporated not only ice sheets but also shifts in ocean currents. Although3
computers were starting to become capable of handling full-scale models for the oceancirculation, here too there was still room for simple plausibility arguments.
2Such arguments were also the best way to study the interactions between glaciation and CO . Ice
2core measurements showed that during recent glacial periods, CO and methane had gone up anddown roughly in time with the advance and retreat of the ice. Was the cycle governed not so
Lindzen (1997) Lindzen et al. (2001); Lindzen and Choi (2009).1
Clement et al. (2009); Lauer et al. (2010); Dessler (2010);2
Trenberth et al. (2010) .
For a short review and references, see Broecker and Denton (1989), p. 2486.3
Weart DGW 1/12 Simple Models - 42
much by ice or ocean dynamics as by emissions of gas, as Chamberlin had speculated a centuryback? Perhaps the gases served as an amplifying feedback, released into the atmosphere from1
seas and peat beds as a warm period began? There were so many interactions that a climatemodeler remarked, “I have quit looking for one cause” of the glacial cycle. The mystery of theice ages, which had launched a century of studies of greenhouse gases and climate, remained achallenge.2
Meanwhile the old program of studying ancient climates for hints on future conditions persisted.With computer models disagreeing on how warming would affect specific regions, theexperience of past warm periods might give as good a guess as any. For the planet as a whole,some scientists used paleoclimate data to get a rough idea of the climate’s “sensitivity”—howmuch temperatures had actually changed, under the powerful influences that had operated at onetime or another in the geological past. The results gave useful and encouraging comparisons withgeneral-circulation computer models
3
To get farther with the big models, people continued to construct simpler models of theinteractions between biological systems and gases. Although actual measurements remainedfragmentary, the models of specific processes were improving rapidly. An example (called “oneof the most robust predictions of the new dynamic global vegetation models”) was a calculationthat forests would tend to replace northern tundra as the world warmed. Here, as so often, therewere complex and unexpected consequences. The dark evergreens would absorb much moresolar radiation than the pale tundra, amplifying the global warming. 4
Meanwhile ice cores and other indicators showed that greenhouse gas levels during the 20thcentury were rising much faster than any change detected in the past. Was that why temperatureswere likewise climbing, more rapidly than any warming in the past millennium? The biggeneral-circulation computer models with their millions of numerical operations could notreliably churn through a run of ten centuries. There was no way to keep small initial errors fromaccumulating, a little more each time the model ran through another year, until the wholecomputation veered off into unreality. But a simple energy-balance model could be adjusteduntil it responded smoothly to changes in gases, aerosols, and the like in ways that faithfullymirrored the overall average responses of the big models. Thus modeling came full circle, withlarge computer systems used to calibrate a stripped-down version. The result was some of the
E.g., “the 100,000-year cycle does not arise from ice sheet dynamics.” Shackleton1
(2000).
Kerr (1999), “quit looking:”Andre Berger.2
Kerr (2000b); A landmark work using paeloclimate data to derive sensitivity was3
Hoffert and Covey (1992).
Foley et al. (1994); “robust”: Melillo (1999).4
Weart DGW 1/12 Simple Models - 43
most convincing evidence yet that the greenhouse effect was indeed upon us, rapidly growingmore serious. No matter how you manipulated any sort of model, if you could get it to simulate1
the current climate, it was likely to show warming if you put in greenhouse gases.
By now, some of the “simple” models run on desktop computers were comparable to what hadbeen considered formidable state-of-the-art for the most advanced computations in the 1960s.(Of course, at that time everyone had recognized that those models were primitive). A simplecomputer model could now be run not once but hundreds of times with different parameters. Forexample, you could get around the uncertainties in how the biosphere interacted with climate bybuilding models with boxes for various regions and types of vegetation, then running thesemodels through the entire range of plausible responses in each box. Another example: to addressthe large uncertainties in the parameters used to calculate such things as cloudiness, thousandsof people cooperated to run simplified “screensaver” models using every reasonablecombination of such parameters (nearly all of them produced global warming, and some gotdisastrously warm).2
Simple models—hardly simple by the standards of 1970, but far more comprehensible than theenormous three-dimensional general circulation models—also found increasing use inestimating the impacts of global warming. Specialized models were used, for example, to studyhow the strength or frequency of storms might change. Others evaluated changes alreadyunderway, as when a group calculated that global warming probably had a hand in theunprecedented 2003 heat wave that killed tens of thousands in Europe.3
A desktop-computer model became far more reliable and convincing once it was calibratedagainst a range of different full-scale general circulation models. Then anyone could run itthrough hundreds of scenarios in the time it would take a full model to do just one run. Suchmodels played a major role in the reports that the Intergovernmental Panel on Climate Changeprepared for the world’s policy-makers. For its 2001 report, researchers explored a large numberof different assumptions for how much greenhouse gases humanity might emit over the comingcentury, getting rough predictions for the range of temperature and sea-level changes likely toresult. For its 2007 report the IPCC ordered up an elementary model with one box representingland and one representing ocean in each hemisphere, adjusted so that the exchanges of heat
Crowley (2000).1
Among the simplifications in the distributed model in the initial runs by2
www.climateprediction.net was a “slab” ocean instead of a circulating-ocean model, seeStainforth et al. (2005); Piani et al. (2005) estimate 5th/95th probability percentiles for futurewarming at 2.2 and 6.8 K. Similarly, Andreae et al. (2005) used a one-dimensional model withparameters that began with those from a three-dimensional general circulation model and variedthem within plausible limits, also finding a possibility of extreme warming.
Knutson and Tuleya (2004); Stott et al. (2004).3
Weart DGW 1/12 Simple Models - 44
2between land and oceans, the responses to an increase in CO , and so forth were all similar to theresponses of state-of-the-art computer models The model was then run through a variety ofscenarios for the emissions that humanity might choose to allow in future, mapping out the rangeof likely consequences for different regions. And for the 2009 Copenhagen meeting where theworld’s leaders assembled in a futile attempt to negotiate an agreement on reducing emissions,modelers produced a simulation that could be run on any laptop computer. Plug in one oranother combination of national policies, and you could see roughly what future climate the full-scale models would be expected to calculate. 1
The huge global computer models, ever grander and more complex, represented an approach todealing with the world that some found neither appealing nor convincing. Simple models offereda variety of other approaches, more comprehensible and more easy to verify within their specialdomains. If they were not overlooked in the shadow cast by gargantuan computations, they couldadd flexibility and plausibility to decisions about future policies.2
Related:The Carbon Dioxide Greenhouse Effect Biosphere: How Life Alters Climate Past Cycles: Ice Age Speculations Rapid Climate Change Supplements:Chaos in the Atmosphere Venus & Mars
IPCC (2001), ch. 9; Randall et al. (2007), section 8.8;Tollefson (2009). For another use1
see Wigley (2005). An example of use of an energy balance model calibrated against generalcirculation models is Hegerl et al. (2006).
Shackley et al. (1998).2