Embed Size (px)
Citation preview
Advances in Concrete Construction, Vol. 10, No. 6 (2020) 509-514
DOI: https://doi.org/10.12989/acc.2020.10.6.509 509
Copyright © 2020 Techno-Press, Ltd. http://www.techno-press.org/?journal=acc&subpage=7 ISSN: 2287-5301 (Print), 2287-531X (Online)
1. Introduction
For preliminary blast resistance design, hydro code
based structural analysis is not feasible. Although, hydro
codes, such as AUTODYN (Toy and Sevim 2017; Sevim
and Toy 2020) and LS-Dyna (Hong et al. 2017), are capable
of estimating detailed failure mechanism, they require
severe calculation time and are sensitive to assumed
parameter values. Single Degree Of Freedom (SDOF)
model has been an alternative in the preliminary design
stage (US DoD 2008), where many calculations are needed.
The SDOF model consists of equivalent mass, damper and
resistance function based on assumed mode shaped. SDOF
can be applied to different types of structural types and
materials such as masonry walls (Edri and Yankelevsky
2018), reinforced concrete columns (Liu et al. 2019, Park et
al. 2014), beams (Nagata et al. 2018), slabs (Kee et al.
2019, Wang et al. 2013), steel columns (Al-Thairy 2016).
For more simplicity in the design stage, Pressure-
Impulse diagram (P-I) is generally accepted (Hou et al.
2018, Li and Meng 2002), which is an iso-damage curve
showing failure causing load as pressure and impulse. For
more convenient use, studies on normalization of P-I have
been made (Yu et al. 2018, Krauthammer et al. 2008, Li
and Meng 2002, Fallah and Louca 2007, Dragos and Wu
2013). Although, many assumptions were made for type of
loading shapes and resistance functions during
normalization, it has not been explained how these
assumptions affects the accuracy. In this study, closed form
solution of P-I diagram based on US DoD criteria (PDC
2008) is proposed and error caused by assumption in reality
Corresponding author, Associate Professor
E-mail: [email protected] aPh.D. Candidate
E-mail: [email protected]
is evaluated. The proposed P-I curve is also validated
comparing to a field blast test results.
2. Solutions for P-I diagram
2.1 Closed form solution for dimensionless P-I diagram
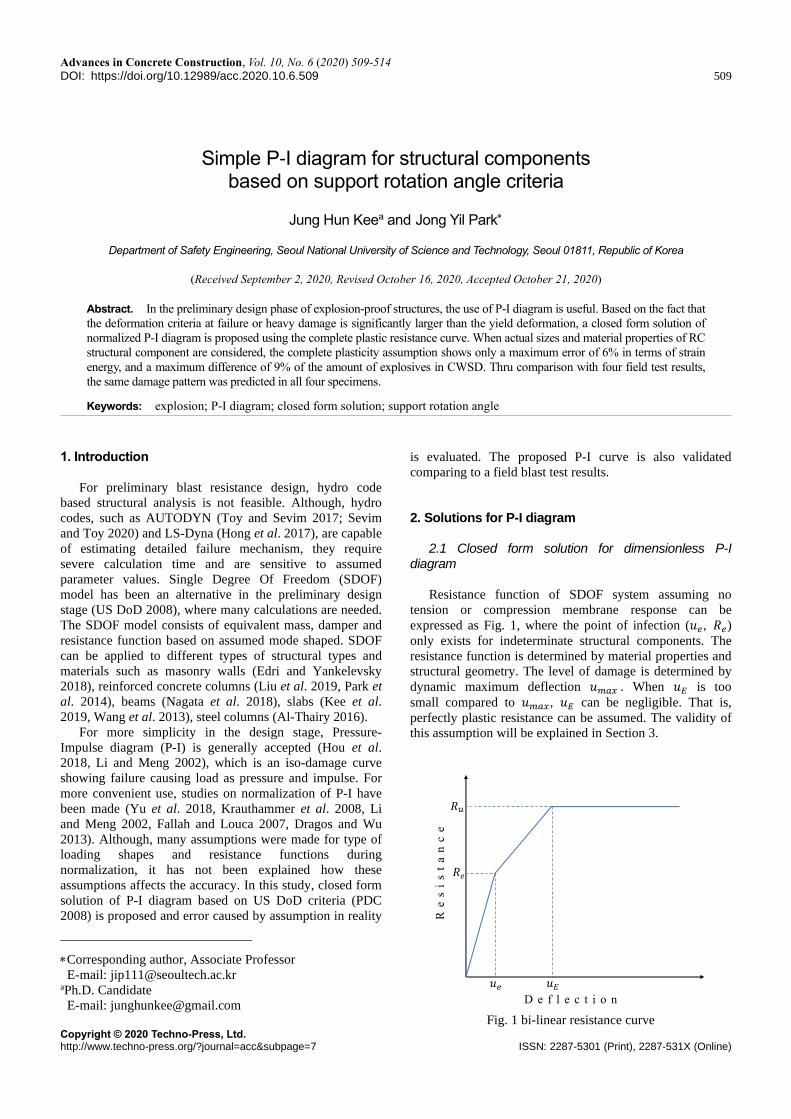
Resistance function of SDOF system assuming no
tension or compression membrane response can be
expressed as Fig. 1, where the point of infection (𝑢𝑒, 𝑅𝑒)
only exists for indeterminate structural components. The
resistance function is determined by material properties and
structural geometry. The level of damage is determined by
dynamic maximum deflection 𝑢𝑚𝑎𝑥 . When 𝑢𝐸 is too
small compared to 𝑢𝑚𝑎𝑥, 𝑢𝐸 can be negligible. That is,
perfectly plastic resistance can be assumed. The validity of
this assumption will be explained in Section 3.
Fig. 1 bi-linear resistance curve
Simple P-I diagram for structural components based on support rotation angle criteria
Jung Hun Keea and Jong Yil Park
Department of Safety Engineering, Seoul National University of Science and Technology, Seoul 01811, Republic of Korea
(Received September 2, 2020, Revised October 16, 2020, Accepted October 21, 2020)
Abstract. In the preliminary design phase of explosion-proof structures, the use of P-I diagram is useful. Based on the fact that
the deformation criteria at failure or heavy damage is significantly larger than the yield deformation, a closed form solution of
normalized P-I diagram is proposed using the complete plastic resistance curve. When actual sizes and material properties of RC
structural component are considered, the complete plasticity assumption shows only a maximum error of 6% in terms of strain
energy, and a maximum difference of 9% of the amount of explosives in CWSD. Thru comparison with four field test results,
the same damage pattern was predicted in all four specimens.
Keywords: explosion; P-I diagram; closed form solution; support rotation angle
Jung Hun Kee and Jong Yil Park
When undamped perfectly plastic SDOF system is
subjected to a triangular load with zero rise time, dynamic
governing equation can be given as follows
𝐾𝐿𝑀𝑀�̈� + 𝑅𝑢 = 𝑃 (1)
where 𝑢 is the deflection, 𝐾𝐿𝑀 is the load-mass factor for
perfectly plastic response, 𝑀 is the mass, and 𝑅𝑢 is the
constant resistance. 𝑃 is the applied pressure defined as
𝑃 = 𝑃𝑚𝑎𝑥 −𝑃𝑚𝑎𝑥
𝑡𝑑𝑡 when 0 ≤ 𝑡 ≤ 𝑡𝑑
𝑃 = 0 when 𝑡𝑑 < 𝑡
(2)
where 𝑃𝑚𝑎𝑥 is the peak pressure and 𝑡𝑑 is the pressure
duration.
When the initial deflection and velocity are set as zero,
the deflection histories are as follows
𝑢 = −1
6
𝑃𝑚𝑎𝑥
𝐾𝐿𝑀𝑀𝑡𝑑𝑡3 +
1
2
𝑃𝑚𝑎𝑥−𝑅𝑢
𝐾𝐿𝑀𝑀𝑡2 when 0 ≤ 𝑡 ≤ 𝑡𝑑 (3)
𝑢 = −1
2
𝑅𝑢
𝐾𝐿𝑀𝑀𝑡2 +
1
2
𝑃𝑚𝑎𝑥𝑡𝑑
𝐾𝐿𝑀𝑀𝑡
−1
6
𝑃𝑚𝑎𝑥𝑡𝑑2
𝐾𝐿𝑀𝑀
when 𝑡𝑑 < 𝑡 (4)
The maximum deflection occurs when velocity is zero.
If deflection reaches the maximum before 𝑡𝑑, the time at
maximum deflection (𝑡𝑚𝑎𝑥) is as below
𝑡𝑚𝑎𝑥 =2𝑡𝑑(𝑃𝑚𝑎𝑥 − 𝑅𝑢)
𝑃𝑚𝑎𝑥
(5)
It should be noted that 𝑡𝑚𝑎𝑥 should be shorted than 𝑡𝑑.
Substituting Eq. (5) into Eq. (3), the maximum deflection
(𝑢𝑚𝑎𝑥) is obtained as follow
𝑢𝑚𝑎𝑥 = 𝑢(𝑡𝑚𝑎𝑥) =
2
3
(1−𝑅𝑢
𝑃𝑚𝑎𝑥)
3𝑃𝑚𝑎𝑥𝑡𝑑
2
𝐾𝐿𝑀𝑀
when 𝑃𝑚𝑎𝑥
𝑅𝑢≤ 2 (6)
If deflection reaches the maximum after 𝑡𝑑, the time at
maximum deflection is
𝑡𝑚𝑎𝑥 =𝑃𝑚𝑎𝑥𝑡𝑑
2𝑅𝑢 (7)
where 𝑡𝑚𝑎𝑥 should be longer than 𝑡𝑑. Substituting Eq. (7)
into Eq. (4), the maximum deflection is obtained as follows
𝑢𝑚𝑎𝑥 =𝑃𝑚𝑎𝑥𝑡𝑑
2
𝐾𝐿𝑀𝑀(
𝑃𝑚𝑎𝑥
8𝑅𝑢−
1
6) when
𝑃𝑚𝑎𝑥
𝑅𝑢> 2 (8)
The degree of damage can be determined based on the
support rotation angle at maximum deflection for flexural
behavior. Then, support rotation angle is defined as below
𝜃 = 𝑡𝑎𝑛−1 (𝑢𝑚𝑎𝑥
𝑍) (9)
where 𝜃 is the support rotation angle and 𝑍 is the shortest
distance from a support to point of maximum deflection.
With dimensionless impulse and peak pressure and the
relationship of peak pressure, impulse, and duration (𝑡𝑑 =2𝐼2/𝑃𝑚𝑎𝑥), normalized pressure-impulse diagram equation
corresponding to a given damage level can be derived as
follows by Eqs. (6),(8) and (9)
𝐼 ̅ = √3�̅�𝑡𝑎𝑛𝜃
8(1−1
�̅�)
3 when 1 < �̅� < 2
Fig. 2 Searching algorithm for P-I diagram
𝐼 ̅ = √2𝑡𝑎𝑛𝜃
(1−4
3�̅�) when �̅� ≥ 2 (10)
where 𝐼 ̅ and �̅� are the dimensionless impulse and peak
pressure, respectively, and are defined as:
𝐼 ̅ =𝐼
√𝐾𝐿𝑀𝑀𝑅𝑢𝑍
�̅� =𝑃𝑚𝑎𝑥
𝑅𝑢
(11)
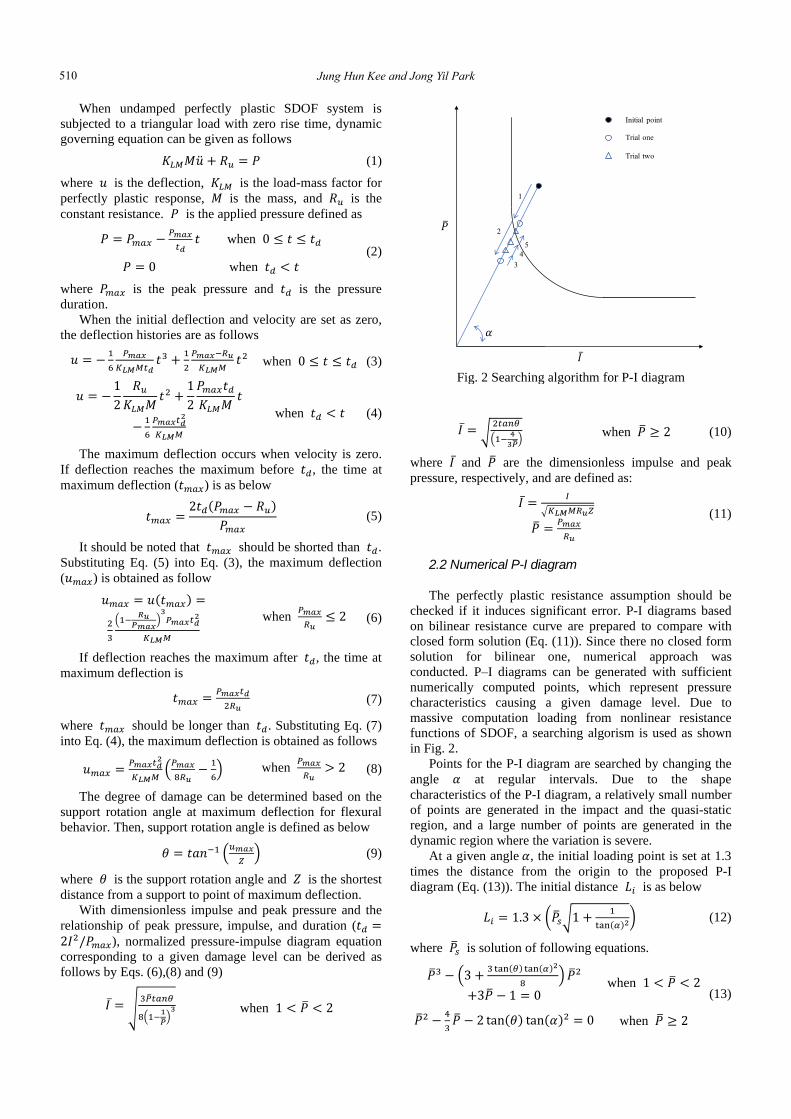
2.2 Numerical P-I diagram
The perfectly plastic resistance assumption should be
checked if it induces significant error. P-I diagrams based
on bilinear resistance curve are prepared to compare with
closed form solution (Eq. (11)). Since there no closed form
solution for bilinear one, numerical approach was
conducted. P–I diagrams can be generated with sufficient
numerically computed points, which represent pressure
characteristics causing a given damage level. Due to
massive computation loading from nonlinear resistance
functions of SDOF, a searching algorism is used as shown
in Fig. 2.
Points for the P-I diagram are searched by changing the
angle 𝛼 at regular intervals. Due to the shape
characteristics of the P-I diagram, a relatively small number
of points are generated in the impact and the quasi-static
region, and a large number of points are generated in the
dynamic region where the variation is severe.
At a given angle 𝛼, the initial loading point is set at 1.3
times the distance from the origin to the proposed P-I
diagram (Eq. (13)). The initial distance 𝐿𝑖 is as below
𝐿𝑖 = 1.3 × (�̅�𝑠√1 +1
tan(𝛼)2) (12)
where �̅�𝑠 is solution of following equations.
�̅�3 − (3 +3 tan(𝜃) tan(𝛼)2
8) �̅�2
+3�̅� − 1 = 0 when 1 < �̅� < 2
(13)
�̅�2 −4
3�̅� − 2 tan(𝜃) tan(𝛼)2 = 0 when �̅� ≥ 2
510
Simple P-I diagram for structural components based on support rotation angle criteria
Table 1 Practical ranges of two-way reinforced concrete
slab parameters
Parameters Ranges
Geometry
Boundary Condition Four Sides Simply Supported,
Four Sides Fixed Supported,
Long Span Length (mm) 4,000~6,000
Short Span Length (mm) 2,000~4,000
Thickness (mm) 150~250
Material Properties
Concrete Compressive Strength (MPa) 18~60
Reinforcement Ratio 0.001~0.005
Yield Strength of Reinforcement (MPa) 300~500
At each point, the maximum deflection is numerically
calculated. The loading is reduced from the initial point
toward the origin with a constant step until damage does not
occur. Then, the load is increased at smaller steps until
damage occurs. This process is repeated until the error is
less than a certain level.
3. Application of perfectly plastic closed form solution
3.1 Error from perfectly-plastic assumption
Strain energies up to the maximum deflection for
perfectly plastic resistance and elastic-perfectly plastic
resistance is as follows
Table 2 Practical ranges of owe-way reinforced concrete
slab parameters
Parameters Ranges
Geometry
Boundary Condition Fixed-Fixed, Simple-Simple
Span Length (mm) 2,000~4,000
Thickness (mm) 150~250
Material Properties
Concrete Compressive Strength (MPa) 18~60
Reinforcement Ratio 0.001~0.005
Yield Strength of Reinforcement (MPa) 300~500
𝑆𝐸𝑝𝑝 = 𝑅𝑢𝑢𝑚𝑎𝑥
𝑆𝐸𝑒𝑝 = 𝑅𝑢𝑢𝑚𝑎𝑥 −1
2𝑅𝑒𝑢𝑒 −
1
2(𝑅𝑢 − 𝑅𝑒)(𝑢𝐸 + 𝑢𝑒)
(22)
As the energy difference is smaller, the reliability of the
closed form P-I diagram increases. The energy differences
of the structural components with practical ranges are
analyzed, of which characteristics are shown in Table 1 and
2. The range of each variable of existing structures is set
based on Ellefsen and Fordyce (2012), who collected data
from 41 countries.
Maximum and minimum energy difference ratios
((𝑆𝐸𝑝𝑝 − 𝑆𝐸𝑒𝑝) 𝑆𝐸𝑝𝑝⁄ ) are given in Table 3 corresponding
to each damage level of 5o and 10o support rotation criteria,
where maximum difference is 6.0% at all simply supported
two-way RC slab.
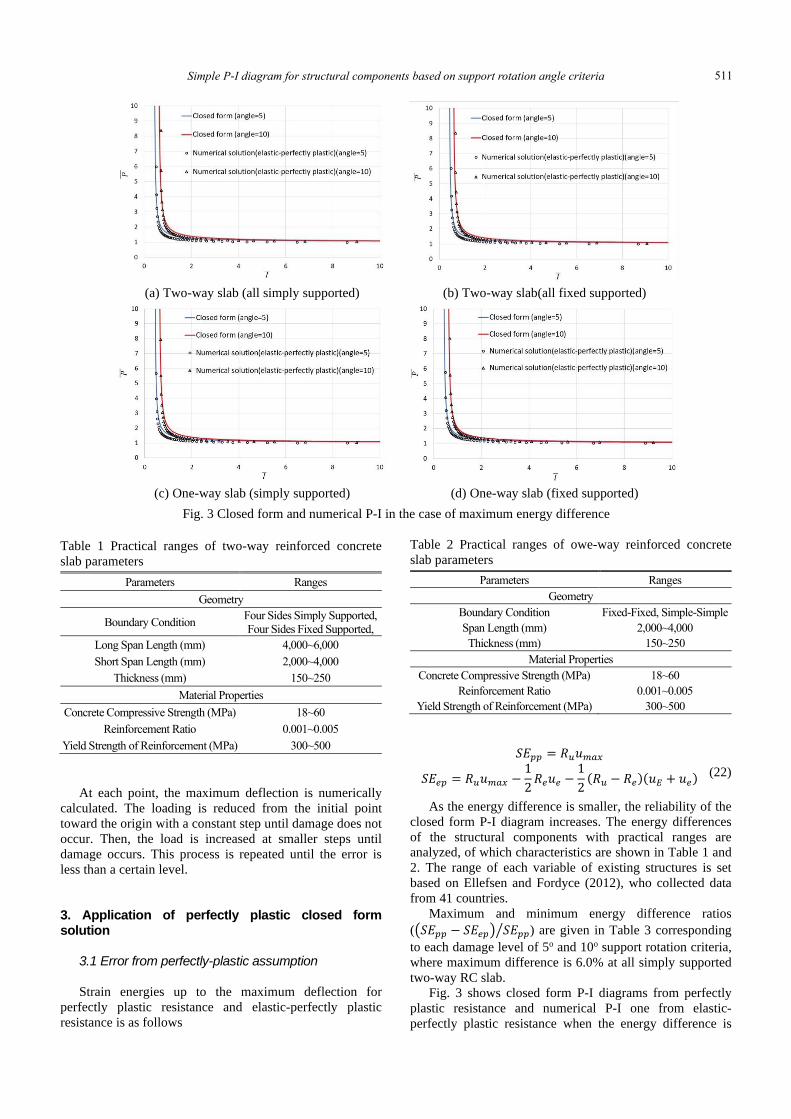
Fig. 3 shows closed form P-I diagrams from perfectly
plastic resistance and numerical P-I one from elastic-
perfectly plastic resistance when the energy difference is
(a) Two-way slab (all simply supported) (b) Two-way slab(all fixed supported)
(c) One-way slab (simply supported) (d) One-way slab (fixed supported)
Fig. 3 Closed form and numerical P-I in the case of maximum energy difference
511
Jung Hun Kee and Jong Yil Park
Table 3 Energy difference of numerical and closed form P-I
curves
Structural components Energy Difference (%) from Eq. (22)
5o rotation angle 10o rotation angle
Fixed-fixed, one-way RC
slabs 0.1~2.5 0.0~1.2
Simple-simple, one-way
RC slabs 0.1~5.2 0.1~2.5
All fixed, two-way RC
slabs 0.2~4.8 0.1~2.3
All simple, two-way RC
slabs 0.2~6.0 0.1~2.9
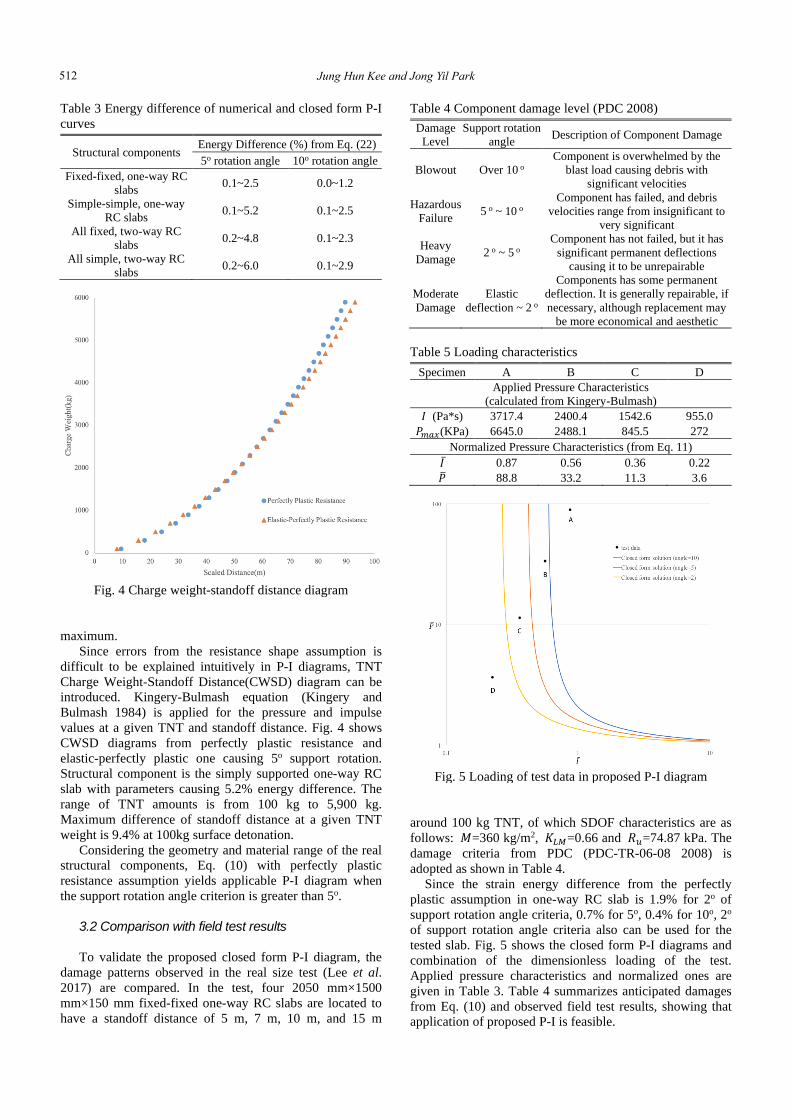
Fig. 4 Charge weight-standoff distance diagram
maximum.
Since errors from the resistance shape assumption is
difficult to be explained intuitively in P-I diagrams, TNT
Charge Weight-Standoff Distance(CWSD) diagram can be
introduced. Kingery-Bulmash equation (Kingery and
Bulmash 1984) is applied for the pressure and impulse
values at a given TNT and standoff distance. Fig. 4 shows
CWSD diagrams from perfectly plastic resistance and
elastic-perfectly plastic one causing 5o support rotation.
Structural component is the simply supported one-way RC
slab with parameters causing 5.2% energy difference. The
range of TNT amounts is from 100 kg to 5,900 kg.
Maximum difference of standoff distance at a given TNT
weight is 9.4% at 100kg surface detonation.
Considering the geometry and material range of the real
structural components, Eq. (10) with perfectly plastic
resistance assumption yields applicable P-I diagram when
the support rotation angle criterion is greater than 5o.
3.2 Comparison with field test results
To validate the proposed closed form P-I diagram, the
damage patterns observed in the real size test (Lee et al.
2017) are compared. In the test, four 2050 mm×1500
mm×150 mm fixed-fixed one-way RC slabs are located to
have a standoff distance of 5 m, 7 m, 10 m, and 15 m
Table 4 Component damage level (PDC 2008)
Damage
Level
Support rotation
angle Description of Component Damage
Blowout Over 10 o
Component is overwhelmed by the
blast load causing debris with
significant velocities
Hazardous
Failure 5 o ~ 10 o
Component has failed, and debris
velocities range from insignificant to
very significant
Heavy
Damage 2 o ~ 5 o
Component has not failed, but it has
significant permanent deflections
causing it to be unrepairable
Moderate
Damage
Elastic
deflection ~ 2 o
Components has some permanent
deflection. It is generally repairable, if
necessary, although replacement may
be more economical and aesthetic
Table 5 Loading characteristics
Specimen A B C D
Applied Pressure Characteristics
(calculated from Kingery-Bulmash)
𝐼 (Pa*s) 3717.4 2400.4 1542.6 955.0
𝑃𝑚𝑎𝑥(KPa) 6645.0 2488.1 845.5 272
Normalized Pressure Characteristics (from Eq. 11)
𝐼 ̅ 0.87 0.56 0.36 0.22
�̅� 88.8 33.2 11.3 3.6
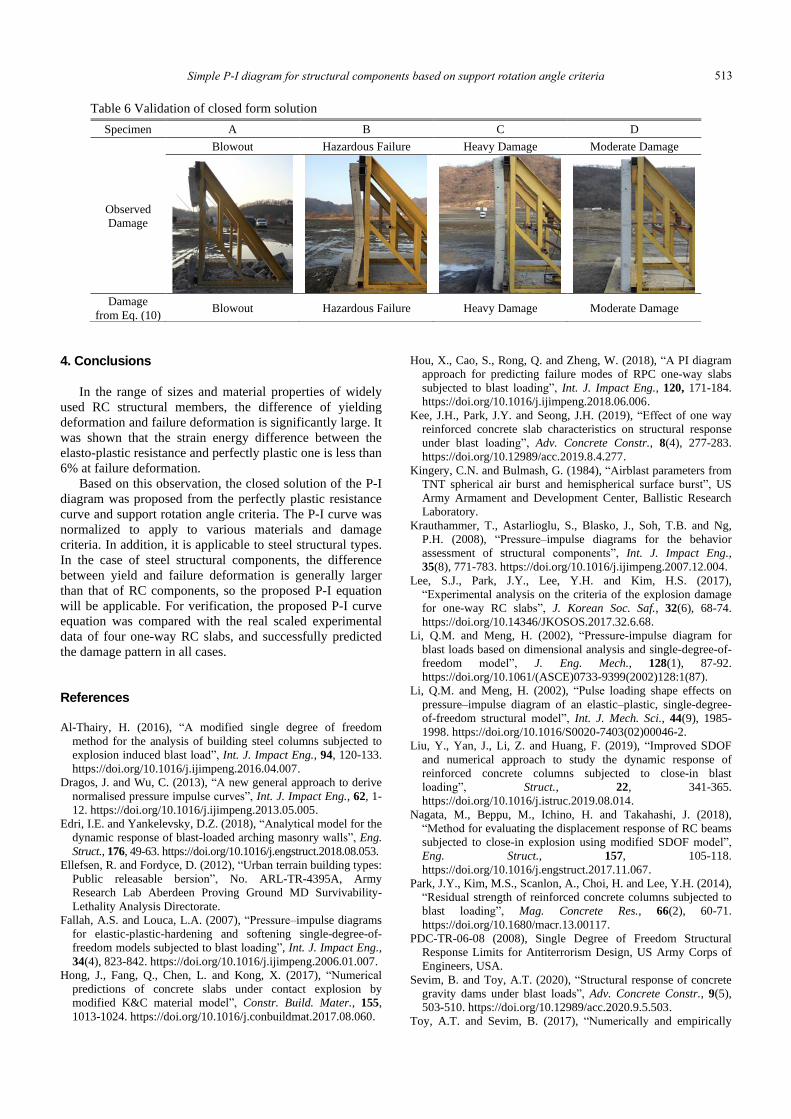
Fig. 5 Loading of test data in proposed P-I diagram
around 100 kg TNT, of which SDOF characteristics are as
follows: 𝑀=360 kg/m2, 𝐾𝐿𝑀=0.66 and 𝑅𝑢=74.87 kPa. The
damage criteria from PDC (PDC-TR-06-08 2008) is
adopted as shown in Table 4.
Since the strain energy difference from the perfectly
plastic assumption in one-way RC slab is 1.9% for 2o of
support rotation angle criteria, 0.7% for 5o, 0.4% for 10o, 2o
of support rotation angle criteria also can be used for the
tested slab. Fig. 5 shows the closed form P-I diagrams and
combination of the dimensionless loading of the test.
Applied pressure characteristics and normalized ones are
given in Table 3. Table 4 summarizes anticipated damages
from Eq. (10) and observed field test results, showing that
application of proposed P-I is feasible.
512
Simple P-I diagram for structural components based on support rotation angle criteria
4. Conclusions
In the range of sizes and material properties of widely
used RC structural members, the difference of yielding
deformation and failure deformation is significantly large. It
was shown that the strain energy difference between the
elasto-plastic resistance and perfectly plastic one is less than
6% at failure deformation.
Based on this observation, the closed solution of the P-I
diagram was proposed from the perfectly plastic resistance
curve and support rotation angle criteria. The P-I curve was
normalized to apply to various materials and damage
criteria. In addition, it is applicable to steel structural types.
In the case of steel structural components, the difference
between yield and failure deformation is generally larger
than that of RC components, so the proposed P-I equation
will be applicable. For verification, the proposed P-I curve
equation was compared with the real scaled experimental
data of four one-way RC slabs, and successfully predicted
the damage pattern in all cases.
References Al-Thairy, H. (2016), “A modified single degree of freedom
method for the analysis of building steel columns subjected to
explosion induced blast load”, Int. J. Impact Eng., 94, 120-133.
https://doi.org/10.1016/j.ijimpeng.2016.04.007.
Dragos, J. and Wu, C. (2013), “A new general approach to derive
normalised pressure impulse curves”, Int. J. Impact Eng., 62, 1-
12. https://doi.org/10.1016/j.ijimpeng.2013.05.005.
Edri, I.E. and Yankelevsky, D.Z. (2018), “Analytical model for the
dynamic response of blast-loaded arching masonry walls”, Eng.
Struct., 176, 49-63. https://doi.org/10.1016/j.engstruct.2018.08.053.
Ellefsen, R. and Fordyce, D. (2012), “Urban terrain building types:
Public releasable bersion”, No. ARL-TR-4395A, Army
Research Lab Aberdeen Proving Ground MD Survivability-
Lethality Analysis Directorate.
Fallah, A.S. and Louca, L.A. (2007), “Pressure–impulse diagrams
for elastic-plastic-hardening and softening single-degree-of-
freedom models subjected to blast loading”, Int. J. Impact Eng.,
34(4), 823-842. https://doi.org/10.1016/j.ijimpeng.2006.01.007.
Hong, J., Fang, Q., Chen, L. and Kong, X. (2017), “Numerical
predictions of concrete slabs under contact explosion by
modified K&C material model”, Constr. Build. Mater., 155,
1013-1024. https://doi.org/10.1016/j.conbuildmat.2017.08.060.
Hou, X., Cao, S., Rong, Q. and Zheng, W. (2018), “A PI diagram
approach for predicting failure modes of RPC one-way slabs
subjected to blast loading”, Int. J. Impact Eng., 120, 171-184.
https://doi.org/10.1016/j.ijimpeng.2018.06.006.
Kee, J.H., Park, J.Y. and Seong, J.H. (2019), “Effect of one way
reinforced concrete slab characteristics on structural response
under blast loading”, Adv. Concrete Constr., 8(4), 277-283.
https://doi.org/10.12989/acc.2019.8.4.277.
Kingery, C.N. and Bulmash, G. (1984), “Airblast parameters from
TNT spherical air burst and hemispherical surface burst”, US
Army Armament and Development Center, Ballistic Research
Laboratory.
Krauthammer, T., Astarlioglu, S., Blasko, J., Soh, T.B. and Ng,
P.H. (2008), “Pressure–impulse diagrams for the behavior
assessment of structural components”, Int. J. Impact Eng.,
35(8), 771-783. https://doi.org/10.1016/j.ijimpeng.2007.12.004.
Lee, S.J., Park, J.Y., Lee, Y.H. and Kim, H.S. (2017),
“Experimental analysis on the criteria of the explosion damage
for one-way RC slabs”, J. Korean Soc. Saf., 32(6), 68-74.
https://doi.org/10.14346/JKOSOS.2017.32.6.68.
Li, Q.M. and Meng, H. (2002), “Pressure-impulse diagram for
blast loads based on dimensional analysis and single-degree-of-
freedom model”, J. Eng. Mech., 128(1), 87-92.
https://doi.org/10.1061/(ASCE)0733-9399(2002)128:1(87).
Li, Q.M. and Meng, H. (2002), “Pulse loading shape effects on
pressure–impulse diagram of an elastic–plastic, single-degree-
of-freedom structural model”, Int. J. Mech. Sci., 44(9), 1985-
1998. https://doi.org/10.1016/S0020-7403(02)00046-2.
Liu, Y., Yan, J., Li, Z. and Huang, F. (2019), “Improved SDOF
and numerical approach to study the dynamic response of
reinforced concrete columns subjected to close-in blast
loading”, Struct., 22, 341-365.
https://doi.org/10.1016/j.istruc.2019.08.014.
Nagata, M., Beppu, M., Ichino, H. and Takahashi, J. (2018),
“Method for evaluating the displacement response of RC beams
subjected to close-in explosion using modified SDOF model”,
Eng. Struct., 157, 105-118.
https://doi.org/10.1016/j.engstruct.2017.11.067.
Park, J.Y., Kim, M.S., Scanlon, A., Choi, H. and Lee, Y.H. (2014),
“Residual strength of reinforced concrete columns subjected to
blast loading”, Mag. Concrete Res., 66(2), 60-71.
https://doi.org/10.1680/macr.13.00117.
PDC-TR-06-08 (2008), Single Degree of Freedom Structural
Response Limits for Antiterrorism Design, US Army Corps of
Engineers, USA.
Sevim, B. and Toy, A.T. (2020), “Structural response of concrete
gravity dams under blast loads”, Adv. Concrete Constr., 9(5),
503-510. https://doi.org/10.12989/acc.2020.9.5.503.
Toy, A.T. and Sevim, B. (2017), “Numerically and empirically
Table 6 Validation of closed form solution
Specimen A B C D
Observed
Damage
Blowout Hazardous Failure Heavy Damage Moderate Damage
Damage
from Eq. (10) Blowout Hazardous Failure Heavy Damage Moderate Damage
513

Jung Hun Kee and Jong Yil Park
determination of blasting response of a RC retaining wall under
TNT explosive”, Adv. Concrete Constr., 5(5), 493.
http://dx.doi.org/10.12989/acc.2017.5.5.493.
UFC 3-340-02 (2008), Structures to Resist the Effects of
Accidental Explosions, US DoD, Washington, DC, USA.
Wang, W., Zhang, D., Lu, F. and Liu, R. (2013), “A new SDOF
method of one-way reinforced concrete slab under non-uniform
blast loading”, Struct. Eng. Mech., 46(5), 595-613.
https://doi.org/10.12989/SEM.2013.46.5.595.
Yu, R., Zhang, D., Chen, L. and Yan, H. (2018), “Non-
dimensional pressure–impulse diagrams for blast-loaded
reinforced concrete beam columns referred to different failure
modes”, Adv. Struct. Eng., 21(14), 2114-2129.
https://doi.org/10.1177/1369433218768085.
JK
514