Embed Size (px)
Citation preview
RESEARCH ARTICLE Open Access
Simple sequence repeat variation in the Daphniapulex genomeWay Sung1*, Abraham Tucker1,3, R Daniel Bergeron2, Michael Lynch3, W Kelley Thomas1
Abstract
Background: Simple sequence repeats (SSRs) are highly variable features of all genomes. Their rapid evolutionmakes them useful for tracing the evolutionary history of populations and investigating patterns of selection andmutation across gnomes. The recently sequenced Daphnia pulex genome provides us with a valuable data set tostudy the mode and tempo of SSR evolution, without the inherent biases that accompany marker selection.
Results: Here we catalogue SSR loci in the Daphnia pulex genome with repeated motif sizes of 1-100 nucleotideswith a minimum of 3 perfect repeats. We then used whole genome shotgun reads to determine the averageheterozygosity of each SSR type and the relationship that it has to repeat number, motif size, motif sequence, anddistribution of SSR loci. We find that SSR heterozygosity is motif specific, and positively correlated with repeatnumber as well as motif size. For non-repeat unit polymorphisms, we identify a motif-dependent end-nucleotidepolymorphism bias that may contribute to the patterns of abundance for specific homopolymers, dimers, andtrimers. Our observations confirm the high frequency of multiple unit variation (multistep) at large microsatelliteloci, and further show that the occurrence of multiple unit variation is dependent on both repeat number andmotif size. Using the Daphnia pulex genetic map, we show a positive correlation between dimer and trimerfrequency and recombination.
Conclusions: This genome-wide analysis of SSR variation in Daphnia pulex indicates that several aspects of SSRvariation are motif dependent and suggests that a combination of unit length variation and end repeat biasedbase substitution contribute to the unique spectrum of SSR repeat loci.
BackgroundTandem arrays of DNA nucleotides, known as simplesequence repeats (SSR), are extremely dynamic parts ofthe genome. These tandem repeats vary in motifsequence, length, and repeat number. The most com-mon SSR loci are homopolymers (repeated singlenucleotide), dimers (repeated nucleotide pair), and tri-mers (repeated nucleotide triplet). The highly poly-morphic nature of SSRs makes them desirable for use inboth genotyping and population-level evolutionary stu-dies. Simple sequence repeats may influence the fitnessof the organism [1], and in specific cases are known tobe causal of human disease [1].A high mutation rate at SSRs has been well documen-
ted in a number of organisms using microsatellite
constructs, pedigree analyses, and mutation accumula-tion (MA) experiments [2-4]. The high mutation rate inSSRs is due to a propensity for DNA misalignment dur-ing replication [5], regulated primarily by the universalmismatch repair system (MMR). MMR knockout experi-ments show dramatic increases (up to 100 fold greater)in the rate of simple sequence variation [6,7]; and sug-gest that surveillance by MMR may vary across the gen-ome [8]. Although the MMR system has been well-categorized in certain species, the components of MMRmay vary from species to species, which may result inlineage specific patterns of SSR repair, and consequentlylineage specific patterns of SSR variation [9]. In additionto MMR fidelity; repeat number, motif sequence, motifsize, local rates of recombination and genomic locationcan influence rates of SSR variation [8,10,11]. Genomewide analysis of SSR variation in well-characterized sys-tems will facilitate a greater understanding of the
* Correspondence: [email protected] Center for Genome Studies, University of New Hampshire,Durham, NH 03824, USAFull list of author information is available at the end of the article
Sung et al. BMC Genomics 2010, 11:691http://www.biomedcentral.com/1471-2164/11/691
Daphnia GenomicsConsortium
© 2010 Sung et al; licensee BioMed Central Ltd. This is an Open Access article distributed under the terms of the Creative CommonsAttribution License (<url>http://creativecommons.org/licenses/by/2.0</url>), which permits unrestricted use, distribution, andreproduction in any medium, provided the original work is properly cited.
relationship between MMR evolution, and the abun-dance of SSR and levels of variation at these loci.Daphnia pulex (water flea), crustacean represents a
particularly useful platform for the study of SSR evolu-tion. The Daphnia pulex lineage is distinct from the twomodel organisms Caenorhabditis elegans (nematode)and Drosophila melanogaster (fruit fly), both of whichhave well characterized simple sequence repeat variation[2,12]. The genome sequence of D. pulex is based on asingle heterozygous genotype sampled from a naturalpopulation with minimal inbreeding [13]. The hetero-zygosity within the genome sequence can be assayed byanalysis of the raw sequence reads (8 × coverage) allow-ing a nearly genome-wide analysis of the variation atSSR loci.There are two main goals of this study. The first is to
provide a detailed catalog of SSR loci and their distribu-tion within the genome of Daphnia pulex. The secondgoal is to assay SSR heterozygosity on a genome widescale to test for motif specific rates and patterns of SSRevolution.
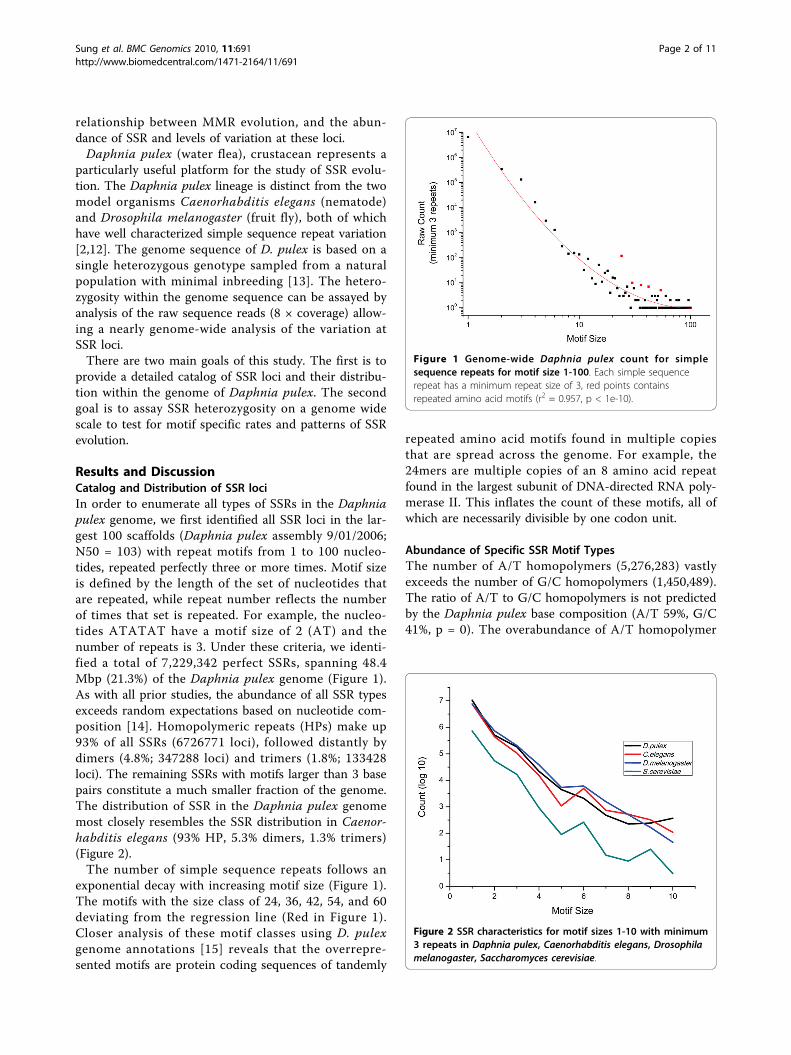
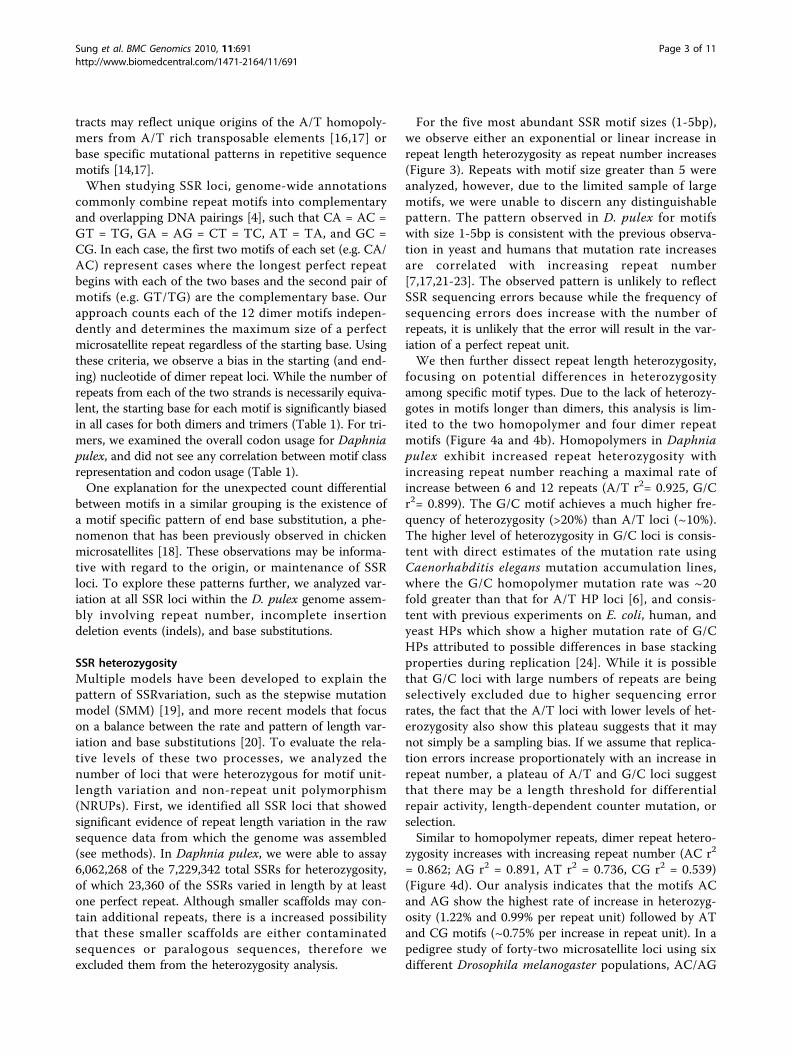
Results and DiscussionCatalog and Distribution of SSR lociIn order to enumerate all types of SSRs in the Daphniapulex genome, we first identified all SSR loci in the lar-gest 100 scaffolds (Daphnia pulex assembly 9/01/2006;N50 = 103) with repeat motifs from 1 to 100 nucleo-tides, repeated perfectly three or more times. Motif sizeis defined by the length of the set of nucleotides thatare repeated, while repeat number reflects the numberof times that set is repeated. For example, the nucleo-tides ATATAT have a motif size of 2 (AT) and thenumber of repeats is 3. Under these criteria, we identi-fied a total of 7,229,342 perfect SSRs, spanning 48.4Mbp (21.3%) of the Daphnia pulex genome (Figure 1).As with all prior studies, the abundance of all SSR typesexceeds random expectations based on nucleotide com-position [14]. Homopolymeric repeats (HPs) make up93% of all SSRs (6726771 loci), followed distantly bydimers (4.8%; 347288 loci) and trimers (1.8%; 133428loci). The remaining SSRs with motifs larger than 3 basepairs constitute a much smaller fraction of the genome.The distribution of SSR in the Daphnia pulex genomemost closely resembles the SSR distribution in Caenor-habditis elegans (93% HP, 5.3% dimers, 1.3% trimers)(Figure 2).The number of simple sequence repeats follows an
exponential decay with increasing motif size (Figure 1).The motifs with the size class of 24, 36, 42, 54, and 60deviating from the regression line (Red in Figure 1).Closer analysis of these motif classes using D. pulexgenome annotations [15] reveals that the overrepre-sented motifs are protein coding sequences of tandemly
repeated amino acid motifs found in multiple copiesthat are spread across the genome. For example, the24mers are multiple copies of an 8 amino acid repeatfound in the largest subunit of DNA-directed RNA poly-merase II. This inflates the count of these motifs, all ofwhich are necessarily divisible by one codon unit.
Abundance of Specific SSR Motif TypesThe number of A/T homopolymers (5,276,283) vastlyexceeds the number of G/C homopolymers (1,450,489).The ratio of A/T to G/C homopolymers is not predictedby the Daphnia pulex base composition (A/T 59%, G/C41%, p = 0). The overabundance of A/T homopolymer
Figure 1 Genome-wide Daphnia pulex count for simplesequence repeats for motif size 1-100. Each simple sequencerepeat has a minimum repeat size of 3, red points containsrepeated amino acid motifs (r2 = 0.957, p < 1e-10).
Figure 2 SSR characteristics for motif sizes 1-10 with minimum3 repeats in Daphnia pulex, Caenorhabditis elegans, Drosophilamelanogaster, Saccharomyces cerevisiae.
Sung et al. BMC Genomics 2010, 11:691http://www.biomedcentral.com/1471-2164/11/691
Page 2 of 11
tracts may reflect unique origins of the A/T homopoly-mers from A/T rich transposable elements [16,17] orbase specific mutational patterns in repetitive sequencemotifs [14,17].When studying SSR loci, genome-wide annotations
commonly combine repeat motifs into complementaryand overlapping DNA pairings [4], such that CA = AC =GT = TG, GA = AG = CT = TC, AT = TA, and GC =CG. In each case, the first two motifs of each set (e.g. CA/AC) represent cases where the longest perfect repeatbegins with each of the two bases and the second pair ofmotifs (e.g. GT/TG) are the complementary base. Ourapproach counts each of the 12 dimer motifs indepen-dently and determines the maximum size of a perfectmicrosatellite repeat regardless of the starting base. Usingthese criteria, we observe a bias in the starting (and end-ing) nucleotide of dimer repeat loci. While the number ofrepeats from each of the two strands is necessarily equiva-lent, the starting base for each motif is significantly biasedin all cases for both dimers and trimers (Table 1). For tri-mers, we examined the overall codon usage for Daphniapulex, and did not see any correlation between motif classrepresentation and codon usage (Table 1).One explanation for the unexpected count differential
between motifs in a similar grouping is the existence ofa motif specific pattern of end base substitution, a phe-nomenon that has been previously observed in chickenmicrosatellites [18]. These observations may be informa-tive with regard to the origin, or maintenance of SSRloci. To explore these patterns further, we analyzed var-iation at all SSR loci within the D. pulex genome assem-bly involving repeat number, incomplete insertiondeletion events (indels), and base substitutions.
SSR heterozygosityMultiple models have been developed to explain thepattern of SSRvariation, such as the stepwise mutationmodel (SMM) [19], and more recent models that focuson a balance between the rate and pattern of length var-iation and base substitutions [20]. To evaluate the rela-tive levels of these two processes, we analyzed thenumber of loci that were heterozygous for motif unit-length variation and non-repeat unit polymorphism(NRUPs). First, we identified all SSR loci that showedsignificant evidence of repeat length variation in the rawsequence data from which the genome was assembled(see methods). In Daphnia pulex, we were able to assay6,062,268 of the 7,229,342 total SSRs for heterozygosity,of which 23,360 of the SSRs varied in length by at leastone perfect repeat. Although smaller scaffolds may con-tain additional repeats, there is a increased possibilitythat these smaller scaffolds are either contaminatedsequences or paralogous sequences, therefore weexcluded them from the heterozygosity analysis.
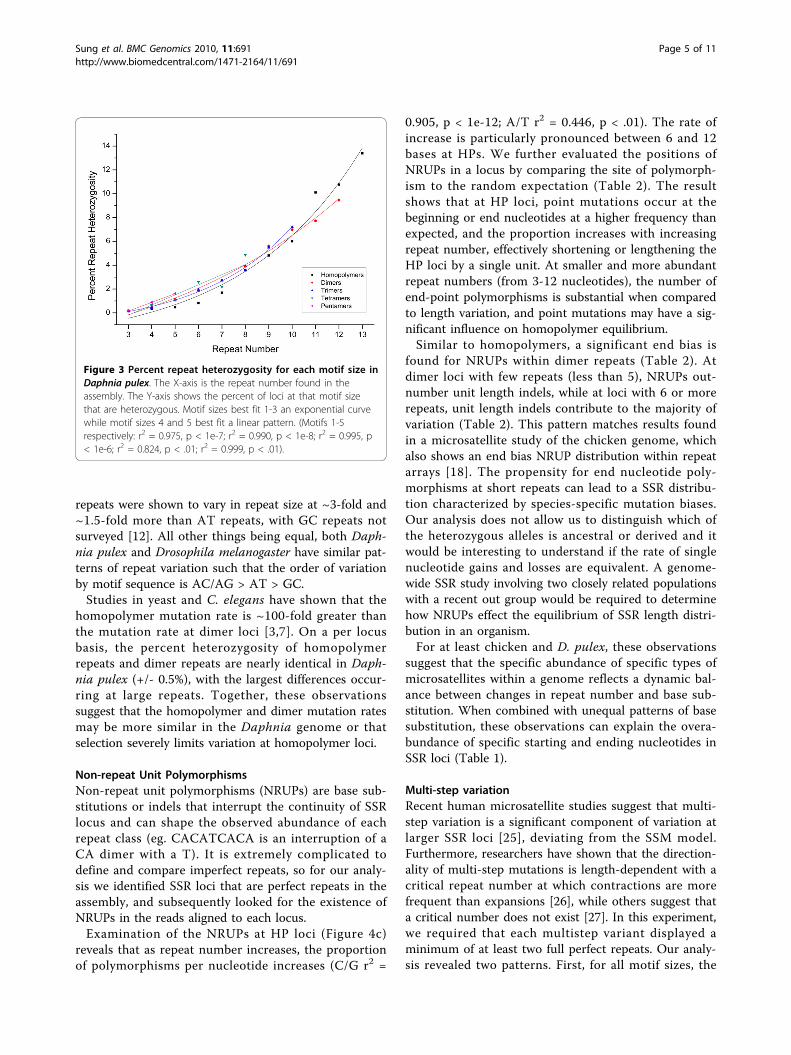
For the five most abundant SSR motif sizes (1-5bp),we observe either an exponential or linear increase inrepeat length heterozygosity as repeat number increases(Figure 3). Repeats with motif size greater than 5 wereanalyzed, however, due to the limited sample of largemotifs, we were unable to discern any distinguishablepattern. The pattern observed in D. pulex for motifswith size 1-5bp is consistent with the previous observa-tion in yeast and humans that mutation rate increasesare correlated with increasing repeat number[7,17,21-23]. The observed pattern is unlikely to reflectSSR sequencing errors because while the frequency ofsequencing errors does increase with the number ofrepeats, it is unlikely that the error will result in the var-iation of a perfect repeat unit.We then further dissect repeat length heterozygosity,
focusing on potential differences in heterozygosityamong specific motif types. Due to the lack of heterozy-gotes in motifs longer than dimers, this analysis is lim-ited to the two homopolymer and four dimer repeatmotifs (Figure 4a and 4b). Homopolymers in Daphniapulex exhibit increased repeat heterozygosity withincreasing repeat number reaching a maximal rate ofincrease between 6 and 12 repeats (A/T r2= 0.925, G/Cr2= 0.899). The G/C motif achieves a much higher fre-quency of heterozygosity (>20%) than A/T loci (~10%).The higher level of heterozygosity in G/C loci is consis-tent with direct estimates of the mutation rate usingCaenorhabditis elegans mutation accumulation lines,where the G/C homopolymer mutation rate was ~20fold greater than that for A/T HP loci [6], and consis-tent with previous experiments on E. coli, human, andyeast HPs which show a higher mutation rate of G/CHPs attributed to possible differences in base stackingproperties during replication [24]. While it is possiblethat G/C loci with large numbers of repeats are beingselectively excluded due to higher sequencing errorrates, the fact that the A/T loci with lower levels of het-erozygosity also show this plateau suggests that it maynot simply be a sampling bias. If we assume that replica-tion errors increase proportionately with an increase inrepeat number, a plateau of A/T and G/C loci suggestthat there may be a length threshold for differentialrepair activity, length-dependent counter mutation, orselection.Similar to homopolymer repeats, dimer repeat hetero-
zygosity increases with increasing repeat number (AC r2
= 0.862; AG r2 = 0.891, AT r2 = 0.736, CG r2 = 0.539)(Figure 4d). Our analysis indicates that the motifs ACand AG show the highest rate of increase in heterozyg-osity (1.22% and 0.99% per repeat unit) followed by ATand CG motifs (~0.75% per increase in repeat unit). In apedigree study of forty-two microsatellite loci using sixdifferent Drosophila melanogaster populations, AC/AG
Sung et al. BMC Genomics 2010, 11:691http://www.biomedcentral.com/1471-2164/11/691
Page 3 of 11
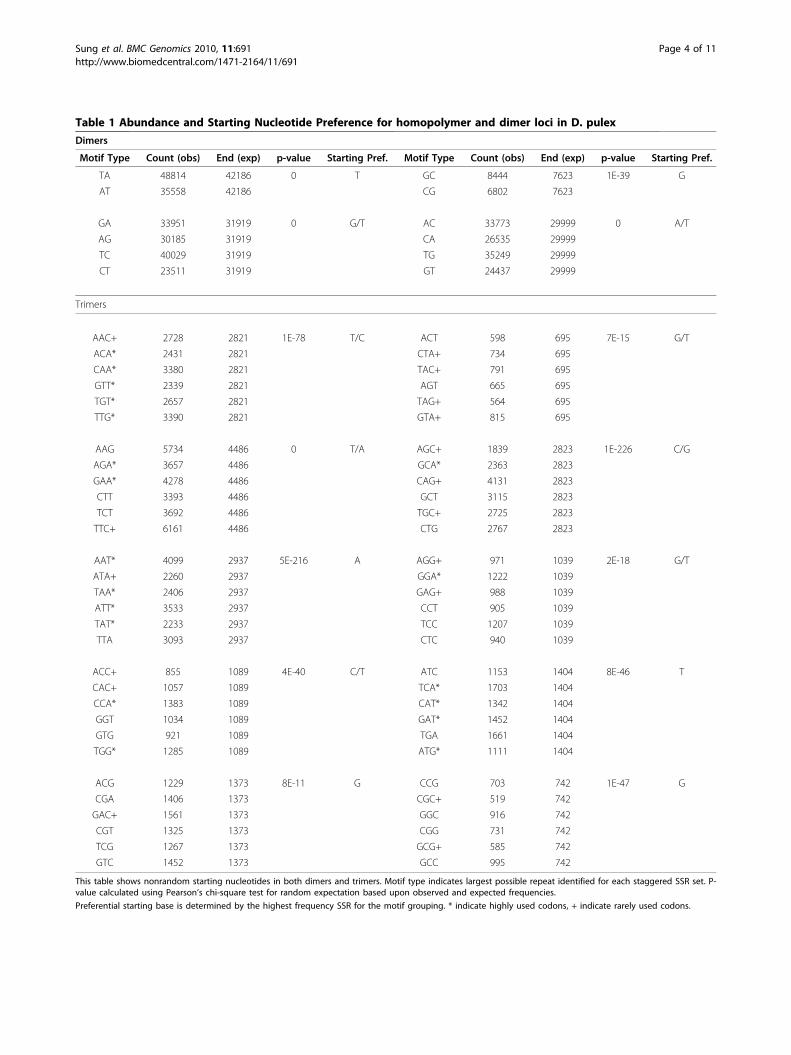
Table 1 Abundance and Starting Nucleotide Preference for homopolymer and dimer loci in D. pulex
Dimers
Motif Type Count (obs) End (exp) p-value Starting Pref. Motif Type Count (obs) End (exp) p-value Starting Pref.
TA 48814 42186 0 T GC 8444 7623 1E-39 G
AT 35558 42186 CG 6802 7623
GA 33951 31919 0 G/T AC 33773 29999 0 A/T
AG 30185 31919 CA 26535 29999
TC 40029 31919 TG 35249 29999
CT 23511 31919 GT 24437 29999
Trimers
AAC+ 2728 2821 1E-78 T/C ACT 598 695 7E-15 G/T
ACA* 2431 2821 CTA+ 734 695
CAA* 3380 2821 TAC+ 791 695
GTT* 2339 2821 AGT 665 695
TGT* 2657 2821 TAG+ 564 695
TTG* 3390 2821 GTA+ 815 695
AAG 5734 4486 0 T/A AGC+ 1839 2823 1E-226 C/G
AGA* 3657 4486 GCA* 2363 2823
GAA* 4278 4486 CAG+ 4131 2823
CTT 3393 4486 GCT 3115 2823
TCT 3692 4486 TGC+ 2725 2823
TTC+ 6161 4486 CTG 2767 2823
AAT* 4099 2937 5E-216 A AGG+ 971 1039 2E-18 G/T
ATA+ 2260 2937 GGA* 1222 1039
TAA* 2406 2937 GAG+ 988 1039
ATT* 3533 2937 CCT 905 1039
TAT* 2233 2937 TCC 1207 1039
TTA 3093 2937 CTC 940 1039
ACC+ 855 1089 4E-40 C/T ATC 1153 1404 8E-46 T
CAC+ 1057 1089 TCA* 1703 1404
CCA* 1383 1089 CAT* 1342 1404
GGT 1034 1089 GAT* 1452 1404
GTG 921 1089 TGA 1661 1404
TGG* 1285 1089 ATG* 1111 1404
ACG 1229 1373 8E-11 G CCG 703 742 1E-47 G
CGA 1406 1373 CGC+ 519 742
GAC+ 1561 1373 GGC 916 742
CGT 1325 1373 CGG 731 742
TCG 1267 1373 GCG+ 585 742
GTC 1452 1373 GCC 995 742
This table shows nonrandom starting nucleotides in both dimers and trimers. Motif type indicates largest possible repeat identified for each staggered SSR set. P-value calculated using Pearson’s chi-square test for random expectation based upon observed and expected frequencies.
Preferential starting base is determined by the highest frequency SSR for the motif grouping. * indicate highly used codons, + indicate rarely used codons.
Sung et al. BMC Genomics 2010, 11:691http://www.biomedcentral.com/1471-2164/11/691
Page 4 of 11
repeats were shown to vary in repeat size at ~3-fold and~1.5-fold more than AT repeats, with GC repeats notsurveyed [12]. All other things being equal, both Daph-nia pulex and Drosophila melanogaster have similar pat-terns of repeat variation such that the order of variationby motif sequence is AC/AG > AT > GC.Studies in yeast and C. elegans have shown that the
homopolymer mutation rate is ~100-fold greater thanthe mutation rate at dimer loci [3,7]. On a per locusbasis, the percent heterozygosity of homopolymerrepeats and dimer repeats are nearly identical in Daph-nia pulex (+/- 0.5%), with the largest differences occur-ring at large repeats. Together, these observationssuggest that the homopolymer and dimer mutation ratesmay be more similar in the Daphnia genome or thatselection severely limits variation at homopolymer loci.
Non-repeat Unit PolymorphismsNon-repeat unit polymorphisms (NRUPs) are base sub-stitutions or indels that interrupt the continuity of SSRlocus and can shape the observed abundance of eachrepeat class (eg. CACATCACA is an interruption of aCA dimer with a T). It is extremely complicated todefine and compare imperfect repeats, so for our analy-sis we identified SSR loci that are perfect repeats in theassembly, and subsequently looked for the existence ofNRUPs in the reads aligned to each locus.Examination of the NRUPs at HP loci (Figure 4c)
reveals that as repeat number increases, the proportionof polymorphisms per nucleotide increases (C/G r2 =
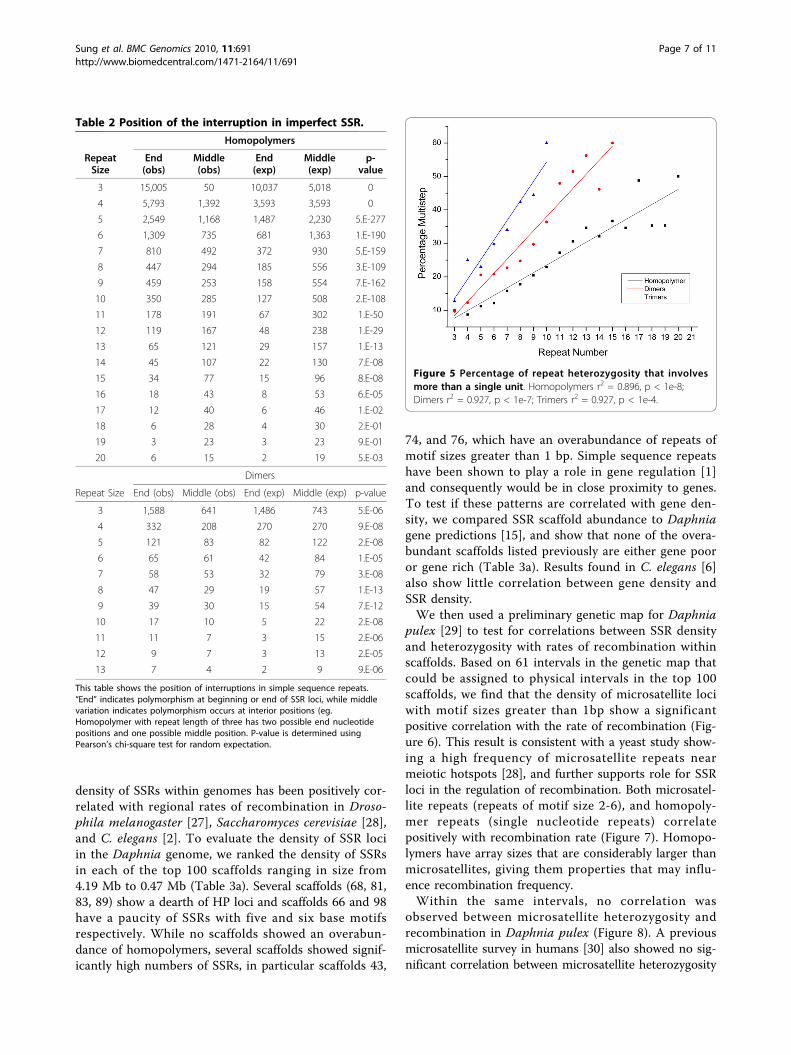
0.905, p < 1e-12; A/T r2 = 0.446, p < .01). The rate ofincrease is particularly pronounced between 6 and 12bases at HPs. We further evaluated the positions ofNRUPs in a locus by comparing the site of polymorph-ism to the random expectation (Table 2). The resultshows that at HP loci, point mutations occur at thebeginning or end nucleotides at a higher frequency thanexpected, and the proportion increases with increasingrepeat number, effectively shortening or lengthening theHP loci by a single unit. At smaller and more abundantrepeat numbers (from 3-12 nucleotides), the number ofend-point polymorphisms is substantial when comparedto length variation, and point mutations may have a sig-nificant influence on homopolymer equilibrium.Similar to homopolymers, a significant end bias is
found for NRUPs within dimer repeats (Table 2). Atdimer loci with few repeats (less than 5), NRUPs out-number unit length indels, while at loci with 6 or morerepeats, unit length indels contribute to the majority ofvariation (Table 2). This pattern matches results foundin a microsatellite study of the chicken genome, whichalso shows an end bias NRUP distribution within repeatarrays [18]. The propensity for end nucleotide poly-morphisms at short repeats can lead to a SSR distribu-tion characterized by species-specific mutation biases.Our analysis does not allow us to distinguish which ofthe heterozygous alleles is ancestral or derived and itwould be interesting to understand if the rate of singlenucleotide gains and losses are equivalent. A genome-wide SSR study involving two closely related populationswith a recent out group would be required to determinehow NRUPs effect the equilibrium of SSR length distri-bution in an organism.For at least chicken and D. pulex, these observations
suggest that the specific abundance of specific types ofmicrosatellites within a genome reflects a dynamic bal-ance between changes in repeat number and base sub-stitution. When combined with unequal patterns of basesubstitution, these observations can explain the overa-bundance of specific starting and ending nucleotides inSSR loci (Table 1).
Multi-step variationRecent human microsatellite studies suggest that multi-step variation is a significant component of variation atlarger SSR loci [25], deviating from the SSM model.Furthermore, researchers have shown that the direction-ality of multi-step mutations is length-dependent with acritical repeat number at which contractions are morefrequent than expansions [26], while others suggest thata critical number does not exist [27]. In this experiment,we required that each multistep variant displayed aminimum of at least two full perfect repeats. Our analy-sis revealed two patterns. First, for all motif sizes, the
Figure 3 Percent repeat heterozygosity for each motif size inDaphnia pulex. The X-axis is the repeat number found in theassembly. The Y-axis shows the percent of loci at that motif sizethat are heterozygous. Motif sizes best fit 1-3 an exponential curvewhile motif sizes 4 and 5 best fit a linear pattern. (Motifs 1-5respectively: r2 = 0.975, p < 1e-7; r2 = 0.990, p < 1e-8; r2 = 0.995, p< 1e-6; r2 = 0.824, p < .01; r2 = 0.999, p < .01).
Sung et al. BMC Genomics 2010, 11:691http://www.biomedcentral.com/1471-2164/11/691
Page 5 of 11
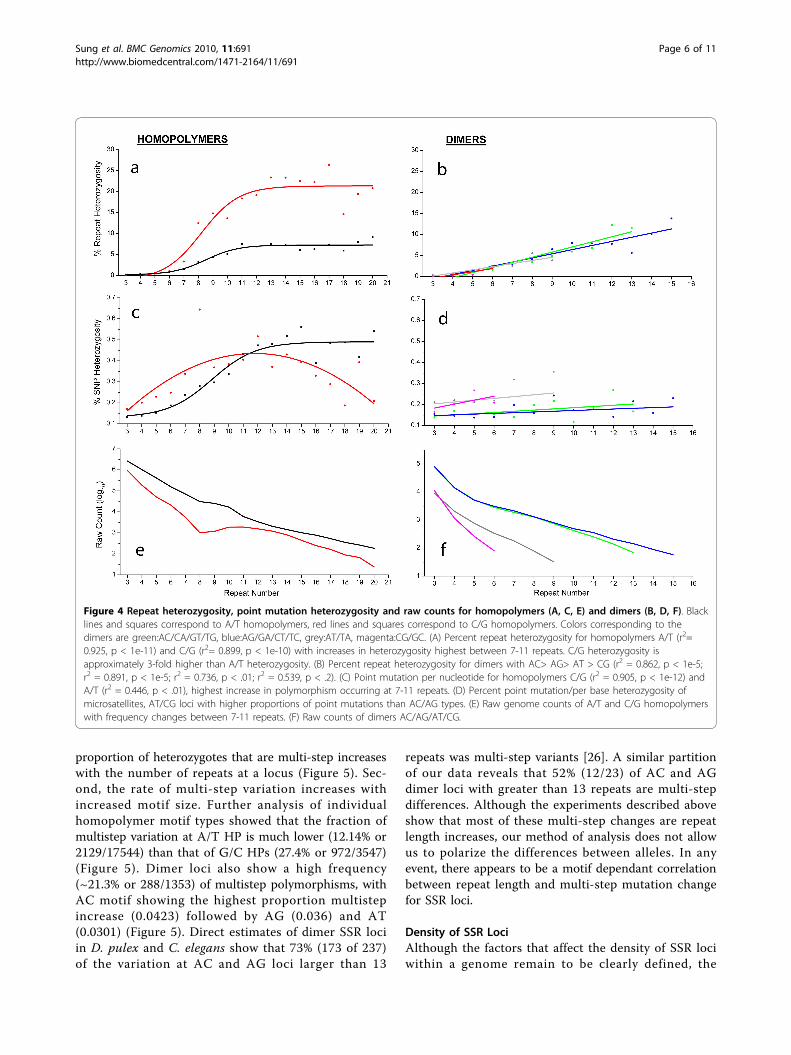
proportion of heterozygotes that are multi-step increaseswith the number of repeats at a locus (Figure 5). Sec-ond, the rate of multi-step variation increases withincreased motif size. Further analysis of individualhomopolymer motif types showed that the fraction ofmultistep variation at A/T HP is much lower (12.14% or2129/17544) than that of G/C HPs (27.4% or 972/3547)(Figure 5). Dimer loci also show a high frequency(~21.3% or 288/1353) of multistep polymorphisms, withAC motif showing the highest proportion multistepincrease (0.0423) followed by AG (0.036) and AT(0.0301) (Figure 5). Direct estimates of dimer SSR lociin D. pulex and C. elegans show that 73% (173 of 237)of the variation at AC and AG loci larger than 13
repeats was multi-step variants [26]. A similar partitionof our data reveals that 52% (12/23) of AC and AGdimer loci with greater than 13 repeats are multi-stepdifferences. Although the experiments described aboveshow that most of these multi-step changes are repeatlength increases, our method of analysis does not allowus to polarize the differences between alleles. In anyevent, there appears to be a motif dependant correlationbetween repeat length and multi-step mutation changefor SSR loci.
Density of SSR LociAlthough the factors that affect the density of SSR lociwithin a genome remain to be clearly defined, the
Figure 4 Repeat heterozygosity, point mutation heterozygosity and raw counts for homopolymers (A, C, E) and dimers (B, D, F). Blacklines and squares correspond to A/T homopolymers, red lines and squares correspond to C/G homopolymers. Colors corresponding to thedimers are green:AC/CA/GT/TG, blue:AG/GA/CT/TC, grey:AT/TA, magenta:CG/GC. (A) Percent repeat heterozygosity for homopolymers A/T (r2=0.925, p < 1e-11) and C/G (r2= 0.899, p < 1e-10) with increases in heterozygosity highest between 7-11 repeats. C/G heterozygosity isapproximately 3-fold higher than A/T heterozygosity. (B) Percent repeat heterozygosity for dimers with AC> AG> AT > CG (r2 = 0.862, p < 1e-5;r2 = 0.891, p < 1e-5; r2 = 0.736, p < .01; r2 = 0.539, p < .2). (C) Point mutation per nucleotide for homopolymers C/G (r2 = 0.905, p < 1e-12) andA/T (r2 = 0.446, p < .01), highest increase in polymorphism occurring at 7-11 repeats. (D) Percent point mutation/per base heterozygosity ofmicrosatellites, AT/CG loci with higher proportions of point mutations than AC/AG types. (E) Raw genome counts of A/T and C/G homopolymerswith frequency changes between 7-11 repeats. (F) Raw counts of dimers AC/AG/AT/CG.
Sung et al. BMC Genomics 2010, 11:691http://www.biomedcentral.com/1471-2164/11/691
Page 6 of 11
density of SSRs within genomes has been positively cor-related with regional rates of recombination in Droso-phila melanogaster [27], Saccharomyces cerevisiae [28],and C. elegans [2]. To evaluate the density of SSR lociin the Daphnia genome, we ranked the density of SSRsin each of the top 100 scaffolds ranging in size from4.19 Mb to 0.47 Mb (Table 3a). Several scaffolds (68, 81,83, 89) show a dearth of HP loci and scaffolds 66 and 98have a paucity of SSRs with five and six base motifsrespectively. While no scaffolds showed an overabun-dance of homopolymers, several scaffolds showed signif-icantly high numbers of SSRs, in particular scaffolds 43,
74, and 76, which have an overabundance of repeats ofmotif sizes greater than 1 bp. Simple sequence repeatshave been shown to play a role in gene regulation [1]and consequently would be in close proximity to genes.To test if these patterns are correlated with gene den-sity, we compared SSR scaffold abundance to Daphniagene predictions [15], and show that none of the overa-bundant scaffolds listed previously are either gene pooror gene rich (Table 3a). Results found in C. elegans [6]also show little correlation between gene density andSSR density.We then used a preliminary genetic map for Daphnia
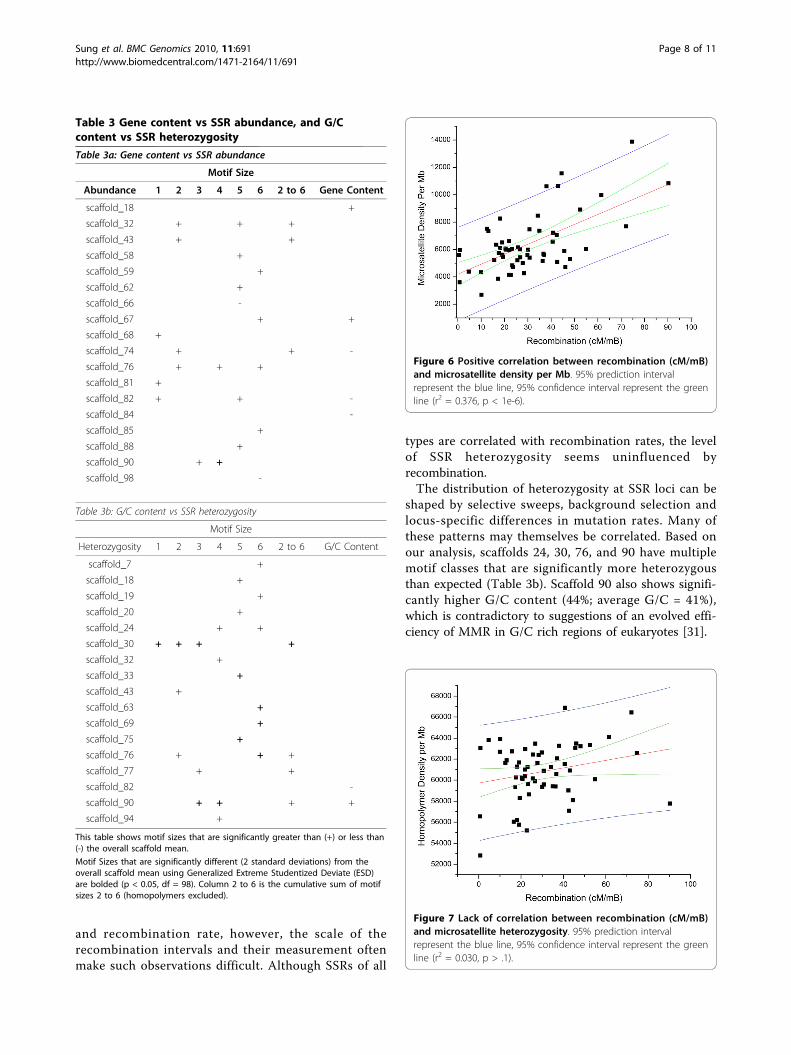
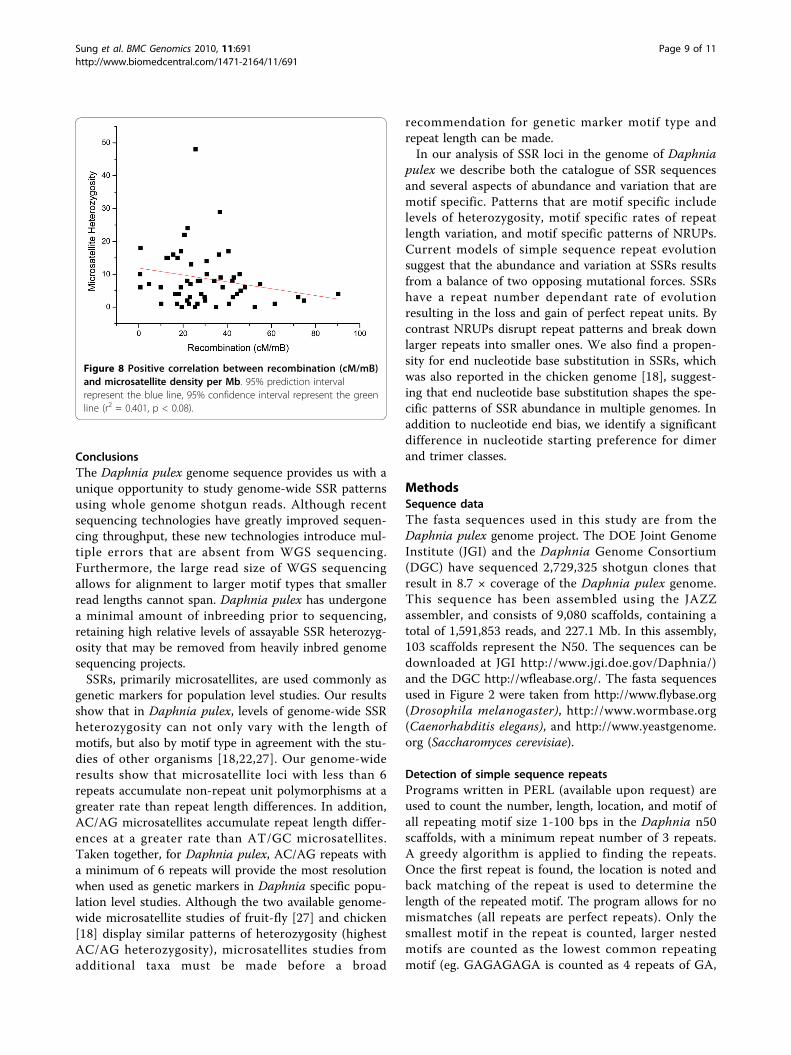
pulex [29] to test for correlations between SSR densityand heterozygosity with rates of recombination withinscaffolds. Based on 61 intervals in the genetic map thatcould be assigned to physical intervals in the top 100scaffolds, we find that the density of microsatellite lociwith motif sizes greater than 1bp show a significantpositive correlation with the rate of recombination (Fig-ure 6). This result is consistent with a yeast study show-ing a high frequency of microsatellite repeats nearmeiotic hotspots [28], and further supports role for SSRloci in the regulation of recombination. Both microsatel-lite repeats (repeats of motif size 2-6), and homopoly-mer repeats (single nucleotide repeats) correlatepositively with recombination rate (Figure 7). Homopo-lymers have array sizes that are considerably larger thanmicrosatellites, giving them properties that may influ-ence recombination frequency.Within the same intervals, no correlation was
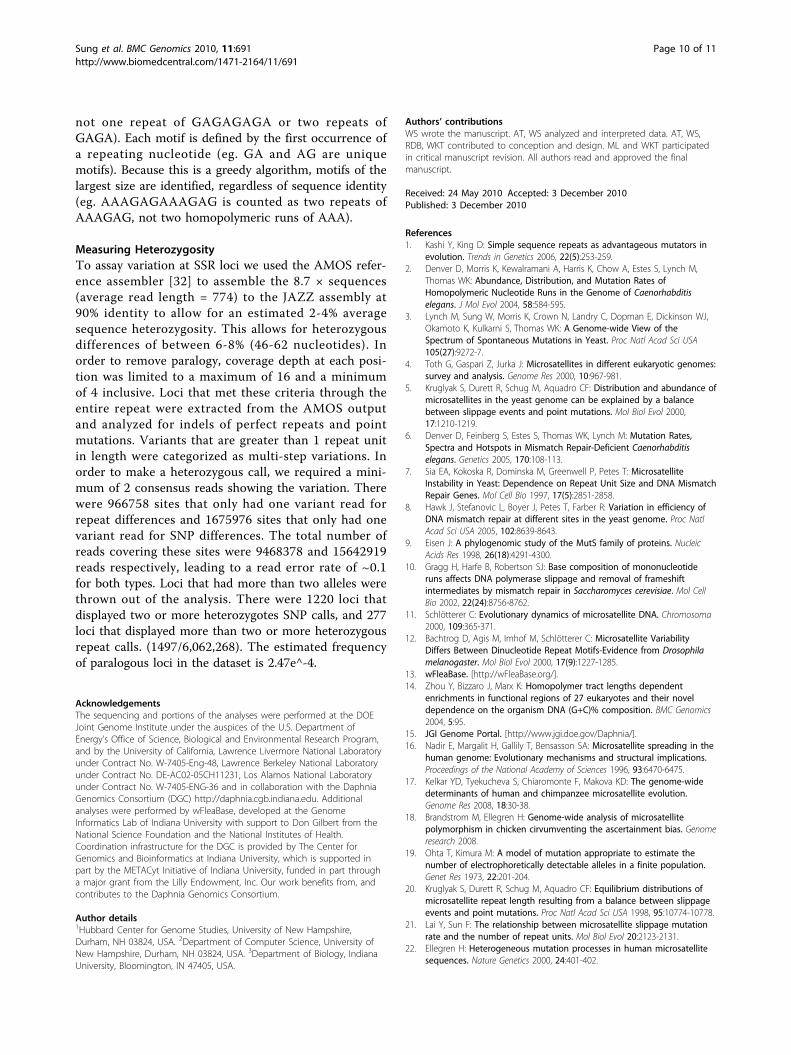
observed between microsatellite heterozygosity andrecombination in Daphnia pulex (Figure 8). A previousmicrosatellite survey in humans [30] also showed no sig-nificant correlation between microsatellite heterozygosity
Table 2 Position of the interruption in imperfect SSR.
Homopolymers
RepeatSize
End(obs)
Middle(obs)
End(exp)
Middle(exp)
p-value
3 15,005 50 10,037 5,018 0
4 5,793 1,392 3,593 3,593 0
5 2,549 1,168 1,487 2,230 5.E-277
6 1,309 735 681 1,363 1.E-190
7 810 492 372 930 5.E-159
8 447 294 185 556 3.E-109
9 459 253 158 554 7.E-162
10 350 285 127 508 2.E-108
11 178 191 67 302 1.E-50
12 119 167 48 238 1.E-29
13 65 121 29 157 1.E-13
14 45 107 22 130 7.E-08
15 34 77 15 96 8.E-08
16 18 43 8 53 6.E-05
17 12 40 6 46 1.E-02
18 6 28 4 30 2.E-01
19 3 23 3 23 9.E-01
20 6 15 2 19 5.E-03
Dimers
Repeat Size End (obs) Middle (obs) End (exp) Middle (exp) p-value
3 1,588 641 1,486 743 5.E-06
4 332 208 270 270 9.E-08
5 121 83 82 122 2.E-08
6 65 61 42 84 1.E-05
7 58 53 32 79 3.E-08
8 47 29 19 57 1.E-13
9 39 30 15 54 7.E-12
10 17 10 5 22 2.E-08
11 11 7 3 15 2.E-06
12 9 7 3 13 2.E-05
13 7 4 2 9 9.E-06
This table shows the position of interruptions in simple sequence repeats.“End” indicates polymorphism at beginning or end of SSR loci, while middlevariation indicates polymorphism occurs at interior positions (eg.Homopolymer with repeat length of three has two possible end nucleotidepositions and one possible middle position. P-value is determined usingPearson’s chi-square test for random expectation.
Figure 5 Percentage of repeat heterozygosity that involvesmore than a single unit. Homopolymers r2 = 0.896, p < 1e-8;Dimers r2 = 0.927, p < 1e-7; Trimers r2 = 0.927, p < 1e-4.
Sung et al. BMC Genomics 2010, 11:691http://www.biomedcentral.com/1471-2164/11/691
Page 7 of 11
and recombination rate, however, the scale of therecombination intervals and their measurement oftenmake such observations difficult. Although SSRs of all
types are correlated with recombination rates, the levelof SSR heterozygosity seems uninfluenced byrecombination.The distribution of heterozygosity at SSR loci can be
shaped by selective sweeps, background selection andlocus-specific differences in mutation rates. Many ofthese patterns may themselves be correlated. Based onour analysis, scaffolds 24, 30, 76, and 90 have multiplemotif classes that are significantly more heterozygousthan expected (Table 3b). Scaffold 90 also shows signifi-cantly higher G/C content (44%; average G/C = 41%),which is contradictory to suggestions of an evolved effi-ciency of MMR in G/C rich regions of eukaryotes [31].
Table 3 Gene content vs SSR abundance, and G/Ccontent vs SSR heterozygosity
Table 3a: Gene content vs SSR abundance
Motif Size
Abundance 1 2 3 4 5 6 2 to 6 Gene Content
scaffold_18 +
scaffold_32 + + +
scaffold_43 + +
scaffold_58 +
scaffold_59 +
scaffold_62 +
scaffold_66 -
scaffold_67 + +
scaffold_68 +
scaffold_74 + + -
scaffold_76 + + +
scaffold_81 +
scaffold_82 + + -
scaffold_84 -
scaffold_85 +
scaffold_88 +
scaffold_90 + +
scaffold_98 -
Table 3b: G/C content vs SSR heterozygosity
Motif Size
Heterozygosity 1 2 3 4 5 6 2 to 6 G/C Content
scaffold_7 +
scaffold_18 +
scaffold_19 +
scaffold_20 +
scaffold_24 + +
scaffold_30 + + + +
scaffold_32 +
scaffold_33 +
scaffold_43 +
scaffold_63 +
scaffold_69 +
scaffold_75 +
scaffold_76 + + +
scaffold_77 + +
scaffold_82 -
scaffold_90 + + + +
scaffold_94 +
This table shows motif sizes that are significantly greater than (+) or less than(-) the overall scaffold mean.
Motif Sizes that are significantly different (2 standard deviations) from theoverall scaffold mean using Generalized Extreme Studentized Deviate (ESD)are bolded (p < 0.05, df = 98). Column 2 to 6 is the cumulative sum of motifsizes 2 to 6 (homopolymers excluded).
Figure 6 Positive correlation between recombination (cM/mB)and microsatellite density per Mb. 95% prediction intervalrepresent the blue line, 95% confidence interval represent the greenline (r2 = 0.376, p < 1e-6).
Figure 7 Lack of correlation between recombination (cM/mB)and microsatellite heterozygosity. 95% prediction intervalrepresent the blue line, 95% confidence interval represent the greenline (r2 = 0.030, p > .1).
Sung et al. BMC Genomics 2010, 11:691http://www.biomedcentral.com/1471-2164/11/691
Page 8 of 11
ConclusionsThe Daphnia pulex genome sequence provides us with aunique opportunity to study genome-wide SSR patternsusing whole genome shotgun reads. Although recentsequencing technologies have greatly improved sequen-cing throughput, these new technologies introduce mul-tiple errors that are absent from WGS sequencing.Furthermore, the large read size of WGS sequencingallows for alignment to larger motif types that smallerread lengths cannot span. Daphnia pulex has undergonea minimal amount of inbreeding prior to sequencing,retaining high relative levels of assayable SSR heterozyg-osity that may be removed from heavily inbred genomesequencing projects.SSRs, primarily microsatellites, are used commonly as
genetic markers for population level studies. Our resultsshow that in Daphnia pulex, levels of genome-wide SSRheterozygosity can not only vary with the length ofmotifs, but also by motif type in agreement with the stu-dies of other organisms [18,22,27]. Our genome-wideresults show that microsatellite loci with less than 6repeats accumulate non-repeat unit polymorphisms at agreater rate than repeat length differences. In addition,AC/AG microsatellites accumulate repeat length differ-ences at a greater rate than AT/GC microsatellites.Taken together, for Daphnia pulex, AC/AG repeats witha minimum of 6 repeats will provide the most resolutionwhen used as genetic markers in Daphnia specific popu-lation level studies. Although the two available genome-wide microsatellite studies of fruit-fly [27] and chicken[18] display similar patterns of heterozygosity (highestAC/AG heterozygosity), microsatellites studies fromadditional taxa must be made before a broad
recommendation for genetic marker motif type andrepeat length can be made.In our analysis of SSR loci in the genome of Daphnia
pulex we describe both the catalogue of SSR sequencesand several aspects of abundance and variation that aremotif specific. Patterns that are motif specific includelevels of heterozygosity, motif specific rates of repeatlength variation, and motif specific patterns of NRUPs.Current models of simple sequence repeat evolutionsuggest that the abundance and variation at SSRs resultsfrom a balance of two opposing mutational forces. SSRshave a repeat number dependant rate of evolutionresulting in the loss and gain of perfect repeat units. Bycontrast NRUPs disrupt repeat patterns and break downlarger repeats into smaller ones. We also find a propen-sity for end nucleotide base substitution in SSRs, whichwas also reported in the chicken genome [18], suggest-ing that end nucleotide base substitution shapes the spe-cific patterns of SSR abundance in multiple genomes. Inaddition to nucleotide end bias, we identify a significantdifference in nucleotide starting preference for dimerand trimer classes.
MethodsSequence dataThe fasta sequences used in this study are from theDaphnia pulex genome project. The DOE Joint GenomeInstitute (JGI) and the Daphnia Genome Consortium(DGC) have sequenced 2,729,325 shotgun clones thatresult in 8.7 × coverage of the Daphnia pulex genome.This sequence has been assembled using the JAZZassembler, and consists of 9,080 scaffolds, containing atotal of 1,591,853 reads, and 227.1 Mb. In this assembly,103 scaffolds represent the N50. The sequences can bedownloaded at JGI http://www.jgi.doe.gov/Daphnia/)and the DGC http://wfleabase.org/. The fasta sequencesused in Figure 2 were taken from http://www.flybase.org(Drosophila melanogaster), http://www.wormbase.org(Caenorhabditis elegans), and http://www.yeastgenome.org (Saccharomyces cerevisiae).
Detection of simple sequence repeatsPrograms written in PERL (available upon request) areused to count the number, length, location, and motif ofall repeating motif size 1-100 bps in the Daphnia n50scaffolds, with a minimum repeat number of 3 repeats.A greedy algorithm is applied to finding the repeats.Once the first repeat is found, the location is noted andback matching of the repeat is used to determine thelength of the repeated motif. The program allows for nomismatches (all repeats are perfect repeats). Only thesmallest motif in the repeat is counted, larger nestedmotifs are counted as the lowest common repeatingmotif (eg. GAGAGAGA is counted as 4 repeats of GA,
Figure 8 Positive correlation between recombination (cM/mB)and microsatellite density per Mb. 95% prediction intervalrepresent the blue line, 95% confidence interval represent the greenline (r2 = 0.401, p < 0.08).
Sung et al. BMC Genomics 2010, 11:691http://www.biomedcentral.com/1471-2164/11/691
Page 9 of 11
not one repeat of GAGAGAGA or two repeats ofGAGA). Each motif is defined by the first occurrence ofa repeating nucleotide (eg. GA and AG are uniquemotifs). Because this is a greedy algorithm, motifs of thelargest size are identified, regardless of sequence identity(eg. AAAGAGAAAGAG is counted as two repeats ofAAAGAG, not two homopolymeric runs of AAA).
Measuring HeterozygosityTo assay variation at SSR loci we used the AMOS refer-ence assembler [32] to assemble the 8.7 × sequences(average read length = 774) to the JAZZ assembly at90% identity to allow for an estimated 2-4% averagesequence heterozygosity. This allows for heterozygousdifferences of between 6-8% (46-62 nucleotides). Inorder to remove paralogy, coverage depth at each posi-tion was limited to a maximum of 16 and a minimumof 4 inclusive. Loci that met these criteria through theentire repeat were extracted from the AMOS outputand analyzed for indels of perfect repeats and pointmutations. Variants that are greater than 1 repeat unitin length were categorized as multi-step variations. Inorder to make a heterozygous call, we required a mini-mum of 2 consensus reads showing the variation. Therewere 966758 sites that only had one variant read forrepeat differences and 1675976 sites that only had onevariant read for SNP differences. The total number ofreads covering these sites were 9468378 and 15642919reads respectively, leading to a read error rate of ~0.1for both types. Loci that had more than two alleles werethrown out of the analysis. There were 1220 loci thatdisplayed two or more heterozygotes SNP calls, and 277loci that displayed more than two or more heterozygousrepeat calls. (1497/6,062,268). The estimated frequencyof paralogous loci in the dataset is 2.47e^-4.
AcknowledgementsThe sequencing and portions of the analyses were performed at the DOEJoint Genome Institute under the auspices of the U.S. Department ofEnergy’s Office of Science, Biological and Environmental Research Program,and by the University of California, Lawrence Livermore National Laboratoryunder Contract No. W-7405-Eng-48, Lawrence Berkeley National Laboratoryunder Contract No. DE-AC02-05CH11231, Los Alamos National Laboratoryunder Contract No. W-7405-ENG-36 and in collaboration with the DaphniaGenomics Consortium (DGC) http://daphnia.cgb.indiana.edu. Additionalanalyses were performed by wFleaBase, developed at the GenomeInformatics Lab of Indiana University with support to Don Gilbert from theNational Science Foundation and the National Institutes of Health.Coordination infrastructure for the DGC is provided by The Center forGenomics and Bioinformatics at Indiana University, which is supported inpart by the METACyt Initiative of Indiana University, funded in part througha major grant from the Lilly Endowment, Inc. Our work benefits from, andcontributes to the Daphnia Genomics Consortium.
Author details1Hubbard Center for Genome Studies, University of New Hampshire,Durham, NH 03824, USA. 2Department of Computer Science, University ofNew Hampshire, Durham, NH 03824, USA. 3Department of Biology, IndianaUniversity, Bloomington, IN 47405, USA.
Authors’ contributionsWS wrote the manuscript. AT, WS analyzed and interpreted data. AT, WS,RDB, WKT contributed to conception and design. ML and WKT participatedin critical manuscript revision. All authors read and approved the finalmanuscript.
Received: 24 May 2010 Accepted: 3 December 2010Published: 3 December 2010
References1. Kashi Y, King D: Simple sequence repeats as advantageous mutators in
evolution. Trends in Genetics 2006, 22(5):253-259.2. Denver D, Morris K, Kewalramani A, Harris K, Chow A, Estes S, Lynch M,
Thomas WK: Abundance, Distribution, and Mutation Rates ofHomopolymeric Nucleotide Runs in the Genome of Caenorhabditiselegans. J Mol Evol 2004, 58:584-595.
3. Lynch M, Sung W, Morris K, Crown N, Landry C, Dopman E, Dickinson WJ,Okamoto K, Kulkarni S, Thomas WK: A Genome-wide View of theSpectrum of Spontaneous Mutations in Yeast. Proc Natl Acad Sci USA105(27):9272-7.
4. Toth G, Gaspari Z, Jurka J: Microsatellites in different eukaryotic genomes:survey and analysis. Genome Res 2000, 10:967-981.
5. Kruglyak S, Durett R, Schug M, Aquadro CF: Distribution and abundance ofmicrosatellites in the yeast genome can be explained by a balancebetween slippage events and point mutations. Mol Biol Evol 2000,17:1210-1219.
6. Denver D, Feinberg S, Estes S, Thomas WK, Lynch M: Mutation Rates,Spectra and Hotspots in Mismatch Repair-Deficient Caenorhabditiselegans. Genetics 2005, 170:108-113.
7. Sia EA, Kokoska R, Dominska M, Greenwell P, Petes T: MicrosatelliteInstability in Yeast: Dependence on Repeat Unit Size and DNA MismatchRepair Genes. Mol Cell Bio 1997, 17(5):2851-2858.
8. Hawk J, Stefanovic L, Boyer J, Petes T, Farber R: Variation in efficiency ofDNA mismatch repair at different sites in the yeast genome. Proc NatlAcad Sci USA 2005, 102:8639-8643.
9. Eisen J: A phylogenomic study of the MutS family of proteins. NucleicAcids Res 1998, 26(18):4291-4300.
10. Gragg H, Harfe B, Robertson SJ: Base composition of mononucleotideruns affects DNA polymerase slippage and removal of frameshiftintermediates by mismatch repair in Saccharomyces cerevisiae. Mol CellBio 2002, 22(24):8756-8762.
11. Schlötterer C: Evolutionary dynamics of microsatellite DNA. Chromosoma2000, 109:365-371.
12. Bachtrog D, Agis M, Imhof M, Schlötterer C: Microsatellite VariabilityDiffers Between Dinucleotide Repeat Motifs-Evidence from Drosophilamelanogaster. Mol Biol Evol 2000, 17(9):1227-1285.
13. wFleaBase. [http://wFleaBase.org/].14. Zhou Y, Bizzaro J, Marx K: Homopolymer tract lengths dependent
enrichments in functional regions of 27 eukaryotes and their noveldependence on the organism DNA (G+C)% composition. BMC Genomics2004, 5:95.
15. JGI Genome Portal. [http://www.jgi.doe.gov/Daphnia/].16. Nadir E, Margalit H, Gallily T, Bensasson SA: Microsatellite spreading in the
human genome: Evolutionary mechanisms and structural implications.Proceedings of the National Academy of Sciences 1996, 93:6470-6475.
17. Kelkar YD, Tyekucheva S, Chiaromonte F, Makova KD: The genome-widedeterminants of human and chimpanzee microsatellite evolution.Genome Res 2008, 18:30-38.
18. Brandstrom M, Ellegren H: Genome-wide analysis of microsatellitepolymorphism in chicken cirvumventing the ascertainment bias. Genomeresearch 2008.
19. Ohta T, Kimura M: A model of mutation appropriate to estimate thenumber of electrophoretically detectable alleles in a finite population.Genet Res 1973, 22:201-204.
20. Kruglyak S, Durett R, Schug M, Aquadro CF: Equilibrium distributions ofmicrosatellite repeat length resulting from a balance between slippageevents and point mutations. Proc Natl Acad Sci USA 1998, 95:10774-10778.
21. Lai Y, Sun F: The relationship between microsatellite slippage mutationrate and the number of repeat units. Mol Biol Evol 20:2123-2131.
22. Ellegren H: Heterogeneous mutation processes in human microsatellitesequences. Nature Genetics 2000, 24:401-402.
Sung et al. BMC Genomics 2010, 11:691http://www.biomedcentral.com/1471-2164/11/691
Page 10 of 11
23. Rose O, Falush D: A Threshold Size for Microsatellite Expansion. Mol BiolEvol 15(5):613-615.
24. Ellegren H: Microsatellites: Simple sequences with complex evolution.Nature Review Genetics 2004, 5:435-444.
25. Xu X, Peng M, Fang Z: The direction of microsatellite mutations isdependent upon allele length. Nature Genet 2000, 24:396-399.
26. Seyfert A, Cristescu M, Frisse L, Schaack S, Thomas WK, Lynch M: The rateand spectrum of microsatellite mutation in Caenorhabditis elegans andDaphnia pulex. Genetics 2008, 178:2113-2121.
27. Schug M, Hutter C, Noor M, Aquadro C: Mutation and evolution ofmicrosatellites in Drosophila melanogaster. Genetica 1998,102(103):359-367.
28. Bagshaw A, Pitt J, Gemmell N: High frequency of microsatellites in S.cerevisiae meiotic recombination hotspots. BMC Genomics 2008, 9:49.
29. Cristescu M, Colbourne J, Radivojac J, Lynch M: A microsatellite-basedgenetic linkage map of the waterflea, Daphnia pulex: On the prospect ofcrustacean genomics. Genomics 2006, 88:415-430.
30. Payseur B, Nachman M: Microsatellite Variation and Recombination Ratein the Human Genome. Genetics 2000, 156:1285-1298.
31. Birdsell J: Integrating genomics, Bioinformatics, and Classical Genetics toStudy the Effects of Recombination on Genome Evolution. Mol Bio Evol19(7):1181-1197.
32. AMOS: A Modular Open-Source Assembler [http://amos.sourceforge.net/].
doi:10.1186/1471-2164-11-691Cite this article as: Sung et al.: Simple sequence repeat variation in theDaphnia pulex genome. BMC Genomics 2010 11:691.
Submit your next manuscript to BioMed Centraland take full advantage of:
• Convenient online submission
• Thorough peer review
• No space constraints or color figure charges
• Immediate publication on acceptance
• Inclusion in PubMed, CAS, Scopus and Google Scholar
• Research which is freely available for redistribution
Submit your manuscript at www.biomedcentral.com/submit
Sung et al. BMC Genomics 2010, 11:691http://www.biomedcentral.com/1471-2164/11/691
Page 11 of 11
![Centennial clonal stability of asexual Daphnia in ... · 7/22/2020 · 88 Daphnia, in particular the large-bodied Daphnia pulex-complex [7]. Arctic Daphnia 89 populations are generally](https://img.pdfslide.net/doc/110x75/5fb33315ffe483517d15d37c/centennial-clonal-stability-of-asexual-daphnia-in-7222020-88-daphnia-in.jpg)


![Oxford Cambridge and RSA AS Level Biology B (Advancing ......[1] 8 A group of students investigated the effects of ethanol on the heart rate of the water flea, Daphnia pulex, and then](https://img.pdfslide.net/doc/110x75/60258224136af74cf4183507/oxford-cambridge-and-rsa-as-level-biology-b-advancing-1-8-a-group-of.jpg)