Embed Size (px)
Citation preview
Simplified Workflow Using Automated Instrument Setup and Compensation on the BD FACSLyric™ Flow CytometerCasey J Fox,1 Mamatha Bharadwaj,1 Dina Huckaby,1 Maclean Nyachienga,1 Bao Nguyen,1 Rebecca Hershock-Quintana,1 Darci Gorgone Chavez,1 Nathan Whizin,1 and Alan Stall2
1 BD Life Sciences, San Jose, USA 2 BD Life Sciences, San Diego, USA
SummaryFlow cytometry is a powerful tool for the single-cell analysis of patient samples. As clinical flow experiments increase in size and complexity, there is a need for instrument solutions that deliver both a streamlined, user-friendly workflow and exceptional performance. In this application note, we highlight key usability and performance features of the 10-color BD FACSLyric™ platform. We show that the BD FACSLyric, in conjunction with BD FACSuite™ Clinical software, BD™ Cytometer Setup and Tracking (CS&T) beads, and BD™ FC beads, delivers a simple and efficient user workflow from instrument startup and setup through data acquisition and analysis. We evaluated the reproducibility of median fluorescence intensity (MFI) across time and between cytometers, as well as resolution sensitivity, using BD CS&T beads and stained cells. The reproducibility of fluorescence spillover was measured using BD FC beads and stained cells. To assess accuracy and reproducibility during automated cytometer setup, the performance of three to six 10-color BD FACSLyric cytometers was measured over two months. Finally, overall performance was assessed using a multicolor assay for T, B, and NK cells in peripheral blood from HIV patients and controls. Taken together, these results show that the BD FACSLyric system provides unique tools to the clinical user to help achieve reproducible and consistent results across time and instruments.
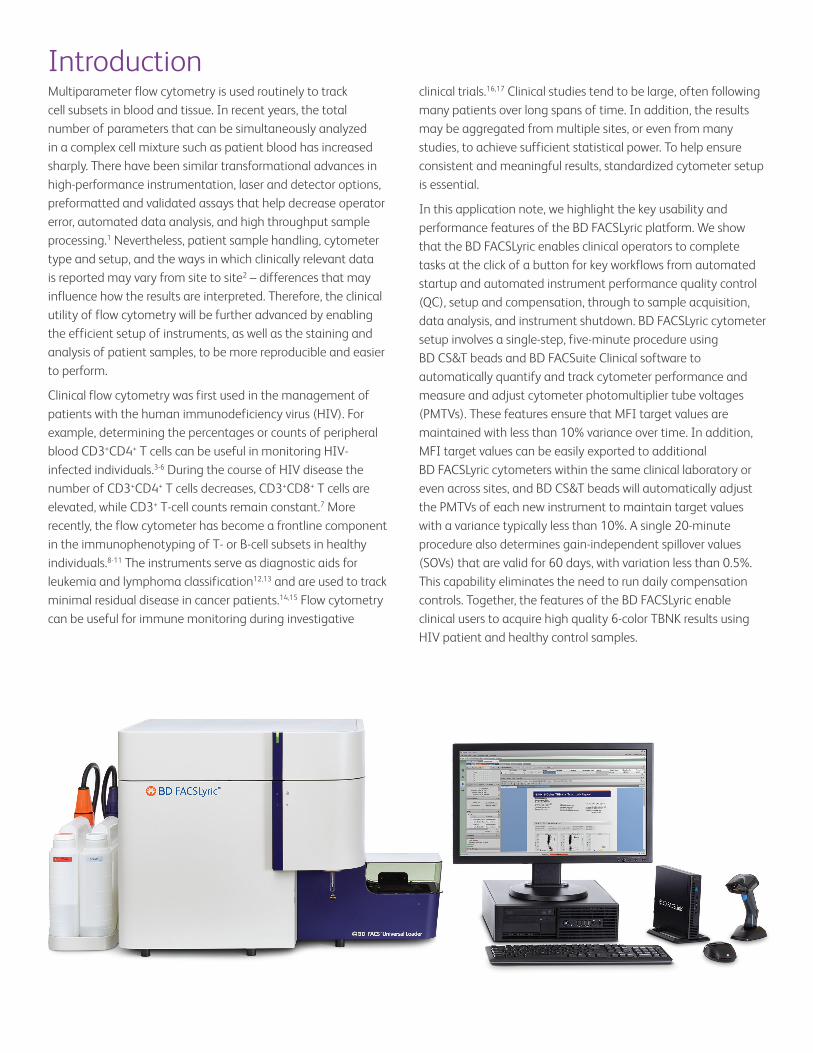
IntroductionMultiparameter flow cytometry is used routinely to track cell subsets in blood and tissue. In recent years, the total number of parameters that can be simultaneously analyzed in a complex cell mixture such as patient blood has increased sharply. There have been similar transformational advances in high-performance instrumentation, laser and detector options, preformatted and validated assays that help decrease operator error, automated data analysis, and high throughput sample processing.1 Nevertheless, patient sample handling, cytometer type and setup, and the ways in which clinically relevant data is reported may vary from site to site2 – differences that may influence how the results are interpreted. Therefore, the clinical utility of flow cytometry will be further advanced by enabling the efficient setup of instruments, as well as the staining and analysis of patient samples, to be more reproducible and easier to perform.
Clinical flow cytometry was first used in the management of patients with the human immunodeficiency virus (HIV). For example, determining the percentages or counts of peripheral blood CD3+CD4+ T cells can be useful in monitoring HIV-infected individuals.3-6 During the course of HIV disease the number of CD3+CD4+ T cells decreases, CD3+CD8+ T cells are elevated, while CD3+ T-cell counts remain constant.7 More recently, the flow cytometer has become a frontline component in the immunophenotyping of T- or B-cell subsets in healthy individuals.8-11 The instruments serve as diagnostic aids for leukemia and lymphoma classification12,13 and are used to track minimal residual disease in cancer patients.14,15 Flow cytometry can be useful for immune monitoring during investigative
clinical trials.16,17 Clinical studies tend to be large, often following many patients over long spans of time. In addition, the results may be aggregated from multiple sites, or even from many studies, to achieve sufficient statistical power. To help ensure consistent and meaningful results, standardized cytometer setup is essential.
In this application note, we highlight the key usability and performance features of the BD FACSLyric platform. We show that the BD FACSLyric enables clinical operators to complete tasks at the click of a button for key workflows from automated startup and automated instrument performance quality control (QC), setup and compensation, through to sample acquisition, data analysis, and instrument shutdown. BD FACSLyric cytometer setup involves a single-step, five-minute procedure using BD CS&T beads and BD FACSuite Clinical software to automatically quantify and track cytometer performance and measure and adjust cytometer photomultiplier tube voltages (PMTVs). These features ensure that MFI target values are maintained with less than 10% variance over time. In addition, MFI target values can be easily exported to additional BD FACSLyric cytometers within the same clinical laboratory or even across sites, and BD CS&T beads will automatically adjust the PMTVs of each new instrument to maintain target values with a variance typically less than 10%. A single 20-minute procedure also determines gain-independent spillover values (SOVs) that are valid for 60 days, with variation less than 0.5%. This capability eliminates the need to run daily compensation controls. Together, the features of the BD FACSLyric enable clinical users to acquire high quality 6-color TBNK results using HIV patient and healthy control samples.
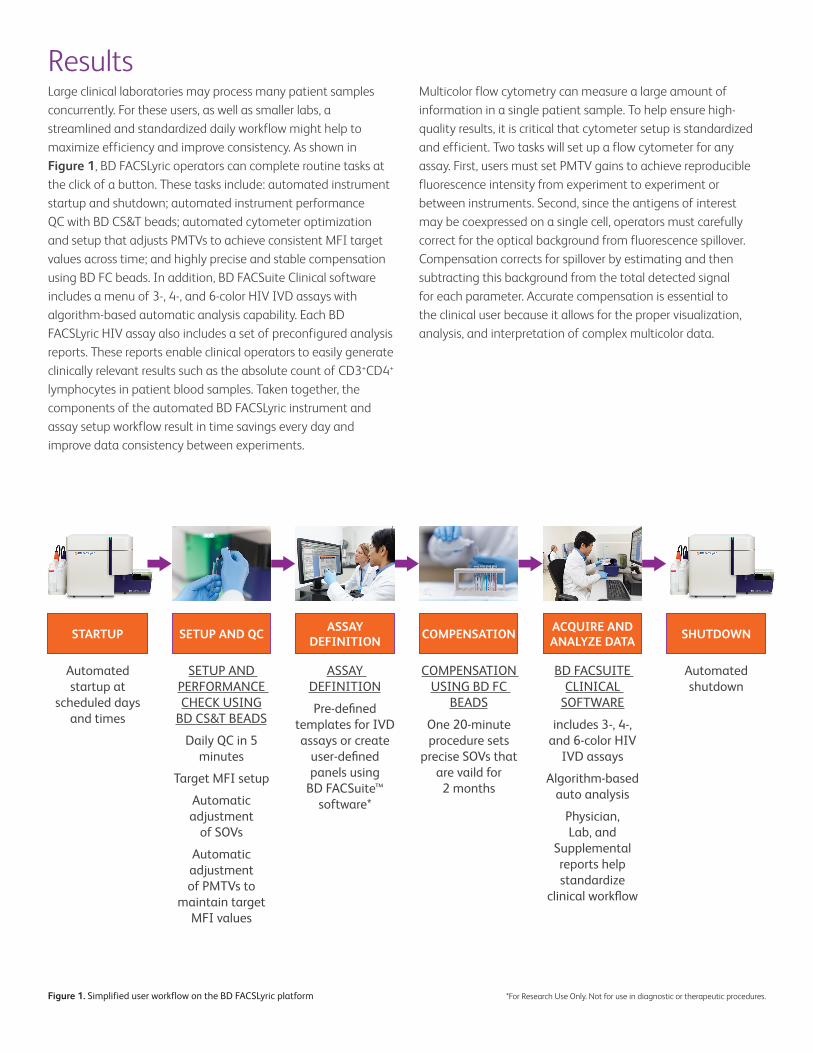
ResultsLarge clinical laboratories may process many patient samples concurrently. For these users, as well as smaller labs, a streamlined and standardized daily workflow might help to maximize efficiency and improve consistency. As shown in Figure 1, BD FACSLyric operators can complete routine tasks at the click of a button. These tasks include: automated instrument startup and shutdown; automated instrument performance QC with BD CS&T beads; automated cytometer optimization and setup that adjusts PMTVs to achieve consistent MFI target values across time; and highly precise and stable compensation using BD FC beads. In addition, BD FACSuite Clinical software includes a menu of 3-, 4-, and 6-color HIV IVD assays with algorithm-based automatic analysis capability. Each BD FACSLyric HIV assay also includes a set of preconfigured analysis reports. These reports enable clinical operators to easily generate clinically relevant results such as the absolute count of CD3+CD4+ lymphocytes in patient blood samples. Taken together, the components of the automated BD FACSLyric instrument and assay setup workflow result in time savings every day and improve data consistency between experiments.
Multicolor flow cytometry can measure a large amount of information in a single patient sample. To help ensure high-quality results, it is critical that cytometer setup is standardized and efficient. Two tasks will set up a flow cytometer for any assay. First, users must set PMTV gains to achieve reproducible fluorescence intensity from experiment to experiment or between instruments. Second, since the antigens of interest may be coexpressed on a single cell, operators must carefully correct for the optical background from fluorescence spillover. Compensation corrects for spillover by estimating and then subtracting this background from the total detected signal for each parameter. Accurate compensation is essential to the clinical user because it allows for the proper visualization, analysis, and interpretation of complex multicolor data.
Figure 1. Simplified user workflow on the BD FACSLyric platform
STARTUP
Automated startup at
scheduled days and times
SHUTDOWN
Automated shutdown
ASSAYDEFINITION
ASSAY DEFINITION
Pre-defined templates for IVD assays or create
user-defined panels using
BD FACSuite™ software*
COMPENSATION
COMPENSATION USING BD FC
BEADS
One 20-minute procedure sets
precise SOVs that are vaild for
2 months
SETUP AND QC
SETUP AND PERFORMANCE CHECK USING
BD CS&T BEADS
Daily QC in 5 minutes
Target MFI setup
Automatic adjustment
of SOVs
Automatic adjustment of PMTVs to
maintain target MFI values
ACQUIRE AND ANALYZE DATA
BD FACSUITE CLINICAL
SOFTWARE
includes 3-, 4-, and 6-color HIV
IVD assays
Algorithm-based auto analysis
Physician, Lab, and
Supplemental reports help standardize
clinical workflow
*For Research Use Only. Not for use in diagnostic or therapeutic procedures.
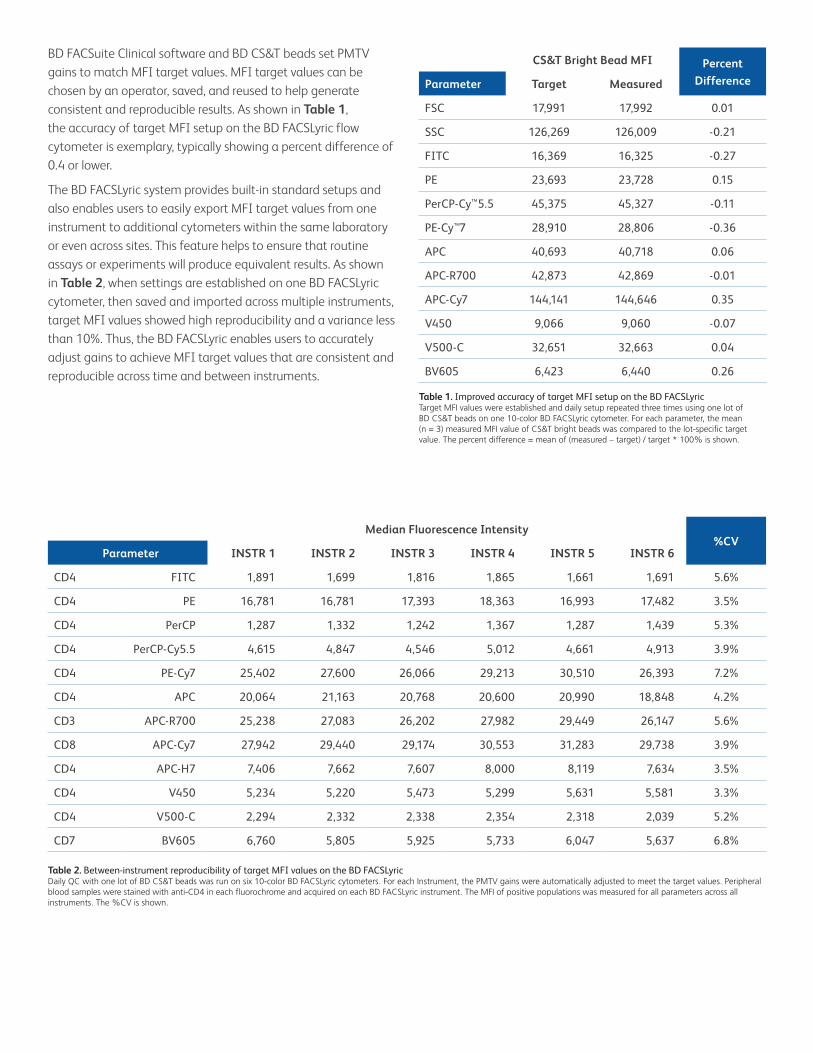
BD FACSuite Clinical software and BD CS&T beads set PMTV gains to match MFI target values. MFI target values can be chosen by an operator, saved, and reused to help generate consistent and reproducible results. As shown in Table 1, the accuracy of target MFI setup on the BD FACSLyric flow cytometer is exemplary, typically showing a percent difference of 0.4 or lower.
The BD FACSLyric system provides built-in standard setups and also enables users to easily export MFI target values from one instrument to additional cytometers within the same laboratory or even across sites. This feature helps to ensure that routine assays or experiments will produce equivalent results. As shown in Table 2, when settings are established on one BD FACSLyric cytometer, then saved and imported across multiple instruments, target MFI values showed high reproducibility and a variance less than 10%. Thus, the BD FACSLyric enables users to accurately adjust gains to achieve MFI target values that are consistent and reproducible across time and between instruments.
Table 1. Improved accuracy of target MFI setup on the BD FACSLyricTarget MFI values were established and daily setup repeated three times using one lot of BD CS&T beads on one 10-color BD FACSLyric cytometer. For each parameter, the mean (n = 3) measured MFI value of CS&T bright beads was compared to the lot-specific target value. The percent difference = mean of (measured – target) / target * 100% is shown.
Table 2. Between-instrument reproducibility of target MFI values on the BD FACSLyricDaily QC with one lot of BD CS&T beads was run on six 10-color BD FACSLyric cytometers. For each Instrument, the PMTV gains were automatically adjusted to meet the target values. Peripheral blood samples were stained with anti-CD4 in each fluorochrome and acquired on each BD FACSLyric instrument. The MFI of positive populations was measured for all parameters across all instruments. The %CV is shown.
CS&T Bright Bead MFI Percent DifferenceParameter Target Measured
FSC 17,991 17,992 0.01
SSC 126,269 126,009 -0.21
FITC 16,369 16,325 -0.27
PE 23,693 23,728 0.15
PerCP-Cy™5.5 45,375 45,327 -0.11
PE-Cy™7 28,910 28,806 -0.36
APC 40,693 40,718 0.06
APC-R700 42,873 42,869 -0.01
APC-Cy7 144,141 144,646 0.35
V450 9,066 9,060 -0.07
V500-C 32,651 32,663 0.04
BV605 6,423 6,440 0.26
Median Fluorescence Intensity%CV
Parameter INSTR 1 INSTR 2 INSTR 3 INSTR 4 INSTR 5 INSTR 6
CD4 FITC 1,891 1,699 1,816 1,865 1,661 1,691 5.6%
CD4 PE 16,781 16,781 17,393 18,363 16,993 17,482 3.5%
CD4 PerCP 1,287 1,332 1,242 1,367 1,287 1,439 5.3%
CD4 PerCP-Cy5.5 4,615 4,847 4,546 5,012 4,661 4,913 3.9%
CD4 PE-Cy7 25,402 27,600 26,066 29,213 30,510 26,393 7.2%
CD4 APC 20,064 21,163 20,768 20,600 20,990 18,848 4.2%
CD3 APC-R700 25,238 27,083 26,202 27,982 29,449 26,147 5.6%
CD8 APC-Cy7 27,942 29,440 29,174 30,553 31,283 29,738 3.9%
CD4 APC-H7 7,406 7,662 7,607 8,000 8,119 7,634 3.5%
CD4 V450 5,234 5,220 5,473 5,299 5,631 5,581 3.3%
CD4 V500-C 2,294 2,332 2,338 2,354 2,318 2,039 5.2%
CD7 BV605 6,760 5,805 5,925 5,733 6,047 5,637 6.8%
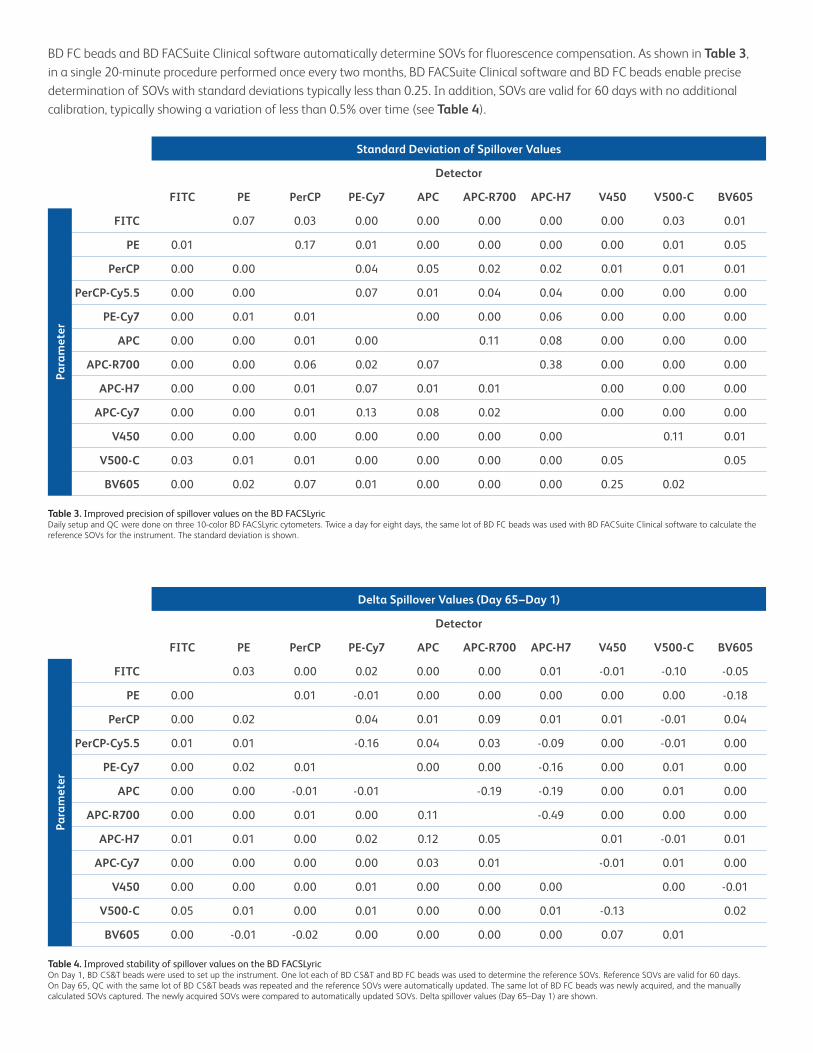
BD FC beads and BD FACSuite Clinical software automatically determine SOVs for fluorescence compensation. As shown in Table 3, in a single 20-minute procedure performed once every two months, BD FACSuite Clinical software and BD FC beads enable precise determination of SOVs with standard deviations typically less than 0.25. In addition, SOVs are valid for 60 days with no additional calibration, typically showing a variation of less than 0.5% over time (see Table 4).
Table 3. Improved precision of spillover values on the BD FACSLyricDaily setup and QC were done on three 10-color BD FACSLyric cytometers. Twice a day for eight days, the same lot of BD FC beads was used with BD FACSuite Clinical software to calculate the reference SOVs for the instrument. The standard deviation is shown.
Table 4. Improved stability of spillover values on the BD FACSLyricOn Day 1, BD CS&T beads were used to set up the instrument. One lot each of BD CS&T and BD FC beads was used to determine the reference SOVs. Reference SOVs are valid for 60 days. On Day 65, QC with the same lot of BD CS&T beads was repeated and the reference SOVs were automatically updated. The same lot of BD FC beads was newly acquired, and the manually calculated SOVs captured. The newly acquired SOVs were compared to automatically updated SOVs. Delta spillover values (Day 65–Day 1) are shown.
Standard Deviation of Spillover Values
Detector
FITC PE PerCP PE-Cy7 APC APC-R700 APC-H7 V450 V500-C BV605
Para
met
er
FITC 0.07 0.03 0.00 0.00 0.00 0.00 0.00 0.03 0.01
PE 0.01 0.17 0.01 0.00 0.00 0.00 0.00 0.01 0.05
PerCP 0.00 0.00 0.04 0.05 0.02 0.02 0.01 0.01 0.01
PerCP-Cy5.5 0.00 0.00 0.07 0.01 0.04 0.04 0.00 0.00 0.00
PE-Cy7 0.00 0.01 0.01 0.00 0.00 0.06 0.00 0.00 0.00
APC 0.00 0.00 0.01 0.00 0.11 0.08 0.00 0.00 0.00
APC-R700 0.00 0.00 0.06 0.02 0.07 0.38 0.00 0.00 0.00
APC-H7 0.00 0.00 0.01 0.07 0.01 0.01 0.00 0.00 0.00
APC-Cy7 0.00 0.00 0.01 0.13 0.08 0.02 0.00 0.00 0.00
V450 0.00 0.00 0.00 0.00 0.00 0.00 0.00 0.11 0.01
V500-C 0.03 0.01 0.01 0.00 0.00 0.00 0.00 0.05 0.05
BV605 0.00 0.02 0.07 0.01 0.00 0.00 0.00 0.25 0.02
Delta Spillover Values (Day 65–Day 1)
Detector
FITC PE PerCP PE-Cy7 APC APC-R700 APC-H7 V450 V500-C BV605
Para
met
er
FITC 0.03 0.00 0.02 0.00 0.00 0.01 -0.01 -0.10 -0.05
PE 0.00 0.01 -0.01 0.00 0.00 0.00 0.00 0.00 -0.18
PerCP 0.00 0.02 0.04 0.01 0.09 0.01 0.01 -0.01 0.04
PerCP-Cy5.5 0.01 0.01 -0.16 0.04 0.03 -0.09 0.00 -0.01 0.00
PE-Cy7 0.00 0.02 0.01 0.00 0.00 -0.16 0.00 0.01 0.00
APC 0.00 0.00 -0.01 -0.01 -0.19 -0.19 0.00 0.01 0.00
APC-R700 0.00 0.00 0.01 0.00 0.11 -0.49 0.00 0.00 0.00
APC-H7 0.01 0.01 0.00 0.02 0.12 0.05 0.01 -0.01 0.01
APC-Cy7 0.00 0.00 0.00 0.00 0.03 0.01 -0.01 0.01 0.00
V450 0.00 0.00 0.00 0.01 0.00 0.00 0.00 0.00 -0.01
V500-C 0.05 0.01 0.00 0.01 0.00 0.00 0.01 -0.13 0.02
BV605 0.00 -0.01 -0.02 0.00 0.00 0.00 0.00 0.07 0.01
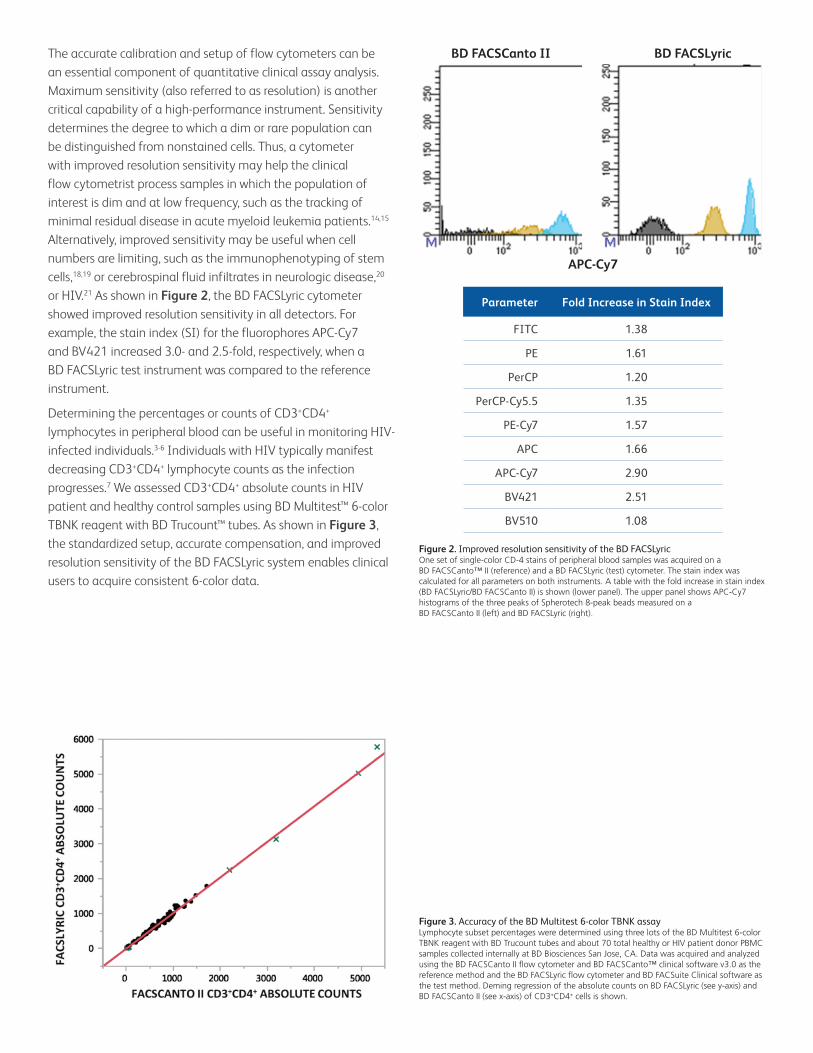
The accurate calibration and setup of flow cytometers can be an essential component of quantitative clinical assay analysis. Maximum sensitivity (also referred to as resolution) is another critical capability of a high-performance instrument. Sensitivity determines the degree to which a dim or rare population can be distinguished from nonstained cells. Thus, a cytometer with improved resolution sensitivity may help the clinical flow cytometrist process samples in which the population of interest is dim and at low frequency, such as the tracking of minimal residual disease in acute myeloid leukemia patients.14,15 Alternatively, improved sensitivity may be useful when cell numbers are limiting, such as the immunophenotyping of stem cells,18,19 or cerebrospinal fluid infiltrates in neurologic disease,20 or HIV.21 As shown in Figure 2, the BD FACSLyric cytometer showed improved resolution sensitivity in all detectors. For example, the stain index (SI) for the fluorophores APC-Cy7 and BV421 increased 3.0- and 2.5-fold, respectively, when a BD FACSLyric test instrument was compared to the reference instrument.
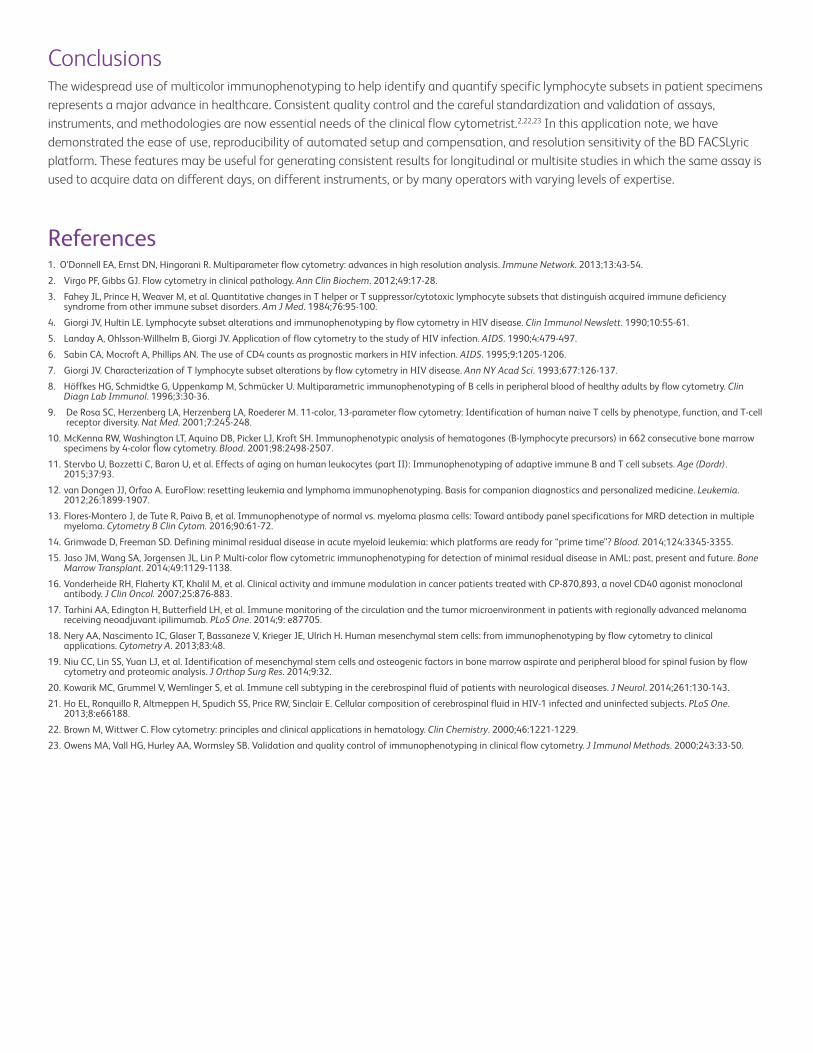
Determining the percentages or counts of CD3+CD4+ lymphocytes in peripheral blood can be useful in monitoring HIV-infected individuals.3-6 Individuals with HIV typically manifest decreasing CD3+CD4+ lymphocyte counts as the infection progresses.7 We assessed CD3+CD4+ absolute counts in HIV patient and healthy control samples using BD Multitest™ 6-color TBNK reagent with BD Trucount™ tubes. As shown in Figure 3, the standardized setup, accurate compensation, and improved resolution sensitivity of the BD FACSLyric system enables clinical users to acquire consistent 6-color data.
Figure 2. Improved resolution sensitivity of the BD FACSLyricOne set of single-color CD-4 stains of peripheral blood samples was acquired on a BD FACSCanto™ II (reference) and a BD FACSLyric (test) cytometer. The stain index was calculated for all parameters on both instruments. A table with the fold increase in stain index (BD FACSLyric/BD FACSCanto II) is shown (lower panel). The upper panel shows APC-Cy7 histograms of the three peaks of Spherotech 8-peak beads measured on a BD FACSCanto II (left) and BD FACSLyric (right).
Figure 3. Accuracy of the BD Multitest 6-color TBNK assayLymphocyte subset percentages were determined using three lots of the BD Multitest 6-color TBNK reagent with BD Trucount tubes and about 70 total healthy or HIV patient donor PBMC samples collected internally at BD Biosciences San Jose, CA. Data was acquired and analyzed using the BD FACSCanto II flow cytometer and BD FACSCanto™ clinical software v3.0 as the reference method and the BD FACSLyric flow cytometer and BD FACSuite Clinical software as the test method. Deming regression of the absolute counts on BD FACSLyric (see y-axis) and BD FACSCanto II (see x-axis) of CD3+CD4+ cells is shown.
BD FACSCanto II BD FACSLyric
APC-Cy7
Parameter Fold Increase in Stain Index
FITC 1.38
PE 1.61
PerCP 1.20
PerCP-Cy5.5 1.35
PE-Cy7 1.57
APC 1.66
APC-Cy7 2.90
BV421 2.51
BV510 1.08
ConclusionsThe widespread use of multicolor immunophenotyping to help identify and quantify specific lymphocyte subsets in patient specimens represents a major advance in healthcare. Consistent quality control and the careful standardization and validation of assays, instruments, and methodologies are now essential needs of the clinical flow cytometrist.2,22,23 In this application note, we have demonstrated the ease of use, reproducibility of automated setup and compensation, and resolution sensitivity of the BD FACSLyric platform. These features may be useful for generating consistent results for longitudinal or multisite studies in which the same assay is used to acquire data on different days, on different instruments, or by many operators with varying levels of expertise.
References1. O’Donnell EA, Ernst DN, Hingorani R. Multiparameter flow cytometry: advances in high resolution analysis. Immune Network. 2013;13:43-54.
2. Virgo PF, Gibbs GJ. Flow cytometry in clinical pathology. Ann Clin Biochem. 2012;49:17-28.
3. Fahey JL, Prince H, Weaver M, et al. Quantitative changes in T helper or T suppressor/cytotoxic lymphocyte subsets that distinguish acquired immune deficiency syndrome from other immune subset disorders. Am J Med. 1984;76:95-100.
4. Giorgi JV, Hultin LE. Lymphocyte subset alterations and immunophenotyping by flow cytometry in HIV disease. Clin Immunol Newslett. 1990;10:55-61.
5. Landay A, Ohlsson-Willhelm B, Giorgi JV. Application of flow cytometry to the study of HIV infection. AIDS. 1990;4:479-497.
6. Sabin CA, Mocroft A, Phillips AN. The use of CD4 counts as prognostic markers in HIV infection. AIDS. 1995;9:1205-1206.
7. Giorgi JV. Characterization of T lymphocyte subset alterations by flow cytometry in HIV disease. Ann NY Acad Sci. 1993;677:126-137.
8. Höffkes HG, Schmidtke G, Uppenkamp M, Schmücker U. Multiparametric immunophenotyping of B cells in peripheral blood of healthy adults by flow cytometry. Clin Diagn Lab Immunol. 1996;3:30-36.
9. De Rosa SC, Herzenberg LA, Herzenberg LA, Roederer M. 11-color, 13-parameter flow cytometry: Identification of human naive T cells by phenotype, function, and T-cell receptor diversity. Nat Med. 2001;7:245-248.
10. McKenna RW, Washington LT, Aquino DB, Picker LJ, Kroft SH. Immunophenotypic analysis of hematogones (B-lymphocyte precursors) in 662 consecutive bone marrow specimens by 4-color flow cytometry. Blood. 2001;98:2498-2507.
11. Stervbo U, Bozzetti C, Baron U, et al. Effects of aging on human leukocytes (part II): Immunophenotyping of adaptive immune B and T cell subsets. Age (Dordr). 2015;37:93.
12. van Dongen JJ, Orfao A. EuroFlow: resetting leukemia and lymphoma immunophenotyping. Basis for companion diagnostics and personalized medicine. Leukemia. 2012;26:1899-1907.
13. Flores-Montero J, de Tute R, Paiva B, et al. Immunophenotype of normal vs. myeloma plasma cells: Toward antibody panel specifications for MRD detection in multiple myeloma. Cytometry B Clin Cytom. 2016;90:61-72.
14. Grimwade D, Freeman SD. Defining minimal residual disease in acute myeloid leukemia: which platforms are ready for “prime time”? Blood. 2014;124:3345-3355.
15. Jaso JM, Wang SA, Jorgensen JL, Lin P. Multi-color flow cytometric immunophenotyping for detection of minimal residual disease in AML: past, present and future. Bone Marrow Transplant. 2014;49:1129-1138.
16. Vonderheide RH, Flaherty KT, Khalil M, et al. Clinical activity and immune modulation in cancer patients treated with CP-870,893, a novel CD40 agonist monoclonal antibody. J Clin Oncol. 2007;25:876-883.
17. Tarhini AA, Edington H, Butterfield LH, et al. Immune monitoring of the circulation and the tumor microenvironment in patients with regionally advanced melanoma receiving neoadjuvant ipilimumab. PLoS One. 2014;9: e87705.
18. Nery AA, Nascimento IC, Glaser T, Bassaneze V, Krieger JE, Ulrich H. Human mesenchymal stem cells: from immunophenotyping by flow cytometry to clinical applications. Cytometry A. 2013;83:48.
19. Niu CC, Lin SS, Yuan LJ, et al. Identification of mesenchymal stem cells and osteogenic factors in bone marrow aspirate and peripheral blood for spinal fusion by flow cytometry and proteomic analysis. J Orthop Surg Res. 2014;9:32.
20. Kowarik MC, Grummel V, Wemlinger S, et al. Immune cell subtyping in the cerebrospinal fluid of patients with neurological diseases. J Neurol. 2014;261:130-143.
21. Ho EL, Ronquillo R, Altmeppen H, Spudich SS, Price RW, Sinclair E. Cellular composition of cerebrospinal fluid in HIV-1 infected and uninfected subjects. PLoS One. 2013;8:e66188.
22. Brown M, Wittwer C. Flow cytometry: principles and clinical applications in hematology. Clin Chemistry. 2000;46:1221-1229.
23. Owens MA, Vall HG, Hurley AA, Wormsley SB. Validation and quality control of immunophenotyping in clinical flow cytometry. J Immunol Methods. 2000;243:33-50.
bdbiosciences.com
© 2017 BD. BD, the BD Logo and all other trademarks are property of Becton, Dickinson and Company.
BD Life Sciences, San Jose, CA, 95131, USA
Class 1 Laser Product.For In Vitro Diagnostic Use for up to six-color assays.Seven- to ten-color assays are for Research Use Only.Cy™ is a trademark of GE Healthcare. Cy™ dyes are subject to proprietary rights of GE Healthcare and Carnegie Mellon University, and are made and sold under license from GE Healthcare only for research and in vitro diagnostic use. Any other use requires a commercial sublicense from GE Healthcare, 800 Centennial Avenue, Piscataway, NJ 08855-1327, USA.23-19868-00 US