Embed Size (px)
Citation preview
Simplifying and Focusing:Abbott’s Work in 2005-06
Presented by Gordon MacInnes
Abbott CSAs and SBAs
December 6, 2004
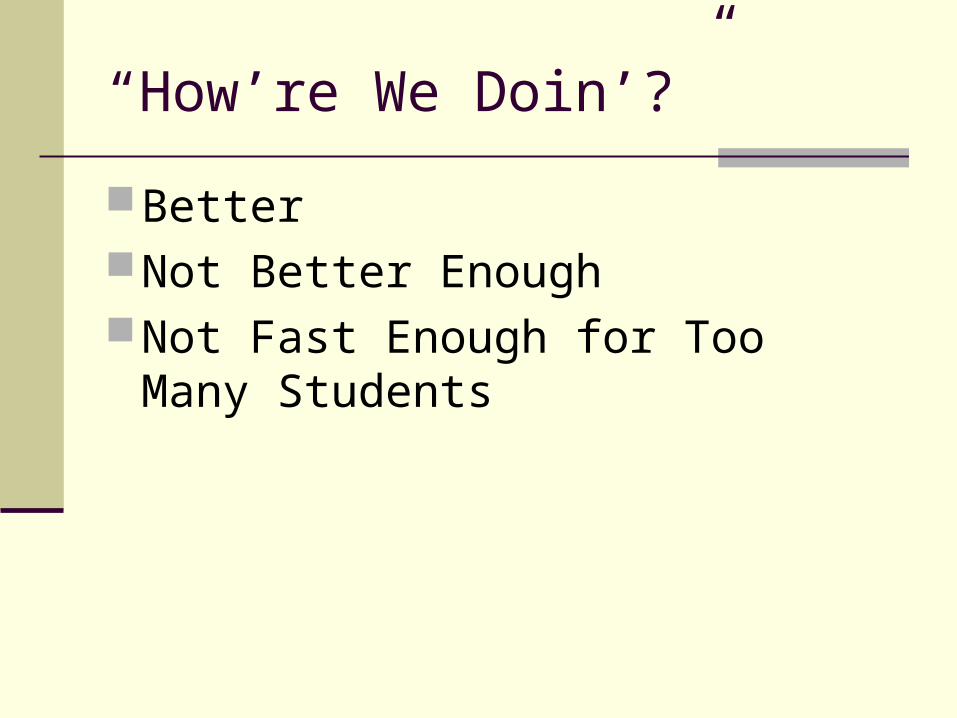
“How’re We Doin’?”
BetterNot Better EnoughNot Fast Enough for Too Many
Students
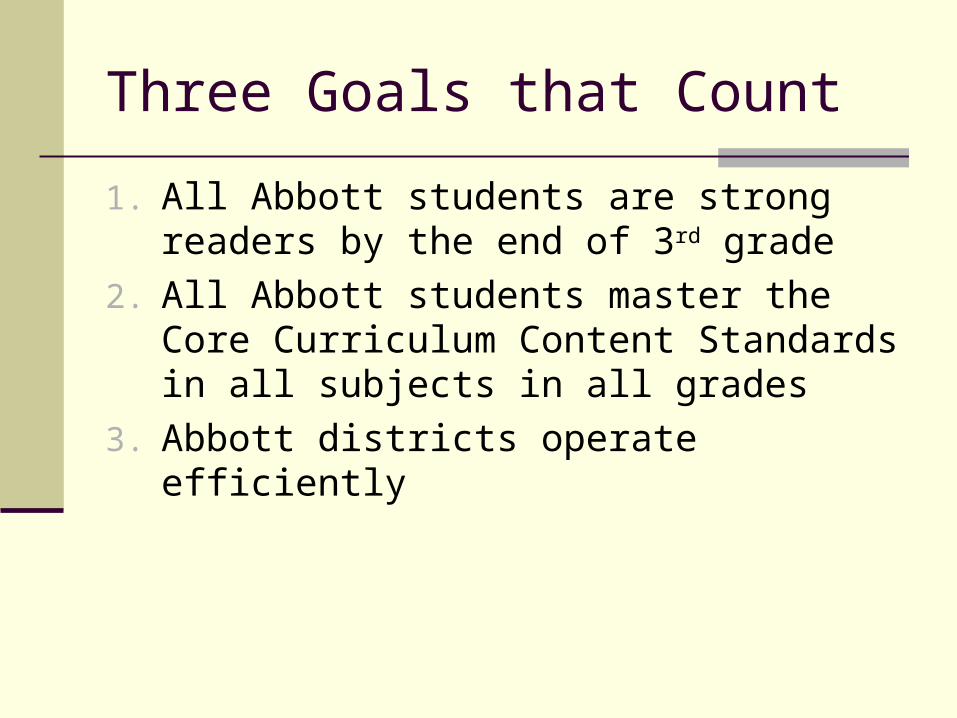
Three Goals that Count
1. All Abbott students are strong readers by the end of 3rd grade
2. All Abbott students master the Core Curriculum Content Standards in all subjects in all grades
3. Abbott districts operate efficiently
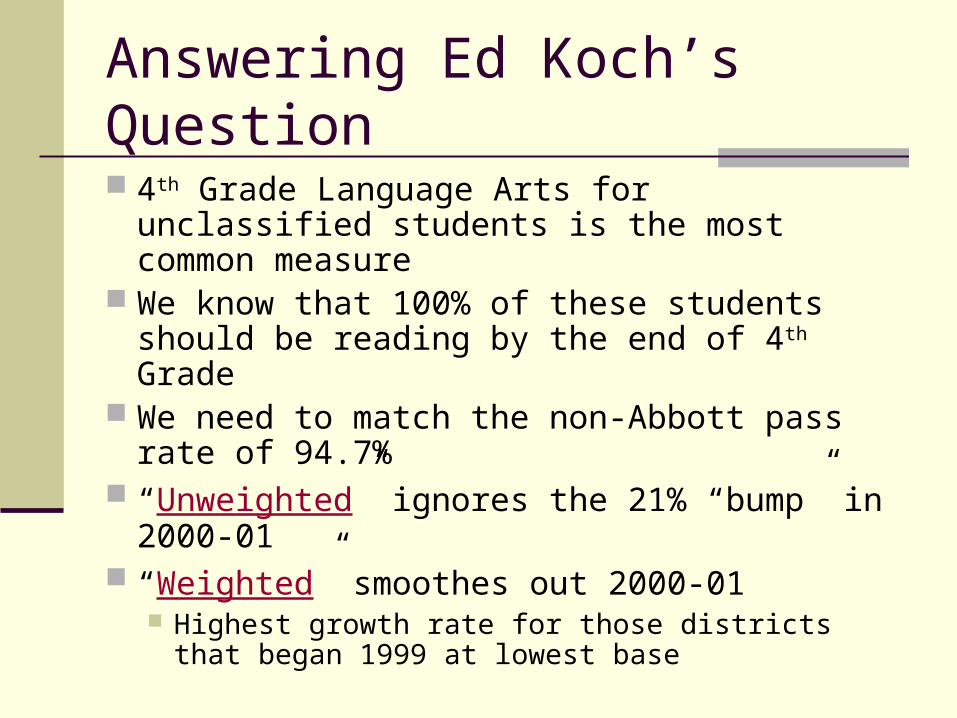
Answering Ed Koch’s Question
4th Grade Language Arts for unclassified students is the most common measure
We know that 100% of these students should be reading by the end of 4th Grade
We need to match the non-Abbott pass rate of 94.7%
“Unweighted” ignores the 21% “bump” in 2000-01
“Weighted” smoothes out 2000-01 Highest growth rate for those districts that began
1999 at lowest base
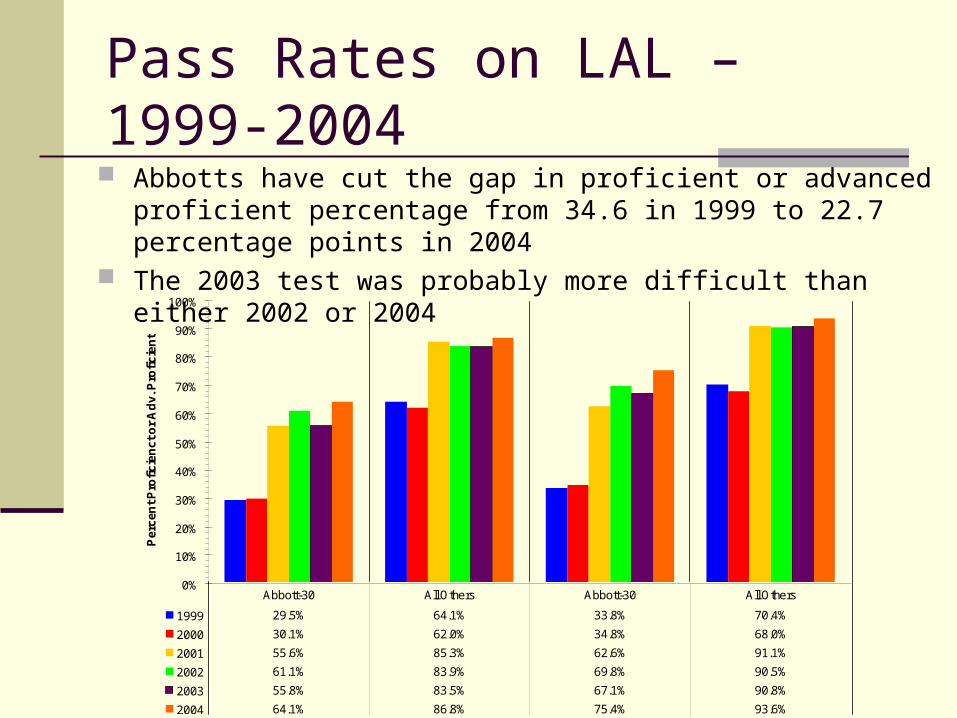
Pass Rates on LAL – 1999-2004 Abbotts have cut the gap in proficient or advanced proficient
percentage from 34.6 in 1999 to 22.7 percentage points in 2004 The 2003 test was probably more difficult than either 2002 or 2004
0%
10%
20%
30%
40%
50%
60%
70%
80%
90%
100%
Pe
rce
nt
Pro
fic
ien
ct
or
Ad
v. P
rofi
cie
nt
1999 29.5% 64.1% 33.8% 70.4%
2000 30.1% 62.0% 34.8% 68.0%
2001 55.6% 85.3% 62.6% 91.1%
2002 61.1% 83.9% 69.8% 90.5%
2003 55.8% 83.5% 67.1% 90.8%
2004 64.1% 86.8% 75.4% 93.6%
Abbott-30 All Others Abbott-30 All Others
Total Students General Education
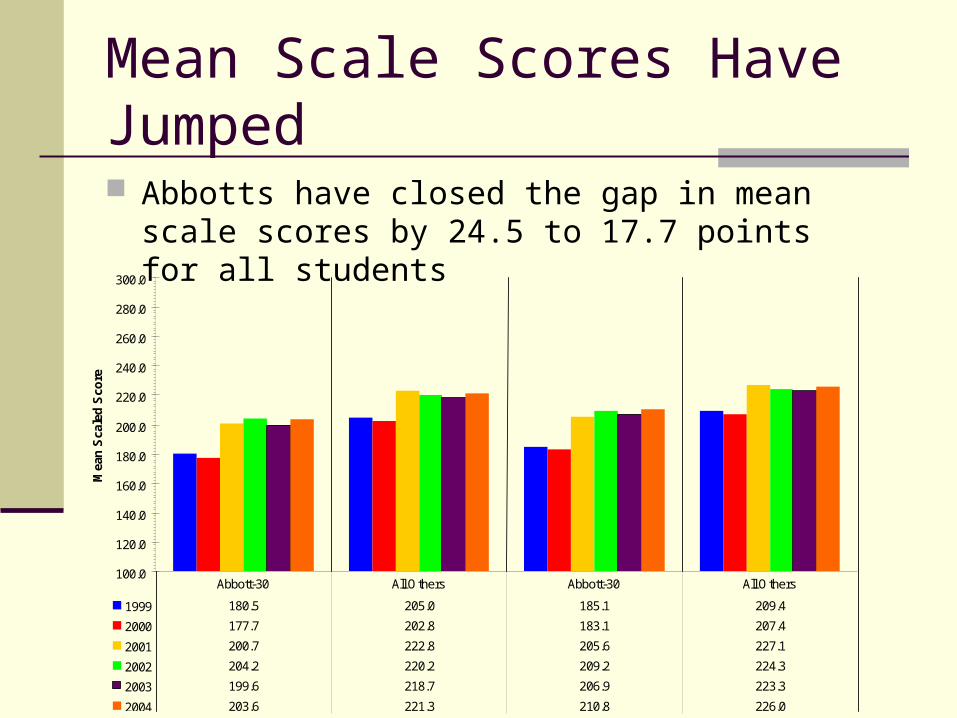
Mean Scale Scores Have Jumped
Abbotts have closed the gap in mean scale scores by 24.5 to 17.7 points for all students
100.0
120.0
140.0
160.0
180.0
200.0
220.0
240.0
260.0
280.0
300.0
Mea
n S
cale
d S
core
1999 180.5 205.0 185.1 209.4
2000 177.7 202.8 183.1 207.4
2001 200.7 222.8 205.6 227.1
2002 204.2 220.2 209.2 224.3
2003 199.6 218.7 206.9 223.3
2004 203.6 221.3 210.8 226.0
Abbott-30 All Others Abbott-30 All Others
Total Students General Education
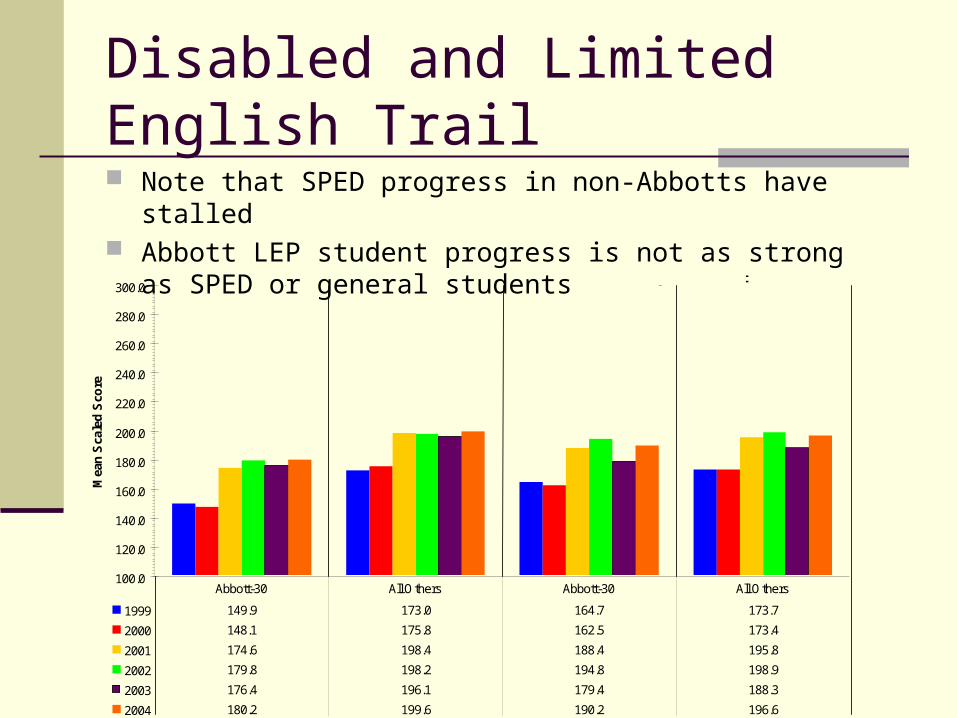
Disabled and Limited English Trail Note that SPED progress in non-Abbotts have stalled Abbott LEP student progress is not as strong as SPED or
general students
100.0
120.0
140.0
160.0
180.0
200.0
220.0
240.0
260.0
280.0
300.0
Mea
n S
cale
d S
core
1999 149.9 173.0 164.7 173.7
2000 148.1 175.8 162.5 173.4
2001 174.6 198.4 188.4 195.8
2002 179.8 198.2 194.8 198.9
2003 176.4 196.1 179.4 188.3
2004 180.2 199.6 190.2 196.6
Abbott-30 All Others Abbott-30 All Others
Special Education Limited English Proficient
Math is Tough on Everyone
Non-Abbott SPED students are making noticeable progress as are Abbott LEP students
Note that non-Abbott SPED students are close to Abbott’s TOTAL students proficiency rates
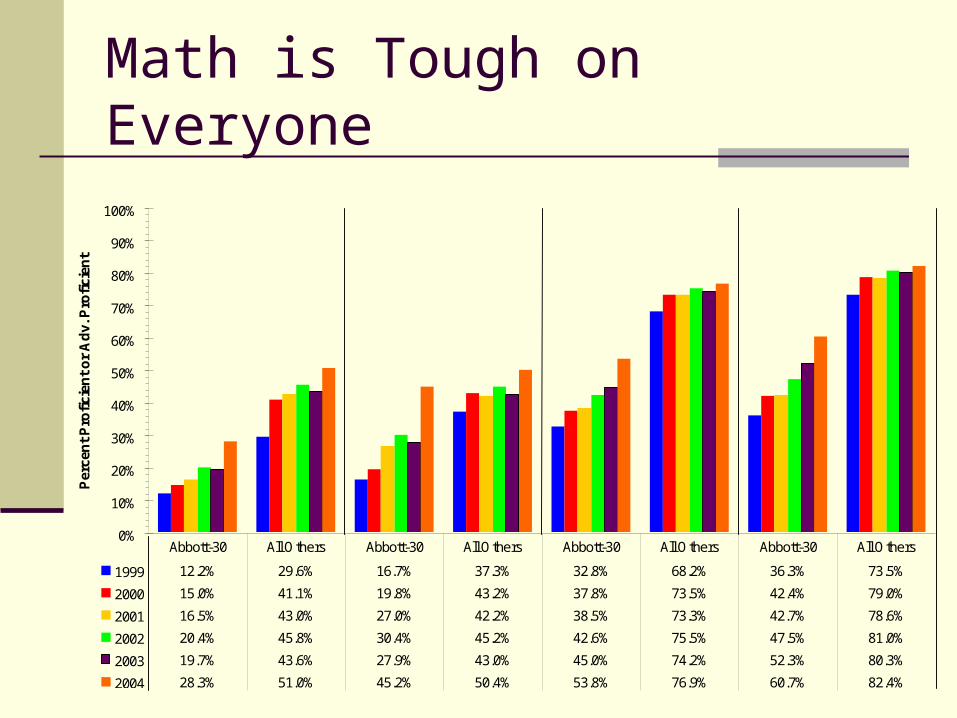
Math is Tough on Everyone
0%
10%
20%
30%
40%
50%
60%
70%
80%
90%
100%
Per
cen
t P
rofi
cien
t o
r A
dv.
Pro
fici
ent
1999 12.2% 29.6% 16.7% 37.3% 32.8% 68.2% 36.3% 73.5%
2000 15.0% 41.1% 19.8% 43.2% 37.8% 73.5% 42.4% 79.0%
2001 16.5% 43.0% 27.0% 42.2% 38.5% 73.3% 42.7% 78.6%
2002 20.4% 45.8% 30.4% 45.2% 42.6% 75.5% 47.5% 81.0%
2003 19.7% 43.6% 27.9% 43.0% 45.0% 74.2% 52.3% 80.3%
2004 28.3% 51.0% 45.2% 50.4% 53.8% 76.9% 60.7% 82.4%
Abbott-30 All Others Abbott-30 All Others Abbott-30 All Others Abbott-30 All Others
Special Education Limited English Total Students General Education
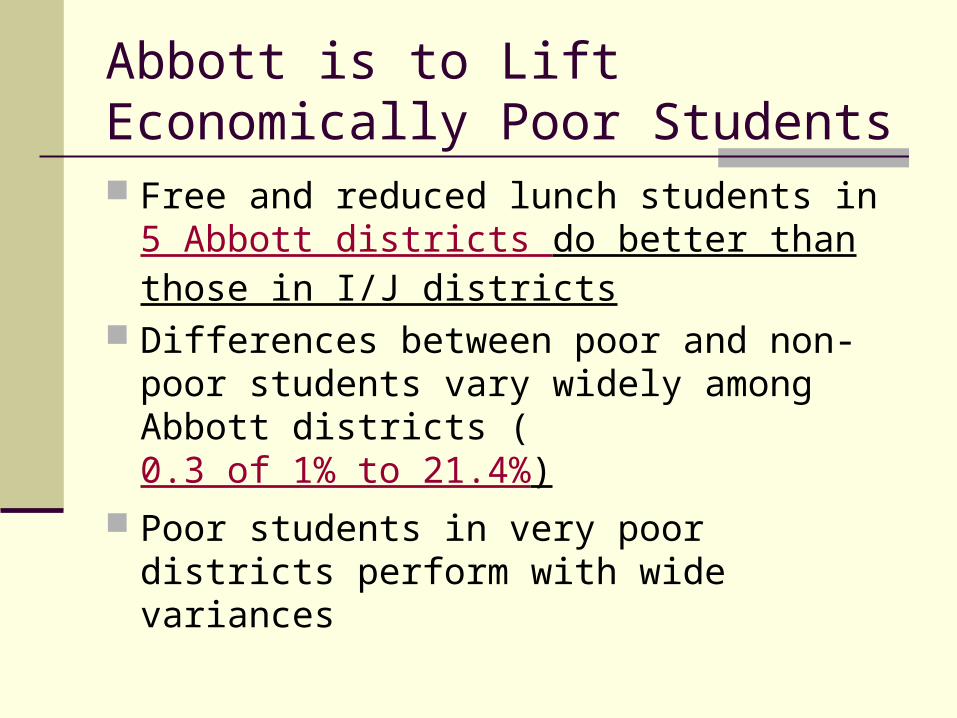
Abbott is to Lift Economically Poor Students Free and reduced lunch students in
5 Abbott districts do better than those in I/J districts
Differences between poor and non-poor students vary widely among Abbott districts (0.3 of 1% to 21.4%)
Poor students in very poor districts perform with wide variances
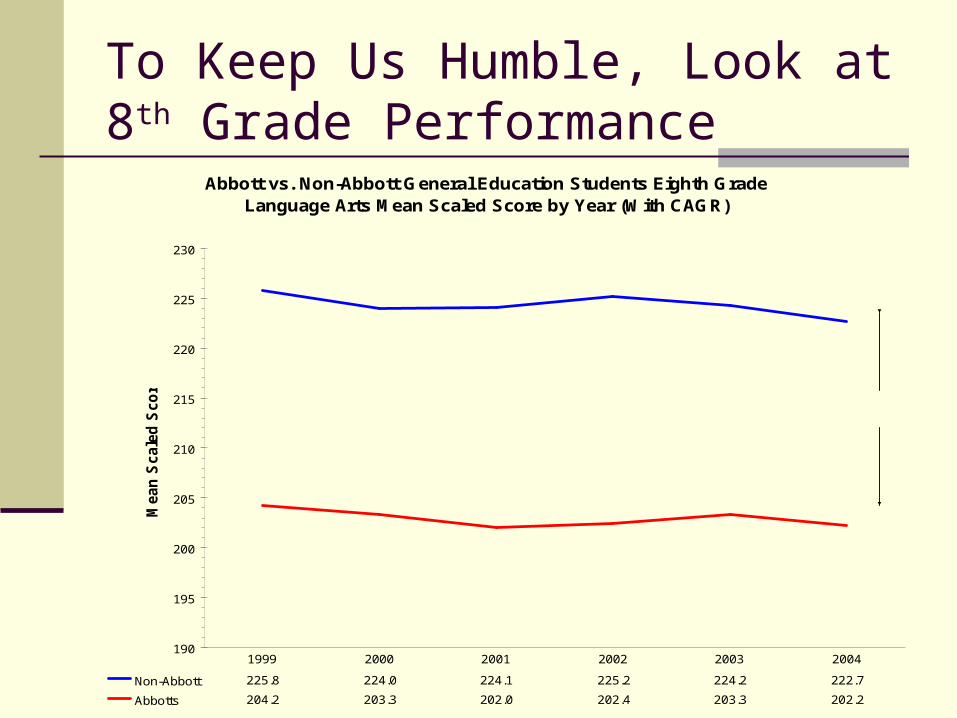
To Keep Us Humble, Look at 8th Grade Performance
Abbott vs. Non-Abbott General Education Students Eighth GradeLanguage Arts Mean Scaled Score by Year (With CAGR)
190
195
200
205
210
215
220
225
230
Mean
Scale
d S
co
re
Non-Abbott 225.8 224.0 224.1 225.2 224.2 222.7
Abbotts 204.2 203.3 202.0 202.4 203.3 202.2
1999 2000 2001 2002 2003 2004
CAGR
-0.2%
-0.3%
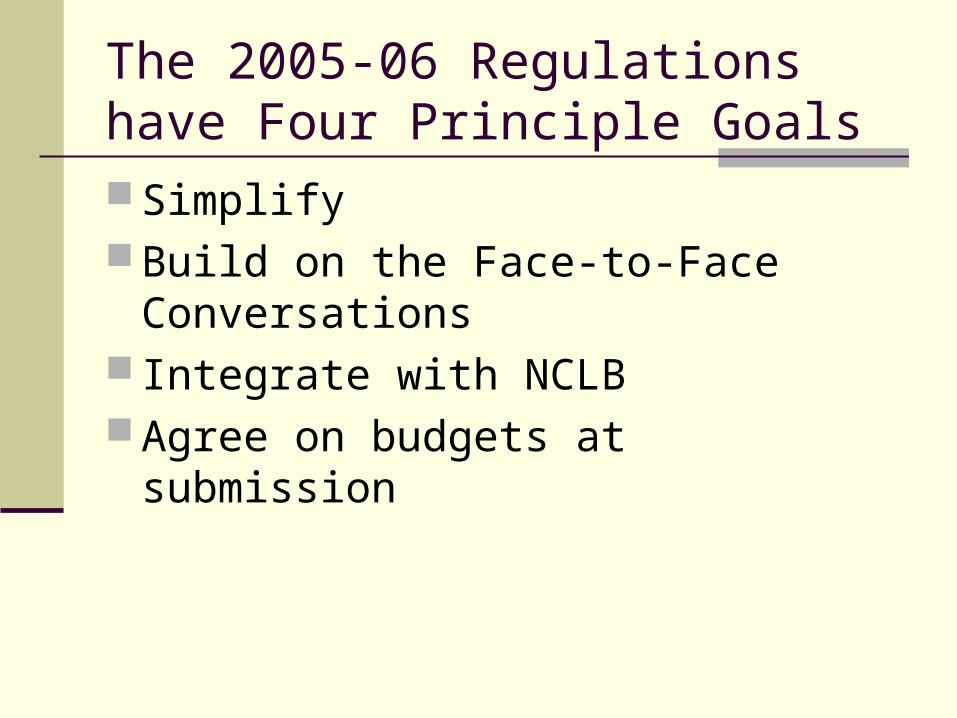
The 2005-06 Regulations have Four Principle Goals Simplify Build on the Face-to-Face
Conversations Integrate with NCLB Agree on budgets at submission
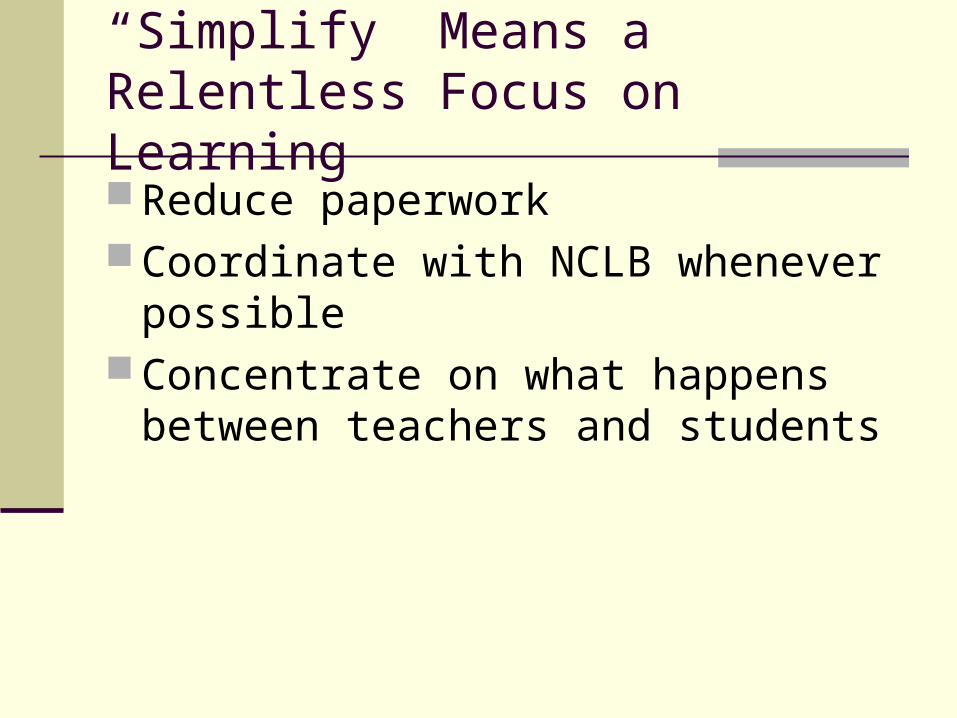
“Simplify” Means a Relentless Focus on Learning Reduce paperwork Coordinate with NCLB whenever
possible Concentrate on what happens between
teachers and students
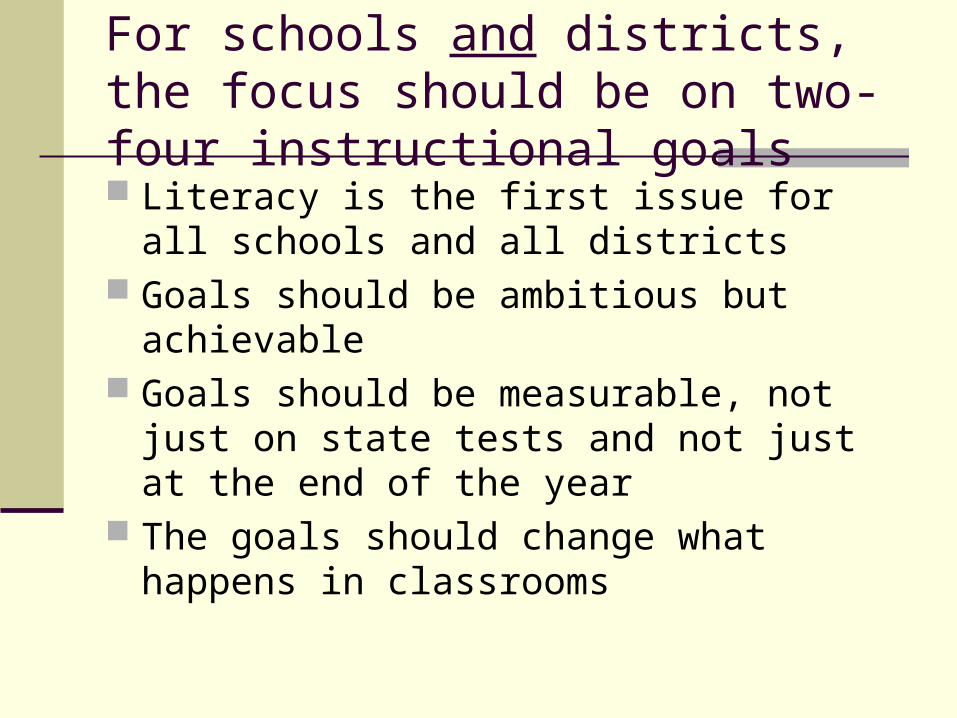
For schools and districts, the focus should be on two-four instructional goals Literacy is the first issue for all schools and all
districts Goals should be ambitious but achievable Goals should be measurable, not just on state
tests and not just at the end of the year The goals should change what happens in
classrooms
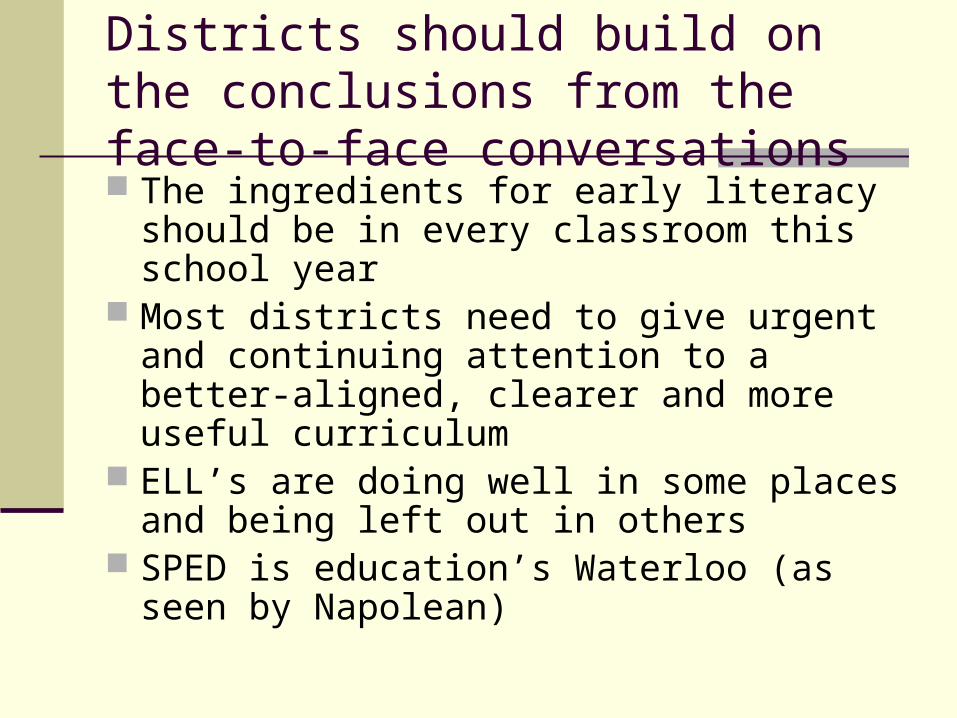
Districts should build on the conclusions from the face-to-face conversations The ingredients for early literacy should be in
every classroom this school year Most districts need to give urgent and
continuing attention to a better-aligned, clearer and more useful curriculum
ELL’s are doing well in some places and being left out in others
SPED is education’s Waterloo (as seen by Napolean)
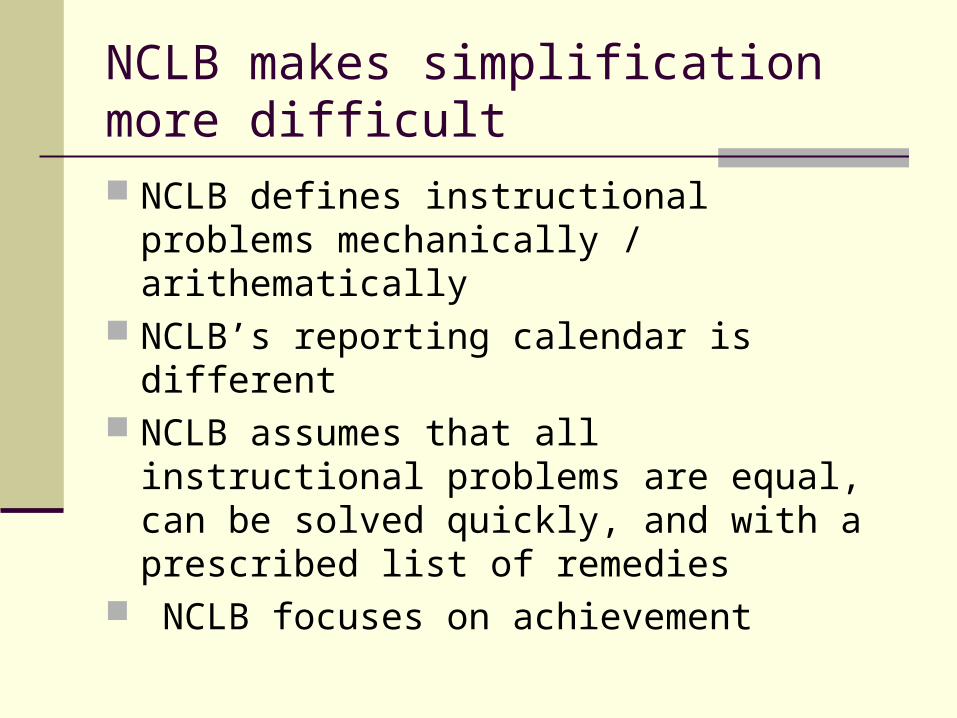
NCLB makes simplification more difficult NCLB defines instructional problems
mechanically / arithematically NCLB’s reporting calendar is different NCLB assumes that all instructional problems
are equal, can be solved quickly, and with a prescribed list of remedies
NCLB focuses on achievement
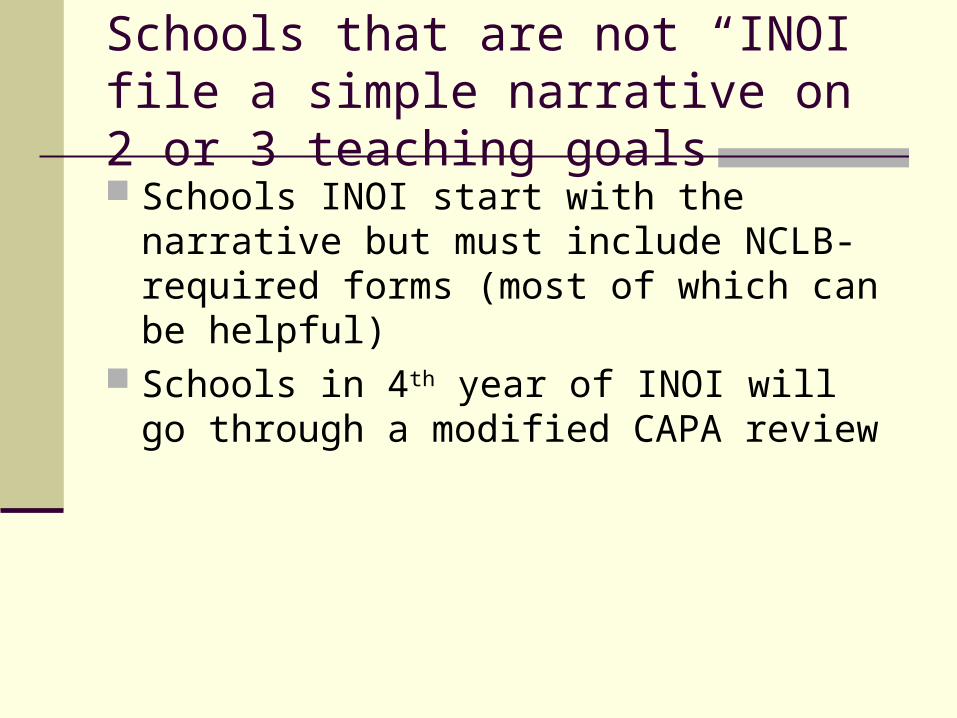
Schools that are not “INOI” file a simple narrative on 2 or 3 teaching goals
Schools INOI start with the narrative but must include NCLB-required forms (most of which can be helpful)
Schools in 4th year of INOI will go through a modified CAPA review
Budget agreements by mid-March
Budget discussions will start right away, not after they’re submitted
The “presumptive budget” facilitates early agreement
The goal is DOE/District agreement by March submission
Applicants for DEOA will receive award notice by May 31, 2005
This year’s regulations build on last year’s approach with three noticeable changes The emphasis on literacy is extended with
more precise standards into the middle grades
The academic expectations for secondary schools are sharpened and the goal of smaller learning communities set
The “presumptive budget” and more specific efficiency standards are introduced
More than 2 of 5 Abbott 8th graders can’t read and write well enough to pass GEPA Middle Grades Literacy Task Force
recommended that the IEL emphasis on small group, print-rich, and uninterrupted literacy instruction be “graduated” to middle grades
More coaching and support for teaching literacy across content areas
Begin next year to plan for 80-120 minutes of uninterrupted focus
The primary reason most Abbott students can’t pass GEPA/HSPA is that they’re not taught what they’re expected to learn A district curriculum should work backwards from
HSPA to ensure that the Core standards are being taught
Through traditional college prep math courses or “integrated” math, all students need to complete Algebra I by 9th grade
English I is the “gatekeeper” for high school language arts just as Algebra I is for math
Middle grade curricula must assume that all students will take college prep courses
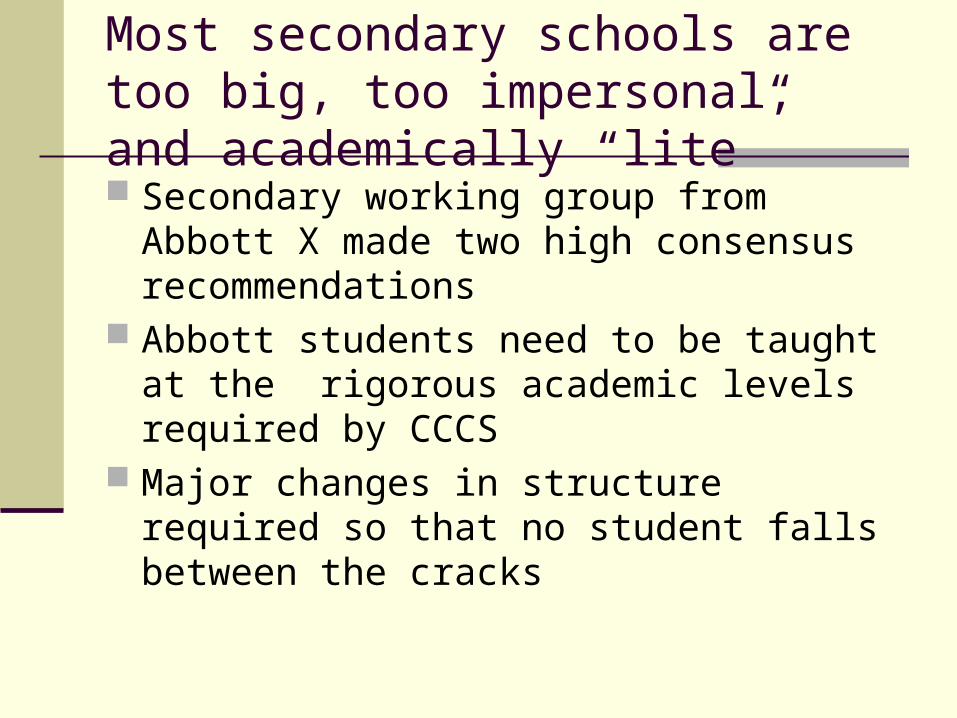
Most secondary schools are too big, too impersonal, and academically “lite” Secondary working group from Abbott X
made two high consensus recommendations Abbott students need to be taught at the
rigorous academic levels required by CCCS Major changes in structure required so that
no student falls between the cracks
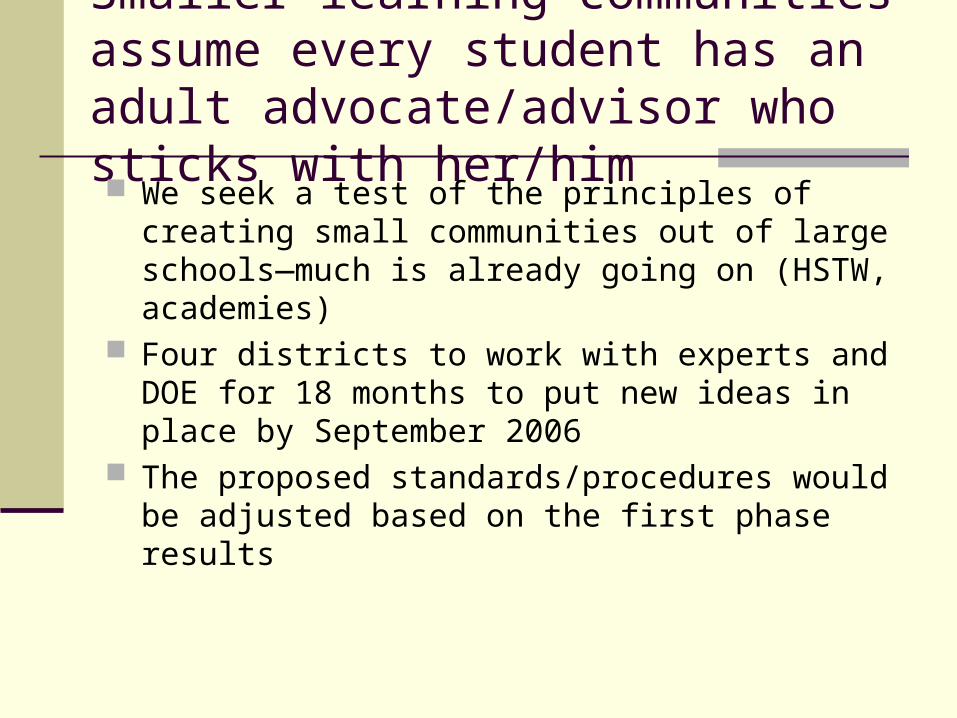
Smaller learning communities assume every student has an adult advocate/advisor who sticks with her/him We seek a test of the principles of creating small
communities out of large schools—much is already going on (HSTW, academies)
Four districts to work with experts and DOE for 18 months to put new ideas in place by September 2006
The proposed standards/procedures would be adjusted based on the first phase results
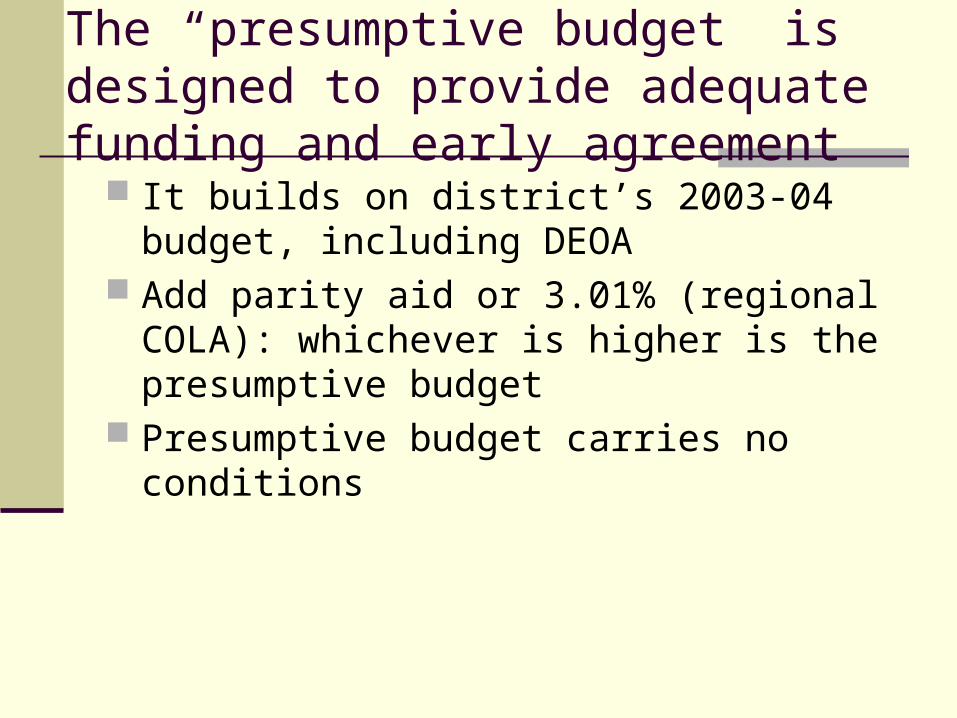
The “presumptive budget” is designed to provide adequate funding and early agreement
It builds on district’s 2003-04 budget, including DEOA
Add parity aid or 3.01% (regional COLA): whichever is higher is the presumptive budget
Presumptive budget carries no conditions
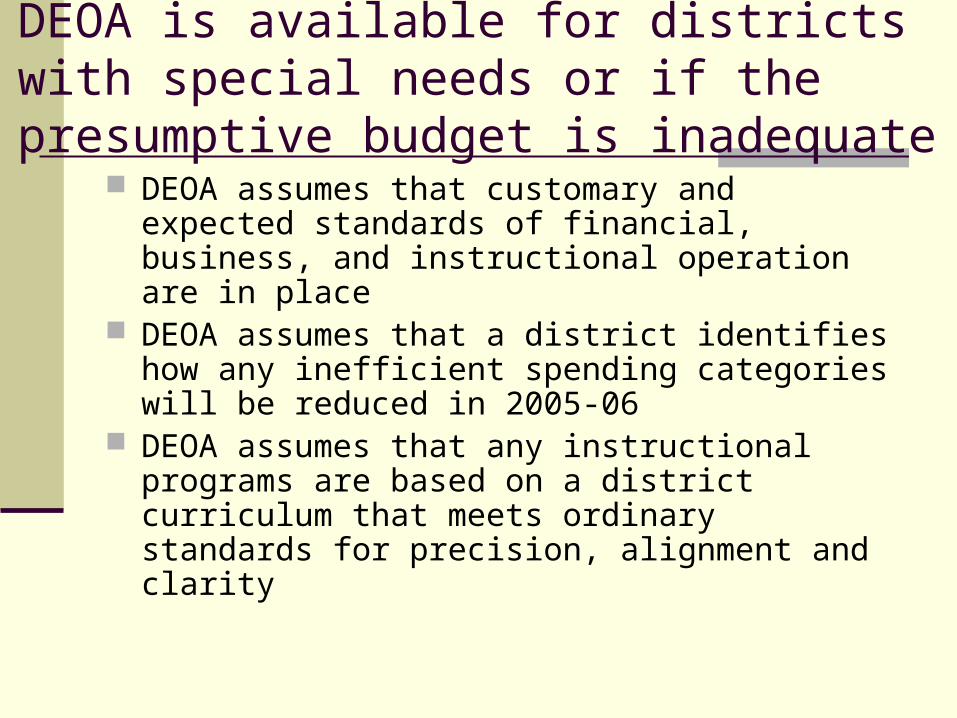
DEOA is available for districts with special needs or if the presumptive budget is inadequate
DEOA assumes that customary and expected standards of financial, business, and instructional operation are in place
DEOA assumes that a district identifies how any inefficient spending categories will be reduced in 2005-06
DEOA assumes that any instructional programs are based on a district curriculum that meets ordinary standards for precision, alignment and clarity
It’s the last slide, thank God
Next December, all we seek is that every unclassified, non-ELL student is a strong reader of English
And that every Abbott school is focused on two or three instructional priorities so that the work of teachers and students improves