Embed Size (px)
Citation preview
Scientia Iranica A (2017) 24(2), 452{466
Sharif University of TechnologyScientia Iranica
Transactions A: Civil Engineeringwww.scientiairanica.com
Simulating FRP debonding from concrete surface inFRP strengthened RC beams: A case study
D. Mosto�nejad and S.J. Hosseini�
Department of Civil Engineering, Isfahan University of Technology (IUT), Isfahan, Iran.
Received 1 February 2015; received in revised form 17 October 2015; accepted 13 February 2016
KEYWORDSFlexuralstrengthening;Debonding;Fiber reinforcementpolymers;Finite elementmethod.
Abstract. Reinforced Concrete (RC) beams strengthened with Fiber Reinforced Polymer(FRP) sheets may fail due to debonding failure. In such cases, the FRP sheet is detachedfrom the RC beam before real damages are in icted on the beam. In this paper, a procedureis developed based on smeared cracks approach for simulating the debonding process inFRP strengthened RC beams within the framework of �nite element. For this purpose,the challenges facing the simulation of debonding mechanism are initially studied, anda method is proposed in a second stage of combating these problems using the cohesiveelements available in the ABAQUS software. The validity of the proposed method is thentested by modeling four beams from those reported in the literature and by comparingthe results with the experimental ones. Given the acceptable agreement observed betweenthe experimental and numerical simulation results, the method is claimed to be valid andpracticable. In a later section of the present paper, the proposed method will be used toinvestigate the e�ects of length and width of the strengthening sheet on beam's behaviorand its failure mechanism. The results of the present study reveal that longer FRP sheetsincrease load carrying capacity and mid-span displacement of strengthened RC beams.
© 2017 Sharif University of Technology. All rights reserved.
1. Introduction
Regarding the fact that most existing structures havelife spans of several decades, their strengthening hasnow become a major concern and the greatest challengefacing structural engineers. A number of methodsare presently available for this purpose, the selec-tion of which depends on a multitude of factors.The unique properties of Fiber Reinforced Polymers(FRPs) used as internal rods or externally bondedsheets/laminates have made them the most commonmethod to strengthen RC beams [1]. Despite the ad-vantages associated with using FRPs in strengthening
*. Corresponding author. Tel.: +98 31 32630332;Fax: +98 31 333912700E-mail addresses: dmosto�@cc.iut.ac.ir (D. Mosto�nejad);[email protected] (S.J. Hosseini)
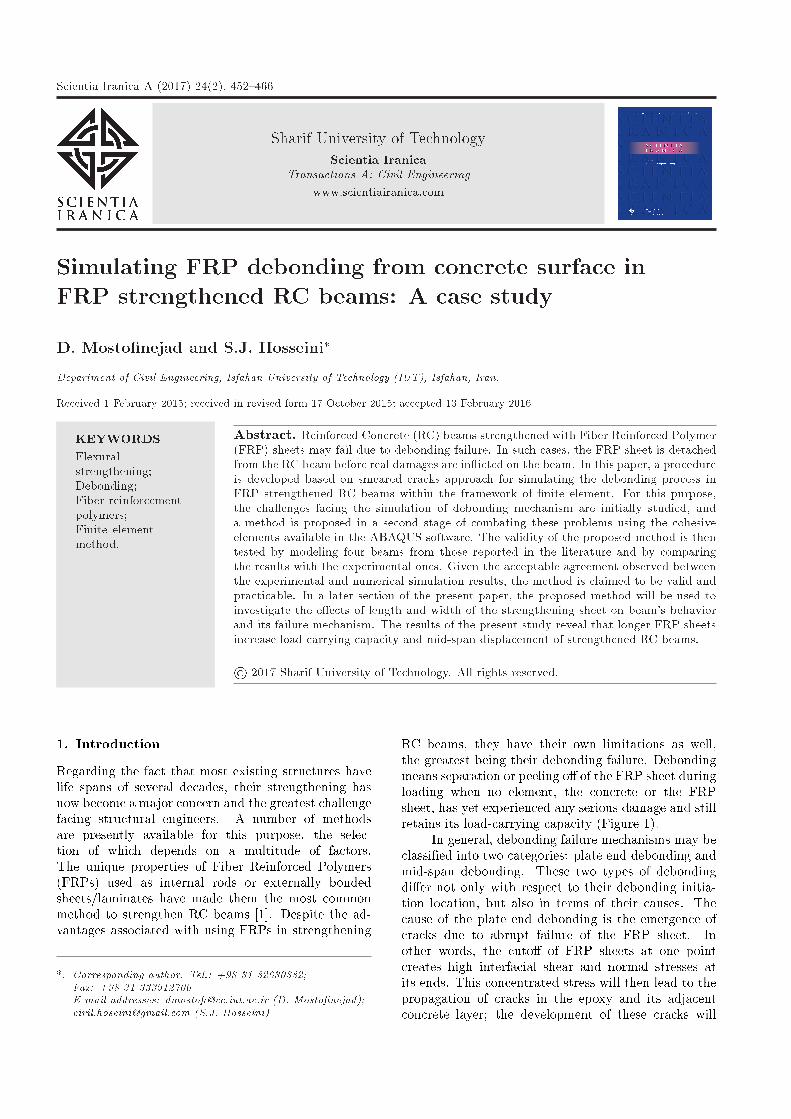
RC beams, they have their own limitations as well,the greatest being their debonding failure. Debondingmeans separation or peeling o� of the FRP sheet duringloading when no element, the concrete or the FRPsheet, has yet experienced any serious damage and stillretains its load-carrying capacity (Figure 1).
In general, debonding failure mechanisms may beclassi�ed into two categories: plate end debonding andmid-span debonding. These two types of debondingdi�er not only with respect to their debonding initia-tion location, but also in terms of their causes. Thecause of the plate end debonding is the emergence ofcracks due to abrupt failure of the FRP sheet. Inother words, the cuto� of FRP sheets at one pointcreates high interfacial shear and normal stresses atits ends. This concentrated stress will then lead to thepropagation of cracks in the epoxy and its adjacentconcrete layer; the development of these cracks will
D. Mosto�nejad and S.J. Hosseini/Scientia Iranica, Transactions A: Civil Engineering 24 (2017) 452{466 453
Figure 1. Debonding failure between beam and plate.
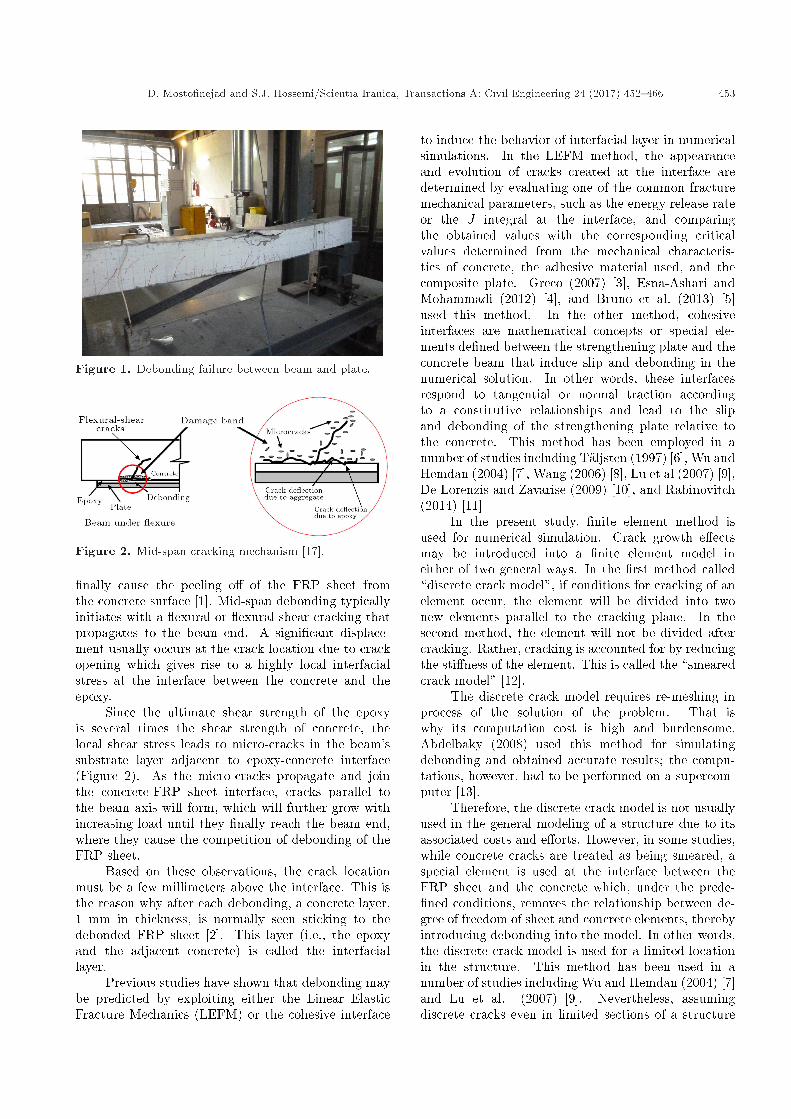
Figure 2. Mid-span cracking mechanism [17].
�nally cause the peeling o� of the FRP sheet fromthe concrete surface [1]. Mid-span debonding typicallyinitiates with a exural or exural-shear cracking thatpropagates to the beam end. A signi�cant displace-ment usually occurs at the crack location due to crackopening which gives rise to a highly local interfacialstress at the interface between the concrete and theepoxy.
Since the ultimate shear strength of the epoxyis several times the shear strength of concrete, thelocal shear stress leads to micro-cracks in the beam'ssubstrate layer adjacent to epoxy-concrete interface(Figure 2). As the micro-cracks propagate and jointhe concrete-FRP sheet interface, cracks parallel tothe beam axis will form, which will further grow withincreasing load until they �nally reach the beam end,where they cause the competition of debonding of theFRP sheet.
Based on these observations, the crack locationmust be a few millimeters above the interface. This isthe reason why after each debonding, a concrete layer,1 mm in thickness, is normally seen sticking to thedebonded FRP sheet [2]. This layer (i.e., the epoxyand the adjacent concrete) is called the interfaciallayer.
Previous studies have shown that debonding maybe predicted by exploiting either the Linear ElasticFracture Mechanics (LEFM) or the cohesive interface
to induce the behavior of interfacial layer in numericalsimulations. In the LEFM method, the appearanceand evolution of cracks created at the interface aredetermined by evaluating one of the common fracturemechanical parameters, such as the energy release rateor the J integral at the interface, and comparingthe obtained values with the corresponding criticalvalues determined from the mechanical characteris-tics of concrete, the adhesive material used, and thecomposite plate. Greco (2007) [3], Esna-Ashari andMohammadi (2012) [4], and Bruno et al. (2013) [5]used this method. In the other method, cohesiveinterfaces are mathematical concepts or special ele-ments de�ned between the strengthening plate and theconcrete beam that induce slip and debonding in thenumerical solution. In other words, these interfacesrespond to tangential or normal traction accordingto a constitutive relationships and lead to the slipand debonding of the strengthening plate relative tothe concrete. This method has been employed in anumber of studies including T�aljsten (1997) [6], Wu andHemdan (2004) [7], Wang (2006) [8], Lu et al (2007) [9],De Lorenzis and Zavarise (2009) [10], and Rabinovitch(2014) [11].
In the present study, �nite element method isused for numerical simulation. Crack growth e�ectsmay be introduced into a �nite element model ineither of two general ways. In the �rst method called\discrete crack model", if conditions for cracking of anelement occur, the element will be divided into twonew elements parallel to the cracking plane. In thesecond method, the element will not be divided aftercracking. Rather, cracking is accounted for by reducingthe sti�ness of the element. This is called the \smearedcrack model" [12].
The discrete crack model requires re-meshing inprocess of the solution of the problem. That iswhy its computation cost is high and burdensome.Abdelbaky (2008) used this method for simulatingdebonding and obtained accurate results; the compu-tations, however, had to be performed on a supercom-puter [13].
Therefore, the discrete crack model is not usuallyused in the general modeling of a structure due to itsassociated costs and e�orts. However, in some studies,while concrete cracks are treated as being smeared, aspecial element is used at the interface between theFRP sheet and the concrete which, under the prede-�ned conditions, removes the relationship between de-gree of freedom of sheet and concrete elements, therebyintroducing debonding into the model. In other words,the discrete crack model is used for a limited locationin the structure. This method has been used in anumber of studies including Wu and Hemdan (2004) [7]and Lu et al. (2007) [9]. Nevertheless, assumingdiscrete cracks even in limited sections of a structure

454 D. Mosto�nejad and S.J. Hosseini/Scientia Iranica, Transactions A: Civil Engineering 24 (2017) 452{466
will lead to high computation costs and will run intomany numerical problems. Hence, some studies havesuggested debonding to occur with reduced sti�ness inelements at the interfacial layers [12] (smeared crackmodel). Hu et al. (2004) [14], Rahimi and Hutchinson(2001) [15], Aram et al. (2005) [16], and Lu andAyoub (2010) [17] also used a similar method. Othermethods, such as extended �nite element (XFEM)and moving mesh technique, are the combination ofsmeared and discrete crack methods. These methodshave been employed in a number of studies includingEsna Ashari and Mohammadi (2011) [4] and Bruno etal. [5].
The methods commonly proposed for the simu-lation of debonding are complicated in most cases asthey are developed based on complex mathematicalconcepts, making them inappropriate for solving engi-neering problems. In the present study, the physics ofthe problem is used to develop a method for simulatingthe debonding problem in the ABAQUS software pack-age. Here, the process begins with the evaluation of theconditions and requirements for proper simulation ofdebonding. The capabilities of the ABAQUS softwareare then exploited to determine a method for propermodeling of debonding. In the proposed method, themethod of smeared cracks is used to induce debondingthe cohesive interface. The method is then validatedby modeling four specimens reported in the literaturefor which numerical and experimental results are com-pared. The simplicity of the proposed method makesit especially suitable not only for solving engineeringproblems, but also for conducting case studies. Thestudy is then supplemented with investigating thee�ects of the length and width of the strengtheningplate on the behavior of strengthened beams as wellas on the load and displacement of the debondingevent.
2. The proposed debonding simulation method
Based on the aforementioned discussion, two majorconditions are required for simulating the debond-ing failure within the framework of a �nite elementapproach. First, the stresses exerted on the inter-facial layer causing interfacial cracking which mustbe properly introduced into the �nite element model.Second, the behavior of the interfacial layer againstthese stresses must be realistically considered, and theinterfacial cracks must be formed in a timely manner.Below, we will investigate the methods used to meetthese conditions.
As previously mentioned, stresses leading to in-termediate debonding failure will give rise to exuralor exural-shear cracking. Therefore, if crack openingoccurs in its realistic proper manner, the stressesexerted on the interfacial layer will also follow a realistic
pattern. Abdelbaky [13] maintained that the size ofselected element must be three times smaller thanthe average aggregate size in order to ensure thevalidity of the FE-based simulation of crack openingin concrete based on smeared crack approach. Thestudy reported in [18] indicates that there is no needfor any special provisions to be made, since thestresses are concentrated on plate end which causethe debonding failure to have already been introducedinto 3D FE models, in which volume elements areemployed.
The requirements for the second condition aremore complicated. The study reported in [19] indicatesthat this condition will not hold true for FE modelsused for simulating concrete behavior based on smearedcracking and that in such cases, special provisions mustbe made for interfacial crack formation. The reasonfor this lies in the dependence of interfacial crackingon concrete microstructure properties. In other words,interfacial cracking is a function of the microscopicproperties of concrete and its microstructure, while theparameters used in FE-based simulation of concretein smeared crack modeling, including cracking stress,compressive stress-strain curve, etc., are all macro-scopic properties. Naturally, FE analysis is not capableof simulating concrete microscopic properties; hence,it fails to simulate those phenomena which arise fromconcrete microstructure properties.
Based on the above considerations, simulation ofdebonding failure in the normal FE analysis of concreterequires the interfacial layer behavior to be includedin the calculations independent of concrete behavior.To put it di�erently, rather than the conventionalmodeling of the interfacial layer including the epoxyand the few millimeters of the immediately adjacentconcrete (i.e., the concrete thickness peeling o� withthe FRP sheet), an element must be used whosebehavior corresponds to the realistic situation. Thisobjective can be realized by using an element in thesoftware, called the cohesive element, which de�nesthe behavior of two surfaces with respect to eachother [20].
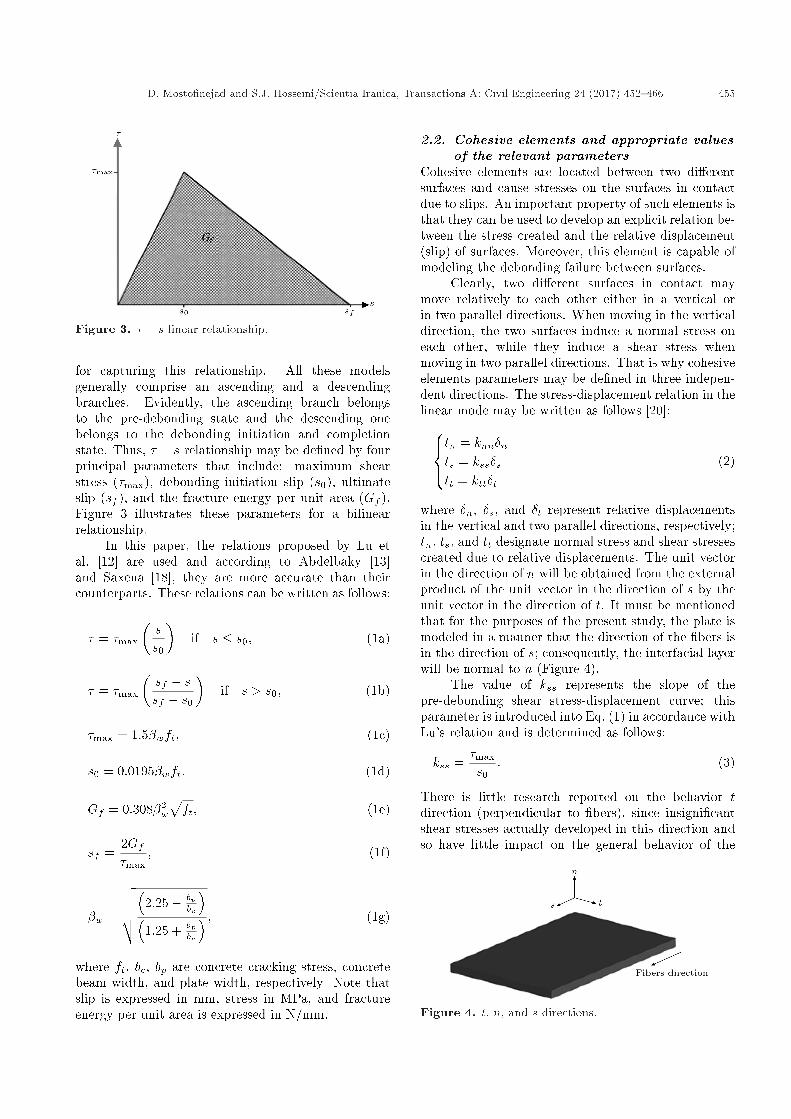
2.1. Behavior of interfacial layerThe true cause of the intermediate debonding failuremay be attributed to the considerable shear stresscreated at the interfacial layer due to crack opening.Hence, the behavior of the interfacial layer under shearstress must be investigated for simulation purposes.The most important aspect of this behavior is therelationship between the shear stress (�) and the rela-tive displacement between the plate and the interfaciallayer (s) called slip.
Shear bond tests can be used to determine thisrelationship [2]. Based on statistical analyses of similartest results, researchers have proposed di�erent models
D. Mosto�nejad and S.J. Hosseini/Scientia Iranica, Transactions A: Civil Engineering 24 (2017) 452{466 455
Figure 3. � � s linear relationship.
for capturing this relationship. All these modelsgenerally comprise an ascending and a descendingbranches. Evidently, the ascending branch belongsto the pre-debonding state and the descending onebelongs to the debonding initiation and completionstate. Thus, � � s relationship may be de�ned by fourprincipal parameters that include: maximum shearstress (�max), debonding initiation slip (s0), ultimateslip (sf ), and the fracture energy per unit area (Gf ).Figure 3 illustrates these parameters for a bilinearrelationship.
In this paper, the relations proposed by Lu etal. [12] are used and according to Abdelbaky [13]and Saxena [18], they are more accurate than theircounterparts. These relations can be written as follows:
� = �max
�ss0
�if s � s0; (1a)
� = �max
�sf � ssf � s0
�if s > s0; (1b)
�max = 1:5�wft; (1c)
s0 = 0:0195�wft; (1d)
Gf = 0:308�2w
pft; (1e)
sf =2Gf�max
; (1f)
�w =
vuuut�2:25� bpbc
��1:25 + bp
bc
� ; (1g)
where ft, bc, bp are concrete cracking stress, concretebeam width, and plate width, respectively. Note thatslip is expressed in mm, stress in MPa, and fractureenergy per unit area is expressed in N/mm.
2.2. Cohesive elements and appropriate valuesof the relevant parameters
Cohesive elements are located between two di�erentsurfaces and cause stresses on the surfaces in contactdue to slips. An important property of such elements isthat they can be used to develop an explicit relation be-tween the stress created and the relative displacement(slip) of surfaces. Moreover, this element is capable ofmodeling the debonding failure between surfaces.
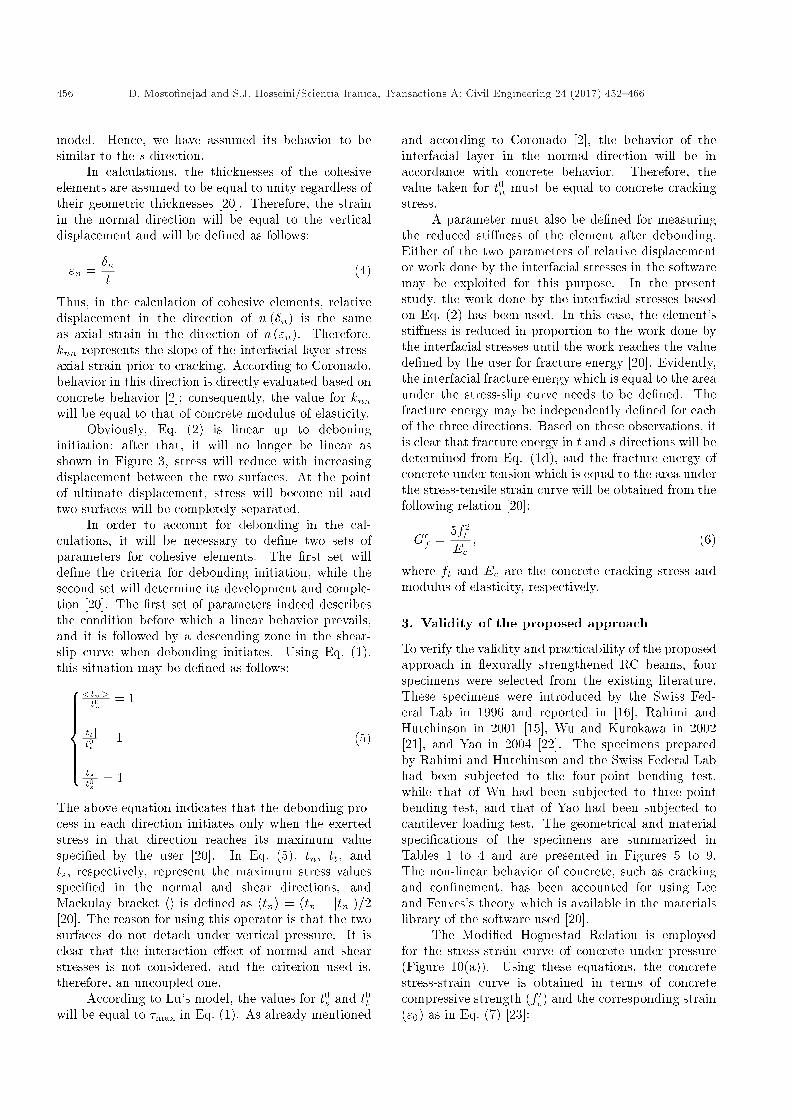
Clearly, two di�erent surfaces in contact maymove relatively to each other either in a vertical orin two parallel directions. When moving in the verticaldirection, the two surfaces induce a normal stress oneach other, while they induce a shear stress whenmoving in two parallel directions. That is why cohesiveelements parameters may be de�ned in three indepen-dent directions. The stress-displacement relation in thelinear mode may be written as follows [20]:8><>:tn = knn�n
ts = kss�stt = ktt�t
(2)
where �n, �s, and �t represent relative displacementsin the vertical and two parallel directions, respectively;tn, ts, and tt designate normal stress and shear stressescreated due to relative displacements. The unit vectorin the direction of n will be obtained from the externalproduct of the unit vector in the direction of s by theunit vector in the direction of t. It must be mentionedthat for the purposes of the present study, the plate ismodeled in a manner that the direction of the �bers isin the direction of s; consequently, the interfacial layerwill be normal to n (Figure 4).
The value of kss represents the slope of thepre-debonding shear stress-displacement curve; thisparameter is introduced into Eq. (1) in accordance withLu's relation and is determined as follows:
kss =�max
s0: (3)
There is little research reported on the behavior tdirection (perpendicular to �bers), since insigni�cantshear stresses actually developed in this direction andso have little impact on the general behavior of the
Figure 4. t, n, and s directions.
456 D. Mosto�nejad and S.J. Hosseini/Scientia Iranica, Transactions A: Civil Engineering 24 (2017) 452{466
model. Hence, we have assumed its behavior to besimilar to the s direction.
In calculations, the thicknesses of the cohesiveelements are assumed to be equal to unity regardless oftheir geometric thicknesses [20]. Therefore, the strainin the normal direction will be equal to the verticaldisplacement and will be de�ned as follows:
"n =�nt
(4)
Thus, in the calculation of cohesive elements, relativedisplacement in the direction of n (�n) is the sameas axial strain in the direction of n ("n). Therefore,knn represents the slope of the interfacial layer stress-axial strain prior to cracking. According to Coronado,behavior in this direction is directly evaluated based onconcrete behavior [2]; consequently, the value for knnwill be equal to that of concrete modulus of elasticity.
Obviously, Eq. (2) is linear up to deboninginitiation; after that, it will no longer be linear asshown in Figure 3, stress will reduce with increasingdisplacement between the two surfaces. At the pointof ultimate displacement, stress will become nil andtwo surfaces will be completely separated.
In order to account for debonding in the cal-culations, it will be necessary to de�ne two sets ofparameters for cohesive elements. The �rst set willde�ne the criteria for debonding initiation, while thesecond set will determine its development and comple-tion [20]. The �rst set of parameters indeed describesthe condition before which a linear behavior prevails,and it is followed by a descending zone in the shear-slip curve when debonding initiates. Using Eq. (1),this situation may be de�ned as follows:8>>>>>><>>>>>>:
<tn>t0n
= 1
jttjt0t
= 1
jtsjt0s
= 1
(5)
The above equation indicates that the debonding pro-cess in each direction initiates only when the exertedstress in that direction reaches its maximum valuespeci�ed by the user [20]. In Eq. (5), tn, tt, andts, respectively, represent the maximum stress valuesspeci�ed in the normal and shear directions, andMackulay bracket hi is de�ned as htni = (tn + jtnj)=2[20]. The reason for using this operator is that the twosurfaces do not detach under vertical pressure. It isclear that the interaction e�ect of normal and shearstresses is not considered, and the criterion used is,therefore, an uncoupled one.
According to Lu's model, the values for t0s and t0twill be equal to �max in Eq. (1). As already mentioned
and according to Coronado [2], the behavior of theinterfacial layer in the normal direction will be inaccordance with concrete behavior. Therefore, thevalue taken for t0n must be equal to concrete crackingstress.
A parameter must also be de�ned for measuringthe reduced sti�ness of the element after debonding.Either of the two parameters of relative displacementor work done by the interfacial stresses in the softwaremay be exploited for this purpose. In the presentstudy, the work done by the interfacial stresses basedon Eq. (2) has been used. In this case, the element'ssti�ness is reduced in proportion to the work done bythe interfacial stresses until the work reaches the valuede�ned by the user for fracture energy [20]. Evidently,the interfacial fracture energy which is equal to the areaunder the stress-slip curve needs to be de�ned. Thefracture energy may be independently de�ned for eachof the three directions. Based on these observations, itis clear that fracture energy in t and s directions will bedetermined from Eq. (1d), and the fracture energy ofconcrete under tension which is equal to the area underthe stress-tensile strain curve will be obtained from thefollowing relation [20]:
Gcf =5f2t
Ec; (6)
where ft and Ec are the concrete cracking stress andmodulus of elasticity, respectively.
3. Validity of the proposed approach
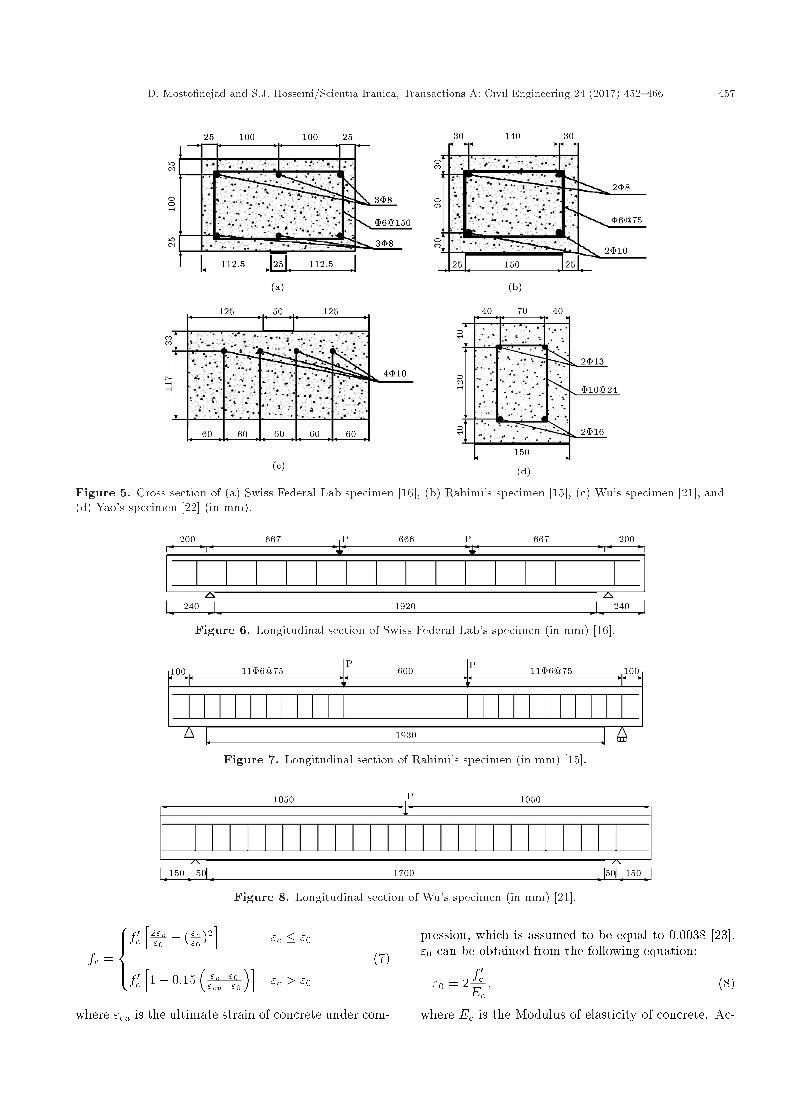
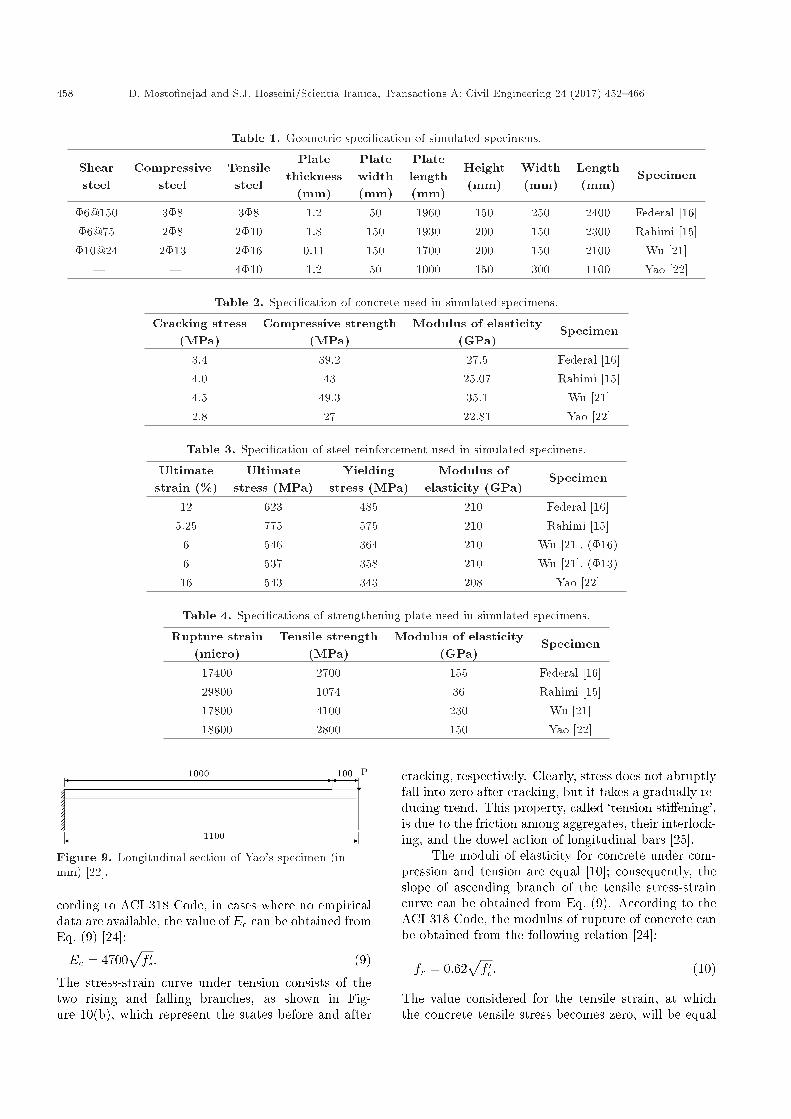
To verify the validity and practicability of the proposedapproach in exurally strengthened RC beams, fourspecimens were selected from the existing literature.These specimens were introduced by the Swiss Fed-eral Lab in 1996 and reported in [16], Rahimi andHutchinson in 2001 [15], Wu and Kurokawa in 2002[21], and Yao in 2004 [22]. The specimens preparedby Rahimi and Hutchinson and the Swiss Federal Labhad been subjected to the four-point bending test,while that of Wu had been subjected to three-pointbending test, and that of Yao had been subjected tocantilever loading test. The geometrical and materialspeci�cations of the specimens are summarized inTables 1 to 4 and are presented in Figures 5 to 9.The non-linear behavior of concrete, such as crackingand con�nement, has been accounted for using Leeand Fenves's theory which is available in the materialslibrary of the software used [20].
The Modi�ed Hognestad Relation is employedfor the stress-strain curve of concrete under pressure(Figure 10(a)). Using these equations, the concretestress-strain curve is obtained in terms of concretecompressive strength (f 0c) and the corresponding strain("0) as in Eq. (7) [23]:
D. Mosto�nejad and S.J. Hosseini/Scientia Iranica, Transactions A: Civil Engineering 24 (2017) 452{466 457
Figure 5. Cross section of (a) Swiss Federal Lab specimen [16], (b) Rahimi's specimen [15], (c) Wu's specimen [21], and(d) Yao's specimen [22] (in mm).
Figure 6. Longitudinal section of Swiss Federal Lab's specimen (in mm) [16].
Figure 7. Longitudinal section of Rahimi's specimen (in mm) [15].
Figure 8. Longitudinal section of Wu's specimen (in mm) [21].
fc =
8>><>>:f 0ch
2"c"0 � ( "c"0 )2
i"c � "0
f 0ch1� 0:15
�"c�"0"cu�"0
�i"c > "0
(7)
where "cu is the ultimate strain of concrete under com-
pression, which is assumed to be equal to 0.0038 [23]."0 can be obtained from the following equation:
"0 = 2f 0cEc; (8)
where Ec is the Modulus of elasticity of concrete. Ac-
458 D. Mosto�nejad and S.J. Hosseini/Scientia Iranica, Transactions A: Civil Engineering 24 (2017) 452{466
Table 1. Geometric speci�cation of simulated specimens.
Shearsteel
Compressivesteel
Tensilesteel
Platethickness
(mm)
Platewidth(mm)
Platelength(mm)
Height(mm)
Width(mm)
Length(mm)
Specimen
�6@150 3�8 3�8 1.2 50 1960 150 250 2400 Federal [16]�6@75 2�8 2�10 1.8 150 1930 200 150 2300 Rahimi [15]�10@24 2�13 2�16 0.11 150 1700 200 150 2100 Wu [21]
{ { 4�10 1.2 50 1000 150 300 1100 Yao [22]
Table 2. Speci�cation of concrete used in simulated specimens.
Cracking stress(MPa)
Compressive strength(MPa)
Modulus of elasticity(GPa)
Specimen
3.4 39.2 27.5 Federal [16]4.0 43 25.07 Rahimi [15]4.5 49.3 35.1 Wu [21]2.8 27 22.81 Yao [22]
Table 3. Speci�cation of steel reinforcement used in simulated specimens.
Ultimatestrain (%)
Ultimatestress (MPa)
Yieldingstress (MPa)
Modulus ofelasticity (GPa)
Specimen
12 623 485 210 Federal [16]5.25 775 575 210 Rahimi [15]
6 546 364 210 Wu [21], (�16)6 537 358 210 Wu [21], (�13)16 543 343 208 Yao [22]
Table 4. Speci�cations of strengthening plate used in simulated specimens.
Rupture strain(micro)
Tensile strength(MPa)
Modulus of elasticity(GPa)
Specimen
17400 2700 155 Federal [16]29800 1074 36 Rahimi [15]17800 4100 230 Wu [21]18600 2800 150 Yao [22]
Figure 9. Longitudinal section of Yao's specimen (inmm) [22].
cording to ACI 318 Code, in cases where no empiricaldata are available, the value of Ec can be obtained fromEq. (9) [24]:
Ec = 4700pf 0c: (9)
The stress-strain curve under tension consists of thetwo rising and falling branches, as shown in Fig-ure 10(b), which represent the states before and after
cracking, respectively. Clearly, stress does not abruptlyfall into zero after cracking, but it takes a gradually re-ducing trend. This property, called `tension sti�ening',is due to the friction among aggregates, their interlock-ing, and the dowel action of longitudinal bars [25].
The moduli of elasticity for concrete under com-pression and tension are equal [10]; consequently, theslope of ascending branch of the tensile stress-straincurve can be obtained from Eq. (9). According to theACI 318 Code, the modulus of rupture of concrete canbe obtained from the following relation [24]:
fr = 0:62pf 0c: (10)
The value considered for the tensile strain, at whichthe concrete tensile stress becomes zero, will be equal

D. Mosto�nejad and S.J. Hosseini/Scientia Iranica, Transactions A: Civil Engineering 24 (2017) 452{466 459
Figure 10. Schematic representations of the stress-strain curves used: (a) For concrete under compression, (b) forconcrete under tension, and (c) for longitudinal steel.
to 10 times the cracking strain, as it is demonstratedin Figure 10(b) [26].
Based on the classic theories used for RC struc-tural analysis and design, a full elastic-plastic regimeis adopted for the stress-strain curve of steel. Inother words, up to the yield strain, this curve willtake a linear form with a slope equal to that ofthe modulus of elasticity of steel. And, beyond thispoint, stress will become constant and equal to yieldstress (Figure 10(c)). Table 3 presents the mechanicalcharacteristics of the steel rebars used in the speci-mens [15,16,21,22].
The stress-strain curves for FRP plates are linearup to the failure point [27]. Given the fact that failuremodes of all the four specimens are the debonding ofthe strengthening plate, and plate rupture was notobserved in any of the specimens, the behavior ofthis material is considered to be a linear elastic one;hence, its failure is not included in the numericalmodel. It is, therefore, necessary to make sure thatthe strain created in the strengthening plate alongthe �ber direction is lower than its rupture strain.Table 4 presents the mechanical characteristics of thestrengthening plates used in the specimens.
For modeling the concrete beam, steel plates, andFRP sheets, 8-node brick elements (with 24 DOFs)were used, while truss elements were utilized for lon-gitudinal reinforcement and steel ties. The Newton-Raphson method was used for the solution of non-linear equations. It must be noted that as 8-node brickelements are used in this paper, degrees of freedom shallonly include displacements (translational degrees offreedom), so that rotations are not included in freedomdegrees. Accordingly, creation of joint supports willrequire translational degrees of freedom to be boundto a single line. In this paper, the displacements onthe edges of support plates were bound to create jointsupports and all the DOFs of the lateral side werebound to create �xed supports. The interfacial layerwas modeled using cohesive.
Based on what was mentioned above about mesh-ing, e�orts were made to use cubic elements of 25�25�25 mm in all the specimens. As for the plate and ad-hesive, cubic elements with a side of 25 mm�25 mm�
thickness of plate, respectively, were used.The dimensions of the elements at the loading
point and the support location were di�erent fromthose of other positions due to geometrical consider-ations. The dimensions of the elements used in theselocations are presented in Table 5 in order of x, y, andz directions. For instance, 19 � 20 � 12:5 will be acube 19 mm long in the x direction, 20 mm wide in they direction, and 12.5 mm in the z direction. Beam'slength is parallel to x, and depth of cross section isparallel to z direction.
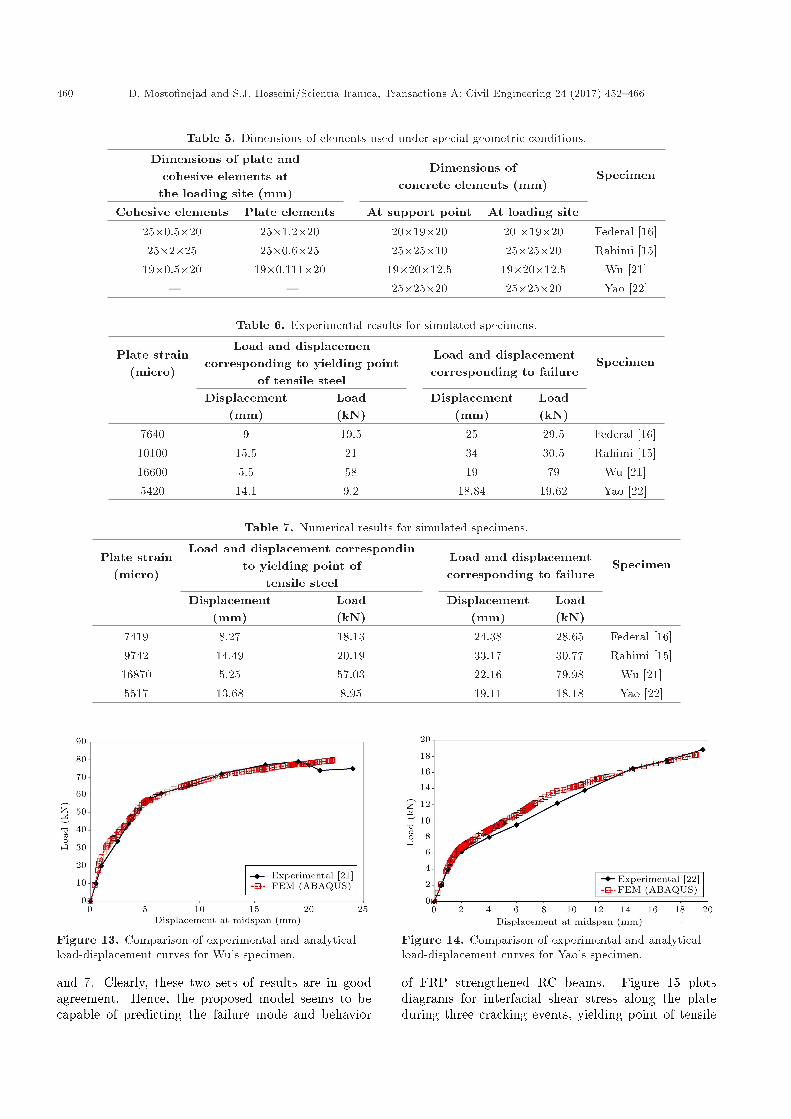
The experimental and analytical results obtainedare compared in Figures 11 to 14 and in Tables 6
Figure 11. Comparison of experimental and analyticalload-displacement curves for Swiss Federal Lab specimen.
Figure 12. Comparison of experimental and analyticalload-displacement curves for Rahimi's specimen.
460 D. Mosto�nejad and S.J. Hosseini/Scientia Iranica, Transactions A: Civil Engineering 24 (2017) 452{466
Table 5. Dimensions of elements used under special geometric conditions.
Dimensions of plate andcohesive elements at
the loading site (mm)
Dimensions ofconcrete elements (mm)
Specimen
Cohesive elements Plate elements At support point At loading site
25�0.5�20 25�1.2�20 20�19�20 20 �19�20 Federal [16]25�2�25 25�0.6�25 25�25�10 25�25�20 Rahimi [15]
19�0.5�20 19�0.111�20 19�20�12.5 19�20�12.5 Wu [21]{ { 25�25�20 25�25�20 Yao [22]
Table 6. Experimental results for simulated specimens.
Plate strain(micro)
Load and displacemencorresponding to yielding point
of tensile steel
Load and displacementcorresponding to failure
Specimen
Displacement(mm)
Load(kN)
Displacement(mm)
Load(kN)
7640 9 19.5 25 29.5 Federal [16]10100 15.5 21 34 30.5 Rahimi [15]16600 5.5 58 19 79 Wu [21]5420 14.1 9.2 18.84 19.62 Yao [22]
Table 7. Numerical results for simulated specimens.
Plate strain(micro)
Load and displacement correspondinto yielding point of
tensile steel
Load and displacementcorresponding to failure
Specimen
Displacement(mm)
Load(kN)
Displacement(mm)
Load(kN)
7419 8.27 18.13 24.38 28.65 Federal [16]9742 14.49 20.19 33.17 30.77 Rahimi [15]16870 5.25 57.03 22.16 79.98 Wu [21]5517 13.68 8.95 19.11 18.18 Yao [22]
Figure 13. Comparison of experimental and analyticalload-displacement curves for Wu's specimen.
and 7. Clearly, these two sets of results are in goodagreement. Hence, the proposed model seems to becapable of predicting the failure mode and behavior
Figure 14. Comparison of experimental and analyticalload-displacement curves for Yao's specimen.
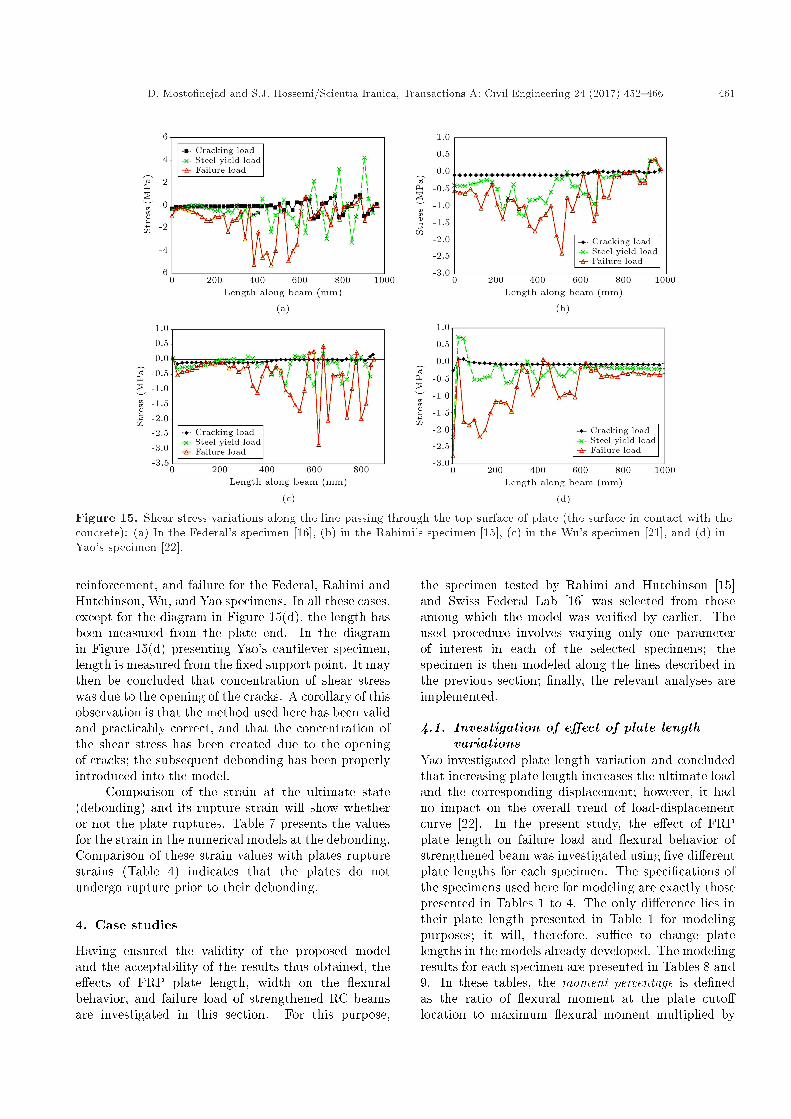
of FRP strengthened RC beams. Figure 15 plotsdiagrams for interfacial shear stress along the plateduring three cracking events, yielding point of tensile
D. Mosto�nejad and S.J. Hosseini/Scientia Iranica, Transactions A: Civil Engineering 24 (2017) 452{466 461
Figure 15. Shear stress variations along the line passing through the top surface of plate (the surface in contact with theconcrete): (a) In the Federal's specimen [16], (b) in the Rahimi's specimen [15], (c) in the Wu's specimen [21], and (d) inYao's specimen [22].
reinforcement, and failure for the Federal, Rahimi andHutchinson, Wu, and Yao specimens. In all these cases,except for the diagram in Figure 15(d), the length hasbeen measured from the plate end. In the diagramin Figure 15(d) presenting Yao's cantilever specimen,length is measured from the �xed support point. It maythen be concluded that concentration of shear stresswas due to the opening of the cracks. A corollary of thisobservation is that the method used here has been validand practicably correct, and that the concentration ofthe shear stress has been created due to the openingof cracks; the subsequent debonding has been properlyintroduced into the model.
Comparison of the strain at the ultimate state(debonding) and its rupture strain will show whetheror not the plate ruptures. Table 7 presents the valuesfor the strain in the numerical models at the debonding.Comparison of these strain values with plates rupturestrains (Table 4) indicates that the plates do notundergo rupture prior to their debonding.
4. Case studies
Having ensured the validity of the proposed modeland the acceptability of the results thus obtained, thee�ects of FRP plate length, width on the exuralbehavior, and failure load of strengthened RC beamsare investigated in this section. For this purpose,
the specimen tested by Rahimi and Hutchinson [15]and Swiss Federal Lab [16] was selected from thoseamong which the model was veri�ed by earlier. Theused procedure involves varying only one parameterof interest in each of the selected specimens; thespecimen is then modeled along the lines described inthe previous section; �nally, the relevant analyses areimplemented.
4.1. Investigation of e�ect of plate lengthvariations
Yao investigated plate length variation and concludedthat increasing plate length increases the ultimate loadand the corresponding displacement; however, it hadno impact on the overall trend of load-displacementcurve [22]. In the present study, the e�ect of FRPplate length on failure load and exural behavior ofstrengthened beam was investigated using �ve di�erentplate lengths for each specimen. The speci�cations ofthe specimens used here for modeling are exactly thosepresented in Tables 1 to 4. The only di�erence lies intheir plate length presented in Table 1 for modelingpurposes; it will, therefore, su�ce to change platelengths in the models already developed. The modelingresults for each specimen are presented in Tables 8 and9. In these tables, the moment percentage is de�nedas the ratio of exural moment at the plate cuto�location to maximum exural moment multiplied by
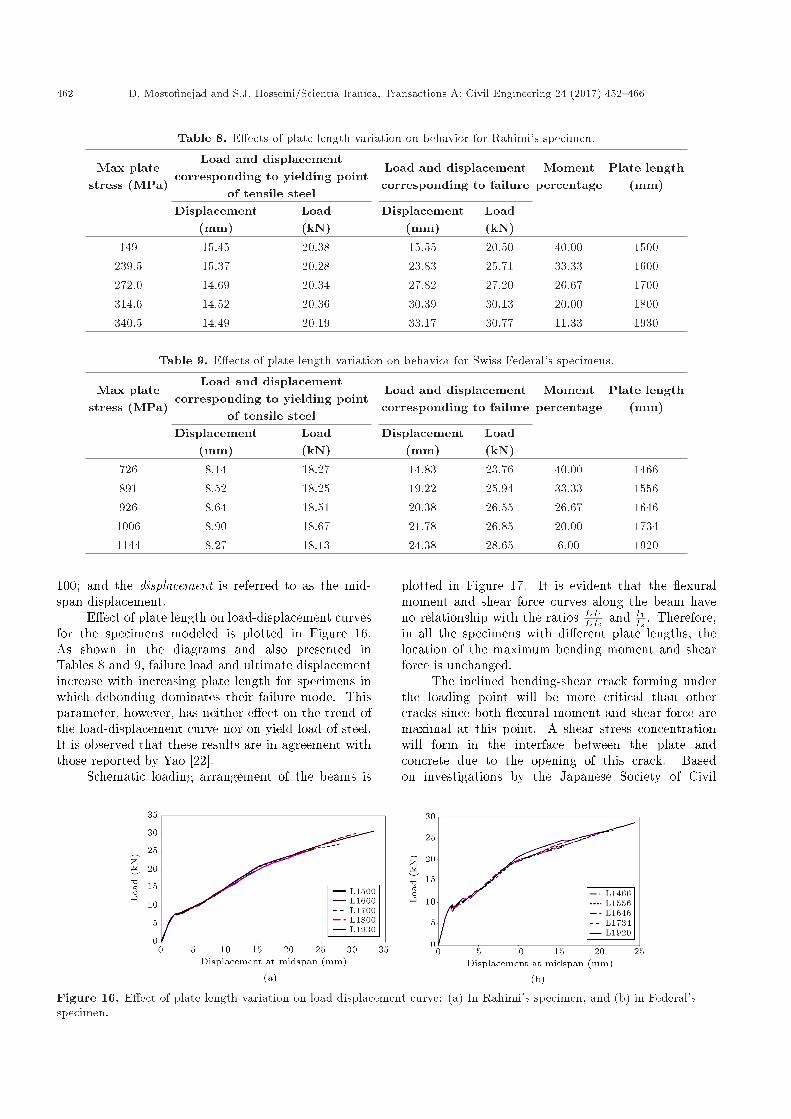
462 D. Mosto�nejad and S.J. Hosseini/Scientia Iranica, Transactions A: Civil Engineering 24 (2017) 452{466
Table 8. E�ects of plate length variation on behavior for Rahimi's specimen.
Max platestress (MPa)
Load and displacementcorresponding to yielding point
of tensile steel
Load and displacementcorresponding to failure
Momentpercentage
Plate length(mm)
Displacement(mm)
Load(kN)
Displacement(mm)
Load(kN)
149 15.45 20.38 15.55 20.50 40.00 1500239.5 15.37 20.28 23.83 25.71 33.33 1600272.0 14.69 20.34 27.82 27.20 26.67 1700314.6 14.52 20.36 30.39 30.13 20.00 1800340.5 14.49 20.19 33.17 30.77 11.33 1930
Table 9. E�ects of plate length variation on behavior for Swiss Federal's specimens.
Max platestress (MPa)
Load and displacementcorresponding to yielding point
of tensile steel
Load and displacementcorresponding to failure
Momentpercentage
Plate length(mm)
Displacement(mm)
Load(kN)
Displacement(mm)
Load(kN)
726 8.14 18.27 14.83 23.76 40.00 1466891 8.52 18.25 19.22 25.94 33.33 1556926 8.64 18.51 20.38 26.55 26.67 16461006 8.90 18.67 21.78 26.85 20.00 17341144 8.27 18.13 24.38 28.65 6.00 1920
100; and the displacement is referred to as the mid-span displacement.
E�ect of plate length on load-displacement curvesfor the specimens modeled is plotted in Figure 16.As shown in the diagrams and also presented inTables 8 and 9, failure load and ultimate displacementincrease with increasing plate length for specimens inwhich debonding dominates their failure mode. Thisparameter, however, has neither e�ect on the trend ofthe load-displacement curve nor on yield load of steel.It is observed that these results are in agreement withthose reported by Yao [22].
Schematic loading arrangement of the beams is
plotted in Figure 17. It is evident that the exuralmoment and shear force curves along the beam haveno relationship with the ratios EI1
EI2 and l1l2 . Therefore,
in all the specimens with di�erent plate lengths, thelocation of the maximum bending moment and shearforce is unchanged.
The inclined bending-shear crack forming underthe loading point will be more critical than othercracks since both exural moment and shear force aremaximal at this point. A shear stress concentrationwill form in the interface between the plate andconcrete due to the opening of this crack. Basedon investigations by the Japanese Society of Civil
Figure 16. E�ect of plate length variation on load-displacement curve: (a) In Rahimi's specimen, and (b) in Federal'sspecimen.
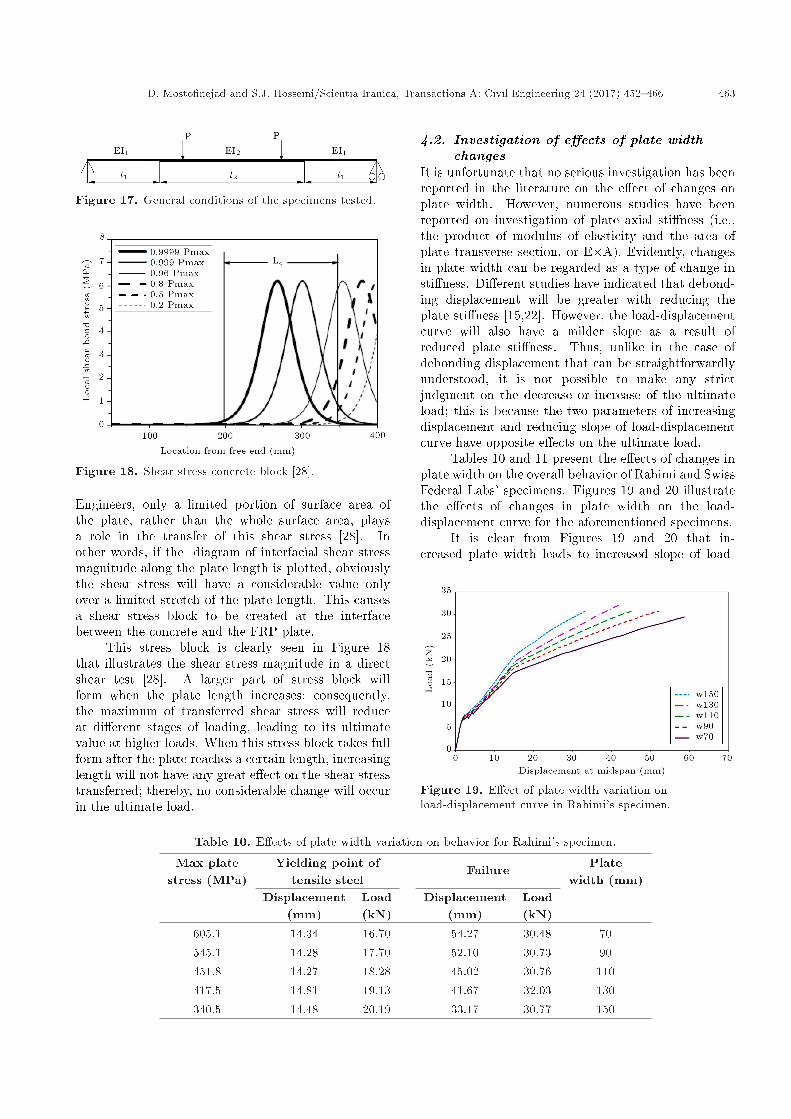
D. Mosto�nejad and S.J. Hosseini/Scientia Iranica, Transactions A: Civil Engineering 24 (2017) 452{466 463
Figure 17. General conditions of the specimens tested.
Figure 18. Shear stress concrete block [28].
Engineers, only a limited portion of surface area ofthe plate, rather than the whole surface area, playsa role in the transfer of this shear stress [28]. Inother words, if the diagram of interfacial shear stressmagnitude along the plate length is plotted, obviouslythe shear stress will have a considerable value onlyover a limited stretch of the plate length. This causesa shear stress block to be created at the interfacebetween the concrete and the FRP plate.
This stress block is clearly seen in Figure 18that illustrates the shear stress magnitude in a directshear test [28]. A larger part of stress block willform when the plate length increases; consequently,the maximum of transferred shear stress will reduceat di�erent stages of loading, leading to its ultimatevalue at higher loads. When this stress block takes fullform after the plate reaches a certain length, increasinglength will not have any great e�ect on the shear stresstransferred; thereby, no considerable change will occurin the ultimate load.
4.2. Investigation of e�ects of plate widthchanges
It is unfortunate that no serious investigation has beenreported in the literature on the e�ect of changes onplate width. However, numerous studies have beenreported on investigation of plate axial sti�ness (i.e.,the product of modulus of elasticity and the area ofplate transverse section, or E�A). Evidently, changesin plate width can be regarded as a type of change insti�ness. Di�erent studies have indicated that debond-ing displacement will be greater with reducing theplate sti�ness [15,22]. However, the load-displacementcurve will also have a milder slope as a result ofreduced plate sti�ness. Thus, unlike in the case ofdebonding displacement that can be straightforwardlyunderstood, it is not possible to make any strictjudgment on the decrease or increase of the ultimateload; this is because the two parameters of increasingdisplacement and reducing slope of load-displacementcurve have opposite e�ects on the ultimate load.
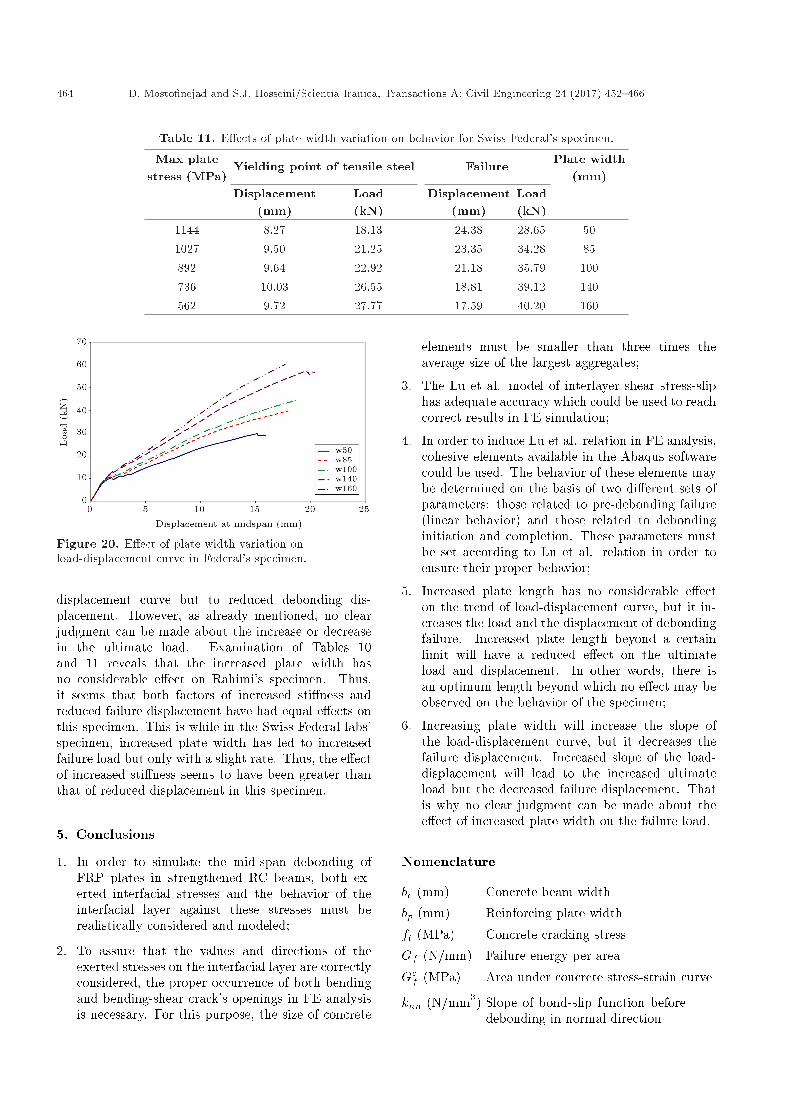
Tables 10 and 11 present the e�ects of changes inplate width on the overall behavior of Rahimi and SwissFederal Labs' specimens. Figures 19 and 20 illustratethe e�ects of changes in plate width on the load-displacement curve for the aforementioned specimens.
It is clear from Figures 19 and 20 that in-creased plate width leads to increased slope of load-
Figure 19. E�ect of plate width variation onload-displacement curve in Rahimi's specimen.
Table 10. E�ects of plate width variation on behavior for Rahimi's specimen.
Max platestress (MPa)
Yielding point oftensile steel
Failure Platewidth (mm)
Displacement(mm)
Load(kN)
Displacement(mm)
Load(kN)
605.1 14.34 16.70 54.27 30.48 70545.1 14.28 17.70 52.10 30.73 90451.8 14.27 18.28 45.02 30.76 110417.5 14.81 19.13 41.67 32.03 130340.5 14.48 20.19 33.17 30.77 150
464 D. Mosto�nejad and S.J. Hosseini/Scientia Iranica, Transactions A: Civil Engineering 24 (2017) 452{466
Table 11. E�ects of plate width variation on behavior for Swiss Federal's specimen.
Max platestress (MPa)
Yielding point of tensile steel Failure Plate width(mm)
Displacement(mm)
Load(kN)
Displacement(mm)
Load(kN)
1144 8.27 18.13 24.38 28.65 501027 9.50 21.25 23.35 34.28 85892 9.64 22.92 21.18 35.79 100736 10.03 26.55 18.81 39.12 140562 9.72 27.77 17.59 40.20 160
Figure 20. E�ect of plate width variation onload-displacement curve in Federal's specimen.
displacement curve but to reduced debonding dis-placement. However, as already mentioned, no clearjudgment can be made about the increase or decreasein the ultimate load. Examination of Tables 10and 11 reveals that the increased plate width hasno considerable e�ect on Rahimi's specimen. Thus,it seems that both factors of increased sti�ness andreduced failure displacement have had equal e�ects onthis specimen. This is while in the Swiss Federal labs'specimen, increased plate width has led to increasedfailure load but only with a slight rate. Thus, the e�ectof increased sti�ness seems to have been greater thanthat of reduced displacement in this specimen.
5. Conclusions
1. In order to simulate the mid-span debonding ofFRP plates in strengthened RC beams, both ex-erted interfacial stresses and the behavior of theinterfacial layer against these stresses must berealistically considered and modeled;
2. To assure that the values and directions of theexerted stresses on the interfacial layer are correctlyconsidered, the proper occurrence of both bendingand bending-shear crack's openings in FE analysisis necessary. For this purpose, the size of concrete
elements must be smaller than three times theaverage size of the largest aggregates;
3. The Lu et al. model of interlayer shear stress-sliphas adequate accuracy which could be used to reachcorrect results in FE simulation;
4. In order to induce Lu et al. relation in FE analysis,cohesive elements available in the Abaqus softwarecould be used. The behavior of these elements maybe determined on the basis of two di�erent sets ofparameters: those related to pre-debonding failure(linear behavior) and those related to debondinginitiation and completion. These parameters mustbe set according to Lu et al. relation in order toensure their proper behavior;
5. Increased plate length has no considerable e�ecton the trend of load-displacement curve, but it in-creases the load and the displacement of debondingfailure. Increased plate length beyond a certainlimit will have a reduced e�ect on the ultimateload and displacement. In other words, there isan optimum length beyond which no e�ect may beobserved on the behavior of the specimen;
6. Increasing plate width will increase the slope ofthe load-displacement curve, but it decreases thefailure displacement. Increased slope of the load-displacement will lead to the increased ultimateload but the decreased failure displacement. Thatis why no clear judgment can be made about thee�ect of increased plate width on the failure load.
Nomenclature
bc (mm) Concrete beam widthbp (mm) Reinforcing plate widthft (MPa) Concrete cracking stressGf (N/mm) Failure energy per areaGcf (MPa) Area under concrete stress-strain curve
knn (N/mm3) Slope of bond-slip function beforedebonding in normal direction
D. Mosto�nejad and S.J. Hosseini/Scientia Iranica, Transactions A: Civil Engineering 24 (2017) 452{466 465
ktt (N/mm3) Slope of bond-slip function beforedebonding in t direction
kss (N/mm3) Slope of bond-slip function beforedebonding in s direction
s (mm) Slip between beam and reinforcingplate
sf (mm) Debonding slip of reinforcing plates0 (mm) Slip corresponding maximum shear
stresstn (MPa) Normal stress in cohesive elementts (MPa) Shear stress in cohesive element in s
directiontt (MPa) Shear stress in cohesive element in t
direction�w Shape factor of reinforcing plate�(MPa) Shear stress in plate and beam
interface layer�max (MPa) Maximum shear stress in plate and
beam interface layer�n (mm) Relative displacement between two
sides of cohesive element in normaldirection
�s (mm) Relative displacement between twosides of cohesive element in s direction
�t (mm) Relative displacement between twosides of cohesive element in t direction
References
1. Teng, J.G., Chen, J.F., Smith, S.T. and Lam, L., FRPStrengthened RC Structures, John Wiley & Sons Ltd.,England (2002).
2. Coronado, C. \Characterization, modeling and sizee�ect of concrete-epoxy interfaces", Department ofCivil and Environmental Engineering, PennsylvaniaState University, PhD Thesis (2006).
3. Greco, F., Lonetti, P. and Blasi, P.N. \An analyt-ical investigation of debonding problems in beamsstrengthened using composite plates", EngineeringFracture Mechanics, 74(3), pp. 346-372 (2007).
4. Esna Ashari, S. and Mohammadi, S. \Fracture analy-sis of FRP-reinforced beams by orthotropic XFEM",Journal of Composite Materials, 46, pp. 1367-1389(2012).
5. Bruno, D., Greco, F. and Lonetti, P. \A fracture-ALE formulation to predict dynamic debonding inFRP strengthened concrete beams", Composites PartB: Engineering, 46, pp. 46-60 (2013).
6. T�aljsten, B. \Strengthening of beams by plate bond-ing", Journal of Materials in Civil Engineering, 9(4),pp. 206-212 (1997).
7. Wu, Z. and Hemdan, S. \Debonding in FRP-strengthened exural members with di�erent shear-span ratios", 7th Int. Symposium on Fiber Reinforced
Composite Reinforcement for Concrete Structures, 1,pp. 411-426, Michigan, USA (2005).
8. Wang, J.L. \Debonding of FRP-plated reinforced con-crete beam, a bond-slip analysis. I. Theoretical formu-lation", International Journal of Solids and Structures,43(21), pp. 6649-6664 (2006).
9. Lu, X.Z., Teng, J.G., Ye, L.P., and Jiang J.J. \In-termediate crack debonding in FRP-strengthened RCbeams: FE analysis and strength model", ASCEJournal oF Composites for Construction, 11(2), pp.161-174 (2007).
10. De Lorenzis, L. and Zavarise, G. \Cohesive zonemodeling of interfacial stresses in plated beams",International Journal of Solids and Structures, 46(24),pp. 4181-4191 (2009).
11. Rabinovitch, O. \An extended high order cohesiveinterface approach to the debonding analysis of FRPstrengthened beams", International Journal of Me-chanical Sciences, 81, pp. 1-16 (2014).
12. Lu, X.Z., Teng, J.G., Ye, L.P. and Jiang, J.J. \Bond-slip models for FRP sheets/plates bonded to concrete",Engineering Structures, 27(6), pp. 920-937 (2005).
13. Abdelbaky, H. \Nonlinear micromechanics-based �niteelement analysis of the interfacial behavior of FRP-strengthened reinforced concrete beams", Departmentof Civil Engineering, Sherbrooke University, Canada,PhD Thesis (2008).
14. Hu, H.T., Lin, F.M. and Jan, Y.Y. \Nonlinear �-nite element analysis of reinforced concrete beamsstrengthened by �ber reinforced plastics", Compositesfor Construction, 63, pp. 271-281 (2001).
15. Rahimi, H. and Hutchinson, A. \Concrete beamsstrengthened with externally bonded FRP plates",Composites for Construction, 5(1), pp. 44-56 (2001).
16. Aram, M.R., Czaderski, C. and Motavalli, M.\Debonding failure modes of exural FRP strength-ened RC beams", Composites Part B, 39, pp. 826-841(2008).
17. Lu, F. and Ayoub, A. \Evaluation of debonding failureof reinforced concrete girders strengthened in exurewith FRP laminates using �nite element modeling",Construction and Building Materials, 25(4), pp. 1963-1979 (2011).
18. Saxena, P. \Interfacial bond behavior between FRPand concrete substrate", The Department of Civil andEnvironmental Engineering, University of Alabama,Master Thesis, Alabama (2006).
19. Hosseini, S.J. \Modeling of FRP-concrete interfacedebonding in strengthened reinforced concrete beamswith some case studies", The Department of CivilEngineering, Isfahan University of Technology, MasterThesis, Isfahan (2009).
20. ABAQUS Inc. \ABAQUS/theory user manual; Ver-sion 6.7", Dassault Syst�emes, Providence, RI, USA(2007).

466 D. Mosto�nejad and S.J. Hosseini/Scientia Iranica, Transactions A: Civil Engineering 24 (2017) 452{466
21. Wu, Z.S. and Kurokawa, T. \Strengthening e�ects ande�ective anchorage method for exural members withexternally bonded CFRP plates", JSCE Journal ofMaterial, Concrete Structures and Pavements, 56, pp.1-13 (2002).
22. Yao, J. \Debonding failures in RC beams and slabsstrengthened with FRP plates", Department of Civiland Structural Engineering, Hong Kong PolytechnicUniversity, PhD Thesis, Hong Kong (2004).
23. Mosto�nejad, D., Reinforced Concrete Structures, 1,34th edition, Arkan Danesh Publisher, Isfahan, Iran(2014).
24. ACI Committee 318, Building Code Requirements forStructural Concrete (ACI 318-14) and Commentary,American Concrete Institute, Detroit, Mich, USA(2014).
25. Chung, W.S. \A cracked concrete material model forthe nonlinear �nite element analysis of slab-on-girderbridges", Purdue University, PhD Thesis (2003).
26. ACI Committee 224, Cracking of Concrete Members inDirect Tension, American Concrete Institute, Detroit,Mich, USA (1997).
27. ACI Committee 440, Guide for the Design and Con-struction of Externally Bonded FRP Systems forStrengthening Concrete Structures, ACI 440.2R-08,Farmington Hills, MI, USA (2008).
28. Maruyama, K. \Recommendations for upgrading ofconcrete structures with use of continuous �bersheets", Research Committee on Upgrading of Con-
crete Structures with use of Continuous Fiber Sheets,Japan Society of Civil Engineers (JSCE) (2001).
29. WhaBai, J. \Seismic retro�t for reinforced concretebuilding structures", Consequence based engineer-ing (CEB) Institute Final Report, Texas University(2003).
Biographies
Davood Mosto�nejad received the BS degree inCivil Engineering from Tehran University, Iran, 1985,and MSc and PhD degrees from the Isfahan Universityof Technology and Carleton University, 1987 and 1997,respectively. He is currently a Distinguished Professorof Concrete Engineering at Department of Civil Engi-neering in Isfahan University of Technology, Isfahan,Iran. His research interests lie in the applicationof Fiber Reinforced Polymer (FRP) in concrete andmasonry structures. He has published over 190 researcharticles and 13 books.
Saied Jalil Hosseini received the BS and MSc degreesin Civil Engineering from Isfahan University of Tech-nology, 2005 and 2009, respectively. He is currentlya PhD candidate in Structural Engineering at De-partment of Civil Engineering in the same University.His research interests lie in the Application of FiberReinforced Polymer (FRP) in concrete structures. Hehas published 2 journal articles.


![A new model to optimize the knowledge exchange …scientiairanica.sharif.edu/article_4065_00e595332522b5a...Power and Lundmark [34] 836 H.R. Dezfoulian et al./Scientia Iranica, Transactions](https://img.pdfslide.net/doc/110x75/5f59c0fe25e6b7600049c058/a-new-model-to-optimize-the-knowledge-exchange-power-and-lundmark-34-836-hr.jpg)