Embed Size (px)
Citation preview
SIMULATING HIGH-THROUGHPUT CRYPTOCURRENCY PAYMENT CHANNEL NETWORKS
BY
CHRISTOPHER NEAL CORDI
THESIS
Submitted in partial fulfillment of the requirements for the degree of Master of Science in Computer Science
in the Graduate College of the University of Illinois at Urbana-Champaign, 2017
Urbana, Illinois Adviser: Professor Andrew Miller
ii
ABSTRACT
Payment channels secured with cryptocurrency as collateral enable users to make many
transactions with few blockchain broadcasts. Networks of payment channels have emerged as a
proposed solution to Bitcoin’s scaling problem. Since the proposal of the first payment channel
network, the Lightning Network, alternatives promising significant improvements, such as the
Sprites protocol, have been proposed. Without at-scale implementations to analyze in situ, it is
difficult to make meaningful comparisons of payment channel network protocols. In order to
bridge this gap, we introduce a new simulation framework that can be used to evaluate how
different payment channel network protocols will perform in both the expected and worst
cases.
Our framework is generic and accommodates benchmarking across different variants of
payment channel network protocols, network topologies, routing algorithms, and user
behaviors. User spending behavior in our payment channel network simulator is generated
based on behavioral modeling techniques used in credit card fraud research. Our simulation is
the first payment channel network simulator to seed user behaviors with data from real-world
credit card users.
Our framework can be used to evaluate expected case performance and resiliency to attacks
across different payment channel network protocols and routing algorithms. We demonstrate
the utility of our framework through comparisons of the Lightning Network to Sprites. We also
compare the proposed decentralized routing algorithm, Flare, to an ideal centralized routing
algorithm. Our results reveal that if spending behaviors are similar to those of credit card users,
scale-free network topologies achieve higher throughput and resiliency compared to small-
world networks. We also confirm that the Sprites protocol enjoys numerous advantages over
the Lightning Network including smaller durations, shorter path length payments, and greater
resiliency, all of which are most significant in decentralized topologies using decentralized
routing algorithms.
iii
TABLE OF CONTENTS
CHAPTER 1: INTRODUCTION ........................................................................................................... 1
CHAPTER 2: BACKGROUND AND RELATED WORK .......................................................................... 6
CHAPTER 3: SIMULATION FRAMEWORK ...................................................................................... 14
CHAPTER 4: RESULTS..................................................................................................................... 31
CHAPTER 5: CONCLUSION ............................................................................................................. 51
REFERENCES .................................................................................................................................. 52
1
CHAPTER 1: INTRODUCTION
Since its introduction in 2009, Bitcoin [1] is a p2p cryptocurrency network that has reached a
market cap of $76.4 billion [2] and is beginning to show scaling problems from this rapid
growth. Bitcoin’s security guarantees rely on having all nodes replicate every transaction in the
network. This network-wide replication is achieved using a distributed consensus protocol
where transactions are verified in chunks, called blocks. These blocks are 1 MB large and occur
on average every 10 minutes, which arbitrarily limits the maximum throughput of the Bitcoin
network to be about 7 transactions per second. The fact that every node replicates each
transaction makes increasing the limit challenging. This low throughput may hamstring the
currency’s utility in the future if transaction latencies and fees become too large for
micropayments.
Payment channels secured with cryptocurrency as collateral enable users to make many
transactions with few blockchain broadcasts. By requiring blockchain consensus to mediate
disputes, users can securely make payment channel transactions off-chain, i.e. without
broadcasting to the blockchain. Essential to payment channels are time-locks, which enable
cryptocurrency to be used as collateral by preventing the locked cryptocurrency from being
spent for a chosen period of time (the locktime). Hash-Timelock Contracts (HTLCs) combine
time-locks with hash-locks, which prevent cryptocurrency from being spent until the preimage
to a chosen hash value is revealed. HTLCs enable payments to be securely sent over a path of
payment channels. Networks of payment channels have emerged as a proposed solution to
Bitcoin’s scaling problem by offloading most transactions off of the blockchain.
Following the proposal of the Lightning Network [3], the first payment channel network, several
alternatives and optimizations have emerged including the Raiden Network [4] and Sprites [5].
Lightning transactions require relative locktimes; successive hops in the path of channels from
source to destination have increasingly larger locktimes. Sprites transactions use a constant
locktime; all hops in the path of channels have the same locktime. One worry with payment
2
channel networks is that because transactions require that all parties in the path of channels
must lock their currency as collateral for a period of time, there may be large opportunity costs
involved with transactions. This collateral cost can be quantified as the product of the collateral
value ($) and the time that it was held. The relative locktime required between nodes in
Lightning transactions causes the asymptotic collateral cost to be O(𝑙∆ ) where 𝑙 is the number
of hops in the HTLC, and ∆ is the minimum locktime between hops. Transactions in Sprites,
which have constant locktimes, have asymptotic collateral cost O(𝑙 + ∆ ). This does not have
much effect in the normal case, but is significant in the case of a denial of service attack where
adversaries purposely wait until the last moment to complete payments.
Sprites also supports incremental deposits, which allow additional cryptocurrency funds to be
deposited into a channel without requiring that users close and reopen the channel. One of the
concerns with payment channel networks is that channels may become “unbalanced”, where
one balance ends up depleted and requires “rebalancing” before both users can continue using
the channel. Because no channels are required to close, incremental deposits mitigate the
impact on payment channel network liquidity when using on-chain funds to rebalance channels.
Lacking an at-scale implementation of any payment channel network to study leaves much
uncertainty about what kind of network topology, routing algorithms, and spending behaviors
should be expected in payment channel networks. This uncertainty adds tremendous difficulty
to making practical performance and security comparisons across these protocols. With this in
mind, we present a simulation framework capable of modeling the many possible variations of
payment channel networks.
1.1 OVERVIEW OF SIMULATION FRAMEWORK
The purpose of our framework is to enable evaluation of proposed payment channel network
protocols and routing algorithms. Modeling any complex system depends on the
parameterization of many variables that may influence performance. Simulating payment
channel networks requires the modeling of the following components:
3
1. Network Size
2. Network Topology
3. Network Propagation
4. Payment Channel Network Protocol
5. Routing Policy
6. User Spending Behaviors
7. Rebalancing Policies
8. Adversarial Model
We use discrete time simulation to approximate the expected behavior of payment channel
networks. There is an inherent tradeoff between computational cost (running time and
memory), precision (the duration of a tick), and network size. We can increase the accuracy of
the simulation, at the expense of longer runtimes, by making ticks arbitrarily small. In our
experimentation we use ticks that are 1 second long.
The validity of results from our simulator comes from the use of real-world data and Monte
Carlo simulation. We have high confidence that the expected behavior of at-scale payment
channel networks is accurately represented because our parameter assumptions are based on
measurements of similar real-world systems. Additionally, though several parameters (such as
network topology and spending behaviors) are sampled from random distributions, we perform
thousands of simulations to make our results robust to overfitting to a subset of possible
configurations.
In addition to benchmarking the expected behavior of payment channel networks, our
framework can be used to assess the impact of potential attacks. The different components in
our simulation can be varied allowing researchers to compare specific components of payment
channel networks under precisely defined network conditions. In our experimentation, we
simulate a potential attack on the network where some fraction of the nodes waits until the
last possible moment before completing a payment.
4
1.2 RESEARCH QUESTIONS
We demonstrate the capability of our simulation framework by evaluating different payment
protocols and routing algorithms. In our experimentation, we evaluate the performance and
resiliency of both the Lightning Network and Sprites protocols, as well as the Flare Routing
Algorithm. We benchmark performance by simulating the network over expected conditions
and benchmark resilience by simulating an attack on the network.
The Sprites protocol supports several optimizations compared to the Lightning Network
including incremental deposits and constant locktimes. With the use of constant locktimes,
Sprites is able to decrease the transaction time-out delay to O(𝑙 + ∆ ) instead of O(𝑙∆ ) in
Lightning. Though the optimization is clearly significant asymptotically, it is difficult to assess
whether the effects will be significant in practice, which made it an ideal candidate for
experimentation.
In addition to the comparing the Lightning and Sprites payment channel networks, we also
evaluate the performance of Flare, a proposed decentralized routing algorithm for payment
channel networks. We compare the performance and resiliency of Flare to an ideal centralized
shortest path algorithm.
Questions we specifically address:
1. How well do the Lightning and Sprites protocols scale under variations of network size,
topology, routing algorithms, and spending behaviors?
2. Do the incremental deposits and constant locktimes offered by Sprites significantly
affect performance or resiliency?
3. How do the performance and resiliency of Flare compare to that of an ideal centralized
routing algorithm?
5
1.3 CONTRIBUTIONS
1. We present a novel payment channel network simulation framework that can be used
to evaluate proposed payment channel networks before deployment. We seed our
model with consumer spending behaviors from real-world data from millions of credit
card users.
2. Using our simulation framework, we benchmark and compare the performances of both
Lightning Network to Sprites and Flare to an ideal centralized routing algorithm.
3. We benchmark the resiliency in each of our comparisons through the simulation of a
“petty” attack on the network, i.e. an attacker that attempts to reduce throughput.
4. Our results show that many channels in the payment channel network will end up
unbalanced if spending behavior follows a similar pattern to that of credit card users.
Incremental deposits significantly enhance throughput when rebalancing using on-chain
transactions. In our simulations we show that the use of incremental deposits can more
than double the throughput of payment channel networks.
5. We show that the effect of petty node attacks is much more significant in small-world
networks compared to scale-free networks. Additionally, though the average payment
duration time increases tremendously with both protocols, the throughput decreases by
61.1% in the Lightning Network compared to 8.3% in Sprites.
6
CHAPTER 2: BACKGROUND AND RELATED WORK
2.1 BLOCKCHAINS AND CRYPTOCURRENCIES
Cryptocurrency systems, such as Bitcoin and Ethereum, rely on the use of public key
cryptography and a distributed consensus protocol to verify transactions between users. The
distributed consensus is validated in chunks of transactions called blocks. Users must
authenticate transactions they send with their private key signature, and miners validate the
signature and the availability of funds in the account. Space is limited within blocks, but users
can incentivize miners to include their transactions in a block by providing a transaction fee.
The 1 MB blocksize and 10-minute blocktime constrain the maximum throughput of the Bitcoin
network to be about 7 transactions per second. Latency and transaction fees are likely to
increase with usage, which could prevent the use of Bitcoin for micropayments.
Several solutions to improve the scalability of the Bitcoin network have been proposed. Some
rely on optimizing the consensus process, including increasing (or outright removing) the
blocksize limit. Others, such as payment channel networks, attempt to reduce strain on the
network by offloading many of the transactions off-chain (without blockchain broadcasts) by
only using the blockchain to act as a trusted adjudicator. These off-chain solutions can amortize
a few on-chain transactions over thousands of off-chain transactions.
2.2 PAYMENT CHANNELS
Contracts define specific instructions for moving currency that are executed by the consensus
of nodes in the blockchain, which enables trusted execution of arbitrary programs on the
blockchain. Duplex payment channels built using contracts are the fundamental building block
for off-chain payment channel networks. Two parties can create a payment channel contract
secured with Bitcoin collateral using an on-chain transaction. Each party funds their deposit
from their Bitcoin account with the use of time-locks, which lock the deposited amount of
Bitcoin for a determined maximum contract duration. Because channel balances are entirely
secured with Bitcoin, both parties are assured that the other will not spend more money than
7
they can pay back at the expense of freezing the entire deposit for the duration of the contract.
In Lightning, both parties also create a revocation transaction, which, when posted to the
blockchain, closes the channel and distributes the original funding deposits in accordance with
the final channel deposits. Successive off-chain transactions between both parties create a new
revocation transaction, which invalidates all former revocation transactions. These time-locks
also ensure that if one party were to act dishonestly (e.g. broadcasting an old revocation
transaction), the other has enough time to dispute it; dishonest parties are penalized with the
forfeit of their entire deposit. Time-locks and the blockchain enforce that the contract is being
followed fairly by both parties.
After creating the payment channel, both parties can continuously exchange off-chain
payments until either their balance is exhausted or one party decides to close the channel. On-
chain transactions are required only to open and close payment channels. Though their
blockchain funds are locked up for the duration of the contract, either party can initiate the
closing of the channel at any time, and after a grace period, the closing transaction will be
eligible to be included in a Bitcoin block. Not requiring the consensus of the entire Bitcoin
network for each transaction allows for payment channel transactions to be much faster and
cheaper (due to no transaction fees) than on-chain transactions. Both parties are incentivized
to reuse payment channels many times before closing in order to further amortize the
necessary setup and closing on-chain transactions.
2.3 THE LIGHTNING NETWORK
It is not technically or fiscally feasible for all participants of the Bitcoin network to open a
payment channel with each other: each party would need to coordinate and fund O(n) channels
to all other parties in the network. In total, this would require that the network contain O(n^2)
channels and deposits. The Lightning Network allows two parties to send transactions through a
path of intermediate channels when they do not have a direct channel. This allows participants
who have opened only O(1) channels to route a payment to any other node in the network
(provided that a path of channels with enough capacity exists). In order route payments
8
through intermediate nodes, the Lightning Network relies upon Hash-Timelock Contracts
(HLTCs), which combine hash-locks and time-locks to enforce atomicity and fairness.
Hash-locks unlock only upon the release of the preimage of a hash chosen by the recipient of
the payment, and they are used to ensure that no node will send money unless the entire
transaction completes (atomicity). Time-locks serve as deadlines for when the preimage must
be released before the recipient of a transaction is eligible to initiate a dispute to receive their
funds from the source. Disputes close the channel, so nodes are incentivized prevent them
from happening. The time-locks guarantee that there is a maximum upper bound on the length
of time that a node must lock up their currency to; this protects against failed and malicious
nodes. The HTLCs in Lightning require that there is an adequate relative grace period between
each node involved in the transaction. This leads to the asymptotic collateral cost being O(𝑙∆ )
where 𝑙 is the number of hops in the HTLC and ∆ is the minimum number of blocks a node has
to reveal their preimage before the recipient is able to initiate a dispute. In the normal case,
transactions are not expected to timeout; however, in the worst case this may lead to a large
opportunity cost due to currency being held for long periods of time. An example of an HTLC in
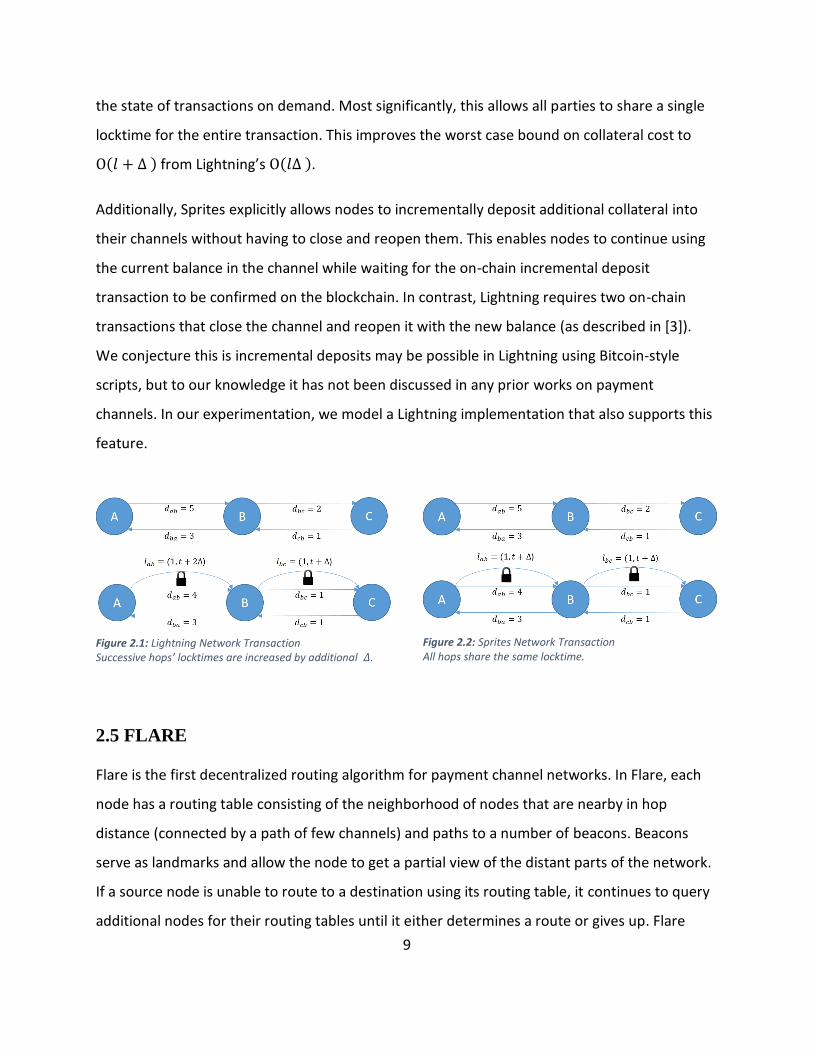
Lightning is shown in Figure 2.1.
Consumers and merchants are incentivized to join the payment channel network, so they can
greatly increase their accessibility to other nodes. Intermediate nodes can be incentivized to be
part of a transaction with the use of transaction fees, similar to miners in Bitcoin now. Most
importantly, the Lightning Network benefits tremendously from the network effect – as more
nodes join the network, the utility of the off-chain currency increases because there are more
consumers to sell to and vendors to buy from.
2.4 SPRITES
Another payment channel network protocol, Sprites, touts two significant features that
distinguish it from the Lightning Network: (1) constant transaction locktimes and (2)
incremental deposits. Sprites uses a global contract that allows multiple parties to synchronize
9
the state of transactions on demand. Most significantly, this allows all parties to share a single
locktime for the entire transaction. This improves the worst case bound on collateral cost to
O(𝑙 + ∆ ) from Lightning’s O(𝑙∆ ).
Additionally, Sprites explicitly allows nodes to incrementally deposit additional collateral into
their channels without having to close and reopen them. This enables nodes to continue using
the current balance in the channel while waiting for the on-chain incremental deposit
transaction to be confirmed on the blockchain. In contrast, Lightning requires two on-chain
transactions that close the channel and reopen it with the new balance (as described in [3]).
We conjecture this is incremental deposits may be possible in Lightning using Bitcoin-style
scripts, but to our knowledge it has not been discussed in any prior works on payment
channels. In our experimentation, we model a Lightning implementation that also supports this
feature.
2.5 FLARE
Flare is the first decentralized routing algorithm for payment channel networks. In Flare, each
node has a routing table consisting of the neighborhood of nodes that are nearby in hop
distance (connected by a path of few channels) and paths to a number of beacons. Beacons
serve as landmarks and allow the node to get a partial view of the distant parts of the network.
If a source node is unable to route to a destination using its routing table, it continues to query
additional nodes for their routing tables until it either determines a route or gives up. Flare
Figure 2.1: Lightning Network Transaction Successive hops’ locktimes are increased by additional 𝛥.
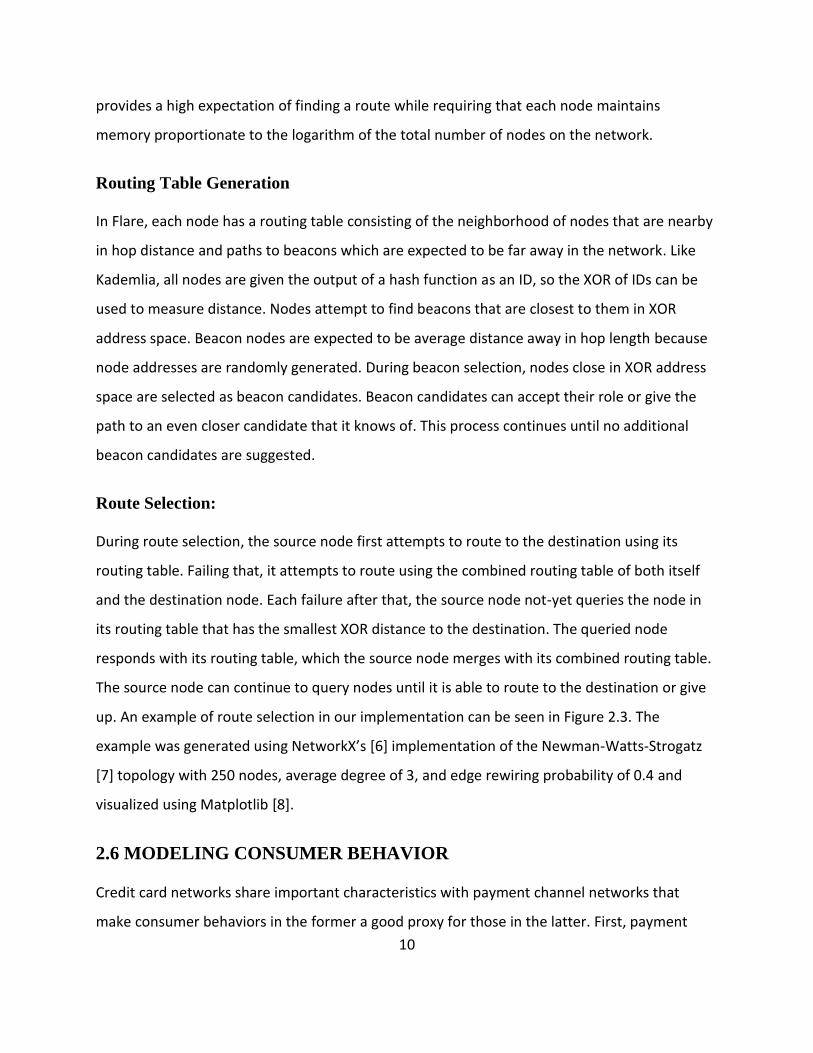
Figure 2.2: Sprites Network Transaction All hops share the same locktime.
10
provides a high expectation of finding a route while requiring that each node maintains
memory proportionate to the logarithm of the total number of nodes on the network.
Routing Table Generation
In Flare, each node has a routing table consisting of the neighborhood of nodes that are nearby
in hop distance and paths to beacons which are expected to be far away in the network. Like
Kademlia, all nodes are given the output of a hash function as an ID, so the XOR of IDs can be
used to measure distance. Nodes attempt to find beacons that are closest to them in XOR
address space. Beacon nodes are expected to be average distance away in hop length because
node addresses are randomly generated. During beacon selection, nodes close in XOR address
space are selected as beacon candidates. Beacon candidates can accept their role or give the
path to an even closer candidate that it knows of. This process continues until no additional
beacon candidates are suggested.
Route Selection:
During route selection, the source node first attempts to route to the destination using its
routing table. Failing that, it attempts to route using the combined routing table of both itself
and the destination node. Each failure after that, the source node not-yet queries the node in
its routing table that has the smallest XOR distance to the destination. The queried node
responds with its routing table, which the source node merges with its combined routing table.
The source node can continue to query nodes until it is able to route to the destination or give
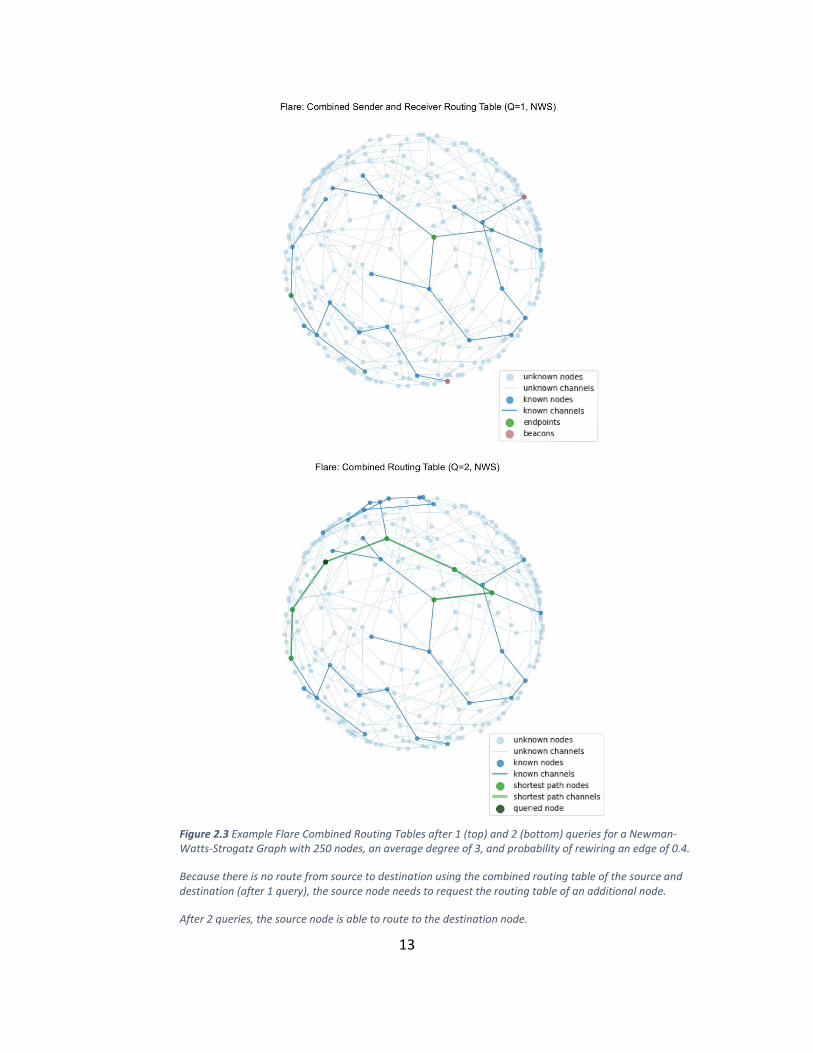
up. An example of route selection in our implementation can be seen in Figure 2.3. The
example was generated using NetworkX’s [6] implementation of the Newman-Watts-Strogatz
[7] topology with 250 nodes, average degree of 3, and edge rewiring probability of 0.4 and
visualized using Matplotlib [8].
2.6 MODELING CONSUMER BEHAVIOR
Credit card networks share important characteristics with payment channel networks that
make consumer behaviors in the former a good proxy for those in the latter. First, payment
11
channels are analogous to credit lines secured with cryptocurrency collateral. Also, it is
expected that consumers in a payment channel network should be able to quickly and cheaply
transact with any merchant within the network, similar to consumers in a credit card network.
We looked to research in analysis and simulation of credit card consumer behaviors to create
an accurate model of the spending behavior of consumers in the payment channel network.
Consumer transaction rates have been shown to follow a Poisson distribution with
heterogeneity across consumers following a Gamma distribution [9] . The endpoints of a given
synthetic transaction have been sampled by fitness proportionate selection over historical data.
Consumer selection was weighed by purchase frequency and merchant selection was weighted
by relative market-cap [10]. The relative frequency by which a given user is chosen as the
source of an arbitrary transaction was sampled with a weighted roulette search among the
purchase frequency of all consumers. Additionally, the distribution of transaction values has
been modeled both as Markov Models, which probabilistically sample from high, medium, and
low distributions, as well as normal distributions [11, 12] .
We combine different parts of the previous models along with a dataset of credit card
transactions, provided to us by a bank we partnered with, to model user behavior in our
framework. This dataset consists of six months (Dec 2016 – May 2017) of anonymized credit
card transactions from a bank with between $10 and $50 billion in assets. In our approach, we
preprocess the dataset by calculating the transaction frequency, transaction value mean, and
transaction value standard deviation for each consumer and the transaction frequency for each
vendor. Next, in the simulation setup phase, we sample a specified number of consumers and
vendors from the dataset. In our simulation, we generate synthetic transactions as follows:
1. We select the consumer and vendor similarly to [10] using a weighted roulette search
[13] weighted with the transaction frequencies.
2. We select the transaction value by sampling from a normal distribution using the
preprocessed transaction value mean and standard deviation similarly to [12].
12
2.7 RELATED WORK ON CRYPTOCURRENCY PAYMENT CHANNELS
AND EVALUATION
Our work draws on prior empirical measurement and modeling of cryptocurrency networks.
Gervais et al introduce a simulator to analyze the security and performance of different
configurations of proof of work blockchains [14]. Decker and Wattenhofer measured the
propagation delay for transactions and blocks across the bitcoin network and showed that the
arrival times resemble an exponential distribution [15]. Neudecker et al measured the latencies
in message propagation between neighbors in the Bitcoin network. Through timing analysis,
they were able to infer that the distribution of node degrees in the bitcoin network follows a
power-law [16], and they used their measurements to model the bitcoin network in their
simulations. We used their observed per node latency distribution to model network
propagation in our framework. Prihodoko et al evaluate their Flare routing algorithm using
synthetically generated small-world topologies, and we repeat their experiment in Section 4.2
to validate our framework [17]. Moreno-Sanchez et al evaluate their privacy-preserving
landmark routing algorithm using data from the Ripple network [18]. We leave the evaluation
of their routing algorithm and other privacy metrics to future work. Additional off-chain
protocols such as teechan [19] and teechain [20] utilize trusted execution environments to
increase blockchain scalability. Because these alternatives rely on the security of the TEE,
precautions against TEE failures are necessary, such as regularly backing up TEE internal state or
deploying multiple independent TEEs. Though route discovery is similar to that in the Lightning
Network, we leave evaluation of these protocols to future work.
13
Figure 2.3 Example Flare Combined Routing Tables after 1 (top) and 2 (bottom) queries for a Newman- Watts-Strogatz Graph with 250 nodes, an average degree of 3, and probability of rewiring an edge of 0.4.
Because there is no route from source to destination using the combined routing table of the source and destination (after 1 query), the source node needs to request the routing table of an additional node.
After 2 queries, the source node is able to route to the destination node.
14
CHAPTER 3: SIMULATION FRAMEWORK
3.1 MOTIVATION
In order to effectively benchmark the performance of different payment channel network
protocols, we created a simulation framework that can robustly simulate many ways that
payment channel networks could evolve. We allow the researcher running the simulation to set
the distributions of values for several parameters, which are randomly sampled in thousands of
Monte Carlo simulations. The validity of our framework is augmented by modeling spending
payment distributions on the spending behaviors of real credit card users.
3.2 MODEL NOTATION AND DEFINITION OVERVIEW
Tick: The base unit of time that is incremented each iteration of the simulation loop. In our
experiments, we define ticks to be 1 second, leading to 600 ticks in the average Bitcoin
blocktime of 10 minutes.
Network Graph: We use a graph to represent the payment channel network. Each edge in the
network corresponds to a duplex channel between two users in the payment channel network.
Channels have a capacity for each user that represents the maximum amount that the user can
send. This is initially set equal to the user’s original deposit into the channel. In our simulations,
we model payment channel network topologies using both small-world and scale-free
networks.
As payments occur, these capacities fluctuate. Potentially, payments are more likely to occur in
one direction than the other, which would result in one user possessing most of the total
capacity of the channel. When this happens, the user with depleted capacity may no longer be
able to send payments along that channel. We refer to channels where most of the capacity of
the channel is concentrated in one channel to be unbalanced. Users may attempt to rebalance
a channel to return it from an unbalanced state. In our model, this is done with on-chain
15
transactions where a user deposits funds into channels with depleted deposits using funds
withdrawn from channels with large deposits.
Payments: Users can send money to each other along a path of channels. We refer to the first
user in the path as the source and the last user as the destination. Starting from the source,
each user creates a Hash-Time-Lock Contract (HTLC) with the next user on the path. We refer to
HTLCs as locks. Each lock has a sender, receiver, value, and locktime. The value is the amount of
funds that the sender must lock-up. Locked-up currency cannot be spent until it is unlocked. In
practice, the sender has until the locktime deadline to reveal the hash pre-image that allows
the recipient to unlock the funds, otherwise the recipient may initiate a dispute to unlock the
funds. Channels may also charge a fee for allowing a payment to route through them.
In our model, users do not charge fees for participating in a payment, so all locks have value
equal to the amount the source user is attempting to send to the destination user. All users
have a time-delay associated with how long it takes them to unlock. When setting up locks, we
use a default value of 3 blocktimes (~1800 ticks) for the locktime.
User Behaviors: All users have a time-delay associated with how long it takes them to unlock
due to computation or network delays. Petty users attempt to attack the network by only
unlocking each lock right before it is about to expire.
Each user also has a spending behavior. In our model, users are divided into consumers and
merchants. All payments must start from a consumer and end at a merchant. The interior
nodes in a payment may be either consumers or merchants.
3.3 PARAMETERS, PERFORMANCE METRICS, AND VALIDATION
Parameters
• Number of nodes: n. We define the number of nodes in our simulation to be n. We vary
n in our simulations between 1,000 and 2,000 nodes.
16
• Transaction Rate: m. We define the number of payments to attempt per tick in our
framework to be m. We vary m in our simulations between 1-20 transactions per tick.
• Protocol: e.g. Lightning Network or Sprites
• Routing Algorithm: e.g. Flare or Ideal Shortest-Path
• Network Topology: e.g. small-world or scale-free
• Petty %: Proportion of nodes attacking the network by waiting until the last possible
moment before completing their transaction.
• Scenario: The set of inputs used to define a simulation. Scenarios can be simulated many
times, and only the random inputs (i.e. network topology and spending behaviors) are
varied across runs.
Performance Metrics
We measure the performance of the payment channel network protocol with the following
metrics:
1. Payment Success Count: The absolute number of successful payments, and the
proportion of attempted payments that are successfully cleared.
2. Payment Success Volume: The absolute sum of successful payment volume, and the
proportion of attempted payment volume that is successfully cleared.
3. Payment Path Length: The number of channels involved in a payment.
4. Payment Duration: The number of ticks until a payment clears.
5. Collateral Cost: The time value of money necessitates that when determining the cost
associated with holding money, we take into account both the value and the duration.
We define the collateral cost to be the amount of locked up currency multiplied by the
number of ticks until it is unlocked.
We consider (5) to be the overall target metric, since it directly relates to efficiency. Our
simulation methodology is useful because it answers which payment channel network protocols
are most efficient.
17
Validation
We run the simulation with each set of parameters to make observations about the model,
which lead to falsifiable predictions about the real world. We vary each parameter
independently of the others to determine how sensitive the model is to starting conditions. We
have higher confidence in the accuracy of predictions that are robust to variations in parameter
estimates. In order to cross-validate our Flare implementation, we replicated the simulation
performed in the original Flare proposal (see section 4.2).
We vary the chosen parameters to answer our research questions regarding the performance
and resilience of different payment network protocols and routing algorithms. We assess the
expected performance by varying each of our parameters and recording each of the
performance metrics. We assess the resiliency to attack by varying the proportion of nodes that
are attacking the network.
We expect that as the network becomes more stressed:
1. Payment success count and volume ratios will decrease
2. Payment path lengths, durations, and collateral cost will increase.
We compare recorded performance metrics across protocols and routing algorithms in our
model to make comparisons of the expected performance in the real world. We use the degree
that the performance metrics are affected with increasing proportion of adversary nodes to
make comparisons of the expected resiliency in the real world.
18
3.4 CONTROL FLOW
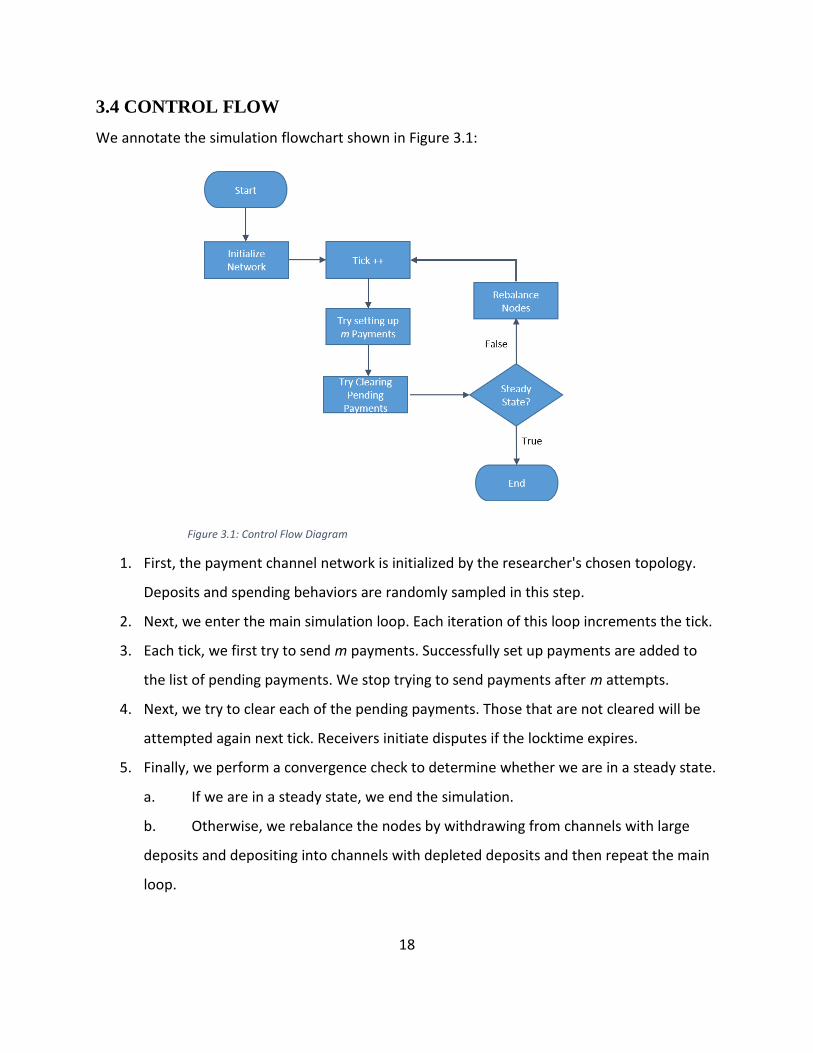
We annotate the simulation flowchart shown in Figure 3.1:
1. First, the payment channel network is initialized by the researcher's chosen topology.
Deposits and spending behaviors are randomly sampled in this step.
2. Next, we enter the main simulation loop. Each iteration of this loop increments the tick.
3. Each tick, we first try to send m payments. Successfully set up payments are added to
the list of pending payments. We stop trying to send payments after m attempts.
4. Next, we try to clear each of the pending payments. Those that are not cleared will be
attempted again next tick. Receivers initiate disputes if the locktime expires.
5. Finally, we perform a convergence check to determine whether we are in a steady state.
a. If we are in a steady state, we end the simulation.
b. Otherwise, we rebalance the nodes by withdrawing from channels with large
deposits and depositing into channels with depleted deposits and then repeat the main
loop.
Figure 3.1: Control Flow Diagram
19
3.5 SCALE PARAMETERS
These parameters describe the size of the simulation. Included among these parameters are n,
the number of nodes, and m, the number of payments to attempt per tick.
3.6 TOPOLOGY PARAMETERS
The payment channel network is modeled as a graph where each node represents a participant
and each edge represents a payment channel between them. The network topology could
substantially influence the protocol’s performance, so it is crucial to consider the variety of
possible topologies.
The two types of topologies we considered in our simulations are scale-free and small-world
network topologies because they each describe different aspects of various man-made and
natural networks. In scale-free networks, nodes preferentially attach to higher degree nodes
leading to few high degree hubs and little clustering. Examples of scale-free networks include
the Internet and research collaborations [21]. Small-world networks describe networks with
high clustering, short average path lengths, and few hubs. Examples of small-world networks
include neural networks and power grids [22].
We chose the Barabási–Albert (BA) [23] model to represent scale-free topologies and the
Watts-Strogatz (WS) [24] model to represent small-world networks. Scale-free networks have
been used in simulation models for timing analysis of the Bitcoin network [16]. The WS network
has been used to model the Lightning Network for evaluation of the Flare routing algorithm
[17]. We used the NetworkX [6] implementations of both of these topologies.
20
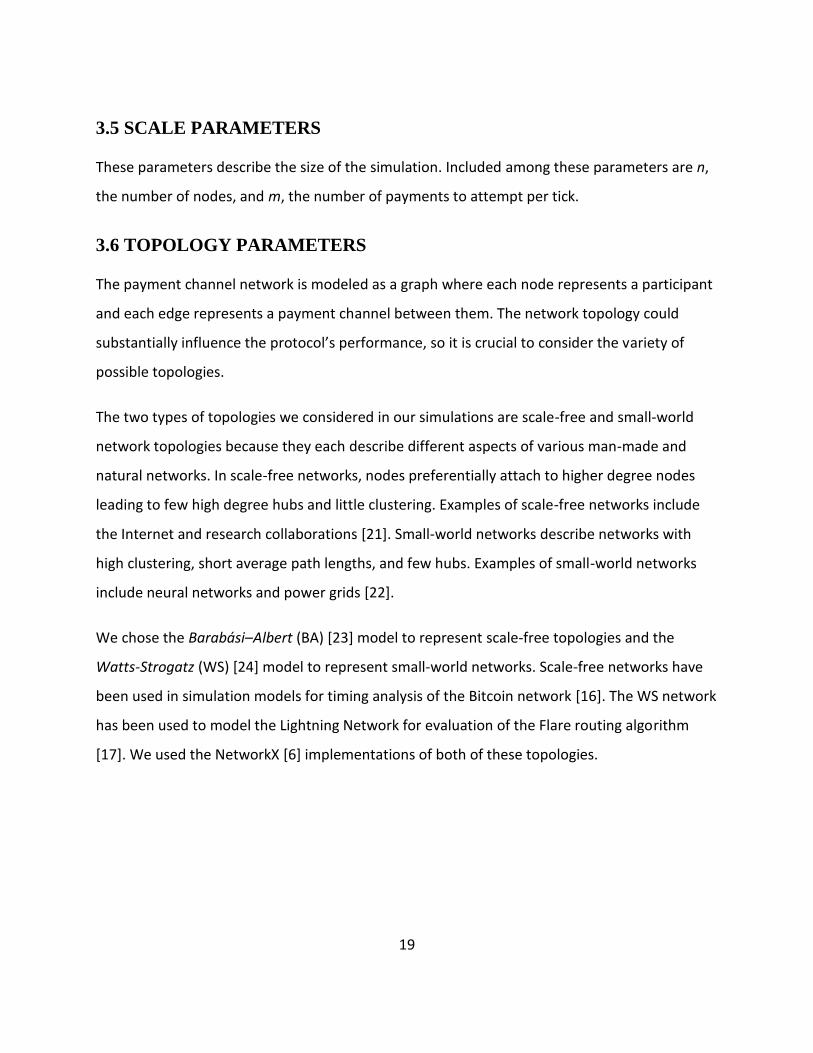
Examples of the chosen topologies can be seen in Figure 3.2. Because variation in any topology
may more accurately model expected real-world behavior, we randomly generate a different
variation of the chosen network topology for each simulation.
3.7 PAYMENT GENERATION
The payment policy configures the distribution of the source, destination, and value for each
payment. Like the type of topology chosen, the configuration of the parameters in the payment
policy can significantly affect a protocol’s efficiency, and there is uncertainty in how they would
be distributed in a realized payment channel network. Novel to our design is the use of
transactional data from credit card users to more precisely model the spending behaviors of
different nodes in the payment channel network.
Figure 3.2: Barabási–Albert (left) and Watts-Strogatz (right) topologies with 100 nodes. Node sizes are scaled by 10 times node degree. Both topologies are generated using NetworkX and visualized using Matplotlib. The Barabási–Albert graph shows significant scale-free behavior and has several hubs with high degree. The Watts-Strogatz Graph exhibits high clustering and little variance in node degrees.
21
Synthetic Payments from Credit Card Data
Dataset: We partnered with a bank who provided us with an anonymized dataset of credit card
transactions. The dataset consists of six months of anonymized credit card transactions from a
bank between $10 and $50 billion in assets. Each transaction consists of a transaction time,
anonymized accountholder ID, transaction value, and recipient. The dataset contains more than
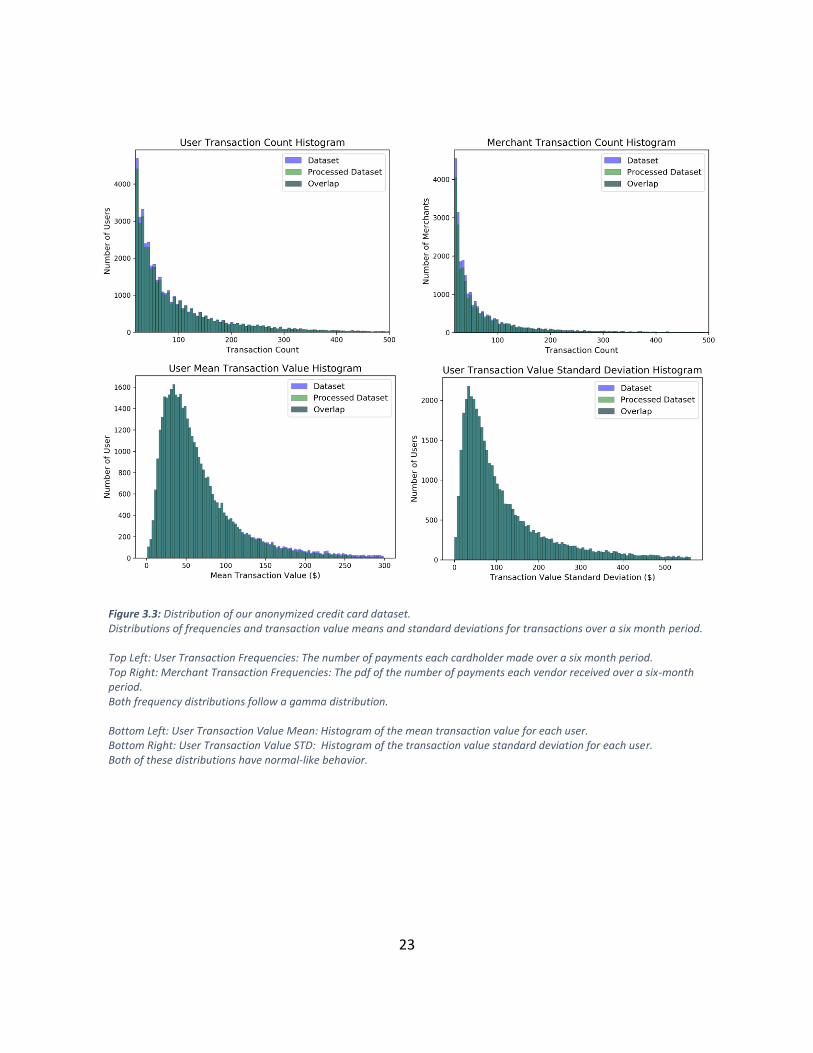
four million transactions made by over 50,000 unique cardholders. Histograms of transaction
frequencies, transaction value means, and transaction value standard deviations are shown in
Figure 3.3.
Synthetic Data:
Nodes are chosen to be either consumers or merchants during topology creation. All payments
must originate at a consumer and terminate at a merchant. Consumer spending behaviors are
generated from sampled credit card consumers’ transaction frequencies and values. We use
cardholder transaction frequencies and values to model the transaction source and value, and
we use vendor transaction frequencies to model the destination.
This consumer-merchant model leads to the formation of sources and sinks in our network. If
consumers are not given a positive cash flow, their balances would eventually deplete, which
would result in the lack of an ability to make any more payments. If merchants are not given a
negative cash flow, their balances would continuously increase, which would result in the
artificial formation of high capacity hubs. We evaluated several approaches to mitigate these
issues including introducing expense flows (firm expenses) out of merchants and income flows
(salary) into consumers. In order to avoid overcomplicating our model, we enforce a net
conservation of currency among all nodes by artificially refunding the transaction amount to
the source node from the destination node upon payment completion. This resembles a model
where each node’s salary matches its expenses. Because salaries are paid in piecemeal instead
of a fixed frequency lump sum, our model does not exhibit potential patterns such as weekly
fluctuations associated with pay periods.
22
Consumer Selection: The consumers are chosen uniformly at random among all of the
consumers in the dataset. The transaction value mean, transaction value standard deviation,
and transaction frequency are calculated for each consumer.
Merchant Selection: The merchants are chosen uniformly at random among all of the
merchants in the dataset. The transaction frequency is calculated for each merchant.
Source: The source is selected among the consumers by a fitness proportionate selection [13]
weighted with the consumer’s transaction frequency.
Destination: The destination is selected among the merchants by a fitness proportionate
selection [13] weighted with the merchant’s transaction frequency.
Value: The payment value is determined by a sample of the normal distribution with mean and
standard deviation equal to the source’s transaction value mean and standard deviation.
3.8 ROUTING POLICY
Nodes can be configured to use arbitrary routing policies when attempting to find a viable path
for a payment. Route selection in payment channel networks has the additional complication of
dynamic channel statuses and capacities. Viable paths require that each channel is open and
has available capacity.
We provide two types of routing algorithms to use within a simulation. Broadly, they can be
classified as centralized and distributed routing algorithms. Within centralized routing
algorithms, each node has full knowledge of the network topology. Within distributed routing
algorithms, each node only knows of a small part of the topology and may need to query other
nodes to complete route selection. We tested the two following routing algorithms in our
simulations:
23
Figure 3.3: Distribution of our anonymized credit card dataset. Distributions of frequencies and transaction value means and standard deviations for transactions over a six month period. Top Left: User Transaction Frequencies: The number of payments each cardholder made over a six month period. Top Right: Merchant Transaction Frequencies: The pdf of the number of payments each vendor received over a six-month period. Both frequency distributions follow a gamma distribution. Bottom Left: User Transaction Value Mean: Histogram of the mean transaction value for each user. Bottom Right: User Transaction Value STD: Histogram of the transaction value standard deviation for each user. Both of these distributions have normal-like behavior.

24
Centralized Routing Algorithm: Ideal Shortest Path (I-SP)
In the Ideal Shortest Path (I-SP), the source node knows the capacity of every open channel in
the payment channel network. Using this information, the node always selects the globally
optimal shortest path a route using bi-directional Dijkstra’s algorithm [25].
Distributed Routing Algorithm: Flare
We implement the decentralized Flare routing algorithm [17] in the following way:
Parameterization:
1. Neighborhood Radius: When using scale-free networks, we set the radius to be equal to 2
(each node maintains the state of the all nodes reachable in <= 2 channels). In the small-
world model, we adjust the radius to 3 to compensate for the longer path lengths.
2. Number of Beacons: The authors of Flare determined 6 to be an acceptable number of
beacons for a 2000 node Watts-Strogatz topology, so we vary this parameter to be either 6
or 10. This allows us to evaluate any additional performance and resiliency improvements
that result from a larger than necessary number of beacons.
3. Number of Nodes to Query: During route selection, we allow nodes to query up to 10 nodes
for their routing tables before giving up.
Beacon Discovery: Nodes are selected in random order to perform beacon selection during the
simulation setup. Selection of k beacons for arbitrary node u, is performed as follows:
1. Node u initializes a list of unprocessed beacon candidates to be equal to the k nodes
nearest in XOR distance from its neighborhood.
2. While unprocessed beacon candidates remain:
3. Remove the unprocessed beacon candidate nearest in XOR distance and
send it a beacon request.
4. (The beacon candidate will return an acknowledgement and optionally up to
k paths to other nodes from its routing table that are closer in XOR distance.)
25
5. Add any additional nodes to the beacon candidate list.
6. If the number of unprocessed beacon candidates > k:
7. Prune the unprocessed beacon candidates to contain the k
candidates with the longest path lengths.
8. Select the k nearest nodes in XOR distance among all candidates to be beacons; add
the discovered paths to each selected beacon to u’s routing table.
Route Selection: Flare normally performs k-shortest paths using the combined routing tables of
the source, destination, and any queried nodes. Flare uses k-shortest-paths to compensate for
the dynamic nature of payment channel networks; channels may not have enough capacity by
the time route selection is made. Upon each failure, the source queries an additional node for
its routing table, which is then used to reattempt route selection.
We approximate this behavior by performing a single shortest path over only the channels
known to have enough capacity to field the payment. Upon failing 10 times (and querying 10
additional nodes’ routing tables), we return no path. Generally, payments may have to route
along longer paths or fail as channels close and capacity diminishes. Therefore, we expect that
our Flare approximation will exhibit signs of stress in the network by more frequently returning
longer path lengths or failing to return a path at all.
3.9 SETUP LOCKS
Once a payment is generated, the source attempts to find a valid route of channels and nodes
to the destination; if no route can be found with available capacity, the payment fails.
Otherwise, we model a transaction created on the payment channel network with a series of
locks between the source and the destination. In practice, both parties in a payment channel
use public key cryptography to sign messages to each other containing the locktime and value.
In the event of a dispute, the parties publish these signed messages on the blockchain. In our
model, we generate a lock with value equal to the payment value for each channel on the path
26
from source to destination. For each hop on this path of channels, this amount is removed from
the sender’s balance and will be credited to the recipient once the sender unlocks the payment
or the receiver initiates a dispute.
Lightning Network Lock Setup
The Lightning Network utilizes a relative time-lock between successive hops in a payment. We
model this by assigning a base locktime to the first lock in a payment. Successive locks have
their locktime incremented by one base locktime.
Sprites Network Lock Setup
Sprites utilizes a constant time-lock for all hops in a payment. We model this in Sprites by
setting the locktime for each lock equal to the base locktime.
3.10 PAYMENT RESOLUTION
All nodes are given a propagation delay time during the simulation initialization. This delay time
represents the delay for a node to complete its hop due to computation and network latency.
We approximate the observed distributions found in [16] by assigning a 100 ms delay to 92.5%
of the nodes, a 1 second delay to 4.9% of the nodes, and a 10 second delay to 2.6% of the
nodes.
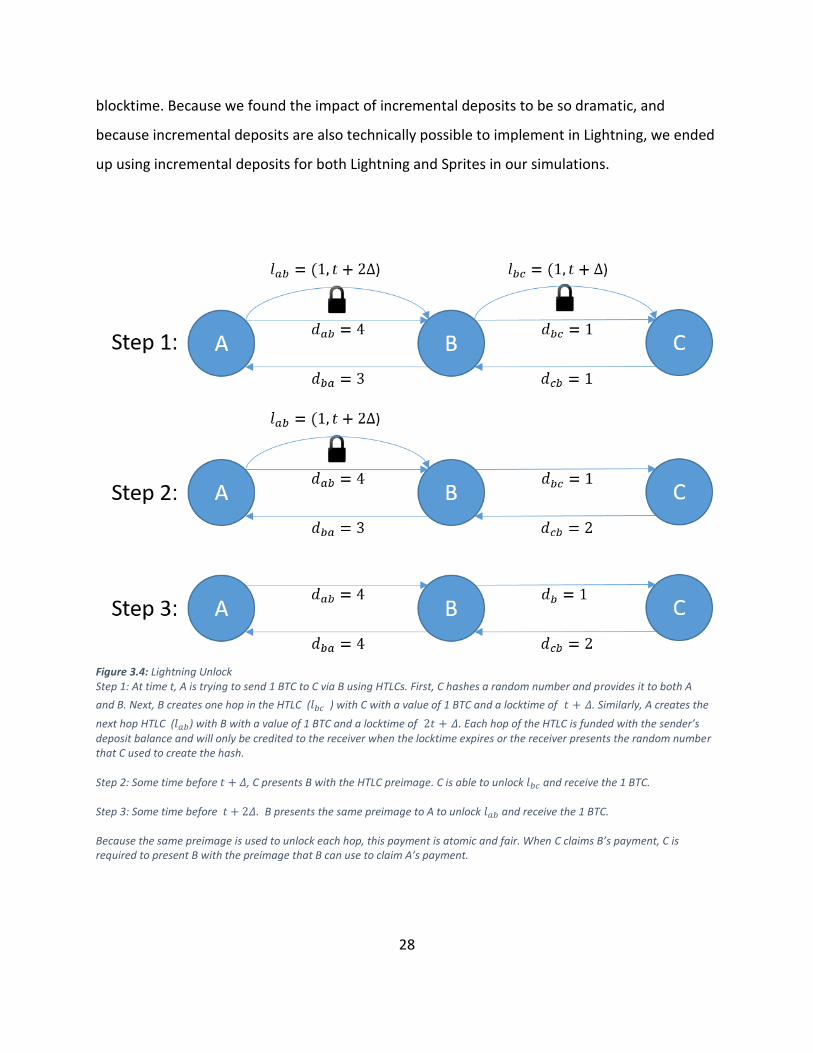
Each tick, we check which pending payments have cleared. When trying to clear a payment, we
iterate through the locks from destination to source. In the normal case, the sender unlocks the
hop when the time since the previous unlock exceeds the sender’s delay time. If we succeed in
unlocking the hop, we attempt to unlock the successive hops until we either clear the payment
or we fail to unlock a hop. Each hop that is unlocked remains unlocked, and the recipient on
that hop receives their money. An example of the successful resolution of a payment in
Lightning is shown in Figure 3.4.
27
In our simulated attack, there is a fraction of “petty” nodes who are attempting to attack the
network by waiting until the last moment to unlock their payments. By doing this, petty nodes
are able to keep all the funds in all successive locks of the payment locked up until they finally
clear their hop. In our model, a petty sender will wait until the locktime is about to expire
before unlocking the payment.
If the locktime for a hop is less than or equal to the current tick, the recipient may initiate a
dispute to claim their money. We model disputes by finishing the payment and closing the
involved channel. In the actual network, disputes close the channel and require an on-chain
transaction to settle all pending payments routing through that channel. We model this in our
network by closing the channel and finishing all of the pending payments. When a channel
closed, it is as if it is removed from the network; no new payments can route over it until it is
reopened. We reopen channels after one blocktime (600 ticks).
3.11 ON-CHAIN REBALANCE POLICY
The proportion of nodes that will attempt to rebalance their payment channels is configured in
the on-chain rebalance policy. Each tick, this proportion of nodes is uniformly sampled from the
entire node population. The node decides to continue rebalancing only if at least one of the
channels is less than the mean payment value for the current simulation’s payment
distribution.
A rebalancing node will determine a fair share channel balance equal to the mean value of the
channel deposits. The node then withdraws from all the channels above the fair share and
deposits into all the channels below the fair share to ensure that all of the channels are equally
balanced.
We originally modeled additional deposits in Lightning by naively closing and reopening the
channel with the new deposit value after one blocktime. In Sprites, incremental deposits are
possible without closing the channel, which we modeled by keeping the original deposit
immediately available and adding the incremental deposit value to the channel after one
28
blocktime. Because we found the impact of incremental deposits to be so dramatic, and
because incremental deposits are also technically possible to implement in Lightning, we ended
up using incremental deposits for both Lightning and Sprites in our simulations.
Figure 3.4: Lightning Unlock Step 1: At time t, A is trying to send 1 BTC to C via B using HTLCs. First, C hashes a random number and provides it to both A
and B. Next, B creates one hop in the HTLC (𝑙𝑏𝑐 ) with C with a value of 1 BTC and a locktime of 𝑡 + 𝛥. Similarly, A creates the
next hop HTLC (𝑙𝑎𝑏) with B with a value of 1 BTC and a locktime of 2𝑡 + 𝛥. Each hop of the HTLC is funded with the sender’s deposit balance and will only be credited to the receiver when the locktime expires or the receiver presents the random number that C used to create the hash. Step 2: Some time before 𝑡 + 𝛥, C presents B with the HTLC preimage. C is able to unlock 𝑙𝑏𝑐 and receive the 1 BTC. Step 3: Some time before 𝑡 + 2𝛥. B presents the same preimage to A to unlock 𝑙𝑎𝑏 and receive the 1 BTC. Because the same preimage is used to unlock each hop, this payment is atomic and fair. When C claims B’s payment, C is required to present B with the preimage that B can use to claim A’s payment.
29
3.12 ASSESSING BASELINE RELIABLE TRANSACTION RATE
We divided our simulations into two sections: baseline evaluation and scenario
experimentation. In the baseline evaluation phase, we are interested in determining the
baseline performance of a payment channel network given a set of inputs, such as network size,
topology, spending behavior, etc. Because we are interested in how many payments can be
reliably processed by the payment channel network, we do not merely choose an arbitrary
number of payments to attempt for each instantiation of parameters. Instead, we define a
reliable network to be one where at least 98% of the payments attempted are successful. We
chose 98% because it requires nearly all of the payments to successfully complete; the resulting
successful payments still closely resemble the distribution of the attempted payments, and the
network is being adequately stressed.
We cannot naively assume the reliable payment rate threshold for a network if we only
evaluate the network under a single arbitrary payment rate. Trivially, if the network is able to
successfully support m transactions per tick with 100% success rate, there is no easy way of
knowing how many more transactions it could support before it achieves only a 98% success
rate. We attempt to determine the reliable payment rate for a network by using the secant
method [26] to iteratively improve an initial guess.
Our benchmarking process works as follows: For each parameter, a distribution of possible
values is defined. Some parameters are sampled from random distributions including the
network topology generated and the node spending behaviors. As an example, consider the
scenario of benchmarking a small-world network where payments are all microtransactions (<
$20) and the nodes use the Flare routing algorithm. Our scenario would consist of the following
parameters:
1. Number of nodes = 1000
2. Network topology = Watts-Strogatz
30
3. Spending Behavior = Microtransactions
4. Routing = Flare
5. Protocol = Lightning
At the beginning of the benchmarking process, the network topology and spending behaviors
are randomly generated. They are held constant until the reliable payment rate is determined
for this configuration of parameters. We continue varying the payment rate and repeating the
simulation until the resulting success rate is within 0.2% of 98%. This benchmarking process is
then repeated with 30 different randomly generated configurations of the given scenario to
determine the spread of possible outputs.
After benchmarking a scenario, we assess resilience to failures and malicious actors in the
evaluation phase. In our experiments, we model an attack on the payment channel network by
attempting to send the previously determined reliable rate of payments while modifying the
percent of nodes that are petty. We use the above performance metrics to analyze the effects
of such an attack on a payment channel network that is operating at full capacity.
31
CHAPTER 4: RESULTS
4.1 INTRODUCTION
In order to answer our research questions, we performed thousands of Monte Carlo
simulations of our framework’s Lightning and Sprites models. Within our simulations, we varied
the type of network topology, network size, routing algorithm, payment rate, and payment
distribution. First, we cross-validate our Flare implementation by replicating the simulation
performed in the original Flare proposal. Next, we give an overview of the effect of the various
parameters on the throughput of the Lightning Network. Then, we present results of a
simulated potential attack on both protocols in which “petty” nodes attempt to freeze liquidity
on the network.
4.2 FLARE IMPLEMENTATION CROSS-VALIDATION
The Flare authors evaluated their algorithm in [17] with simulations containing 2,000 and
100,000 nodes. In their simulations, they use the Watts-Strogatz topology with an average
degree of 4 and edge rewiring probability of 0.03. They parameterize their algorithm with a
neighborhood radius of 2 and a route selection query limit of 10. They vary the number of
beacons between 0 and 12.
Their simulation proceeds follows:
1. Initialize payment channel network topology.
2. Perform beacon selection for all nodes in random order.
3. Choose 10 nodes randomly. For each selected node attempt to route to all other
nodes.
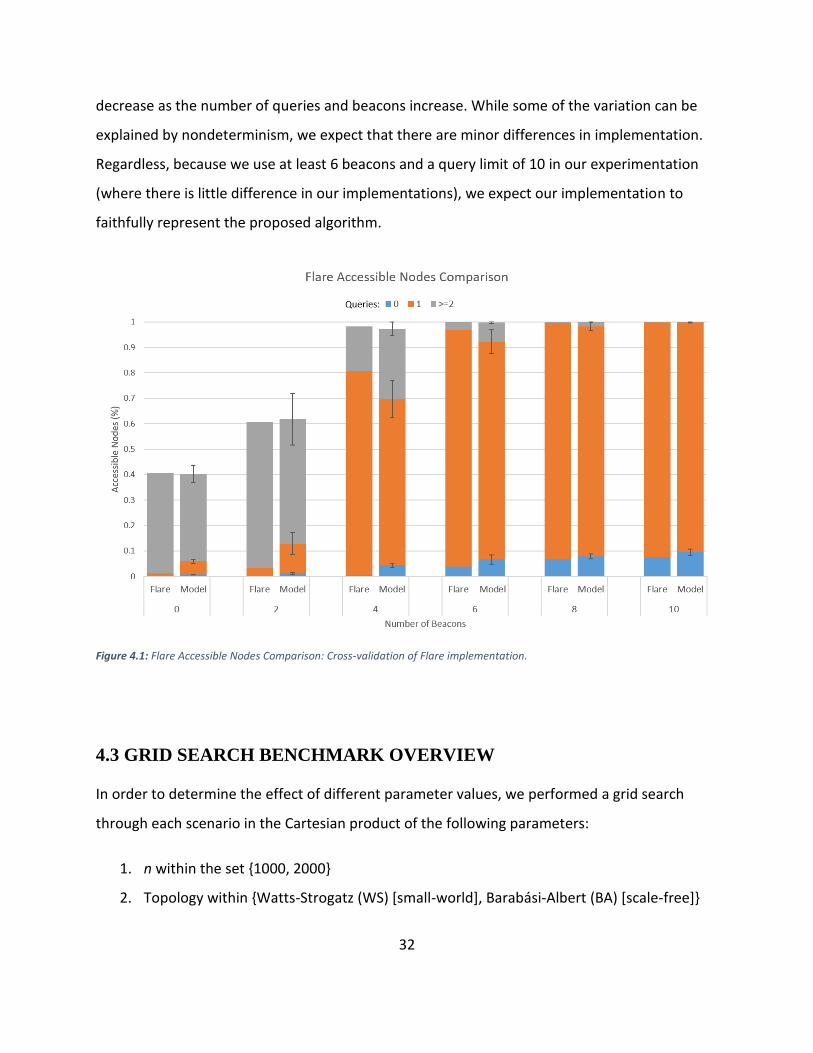
We repeated their simulation 30 times using our implementation of their algorithm.
Comparisons of our results for accessible nodes are shown in Figure 4.1. Our results also
feature error bars that are equal to 2 standard deviations both above and below the mean
value. Though there are some differences in our results, we notice that the differences
32
decrease as the number of queries and beacons increase. While some of the variation can be
explained by nondeterminism, we expect that there are minor differences in implementation.
Regardless, because we use at least 6 beacons and a query limit of 10 in our experimentation
(where there is little difference in our implementations), we expect our implementation to
faithfully represent the proposed algorithm.
4.3 GRID SEARCH BENCHMARK OVERVIEW
In order to determine the effect of different parameter values, we performed a grid search
through each scenario in the Cartesian product of the following parameters:
1. n within the set {1000, 2000}
2. Topology within {Watts-Strogatz (WS) [small-world], Barabási-Albert (BA) [scale-free]}
Figure 4.1: Flare Accessible Nodes Comparison: Cross-validation of Flare implementation.
33
3. Payment sizes within {micropayments (< $20), mid-size payments (< $100)}
4. Routing algorithms within {Ideal Shortest Path (I-SP), Flare: 6 Beacons (F6), Flare: 10
Beacons (F10)}
• In our implementation of Flare, we set the neighborhood radius equal to 2 and
the number of queries to attempt equal to 10. We parameterize the number of
beacons within {6,10}.
5. Rebalancing behaviors within {None, On-chain, On-chain with incremental deposit}
During these simulations, we defined ticks to be one second and the locktime to be 1800 ticks
(30 minutes / 3 blocktimes). Our benchmarks assessed the reliable payment rate (where 98%
+/- (0.2%) of attempted payments succeed) for each scenario. All simulations were run on an
Ubuntu VM with 15 VCPUs and 60GB of RAM running on a hypervisor with an Intel(R) Xeon(R)
CPU E5-2670 and 64 GB of RAM. Because there is negligible variation in the outputs of Lightning
and Sprites when there are few failures and no malicious parties, we performed each of these
benchmarks using only the Lightning Network protocol.
4.4 VARYING REBALANCING BEHAVIOR
First, we evaluated the effect of incremental deposits when using on-chain transactions to
rebalance channels (as described in section 3.11).
We used the Cartesian product of the following parameters:
1. n = {2000}
2. Routing algorithm within {I-SP, F10-10)}
3. Topology = {NWS, BA}
4. Payment Distribution = Microtransactions
5. Rebalancing = {on-chain with incremental deposits, on-chain without incremental
deposits}
34
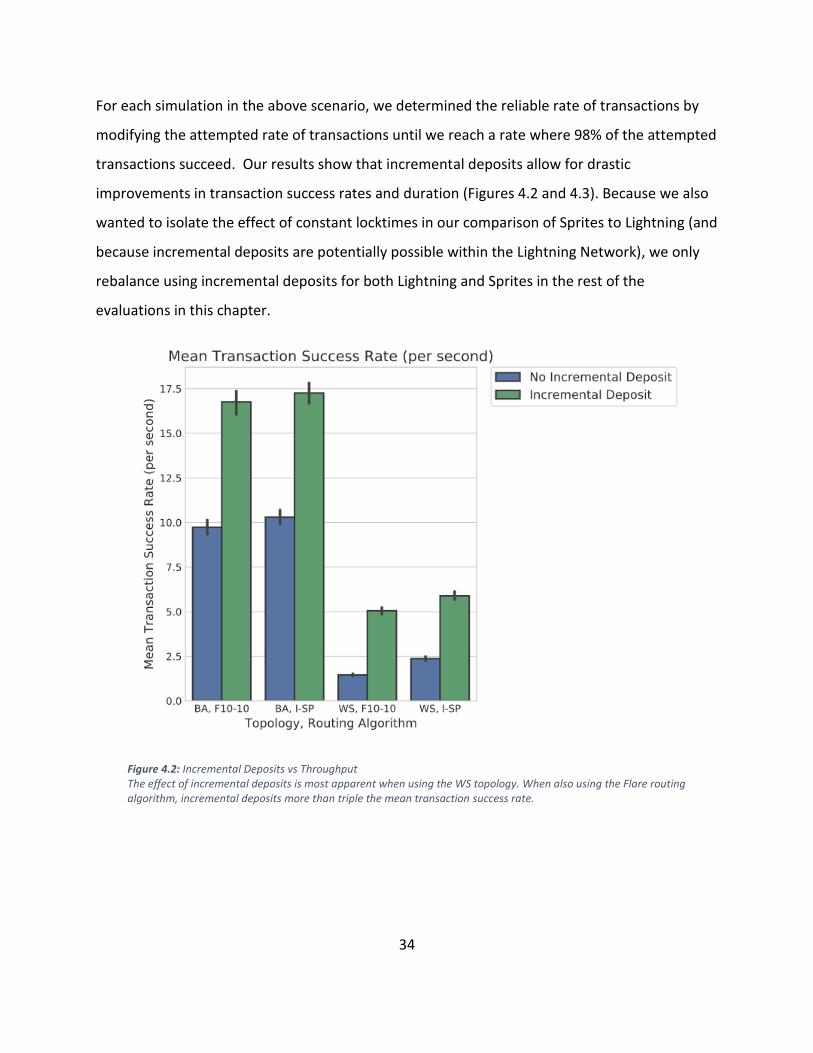
For each simulation in the above scenario, we determined the reliable rate of transactions by
modifying the attempted rate of transactions until we reach a rate where 98% of the attempted
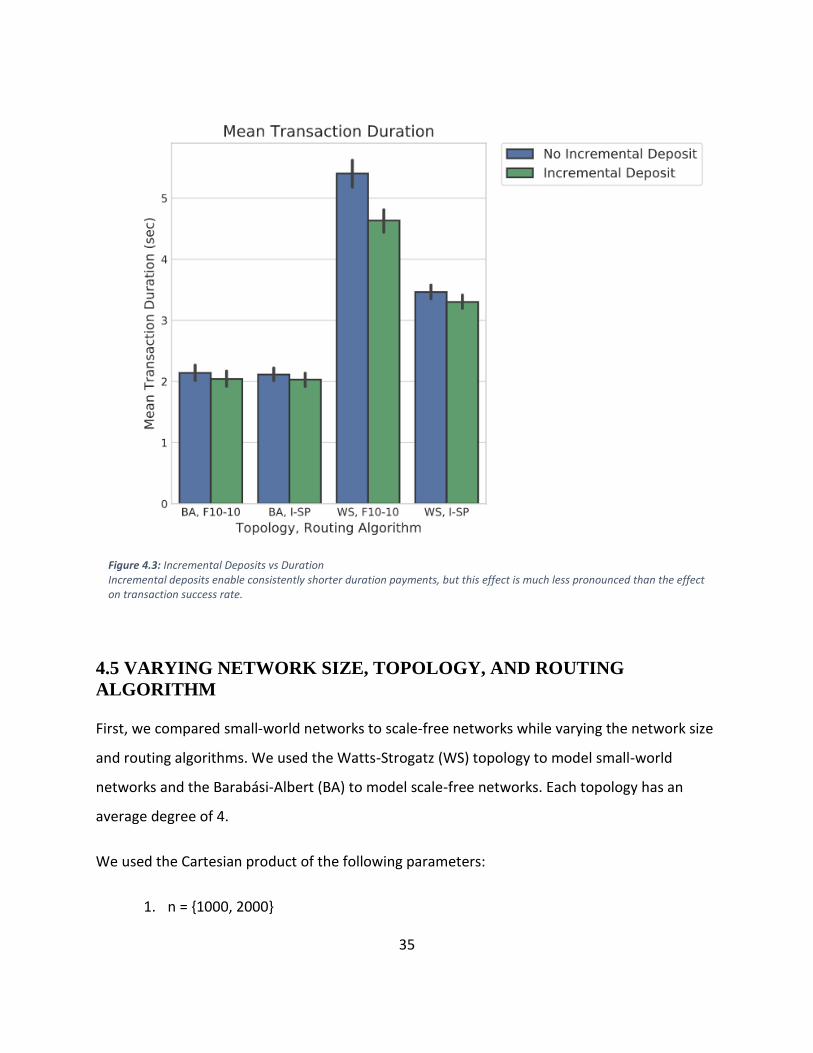
transactions succeed. Our results show that incremental deposits allow for drastic
improvements in transaction success rates and duration (Figures 4.2 and 4.3). Because we also
wanted to isolate the effect of constant locktimes in our comparison of Sprites to Lightning (and
because incremental deposits are potentially possible within the Lightning Network), we only
rebalance using incremental deposits for both Lightning and Sprites in the rest of the
evaluations in this chapter.
Figure 4.2: Incremental Deposits vs Throughput The effect of incremental deposits is most apparent when using the WS topology. When also using the Flare routing algorithm, incremental deposits more than triple the mean transaction success rate.
35
4.5 VARYING NETWORK SIZE, TOPOLOGY, AND ROUTING
ALGORITHM
First, we compared small-world networks to scale-free networks while varying the network size
and routing algorithms. We used the Watts-Strogatz (WS) topology to model small-world
networks and the Barabási-Albert (BA) to model scale-free networks. Each topology has an
average degree of 4.
We used the Cartesian product of the following parameters:
1. n = {1000, 2000}
Figure 4.3: Incremental Deposits vs Duration Incremental deposits enable consistently shorter duration payments, but this effect is much less pronounced than the effect on transaction success rate.
36
2. Routing algorithm within { I-SP, F10-6, F10-10)}
3. Topology = {NWS, BA}
4. Payment Distribution = Microtransactions
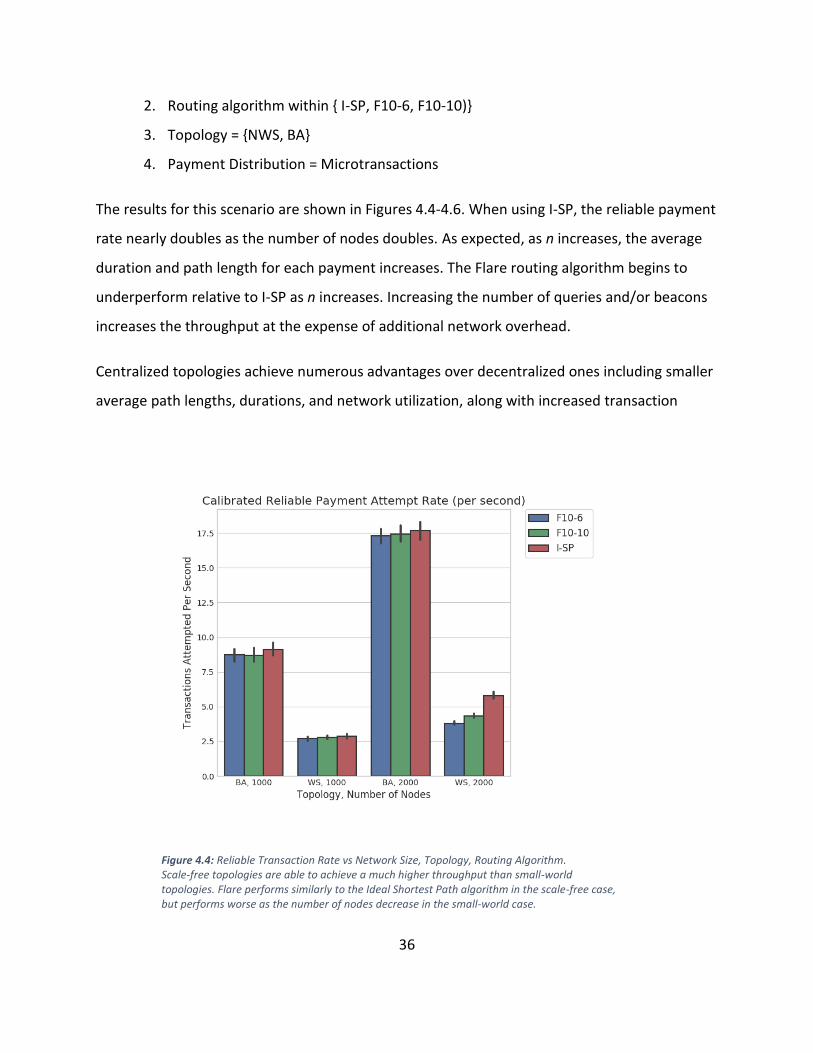
The results for this scenario are shown in Figures 4.4-4.6. When using I-SP, the reliable payment
rate nearly doubles as the number of nodes doubles. As expected, as n increases, the average
duration and path length for each payment increases. The Flare routing algorithm begins to
underperform relative to I-SP as n increases. Increasing the number of queries and/or beacons
increases the throughput at the expense of additional network overhead.
Centralized topologies achieve numerous advantages over decentralized ones including smaller
average path lengths, durations, and network utilization, along with increased transaction
Figure 4.4: Reliable Transaction Rate vs Network Size, Topology, Routing Algorithm. Scale-free topologies are able to achieve a much higher throughput than small-world topologies. Flare performs similarly to the Ideal Shortest Path algorithm in the scale-free case, but performs worse as the number of nodes decrease in the small-world case.
37
success ratio. We also see that these dramatically increase when using a decentralized routing
algorithm.
4.6 VARYING SPENDING BEHAVIORS
Next, we explored how payment channel networks would respond to payments larger than
$20. We compared two different payment distributions: one where the frequencies and
amounts are sampled from credit card transactions < $20 (micro) and from credit card
transactions < $100 (midsize). When using the larger payments, we scaled all initial deposits by
the same factor that the mean transaction value increases.
We used the Cartesian product of the following parameters:
1. n = 2000
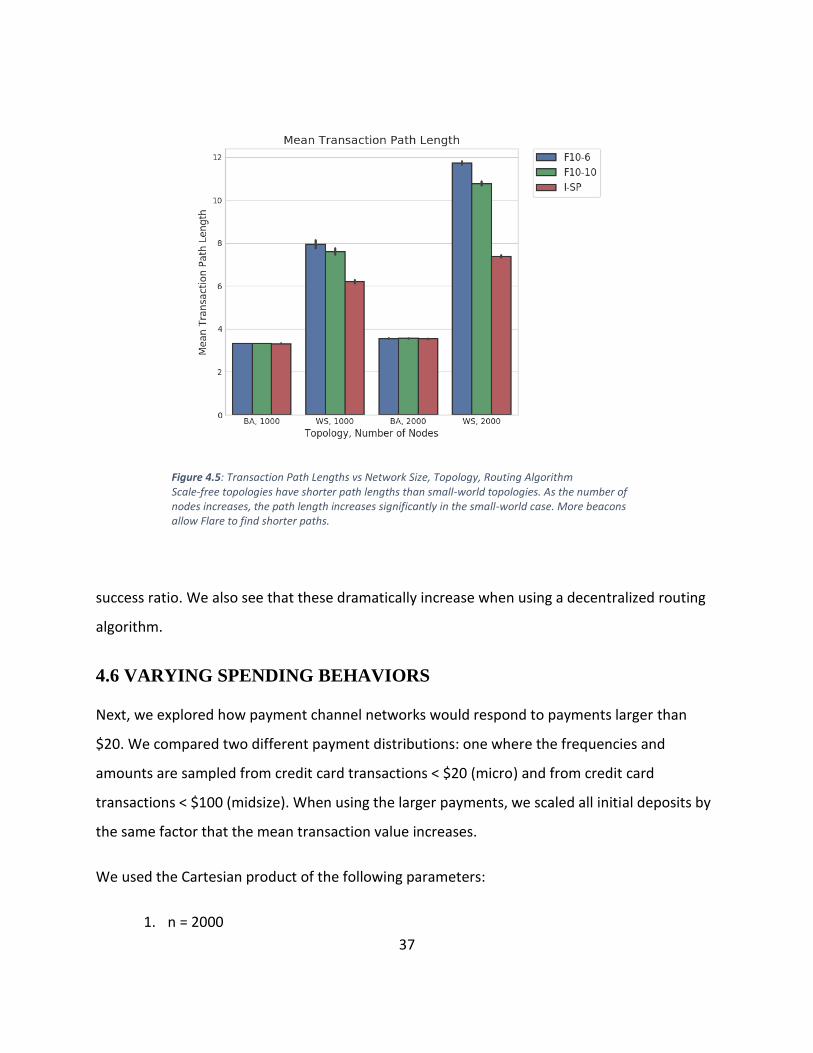
Figure 4.5: Transaction Path Lengths vs Network Size, Topology, Routing Algorithm Scale-free topologies have shorter path lengths than small-world topologies. As the number of nodes increases, the path length increases significantly in the small-world case. More beacons allow Flare to find shorter paths.
38
2. Routing Algorithm within {I-SP, F10-6}.
3. Topology = {WS, BA}
4. Payment Distribution in {micro, midsize}
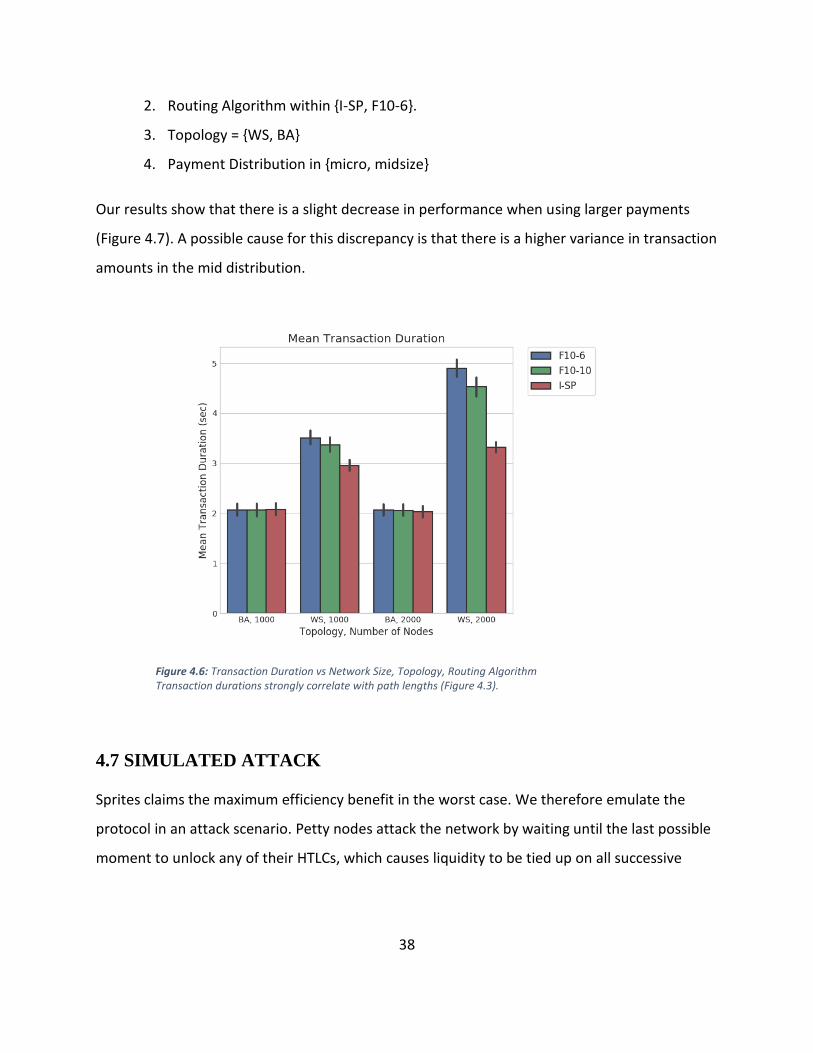
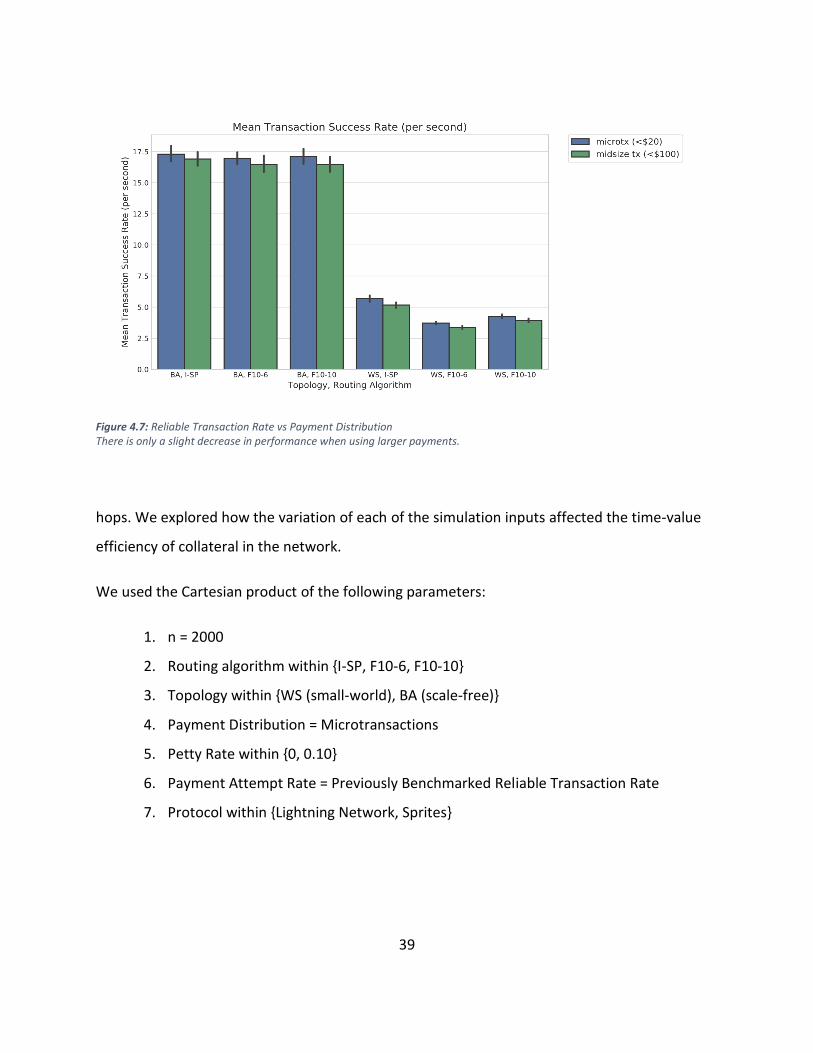
Our results show that there is a slight decrease in performance when using larger payments
(Figure 4.7). A possible cause for this discrepancy is that there is a higher variance in transaction
amounts in the mid distribution.
4.7 SIMULATED ATTACK
Sprites claims the maximum efficiency benefit in the worst case. We therefore emulate the
protocol in an attack scenario. Petty nodes attack the network by waiting until the last possible
moment to unlock any of their HTLCs, which causes liquidity to be tied up on all successive
Figure 4.6: Transaction Duration vs Network Size, Topology, Routing Algorithm Transaction durations strongly correlate with path lengths (Figure 4.3).
39
hops. We explored how the variation of each of the simulation inputs affected the time-value
efficiency of collateral in the network.
We used the Cartesian product of the following parameters:
1. n = 2000
2. Routing algorithm within {I-SP, F10-6, F10-10}
3. Topology within {WS (small-world), BA (scale-free)}
4. Payment Distribution = Microtransactions
5. Petty Rate within {0, 0.10}
6. Payment Attempt Rate = Previously Benchmarked Reliable Transaction Rate
7. Protocol within {Lightning Network, Sprites}
Figure 4.7: Reliable Transaction Rate vs Payment Distribution There is only a slight decrease in performance when using larger payments.
40
Observed Trends
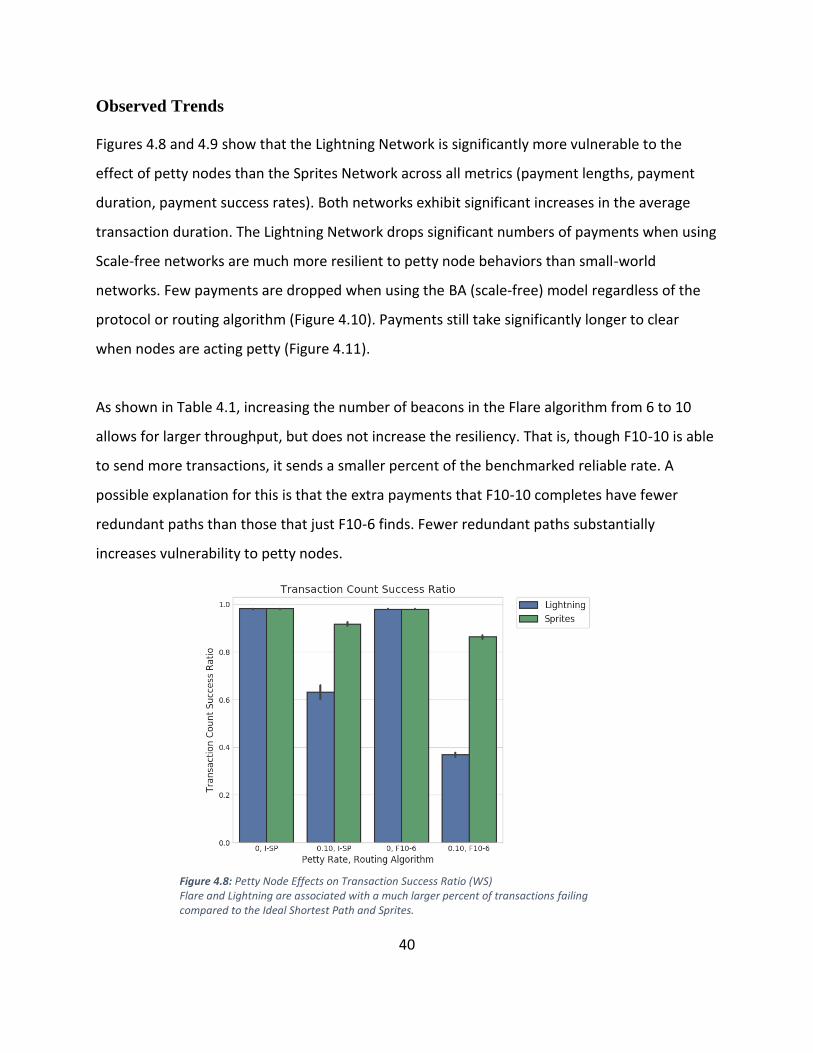
Figures 4.8 and 4.9 show that the Lightning Network is significantly more vulnerable to the
effect of petty nodes than the Sprites Network across all metrics (payment lengths, payment
duration, payment success rates). Both networks exhibit significant increases in the average
transaction duration. The Lightning Network drops significant numbers of payments when using
Scale-free networks are much more resilient to petty node behaviors than small-world
networks. Few payments are dropped when using the BA (scale-free) model regardless of the
protocol or routing algorithm (Figure 4.10). Payments still take significantly longer to clear
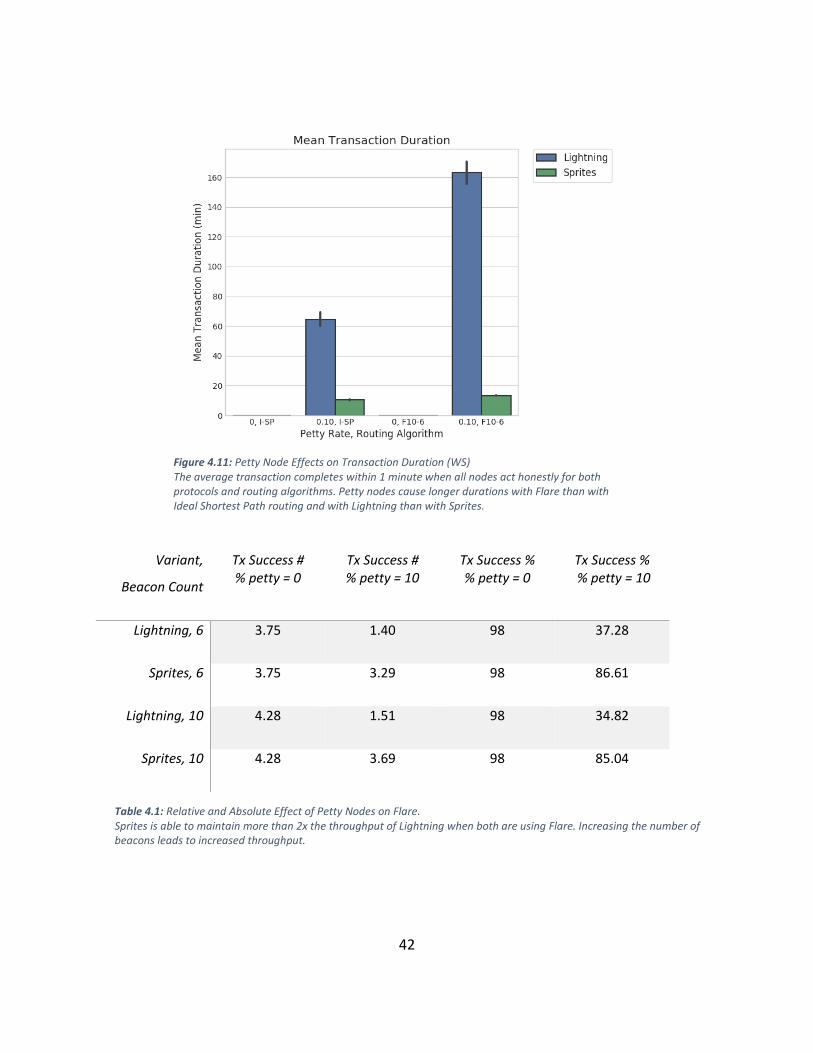
when nodes are acting petty (Figure 4.11).
As shown in Table 4.1, increasing the number of beacons in the Flare algorithm from 6 to 10
allows for larger throughput, but does not increase the resiliency. That is, though F10-10 is able
to send more transactions, it sends a smaller percent of the benchmarked reliable rate. A
possible explanation for this is that the extra payments that F10-10 completes have fewer
redundant paths than those that just F10-6 finds. Fewer redundant paths substantially
increases vulnerability to petty nodes.
Figure 4.8: Petty Node Effects on Transaction Success Ratio (WS) Flare and Lightning are associated with a much larger percent of transactions failing compared to the Ideal Shortest Path and Sprites.
41
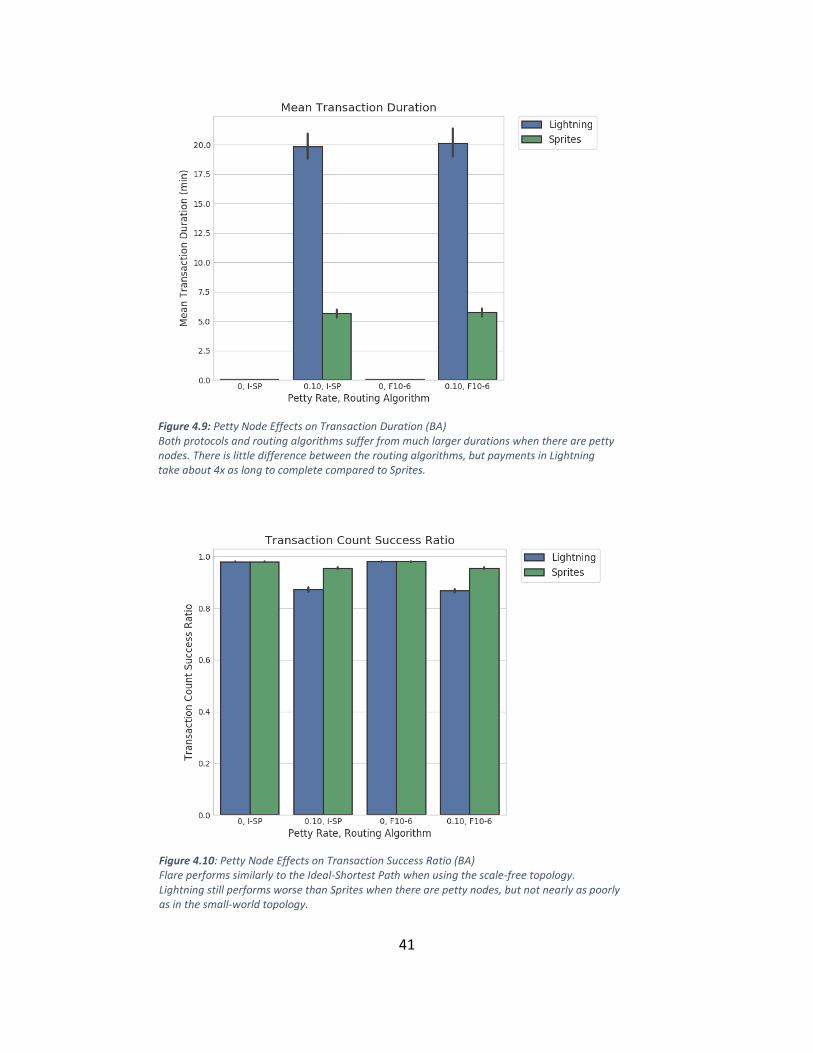
Figure 4.9: Petty Node Effects on Transaction Duration (BA) Both protocols and routing algorithms suffer from much larger durations when there are petty nodes. There is little difference between the routing algorithms, but payments in Lightning take about 4x as long to complete compared to Sprites.
Figure 4.10: Petty Node Effects on Transaction Success Ratio (BA) Flare performs similarly to the Ideal-Shortest Path when using the scale-free topology. Lightning still performs worse than Sprites when there are petty nodes, but not nearly as poorly as in the small-world topology.
42
Variant,
Beacon Count
Tx Success # % petty = 0
Tx Success # % petty = 10
Tx Success % % petty = 0
Tx Success % % petty = 10
Lightning, 6 3.75 1.40 98 37.28
Sprites, 6 3.75 3.29 98 86.61
Lightning, 10 4.28 1.51 98 34.82
Sprites, 10 4.28 3.69 98 85.04
Table 4.1: Relative and Absolute Effect of Petty Nodes on Flare. Sprites is able to maintain more than 2x the throughput of Lightning when both are using Flare. Increasing the number of beacons leads to increased throughput.
Figure 4.11: Petty Node Effects on Transaction Duration (WS) The average transaction completes within 1 minute when all nodes act honestly for both protocols and routing algorithms. Petty nodes cause longer durations with Flare than with Ideal Shortest Path routing and with Lightning than with Sprites.
43
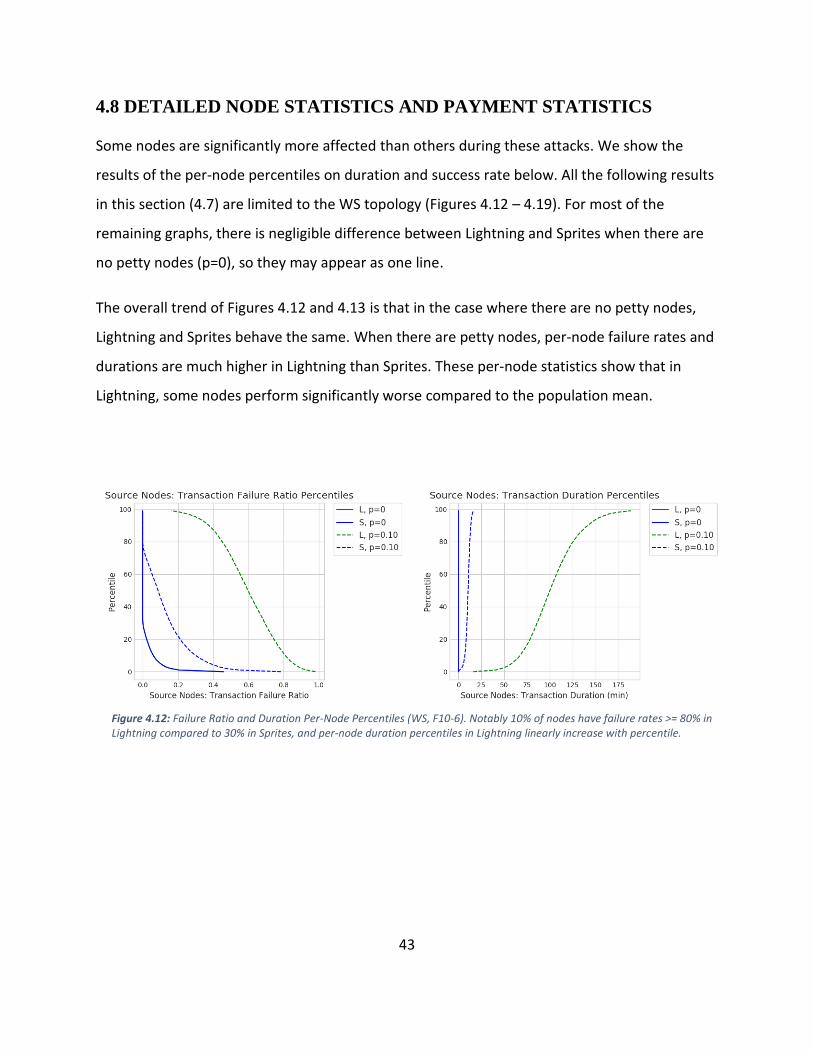
4.8 DETAILED NODE STATISTICS AND PAYMENT STATISTICS
Some nodes are significantly more affected than others during these attacks. We show the
results of the per-node percentiles on duration and success rate below. All the following results
in this section (4.7) are limited to the WS topology (Figures 4.12 – 4.19). For most of the
remaining graphs, there is negligible difference between Lightning and Sprites when there are
no petty nodes (p=0), so they may appear as one line.
The overall trend of Figures 4.12 and 4.13 is that in the case where there are no petty nodes,
Lightning and Sprites behave the same. When there are petty nodes, per-node failure rates and
durations are much higher in Lightning than Sprites. These per-node statistics show that in
Lightning, some nodes perform significantly worse compared to the population mean.
Figure 4.12: Failure Ratio and Duration Per-Node Percentiles (WS, F10-6). Notably 10% of nodes have failure rates >= 80% in Lightning compared to 30% in Sprites, and per-node duration percentiles in Lightning linearly increase with percentile.
44
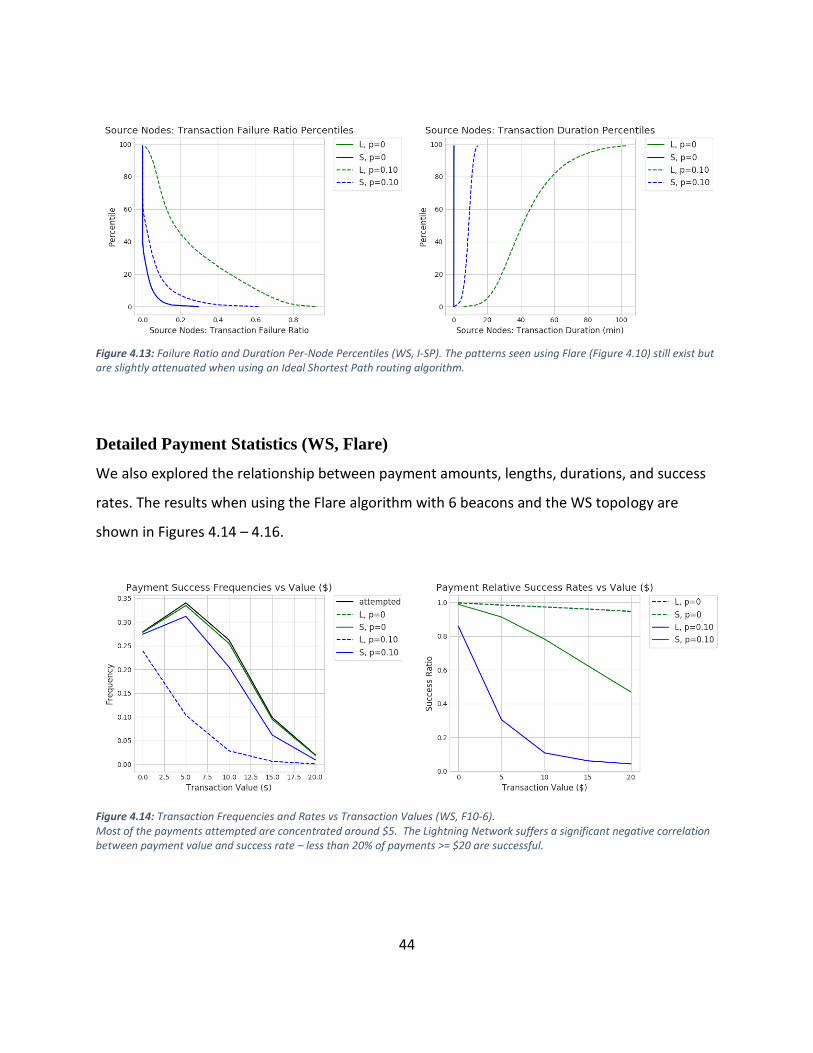
Detailed Payment Statistics (WS, Flare)
We also explored the relationship between payment amounts, lengths, durations, and success
rates. The results when using the Flare algorithm with 6 beacons and the WS topology are
shown in Figures 4.14 – 4.16.
Figure 4.13: Failure Ratio and Duration Per-Node Percentiles (WS, I-SP). The patterns seen using Flare (Figure 4.10) still exist but are slightly attenuated when using an Ideal Shortest Path routing algorithm.
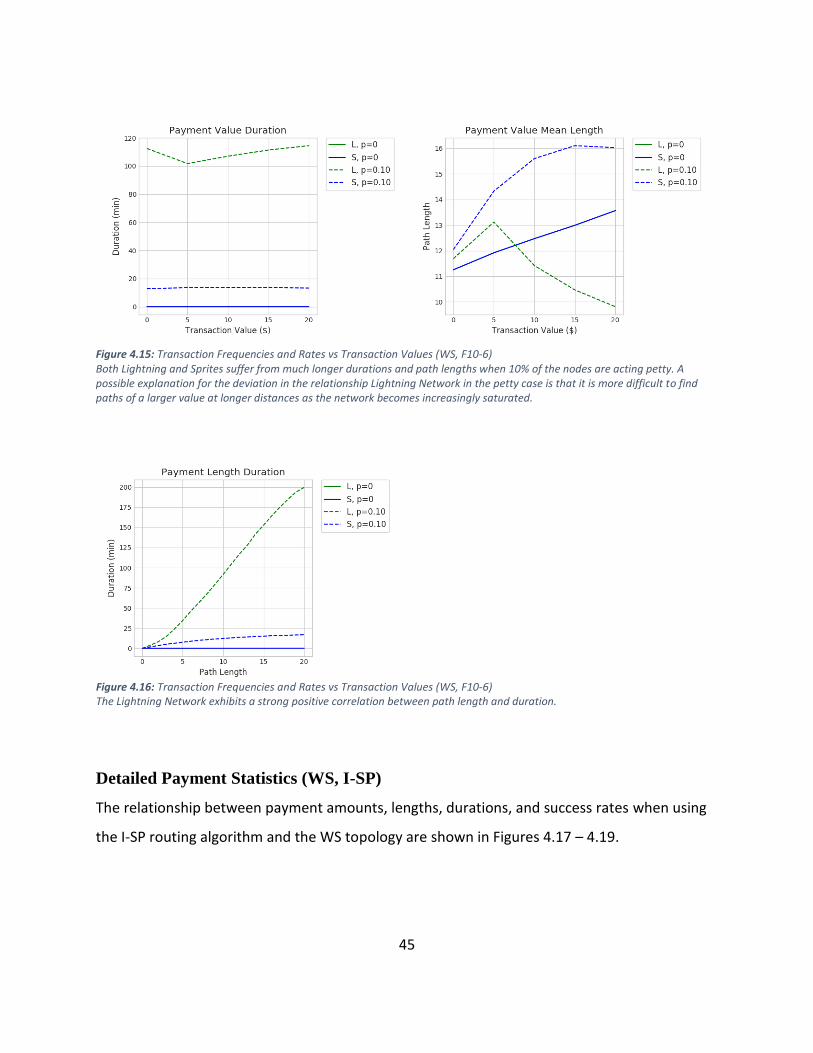
Figure 4.14: Transaction Frequencies and Rates vs Transaction Values (WS, F10-6). Most of the payments attempted are concentrated around $5. The Lightning Network suffers a significant negative correlation between payment value and success rate – less than 20% of payments >= $20 are successful.
45
Detailed Payment Statistics (WS, I-SP)
The relationship between payment amounts, lengths, durations, and success rates when using
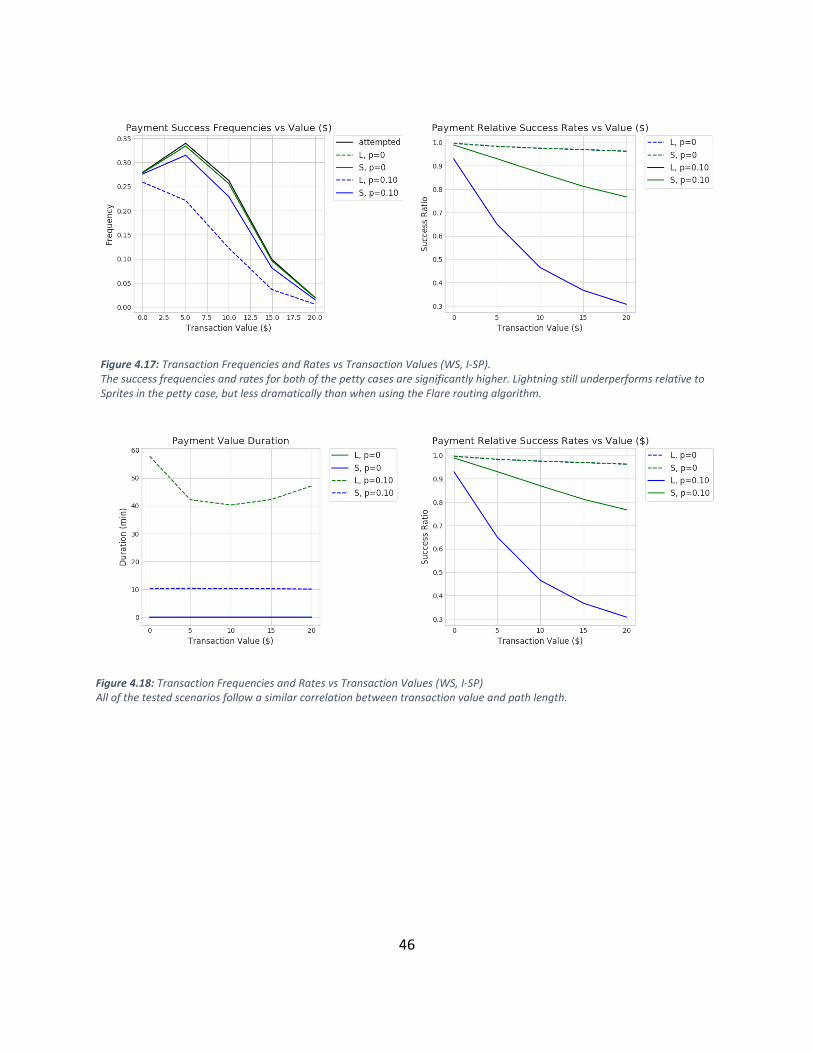
the I-SP routing algorithm and the WS topology are shown in Figures 4.17 – 4.19.
Figure 4.15: Transaction Frequencies and Rates vs Transaction Values (WS, F10-6) Both Lightning and Sprites suffer from much longer durations and path lengths when 10% of the nodes are acting petty. A possible explanation for the deviation in the relationship Lightning Network in the petty case is that it is more difficult to find paths of a larger value at longer distances as the network becomes increasingly saturated.
Figure 4.16: Transaction Frequencies and Rates vs Transaction Values (WS, F10-6) The Lightning Network exhibits a strong positive correlation between path length and duration.
46
Figure 4.17: Transaction Frequencies and Rates vs Transaction Values (WS, I-SP). The success frequencies and rates for both of the petty cases are significantly higher. Lightning still underperforms relative to Sprites in the petty case, but less dramatically than when using the Flare routing algorithm.
Figure 4.18: Transaction Frequencies and Rates vs Transaction Values (WS, I-SP) All of the tested scenarios follow a similar correlation between transaction value and path length.
47
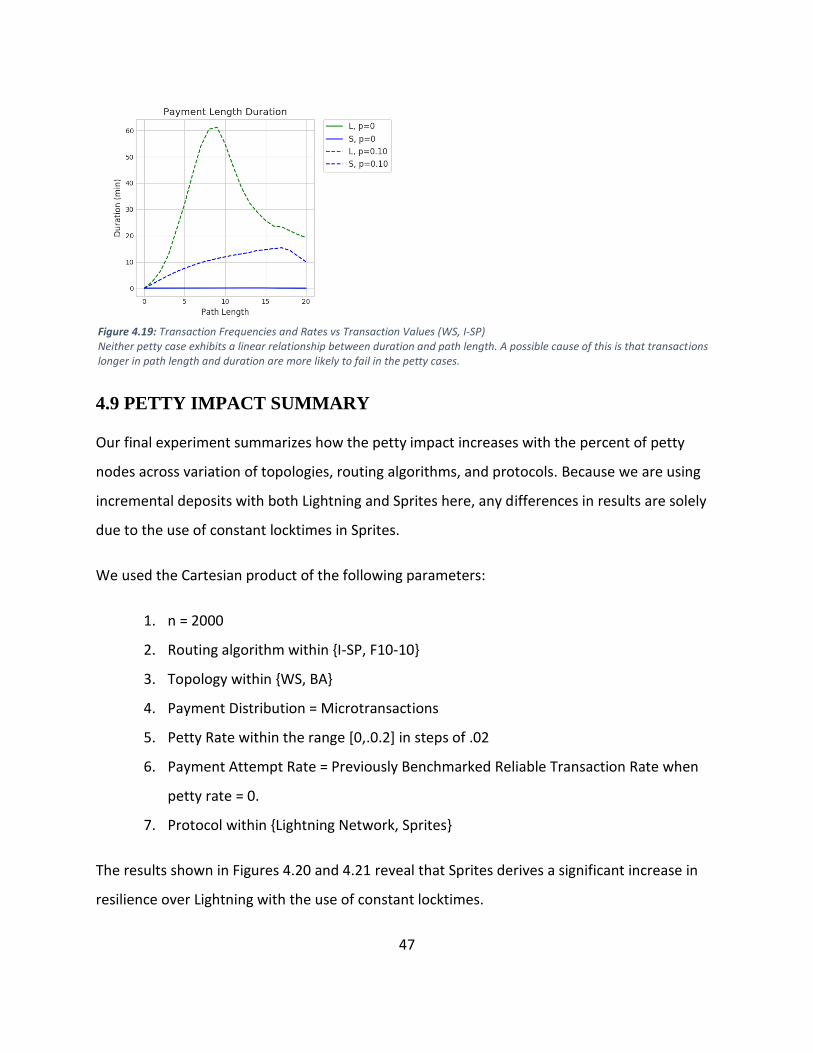
4.9 PETTY IMPACT SUMMARY
Our final experiment summarizes how the petty impact increases with the percent of petty
nodes across variation of topologies, routing algorithms, and protocols. Because we are using
incremental deposits with both Lightning and Sprites here, any differences in results are solely
due to the use of constant locktimes in Sprites.
We used the Cartesian product of the following parameters:
1. n = 2000
2. Routing algorithm within {I-SP, F10-10}
3. Topology within {WS, BA}
4. Payment Distribution = Microtransactions
5. Petty Rate within the range [0,.0.2] in steps of .02
6. Payment Attempt Rate = Previously Benchmarked Reliable Transaction Rate when
petty rate = 0.
7. Protocol within {Lightning Network, Sprites}
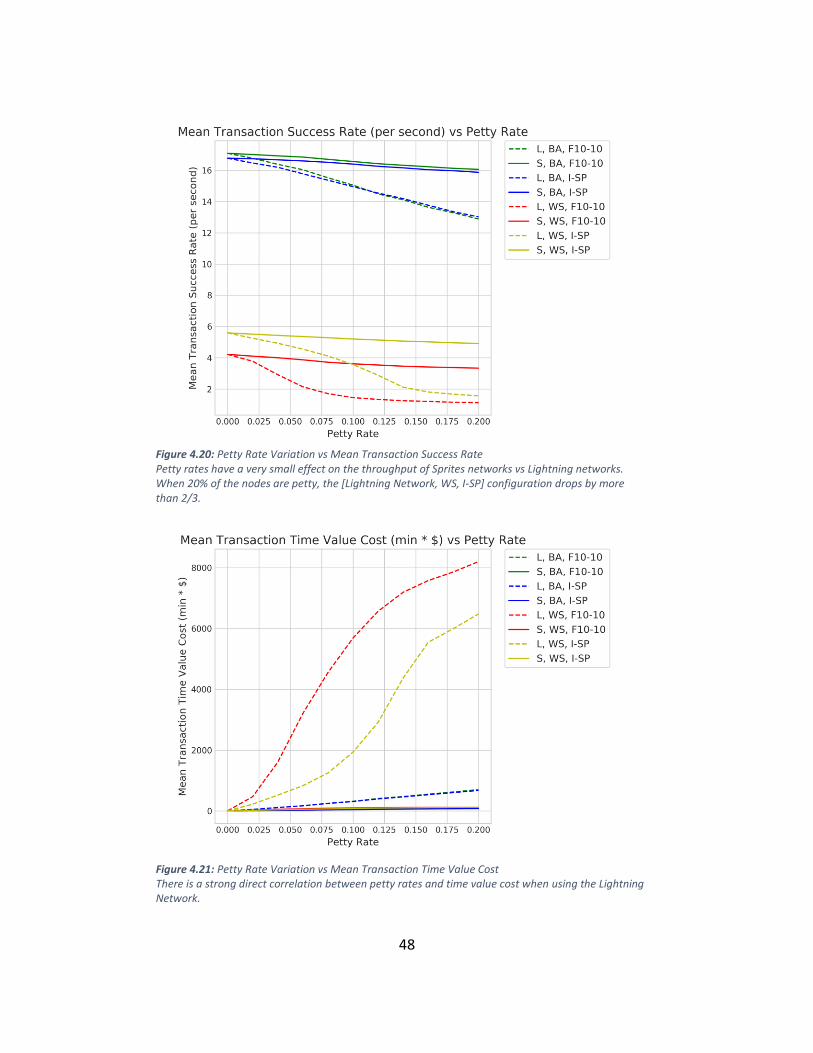
The results shown in Figures 4.20 and 4.21 reveal that Sprites derives a significant increase in
resilience over Lightning with the use of constant locktimes.
Figure 4.19: Transaction Frequencies and Rates vs Transaction Values (WS, I-SP) Neither petty case exhibits a linear relationship between duration and path length. A possible cause of this is that transactions longer in path length and duration are more likely to fail in the petty cases.
48
Figure 4.20: Petty Rate Variation vs Mean Transaction Success Rate Petty rates have a very small effect on the throughput of Sprites networks vs Lightning networks. When 20% of the nodes are petty, the [Lightning Network, WS, I-SP] configuration drops by more than 2/3.
Figure 4.21: Petty Rate Variation vs Mean Transaction Time Value Cost There is a strong direct correlation between petty rates and time value cost when using the Lightning Network.
49
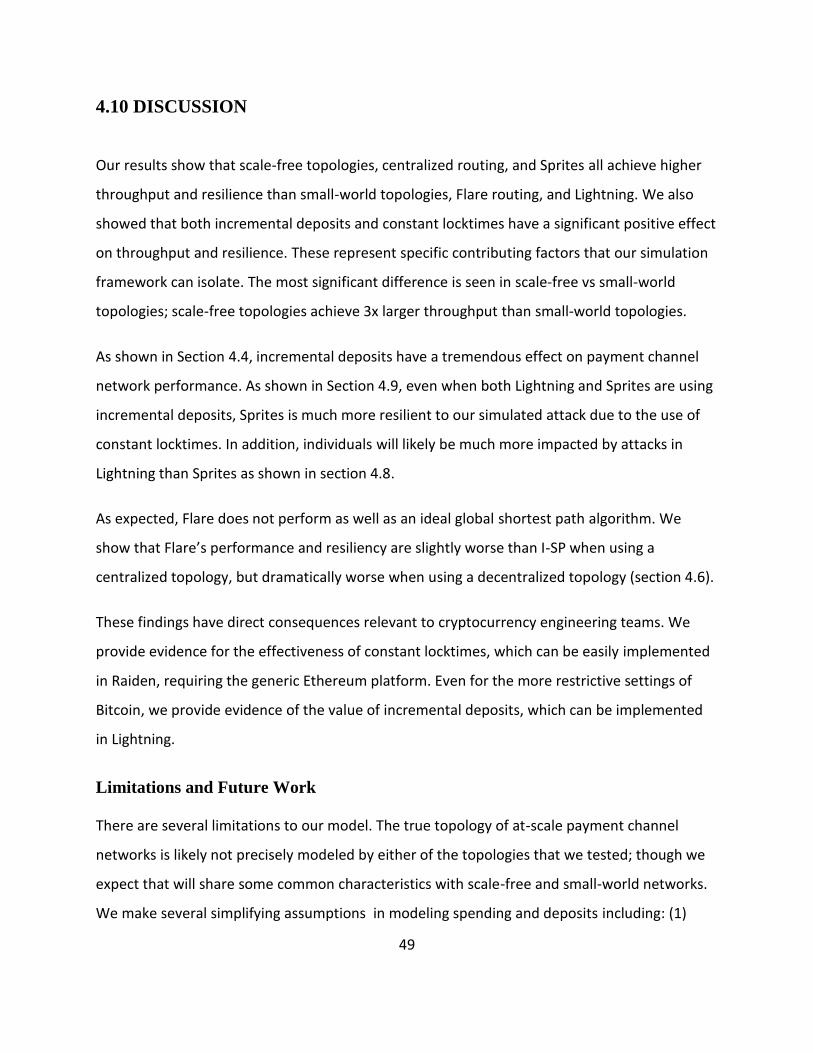
4.10 DISCUSSION
Our results show that scale-free topologies, centralized routing, and Sprites all achieve higher
throughput and resilience than small-world topologies, Flare routing, and Lightning. We also
showed that both incremental deposits and constant locktimes have a significant positive effect
on throughput and resilience. These represent specific contributing factors that our simulation
framework can isolate. The most significant difference is seen in scale-free vs small-world
topologies; scale-free topologies achieve 3x larger throughput than small-world topologies.
As shown in Section 4.4, incremental deposits have a tremendous effect on payment channel
network performance. As shown in Section 4.9, even when both Lightning and Sprites are using
incremental deposits, Sprites is much more resilient to our simulated attack due to the use of
constant locktimes. In addition, individuals will likely be much more impacted by attacks in
Lightning than Sprites as shown in section 4.8.
As expected, Flare does not perform as well as an ideal global shortest path algorithm. We
show that Flare’s performance and resiliency are slightly worse than I-SP when using a
centralized topology, but dramatically worse when using a decentralized topology (section 4.6).
These findings have direct consequences relevant to cryptocurrency engineering teams. We
provide evidence for the effectiveness of constant locktimes, which can be easily implemented
in Raiden, requiring the generic Ethereum platform. Even for the more restrictive settings of
Bitcoin, we provide evidence of the value of incremental deposits, which can be implemented
in Lightning.
Limitations and Future Work
There are several limitations to our model. The true topology of at-scale payment channel
networks is likely not precisely modeled by either of the topologies that we tested; though we
expect that will share some common characteristics with scale-free and small-world networks.
We make several simplifying assumptions in modeling spending and deposits including: (1)
50
automatically refilling consumer balances and depleting merchant balances, (2) treating the
transaction source, amount, and destination as independent from each other, and (3) treating
all initial channel deposits as independent from each other.
The attack model presented is somewhat contrived -- the adversaries do not get any immediate
benefit from their denial of service attack. The attack impact depends on the adversary
investing a significant portion (up to 20% in our experiments) of the total network capital,
though an adversary with knowledge of the topology may be able to maximize their impact
with more complex attacks.
The effectiveness of the modeled attack can be mitigated by reputation systems. Future work
includes creating a reputation system that is able to withstand these denial of service attacks,
while maintaining decentralization and privacy. Off-chain rebalancing within payment channel
networks is an active area of research [27], which potentially lessens the impact of incremental
deposits. Off-chain rebalancing allows nodes within a payment channel network to rebalance
their depleted channels using only off-chain currency. These rebalances are expected to be
quicker and cheaper than on-chain transactions. As with reputation systems, it is a current
challenge to add support for effective off-chain rebalancing without compromising
decentralization and privacy.
51
CHAPTER 5: CONCLUSION
In this work, we used real world data to approximate the expected behavior of payment
channel networks. We showed that incremental deposits and constant locktimes greatly
increase payment channel network throughput and resiliency. Results from our naïve attack
reveal that, in the worst case, an adversary controlling 10% of the network can more than halve
the throughput of the Lightning Network. Our findings underscrore the need for mitigation
mechanisms such as reputation systems. Despite the limitations in our experiments, our model
can be extended to support the evaluation of additional protocols, routing algorithms, attacks,
and mitigations.
52
REFERENCES
[1] S. Nakamoto, "Bitcoin: A peer-to-peer electronic cash system," 2008.
[2] A. Mahmudova, "Bitcoin prices soar above $4,700," MarketWatch, 29 August 2017.
[Online]. Available: http://www.marketwatch.com/story/bitcoin-prices-soar-above-4700-
2017-08-29. [Accessed 15 September 2017].
[3] J. Poon and T. Dryja, "The bitcoin lightning network: Scalable off-chain instant payments.,"
Technical Report (Draft), 2015.
[4] "Raiden Network," 2015. [Online]. Available: http://raiden.network/.
[5] A. Miller, I. Bentov, R. Kumaresan and P. McCorry, "Sprites: Payment Channels that Go
Faster than Lightning," CoRR, vol. abs/1702.05812, 2017.
[6] A. A. Hagberg, D. A. Schult and P. J. Swart, "Exploring network structure, dynamics, and
function using NetworkX," in Proceedings of the 7th Python in Science Conference
(SciPy2008), Pasadena, CA USA, 2008.
[7] M. E. J. Newman and D. J. Watts, " Renormalization group analysis of the small-world
network model," Physics Letters A, vol. 263, no. 4, pp. 341-346, 1999.
[8] J. D. Hunter, "Matplotlib: A 2D graphics environment," Computing In Science &
Engineering, vol. 9, no. 3, pp. 90-95, 2007.
[9] P. S. Fader, B. G. Hardie and K. L. Lee, "“Counting your customers” the easy way: An
alternative to the Pareto/NBD model," Marketing science, vol. 24, no. 2, pp. 275-284,
2005.
53
[10] M. Zanin, D. Papo, M. Romance, R. Criado and S. Moral, "The topology of card transaction
money flows," Physica A: Statistical Mechanics and its Applications, vol. 462, pp. 134-140,
2016.
[11] A. Srivastava, A. Kundu, S. Sural and A. Majumdar, "IEEE Transactions on dependable and
secure computing,," Credit card fraud detection using hidden Markov model., vol. 5, no. 1,
pp. 37-48, 2008.
[12] S. Panigrahi, A. Kundu, S. Sural and A. Majumdar, "Credit card fraud detection: A fusion
approach using Dempster–Shafer theory and Bayesian learning," Information Fusion, vol.
10, no. 4, pp. 354-363, 2009.
[13] A. Lipowski and D. Lipowska, "Roulette-wheel selection via stochastic acceptance,"
Physica A: Statistical Mechanics and its Applications, vol. 391, no. 6, pp. 2193-2196, 2012.
[14] A. Gervais, G. O. Karame, K. W{\"u}st, V. Glykantzis, H. Ritzdorf and S. Capkun, "On the
security and performance of proof of work blockchains," in Proceedings of the 2016 ACM
SIGSAC Conference on Computer and Communications Security, ACM, 2016, pp. 3-16.
[15] C. Decker and R. Wattenhofer, "Information propagation in the bitcoin network," in Peer-
to-Peer Computing (P2P), 2013 IEEE Thirteenth International Conference on, IEEE, 2013,
pp. 1-10.
[16] T. Neudecker, P. Andelfinger and H. Hartenstein, "Timing Analysis for Inferring the
Topology of the Bitcoin Peer-to-Peer Network.," in Ubiquitous Intelligence & Computing,
Advanced and Trusted Computing, Scalable Computing and Communications, Cloud and
Big Data Computing, Internet of People, and Smart World Congress
(UIC/ATC/ScalCom/CBDCom/IoP/SmartWorld), 2016 Intl IEEE Conferences, 2016.
54
[17] P. Prihodko, S. Zhigulin, S. M. A. Ostrovskiy and O. Osuntokun, Flare: An Approach to
Routing in Lightning Network. (1.0), 2016.
[18] P. Moreno-Sanchez, A. Kate and M. Maffei, "SilentWhispers: Enforcing Security and
Privacy in Decentralized Credit Networks.," 2017.
[19] J. Lind, I. Eyal, P. Pietzuch and E. G. Sirer, "Teechan: Payment Channels Using Trusted
Execution Environments," in arXiv preprint arXiv:1612.07766, 2016.
[20] J. a. E. I. Lind, F. Kelbert, O. Naor, P. Pietzuch and E. G. Sirer, "Teechain: Scalable
Blockchain Payments using Trusted Execution Environments," in {arXiv preprint
arXiv:1707.05454, 2017.
[21] B. A. L. Barabási and E. Bonabeau, "Scale-free," Scientific American, vol. 288, no. 5, pp. 50-
59, 2003.
[22] D. J. &. S. Watts, "Collective dynamics of'small-world'networks," nature, vol. 393, no.
6684, p. 440, 1998.
[23] R. Albert and A. L. Barabási, "Statistical mechanics of complex networks.," Reviews of
modern physics, vol. 74, no. 1, p. 47, 2002.
[24] M. E. Newman, S. H. Strogatz and W. D. J. , "Random graphs with arbitrary degree
distributions and their applications," Physical review E, vol. 64, no. 2, p. 026118, 2001.
[25] I. Pohl, Bi-directional and heuristic search in path problems, (Doctoral dissertation,
Department of Computer Science, Stanford University), 1969.
[26] C. T. Kelley, "Iterative methods for optimization," Society for Industrial and Applied
Mathematics, 1999.
55
[27] R. Khalil and A. Gervais, Gas, p. 400, 200.
[28] S. Marquer, "Ripple’s Blockchain Network Is Now More Than 100 Strong," Ripple, 10 10
2017. [Online]. Available: https://ripple.com/ripple_press/ripples-blockchain-network-
now-100-strong/. [Accessed 13 10 2017].
[29] P. Moreno-Sanchez, M. B. Zafar and A. Kate, "Listening to whispers of ripple: Linking
wallets and deanonymizing transactions in the ripple network," Proceedings on Privacy
Enhancing Technologies, vol. 2016, no. 4, pp. 436-453, 2016.
[30] A. Biryukov, D. Khovratovich and I. Pustogarov, "Deanonymisation of clients in Bitcoin P2P
network," in Proceedings of the 2014 ACM SIGSAC Conference on Computer and
Communications Security, ACM, 2014, pp. 15-29.