Embed Size (px)
Citation preview
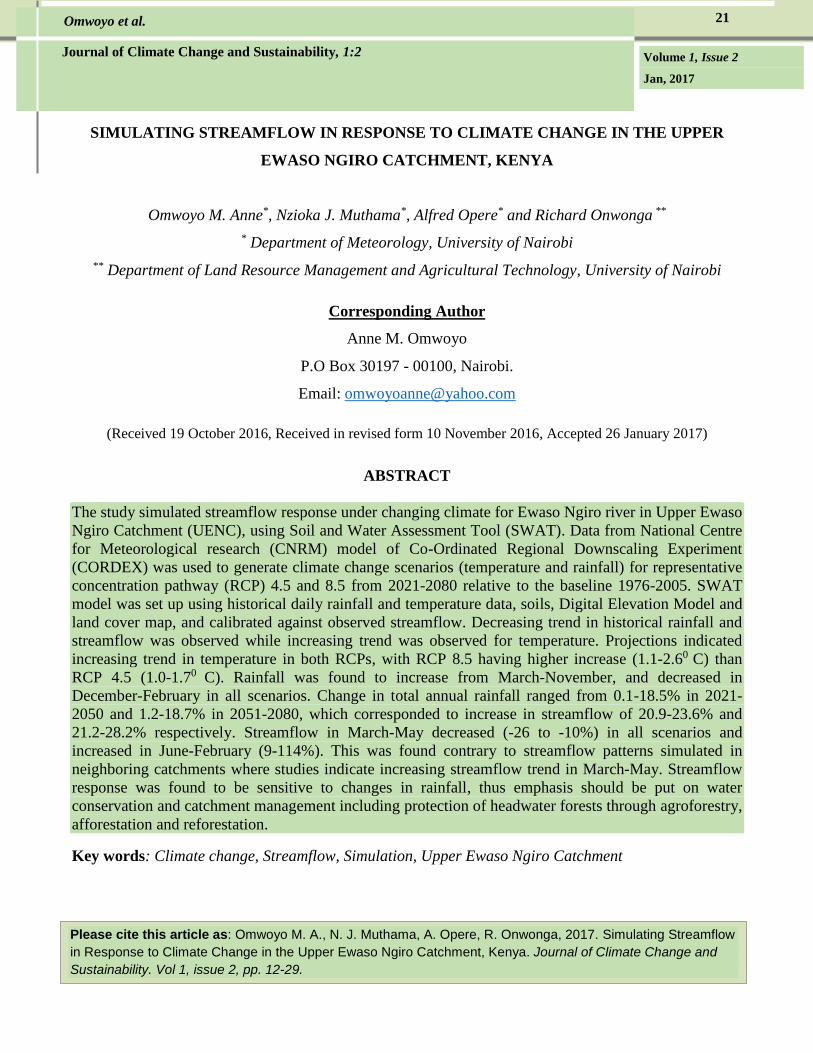
Omwoyo et al. Journal of Climate change and Sustainability 21
Volume 1, Issue 2
Jan, 2017
Journal of Climate Change and Sustainability, 1:2
Omwoyo et al.
SIMULATING STREAMFLOW IN RESPONSE TO CLIMATE CHANGE IN THE UPPER
EWASO NGIRO CATCHMENT, KENYA
Omwoyo M. Anne*, Nzioka J. Muthama*, Alfred Opere* and Richard Onwonga **
* Department of Meteorology, University of Nairobi
** Department of Land Resource Management and Agricultural Technology, University of Nairobi
Corresponding Author
Anne M. Omwoyo
P.O Box 30197 - 00100, Nairobi.
Email: [email protected]
(Received 19 October 2016, Received in revised form 10 November 2016, Accepted 26 January 2017)
ABSTRACT
The study simulated streamflow response under changing climate for Ewaso Ngiro river in Upper Ewaso
Ngiro Catchment (UENC), using Soil and Water Assessment Tool (SWAT). Data from National Centre
for Meteorological research (CNRM) model of Co-Ordinated Regional Downscaling Experiment
(CORDEX) was used to generate climate change scenarios (temperature and rainfall) for representative
concentration pathway (RCP) 4.5 and 8.5 from 2021-2080 relative to the baseline 1976-2005. SWAT
model was set up using historical daily rainfall and temperature data, soils, Digital Elevation Model and
land cover map, and calibrated against observed streamflow. Decreasing trend in historical rainfall and
streamflow was observed while increasing trend was observed for temperature. Projections indicated
increasing trend in temperature in both RCPs, with RCP 8.5 having higher increase (1.1-2.60 C) than
RCP 4.5 (1.0-1.70 C). Rainfall was found to increase from March-November, and decreased in
December-February in all scenarios. Change in total annual rainfall ranged from 0.1-18.5% in 2021-
2050 and 1.2-18.7% in 2051-2080, which corresponded to increase in streamflow of 20.9-23.6% and
21.2-28.2% respectively. Streamflow in March-May decreased (-26 to -10%) in all scenarios and
increased in June-February (9-114%). This was found contrary to streamflow patterns simulated in
neighboring catchments where studies indicate increasing streamflow trend in March-May. Streamflow
response was found to be sensitive to changes in rainfall, thus emphasis should be put on water
conservation and catchment management including protection of headwater forests through agroforestry,
afforestation and reforestation.
Key words: Climate change, Streamflow, Simulation, Upper Ewaso Ngiro Catchment
Please cite this article as: Omwoyo M. A., N. J. Muthama, A. Opere, R. Onwonga, 2017. Simulating Streamflow
in Response to Climate Change in the Upper Ewaso Ngiro Catchment, Kenya. Journal of Climate Change and
Sustainability. Vol 1, issue 2, pp. 12-29.
Omwoyo et al. Journal of Climate change and Sustainability 21
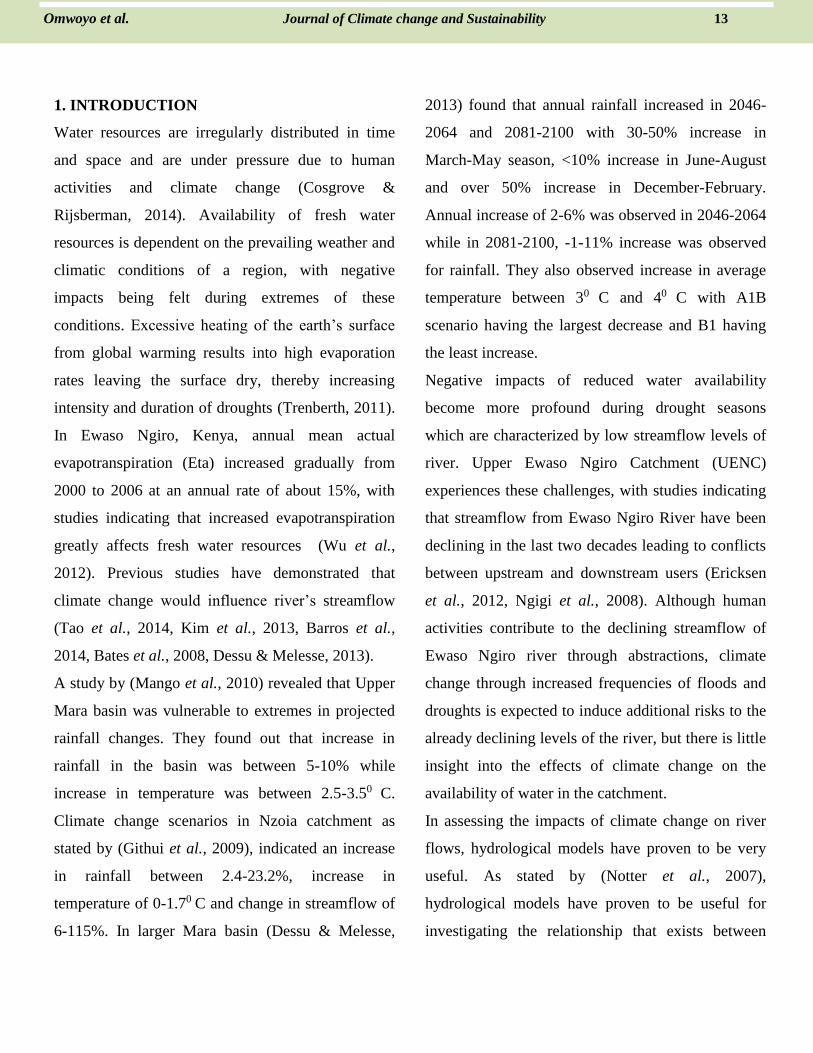
1. INTRODUCTION
Water resources are irregularly distributed in time
and space and are under pressure due to human
activities and climate change (Cosgrove &
Rijsberman, 2014). Availability of fresh water
resources is dependent on the prevailing weather and
climatic conditions of a region, with negative
impacts being felt during extremes of these
conditions. Excessive heating of the earth’s surface
from global warming results into high evaporation
rates leaving the surface dry, thereby increasing
intensity and duration of droughts (Trenberth, 2011).
In Ewaso Ngiro, Kenya, annual mean actual
evapotranspiration (Eta) increased gradually from
2000 to 2006 at an annual rate of about 15%, with
studies indicating that increased evapotranspiration
greatly affects fresh water resources (Wu et al.,
2012). Previous studies have demonstrated that
climate change would influence river’s streamflow
(Tao et al., 2014, Kim et al., 2013, Barros et al.,
2014, Bates et al., 2008, Dessu & Melesse, 2013).
A study by (Mango et al., 2010) revealed that Upper
Mara basin was vulnerable to extremes in projected
rainfall changes. They found out that increase in
rainfall in the basin was between 5-10% while
increase in temperature was between 2.5-3.50 C.
Climate change scenarios in Nzoia catchment as
stated by (Githui et al., 2009), indicated an increase
in rainfall between 2.4-23.2%, increase in
temperature of 0-1.70 C and change in streamflow of
6-115%. In larger Mara basin (Dessu & Melesse,
2013) found that annual rainfall increased in 2046-
2064 and 2081-2100 with 30-50% increase in
March-May season, <10% increase in June-August
and over 50% increase in December-February.
Annual increase of 2-6% was observed in 2046-2064
while in 2081-2100, -1-11% increase was observed
for rainfall. They also observed increase in average
temperature between 30 C and 40 C with A1B
scenario having the largest decrease and B1 having
the least increase.
Negative impacts of reduced water availability
become more profound during drought seasons
which are characterized by low streamflow levels of
river. Upper Ewaso Ngiro Catchment (UENC)
experiences these challenges, with studies indicating
that streamflow from Ewaso Ngiro River have been
declining in the last two decades leading to conflicts
between upstream and downstream users (Ericksen
et al., 2012, Ngigi et al., 2008). Although human
activities contribute to the declining streamflow of
Ewaso Ngiro river through abstractions, climate
change through increased frequencies of floods and
droughts is expected to induce additional risks to the
already declining levels of the river, but there is little
insight into the effects of climate change on the
availability of water in the catchment.
In assessing the impacts of climate change on river
flows, hydrological models have proven to be very
useful. As stated by (Notter et al., 2007),
hydrological models have proven to be useful for
investigating the relationship that exists between
Omwoyo et al. Journal of Climate change and Sustainability 13

Omwoyo et al. Journal of Climate change and Sustainability 21
climatic parameters, human activities, surface and
underground water resources. Many studies have
applied hydrological models to investigate the
impacts of climate change on runoff and river flows,
including (Vörösmarty et al., 2000, Hagemann et al.,
2013, Chaplot, 2007, Dessu & Melesse, 2013,
Ficklin et al., 2009, Kathumo et al., 2011, Kim et al.,
2013, Schneider et al., 2013, Willy Bauwens, 2009).
The overall objective of this study was to simulate
streamflow in response to climate change in UENC.
The specific objectives were: (1), to determine the
trend in historical rainfall, temperature and
streamflow in Upper Ewaso Ngiro Catchment
(UENC); (2), to determine the future climate change
scenarios over UENC and (3), to assess the impacts
of climate change on River Ewaso Ngiro’s
streamflow.
2. MATERIALS AND METHODS
2.1 Data
Data from CNRM model of CORDEX was used to
generate climate change scenarios in terms of rainfall
and temperature, and assessed their changes with
respect to the baseline (1976-2005), while SWAT
model was used in simulating streamflow in
response to the climate scenarios generated.
Observed daily temperature and rainfall data for
Naromoru and Archer’s Post meteorological stations
was obtained from the Kenya Meteorological
Department (KMD) and covered the period 1976-
2005. Daily streamflow data (1987-2010) for Ewaso
Ngiro River, at Archer’s Post river gauging station
was obtained from Water Resources Management
Authority (WARMA). Soil data was obtained as a
Digital map of scale 1:1 from International Soil
Reference and Information Centre (ISRIC 2016),
Digital Elevation Model (DEM) of 100 m resolution
from United States Geological Survey (USGS) and
land use map of year 2003 from Regional Centre for
Mapping and Resource Development (RCMRD).
2.2 Description of the area of study
The catchment (Figure 1) traverses six counties
namely; Nyandarua, Laikipia, Samburu, Isiolo, Nyeri
and Meru. UENC lies to the north east of Mt. Kenya
and the Nyandarua (Aberdares) range between the
coordinates 3600’00” E, 3800’0” E and 100’0” S,
1030’0” N. It covers an area of approximately 15,000
square kilometers.
The main river originates from the Nyandarua
ranges, while the tributaries come from Mt. Kenya
and they supply most of the flow in the river (Mati et
al., 2008). Some of the tributaries of the river are;
Timau, Ontulili, Naro Moru, Teleswani, Burget,
Isiolo, Kongoni, Pesi, Sirimon, Nanyuki, Ewaso
Narok, Likii and Timau which later converge
forming the Ewaso Ngiro river that flows through
Archer’s Post.
Temperatures in the upper parts of the catchment
range between 90 C -220 C while at lower parts of the
catchment temperatures range between 150 C -290 C
(Mutiga et al., 2011). High population growth rates
have been experienced in the upper parts of the
Omwoyo et al Journal of Climate change and Sustainability 15
15 Journal of Climate change and Sustainability Volume 1
14 Journal of Climate change and Sustainability Volume 1
Omwoyo et al. Journal of Climate change and Sustainability 21
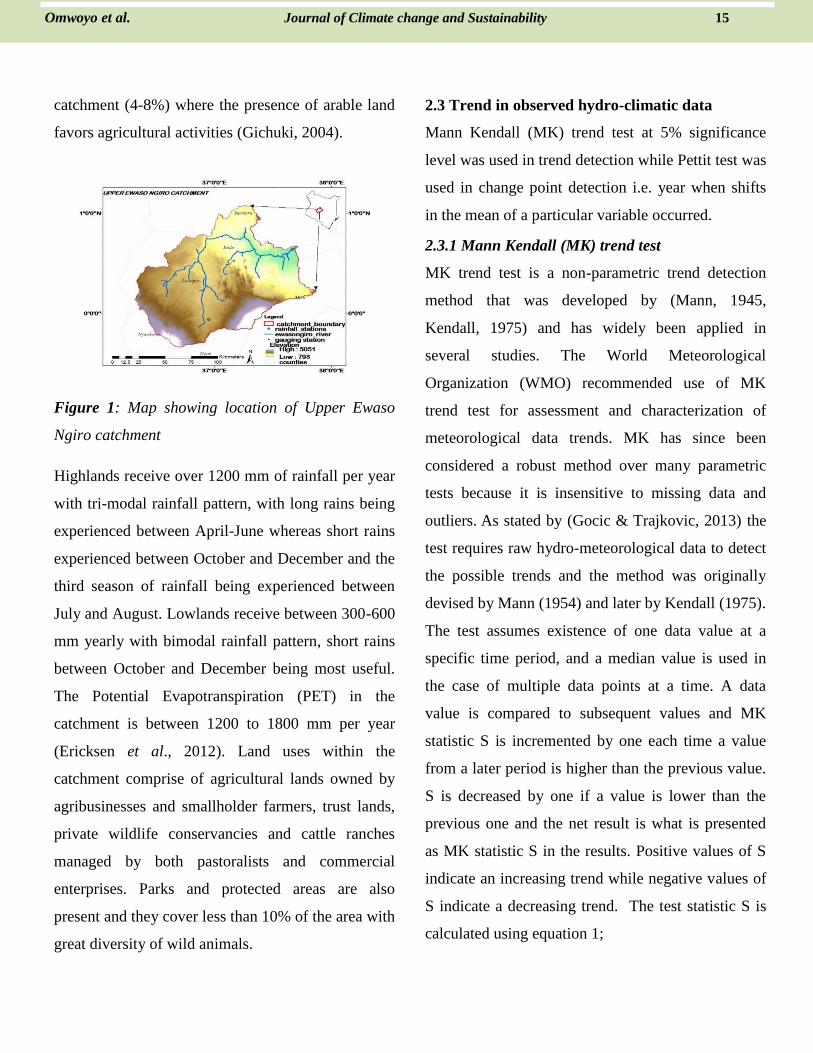
catchment (4-8%) where the presence of arable land
favors agricultural activities (Gichuki, 2004).
Figure 1: Map showing location of Upper Ewaso
Ngiro catchment
Highlands receive over 1200 mm of rainfall per year
with tri-modal rainfall pattern, with long rains being
experienced between April-June whereas short rains
experienced between October and December and the
third season of rainfall being experienced between
July and August. Lowlands receive between 300-600
mm yearly with bimodal rainfall pattern, short rains
between October and December being most useful.
The Potential Evapotranspiration (PET) in the
catchment is between 1200 to 1800 mm per year
(Ericksen et al., 2012). Land uses within the
catchment comprise of agricultural lands owned by
agribusinesses and smallholder farmers, trust lands,
private wildlife conservancies and cattle ranches
managed by both pastoralists and commercial
enterprises. Parks and protected areas are also
present and they cover less than 10% of the area with
great diversity of wild animals.
2.3 Trend in observed hydro-climatic data
Mann Kendall (MK) trend test at 5% significance
level was used in trend detection while Pettit test was
used in change point detection i.e. year when shifts
in the mean of a particular variable occurred.
2.3.1 Mann Kendall (MK) trend test
MK trend test is a non-parametric trend detection
method that was developed by (Mann, 1945,
Kendall, 1975) and has widely been applied in
several studies. The World Meteorological
Organization (WMO) recommended use of MK
trend test for assessment and characterization of
meteorological data trends. MK has since been
considered a robust method over many parametric
tests because it is insensitive to missing data and
outliers. As stated by (Gocic & Trajkovic, 2013) the
test requires raw hydro-meteorological data to detect
the possible trends and the method was originally
devised by Mann (1954) and later by Kendall (1975).
The test assumes existence of one data value at a
specific time period, and a median value is used in
the case of multiple data points at a time. A data
value is compared to subsequent values and MK
statistic S is incremented by one each time a value
from a later period is higher than the previous value.
S is decreased by one if a value is lower than the
previous one and the net result is what is presented
as MK statistic S in the results. Positive values of S
indicate an increasing trend while negative values of
S indicate a decreasing trend. The test statistic S is
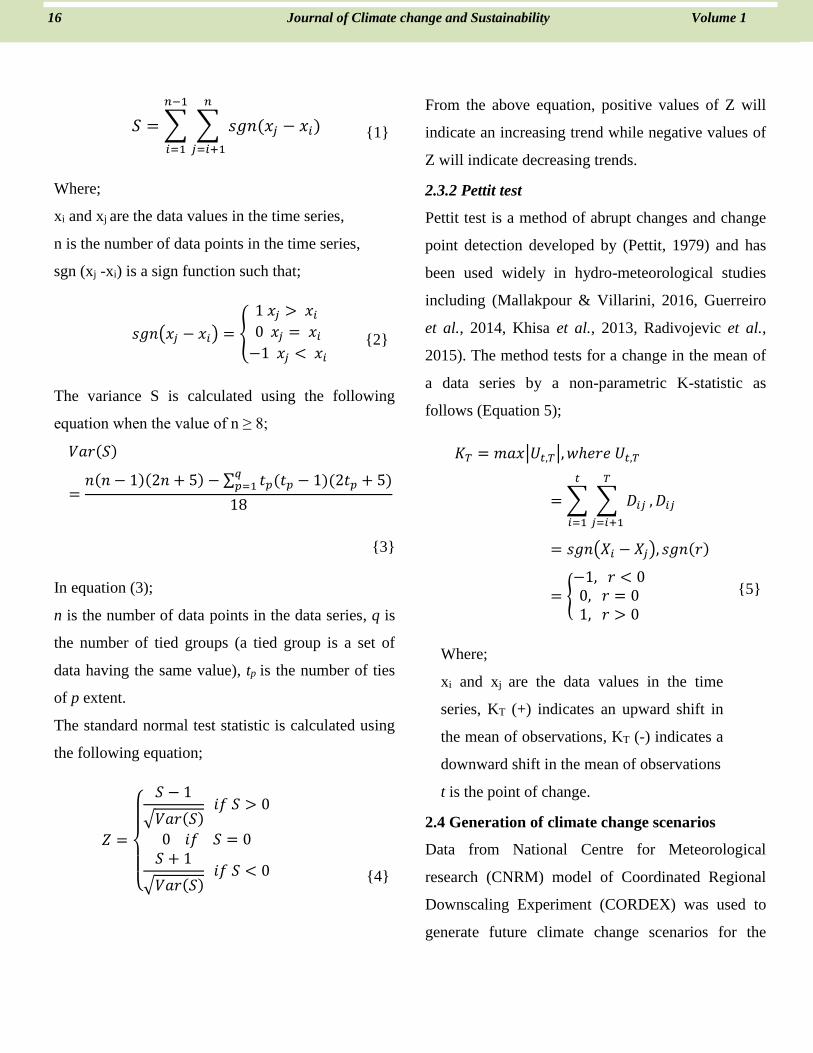
calculated using equation 1;
16 Journal of Climate change and Sustainability Volume 1
Omwoyo et al. Journal of Climate change and Sustainability 15
Omwoyo et al. Journal of Climate change and Sustainability 21
𝑆 = ∑ ∑ 𝑠𝑔𝑛(𝑥𝑗 − 𝑥𝑖)
𝑛
𝑗=𝑖+1
𝑛−1
𝑖=1
{1}
Where;
xi and xj are the data values in the time series,
n is the number of data points in the time series,
sgn (xj -xi) is a sign function such that;
𝑠𝑔𝑛(𝑥𝑗 − 𝑥𝑖) = {
1 𝑥𝑗 > 𝑥𝑖
0 𝑥𝑗 = 𝑥𝑖−1 𝑥𝑗 < 𝑥𝑖
{2}
The variance S is calculated using the following
equation when the value of n ≥ 8;
𝑉𝑎𝑟(𝑆)
=𝑛(𝑛 − 1)(2𝑛 + 5) − ∑ 𝑡𝑝(𝑡𝑝 − 1)(2𝑡𝑝 + 5)
𝑞𝑝=1
18
{3}
In equation (3);
n is the number of data points in the data series, q is
the number of tied groups (a tied group is a set of
data having the same value), tp is the number of ties
of p extent.
The standard normal test statistic is calculated using
the following equation;
𝑍 =
{
𝑆 − 1
√𝑉𝑎𝑟(𝑆) 𝑖𝑓 𝑆 > 0
0 𝑖𝑓 𝑆 = 0𝑆 + 1
√𝑉𝑎𝑟(𝑆) 𝑖𝑓 𝑆 < 0
{4}
From the above equation, positive values of Z will
indicate an increasing trend while negative values of
Z will indicate decreasing trends.
2.3.2 Pettit test
Pettit test is a method of abrupt changes and change
point detection developed by (Pettit, 1979) and has
been used widely in hydro-meteorological studies
including (Mallakpour & Villarini, 2016, Guerreiro
et al., 2014, Khisa et al., 2013, Radivojevic et al.,
2015). The method tests for a change in the mean of
a data series by a non-parametric K-statistic as
follows (Equation 5);
𝐾𝑇 = 𝑚𝑎𝑥|𝑈𝑡,𝑇|, 𝑤ℎ𝑒𝑟𝑒 𝑈𝑡,𝑇
=∑ ∑ 𝐷𝑖𝑗
𝑇
𝑗=𝑖+1
𝑡
𝑖=1
, 𝐷𝑖𝑗
= 𝑠𝑔𝑛(𝑋𝑖 − 𝑋𝑗), 𝑠𝑔𝑛(𝑟)
= {−1, 𝑟 < 00, 𝑟 = 01, 𝑟 > 0
Where;
xi and xj are the data values in the time
series, KT (+) indicates an upward shift in
the mean of observations, KT (-) indicates a
downward shift in the mean of observations
t is the point of change.
{5}
2.4 Generation of climate change scenarios
Data from National Centre for Meteorological
research (CNRM) model of Coordinated Regional
Downscaling Experiment (CORDEX) was used to
generate future climate change scenarios for the
17 Journal of Climate change and Sustainability Volume 1
16 Journal of Climate change and Sustainability Volume 1

Omwoyo et al. Journal of Climate change and Sustainability 21
catchment from the year 2021-2080, which is a span
of 60 years. CORDEX is a climate projection
framework with different Regional Climate Model
(RCM) simulations including experiments of new
simulations of greenhouse gases, carbon cycle and
feedback mechanisms (Giorgi et al., 2009). RCMs
within CORDEX include; National Centre for
Meteorological research (CNRM), Max Plank
Institute (MPI) developed by Max Plank Institute of
meteorology- Germany, Hadley Center (HadGEM2-
ES), Earth System Model of the EC-Earth
Consortium, Model for Interdisciplinary Research on
Climate (MIROC) jointly developed by the
University of Tokyo, NIES and JAMSTEC, National
Oceanic and Atmospheric Administration (NOAA),
National Climate Centre (NCC) and Canadian
Centre for Climate Modelling and Analysis
(CCCMA) model developed by Climate Research
Division of Environment Canada.
The spatial resolution used by CORDEX is 0.440
which is equivalent to approximately 44 km grid
resolution and is based on Representative
Concentration Pathways (RCPs) which are
stabilization levels of radiative forcing as a result of
the concentration of greenhouse gases by the end of
21st century. Four RCPs were selected within
CORDEX and they include RCPs 2.6, 4.5, 8.5 and
6.0 which correspond to warming of 2.6, 4.5, 8.5 and
6.0 W/m2 respectively. RCPs 4.5 and 8.5 were
selected for climate scenarios generation. RCP 4.5 is
a stabilization scenario that assumes introduction of
emission mitigation policies, although temperature
will continue to rise due to inertia in the climate
system (Peters et al., 2013), while RCP 8.5 assumes
no mitigation measures and temperatures will
continue increasing up to 2100 due to continued
emission of greenhouse gases (Van Vuuren et al.,
2011, Moss et al., 2010).
One RCM model was chosen on the basis of
validation between observed climatic data and the
model’s historical data. A box plot of all the RCMs
together with observed data used to determine which
model had a close resemblance to the observed
station’s climatic data. From the boxplot, two models
(NCC and CNRM) were in close resemblance to the
observed data and further statistical tests using
correlation coefficient (R2) revealed that CNRM had
a higher R2 value (0.62) as compared to NCC (0.38).
CNRM was therefore selected for use in generating
climate change scenarios.
Data from CNRM model was downloaded and used
to extract data for UENC. A script for extracting the
data was prepared and Grid Analysis and Display
System (GRADS) was used to run it in order get the
climate change scenarios in UENC.
The period between 2021 and 2050 was referred to
as ‘2030s’ while the period between 2051 and 2080
was given the abbreviation ‘2060s’. Mann Kendal
(MK) trend test was used to detect trend in rainfall
and temperature. Change in climatic parameters (%)
was then identified using equation 6 which was
19 Journal of Climate change and Sustainability Volume 1
Omwoyo et al. Journal of Climate change and Sustainability 17
Omwoyo et al. Journal of Climate change and Sustainability 21
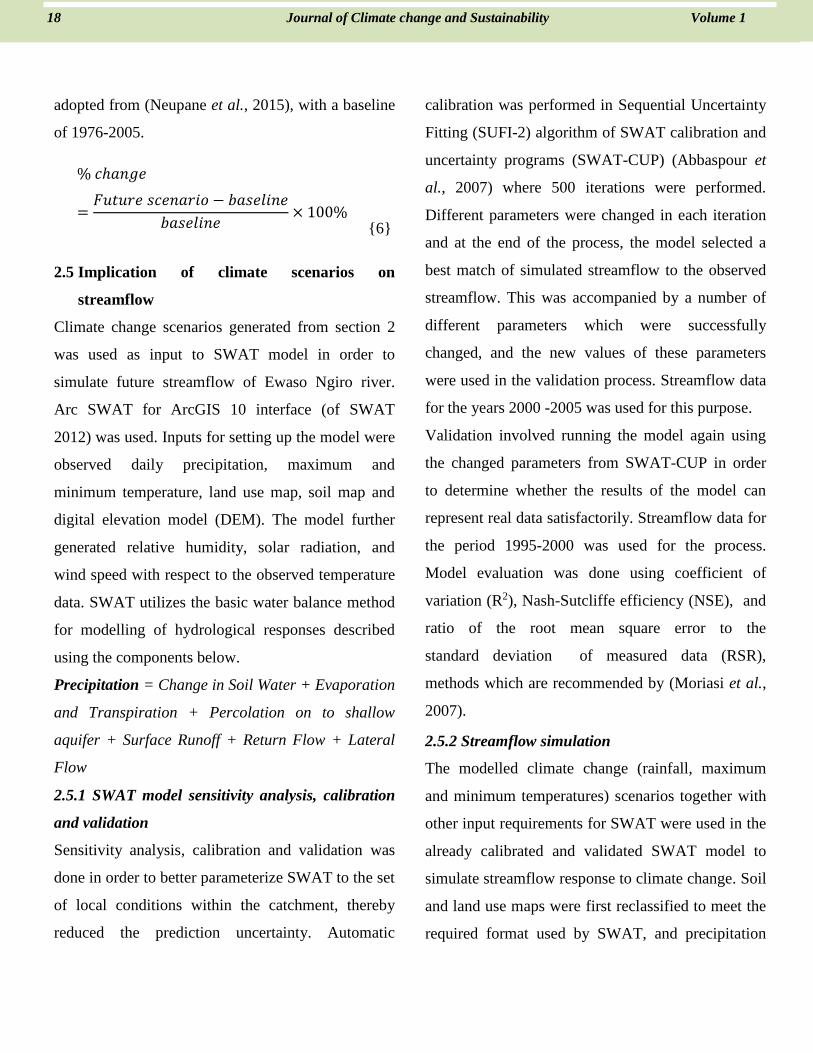
adopted from (Neupane et al., 2015), with a baseline
of 1976-2005.
% 𝑐ℎ𝑎𝑛𝑔𝑒
=𝐹𝑢𝑡𝑢𝑟𝑒 𝑠𝑐𝑒𝑛𝑎𝑟𝑖𝑜 − 𝑏𝑎𝑠𝑒𝑙𝑖𝑛𝑒
𝑏𝑎𝑠𝑒𝑙𝑖𝑛𝑒× 100%
{6}
2.5 Implication of climate scenarios on
streamflow
Climate change scenarios generated from section 2
was used as input to SWAT model in order to
simulate future streamflow of Ewaso Ngiro river.
Arc SWAT for ArcGIS 10 interface (of SWAT
2012) was used. Inputs for setting up the model were
observed daily precipitation, maximum and
minimum temperature, land use map, soil map and
digital elevation model (DEM). The model further
generated relative humidity, solar radiation, and
wind speed with respect to the observed temperature
data. SWAT utilizes the basic water balance method
for modelling of hydrological responses described
using the components below.
Precipitation = Change in Soil Water + Evaporation
and Transpiration + Percolation on to shallow
aquifer + Surface Runoff + Return Flow + Lateral
Flow
2.5.1 SWAT model sensitivity analysis, calibration
and validation
Sensitivity analysis, calibration and validation was
done in order to better parameterize SWAT to the set
of local conditions within the catchment, thereby
reduced the prediction uncertainty. Automatic
calibration was performed in Sequential Uncertainty
Fitting (SUFI-2) algorithm of SWAT calibration and
uncertainty programs (SWAT-CUP) (Abbaspour et
al., 2007) where 500 iterations were performed.
Different parameters were changed in each iteration
and at the end of the process, the model selected a
best match of simulated streamflow to the observed
streamflow. This was accompanied by a number of
different parameters which were successfully
changed, and the new values of these parameters
were used in the validation process. Streamflow data
for the years 2000 -2005 was used for this purpose.
Validation involved running the model again using
the changed parameters from SWAT-CUP in order
to determine whether the results of the model can
represent real data satisfactorily. Streamflow data for
the period 1995-2000 was used for the process.
Model evaluation was done using coefficient of
variation (R2), Nash-Sutcliffe efficiency (NSE), and
ratio of the root mean square error to the
standard deviation of measured data (RSR),
methods which are recommended by (Moriasi et al.,
2007).
2.5.2 Streamflow simulation
The modelled climate change (rainfall, maximum
and minimum temperatures) scenarios together with
other input requirements for SWAT were used in the
already calibrated and validated SWAT model to
simulate streamflow response to climate change. Soil
and land use maps were first reclassified to meet the
required format used by SWAT, and precipitation
18 Journal of Climate change and Sustainability Volume 1

Omwoyo et al. Journal of Climate change and Sustainability 21
and maximum and minimum temperature data were
also prepared in a relevant format acceptable by the
model.
Trend in the simulated streamflow was identified
using MK trend test while changes (%) in
streamflow with respect to the baseline was carried
out using equation 6.
3. RESULTS AND DISCUSSIONS
3.1 Trend in historical hydro-climatic data
Results from MK trend analyses indicated an
increasing trend in historical maximum and
minimum temperatures at Naromoru and Archer’s
Post stations (Figure 2).
(a)
(b)
(c)
(d)
Figure 2: Trend and change points in annual
average maximum temperatures for Naromoru
(figure 2a) and Archer’s Post (figure 2b); and
annual minimum temperatures for Naromoru
(figure2c) and Archer’s Post (figure 2d) in 1976-
2005
Temperature trend at Naromoru was statistically
significant at 5% significance level while trend at
Archer’s Post was not significant. Pettit test also
confirmed an increasing trend where the test
indicated an upward shift in the mean of minimum
and maximum temperatures at Naromoru which
occurred in the years 1996 and 1994 respectively and
at Archer’s Post which occurred in 1999 and 1997
respectively (Figure 2).
21 Journal of Climate change and Sustainability Volume 1
Omwoyo et al. Journal of Climate change and Sustainability 19

Omwoyo et al. Journal of Climate change and Sustainability 21
(a)
(b)
Figure 3: Trend and change point in rainfall at
Naromoru (figure 3a) and Archer’s Post (figure 3b)
in 1976-2005
Significant decreasing trend in rainfall was observed
at Naromoru during 1976-2005 and this was
confirmed by Pettit test conducted where a
downward shift in the mean of the total annual
rainfall was observed, with a change point in the
year 1982 (Figure 2a). Non-significant increasing
trend in rainfall was observed at Archer’s Post and
Pettit test revealed similar results whereby an
upward shift in the mean of the total annual rainfall
was observed, with a change point occurring in the
year 1985 (Figure 3b). Significant decreasing trend
in streamflow was observed with a change point in
the year 2002 identified using Pettit test where a
downward shift in the mean was observed.
3.2 Climate change scenarios
Rainfall and temperature projections for the period
2021-2050 (2030s) and 2051-2080 (2060s) are
presented hereunder.
3.2.1 Temperature changes
The average annual temperature trend at Naromoru
and Archer’s Post was found to significantly increase
in all the scenarios (Table 1), where the value of
Kendall’s statistic S was positive and p-values less
than significant level alpha indicated that the trend
was significant. RCP 8.5 was noted to have high
temperature increase than RCP 4.5 since its S values
are larger than for RCP 4. 5.
Table 1: Results of Mann Kendal trend test of
average annual temperature (2021-2080)
The increase in temperature was associated with
global warming due to increased greenhouse gases in
the atmosphere. Similar results were presented by
(Githui et al., 2009, Kim et al., 2013, Rwigi et al.,
2016) where RCP 8.5 exhibited higher temperature
increases than RCP 4.5.
scenario
Kendall’
s Tau
Mann
Kendall
statistic
(S)
2-sided p
value alpha
2030s Naromoru RCP4.5 0.48 207.00 0.00 0.05
Archer’s post RCP4.5 0.46 199.00 0.00 0.05
Naromoru RCP8.5 0.68 297.00 0.00 0.05
Archer’s post RCP8.5 0.65 283.00 0.00 0.05
2060s Naromoru RCP4.5 0.41 177.00 0.00 0.05
Archer’s post RCP4.5 0.37 161.00 0.00 0.05
Naromoru RCP8.5 0.82 355.00 0.00 0.05
Archer’s post RCP8.5 0.76 329.00 0.00 0.05
Omwoyo et al Journal of Climate change and Sustainability 22
20 Journal of Climate change and Sustainability Volume 1

Omwoyo et al. Journal of Climate change and Sustainability 21
Annual changes in rainfall (%) and temperature (%)
with reference to the baseline (1976-2005) are shown
in Table 2.
Table 2: Changes in rainfall and temperature in
2030s and 2060s
On average temperature increase at Naromoru in
2030s was found to be 1.00 C and 1.10 C for RCP 4.5
and RCP 8.5 respectively while in 2060s the increase
was 1.70 C and 2.50 C for RCP 4.5 and RCP 8.5
respectively. At Archer’s Post, in 2030s average
temperature increase was found to be 1.00 C and 1.20
C for RCP 4.5 and RCP 8.5 respectively while in
2060s the increase was 1.70 C and 2.60 C for RCP 4.5
and RCP 8.5 respectively (Table 2).
Seasonal minimum and maximum temperature
changes calculated using equation 6 showed that
minimum temperatures in March-April-May
(MAM), June-July-August (JJA), September-
October-November (SON) and December-January-
February (DJF) increased in all scenarios (Figure 4).
Seasonal maximum temperatures were also found to
increase in all scenarios and the results are showed in
Figure 5. It was noted that percentage increase in
minimum temperatures was higher (between 5 and
38%) than the percentage increase in maximum
temperatures in all the seasons (between 3 and 13%),
indicating that nights are expected to be warmer in
the future.
(a)
(b)
Figure 4: Seasonal changes (%) in minimum
temperatures at Naromoru (a) and Archer’s Post (b)
in 2030s and 2060s with respect to the baseline
DJF season was found to have a higher % increase in
the minimum temperatures while MAM was found
to have lower % increase in the minimum
temperatures with reference to the baseline totals for
those seasons.
Rainfall
(%)
temperature
(0C)
Rainfall
(%)
temperature
(0C)
RCP4.5 14.20 1.00 0.10 1.00
RCP8.5 18.50 1.10 7.60 1.20
RCP4.5 18.70 1.70 10.20 1.70
RCP8.5 14.60 2.50 1.20 2.60
Naromoru Archer's post
Omwoyo et al Journal of Climate change and Sustainability 21

Omwoyo et al. Journal of Climate change and Sustainability 21
(a)
(b)
Figure 5: Seasonal changes (%) in maximum
temperatures at Naromoru (a) and Archer’s Post (b)
in 2030s and 2060s with respect to the baseline
For maximum temperatures, MAM season in the two
stations was found to have a higher % increase while
the DJF season was found to have a lower %
increase in the maximum temperatures with
reference to the baseline for those seasons, except for
RCP 8.5 in 2060s at Archer’s Post (Figure 5).
3.2.2 Rainfall
Results of MK trend test on rainfall in 2021-2080 are
shown in Table 3. Annual rainfall trend at Naromoru
for RCP 4.5 was found to increase, although not
statistically significant, with the 2030s having a
larger increase than the 2060s as indicated by larger
S value.
Table 3: Mann Kendall trend test results for rainfall
at Archers Post and Naromoru (2021-2080).
For RCP 8.5 a decreasing trend was observed in the
2030s, while significant increasing trend was
observed in the 2060s. At Archer’s Post, for RCP
4.5, an increasing trend in annual rainfall was
observed in the 2030s and a decreasing trend in the
2060s, both trends being insignificant. For RCP 8.5,
decreasing trend was observed both in the 2030s and
2060s. Decreasing trend was significant in 2030s and
insignificant in 2060s (Table 3). Average increase in
rainfall in 2030s at Naromoru was 14.2% and 18.5%
for RCP 4.5 and RCP 8.5 respectively. At Archer’s
Post, the average increase was 0.3% and 7.6% for
RCP 4.5 and RCP 8.5 respectively. Change in mean
annual rainfall at Naromoru was found to be 14.2%
and 18.5% for RCP 4.5 and RCP 8.5 respectively in
the 2030s and 18.7% and 14.6% for RCP 4.5 and
RCP 8.5 respectively in the 2060s. At Archer’s Post
the change was found to be 0.1% and 7.6% for RCP
4.5 and RCP 8.5 respectively in the 2030s and 10.2%
scenario
Kendall’s
Tau
Mann
Kendall
statistic
(S)
2-sided p
value alpha
Naromoru RCP4.5_2030s 0.15 65.00 0.11 0.05
Naromoru RCP4.5_2060s 0.25 11.00 0.24 0.05
Naromoru RCP8.5_2030s -0.06 -27.00 0.05 0.05
Naromoru RCP8.5_2060s 0.01 3.00 0.01 0.05
Archer’s post RCP4.5_2030s 0.15 67.00 0.23 0.05
Archer’s post RCP4.5_2060s -0.11 -46.00 0.41 0.05
Archer’s post RCP8.5_2030s -0.06 -25.00 0.06 0.05
Archer’s post RCP8.5_2060s -0.04 -17.00 0.76 0.05
Archers
post
Naromoru
22 Journal of Climate change and Sustainability Volume 1

Omwoyo et al. Journal of Climate change and Sustainability 21
and 1.2% for RCP 4.5 and RCP 8.5 respectively in
the 2060s (Table 2).
Seasonal percentage change with reference to the
baseline (1976-2005) was also done and the results
are as shown in Figure 6. Increasing rainfall trend
was observed in MAM, JJA and SON in the two
stations both for RCP4.5 and RCP8.5, except for
MAM season in Archers Post for RCP 8.5 in 2060s
where decreasing trend was observed. DJF at both
stations was found to have a decreasing trend in the
seasonal totals as compared to the baseline.
(a)
(b)
Figure 6: seasonal percent changes in rainfall
expected in Naromoru (a) and Archer’s Post (b) in
2030s and 2060s with respect to the baseline
3.3 Impact of climate change on streamflow
3.3.1 SWAT model calibration and validation
Sensitivity analysis showed the following parameters
were sensitive and had great impact on simulated
streamflow; The runoff curve number which affects
surface runoff response (r__CN2), base flow
recession factor (ALPHA_BF), groundwater delay
(GW_DELAY) and deep percolation (GWQMN).
Model performance was evaluated using coefficient
of variation (R2), Nash-Sutcliffe efficiency (NSE),
and ratio of the root mean square error to the
standard deviation of measured data (RSR) and the
results are shown in Table 4.
Table 4: SWAT model performance evaluation
results
From the results in Table 4, the model was
considered fit for use in streamflow simulation in the
catchment. As stated by (Moriasi et al., 2007) a
model is considered to be satisfactory if R2 > 0.6,
0.50 < NSE ≤ 0.65 and 0.60 < RSR ≤ 0.70.
3.3.2 Simulated streamflow
Trend in simulated streamflow (Table 5) was found
to increase in 2030s for RCP 4.5 and in 2060s for
RCP 8.5 since the Kendall’s statistic S for the two
scenarios are positive (59 and 33).
Calibration Validation
R2 0.44 0.73
NSE 0.35 0.53
RSR 0.81 0.70
Omwoyo et al. Journal of Climate change and Sustainability 23

Omwoyo et al. Journal of Climate change and Sustainability 21
Table 5: results for Mann Kendall trend test on
simulated streamflow
The trend in RCP 4.5 was significant while in RCP
8.5 it was insignificant. Streamflow in 2060s for
RCP 4.5 and in 2030s for RCP 8.5 was found to be
decreasing with no statistical significance (Table 5).
Percent changes in seasonal streamflow were
analyzed and the results are as shown in Figure 7.
Figure 7: Seasonal percent change of streamflow in
2030s and 2060s with respect to the baseline
As presented in Figure 7, streamflow in MAM
season was found to have a decreasing trend in all
the scenarios with a greater decrease (-26%) being
showed by RCP 8.5 during 2060s and a smaller
percent change (-10%) during 2060s of RCP 4.5. All
the other seasons were found to have an increasing
trend in the streamflow with JJA having a greater
percentage increase (90-114%) as compared to the
other seasons.
A regression of mean annual streamflow percent
changes against mean annual rainfall percent
changes at Naromoru showed that change in rainfall
in all scenarios would significantly influence
streamflow within the catchment. This was due to
the fact that the coefficient of variation (R2) values
were more than 0.8, thereby indicating that over 80%
of the changes in streamflow can be explained by the
changes in rainfall at Naromoru. A regression of
changes in rainfall at Archer’s Post and the
streamflow produced low R2 values (<0.4).
Figure 8: a regression of percent change in rainfall
(Naromoru) on percent change streamflow
R2=0.9213
This means that rainfall received at the upper parts of
UENC catchment contributes most to the streamflow
as indicated by higher R2 values at Naromoru.
Rainfall received at the lower parts of the catchment
contributes least to the streamflow since the R2
values for Archer’s Post were low.
scenario
Kendall’s
Tau
Mann
Kendall
statistic
(S)
2-sided
p value alpha
RCP4.5_2030s 0.14 59.00 0.00 0.05
RCP4.5_2060s -0.02 -7.00 0.90 0.05
RCP8.5_2030s -0.07 -29.00 0.61 0.05
RCP8.5_2060s 0.08 33.00 0.56 0.05
24 Journal of Climate change and Sustainability Volume 1
Omwoyo et al. Journal of Climate change and Sustainability 21
It was also noted that an increase in rainfall in one
season resulted to an increase in streamflow in the
following season while a reduction of rainfall one
season resulted to a decrease in streamflow in the
season that follows. This is evident in figures 6 and 7
whereby a decrease in rainfall DJF season resulted to
a decrease in streamflow in the MAM season.
Similarly, an increase in MAM rainfall resulted to
increased streamflow in the JJA season.
4. CONCLUSION
Climate change scenarios over the catchment
indicated an increasing trend in temperature, both in
RCP4.5 and RCP8.5. The increases were however
much higher in RCP8.5 and was associated to the
fact that RCP8.5 is a higher greenhouse gas emission
scenario with a higher degree of global warming.
Similar findings were also presented in (Chaplot,
2007, Field, 2012). Minimum temperatures were also
found to increase more than maximum temperatures
thus nights are expected to be warmer in future. This
led to the conclusion that without mitigation to
greenhouse gases, higher temperatures are expected,
and therefore low carbon pathways should be
enforced.
Variability in seasonal rainfall was observed during
2021-2080. Rainfall increase in MAM season was
much lower than rainfall increase in JJA, meaning
that activities that used to be carried out in MAM for
example agriculture, could perform well in JJA,
since enough rainfall is expected during this period.
Adaptation measures are therefore encouraged to be
adopted in line with results of this study including
shifting of agricultural activities to JJA.
Streamflow was found to be affected much by
climate change since increase in temperatures are
associated to increase in evapotranspiration, thereby
reducing the amount of surface water available on
land. Variability in rainfall was also found to be
contributing much to the variability in streamflow.
This was evident when a decrease in rainfall in one
season (DJF) led to a decrease in streamflow in the
immediate following season (MAM) and over 80%
of the changes in streamflow was explained by the
changes in rainfall at Naromoru station. Water
conservation measures are therefore recommended in
order to cater for periods of low rainfall and
streamflow amounts.
The study also found out that responses of
streamflow to climate change are catchment specific
since in Upper Ewaso Ngiro Catchment, streamflow
was found to reduce in MAM which is contrary to
other neighboring catchments where studies have
indicated an increase in streamflow in MAM. Since
streamflow response was found to be sensitive to
changes in rainfall, emphasis should be put on water
conservation and catchment management practices
including protection of headwater forests through
agroforestry, afforestation and reforestation in order
to increase the rate of infiltration and recharge of
ground water aquifers.
ACKNOWLEDGEMENT
My sincere gratitude goes to the Governments of
Omwoyo et al Journal of Climate change and Sustainability 25
Omwoyo et al. Journal of Climate change and Sustainability 25
Omwoyo et al. Journal of Climate change and Sustainability 21
Kenya and Australia for providing necessary
financial support through the System for Land-based
Emission Estimation in Kenya (SLEEK) scholarship
programme.
REFERENCES
Abbaspour, K., M. Vejdani and S. Haghighat,
SWAT-CUP calibration and uncertainty
programs for SWAT. in Proceedings of the
MODSIM 2007 International Congress on
Modelling and Simulation, Modelling and
Simulation Society of Australia and New
Zealand, 2007.
Barros, V., C. Field, D. Dokke, M. Mastrandrea, K.
Mach, T. Bilir, M. Chatterjee, K. Ebi, Y.
Estrada and R. Genova, 2014: Climate
Change 2014: Impacts, Adaptation, and
Vulnerability. Part B: Regional Aspects.
Contribution of Working Group II to the
Fifth Assessment Report of the
Intergovernmental Panel on Climate Change.
Bates, B., Z. W. Kundzewicz, S. Wu and J.
Palutikof, 2008: Climate change and water:
Technical paper vi. Intergovernmental Panel
on Climate Change (IPCC).
Chaplot, V., 2007: Water and soil resources response
to rising levels of atmospheric CO 2
concentration and to changes in precipitation
and air temperature. Journal of Hydrology,
337, 159-171.
Cosgrove, W. J. and F. R. Rijsberman, 2014: World
water vision: making water everybody's
business. Routledge.
Dessu, S. B. and A. M. Melesse, 2013: Impact and
uncertainties of climate change on the
hydrology of the Mara River basin,
Kenya/Tanzania. Hydrological Processes,
27, 2973-2986.
Ericksen, P., J. de Leeuw, M. Said, S. Silvestri and
L. Zaibet, 2012: Mapping ecosystem services
in the Ewaso Ng'iro catchment. International
Journal of Biodiversity Science, Ecosystem
Services & Management, 8, 122-134.
Ficklin, D. L., Y. Luo, E. Luedeling and M. Zhang,
2009: Climate change sensitivity assessment
of a highly agricultural watershed using
SWAT. Journal of Hydrology, 374, 16-29.
Field, C. B., 2012: Managing the risks of extreme
events and disasters to advance climate
change adaptation: special report of the
intergovernmental panel on climate change.
Cambridge University Press.
Gichuki, F. N., 2004: Managing the externalities of
declining dry season river flow: A case study
from the Ewaso Ngiro North River Basin,
Kenya. Water resources research, 40.
Giorgi, F., C. Jones and G. R. Asrar, 2009:
Addressing climate information needs at the
regional level: the CORDEX framework.
World Meteorological Organization (WMO)
Bulletin, 58, 175.
26 Journal of Climate change and Sustainability Volume 1
Omwoyo et al. Journal of Climate change and Sustainability 21
Githui, F., W. Gitau, F. Mutua and W. Bauwens,
2009: Climate change impact on SWAT
simulated streamflow in western Kenya.
International Journal of Climatology, 29,
1823-1834.
Gocic, M. and S. Trajkovic, 2013: Analysis of
changes in meteorological variables using
Mann-Kendall and Sen's slope estimator
statistical tests in Serbia. Global and
Planetary Change, 100, 172-182.
Guerreiro, S. B., C. G. Kilsby and F. Serinaldi, 2014:
Analysis of time variation of rainfall in
transnational basins in Iberia: abrupt changes
or trends? International Journal of
Climatology, 34, 114-133.
Hagemann, S., C. Chen, D. Clark, S. Folwell, S. N.
Gosling, I. Haddeland, N. Hannasaki, J.
Heinke, F. Ludwig and F. Voss, 2013:
Climate change impact on available water
resources obtained using multiple global
climate and hydrology models. Earth System
Dynamics, 4, 129-144.
Kathumo, V., C. Gachene, P. Gicheru, P. Kariuki, P.
Okinda-Owuor, E. Banadda, J. Obua and S.
Okoth, Effects of land-use and climate
changes on hydrological processes in the
River Gucha catchment, Kenya. in
Proceedings of the Natural Resources
Management and Land Use. Proceedings of
the Cluster Workshop, Nairobi, Kenya, 30th
November-2nd December 2011., 2011, p.
101-112.
Kendall, M., 1975: Multivariate analysis. Charles
Griffin.
Khisa, P., S. Uhlenbrook, A. van Dam, J.
Wenninger, A. van Griensven and M. Abira,
2013: Ecohydrological characterization of the
Nyando wetland, Lake Victoria, Kenya: a
state of system (SoS) analysis. African
Journal of Environmental Science and
Technology, 7, 417-434.
Kim, J., J. Choi, C. Choi and S. Park, 2013: Impacts
of changes in climate and land use/land cover
under IPCC RCP scenarios on streamflow in
the Hoeya River Basin, Korea. Science of the
Total Environment, 452, 181-195.
Mallakpour, I. and G. Villarini, 2016: A simulation
study to examine the sensitivity of the Pettit
test to detect abrupt changes in mean.
Hydrological Sciences Journal, 61, 245-254.
Mango, L. M., A. M. Melesse, M. E. McClain, D.
Gann and S. Setegen, 2010: Land use and
climate change impacts on the hydrology of
the upper Mara River Basin, Kenya: results
of a modeling study to support better
resource management.
Mann, H. B., 1945: Nonparametric tests against
trend. Econometrica: Journal of the
Econometric Society, 245-259.
Mati, B. M., S. Mutie, H. Gadain, P. Home and F.
Mtalo, 2008: Impacts of land‐use/cover
Omwoyo et al Journal of Climate change and Sustainability 27
Omwoyo et al. Journal of Climate change and Sustainability 27

Omwoyo et al. Journal of Climate change and Sustainability 21
changes on the hydrology of the
transboundary Mara River, Kenya/Tanzania.
Lakes & Reservoirs: Research &
Management, 13, 169-177.
Moriasi, D. N., J. G. Arnold, M. W. Van Liew, R. L.
Bingner, R. D. Harmel and T. L. Veith, 2007:
Model evaluation guidelines for systematic
quantification of accuracy in watershed
simulations. Transactions of the ASABE, 50,
885-900.
Moss, R. H., J. A. Edmonds, K. A. Hibbard, M. R.
Manning, S. K. Rose, D. P. Van Vuuren, T.
R. Carter, S. Emori, M. Kainuma and T.
Kram, 2010: The next generation of scenarios
for climate change research and assessment.
Nature, 463, 747-756.
Mutiga, J., S. Zhongbo and T. Woldai, 2011:
Impacts of agricultural intensification
through upscaling of suitable rainwater
harvesting technologies in the upper Ewaso
Ng'iro North basin, Kenya. Hydrology and
Earth System Sciences Discussions, 8, 2477-
2501.
Neupane, R. P., J. D. White and S. E. Alexander,
2015: Projected hydrologic changes in
monsoon-dominated Himalaya Mountain
basins with changing climate and
deforestation. Journal of Hydrology, 525,
216-230.
Ngigi, S. N., H. H. Savenije and F. N. Gichuki,
2008: Hydrological impacts of flood storage
and management on irrigation water
abstraction in upper Ewaso Ng’iro river
basin, Kenya. Water resources management,
22, 1859-1879.
Notter, B., L. MacMillan, D. Viviroli, R.
Weingartner and H.-P. Liniger, 2007:
Impacts of environmental change on water
resources in the Mt. Kenya region. Journal of
Hydrology, 343, 266-278.
Peters, G. P., R. M. Andrew, T. Boden, J. G.
Canadell, P. Ciais, C. Le Quéré, G. Marland,
M. R. Raupach and C. Wilson, 2013: The
challenge to keep global warming below 2 C.
Nature Climate Change, 3, 4-6.
Pettit, A., 1979: A non-parametric approach to the
change-point problem. Applied statistics,
126-135.
Radivojevic, A. R., N. M. M. Bursac, M. J. Gocic, I.
M. Filipovic, M. A. Pavlovic, M. M.
Radovanovic, L. S. Stricevic and M. R.
Punisic, 2015: STATISTICAL ANALYSIS
OF TEMPERATURE REGIME CHANGE
ON THE EXAMPLE OF SOKOBANJA
BASIN IN EASTERN SERBIA. Thermal
Science, 19, S323-S330.
Rwigi, S., N. J. Muthama, A. Opere and F. J. Opijah,
2016: Assessment of Potential Changes in
Hydrologically Relevant Rainfall Statistics
over the Sondu River Basin in Kenya Under
a Changing Climate. J. Meteorol.
28 Journal of Climate change and Sustainability Volume 1

Omwoyo et al. Journal of Climate change and Sustainability 21
Schneider, C., C. Laizé, M. Acreman and M. Florke,
2013: How will climate change modify river
flow regimes in Europe? Hydrology and
Earth System Sciences, 17, 325-339.
Tao, B., H. Tian, W. Ren, J. Yang, Q. Yang, R. He,
W. Cai and S. Lohrenz, 2014: Increasing
Mississippi river discharge throughout the
21st century influenced by changes in
climate, land use, and atmospheric CO2.
Geophysical Research Letters, 41, 4978-
4986.
Trenberth, K. E., 2011: Changes in precipitation with
climate change. Climate Research, 47, 123.
Van Vuuren, D. P., J. Edmonds, M. Kainuma, K.
Riahi, A. Thomson, K. Hibbard, G. C. Hurtt,
T. Kram, V. Krey and J.-F. Lamarque, 2011:
The representative concentration pathways:
an overview. Climatic change, 109, 5-31.
Vörösmarty, C. J., P. Green, J. Salisbury and R. B.
Lammers, 2000: Global water resources:
vulnerability from climate change and
population growth. science, 289, 284-288.
Willy Bauwens, F. G., Francis Mutua, Wilson Gitau,
2009: Climate change impact on SWAT
simulated streamflow in western Kenya.
INTERNATIONAL JOURNAL OF
CLIMATOLOGY, 19, 1823–1834.
Wu, Y., S. Liu and A. L. Gallant, 2012: Predicting
impacts of increased CO 2 and climate
change on the water cycle and water quality
in the semiarid James River Basin of the
Midwestern USA. Science of the Total
Environment, 430, 150-160.
Omwoyo et al Journal of Climate change and Sustainability 29
Omwoyo et al. Journal of Climate change and Sustainability 29