Embed Size (px)
Citation preview
Simulation and Field-Testing of Hybrid Ultra-Capacitor/Battery Energy Storage Systems for Electric and Hybrid-Electric Transit Vehicles
Joel R. Anstrom, Benjamin Zile, Kandler Smith Department of Mechanical Engineering
The Pennsylvania State University University Park, PA
Abstract-- This paper investigates the use of ultra-capacitors combined with batteries as an improved energy storage system for electric, hybrid electric, and hybrid fuel cell transit vehicles. A demonstrator hybrid eIectric vehicle with an ultra-capacitor system was constructed and used to validate simulations. Results suggest a significant reduction in peak currents experienced by the battery pack in drive cycles with a high number of starts and stops.
1. INTRODUCTION
Hybrid Electric Vehicles (HEVs) have already been produced in the form of consumer automobiles and mass transit buses [I]. However, the combination of limited battery technology and high power requirements of HEVs has hindered the success of these vehicles. One way to reduce the demand on HEV batteries is to use ultra-capacitors as load-leveling devices for the batteries [2-41. The relatively high power density of ultra-capacitors should allow for a significant reduction in the power fluctuations imposed on the batteries in HEVs, thereby reducing peak battery currents and extending battery life. As secondary benefits, ultra-capacitors may improve overall energy storage system efficiency and regenerative braking power levels. This paper describes the results and conclusions o f a project in which the use of ultra- capacitors in conjunction with batteries as an energy storage system for mass transit vehicles is studied.
11. METHODS
A bidirectional DC-DC converter, shown in Fig. 1, was constructed to provide the means for energy to be transferred back and forth from ultra-capacitors to the DC bus of the hybrid electric vehicle [ M I . The inductor i5 0.36mH, and is rated at 500A peak. The ferromagnetic core of the inductor consists of 2 sets of Metglasm PowerLiteB AMCC-I000 amorphous iron C-cores. Multiple gaps were cut into the C- cores in order to reduce the proximity effect on the winding losses. An ultra-capacitor bank consisting of 4 3F, lSOV EcondTM ultra-capacitors was constructed and is also shown in Fig. 1. Experimental results revealing a complete discharge and charge of the ultra-capacitor bank are shown in Fig. 2.
The control strategy calculates a current request for the ultra- capacitor DC-DC converter as a function of the total current demand on the hybrid energy storage system (ESS), the vehicle speed, and the ultra-capacitor state-of-charge (SOC). Fig. 3 is a schedule of the current contribution from the capacitors as a function of total current demand. In addition, a
Heath Hofmann, Amit Batra Department of Electrical Engineering
The Pennsylvania State University University Park, PA
small amount of current is commanded based on vehicle speed to prepare the ultra-capacitors to deliver high power during acceleration and accept high power during regenerative braking. The controller targets a capacitor SOC of 20% at 0 mph and 70% at 55 mph by commanding small currents up to 20 Amps. The control strategy was developed concurrently with that of the demonstrator vehicle shown in Figure 4. The vehicle is a range-extending series hybrid with a 144 V nominal battery pack, a 15 kW auxiliary power unit, and an ultra-capacitor energy storage system installed in a small trailer with the goal of reducing average and peak battery currents over a wide variety of driving cycles.
1 I
Figure I . Bidirectionai DC-DC converter: converier circuit (top), capacitor bank (middle left), converter (middle right), inductor (bottom)
0-7803-8975- l/O5/%20.O0 a2005 IEEE. 49 I

Time [Sec]
Figure 2. Ultra-capacitor bank chargeidischarge using bi-directional DC-DC converter
Figure 3, Capacitor current contribution schedule
- DC BY. + -DC 0". I
Figure 4. Ford Escort series hybrid conversion with ultra-capacitor energy storage system shown at the PTl Test Track
This vehicle was tested on a Clayton model ASMFS96 dynamometer on three transit driving cycles recommended by the Society of Automotive Engineers (SAE) Standard 5271 1, the recommended practice for measuring fuel economy and emissions of hybrid electric and conventional heavy-duty vehicles: the Manhattan Cycle, the Orange County (O.C.) Cycle, and the Urban Dynamometer Driving Schedule (UDDS) Cycle.
111. TESTING
Figs. 5 and 6 show dynamometer test results of the hybrid vehicle performing the Manhattan driving cycle. The Manhattan driving cycle is a series of rapid starts and stops typical of urban transit routes with the bus accelerating to a top speed of approximately 25 mph. Fig. 5 shows hybrid vehicle results without ultra-capacitors activated. It can be seen that battery current typically peaks at 100-150 Amps during hard acceleration. The APU generates 20 to 40 Amps to maintain the battery state of charge. Note that in this test, a problem with the battery SOC meter caused loss of APU operation at about 800 seconds. This is not an issue since the Manhattan Cycle repeats the same velocity trace every 550 seconds and a full trace was complete before the problem occurred. By comparison, Fig. 6 shows the same cycle with ultra-capacitors activated. it can be seen that, under these conditions, the battery current exceeds 100 Amps only twice. The combined current of the APU and ultra-capacitors maintains battery voltage in a very narrow range even though large currents are drawn from the DC bus during hard acceleration. From this data it can be observed that the addition of ultra-capacitors to a hybrid electric vehicle reduced the levels and duration of peak battery loads during both charge and discharge on urban transit routes with heavy transient loads.
Figs. 7 and 8 show results of dynamometer tests of the hybrid vehicle mnning the Orange County driving cycle. The Orange County driving cycle is a series of starts, short cruise periods, and stops typical of commuter transit routes with the bus accelerating to a top speed of 30 mph. Fig. 7 shows hybrid vehicle resuits without ultra-capacitors activated. It can be seen that battery current peaks at 100-150 Amps during hard acceleration. By comparison, Fig. 8 shows the same cycle in with ultra-capacitors activated. It can be seen that, under these conditions, the battery current upper limit is 100 Amps. From this data it can be observed that the addition of ultra- capacitors to a hybrid electric vehicle significantly reduces battery peak currents on commuter transit driving cycles with intermittent levels of transient load.
Figs. 9 and 10 show dynamometer tests of the hybrid vehicle performing the UDDS driving cycle. The UDDS driving cycle is a series of accelerations to the speeds of secondary and highway routes with significant periods of cruising typical of arterial transit routes. The driving cycle has a top speed of 56 mph. It can be seen that battery current has periods of 100
492

Amps during cruising and peaks of 150 Amps during hard acceleration. By comparison, Fig. 10 shows the same cycle with ultra-capacitors activated. During sustained cruising, the capacitors quickly become discharged. Battery currents of 100 Amps are once again experienced. Peak currents during acceleration are somewhat reduced below 150 Amps. This data shows that the addition of ultra-capacitors to a hybrid electric vehicle on a highway route reduced peak currents on initial acceleration but did little to reduce sustained loads during periods of cruising.
Figs. 11 and 12 show data of the hybrid vehicle performing a modified driving cycle that combines the Central Business District Cycle (CBD), Commuter Cycle, and Arterial Cycle at the Pennsylvania Transportation Institute test track facility. The CBD cycle consists of seven short accelerations per mile up to 20 mph. The Commuter Cycle is two accelerations per mile up to 30 mph. The Arterial Cycle is a single acceleration per mile up to 30 mph. Fig. 11 shows a test with one CBD cycle followed by one Commuter and one Arterial cycle without the ultra-capacitors activated. Periods of high acceleration produce peak currents near 150 Amps and periods of cruising produce sustained 100 Amp currents. Fig. 12 shows a test with four CBD cycles followed by one Commuter and one Arterial cycle with ultra-capacitors activated. This cycle is an excellent illustration of the effect that an ultra- capacitor system can have on battery currents. Peak currents are grcatly reduced during the rapid and shallow accelerations of the Central Business District cycle. The short periods of cruising of the Commuter cycle cause deep discharge of the capacitors and higher battery currents. The Arterial Cycle shows complete discharge of the capacitors during cruising speeds according to the state of charge control strategy. The low capacitor state of charge allows the system to recover significant energy during regenerative braking from higher speeds.
Time [Sec] I
VI , , , , , , , , , , , , m
a 200 400 sm im im rim im iaa 1800 2000 2200 - Time ISec] G m , , . . , . . , . , . .
Time {Sec1
Figure 6. Manhattan Cycle with ultra-capacitors enabled
T m ISecl
T h $SKI
Figure 7. Orange County Driving Cycle with ultra-capacitors disabled
I
TimelSeCl
Figure 5 . Manhattan Cycle withaut ultra-capacitors disablcd
TImalSSCI
Figure 8. Orange County Driving Cycle with ultra-capacitors enabled
493

......... ~. " . ~ ........................ i . . . ... :..
n-m I W
Figure 9. UDDS Driving Cycle with ultra-capacitors disabled
- 1 ' " ZiWt I ' I. . ' '
. . . . . . . . . . . . . . . . . . . . . . . . . , . . , . ,
Figure 12. Combined test track dnving cycle with ultra-capacitors enabled
IV. SIMULATION
Data from the chassis dynamometer runs of the 1992 Ford Escort demonstrator vehicle presented in the prequel, as well as experimental data taken from an AVS electric transit bus (without an ultra-capacitor energy storage system) provided by the Chattanooga Area Regional Transit Authority (CARTA), provided information for validation of a U S DOE PSAT (PNGV Systems Analysis Toolkit) simulation of electric and hybrid-electric mass transit vehicles with ultra-capacitor energy storage systems.
Fig. 13 presents a comparison of the measured and simulated bus voltage of the CARTA bus during the second quarter of the CARTA drive cycle. The purpose of this simulation was to validate the bus model. Comparison of the experimental data with the PSAT simulation reveals close agreement.
AVS Bus Vatidation t
.................................... . . .
- ..... ~ ..... l f l - - - ..
. *. , - -__
...........
...........
i 1 2 0 0
I Figure 13. Comparison of PSG'S
voltage of CARTA electric transit bus
. " ---- dation and measured banery pack ring second quarter of CARTA drive
cycle
494
Additional validation was conducted on the ultra-capacitor energy storage system. Prior to simulating the ultra-capacitor system on a vehicle level, a stand-alone version of the ultracapacitor/DC-DC converter model was created for validation purposes. Inputs to the stand-alone model were bus voltage and a desired current output. Outputs from the model were ultracapacitor voltage and actual output current. The inputs were fed into the model directly from experimental data. Fig. 14 presents a comparison of the PSAT simulator to the Orange County driving cycle data presented in Fig. 8. We note that the simulated ultra-capacitor voltage deviates from the experimental value over time. This could be due to a slight DC current error between experiment and simulation, which would cause a gradual discharge of the ultracapacitors.
a e 5 - r
Simulation underpradlds cap vdtag%
TkTd lskl
Figure 14 Validation of PSAT simulation w ~ t h Orange County Driving Cycle
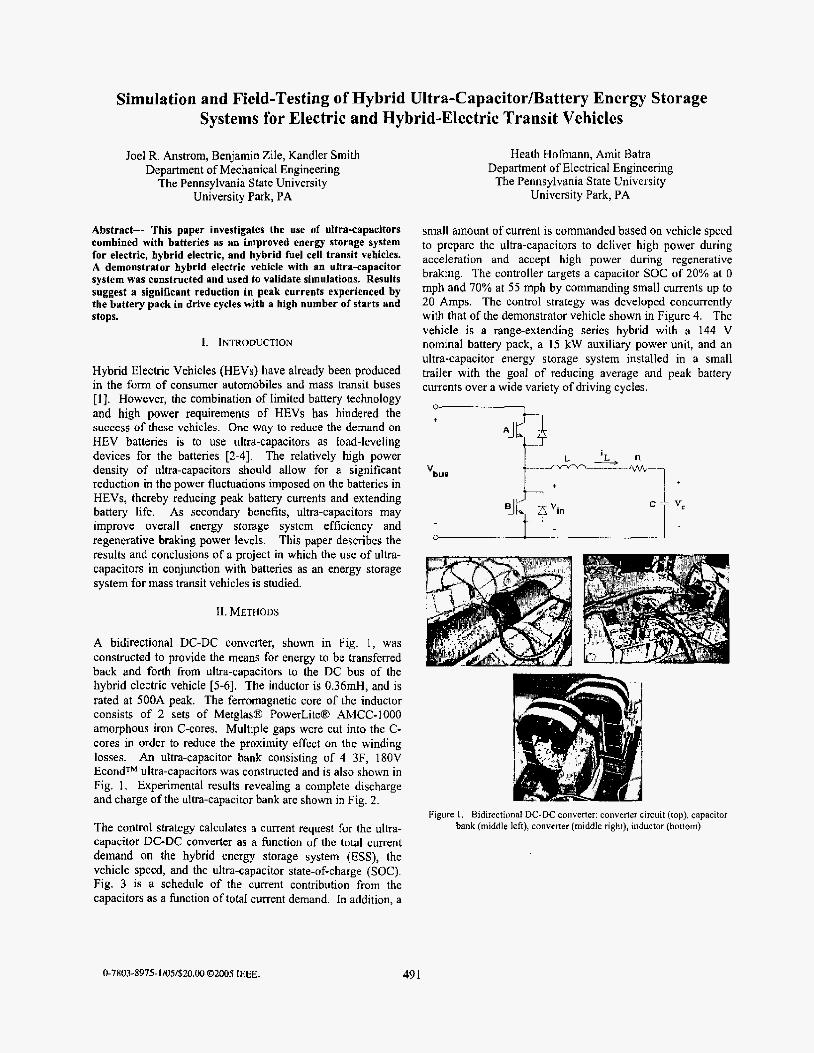
Ultracap. Bank Equivalent Cap. [F] 6 Ultracap. Bank Equivalent ESR (n) 0.5
420 Ultracap. Bank Mass [kgJ DUDC Converter Mass [kg] 50
After validation of the PSAT model was completed, extensive simulations of the 52711 standard driving cycles were conducted on a hybrid electric bus design in order to make general conclusions regarding the benefits of ultra-capacitor storage systems. The details of the hybrid electric bus model, both with and without an ultra-capacitor energy storage system, can be found in Table 1.
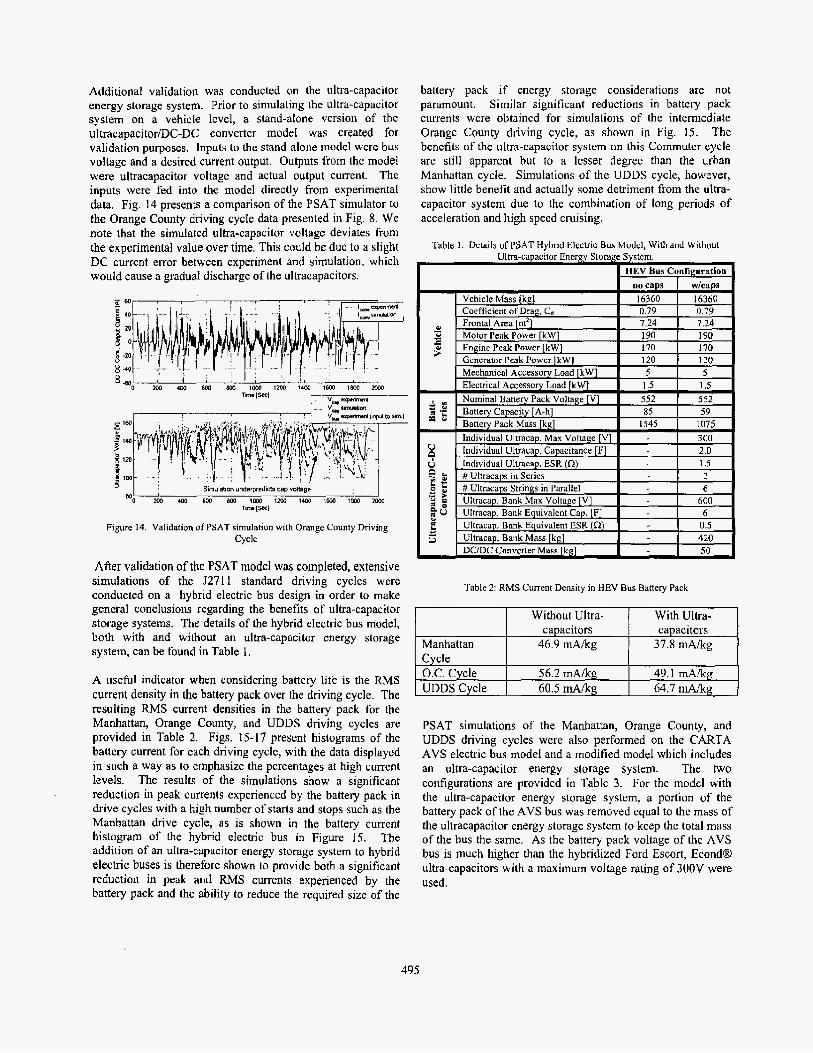
A useful indicator when considering battery life is the RMS current density in the battery pack over the driving cycle. The resulting RMS current densities in the battery pack for the Manhattan, Orange County, and UDDS driving cycles are provided in Table 2. Figs. 15-17 present histograms of the battcry current for each driving cycle, with the data displayed in such a way as to emphasize the percentages at high current levels. The results of the simulations show a significant reduction in peak currents experienced by the battery pack in drive cycles with a high number of starts and stops such as the Manhattan drive cycle, as is shown in the battery current histogram of the hybrid electric bus in Figure 15. The addition of an ultra-capacitor energy storage system to hybrid electric buses is therefore shown to provide both a significant reduction in peak and RMS currents experienced by the battery pack and the ability to reduce the required size of the
battery pack if energy storage considerations are not paramount. Similar significant reductions in battery pack currents were obtained for siniulations of the intermediate Orange County driving cycle, as shown in Fig. 15. The benefits of the ultra-capacitor system on this Commuter cycle are still apparent but to a lesser degree than the urban Manhattan cycle. Simulations of the UDDS cycle, however, show little benefit and actually some detriment from the ultra- capacitor system due to the combination of long periods of acceleration and high speed cruising.
Table 1 . Details of PSAT Hybrid Electric Bus Model, Wrth and Without Ultra-capacitor Energy Storage System.
HEV BUS Configuration nncanc I wirsna
Individual Ultracap. Max Voltage [VI 300 [ndividual Ultracap. Capacitance [F] 2.0 Individual Ultracap. ESR (0) 1 . 5 # Ultracaps in Series 2
E 0 # Ultracaps Strings in Parallel I I 6 I 600 .- E Ultracap. Bank Max Voltage [VI
Table 2: RMS Current Density in HEV Bus Battery Pack
Without Ultra- With Ultra-
Manhattan 46.9 mAkg 37.8 mAkg
60.5 mA/k 64.7 mAik
PSAT simulations of the Manhattan, Orange County, and UDDS driving cycles were also performed on the CARTA AVS electric bus model and a modified model which includes an ultra-capacitor energy storage system. The two configurations are provided in Table 3. For the model with the ultra-capacitor energy storage system, a portion of the battery pack of the AVS bus was removed equal to thc mass of the ultracapacitor energy storage system to keep the total mass of the bus the same. As the battery pack voltage of the AVS bus is much higher than the hybridized Ford Escort, Econdm ultra-capacitors with a maximum voltage rating of 300V were used.
495

f ’ i J . .. * I CumEd (Ampi;) -.” -.-&k”%r-r-.L---J- ~
Figure I5 Battery Current Histograms of HEV Bus Model with and without Ultra-capacitor Energy Storage System, Manhattan Dnve Cycle. Data IS
displayed to emphasize percentages at high current tevels
H y b d Elactnc Bus - Omega County Cycle
Vehicle Mass [kg] 2 Coefficient of Drag, Cd
i Cunent [Amps)
nocspr f wfcaps
0.6 1 0.6 10000 I LOO00
Figure 16. Battery Current Histograms of HEV Bus M d e l with and without Ultra-capacitor Energy Storage System, Orange County Drive Cycle. Data is
disptayed to emphasize percentages at high current levels.
Manhattan Cycle Orange County Cycle UDDS Cycle
Histograms of the battery current levels in the two electric bus configurations for the Manhattan and Orange County driving cycles are shown in Figs. 18 and 19. The results show a significant reduction in peak battery currents and battery pack voltage swings in the Manhattan cycle, with the effect lessening in the Orange County cycle. In all cycles, the ultracapacitor system absorbs essentially all regenerative braking currents. The RMS current in the battery pack of the EV bus models with and without ultracapacitors is shown in Table 4. Because the battery packs of the bus models with and without ultracapacitors have different capacities, the EWS current per unit mass of the two packs is presented in Table 5 to allow direct comparison.
Without Ultracapacitors With Ultracapacitors 34.lmAk.g 28.6mAikg 43.1 mAkg 4 1 .I M k g 56.2mAkg 57.8“g
1 Current @TIPS]
Figure 17. Battery Current Histograms of HEV Bus Model with afld without Ultra-capacitor Energy Storage System, UDDS Drive Cycle. Data is
displayed to emphasize percentages at high current levels.
Table 3. CARTA AVS 22’ EV bus configurations, with and without ultra-capacitor energy storage system
l-zz-l Bus ConA uration
Table 4. RMS current of AVS EV Bus Battery Pack
I Without Ultracapacitors I With Ultracapacitors 99.1 A I 73.8 A 125 d A
1 UDDSCycle I 163.5 A I 149.0 A
Table 5 . RMS Current per Kilogram of AVS EV Bus Battery Pack
496

$ 0 cumnt W P S )
*-- ---- Figure 18 Battery Currents Histograms of AVS EV Bus Model with and without Ultracapacitor Energy Storage System, Manhattan Dnve Cycle .
Data IS displayed to emphasize percentages at hlgh current levels
" Current W I P S ) i Figure, 19. Battery Currents Histograms ofAVS EV Bus Model with and
without Ultracapacitor Energy Storage System, Orange County Drive Cycle. . Data is displayed to emphasize percentages at high current levels
The results show a reduction of RMS current per kilogram of 16% in the Manhattan driving cycle, 5% in the Orange County driving cycle, and an increase of 3% in the UDDS cycle. That the benefits of the ultracapacitors are more markedly shown in the Manhattan cycle is expected due to the larger number of starts and stops. It is worth remarking that the bus model with the ultracapacitor system has a reduced battery pack size of approximately 1 I%, which can also be considered a benefit. However, the reduced capacity of the battery pack, which occurred due to the assumption o f conserving mass when adding the ultracapacitors, could be a concern for pure electric buses.
V. CONCLUSIONS
The results of this project suggest that an ultra-capacitor energy storage system can offer significant reduction to the RMS and peak battery currents in etectric and hybrid-electric mass-transit vehicfes operating in driving cycles that consist of a large number of starts and stops, such as the Manhattan driving cycle. The benefits of an ultra-capacitor energy storage system are perhaps somewhat understated in this work. To allow direct comparison, simulations with and without ultra-capacitors used the same regenerative braking scheme, where regenerative braking takes up 50% of total braking. With an ultra-capacitor energy storage system, the electrical system could handle a higher percentage of regenerative braking, thus improving the efficiency of the overall system. Furthermore, it is believed that additional optimization of both the ultra-capacitor energy storage system and the energy management controller for specific vehicle configurations and drive cycles could yield significant improvements in performance. Future work in this area should address these Issues.
REFERENCES [ l ] Jones, W.D., New York wants more hybrid buses on the city's streets, IEEE Spectrum, Vol. 37, No. 9, Sept. 2000, pp. 36 [2] Cahela, D.R.; Tatarchuk, B.J., Overview of electrochemical double layer capacitors, International Conference on Industrial Electronics, Control, and Instrumentation, November 1997, Vol. 3, pp. 1068 - 1073 [3] Yan, X.; Patterson, D., Improvement of drive range, acceleration and deceleration performance in an electric vehicle propulsion system, 30* Annual IEEE Power Electronics Specialists Conference, Vol. 2, JuIy 1999, pp. 638
[4] Brandhorst, H.W., Jr.; Zheng Chen , Achieving a high pulse power system through engineering the battery-capacitor Combination, The Sixteenth Annual Battery Conference on Applications and Advances, Jan. 2001, pp. 153 ~ 156 [ 5 ] King, R.D.; Salasoo, L.; Schwartz, J.; Cardinal, M.; Ultra- CapacitorBattery Electronic Interface Development, Final Report, General Electric Company, June 1998 [6] Amet, B.J.; Haines, L.P., High power DC-to-DC converter for supercapacitors, IEEE International Electric Machines and Drives Conference, June 2000, pp. 985 - 990
- 643
497