Embed Size (px)
Citation preview

SIMULATION BASED EVALUATION ON THE EFFECTS OF
JAYWALKING
by
Roy J. Wang
A thesis submitted to the Faculty of the University of Delaware in partial fulfillment of the requirements for the degree of Master of Civil Engineering
Summer 2009
Copyright 2009 Roy J. Wang All Rights Reserved


ACKNOWLEDGMENTS
I would like to thank my advisor and mentor, Earl “Rusty” Lee. Without
his guidance, this thesis would never have been possible. Throughout my journey here
at the University of Delaware, he has given nothing but encouragement, praise, and
support.
I would also like to thank my family, friends, and loved ones. They have
always helped me in my time of need and given me their blessing in all my choices
throughout my life. Thank you for everything.
iii

TABLE OF CONTENTS
ACKNOWLEDGEMENTS .......................................................................................... iii TABLE OF CONTENTS .............................................................................................. iv ABSTRACT ................................................................................................................... 1 CHAPTER 1 INTRODUCTION .................................................................................... 3 CHAPTER 2 LITERATURE REVIEW ......................................................................... 6 CHAPTER 3 DATA COLLECTION ........................................................................... 12 CHAPTER 4 METHODOLOGY ................................................................................. 18 CHAPTER 5 RESULTS ............................................................................................... 25 CHAPTER 6 CONCLUSIONS AND FUTURE WORK ............................................. 30 BIBLIOGRAPHY ........................................................................................................ 34 APPENDIX A PEDESTRIAN DATA COLLECTION ............................................... 37 APPENDIX B TRAFFIC COUNT DATA .................................................................. 45 APPENDIX C CALCULATIONS ............................................................................... 52 APPENDIX D DATA AND HISTOGRAMS .............................................................. 68
iv

1
ABSTRACT
Jaywalking is a behavior that exposes the pedestrian to a high-risk
condition and induces delay for vehicular traffic. The focus of most pedestrian
research has been on the issue of safety. The goal of this research is to measure the
impact on travel time and delay for vehicle traffic due to pedestrians who are crossing
traffic, including jaywalkers. By using a micro-simulation software, VISSIM, the
differences in travel time and delay time have been measured for a series of pedestrian
scenarios. Data was collected in Newark, DE along East Main Street, a section of
roadway serving many attractions near to the University of Delaware. Vehicle and
pedestrian volumes and pedestrian crossing locations were observed and recorded
during the midday peak hour.
Four scenarios were created in order to compare the effect of pedestrians
and jaywalkers. This first scenario was titled the Base Case scenario and contained
just the vehicle volumes and the signal timings for the main intersections. The Case 1
scenario introduced pedestrians at only the signalized crosswalks, which were located
at each major intersection. Next, the Case 2 scenario contained the marked midblock
crossings in addition to the already existing signalized crosswalks from Case 1.
Finally, the Case 3 scenario contained jaywalkers, where pedestrians were free to
cross wherever and whenever they appeared in the data collection. This scenario had
several paths along East Main Street to allow pedestrians to cross freely with the right
of way, in order to simulate jaywalking. In each case, pedestrian volumes were
balanced to ensure the same total number of pedestrians were crossing.

The results showed that when pedestrians are legally crossing at the
signalized locations, they do not obstruct traffic. However, when pedestrians are
allowed to cross at the marked midblock crossings, there is a significant increase in
travel time and delay when compared to a network with no pedestrians. This was also
true when comparing the Base Case to the one with pedestrians and jaywalkers
scattered throughout. Finally, we compared the jaywalking network to the network
with pedestrians crossing legally at crosswalks and discovered that the addition of
jaywalkers does have a significant impact on the travel time and delay of oncoming
motorists.
2

3
Chapter 1
INTRODUCTION
Regardless of the mode of transportation that is taken, all roadway users
hope to experience a minimal amount of delay and travel time. As a driver, one must
often yield to pedestrians, especially when making right turns, resulting in increased
delay. The same applies to pedestrians that arrive at an intersection and experience a
DON’T WALK phase from the signal. These individuals are experiencing delays as
they yield to motorists that are currently traveling through the segment of roadway
which they intend to cross. As a result, a tradeoff exists between pedestrians and
drivers that balance the delay that they experience from the intersection or roadway
segment. With this in mind, some roadway users may attempt to reduce their
experienced delay by taking a more direct approach to reach their destination. A
pedestrian may decide to jaywalk if their destination is directly across the roadway,
there is no crosswalk nearby, and the vehicular flow is deemed suitable. This is mainly
true because pedestrian street-crossing behavior is responsive to the street
environment (Chu 2004).
Jaywalking is described in two ways. One is the act of crossing outside of
a delineated crosswalk. The other is the act of crossing within the crosswalk but
during a flashing or solid DON’T WALK phase of the pedestrian signal. Akin and
Sisiopiku (2007) have provided similar definitions when discussing pedestrian
crossing compliance and have classified each as spatial and temporal crossing

4
compliance, respectively, and these classifications to describe jaywalking will be used
in this thesis.
Many past studies have been focused on pedestrian crossing behavior.
These studies have evaluated the effectiveness of crosswalks, in terms of location and
usage, as well as the efficiency of pedestrian signal phasing that informs the
pedestrians of when it is safe to traverse a crosswalk. In addition, most past research
analyzed the safety concerns for pedestrians when crossing the road. The size of the
pedestrian population makes it difficult to predict the behavior of each individual. One
common trait about the pedestrian population is their intolerance for delay.
If a pedestrian crosses the road away from a crosswalk, the driver is not
expecting an obstruction along the open roadway. As a driver approaches a crosswalk,
they are more aware of the possibility that there could be a pedestrian crossing at that
time. This is especially true with marked crosswalks, as they are generally associated
with traffic signals and located at intersections where drivers use greater caution and
lower driver speeds, when compared with unmarked crossings (Van Houten,
McCusker et al. 2003). In general it can be said that most spatial jaywalking is
occurring at the points furthest from the marked locations. The midblock dart-out [by
a pedestrian] is by far the most common pedestrian-related accident type, accounting
for one-third of all pedestrian accidents (Knoblauch, Tobey et al. 1984).
This research will take a different approach to the issue of jaywalking.
Rather than analyze the safety issues associated with jaywalking, this research will
determine the vehicular delays experienced by motorists due to pedestrian crossings.
A pedestrian establishes a minimum critical gap and associated safety
margin before crossing the street. As vehicles approach, each gap between them

5
commonly referred to as headway, is evaluated and the gap is either accepted or
rejected for crossing. If the gap is rejected, the next one is considered. This is known
as the Gap-Acceptance Theory (Palamarthy, Mahmassani et al. 1994). However in the
event that the pedestrian miscalculates the gap and decides to cross anyways, the
driver is forced to decelerate in order to avoid collision with the pedestrian. This
deceleration translates to delay that is experienced by the motorist, as well as
following vehicles that are also forced to slow down. This amount of delay will be
compared among different scenarios that incorporate a base case that involves no
pedestrians on the network, scenarios with pedestrians only along the designated
crosswalk areas, and the real-life scenario with pedestrians crossing freely. This will
give us the opportunity to determine the increase in delay associated with strictly
jaywalkers, when it is compared with the legally crossing pedestrians.
The basic premise of this research is that jaywalking causes the largest
increases in delay for the vehicles. This premise will be proved or disproved by the
data and analysis. Consideration of jaywalking as a delay source as well as a safety
issue may become a useful aspect for consideration by traffic engineers as they
evaluate transportation corridors.

6
Chapter 2
LITERATURE REVIEW
As stated in the introduction, most of the past pedestrian related research
has been focused on pedestrian movement or crossing behavior. Often, these analyses
evaluate the issues of safety and delay experienced only by the pedestrians. Few have
included jaywalking.
Pedestrian behavior is generally unpredictable. Due to the diversity of
pedestrians in regards to age and physical ability, their characteristics differ from
group to group. However, it can be said that in general, all pedestrians are concerned
with travel time and delay. In fact, about 75% of pedestrians feel that they should have
to wait one minute or less before crossing the street upon arrival of the curb edge
(Fitzpatrick, Ullman et al. 2004). Increased or unexpected delays can result in more
frequent jaywalking. Jason and Liotta (1982) discovered that under non-facilitating
crossing conditions, pedestrians are more likely to jaywalk. Non-facilitating crossing
conditions occur when a pedestrian crosses one leg of an intersection and then must
wait 30 seconds before the WALK phase in order to cross the second leg. By
increasing the delay that the pedestrians experienced, more of them were willing to
cross regardless of the current phase.
Jaywalking can also occur when pedestrians cross the street outside of a
designated crosswalk. Akin and Sisiopiku (2007) conducted a study to determine the
pedestrian crossing compliance when approaching signalized crosswalks. While
performing the pedestrian count, the number of jaywalkers was also recorded in order

7
to determine the spatial compliance of each crosswalk, specifically the number of
pedestrians that were actually using it. They found that the average spatial
compliance rate for crossing within the crosswalk was only 83.1%. In addition, the
compliance of pedestrians to cross only when a WALK phase is encountered was
defined as the temporal compliance. It was determined that the average temporal
compliance rate was a mere 50.6%. This shows that pedestrians are often crossing
whenever they feel is more convenient, in order to reduce delay of waiting for a
WALK phase or traveling to the nearest crosswalk to traverse the road safely.
Although this study focuses on pedestrian crossing behavior and discusses jaywalking,
it does not analyze the effects that the behavior will have on approaching vehicles.
In another study, Kim, Brunner, and Yamashita (2008) analyzed
pedestrian and driver behavior in order to examine patterns of violation and
compliance in regards to crosswalks. Drivers were evaluated on whether or not they
fully yielded to pedestrians that are within the crosswalks, while pedestrians were
evaluated on whether they crossed within the crosswalk boundaries and if they obeyed
the pedestrian signal. The authors determined that the most common driver violation
occurred at unsignalized midblock crossings when drivers did not stop for pedestrians
waiting to cross at the crosswalk. Only 43% of drivers fully complied when yielding
to pedestrians, ensuring that they had cleared the road completely before passing
through the crosswalk. For pedestrians, it was found that the most common type of
violation was crossing outside of the crosswalk, also referred to in this paper as spatial
jaywalking. This study provided useful information in support of this research because
it noted specifically that jaywalking was the most common violation. Also, it analyzed
both pedestrian and driver behavior when approaching a crosswalk. This research

8
differs from Kim, Brunner et al. (2008) because rather than considering pedestrian and
driver behavior as two separate factors, it will determine the direct impact of
jaywalking on the delay experienced by the drivers.
From these studies, it could be determined that pedestrians were often
crossing at locations that they consider safe, regardless of whether or not a crosswalk
is present. Also, a significant amount of drivers are improperly yielding to pedestrians
at crosswalks. In fact, only 30.7% of vehicles wait for pedestrians to clear the
walkway before proceeding (DeVeauuse, Kim et al. 1999). As a result, a tradeoff
exists between delays experienced by pedestrians, and those experienced by drivers.
One study from the University of Science and Technology of China, Hefei
focused on the effects a pedestrian has on the flow of traffic. Jiang, Wu, and Li (2002)
conducted a study analyzing how a pedestrian crossing the roadway affected the flow
of traffic. They developed a mathematical model to determine the change in roadway
capacity as a pedestrian impedes the flow of traffic. In their study, the basic scenario
was of a pedestrian waiting to cross the road, while a vehicle is approaching. They
established that the pedestrian would cross if the speed of the approaching driver and
their distance from the pedestrian would provide enough time to safely cross the lane
of travel (assumed to be 0.5 sec). Also, they considered that in the event a vehicle
approaches a pedestrian in the roadway, the vehicle would stop, as if there is a
roadblock ahead, until the pedestrian exits the travel lane. After completing their
analysis, they discovered that if the average headway between vehicles is either small
or large, then the capacity of the roadway remains unchanged. However, in the event
that the headway between vehicles is intermediate, then the capacity is greatly affected
by the addition of pedestrians (Jiang, Wu et al. 2002). Although this study evaluated

9
the impact of pedestrians on the flow of traffic, it differs from this study in that
pedestrians that jaywalk are considered along with those that legally cross within an
intersection. Their study only focused on one lane of travel with one pedestrian path.
This research introduces numerous paths that pedestrians may take along the corridor
of interest. The research discussed in this thesis also gives the right of way to
pedestrians. This means that vehicles are forced to stop for individuals using the
crosswalk, rather than having the pedestrians evaluate each gap and determine if they
can cross in time.
Another study performed by Ishaque and Noland (2007) utilized VISSIM,
a micro-simulation model, to study the effects of signal cycle timings on delay and
travel time costs for both vehicles and pedestrians. They discovered that shorter cycle
timings generally benefit pedestrians. Although our project will utilize micro-
simulation software and involve a tradeoff between pedestrian/jaywalker and
vehicular delay, it is different from Ishaque’s work because this work is not an
optimization. This research relies on the current signal timings of the area of interest
and determining the effect of jaywalking on the delay when compared to pedestrian
traffic that crosses at the correct locations.
While researching information regarding pedestrian crossing behavior, it
was discovered that several studies are focused on the way that pedestrians perceive
their environment and what they would consider as safe or unsafe crossing locations.
These studies included Schneider, Khattak et al. (2002), Chu (2004), Fitzpatrick,
Ullman et al. (2004), Chu, Guttenplan et al. (2004), and Bernhoft and Carstensen
(2008). All of these studies were performed by conducting surveys or questionnaires
designed to determine what a pedestrian would consider safe, and whether or not this

10
is categorical of a certain age, gender, etc. Although this information is useful, it does
not directly relate to this research.
Another common focus of pedestrians studies are related to pedestrian
walking characteristics. These often center on factors such as walking time, start up
time, crossing location, age, gender, time of day, etc. Some of these studies include
Knoblauch, Tobey et al. (1984), Knoblauch, Pietrucha et al. (1996), Coffin and
Morrall (1995), Montufar, Arango et al. (2007), and Bowman and Vecellio (1994). All
of these studies were performed by simply observing pedestrians and determining
their characteristics as well as the surrounding environment. This information is useful
in trying to establishing generalized information about a specific group of people such
as males, females, the elderly, etc. Once again, though, this information is not directly
related to this study of how jaywalkers affect the flow of traffic.
Pedestrian delay is also a general focal point for pedestrian related studies.
Many of them evaluate the delays experienced by pedestrians in different roadway
environments. Some studies that were geared towards calculating this pedestrian delay
were Virkler (1998), Kruszyna, Mackiewicz et al. (2006), and Chu and Baltes (2002).
Although these studies provide useful information on pedestrian level of service and
delay, as well as measures taken in order to reduce delay, this research is mainly
geared toward the level of service and delay of the oncoming vehicles.
When researching pedestrian crossing behavior, another frequent theme
for study is related to pedestrian accidents and crash data. These studies compare the
results of pedestrian related accidents to the surrounding locations, whether alcohol
was involved, along with other factors. A few of these studies we came across were
Cui and Nambisan (2003), Baltes (1998), and Miles-Doan and Thompson (1999).

11
Unfortunately, this topic is not directly related to jaywalking or the effect it has on
approaching motorists.
Finally, another common topic related to pedestrians was centered on the
opinions of drivers and how they perceive pedestrians in the roadway or react to
pedestrian friendly devices. These studies included Mitman and Ragland (2007), Britt,
Bergman et al. (1995), and Van Houten, McCusker et al. (2003)

12
Chapter 3
DATA COLLECTION
This study was conducted in Newark, DE, which is home to the
University of Delaware. About 20,000 students attend the university and the university
employs about 4,000 faculty and staff. As with any other university, there are a
significant number of individuals that utilize non-motorized transportation as their
means to commute to work or school. As a result, many of the roadways near the
university are pedestrian-friendly to provide safety for this pedestrian population.
From 2002-2007, the Newark Police Department reported 142 cases of
pedestrian related accidents, along with 39 jaywalking citations from the year 2002-
2006. Although these numbers may not seem significant, they do not include instances
where the accident was not severe enough to require police assistance. Out of the
reported accidents and citations, the majority of those involved are in the age range of
18-24. This falls in the age range of a typical, college student.
East Main Street was selected as the area of interest for this study of
pedestrian behavior. East Main Street is a one-way, two lane city street with on-street
parking on both sides of the road. There are several attractions along this stretch of
roadway that include restaurants, shops, among other locations that appeal to
pedestrians. This area guarantees some jaywalking occurrences based on personal
observation, its proximity to the campus and the numerous attractions.
Data was collected along the portion of East Main Street from N. Chapel
Street to N. College Avenue.

Figure 1 Area of Interest
This section has seven marked crosswalks with three of them being unsignalized. The
three unsignalized crosswalks within this stretch are all midblock crossings that give
the pedestrian right of way and force approaching drivers to yield. Many of them have
pedestrian friendly devices such as extended curb edges, flashing beacons above, as
well as the appropriate signage to alert drivers to stop for pedestrians.
The four signalized locations occur at the three major intersections along
East Main Street. These intersections are East Main Street & N. Chapel Street, East
Main Street & Academy Street, and East Main Street & N. College Avenue. The
13

14
Academy Street and N. College Avenue intersections each contain one signalized
crosswalk. Because East Main Street is a one-way street heading westbound, the
crosswalks are placed prior to the signal so that vehicles turning onto westbound East
Main Street do not have to yield to pedestrians. The intersection at N. College Avenue
contains two marked, signalized crosswalks. The first crosswalk traverses East Main
Street prior to S. College Avenue, the extension of N. College Avenue that is shifted
east by 100 feet up East Main Street. The second crosswalk spans the entire
intersection of East Main Street at N. College Avenue as it is a pedestrian scramble. A
scramble is defined as a pedestrian crossing system that stops all traffic and allows
pedestrians to cross an intersection in every direction at the same time. This location
has a dedicated pedestrian phase that allows for all pedestrian movement in either
direction across the intersection.
Pedestrian movements and behavior were observed by means of manual
data collection. Volunteers were each assigned one of six locations that spanned the
area of interest. These six locations can be seen in Appendix A. They were each given
a pedestrian data collection packet that was relative to their assigned area. The data
collection packet included several copies of an aerial image of the location. Space was
provided for data collectors to illustrate the movement of a jaywalker. Arrows were
used to clearly mark the direction of travel as well as the “start” and “finish” location
of crossing. For each additional jaywalker that may have traversed the same path, a
tally was given next to the arrow. In order to accurately measure the location of
crossing, data collectors were instructed to note the crossing location of each
jaywalker in relation to the nearby buildings on East Main Street. This allowed them

15
to locate the building in the aerial image of their pedestrian data collection packet for
more accuracy.
For data collection locations that contained one of the marked,
unsignalized midblock crossings, there were spaces for the volunteers to count the
number of pedestrians that crossed within the crosswalk. These pedestrians were
separated into those that traveled northbound and those that traveled southbound. In
the event that a data collector was assigned one of the locations that housed a
signalized crosswalk, pedestrians were separated into two categories. These categories
were those that used the crosswalk while within the WALK phase, and those that did
not (temporal jaywalking). Once again, these pedestrians/jaywalkers were separated
by direction of travel (northbound vs. southbound). A completed data collection
sample can be found in Appendix A.
The pedestrian data collection period occurred during the midday peak
period (11:00 am – 1:00 pm) on Wednesday, March 11, 2009 and Friday, March 13,
2009 during the university’s spring semester. The two-hour assigned period was
divided into eight 15-minute intervals for ease of counting. Data collectors were also
asked to stand in a location that is suitable for viewing the entire roadway within their
assigned area in order to ensure that no pedestrian or jaywalker was missed. In
addition, the observation period was performed regardless of the weather condition
(rain, sun, snow, etc).
Once the pedestrian data collection process was complete, the total
number of jaywalkers and pedestrians were then calculated. For each 15-minute time
interval, the number of jaywalkers and pedestrians were summed up across all six
locations. This was done for both Wednesday and Friday’s results. With the totals

16
calculated, the percentage of jaywalkers for each time period was determined, in
relation to the total number of observed pedestrians/jaywalkers. The 11:45 AM -12:00
PM interval had the highest jaywalking percentage for both days. The Wednesday data
had a 44% jaywalking occurrence while the Friday data had a 46% jaywalking
occurrence. The volumes from this time period, both pedestrian and jaywalking, were
then multiplied by a factor of 4. The purpose of this is to recreate a peak hour volume
of jaywalking. These resulting numbers were then used as the pedestrian data for
modeling.
With the pedestrian modeling volumes complete, a vehicular data
collection was then performed in order to determine the approximate number of
vehicles that are on East Main Street during this peak hour. For this traffic count,
volunteers were assigned one of four locations along Main Street. These locations
were the three signalized intersections of East Main Street, within the corridor, as well
as one location further west on East Main Street. These counts provided information
for the traffic entering East Main Street at the west end as well as those entering or
exiting at each of the major intersections. The four locations can be seen in Appendix
B.
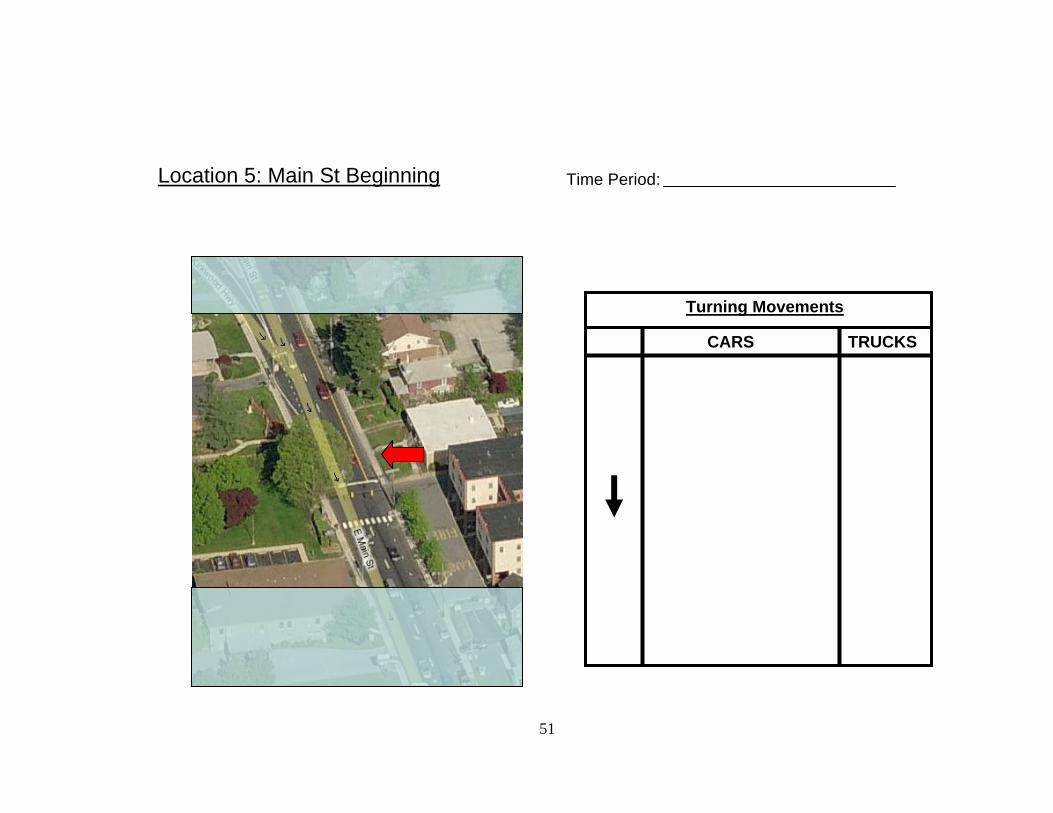
Each traffic counter was given a packet containing an aerial view of their
assigned intersection. Also, each packet contained a box to allow for the counting of
vehicles that make a specific turning movement. Only movements that were either
exiting or entering East Main Street as well as those traveling straight through the
intersection were considered. For the location upstream from the area of interest, the
only movement of interest was those traveling through. A data collection sample can
also be found in Appendix B.

17
The time period in which traffic was counted was the one hour interval
between 11:30 AM and 12:30 PM. Once again, the data collection process was split
up into four 15-minute intervals for ease of counting. This selected time period falls
within the midday peak hour of pedestrian data collection, as well as contains the
calculated peak 15-minute jaywalking period. Vehicular data collection was
performed on Monday, April 6, 2009.
Upon completion of the traffic count, the totals of turning movements
were summed to create the hourly volume for East Main Street along with the various
turning movements. It was decided to include a single hour of data collection for
vehicular volumes because the goal is to determine the effects of jaywalking on the
approaching vehicular traffic versus legal pedestrian crossing behavior. As a result,
the vehicular volume which was used to evaluate this change should be affected
regardless of the volume.

18
Chapter 4
METHODOLOGY
In order to determine the effect of pedestrian jaywalking on the flow of
traffic, a simulation model was created. Through the use of simulation, several
statistics can be generated in order to evaluate the effectiveness of a network or
roadway. This is done by analyzing the delay, level of service, and travel time.
The program that was chosen was VISSIM, a micro-simulation software
that is produced by PTV America, Inc. To our best knowledge, VISSIM is the only
micro-simulation that is able to simulate pedestrians as part of the transportation
system. The software provides the user with an opportunity to view each network in 3-
D. The 3-D feature of VISSIM also provides video representation of the 1st person
view of any vehicle or pedestrian in the network. This feature is wonderful for
presentation of a network or witnessing any queues first hand.
The first step of developing the model was to create a background aerial
image that would be large enough to cover the area of interest. This was done by
taking several screen shots of an aerial image provided by Google Earth and laying
them adjacently. Each image was slightly overlapped with the neighboring one in
order to ensure accuracy of the image. Once the image of the entire stretch of East
Main Street (from Library Ave to Elkton Rd) was developed, the file was saved and
then imported into VISSIM as a background image. The distance of the corridor of
East Main Street from beginning to end was then estimated using Google Earth once

19
again. This distance was then used in the simulation program in order to scale the
image so that it is consistent with the length of roadways to be created by VISSIM.
With the background in place, roadway links were added along East Main
Street, as well as the major side streets of N. Chapel Street, Academy Street, and N.
College Avenue matching them to the image. All roadway geometry was determined
by using various satellite and aerial imagery provided by Google Maps and Windows
Live Search Maps, as well as direct observations. This included the number of lanes
for each roadway, any turn bays that existed, as well as noting the locations of marked
crosswalks. In order to determine the length of any turn bays along East Main Street
or along the side streets, Google Earth was used to provide an approximate value to be
used in the simulation.
Finally, the signal timings for the three major intersections along the Main
Street corridor were implemented. These were obtained from the Delaware
Department of Transportation (DelDOT). Once they were coded into the network, the
traffic volumes obtained from the data collection procedure were inserted into the
model.
The traffic volumes were implemented into the network and then were
balanced in order to reflect the results that were obtained from the data collection.
Because vehicular data was collected along the three major intersections on East Main
Street, there were differences between the Main Street approach volumes of one
intersection and the departure volumes of the preceding intersection. For example, the
number of vehicles that left the N. Chapel Street intersection (whether by passing
through on East Main Street, or turning onto East Main Street from N. Chapel Street)
may not be equal to the volume on East Main Street that approaches the next

20
downstream intersection, Academy Street. The reason for this is due to the minor side
streets or parking lots that may reduce or add to the volume. These differences in
volume were calculated and modeled in VISSIM by creating a point along East Main
Street that allowed a small amount of traffic to either exit or enter the network. This
point was placed in between each intersection to ensure volume equilibrium
throughout the network so that the simulation matched the results of the vehicle data
collection.
Before adding the pedestrians into the network, four different scenarios
were developed.
The Base Case scenario consists of the network with only the vehicular
volume collected. Pedestrians were not included so that this scenario may act as the
baseline in order to compare results of the other scenarios.
The Case 1 scenario consists of the network with the vehicular volume, as
well as pedestrians located on the network. However, this scenario will only contain
pedestrians that used signalized intersections. These pedestrians will be crossing at the
signalized locations and are restricted to cross only during the pedestrian WALK
phase. This is to recreate an environment in which pedestrians do not cross illegally.
In order to have the analysis remain consistent, pedestrians that did not cross at these
signalized crosswalks were allocated to the nearest signalized crosswalk. Also, those
that crossed at a signalized crosswalk but did so against the WALK phase, were forced
to cross at the appropriate time. The resulting network contains the same amount of
pedestrians, as measured during data collection, all crossing during the WALK phase
at each signalized crosswalk. These crosswalks were located at East Main Street and
21
N. Chapel Street, East Main Street and Academy Street, and East Main Street and N.
College Avenue.
The Case 2 scenario is similar to the Case 1 scenario except that now, all
marked crosswalks are considered as valid crossing locations. This includes the three
midblock crosswalks along the stretch of East Main Street. Although these midblock
crosswalks are legal crossing locations for pedestrians, it was decided to dedicate this
as a separate scenario from the signalized crosswalks because at these locations,
pedestrians are given the right of way and approaching vehicles are forced to yield. As
a result, there is some factor of unexpectedness in terms of driver perceptions of a
pedestrian crossing. In the Case 1 scenario, pedestrians will only cross when drivers
are forced to stop due to the red phase of the traffic signal. This provides no conflict
between driver and pedestrian. However, in the Case 2 scenario, vehicles are forced to
stop on their own in order to give right of way to the pedestrian. Also, the pedestrians
in Case 2 will be allocated to the nearest marked crosswalk, regardless of whether it is
signalized or a midblock crossing. As a result, the pedestrian volumes are different
from the Case 1 scenario as they become more spread out throughout the network
along these additional points of crossing. The total pedestrian volume throughout the
entire network remains the same.
Finally, the Case 3 scenario introduces pedestrians that choose to jaywalk.
In this scenario, jaywalkers are modeled by placing several paths within the model
that traverse East Main Street, along with the signalized and marked midblock
crosswalks. These paths are strategically placed in the locations where jaywalkers
illegally crossed, as it appeared during data collection. For reference, the aerial image
of the surrounding buildings was used to place these jaywalking locations with some
22
degree of accuracy. In the simulation, all of these paths gave jaywalkers the right of
way and forced the approaching vehicles on East Main Street to yield. This simulates
an environment in which an approaching vehicle witnesses a jaywalker enter the
roadway and may be forced to stop. Since this scenario was designed to reflect the raw
data as collected, there was no need to reallocate pedestrians along the roadway.
Similar to Case 1 and Case 2, this scenario has the same pedestrian total volume
throughout the entire network. Every location at which a jaywalker was seen crossing
the road was added into the model with the appropriate volume. For jaywalkers that
crossed at signalized locations but against the WALK signal (temporal jaywalking),
jaywalking paths were laid overtop of the existing signalized crosswalks. These paths
were given no restriction of when to cross. The result had pedestrians, who
appropriately crossed during the WALK phase, being forced to wait until they were
given the WALK signal, while jaywalkers were free to cross whenever they
approached the intersection. Once again, these jaywalkers were always given the right
of way. In order to easily decipher between the two, jaywalkers were color coded as
pink in the simulation.
After creating all four scenarios using the witnessed pedestrian volumes
from the Wednesday data collection, they were all duplicated in order to test the
Friday data collection results except for the Base Case scenario. Since, the Base Case
scenario contains no pedestrians, it is not necessary to implement any Friday
pedestrian volumes. However for the Case 1 and Case 2 scenarios, the pedestrian
volumes were changed in order to reflect the Friday data collection. These volumes
were calculated in the same way as the Wednesday volumes, where Case 1 has
pedestrians allocated to the nearest signalized crosswalk and Case 2 has pedestrians

23
allocated to the nearest signalized/marked crosswalk. The Case 3 scenario, on the
other hand, follows a different approach. The jaywalking locations that were observed
on the Wednesday data collection may not have been in the same location as those that
were observed on the Friday data collection. As a result, after copying the Wednesday
Case 3 scenario, the jaywalking locations were adjusted in order to accurately reflect
the Friday data collection. Upon completion of all 8 networks (2 days, 4 scenarios
each), VISSIM was used to collect the statistics of interest.
In the simulation, it was decided to collect travel time and delay along
East Main Street. A virtual counting device was placed at the beginning and end of
East Main Street in each scenario that would determine both travel time and delay for
each vehicle that crosses the start and finish counters. To ensure that each counter was
placed in the same location between each case, one network was copied and altered in
order to create the next scenario’s network. As a result, the building of each
successive network only entailed creating the additional crossing locations as well as
entering the new adjusted pedestrian/jaywalking volumes. The counters remained in
the same position between each network. Also, not all of the vehicles that are
generated and trigger the initial travel time and delay time counter on Main Street will
reach the final counter. The reason for this is because the intersection turning volumes
are randomly assigned by the percentage of those turning or traveling through.
Therefore, as a vehicle approaches one of the intersections there is only a percentage,
relative to the number of vehicles observed traveling thru versus turning left or right,
that it will travel onto the next intersection, where the same thing will take place. The
resulting percentage of vehicles that fully travel the length of East Main Street is
approximately 33%. With the travel time and delay counters in place, each of the 8

24
networks was simulated 10 times in order to get a large amount of data for analysis.
Each simulation generated differences in travel time and delay because vehicles and
pedestrians were randomly generated at different times according to the Poisson
Arrival Process.

25
Chapter 5
RESULTS
After running the simulation, the data was analyzed from each run of each
scenario. This consisted of determining the travel time and delay of every vehicle that
crossed the “start” and “finish” counters along East Main Street. The average travel
time and delay time were then calculated and a comparison was done between the
different cases. These average values utilized all of the vehicle data across the ten
simulation runs per scenario. Also, the standard deviation was determined in order to
get an idea of the spread and range of travel time and delay time values.
With these values, we were able to determine a few different results.
When comparing the Base Case scenario of no pedestrians on the network with the
Case 1 scenario of pedestrians allocated strictly to the signalized crosswalks, we saw
that there was very little change in travel time and delay. This was consistent for both
the Wednesday and Friday simulations. In addition, the standard deviations between
the two cases were also nearly the same for both days as well.
The results from the comparison between the Base Case and Case 1
scenarios are as expected. By including only pedestrians that are allocated at only the
signalized crossing locations, we should not expect an increase in travel time and
delay. The pedestrians that are crossing at the signalized crossing locations are
crossing during the appropriate WALK phase. As a result, the approaching vehicles
along East Main Street experience no additional delay as a result of these pedestrians.
The WALK phase of each of the signal timings is purposely given with the intention

26
of minimizing delay. For the intersections along the corridor at N. Chapel Street and
Academy Street, the pedestrian WALK phase for the crosswalk that traverses East
Main Street is coordinated with each of the side streets. Pedestrians in the model will
never cross East Main Street when there is traffic approaching and will only cross
when the vehicles are given the red phase from the signal timings. For the intersection
at N. College Avenue, pedestrians are given their own dedicated WALK phase. This
allows them to cross the scramble in any direction without disrupting traffic flow. This
dedicated WALK phase is also included in the Base Case scenario. As a result,
pedestrians throughout the network in Case 1 are crossing when the East Main Street
traffic is stopped due to the signals.
A Two Sample T-Test for Large Populations was used in order to
determine if the differences in values between the Base Case scenario (the control
model) and any of the other cases were statistically significant or just a product of
variation from the Base Case. When using this statistical procedure, we set a null
hypothesis which is to be evaluated and either accepted or rejected. The null
hypothesis was that the means of the travel times or delay times had no difference. In
other words, any observed variation was just due to statistical scatter. We will be
evaluating the relationships between cases with a 95% confidence interval.
After performing the analysis, we were able to accept the null hypotheses
between the Base Case and Case 1 and state that with 95% confidence, both the
Wednesday and Friday Case 1 travel time and delay time are not statistically
significant when compared to the Base Case scenario. This evidence supports our
previous statement that the pedestrians are not causing additional delay when they are

27
allocated to signalized intersections and forced to cross East Main Street during the
appropriate WALK phase at their location.
When comparing the Case 2 simulation results to the Base Case result, we
discover that there are significant changes in delay and travel time. As a reminder, the
Case 2 scenario implements pedestrians that cross legally at all marked crosswalks.
This includes the three midblock crossings on East Main Street along with the four
signalized crosswalks from the Case 1 scenario. After taking the average travel time
and delay times for all the vehicles within the 10 simulation runs for both days of
pedestrian data collection, we discovered a statistically significant increase in these
values.
We believe that this additional delay and travel time is attributed mainly
to the pedestrians that are crossing along the midblock crosswalks. These pedestrians
are given the right of way and force approaching vehicles to stop. By introducing them
into the network, we are creating additional stopping points for some vehicles, in
addition to the traffic lights already established from the Base Case scenario.
The final scenario introduces the jaywalkers, as they are witnessed from
the data collection process. As a reminder, the Case 3 scenario contains several paths
along the network in which jaywalkers are free to cross as soon as they approach the
roadway. Also, the Case 3 scenario still maintains the signalized and marked midblock
crossings from Case 1 and 2. The Case 3 scenario more accurately represents the
walking patterns of the witnessed pedestrians because not all pedestrians cross at the
appropriate locations within the appropriate signal phase (if applicable). After viewing
the Case 3 simulation results, we discovered an even larger increase in travel time and
delay time when compared to any of the other cases.
28
We believe that the Case 3 results were significantly increased as a result
of the jaywalkers within the network. By introducing additional paths in which
jaywalkers are free to cross, vehicles have the opportunity to encounter more stopping
locations. The standard deviation is high due to the large range of travel time and
delay times that are possible. In the Case 3 network, some vehicles may be lucky and
may neither come upon any pedestrians while traveling through the East Main Street
network, nor approach any red signals from the signalized intersections. On the other
hand, some vehicles may not be as lucky and may be forced to yield to several
jaywalkers on the network in addition to having to stop for a red phase. Also, this may
explain the significant increase in travel time and delay. In order to get a better grasp
of the results, statistical analysis was performed. The statistical results indicate that
there are significant increases in both travel time and delay time for both Wednesday
and Friday, with 95% confidence. Thus, we can now state that, with 95% confidence,
jaywalking causes significant increases to travel time and delay.
However, this result compares the increase in travel time and delay from a
network with pedestrians crossing freely to a network that lacks any pedestrian inputs.
Therefore in order to accurately state that the addition of strictly jaywalkers to a
pedestrian network increases travel time and delay, we compared the Case 2 data to
the Case 3 data.
The results show that there is a significant increase in travel time and
delay time for both Wednesday and Friday data. Therefore, we can now state that,
with 95% confidence, when comparing a network in which pedestrians are strictly
enforced to cross only in designated crossing areas, the introduction of jaywalking
significantly increases the expected travel time and delay time for approaching

29
motorists. All data analyses, histograms and results of T tests are shown in
Appendices C and D.
30
Chapter 6
CONCLUSIONS AND FUTURE WORK
The use of simulation modeling has proven to be truly effective in our
study. Through this tool, we were able to compare different scenarios involving the
implementation of pedestrians and how they affect the flow of traffic. After
completion of our analysis, we were able to discover several different conclusions.
The first conclusion that we discovered was that when pedestrians are
implemented strictly at signalized intersections, there is no significant extra delay or
travel time experienced by the approaching drivers. Because these pedestrians are
forced to cross at signalized crosswalks during the appropriate WALK phase, they do
not interfere with the flow of traffic along East Main Street.
The second conclusion that we discovered was that when pedestrians are
placed along marked, midblock crosswalks and signalized crosswalks, the travel time
and delay time significantly increases. When pedestrians crossed at these midblock
locations, they are given the right of way and drivers are forced to yield to them. This
then adds to the travel time and delay.
After comparing the strictly vehicular network (Base Case scenario) to the
network with jaywalkers as they appeared during data collection (Case 3 scenario),
this led us to our next conclusion. This conclusion is that the introduction of
jaywalkers to a vehicular network significantly increases travel time and delay time.
As jaywalkers were introduced into the network, they were allowed to freely cross at
any location along our corridor of East Main Street. This included any locations at

31
signalized intersections. As a jaywalker approached East Main Street, in the model,
they were given the right of way and forced the vehicles to yield to them. For the
signalized intersections, vehicles that experienced the green phase of their signal were
still forced to yield to any jaywalkers in the event that they were crossing at the same
time. Also, the results for this network yielded a wide range of values. This is due to
the variety of possibilities of a vehicle intersecting paths with a jaywalker along the
network. With the introduction of several jaywalking paths, one vehicle may
experience no jaywalkers or pedestrians while driving, while another vehicle may be
stopped at every jaywalking/pedestrian location.
The results of comparing a network with pedestrians crossing at marked
and signalized crosswalks (Case 2 scenario) proved to cause a significant increase in
travel time and delay when compared to the same network with just vehicular data
(Base Case scenario). The same result was true when we compared the network with
jaywalkers (Case 3 scenario) to the vehicle network (Base Case scenario). In order to
measure the impact of introducing jaywalkers to the network, a comparison between
the network with pedestrians at marked crosswalks (Case 2 scenario) and the network
with jaywalkers was conducted (Case 3 scenario). The results showed that the
introduction of jaywalkers to a pedestrian network with legal crossing behavior
significantly increased travel time and delay.
Before conducting this study, our hypothesis stated that the jaywalking
would have an effect on the flow of traffic and the delay experienced by approaching
motorists. After performing the study, we have discovered that our hypothesis was
correct. The impact of introducing jaywalkers into a vehicular network showed a
significant increase in travel time and delay for approaching vehicles. Also, the

32
redistribution of a portion of pedestrians at signalized and marked midblock
crosswalks to jaywalkers showed a significant increase in travel time and delay time
for approaching motorists as well.
Our study provided successful and informative results. However, there can
always be changes made in order to strengthen the study and conclusions. One
possibility is to consider pedestrian gap acceptance within our VISSIM model. The
Case 3 scenario allows jaywalkers to cross the road freely without worry about
approaching vehicles stopping in time. However, this is not an accurate representation
of pedestrian behavior. As mentioned earlier, the pedestrians follow a Gap-
Acceptance Theory in which each gap or headway between cars is evaluated and if the
pedestrian feels that he or she cannot cross the roadway in time, it is rejected and the
next gap is considered (Palamarthy, Mahmassani et al. 1994). Future work could
implement this factor into the model in order to better represent this pedestrian
crossing behavior.
VISSIM’s 3-D visualization capability allows for one to create buildings
and objects while projecting photos onto a face of a building, in order to enhance the
3D view of the simulation. Future work on our model could include adding all of the
buildings along the Main Street corridor as they appear in real life. Although this
improvement would be purely aesthetic, it would improve the visualization.
Another possibility of future work would be to evaluate the efficiency of
creating different pedestrian alternatives in order to reduce jaywalking occurrences.
Now that it has been determined that jaywalking increases delay, a planner who is
trying to reduce delay in a corridor may consider implementing overpass walkways or
some other form of pedestrian device that may be beneficial.

33
Finally, as with any study, the evaluation of the effect of jaywalking on
the flow of traffic may be expanded to include larger networks or several other
networks in order to determine if the results remain consistent throughout. Also, one
may decide to consider locations with higher pedestrian volume, such as urban cities
or other college campuses, or lower pedestrian volume, such as suburban areas. Once
again these results may determine if the effect of jaywalking on the flow of traffic
remains consistent regardless of environment or area of study.

34
BIBLIOGRAPHY
Akin, D. and V. P. Sisiopiku (2007). Pedestrian Crossing Compliance Characteristics At-Grade Signalized Crosswalks: Case Study in a Downtown-University Campus Environment. 86th Annual Meeting, Transportation Research Board, Washington D.C.
Baltes, M. R. (1998). "Descriptive Analysis of Crashes Involving Pedestrians in Florida, 1990-1994 " Transportation Research Record: Journal of the Transportation Research Board 1636: 138-145.
Bernhoft, I. M. and G. Carstensen (2008). "Preferences and Behaviour of Pedestrians and Cyclists by Age and Gender." Transportation Research Part F: Traffic Psychology and Behaviour 11(2): 83-95.
Bowman, B. L. and R. L. Vecellio (1994). "Pedestrian Walking Speeds and Conflicts at Urban Median Locations." Transportation Research Record: Journal of the Transportation Research Board 1438: 67-73.
Britt, J. W., A. B. Bergman, et al. (1995). "Law Enforcement, Pedestrian Safety, and Driver Compliance with Crosswalk Laws: Evaluation of a Four-Year Campaign in Seattle." Transportation Research Record: Journal of the Transportation Research Board 1485: 160-167.
Chu, X. (2004). Testing Behavioral Hypotheses on Street Crossing. 83rd Annual Meeting, Transportation Research Board, Washington D.C.
Chu, X. and M. R. Baltes (2002). Measuring Pedestrian Quality of Service for Mid-block Street Crossing: The Selection of Potential Determinants. 81st Annual Meeting, Transportation Research Board, Washington D.C.
Chu, X., M. Guttenplan, et al. (2004). "Why People Cross Where They Do: The Role of Street Environment." Transportation Research Record: Journal of the Transportation Research Board 1878: 3-10.
Coffin, A. and J. Morrall (1995). "Walking Speeds of Elderly Pedestrians at Crosswalks." Transportation Research Record: Journal of the Transportation Research Board 1487: 63-67.

35
Cui, Z. and S. S. Nambisan (2003). "Methodology for Evaluating the Safety of Midblock Pedestrian Crossings." Transportation Research Record: Journal of the Transportation Research Board 1828: 75-82.
DeVeauuse, N., K. Kim, et al. (1999). "Driver Compliance with Stop Signs at Pedestrian Crosswalks on a University Campus." Journal of American College Health 47(6): 269-74.
Fitzpatrick, K., B. Ullman, et al. (2004). On-Street Pedestrian Surveys of Pedestrian Crossing Treatments. 83rd Annual Meeting, Transportation Research Board, Washington D.C.
Ishaque, M. M. and R. B. Noland (2007). "Trade-offs Between Vehicular and Pedestrian Traffic Using Micro-Simulation Methods." Elsevier: Transport Policy 14: 124-138.
Jason, L. A. and R. Liotta (1982). "Pedestrian Jaywalking Under Facilitating and Non-Facilitating Conditions." Journal of Applied Behavior Analysis 15(3): 469-473.
Jiang, R., Q. Wu, et al. (2002). "Capacity Drop Due to the Traverse of Pedestrians." Physical Review E 65: 036120.1-036120.5.
Kim, K., I. M. Brunner, et al. (2008). "Modeling Violation of Hawaii's Crosswalk Law." Elsevier: Accident Analysis & Prevention 40: 894-904.
Knoblauch, R. L., M. T. Pietrucha, et al. (1996). "Field Studies of Pedestrian Walking Speed and Start-Up Time." Transportation Research Record: Journal of the Transportation Research Board 1538: 27-38.
Knoblauch, R. L., H. N. Tobey, et al. (1984). "Pedestrian Characteristics and Exposure Measures." Transportation Research Record: Journal of the Transportation Research Board 959: 35-41.
Kruszyna, M., P. Mackiewicz, et al. (2006). "Influence of Pedestrians' Entry Process on Pedestrian Delays at Signal-Controlled Crosswalks." Journal of Transportation Engineering, ASCE 132(11): 855.
Miles-Doan, R. and G. Thompson (1999). "The Planning Profession and Pedestrian Safety: Lessons From Orlando." Journal of Planning Education and Research 18(3): 211-220.

36
Mitman, M. F. and D. R. Ragland (2007). "Crosswalk Confusion: More Evidence Why Pedestrian and Driver Knowledge of the Vehicle Code Should Not Be Assumed." Transportation Research Record: Journal of the Transportation Research Board 2002: 55-63.
Montufar, J., J. Arango, et al. (2007). "Pedestrians' Normal Walking Speed and Speed When Crossing a Street." Transportation Research Record: Journal of the Transportation Research Board 2002: 90-97.
Palamarthy, S., H. S. Mahmassani, et al. (1994). Models of Pedestrianm Crossing Behavior at Signalized Intersections. Center for Transportation Research, University of Texas at Austin: 1296-1.
Schneider, R. J., A. J. Khattak, et al. (2002). Factors Associated with Pedestrian Crash Risk: Integrating Risk Perceptions and Police-Reported Crashes. 81st Annual Meeting, Transportation Research Board, Washington D.C.
Van Houten, R., D. McCusker, et al. (2003). "An Examination of the Use of Advance Yield Markings and Flourescent Yellow Green RA4 Signs at Crosswalks with Uncontrolled Approaches." Transportation Research Record: Journal of the Transportation Research Board 1818: 119-124.
Virkler, M. R. (1998). "Pedestrian Compliance Effects on Signal Delay." Transportation Research Record: Journal of the Transportation Research Board 1636: 88-91.

37
Appendix A
PEDESTRIAN DATA COLLECTION

SAMPLE
38

Location 1: Main St @ N. College Ave
Peds in Crosswalk:
LIMIT OF WORK
LIMIT OF WORK LIMIT OF WORK
LIMIT OF WORK
Jaywalkers (against WALK) N
N. College
NSB S
Time Period:
39

Location 2: Main St @ S. College Ave
Time Period:
LIMIT OF WORK
LIMIT OF WORK LIMIT OF WORK
LIMIT OF WORK
NPeds in Crosswalk: Jaywalkers (against WALK)
S. College Crosswalk
NB S S
40
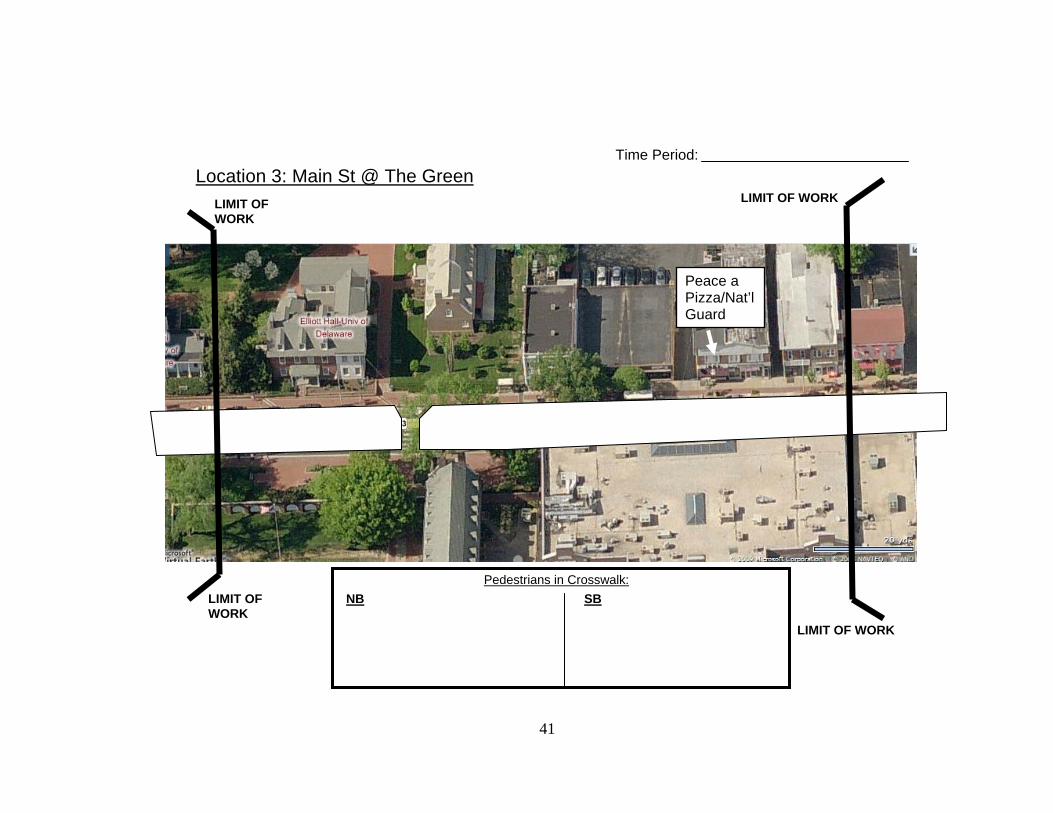
Location 3: Main St @ The Green
Pedestrians in Crosswalk:
LIMIT OF WORK
LIMIT OF WORK LIMIT OF WORK
LIMIT OF WORK
NB SB
Peace a Pizza/Nat’l Guard
Time Period:
41

Location 4: Main St @ The Galleria Time Period:
LIMIT OF WORK
LIMIT OF WORK LIMIT OF WORK
LIMIT OF WORK
Wilmington Trust Rainbow
Pedestrians in Crosswalk: NB SB
42

Location 5: Main St @ Academy Street Time Period:
LIMIT OF WORK
LIMIT OF WORK
LIMIT OF WORK
LIMIT OF WORK
Center Street
Pedestrians in Crosswalk: Jaywalkers (against WALK)
Café Gelato
SB SB NB NB
43

Location 6: Main St @ Haines St Time Period:
LIMIT OF WORK
LIMIT OF WORK LIMIT OF WORK
LIMIT OF WORK
Panera Bread Happy
Harry’s
Pedestrians in Crosswalk: NB SB
Starbucks/ Hollywood Tans
44

45
Appendix B
TRAFFIC COUNT DATA

SAMPLE
46 46

Location 1: Main St @ N. College Ave
Time Period:
NB
CARS
Turning Movements
TRUCKS
Trabant
47
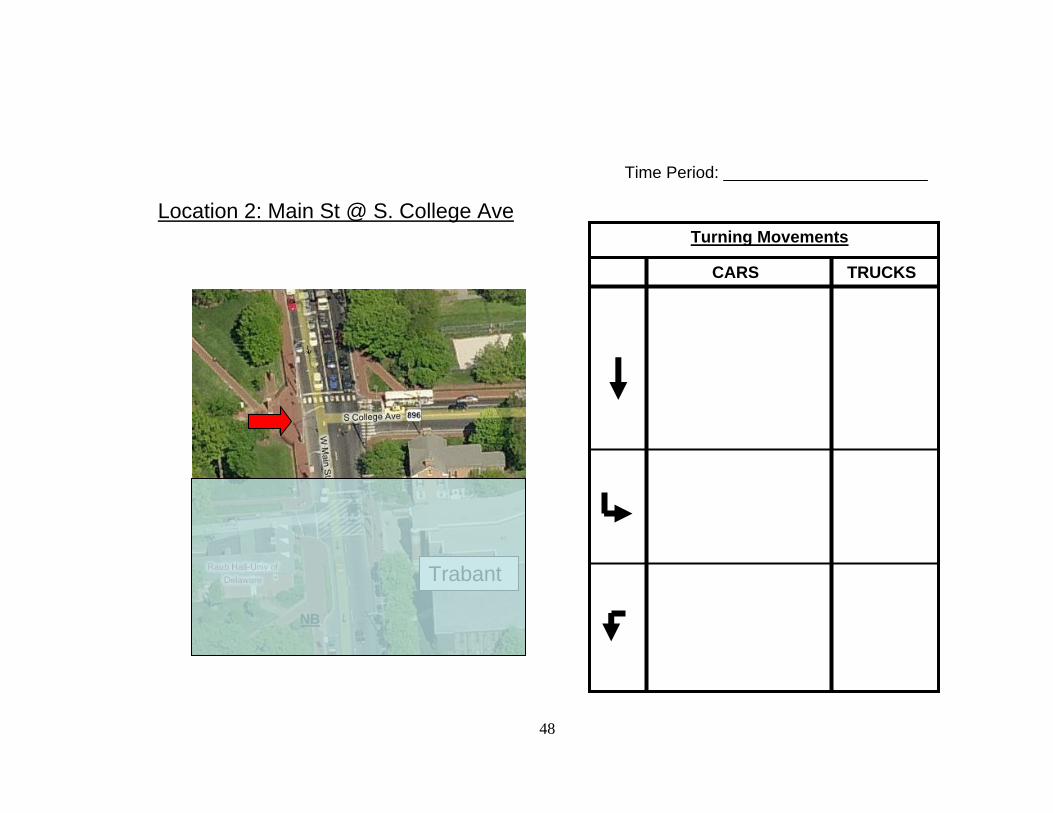
Location 2: Main St @ S. College Ave
Time Period:
NB
CARS
Turning Movements
TRUCKS
Trabant
48

Location 3: Main St @ Academy St.
Time Period:
NB
CARS
Turning Movements
TRUCKS
49

50
Location 4: Main St @ Chapel St.
Time Period:
CARS
Turning Movements
TRUCKS
51
Location 5: Main St Beginning Time Period:
CARS
Turning Movements
TRUCKS
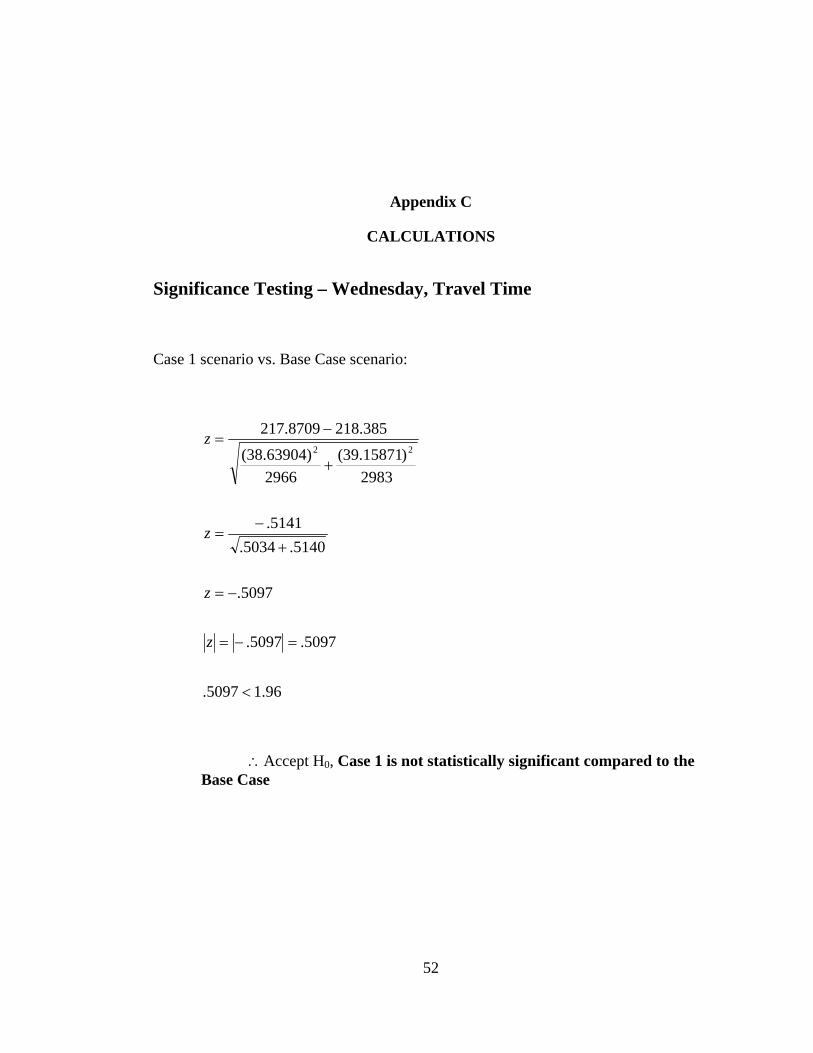
Appendix C
CALCULATIONS
Significance Testing – Wednesday, Travel Time
Case 1 scenario vs. Base Case scenario:
96.15097.
5097.5097.
<
=−=z
5097.
5140.5034.5141.
2983)15871.39(
2966)63904.38(
385.2188709.21722
−=
+−
=
+
−=
z
z
z
∴Accept H0, Case 1 is not statistically significant compared to the Base Case
52

Case 2 scenario vs. Base Case scenario:
96.15636.13
5636.135636.13
5636.13
5140.5227.8108.13
2983)15871.39(
2983)488.39( 22
>
==
=
+=
+
z
z
z
385.2181958.232 −=z
∴Reject H0, Case 2 is statistically significant compared to the Base Case
53

Case 3 scenario vs. Base Case scenario:
96.1368.59
368.59368.59
368.59
5140.5734.17759.85
2983)15871.39(
2832)75261.66( 22
>
==
=
+=
+
=
z
z
z
z 385.2181609.304 −
∴Reject H0, Case 3 is statistically significant compared to the Base Case
54

Case 3 scenario vs. Case 2 scenario:
96.17063.49
7063.497063.49
7063.49
5227.5734.19651.71
2983)488.39(
2832)75261.66( 22
>
==
=
+=
+
=
z
z
z
z 1958.2321609.304 −
∴Reject H0, Case 3 is statistically significant compared to Case 2
55

Significance Testing – Friday, Travel Time
Case 1 scenario vs. Base Case scenario:
96.16130.
6130.6130.
6130.
5140.5084.6198.
29832987
<
=−=
−=
+−
=
+
z
z
z
)15871.39()9673.38(
385.2187652.21722
−=z
∴Accept H0, Case 1 is not statistically significant compared to the Base Case
56

Case 2 scenario vs. Base Case scenario:
96.14328.14
4328.144328.14
4328.14
5140.4424.1153.14
2983)15871.39(
2973)2680.36( 22
>
==
=
+=
+
=
z
z
z
z 385.2185003.232 −
∴Reject H0, Case 2 is statistically significant compared to the Base Case
57

Case 3 scenario vs. Base Case scenario:
96.1219.84
219.84219.84
219.84
5140.106.74828.232
2983)15871.39(
2545)4797.134( 22
>
==
=
+=
+
=
z
z
z
z 385.2188678.450 −
∴Reject H0, Case 3 is statistically significant compared to the Base Case
58

Case 3 scenario vs. Case 2 scenario:
96.14085.79
4085.794085.79
4805.79
4424.106.73675.218
2973)2680.36(
2545)4797.134( 22
>
==
=
+=
+
=
z
z
z
z 5003.2328678.450 −
∴Reject H0, Case 3 is statistically significant compared to Case 2
59
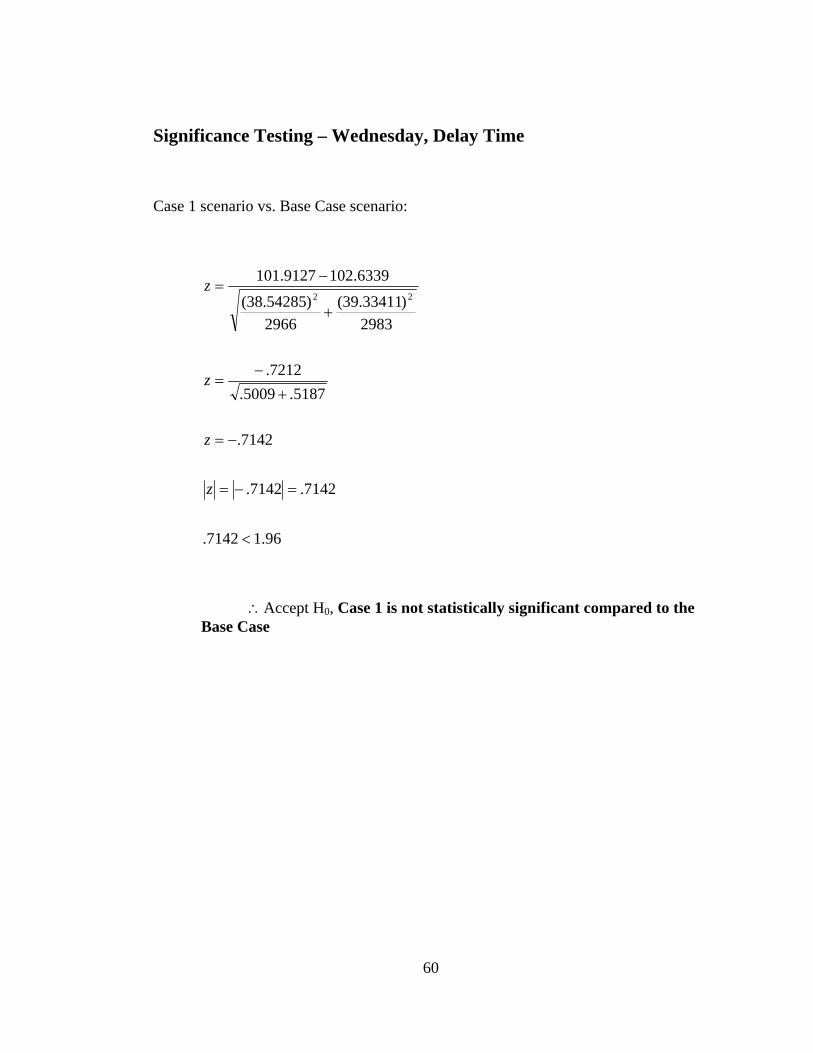
Significance Testing – Wednesday, Delay Time
Case 1 scenario vs. Base Case scenario:
96.17142.
7142.7142.
7142.
5187.5009.7212.
29832966
<
=−=
−=
+−
=
+
z
z
z
)33411.39()54285.38(
6339.1029127.10122
−=z
∴Accept H0, Case 1 is not statistically significant compared to the Base Case
60

Case 2 scenario vs. Base Case scenario:
96.15251.13
5251.135251.13
5251.13
5187.5193.7795.13
2983)33411.39(
2983)35716.39( 22
>
==
=
+=
+
=
z
z
z
z 6339.1024134.116 −
∴Reject H0, Case 2 is statistically significant compared to the Base Case
61
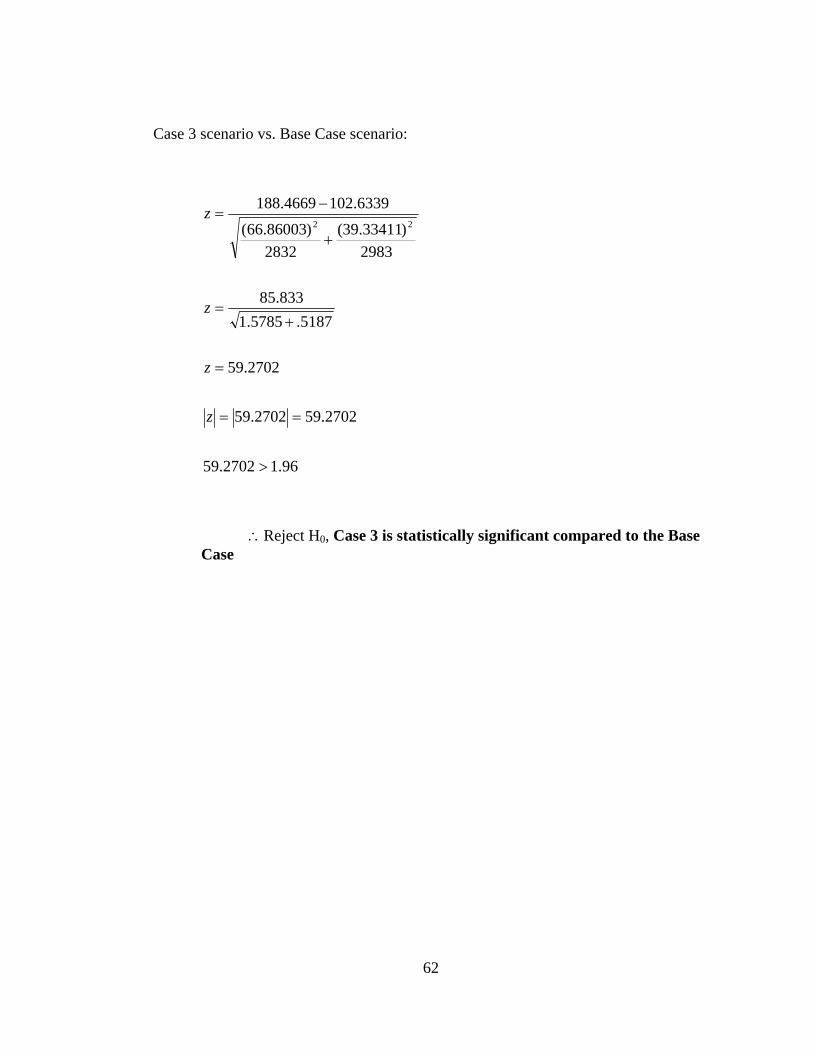
Case 3 scenario vs. Base Case scenario:
96.12702.59
2702.592702.59
2702.59
5187.5785.1833.85
2983)33411.39(
2832)86003.66( 22
>
==
=
+=
+
=
z
z
z
z 6339.1024669.188 −
∴Reject H0, Case 3 is statistically significant compared to the Base Case
62

Case 3 scenario vs. Case 2 scenario:
96.17477.49
7477.497477.49
7477.49
5193.5785.10535.72
2983)35716.39(
2832)86003.66( 22
>
==
=
+=
+
=
z
z
z
z 4134.1164669.188 −
∴Reject H0, Case 3 is statistically significant compared to Case 2
63

Significance Testing – Friday, Delay Time
Case 1 scenario vs. Base Case scenario:
96.18981.
8981.8981.
8981.
5187.5068.9095.
29832987
<
=−=
−=
+−
=
+
z
z
z
)33411.39()90596.38(
6339.1027244.10122
−=z
∴Accept H0, Case 1 is not statistically significant compared to the Base Case
64

Case 2 scenario vs. Base Case scenario:
96.12944.14
2944.142944.14
2944.14
5187.4468.0454.14
2983)33411.39(
2973)44468.36( 22
>
==
=
+=
+
=
z
z
z
z 6339.1026793.116 −
∴Reject H0, Case 2 is statistically significant compared to the Base Case
65

Case 3 scenario vs. Base Case scenario:
96.11483.84
1483.841483.84
1483.84
5187.1317.77487.232
2983)33411.39(
2545)7223.134( 22
>
==
=
+=
+
=
z
z
z
z 6339.1023826.335 −
∴Reject H0, Case 3 is statistically significant compared to the Base Case
66

Case 3 scenario vs. Case 2 scenario:
96.14445.79
4445.794445.79
4445.79
4468.1317.77033.218
2973)44468.36(
2545)7223.134( 22
>
==
=
+=
+
=
z
z
z
z 6793.1163826.335 −
∴Reject H0, Case 3 is statistically significant compared to Case 2
67
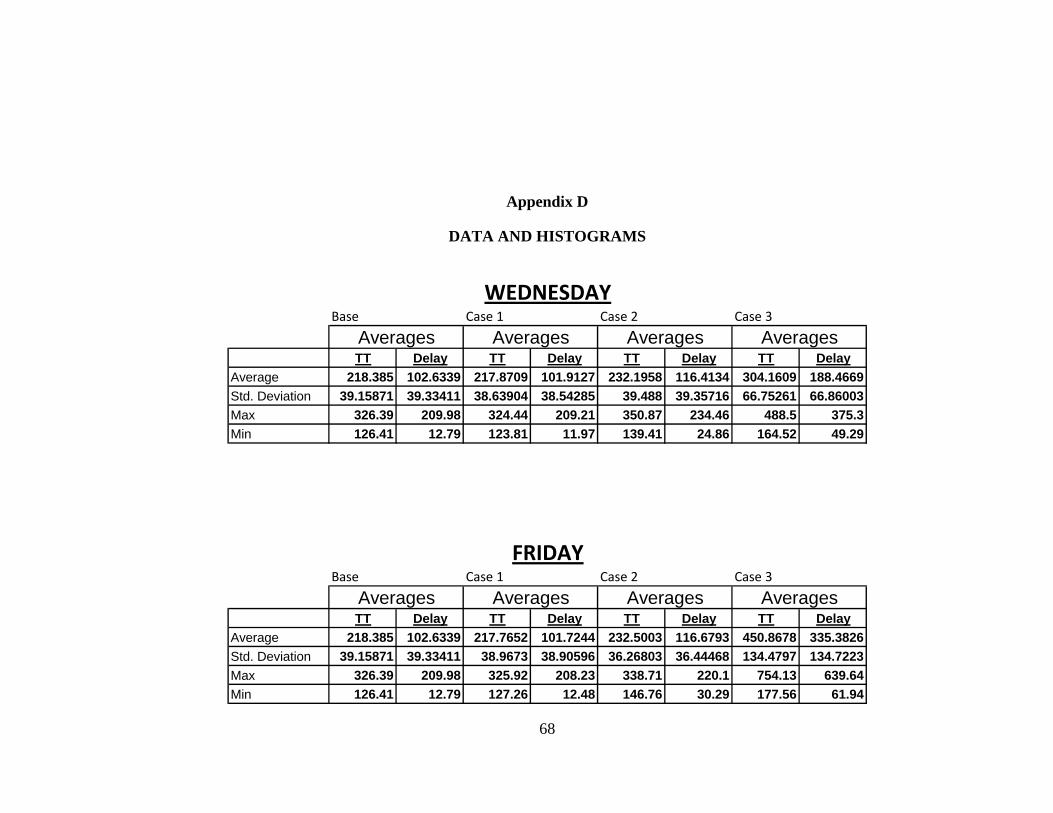
Std. Deviation 39.15871 39.33411 38.63904 38.54285 39.488 39.35716 66.75261 66.86003Max 326.39 209.98 324.44 209.21 350.87 234.46 488.5 375.3Min 126.41 12.79 123.81 11.97 139.41 24.86 164.52 49.29
Base Case 1 Case 2 Case 3
TT Delay TT Delay TT Delay TT DelayAverage 218.385 102.6339 217.7652 101.7244 232.5003 116.6793 450.8678 335.3826Std. Deviation 39.15871 39.33411 38.9673 38.90596 36.26803 36.44468 134.4797 134.7223Max 326.39 209.98 325.92 208.23 338.71 220.1 754.13 639.64Min 126.41 12.79 127.26 12.48 146.76 30.29 177.56 61.94
Average 218.385 102.6339 217.8709 101.9127 232.1958 116.4134 304.1609 188.4669
Base Case 1 Case 2 Case 3
TT DelayTTDelay
68
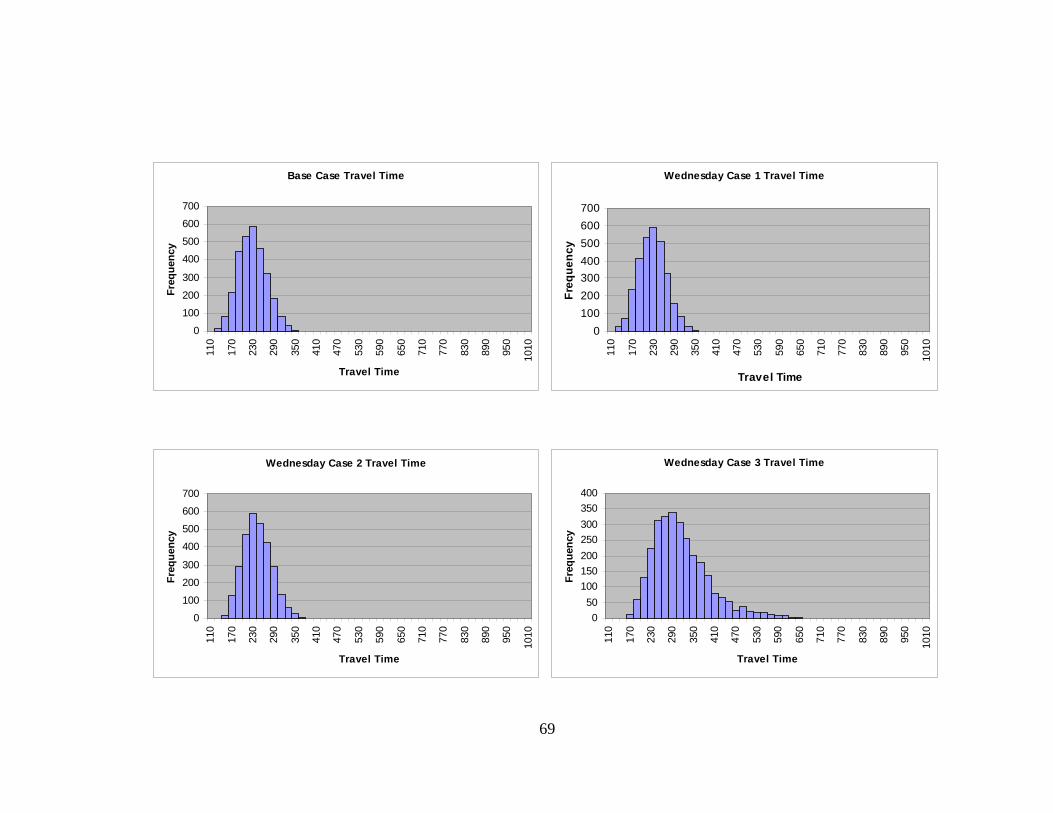
Appendix D
DATA AND HISTOGRAMS
TTDelayTTDelay
WEDNESDAY
FRIDAY
Averages Averages Averages Averages
AveragesAveragesAverages Averages
Base Case Travel Time
0
100
200
300
400
500
600
70011
0
170
230
290
350
410
470
530
590
650
710
770
830
890
950
1010
Travel Time
Freq
uenc
y
Wednesday Case 1 Travel Time
0100200300400500600700
110
170
230
290
350
410
470
530
590
650
710
770
830
890
950
1010
Travel Time
Freq
uenc
y
69
Wednesday Case 2 Travel Time
0
100
200
300
400
500
600
700
110
170
230
290
350
410
470
530
590
650
710
770
830
890
950
1010
Travel Time
Freq
uenc
y
Wednesday Case 3 Travel Time
050
100150200250300350400
110
170
230
290
350
410
470
530
590
650
710
770
830
890
950
1010
Travel Time
Freq
uenc
y

Base Case Delay
0
100
200
300
400
500
6000 60 120
180
240
300
360
420
480
540
600
660
720
780
840
900
Delay
Freq
uenc
y
Wednesday Case 1 Delay
0
100
200
300
400
500
600
0 60 120
180
240
300
360
420
480
540
600
660
720
780
840
900
Delay
Freq
uenc
y
70
Wednesday Case 2 Delay
0
100
200
300
400
500
600
700
0 60 120
180
240
300
360
420
480
540
600
660
720
780
840
900
Delay
Freq
uenc
y
Wednesday Case 3 Delay
050
100150200250300350400
0 60 120
180
240
300
360
420
480
540
600
660
720
780
840
900
Delay
Freq
uenc
y

Base Case Travel Time
0
100
200
300
400
500
600
70011
0
170
230
290
350
410
470
530
590
650
710
770
830
890
950
1010
Travel Time
Freq
uenc
y
Friday Case 1 Travel Time
0
100
200
300
400
500
600
700
110
170
230
290
350
410
470
530
590
650
710
770
830
890
950
1010
Travel Time
Freq
uenc
y
71
Friday Case 2 Travel Time
0
100
200
300
400
500
600
700
110
170
230
290
350
410
470
530
590
650
710
770
830
890
950
1010
Travel Time
Freq
uenc
y
Friday Case 3 Travel Time
020406080
100120140160180
110
170
230
290
350
410
470
530
590
650
710
770
830
890
950
1010
Travel Time
Freq
uenc
y

Base Case Delay
0
100
200
300
400
500
6000 60 120
180
240
300
360
420
480
540
600
660
720
780
840
900
Delay
Freq
uenc
y
Friday Case 1 Delay
0
100
200
300
400
500
600
0 60 120
180
240
300
360
420
480
540
600
660
720
780
840
900
Delay
Freq
uenc
y
72
Friday Case 2 Delay
0
100
200
300
400
500
600
700
0 60 120
180
240
300
360
420
480
540
600
660
720
780
840
900
Delay
Freq
uenc
y
Friday Case 3 Delay
020406080
100120140160
0 60 120
180
240
300
360
420
480
540
600
660
720
780
840
900
Delay
Freq
uenc
y