Embed Size (px)
Citation preview
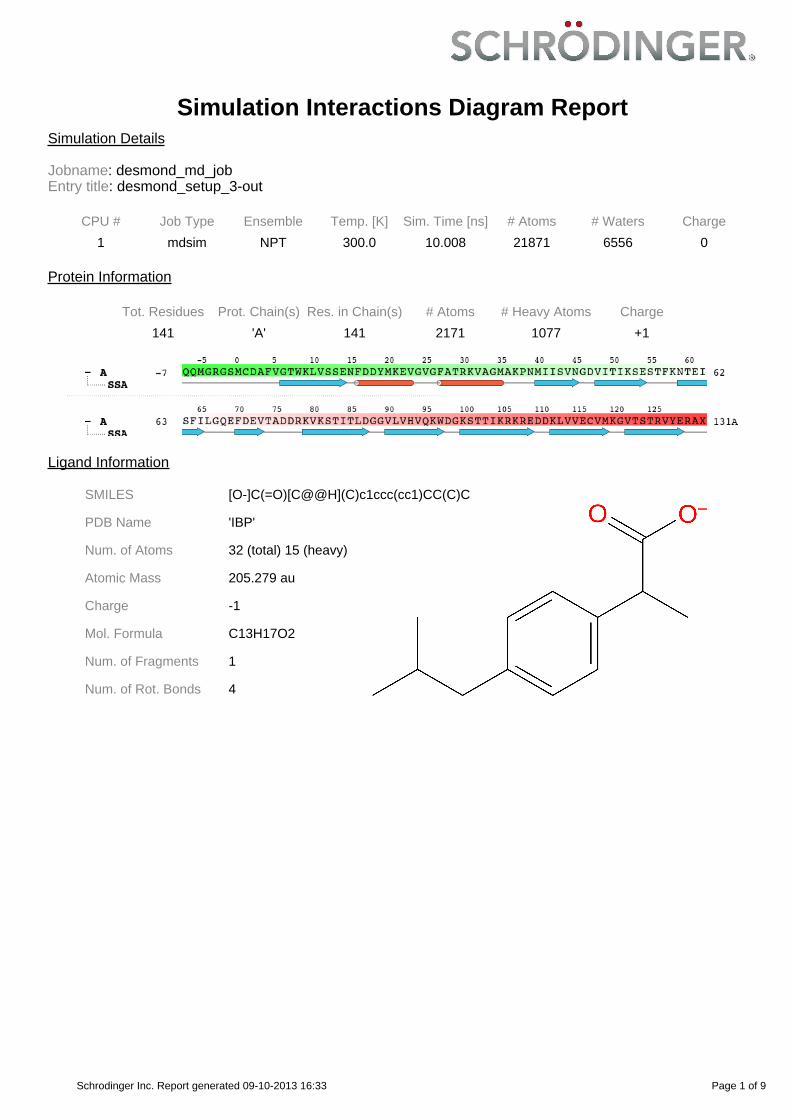
Simulation Interactions Diagram ReportSimulation Details
Jobname: desmond_md_jobEntry title: desmond_setup_3-out
CPU # Job Type Ensemble Temp. [K] Sim. Time [ns] # Atoms # Waters Charge
1 mdsim NPT 300.0 10.008 21871 6556 0
Protein Information
Tot. Residues Prot. Chain(s) Res. in Chain(s) # Atoms # Heavy Atoms Charge
141 'A' 141 2171 1077 +1
Ligand Information
SMILES [O-]C(=O)[C@@H](C)c1ccc(cc1)CC(C)C
PDB Name 'IBP'
Num. of Atoms 32 (total) 15 (heavy)
Atomic Mass 205.279 au
Charge -1
Mol. Formula C13H17O2
Num. of Fragments 1
Num. of Rot. Bonds 4
Page 1 of 9Schrodinger Inc. Report generated 09-10-2013 16:33
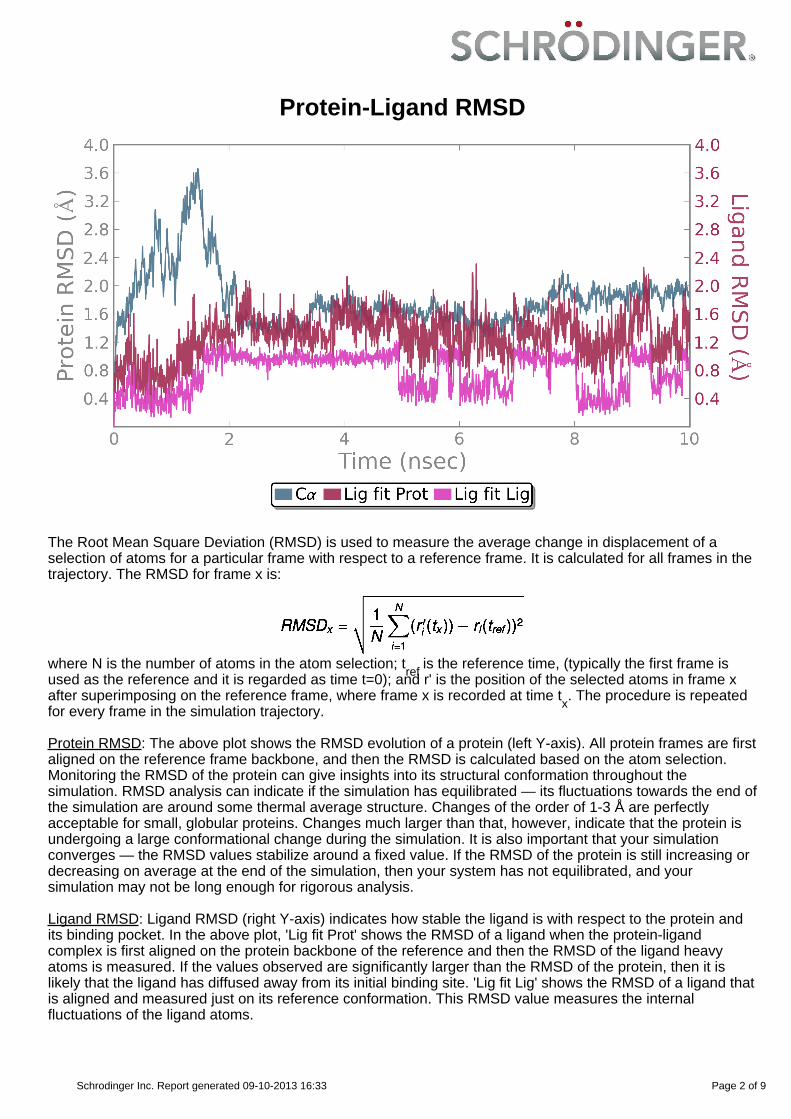
Protein-Ligand RMSD
The Root Mean Square Deviation (RMSD) is used to measure the average change in displacement of aselection of atoms for a particular frame with respect to a reference frame. It is calculated for all frames in thetrajectory. The RMSD for frame x is:
where N is the number of atoms in the atom selection; tref
is the reference time, (typically the first frame isused as the reference and it is regarded as time t=0); and r' is the position of the selected atoms in frame xafter superimposing on the reference frame, where frame x is recorded at time t
x. The procedure is repeated
for every frame in the simulation trajectory.
Protein RMSD: The above plot shows the RMSD evolution of a protein (left Y-axis). All protein frames are firstaligned on the reference frame backbone, and then the RMSD is calculated based on the atom selection.Monitoring the RMSD of the protein can give insights into its structural conformation throughout thesimulation. RMSD analysis can indicate if the simulation has equilibrated — its fluctuations towards the end ofthe simulation are around some thermal average structure. Changes of the order of 1-3 Å are perfectlyacceptable for small, globular proteins. Changes much larger than that, however, indicate that the protein isundergoing a large conformational change during the simulation. It is also important that your simulationconverges — the RMSD values stabilize around a fixed value. If the RMSD of the protein is still increasing ordecreasing on average at the end of the simulation, then your system has not equilibrated, and yoursimulation may not be long enough for rigorous analysis.
Ligand RMSD: Ligand RMSD (right Y-axis) indicates how stable the ligand is with respect to the protein andits binding pocket. In the above plot, 'Lig fit Prot' shows the RMSD of a ligand when the protein-ligandcomplex is first aligned on the protein backbone of the reference and then the RMSD of the ligand heavyatoms is measured. If the values observed are significantly larger than the RMSD of the protein, then it islikely that the ligand has diffused away from its initial binding site. 'Lig fit Lig' shows the RMSD of a ligand thatis aligned and measured just on its reference conformation. This RMSD value measures the internalfluctuations of the ligand atoms.
Page 2 of 9Schrodinger Inc. Report generated 09-10-2013 16:33
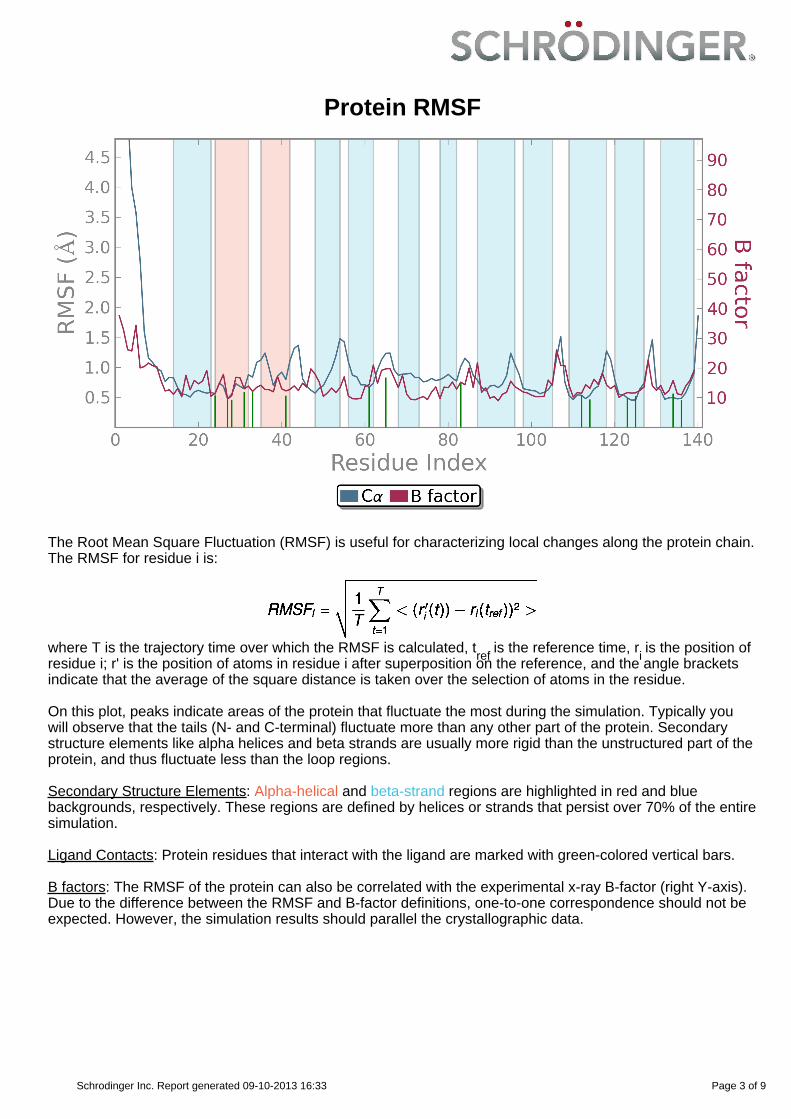
Protein RMSF
The Root Mean Square Fluctuation (RMSF) is useful for characterizing local changes along the protein chain.The RMSF for residue i is:
where T is the trajectory time over which the RMSF is calculated, tref
is the reference time, ri is the position of
residue i; r' is the position of atoms in residue i after superposition on the reference, and the angle bracketsindicate that the average of the square distance is taken over the selection of atoms in the residue.
On this plot, peaks indicate areas of the protein that fluctuate the most during the simulation. Typically youwill observe that the tails (N- and C-terminal) fluctuate more than any other part of the protein. Secondarystructure elements like alpha helices and beta strands are usually more rigid than the unstructured part of theprotein, and thus fluctuate less than the loop regions.
Secondary Structure Elements: Alpha-helical and beta-strand regions are highlighted in red and bluebackgrounds, respectively. These regions are defined by helices or strands that persist over 70% of the entiresimulation.
Ligand Contacts: Protein residues that interact with the ligand are marked with green-colored vertical bars.
B factors: The RMSF of the protein can also be correlated with the experimental x-ray B-factor (right Y-axis).Due to the difference between the RMSF and B-factor definitions, one-to-one correspondence should not beexpected. However, the simulation results should parallel the crystallographic data.
Page 3 of 9Schrodinger Inc. Report generated 09-10-2013 16:33
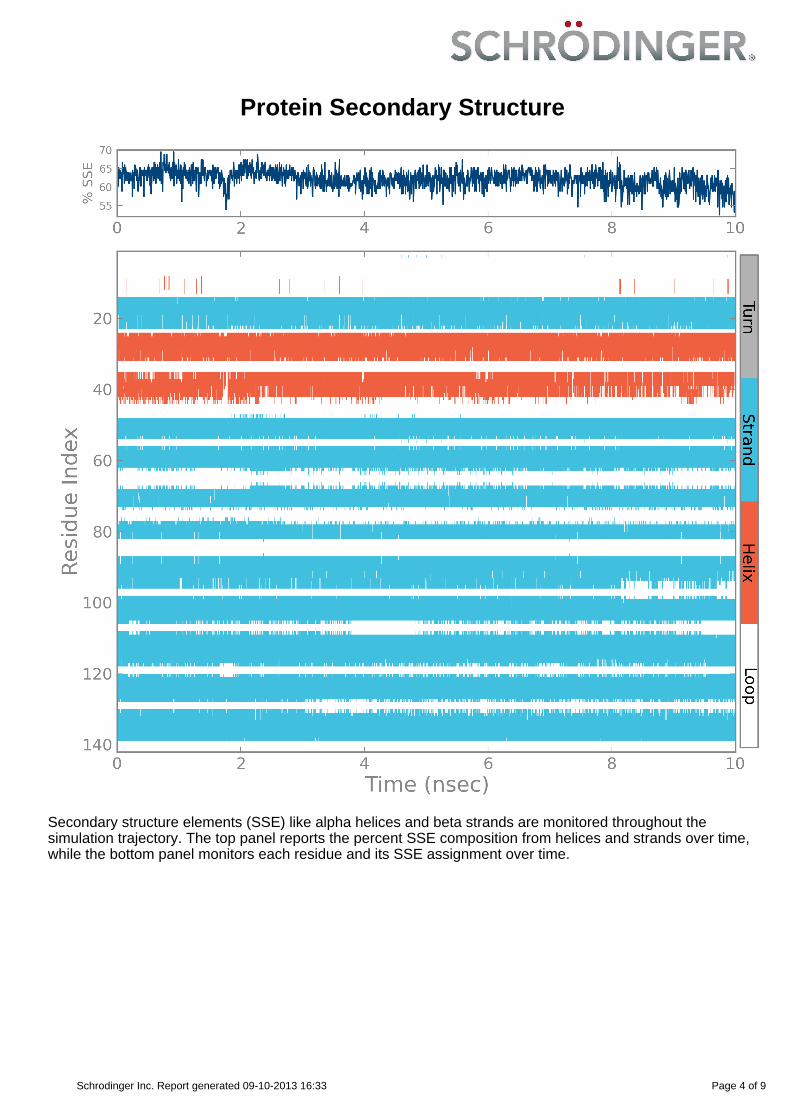
Protein Secondary Structure
Secondary structure elements (SSE) like alpha helices and beta strands are monitored throughout thesimulation trajectory. The top panel reports the percent SSE composition from helices and strands over time,while the bottom panel monitors each residue and its SSE assignment over time.
Page 4 of 9Schrodinger Inc. Report generated 09-10-2013 16:33
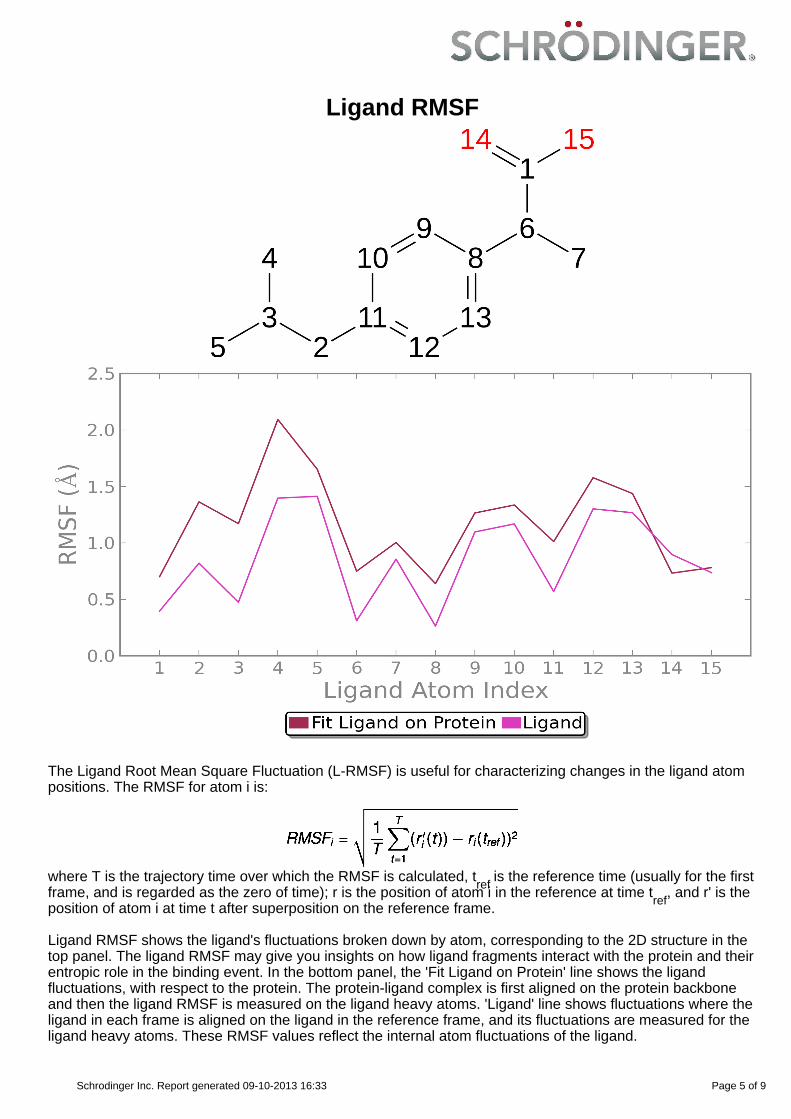
Ligand RMSF
The Ligand Root Mean Square Fluctuation (L-RMSF) is useful for characterizing changes in the ligand atompositions. The RMSF for atom i is:
where T is the trajectory time over which the RMSF is calculated, tref
is the reference time (usually for the firstframe, and is regarded as the zero of time); r is the position of atom i in the reference at time t
ref, and r' is the
position of atom i at time t after superposition on the reference frame.
Ligand RMSF shows the ligand's fluctuations broken down by atom, corresponding to the 2D structure in thetop panel. The ligand RMSF may give you insights on how ligand fragments interact with the protein and theirentropic role in the binding event. In the bottom panel, the 'Fit Ligand on Protein' line shows the ligandfluctuations, with respect to the protein. The protein-ligand complex is first aligned on the protein backboneand then the ligand RMSF is measured on the ligand heavy atoms. 'Ligand' line shows fluctuations where theligand in each frame is aligned on the ligand in the reference frame, and its fluctuations are measured for theligand heavy atoms. These RMSF values reflect the internal atom fluctuations of the ligand.
Page 5 of 9Schrodinger Inc. Report generated 09-10-2013 16:33
Protein-Ligand Contacts
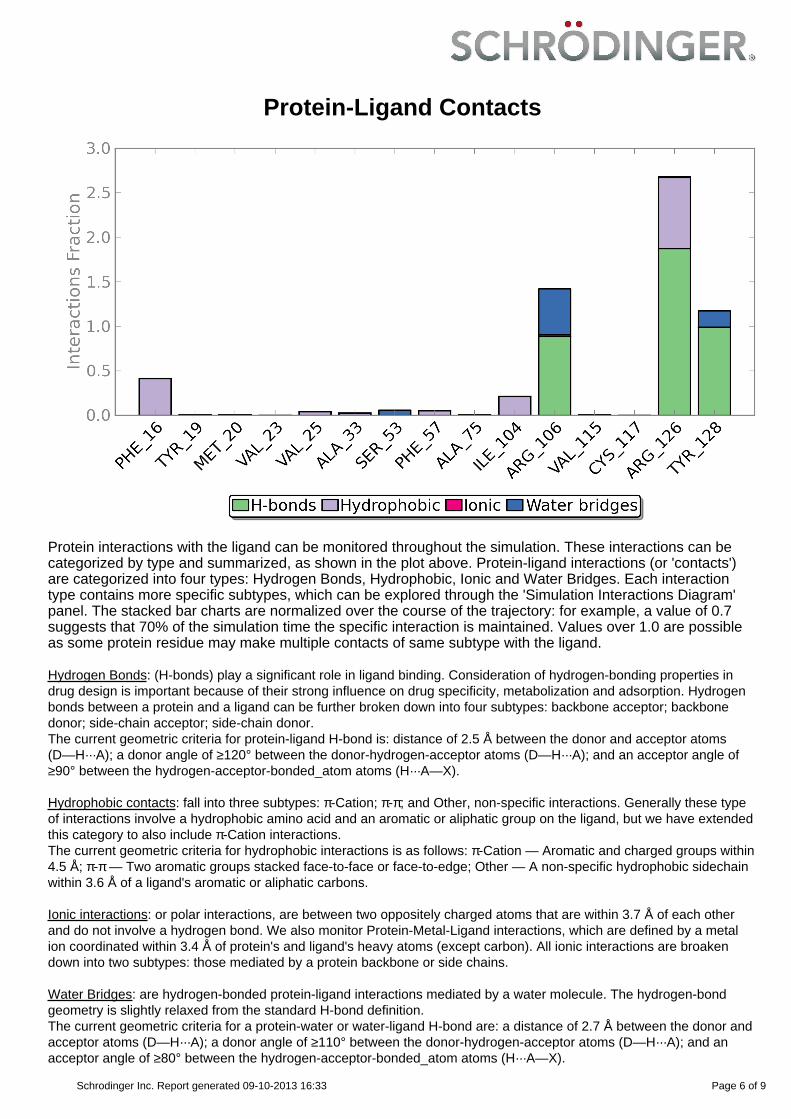
Protein interactions with the ligand can be monitored throughout the simulation. These interactions can becategorized by type and summarized, as shown in the plot above. Protein-ligand interactions (or 'contacts')are categorized into four types: Hydrogen Bonds, Hydrophobic, Ionic and Water Bridges. Each interactiontype contains more specific subtypes, which can be explored through the 'Simulation Interactions Diagram'panel. The stacked bar charts are normalized over the course of the trajectory: for example, a value of 0.7suggests that 70% of the simulation time the specific interaction is maintained. Values over 1.0 are possibleas some protein residue may make multiple contacts of same subtype with the ligand.
Hydrogen Bonds: (H-bonds) play a significant role in ligand binding. Consideration of hydrogen-bonding properties indrug design is important because of their strong influence on drug specificity, metabolization and adsorption. Hydrogenbonds between a protein and a ligand can be further broken down into four subtypes: backbone acceptor; backbonedonor; side-chain acceptor; side-chain donor.The current geometric criteria for protein-ligand H-bond is: distance of 2.5 Å between the donor and acceptor atoms(D—H···A); a donor angle of ≥120° between the donor-hydrogen-acceptor atoms (D—H···A); and an acceptor angle of≥90° between the hydrogen-acceptor-bonded_atom atoms (H···A—X).
Hydrophobic contacts: fall into three subtypes: π-Cation; π-π; and Other, non-specific interactions. Generally these typeof interactions involve a hydrophobic amino acid and an aromatic or aliphatic group on the ligand, but we have extendedthis category to also include π-Cation interactions.The current geometric criteria for hydrophobic interactions is as follows: π-Cation — Aromatic and charged groups within4.5 Å; π-π — Two aromatic groups stacked face-to-face or face-to-edge; Other — A non-specific hydrophobic sidechainwithin 3.6 Å of a ligand's aromatic or aliphatic carbons.
Ionic interactions: or polar interactions, are between two oppositely charged atoms that are within 3.7 Å of each otherand do not involve a hydrogen bond. We also monitor Protein-Metal-Ligand interactions, which are defined by a metalion coordinated within 3.4 Å of protein's and ligand's heavy atoms (except carbon). All ionic interactions are broakendown into two subtypes: those mediated by a protein backbone or side chains.
Water Bridges: are hydrogen-bonded protein-ligand interactions mediated by a water molecule. The hydrogen-bondgeometry is slightly relaxed from the standard H-bond definition.The current geometric criteria for a protein-water or water-ligand H-bond are: a distance of 2.7 Å between the donor andacceptor atoms (D—H···A); a donor angle of ≥110° between the donor-hydrogen-acceptor atoms (D—H···A); and anacceptor angle of ≥80° between the hydrogen-acceptor-bonded_atom atoms (H···A—X).
Page 6 of 9Schrodinger Inc. Report generated 09-10-2013 16:33
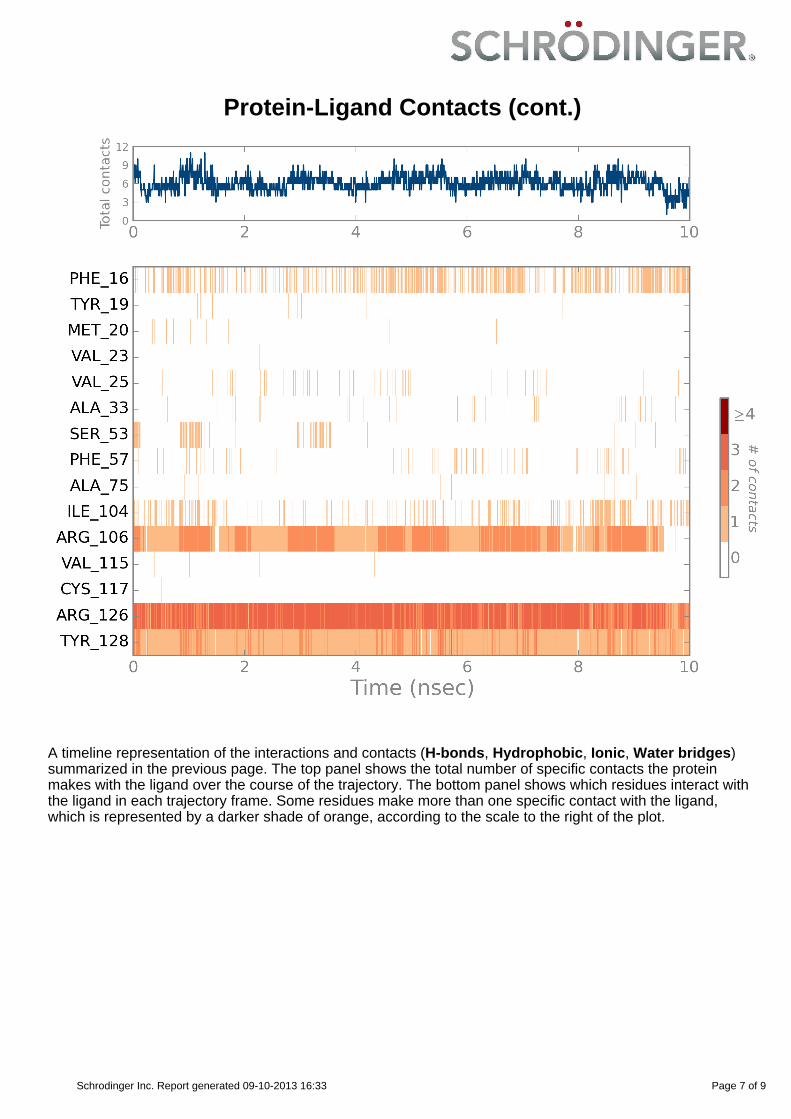
Protein-Ligand Contacts (cont.)
A timeline representation of the interactions and contacts (H-bonds, Hydrophobic, Ionic, Water bridges)summarized in the previous page. The top panel shows the total number of specific contacts the proteinmakes with the ligand over the course of the trajectory. The bottom panel shows which residues interact withthe ligand in each trajectory frame. Some residues make more than one specific contact with the ligand,which is represented by a darker shade of orange, according to the scale to the right of the plot.
Page 7 of 9Schrodinger Inc. Report generated 09-10-2013 16:33
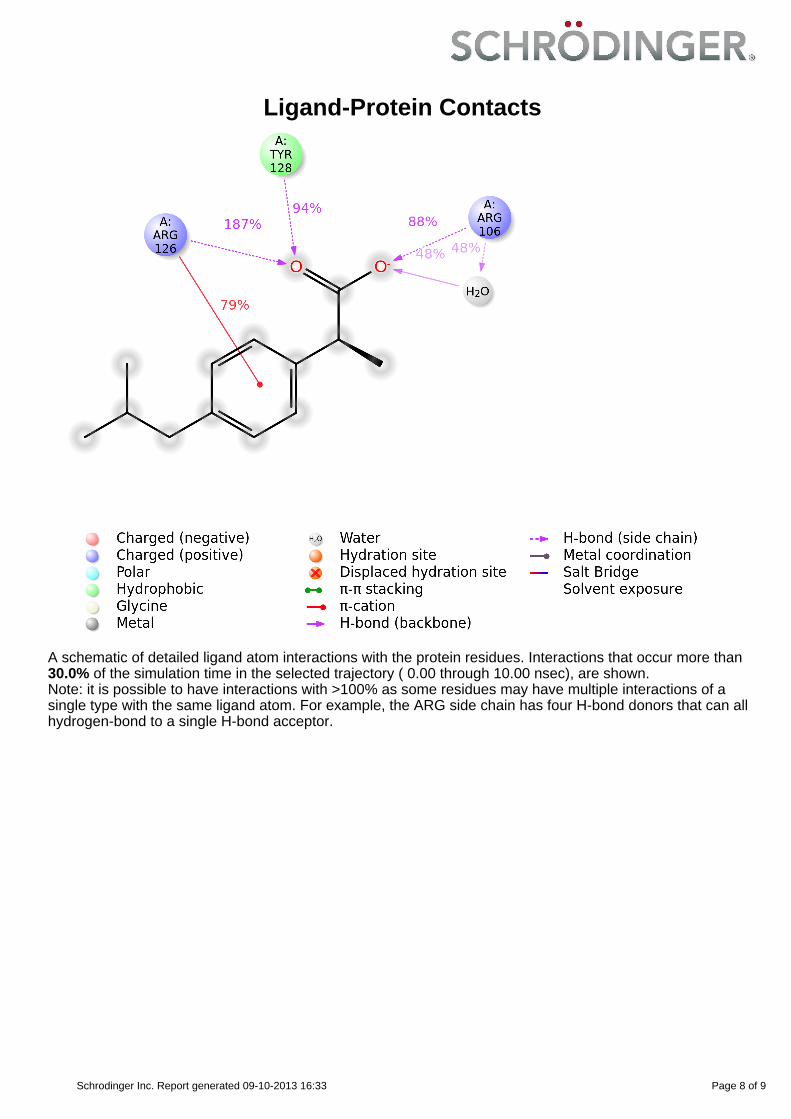
Ligand-Protein Contacts
A schematic of detailed ligand atom interactions with the protein residues. Interactions that occur more than30.0% of the simulation time in the selected trajectory ( 0.00 through 10.00 nsec), are shown.Note: it is possible to have interactions with >100% as some residues may have multiple interactions of asingle type with the same ligand atom. For example, the ARG side chain has four H-bond donors that can allhydrogen-bond to a single H-bond acceptor.
Page 8 of 9Schrodinger Inc. Report generated 09-10-2013 16:33
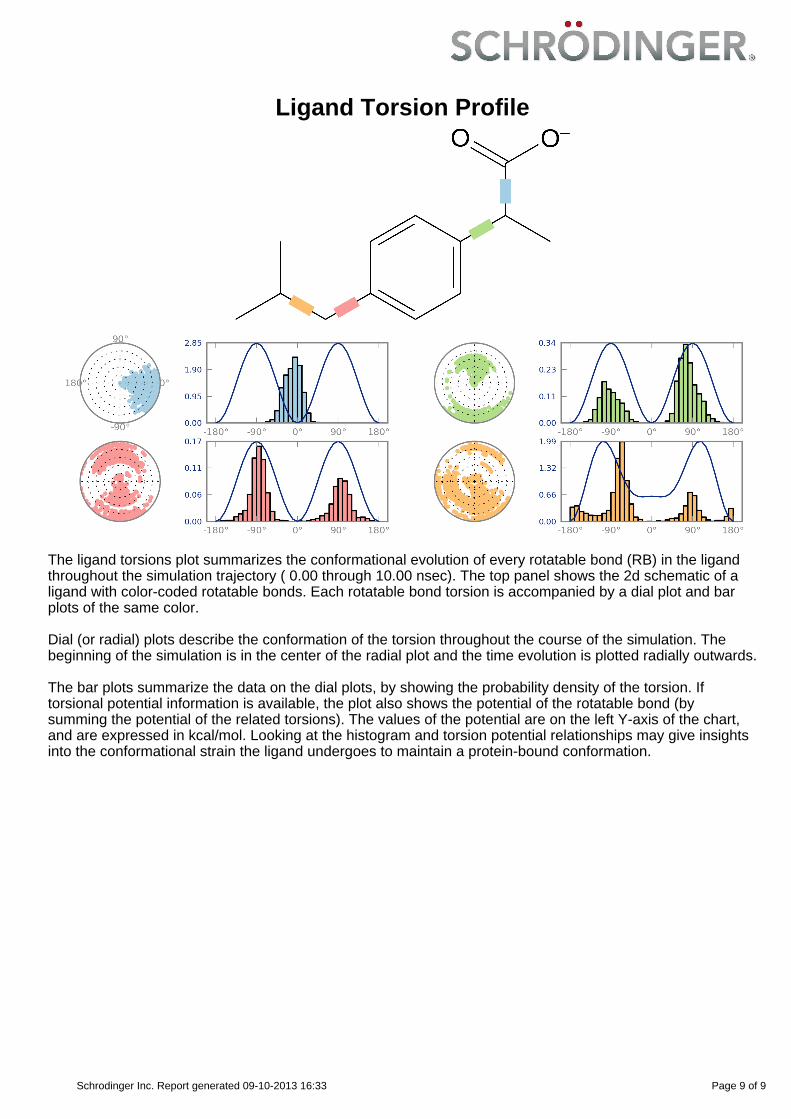
Ligand Torsion Profile
The ligand torsions plot summarizes the conformational evolution of every rotatable bond (RB) in the ligandthroughout the simulation trajectory ( 0.00 through 10.00 nsec). The top panel shows the 2d schematic of aligand with color-coded rotatable bonds. Each rotatable bond torsion is accompanied by a dial plot and barplots of the same color.
Dial (or radial) plots describe the conformation of the torsion throughout the course of the simulation. Thebeginning of the simulation is in the center of the radial plot and the time evolution is plotted radially outwards.
The bar plots summarize the data on the dial plots, by showing the probability density of the torsion. Iftorsional potential information is available, the plot also shows the potential of the rotatable bond (bysumming the potential of the related torsions). The values of the potential are on the left Y-axis of the chart,and are expressed in kcal/mol. Looking at the histogram and torsion potential relationships may give insightsinto the conformational strain the ligand undergoes to maintain a protein-bound conformation.
Page 9 of 9Schrodinger Inc. Report generated 09-10-2013 16:33