Embed Size (px)
Citation preview

Portland State University Portland State University
PDXScholar PDXScholar
Institute for Sustainable Solutions Publications and Presentations Institute for Sustainable Solutions
2-1-1987
Simulation modeling on the Macintosh using Simulation modeling on the Macintosh using
STELLA STELLA
Robert Costanza Portland State University
Follow this and additional works at: https://pdxscholar.library.pdx.edu/iss_pub
Part of the Sustainability Commons
Let us know how access to this document benefits you.
Citation Details Citation Details Costanza, R. 1987. Simulation modeling on the Macintosh using STELLA. BioScience 37:129-132.
This Article is brought to you for free and open access. It has been accepted for inclusion in Institute for Sustainable Solutions Publications and Presentations by an authorized administrator of PDXScholar. Please contact us if we can make this document more accessible: [email protected].
This content downloaded on Wed, 6 Feb 2013 19:42:52 PMAll use subject to JSTOR Terms and Conditions
The Biologist~s Toolbox
Simulation modeling on the Macintosh using STELLA
Simulations of complex systems were among the first applications of high-speed computers.
Their computing power allowed the construction of mathematical models to describe the behavior of systems such as industrial plant operations, extensive ecosystems, or even the arms race. However, writing and debugging the software for simulations has been a tedious and time-consuming task. The beginner needs a strong mathematics background and at least a semester of instruction. These requirements have limited the people who can afford simulation modeling. Biologists without exceptional mathematical prowess were generally wary of simulation as a scientific tool. However, STELLA,! a new software package for the Macintosh, has greatly eased model building for the biologist.
STELLA allows the user to design and run a fairly elaborate model in only a fraction of the time that is usually required, without using a programming language. The program has its limitations, but it performs with style and grace. STELLA takes advantage of the Macintosh graphic user interface by using symbols, windows, and menus to design and run simulations.
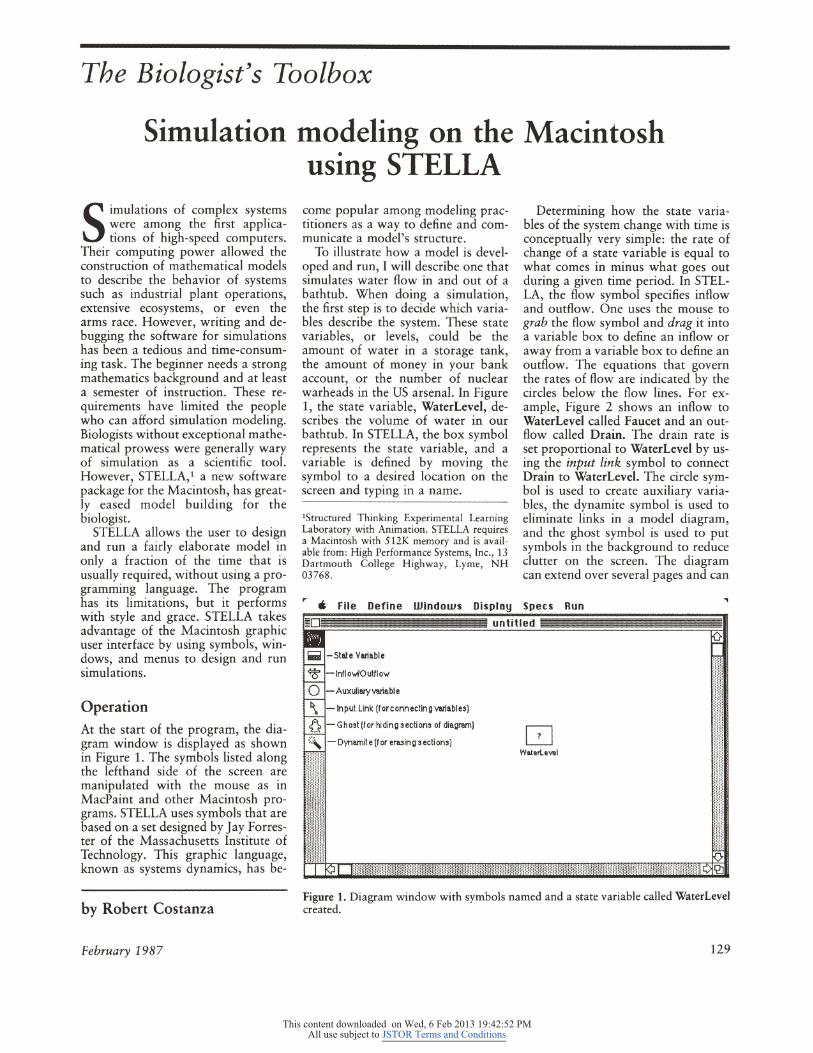
Operation At the start of the program, the diagram window is displayed as shown in Figure 1. The symbols listed along the lefthand side of the screen are manipulated with the mouse as in MacPaint and other Macintosh programs. STELLA uses symbols that are based on a set designed by Jay Forrester of the Massachusetts Institute of Technology. This graphic language, known as systems dynamics, has be-
by Robert Costanza
February 1987
come popular among modeling practitioners as a way to define and communicate a model's structure.
To illustrate how a model is developed and run, I will describe one that simulates water flow in and out of a bathtub. When doing a simulation, the first step is to decide which variables describe the system. These state variables, or levels, could be the amount of water in a storage tank, the amount of money in your bank account, or the number of nuclear warheads in the US arsenal. In Figure 1, the state variable, WaterLevel, describes the volume of water in our bathtub. In STELLA, the box symbol represents the state variable, and a variable is defined by moving the symbol to a desired location on the screen and typing in a name.
lStructured Thinking Experimental Learning Laboratory with Animation. STELLA requires a Macintosh with 512K memory and is available from: High Performance Systems, Inc., 13 Dartmouth College Highway, Lyme, NH 03768.
r • File Define Windows Di
Auxuliary variabl e
Input Link (for connecting variables)
Ghost (for hiding sections of diagram)
D\'Tlemite (for erasing sections)
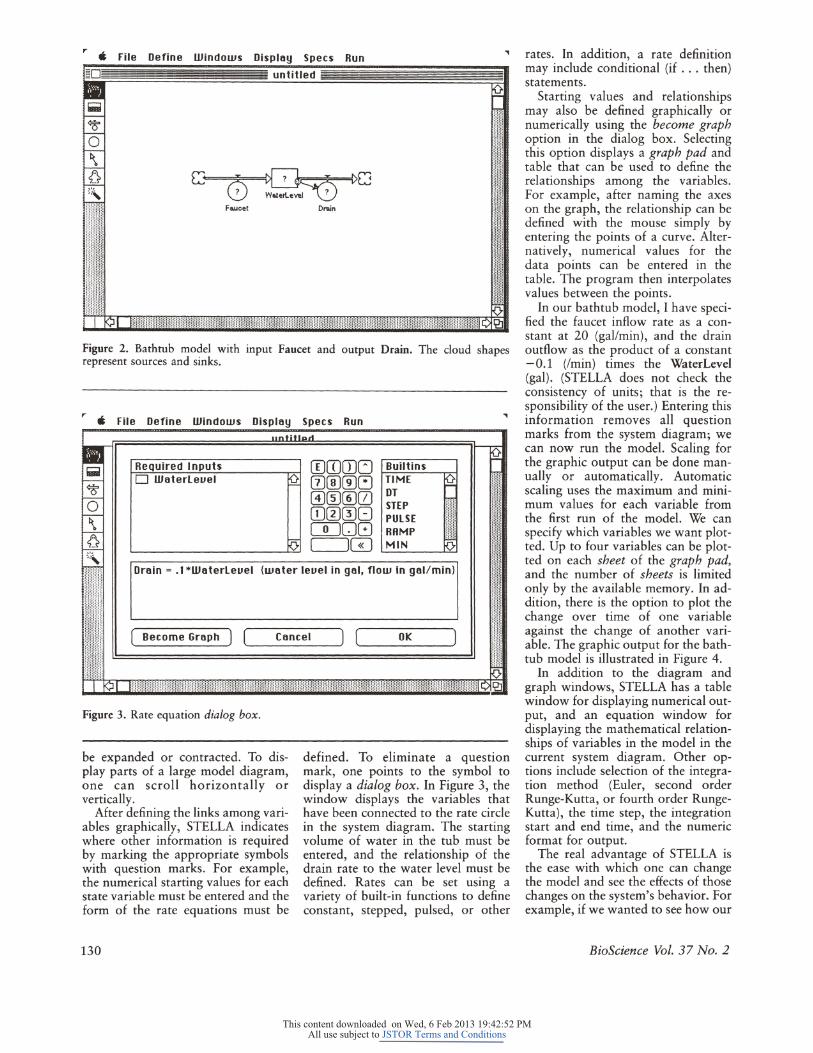
Determining how the state variables of the system change with time is conceptually very simple: the rate of change of a state variable is equal to what comes in minus what goes out during a given time period. In STELLA, the flow symbol specifies inflow and outflow. One uses the mouse to grab the flow symbol and drag it into a variable box to define an inflow or away from a variable box to define an outflow. The equations that govern the rates of flow are indicated by the circles below the flow lines. For example, Figure 2 shows an inflow to WaterLevel called Faucet and an outflow called Drain. The drain rate is set proportional to Water Level by using the input link symbol to connect Drain to Water Level. The circle symbol is used to create auxiliary variables, the dynamite symbol is used to eliminate links in a model diagram, and the ghost symbol is used to put symbols in the background to reduce clutter on the screen. The diagram can extend over several pages and can
.,
D Wa.terle",,!
Figure 1. Diagram window with symbols named and a state variable called WaterLevel created.
129
This content downloaded on Wed, 6 Feb 2013 19:42:52 PMAll use subject to JSTOR Terms and Conditions
.. • File Define Windows Displll ., rates. In addition, a rate definition
~jiiiiiiiiiiiiiiii~iit~~~~ii~~iiiiiiiiiiiiii~~ may include conditional (if ... then) ~ statements.
0~~O I'I~IU Faucet Drain
Figure 2. Bathtub model with input Faucet and output Drain. The cloud shapes represent sources and sinks.
.. • File Define Windows Disp
Required Inputs D WllterLellel Q
0:
Builtins TIME DT STEP PULSE RRMP MIN
.,
Drllin = .'''WllterLellel (wllter lellel in gill, flow in gal/min)
[ Become Grllph 1 [ Cllncel 1 [ ~--------~ ~--------~
OK
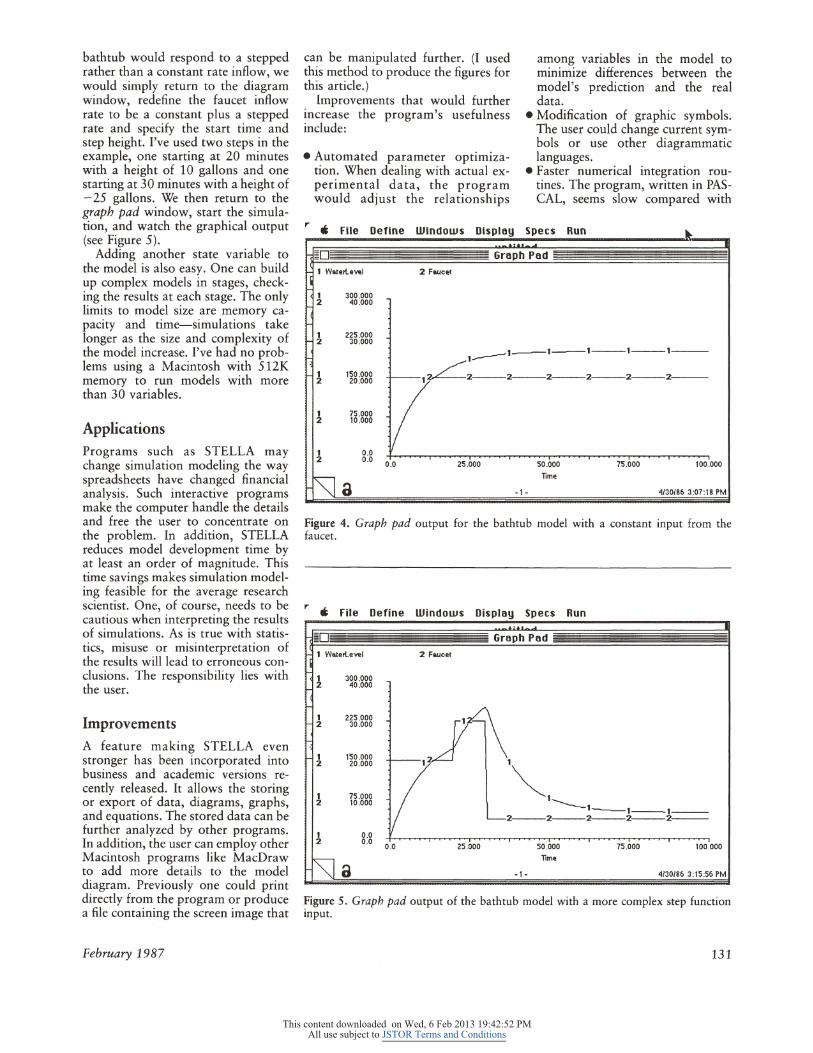
Figure 3. Rate equation dialog box.
be expanded or contracted. To display parts of a large model diagram, one can scroll horizontally or vertically.
After defining the links among variables graphically, STELLA indicates where other information is required by marking the appropriate symbols with question marks. For example, the numerical starting values for each state variable must be entered and the form of the rate equations must be
130
defined. To eliminate a question mark, one points to the symbol to display a dialog box. In Figure 3, the window displays the variables that have been connected to the rate circle in the system diagram. The starting volume of water in the tub must be entered, and the relationship of the drain rate to the water level must be defined. Rates can be set using a variety of built-in functions to define constant, stepped, pulsed, or other
Starting values and relationships may also be defined graphically or numerically using the become graph option in the dialog box. Selecting this option displays a graph pad and table that can be used to define the relationships among the variables. For example, after naming the axes on the graph, the relationship can be defined with the mouse simply by entering the points of a curve. Alternatively, numerical values for the data points can be entered in the table. The program then interpolates values between the points.
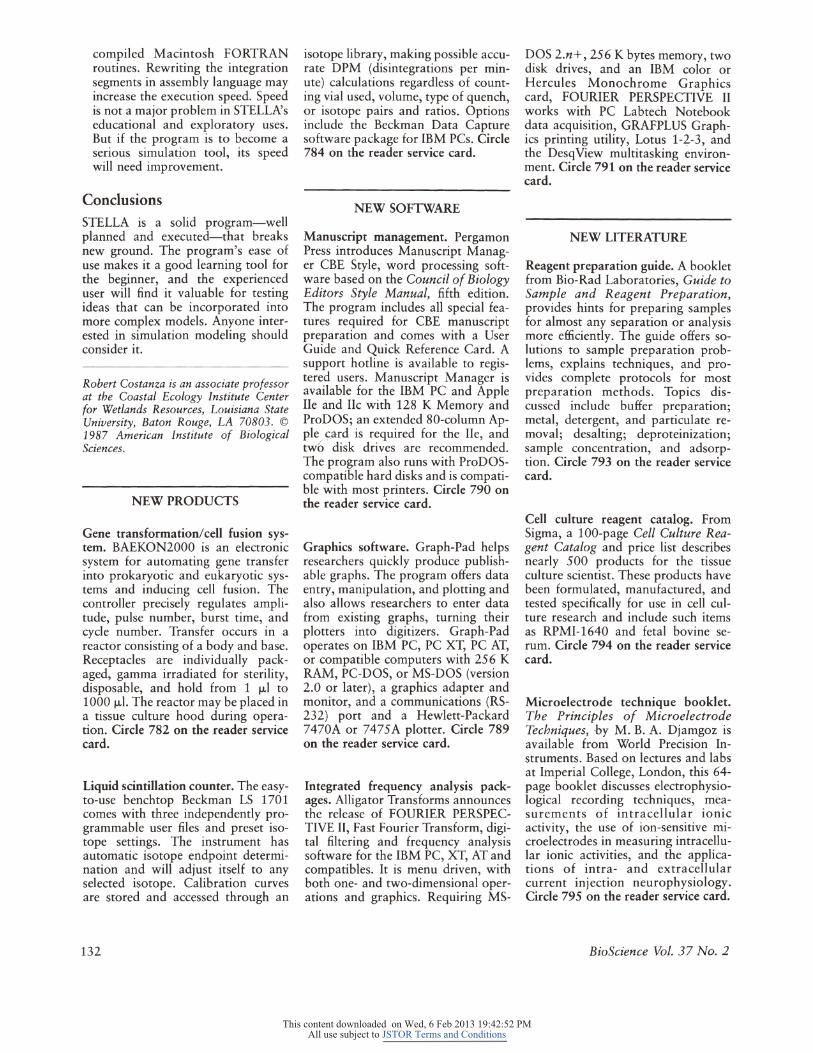
In our bathtub model, I have specified the faucet inflow rate as a constant at 20 (gal/min), and the drain outflow as the product of a constant - 0.1 (lmin) times the WaterLevel (gal). (STELLA does not check the consistency of units; that is the responsibility of the user.) Entering this information removes all question marks from the system diagram; we can now run the model. Scaling for the graphic output can be done manually or automatically. Automatic scaling uses the maximum and minimum values for each variable from the first run of the model. We can specify which variables we want plotted. Up to four variables can be plotted on each sheet of the graph pad, and the number of sheets is limited only by the available memory. In addition, there is the option to plot the change over time of one variable against the change of another variable. The graphic output for the bathtub model is illustrated in Figure 4.
In addition to the diagram and graph windows, STELLA has a table window for displaying numerical output, and an equation window for displaying the mathematical relationships of variables in the model in the current system diagram. Other options include selection of the integration method (Euler, second order Runge-Kutta, or fourth order RungeKutta), the time step, the integration start and end time, and the numeric format for output.
The real advantage of STELLA is the ease with which one can change the model and see the effects of those changes on the system's behavior. For example, if we wanted to see how our
BioScience Vol. 37 No.2
This content downloaded on Wed, 6 Feb 2013 19:42:52 PMAll use subject to JSTOR Terms and Conditions
bathtub would respond to a stepped rather than a constant rate inflow, we would simply return to the diagram window, redefine the faucet inflow rate to be a constant plus a stepped rate and specify the start time and step height. I've used two steps in the example, one starting at 20 minutes with a height of 10 gallons and one starting at 30 minutes with a height of - 25 gallons. We then return to the graph pad window, start the simulation, and watch the graphical output (see Figure 5).
Adding another state variable to the model is also easy. One can build up complex models in stages, checking the results at each stage. The only limits to model size are memory capacity and time-simulations take longer as the size and complexity of the model increase. I've had no problems using a Macintosh with 512K memory to run models with more than 30 variables.
Applications Programs such as STELLA may change simulation modeling the way spreadsheets have changed financial analysis. Such interactive programs make the computer handle the details and free the user to concentrate on the problem. In addition, STELLA reduces model development time by at least an order of magnitude. This time savings makes simulation modeling feasible for the average research scientist. One, of course, needs to be cautious when interpreting the results of simulations. As is true with statistics, misuse or misinterpretation of the results will lead to erroneous conclusions. The responsibility lies with the user.
Improvements
A feature making STELLA even stronger has been incorporated into business and academic versions recently released. It allows the storing or export of data, diagrams, graphs, and equations. The stored data can be further analyzed by other programs. In addition, the user can employ other Macintosh programs like MacDraw to add more details to the model diagram. Previously one could print directly from the program or produce a file containing the screen image that
February 1987
can be manipulated further. (I used this method to produce the figures for this article.)
Improvements that would further Increase the program's usefulness include:
• Automated parameter optimIzation. When dealing with actual experimental data, the program would adjust the relationships
among variables in the model to minimize differences between the model's prediction and the real data.
• Modification of graphic symbols. The user could change current symbols or use other diagrammatic languages.
• Faster numerical integration routines. The program, written in PASCAL, seems slow compared with
,. '* File Define Windows Disploy Specs Run
-0 1 \'Iatetlevel
1 300 .000 2 40 .000
1 225 .000 2 30.000
1 150.000 2 20.000
1 75 .000 2 10.000
0.0
' t.L
Groph Pod
2 Faucet
1_1--1--1--1---1----vr'_2_2_2_2_2-1 2 0.0 0 .0 25 .000 50.000
Tome 75 .000 100.000
-1 - 4130186 3:07:18 PM
Figure 4. Graph pad output for the bathtub model with a constant input from the faucet.
,. '* File Define Windows Disploy Specs Run
:0 Groph Pod
1 \'Iatetlevel 2 Faucet
1 300.000 2 40 .000
1 225 .000 2 30 .000
1 150 .000 2 20.000
1 75.000 2 10.000
r-.ft. If ~1 ----1--1 __ 1 __ _
~2--2--2--2--2---
0.0 0.0 0 .0 25 .000 50 .000
Time 75.000 100 .000
-1- 41301863 :15:56 PM
Figure 5. Graph pad output of the bathtub model with a more complex step function input.
131
This content downloaded on Wed, 6 Feb 2013 19:42:52 PMAll use subject to JSTOR Terms and Conditions
compiled Macintosh FORTRAN routines. Rewriting the integration segments in assembly language may increase the execution speed. Speed is not a major problem in STELLA's educational and exploratory uses. But if the program is to become a serious simulation tool, its speed will need improvement.
Conclusions STELLA is a solid program-well planned and executed-that breaks new ground. The program's ease of use makes it a good learning tool for the beginner, and the experienced user will find it valuable for testing ideas that can be incorporated into more complex models. Anyone interested in simulation modeling should consider it.
Robert Costanza is an associate professor at the Coastal Ecology Institute Center for Wetlands Resources, Louisiana State University, Baton Rouge, LA 70803 . © 1987 American Institute of Biological Sciences.
NEW PRODUCTS
Gene transformation/cell fusion system. BAEKON2000 is an electronic system for automating gene transfer into prokaryotic and eukaryotic systems and inducing cell fusion. The controller precisely regulates amplitude, pulse number, burst time, and cycle number. Transfer occurs in a reactor consisting of a body and base. Receptacles are individually packaged, gamma irradiated for sterility, disposable, and hold from 1 J.Ll to 1000 J.L1. The reactor may be placed in a tissue culture hood during operation. Circle 782 on the reader service card.
Liquid scintillation counter. The easyto-use bench top Beckman LS 1701 comes with three independently programmable user files and preset isotope settings. The instrument has automatic isotope endpoint determination and will adjust itself to any selected isotope. Calibration curves are stored and accessed through an
132
isotope library, making possible accurate DPM (disintegrations per minute) calculations regardless of counting vial used, volume, type of quench, or isotope pairs and ratios. Options include the Beckman Data Capture software package for IBM PCs. Circle 784 on the reader service card.
NEW SOFTWARE
Manuscript management. Pergamon Press introduces Manuscript Manager CBE Style, word processing software based on the Council of Biology Editors Style Manual, fifth edition. The program includes all special features required for CBE manuscript preparation and comes with a User Guide and Quick Reference Card. A support hotline is available to registered users . Manuscript Manager is available for the IBM PC and Apple lIe and IIc with 128 K Memory and ProDOS; an extended 80-column Apple "sard is required for the lIe, and tw6 disk drives are recommended. The program also runs with ProD OScompatible hard disks and is compatible with most printers. Circle 790 on the reader service card.
Graphics software. Graph-Pad helps researchers quickly produce publishable graphs. The program offers data entry, manipulation, and plotting and also allows researchers to enter data from existing graphs, turning their plotters into digitizers. Graph-Pad operates on IBM PC, PC XT, PC AT, or compatible computers with 256 K RAM, PC-DOS, or MS-DOS (version 2.0 or later), a graphics adapter and monitor, and a communications (RS-232) port and a Hewlett-Packard 7470A or 7475A plotter. Circle 789 on the reader service card.
Integrated frequency analysis packages. Alligator Transforms announces the release of FOURIER PERSPECTIVE II, Fast Fourier Transform, digital filtering and frequency analysis software for the IBM PC, XT, AT and compatibles. It is menu driven, with both one- and two-dimensional operations and graphics. Requiring MS-
DOS 2.n+, 256 K bytes memory, two disk drives, and an IBM color or Hercules Monochrome Graphics card, FOURIER PERSPECTIVE II works with PC Labtech Notebook data acquisition, GRAFPLUS Graphics printing utility, Lotus 1-2-3, and the DesqView multitasking environment. Circle 791 on the reader service card.
NEW LITERATURE
Reagent preparation guide. A booklet from Bio-Rad Laboratories, Guide to Sample and Reagent Preparation, provides hints for preparing samples for almost any separation or analysis more efficiently. The guide offers solutions to sample preparation problems, explains techniques, and provides complete protocols for most preparation methods. Topics discussed include buffer preparation; metal, detergent, and particulate removal; desalting; deproteinization; sample concentration, and adsorption. Circle 793 on the reader service card.
Cell culture reagent catalog. From Sigma, a 100-page Cell Culture Reagent Catalog and price list describes nearly 500 products for the tissue culture scientist. These products have been formulated, manufactured, and tested specifically for use in cell culture research and include such items as RPMI-1640 and fetal bovine serum. Circle 794 on the reader service card.
Microelectrode technique booklet. The Principles of Microelectrode Techniques, by M. B. A. Djamgoz is available from World Precision Instruments. Based on lectures and labs at Imperial College, London, this 64-page booklet discusses electrophysiological recording techniques, measurements of intracellular ionic activity, the use of ion-sensitive microelectrodes in measuring intracellular ionic activities, and the applications of intra- and extracellular current injection neurophysiology. Circle 795 on the reader service card.
BioScience Vol. 37 No.2