Embed Size (px)
Citation preview

8th European LS-DYNA Users Conference, Strasbourg - May 2011
SIMULATION OF CHARGE AND STRUCTURE BEHAVIOUR IN A TUMBLING MILL
Pär Jonsén 1, Bertil I. Pålsson 2, Hans-Åke Häggblad1, Kent Tano 3, Andreas Berggren 4
1 Division of Solid Mechanics, Luleå University of Technology, SE-97187 Luleå, Sweden,
2 Division of Mineral Processing, Luleå University of Technology, SE-97187 Luleå,
Sweden,
3Technology and Business Development, LKAB, SE-98381 Malmberget, Sweden,
4 Technology and Development, Boliden Minerals, SE-93681 Boliden, Sweden
ABSTRACT
For a long time discrete element methods (DEM) has been used as simulation tools to gain insight into particulate flow processes. Such a process may be grinding in tumbling mills, where the mechanical behaviour is complex. To include all phenomena that occur in a mill in a single numerical model is today not possible. Therefore, a common approach is to model milling charges using the DEM assuming a rigid mill structure. To close the gap between reality and numerical models in milling, more physically realistic methods must be used. In this work, the finite element method (FEM) and the smoothed particle hydrodynamic (SPH) method are used together to model a ball mill charge in a tumbling mill. The mesh free formulation and the adaptive nature of the SPH method result in a method that handles extremely large deformations and thereby suits for modelling of grinding charges. The mill structure consists of rubber lifter and liners and a mantel made of solid steel. It is modelled with the finite element method. For the elastic behaviour of the rubber, a Blatz-Ko hyper-elastic model is used. The supplier of the lining provided experimental data for the rubber. The deflection profile of the lifters obtained from SPH-FEM simulation shows a reasonably good correspondence to pilot mill measurements as measured by an embedded strain gauge sensor. This computational model makes it possible to predict charge pressure and shear stresses within the charge. It is also possible to predict contact forces for varying mill dimensions and liner combinations.

8th European LS-DYNA Users Conference, Strasbourg - May 2011
1 Introduction Grinding in tumbling mills are one of the most energy consuming unit operations as much of the energy is wasted in impact, that do not break particles. Therefore, it is of great importance to run the grinding process as efficiently as possible. Autogenous (AG) and semi-autogenous (SAG) mills often operate in a metastable state because of the difficulty to balance the rate of replenishment of large ore particles from the feed with the consumption in the charge. This has led to an increased interest in obtaining an accurate and direct measurement of mill load and the behaviour of the mill charge. Several parameters do significantly influence the effectiveness of the grinding operation; however, some of these parameters are either difficult or laborious to measure. Intermittent in-situ measurements of these are most often prone to errors and there is often a long time-delay before the acquired data can be fed to the control system. Understanding of the charge motion within the mill is of importance in mill optimisation. Both the breakage of ore particles and the wear of liners/ball media are closely linked to the charge motion. To study these phenomena in a physically correct manner, suitable numerical models for different parts of the mill system has to be utilised. Validation of these models is of major importance. For tumbling mill simulations the distinct element methods (DEM) has been an important numerical tools to gain insight into particulate flow processes. Cundall (1971) introduced DEM for analyses of rock mechanic problems. When applied to comminution it gives an opportunity to study several aspects of grinding in detail than has been possible to date, e.g. charge viscosity and charge size distribution, collision forces, energy loss spectra and power consumption. An initial attempt to use DEM to describe the interaction of large grinding balls and the lining was presented by Rajamani (2000). However, some improvements of today’s DEM models can be identified; for example, the structure of the mill (geometry and material composition) may be modelled with the finite element method (FEM). One-step towards a more physically realistic mill model was taken by Jonsén et al. (2011). They used a combined DEM-FEM model to study the interaction between the charge and the mill structure. To solve astrophysical problems in open space, Lucy (1977) and at the same time Gingold and Monaghan (1977), invented the smoothed particle hydrodynamics (SPH) method independently. It is a mesh free, point-based method for modelling fluid flows, which has been extended to solve problems with material strength. Today, the SPH method is used in many areas such as fluid mechanics (for example; free surface flow, incompressible flow and compressible flow), solid mechanics (for example; high velocity impact and penetration problems) and high explosive detonation over and under water. In the SPH method, a problem domain is represented by a set of particles or points (Liu & Liu, 2009). Besides representing the problem domain, the points also act as the computational frame for the field approximation. Each point is given a mass and carries information about spatial coordinate, velocity, density and internal energy. Other quantities as stresses and strains are derived from constitutive relations. The mesh free Lagrangian formulation and the adaptive nature of the SPH method result in a method that handles extremely large deformations. In this work, a step towards a physically correct description of the ball charge is taken by using SPH to model the ball charge.

8th European LS-DYNA Users Conference, Strasbourg - May 2011
The comminution process is complex and to include all phenomena that occur in a single numerical model is today not possible. Therefore, modelling the physical interaction between the charge and the mill structure is the major goal in this work. The validation of this task is done by comparing numerical results with experimental measurements from grinding in a pilot mill equipped with an instrumented rubber lifter.
2 Experimental setup Experimental measurements have been done in a pilot mill. The deflection of a rubber lifter has been measured.
2.1 Measurement system
One lifter is equipped with a sensor and a simplified view of the sensor is shown in Fig. 1. The mill has several lifters and the one equipped with a leaf spring (marked 1) is whose deflection is measured by the strain gauge (marked 2). As the mill rotates and the lifter with the sensor dips into the charge, the force acting on the lifter increases, which in turn, causes a deflection. The strain gauge mounted on the leaf spring converts this deflection to an electric signal. This signal is amplified, filtered and transmitted to a computer. Metso Minerals have marketed the sensor system under the name Continuous Charge Measurement system (CCM), cf. Dupont and Vien (2001). A typical deflection profile of the sensor signal and an attempt to divide it into different segments is shown in Fig. 2. The boundaries and size of the partitions are determined by engineering knowledge of the grinding process. Each segment in Fig. 2 illustrates an important dynamic event during the passage of the sensor-equipped lifter bar under the mill charge. The ordinate in Fig. 2 shows the deflection of the lifter bar, which indirectly corresponds to the force acting on it and the abscissa is the mill rotation angle with a resolution of 1°.
Toe angle
°90
°180
°270
°0
(1) Lifter bar
(2) Sensor
Should
er a
ngle
Toe
PulpCharge
Shoulder
Figure 1. To the right a cross section of a mill with a horizontal reference line, the left part shows the lifter bar (1) with a strain gauge sensor embedded (2), from Tano (2005).

8th European LS-DYNA Users Conference, Strasbourg - May 2011
The sensor signature reflects different charge features such as mill volume, position and behaviour of the mill charge. Both toe region (S2) and shoulder region (S6) are well known, and can be used to calculate the volumetric mill load and the angle of repose based on the CSM-signal that is calibrated against the measured charge volume when the charge is at rest. Collectively, these data give a good measure of the location of the charge. The other segments are less known but are expected to provide information about grinding efficiency. Such features can be extracted from the sensor signal for the purpose of process monitoring and diagnosis of process performance. Table 1 provides a summary of the stages during one mill revolution. The lifter bar angles given in Table 1 correspond to the positions marked in Fig. 2, as a reference in these measurements is the horizontal line, which corresponds to 0 degrees at the 9 o’clock position. In this work, an attempt is made to identify the corresponding segments in a predicted deflection profile obtained from SPH-FEM simulation. The toe/shoulder position in particular will be compared for validation purposes.
0 30 60 90 120 150 180 210 240 270 300 330 360
0
0.2
0.4
0.6
0.8
1
Rotation angle [degrees]
Nor
mal
ised
def
lect
ion
[−]
s1
s2
s5
s6
s7
s4
s3
Figure 2. Segmentation of a typical sensor signal during its passage in the charge Tano (2005).
Table 1. Sensor lifter bar signal segmentation and grinding load features Tano (2005).
Segment Lifter bar angle Process feature S1: the sensor lifter bar (SL) is still in the air < 50° S2: the SL hits the ball charge and starts to get submerged in the charge
50°- 70° Indicate the toe position of the charge, and if present, the slurry pool
S3: the SL starts to bend forward due to turbulence in the toe area
70°- 85° Rate of charge varies with mill speed
S4: the SL is at peak bending 75°- 90° Both speed and charge level has an influence, wear of lifter
S5: the SL is moving through the charge 80°- 190° Ind ication of every lifter bar hitting the charge S6: the SL has gradually decrease the bending and is at take-off position
190°- 215° Indicates the shoulder position of the c harge
S7: the SL is leaving the ball charge and starts slowly to rise to an upright position
> 215°

8th European LS-DYNA Users Conference, Strasbourg - May 2011
2.2 Experimental conditions
The pilot mill is 1.41 m in diameter and 1.22 m in length. It is a grate-discharge mill, equipped with 12 rubber lifters of square size 0.1 m and a face angle of 45 degrees. Steel balls with a diameter ranging between 10-30 mm and a density of 7800 kg/m3 were used in the experiments. The test material, a hematite pellet feed with d50 around 35µm and a solids density of 5200 kg/m3, was chosen to get stable grinding conditions with respect to feed size variations. Feed rate was kept constant at approx. 1.5 tonne/h. Four experiments were run with the mill speed at 73% and 78% of critical speed (nc) for two levels of mill filling (J = 25% and 35% by volume). The embedded strain gauge sensor measured the load position (toe and shoulder) using the CCM algorithm, proprietary of Metso Minerals. More details regarding the experimental measurements can be found in Tano (2005).
3 Modelling To virtually reproduce a tumbling ball mill process a combined three dimensional SPH-FEM model is used. The model consists of a charge modelled with SPH and the mill structure modelled with FEM. The nonlinear finite element code LS-Dyna v971 R5 (2010) has been used for the modelling and simulation of the mill. The mill structure consists of lifters, liners made of rubber, and a mantel made of solid steel. Here the rubber is modelled as a hyper-elastic material and the mill mantel is modelled as a rigid material.
3.1 Charge model
The ball charge is modelled with spherical SPH particles with LS-Dyna. The problem domain in SPH is represented by a set of particles or points. Besides representing the problem domain, the points also act as the computational frame for the field approximation. Initially, each point is given mass and coordinate information. During calculation, information about spatial coordinate, velocity, density and internal energy is stored in the each point. From constitutive relations, stresses and strains are derived. The SPH method is an adaptive Lagrangian method, which means that in every time step the field function approximations are performed based on the current local set of distributed points. Another difference from the FE method is that the points are free to move in action of the internal and external forces, there are no direct connections between them like the mesh in FE method. The SPH method is originally a continuum-based method used to model fluids, granular and solid material. The basic idea for a numerical method is to reduce the partial differential equations (PDE:s) describing the field functions (for example; density, accelerations and internal energy) to a set of ordinary differential equations (ODE:s), with respect to time only. These equations can easily be solved with some standard integration routine. With the SPH method, this is carried out by the following key-steps: 1. The problem domain is represented by an arbitrary distributed set of no connected points. (Mesh free) 2. Each field function is rewritten as integral functions. (Kernel approximation)
8th European LS-DYNA Users Conference, Strasbourg - May 2011
3. The kernel approximation is then further approximated using the points. This is called the particle approximation. The integrals are replaced with summations over the neighbouring points to each computational point in the system. 4. The particle approximations are performed to each point at every time step, based on the local distribution of points. 5. By the particle approximations all field functions (PDE:s) are reduced to ODE:s with respect to time only. (Lagrangian) 6. The ODE:s are solved using an explicit integration algorithm. 7. Other quantities are derived from constitutive relations. The kernel approximation serves to represent an arbitrary field function in integral form. An arbitrary function, f, is written in integral form as:
( ) ( ) ( )f f dδΩ
′ ′ ′= −∫x x x x x (1)
Where f is a field function of the three-dimensional position vector x, and ( )δ ′−x x is the Dirac delta function. Ω is the volume of the integral that contains x. So far, the integral representation of the function is exact, as long as f(x) is defined and continuous in Ω. Next, the Dirac delta function ( )δ ′−x x is replaced with a smoothing kernel
function ( , )W h′−x x , according to:
( ) ( ) ( , )f f W h dΩ
′ ′ ′= −∫x x x x x (2)
In the smoothing function, h is the smoothing length, defining the influence area of the smoothing function. The integral representation approximates the field function as long as W is not the Dirac delta function. This is called the kernel approximation. A more detailed description regarding kernel approximation and particle approximation can be found in (Liu & Liu, 2009) and (LSTC LS-Dyna 2010). In the present case, the ball charge is modelled with 6000 SPH particles. In 3D, a sphere represents the SPH particle with its radius controlled by the value of h. To model the steel balls in the charge the sphere is given a constant mass and radius. Here, the grinding balls are modelled in three different sizes 10, 20 and 30 mm. A ball charge with a distributed ball size is called a graded charge. Each sphere size is given a mass m and radius h that correspond to the density of steel 7800kg/m3. For modelling of fluids, the smoothing function can vary. For this case, a constant value of h is set for the spheres. A constitutive relation eq. 3 given by the Drücker-Prager model governs the interaction between the balls.
2 2( , ) 2 0dpf p J J kp d= + + = (3)

8th European LS-DYNA Users Conference, Strasbourg - May 2011
Where, p is the mean pressure, J2, the second invariant of the deviator stress tensor and k and d are material parameters representing internal friction and cohesion. In LS-Dyna the constitutive model type 5 (Soil and Foam) is used to mimic the Drücker-Prager model. The elastic properties are considered constant for the actual range of density. For DEM simulation a recommended value for the particle-particle contact is µ= 0.5, Rajamani (2000). In the case of SPH, a constitutive relation above governs this inner friction by the material coefficient k. From the DEM particle-particle friction value an approximate value for the coefficient a2=0.3 is used in the Soil and Foam model. The constitutive model will govern the mechanical response of the grinding charge and when the SPH particles interact with each other or the lining values of mechanical properties like stress can be calculated. The SPH particle will give a constant value of these properties within the particle.
3.2 Mill structure model
The length of the pilot mill is 1.22 m, however, in the numerical model only a slice of 0.10 m is modelled. All structural parts of the model: rubber liners, rubber lifters and mantel are modelled with eight node solid elements. This type of element is fully integrated with a reduced integration of the pressure part to avoid volumetric locking of the element. The elastic behaviour of the rubber is governed by the Blatz-Ko hyper-elastic model (Blatz and Ko, 1962). A classic approach to model rubber material is to use a hyper-elastic model. A hyper-elastic material is an ideally elastic material for which the stress-strain relationship derives from a strain energy density function. The supplier of the lining provides experimental data for the rubber.
Figure 3. a) the 3D FEM model of the mill containing lifter and liners in rubber and a solid mantel modelled with rigid material, b) a close up of the liner and lifter mesh is shown.
In Fig. 3, the FEM model of the mill is shown. The mill model contains two parts, the lining containing 12 lifters and liners and a solid mantel. The force response on the rubber structure is an interesting characteristic of the mill system. Contact force history of one of the lifters during a number of evolutions is studied in detail. To study forces in

8th European LS-DYNA Users Conference, Strasbourg - May 2011
the liners a section plane is added in the liner behind the studied lifter, specifically between elements in row three and four. The action of the section plane is to add all forces in the plane together. In Fig. 4, a detailed illustration of the lifter mesh with the added section plane is shown. A total number of 11620 solid elements are used to model the structure. The deflections of the lifter are tracked by monitoring the positions of two nodes at the locations nearest the true base and tip of the lifter, see Fig. 4. The friction coefficients for the particle-wall contact was set to µ= 0.9 by Tano (2005), based on values published by Rajamani (2000). For the contact between the particles and the structure a “nodes to surface” contact is used. This type of contact is a so-called one-way contact, which works well when the master side are SPH-particles.
Figure 4. The mesh of the lifter with the section plane, also the locations of the nodes at the tip and base are shown.
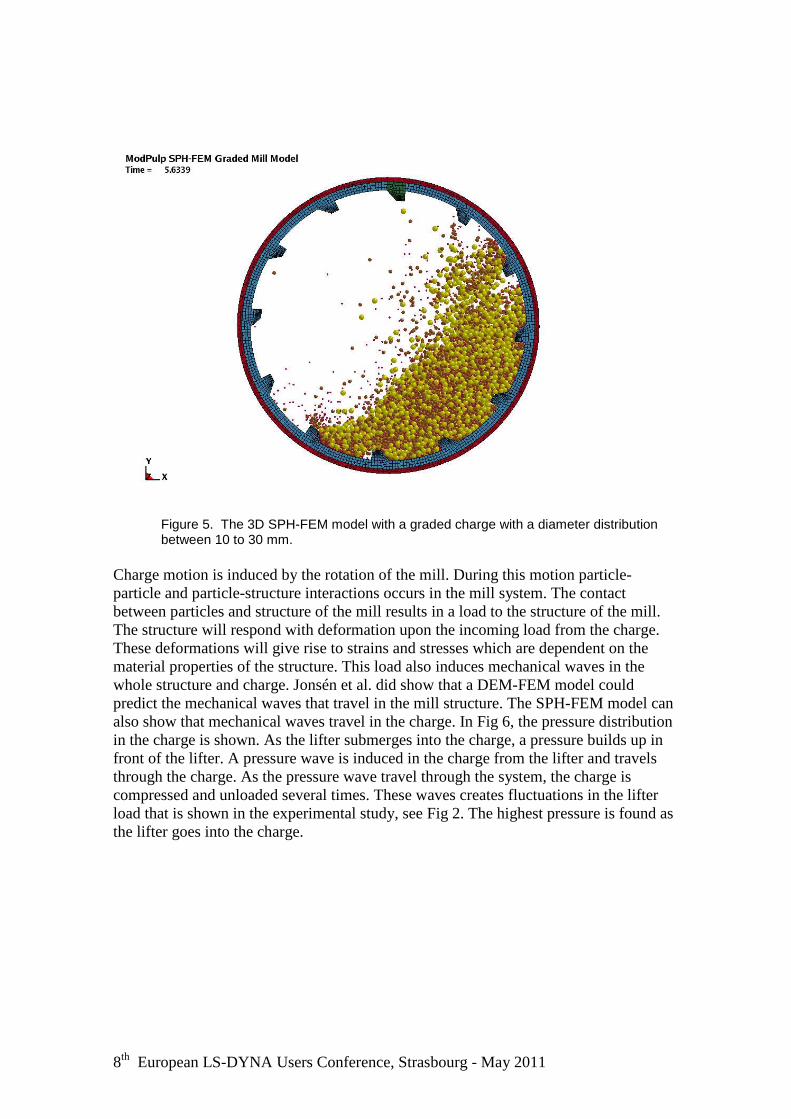
4 Results In the numerical study the charge filling is J = 25% and speed 73% of critical rotational speed. The charge has a ball diameter distribution from 10 to 30 mm, one third of each type, also called a graded charge. A snapshot of the charge movement at steady state is shown in Fig. 5.
8th European LS-DYNA Users Conference, Strasbourg - May 2011
Figure 5. The 3D SPH-FEM model with a graded charge with a diameter distribution between 10 to 30 mm.
Charge motion is induced by the rotation of the mill. During this motion particle-particle and particle-structure interactions occurs in the mill system. The contact between particles and structure of the mill results in a load to the structure of the mill. The structure will respond with deformation upon the incoming load from the charge. These deformations will give rise to strains and stresses which are dependent on the material properties of the structure. This load also induces mechanical waves in the whole structure and charge. Jonsén et al. did show that a DEM-FEM model could predict the mechanical waves that travel in the mill structure. The SPH-FEM model can also show that mechanical waves travel in the charge. In Fig 6, the pressure distribution in the charge is shown. As the lifter submerges into the charge, a pressure builds up in front of the lifter. A pressure wave is induced in the charge from the lifter and travels through the charge. As the pressure wave travel through the system, the charge is compressed and unloaded several times. These waves creates fluctuations in the lifter load that is shown in the experimental study, see Fig 2. The highest pressure is found as the lifter goes into the charge.

8th European LS-DYNA Users Conference, Strasbourg - May 2011
Figure 6. A snapshot of the pressure distribution in the charge.
The maximum shear stress distribution for the mill is shown in Fig 7. The highest value for the shear stress is found close to where the high pressures are found. As for the pressure, the shear stress is also changing from low to high level as the mechanical waves travel in the system.
Figure 7. A snapshot of the shear stress in the charge.

8th European LS-DYNA Users Conference, Strasbourg - May 2011
To study the charge impact on the mill structure during the milling process one can study forces and deflections of a lifter in the system. To observe the forces that go through the system of liners, a section plane is introduced in the liner behind the studied lifter. The deflection of the lifter is also analysed and compared to the experimental measurements. The charge movement will induce forces to the structure and the structure will deform upon the incoming load from the charge. These deformations will give rise to strains and stresses, which are dependent on the material properties of the structure. A snapshot of the von Mises’ stress field for the lining during its passage through the charge is shown in Fig. 8.
Figure 8. A snapshot of the von Mises’ stress field for a part of the mill model during its passage through the charge.
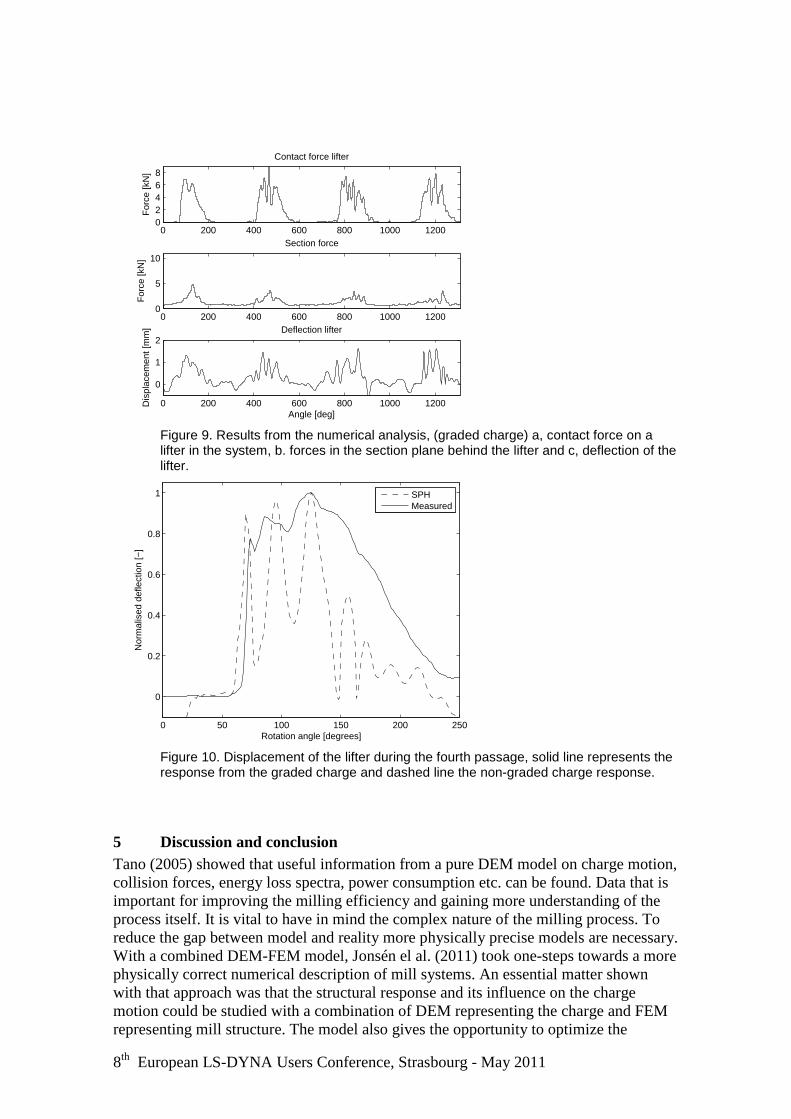
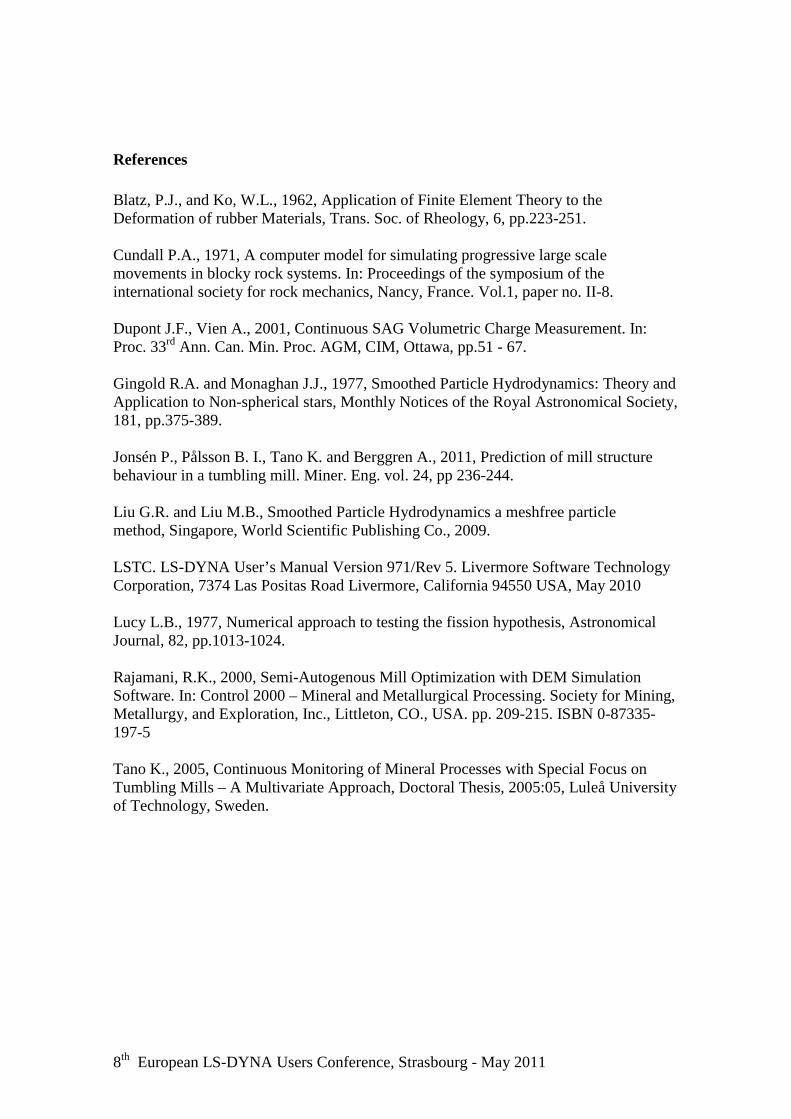
As the model is just a small segment of the actual mill, the forces are recalculated to a 1.22 m long mill. Results for contact forces, section forces and deflection for four passages for the model are shown in Figs. 9. In the beginning of the simulation, the system has a start-up process and the system has to find steady state. This explains why the first passage show a dissimilar response compared to the following three passages. During passage in the ball charge contact forces on the lifter have a maximum peak force of about 8.0 kN. The deflection of the lifter during its fourth passage for the simulated and the experimentally measured is shown in Fig. 10. There are differences in the signature between measured and simulated results. What is important here is that both simulations show the same 30° separation between the peaks as the measured signal. This means that the mechanical waves are correctly predicted. The maximum peak values for measured and the simulated signature occurs around 105°. The charge toe angle is 69° for the measured and 65° for the model. The shoulder angle for measured is 202° and 190° for the model charge. The peaks are higher for the model.
8th European LS-DYNA Users Conference, Strasbourg - May 2011
0 200 400 600 800 1000 120002468
Contact force lifterF
orce
[kN
]
0 200 400 600 800 1000 12000
5
10
Section force
For
ce [k
N]
0 200 400 600 800 1000 1200
0
1
2Deflection lifter
Angle [deg]
Dis
plac
emen
t [m
m]
Figure 9. Results from the numerical analysis, (graded charge) a, contact force on a lifter in the system, b. forces in the section plane behind the lifter and c, deflection of the lifter.
0 50 100 150 200 250
0
0.2
0.4
0.6
0.8
1
Nor
mal
ised
def
lect
ion
[−]
Rotation angle [degrees]
SPHMeasured
Figure 10. Displacement of the lifter during the fourth passage, solid line represents the response from the graded charge and dashed line the non-graded charge response.
5 Discussion and conclusion Tano (2005) showed that useful information from a pure DEM model on charge motion, collision forces, energy loss spectra, power consumption etc. can be found. Data that is important for improving the milling efficiency and gaining more understanding of the process itself. It is vital to have in mind the complex nature of the milling process. To reduce the gap between model and reality more physically precise models are necessary. With a combined DEM-FEM model, Jonsén el al. (2011) took one-steps towards a more physically correct numerical description of mill systems. An essential matter shown with that approach was that the structural response and its influence on the charge motion could be studied with a combination of DEM representing the charge and FEM representing mill structure. The model also gives the opportunity to optimize the

8th European LS-DYNA Users Conference, Strasbourg - May 2011
material selection of the mill structure. In this work, a combined SPH-FEM model is used in simulations of tumbling mill processes. With a SPH-FEM model, structural response and its influence on the charge motion can be studied in greater detail. In addition, the model gives the opportunity to study the internal workings of the charge. FE-codes are well developed and already used for optimisation of mechanical response of structural parts. Critical response values e.g., stress and strain can be identified during the milling process. Forces and mechanical waves in the structure can be found. Within a grinding ball, the stress is distributed. To resolve that stress for each grinding ball in a mill is possible but very computationally costly and today not reasonable. Each ball has to contain a number of FE elements to resolve the stress field. To model grinding balls as single SPH particles give a constant stress. This means that the single SPH particle provides the mean value of the stress. The peak values will not be found with this approach but it will give an idea of how the global stress field looks like. The Drücker-Prager model controls the interaction between SPH particles. In this work, the slope of the internal friction k has been predicted from particle-particle friction recommended by Rajamani (2000). This is a rough approximation of the complex charge behaviour and further investigations into the constitutive relation of a grinding charge have to be done. The aim with this work is to show that SPH can be an alternative to DEM in modelling of grinding charges. Constitutive models included in the FE formulation predict mechanical response of the mill structure. This also includes forces travelling in the lining and the echoes from consecutive lifter-charge hits. An important conclusion from this work is that this gives an opportunity to validate signals from on-shell sensor types. In addition, the SPH-FEM model gives opportunity to study mechanical parameters e.g., pressure and shear stresses inside the charge. The SPH-FEM model should also be a more physically correct model description compared to a DEM model with rigid walls. In the present case, all lifters and liners for the whole mill are modelled with realistic material behaviour. This gives a physically accurate presentation of the system. The liner design has a large influence on the charge motion but the charge is also changed during its passage through the mill. Better description of the charge behaviour will help to optimise liner design. This may minimize energy consumption and increase the efficiency of the milling process. The SPH-FEM model can predict the classical DEM results, but can also predict responses from the mill structure like, e.g., strain. All parts of the mill system will affect its response and a SPH-FEM model gives the opportunity to study the influence of the mill structure and for e.g. pressure and shear stresses in the charge.
6 Acknowledgement For financial support of the project ModPulp project number P341106-1 within Gruvforskningsprogrammet are Vinnova gratefully acknowledged.
8th European LS-DYNA Users Conference, Strasbourg - May 2011
References Blatz, P.J., and Ko, W.L., 1962, Application of Finite Element Theory to the Deformation of rubber Materials, Trans. Soc. of Rheology, 6, pp.223-251. Cundall P.A., 1971, A computer model for simulating progressive large scale movements in blocky rock systems. In: Proceedings of the symposium of the international society for rock mechanics, Nancy, France. Vol.1, paper no. II-8. Dupont J.F., Vien A., 2001, Continuous SAG Volumetric Charge Measurement. In: Proc. 33rd Ann. Can. Min. Proc. AGM, CIM, Ottawa, pp.51 - 67. Gingold R.A. and Monaghan J.J., 1977, Smoothed Particle Hydrodynamics: Theory and Application to Non-spherical stars, Monthly Notices of the Royal Astronomical Society, 181, pp.375-389. Jonsén P., Pålsson B. I., Tano K. and Berggren A., 2011, Prediction of mill structure behaviour in a tumbling mill. Miner. Eng. vol. 24, pp 236-244. Liu G.R. and Liu M.B., Smoothed Particle Hydrodynamics a meshfree particle method, Singapore, World Scientific Publishing Co., 2009. LSTC. LS-DYNA User’s Manual Version 971/Rev 5. Livermore Software Technology Corporation, 7374 Las Positas Road Livermore, California 94550 USA, May 2010 Lucy L.B., 1977, Numerical approach to testing the fission hypothesis, Astronomical Journal, 82, pp.1013-1024. Rajamani, R.K., 2000, Semi-Autogenous Mill Optimization with DEM Simulation Software. In: Control 2000 – Mineral and Metallurgical Processing. Society for Mining, Metallurgy, and Exploration, Inc., Littleton, CO., USA. pp. 209-215. ISBN 0-87335-197-5 Tano K., 2005, Continuous Monitoring of Mineral Processes with Special Focus on Tumbling Mills – A Multivariate Approach, Doctoral Thesis, 2005:05, Luleå University of Technology, Sweden.