Embed Size (px)
Citation preview
Journal of Power Sources 147 (2005) 148–161
Simulation of flow and transport phenomena in a polymerelectrolyte fuel cell under low-humidity operation
Yun Wang, Chao-Yang Wang∗
Department of Mechanical and Nuclear Engineering, Electrochemical Engine Center (ECEC), The Pennsylvania State University,University Park, PA 16802, USA
Received 13 December 2004; accepted 18 January 2005Available online 18 March 2005
Abstract
Numerical simulations of a 50 cm2 polymer electrolyte fuel cell (PEFC) with 36 channels are carried out to study the lateral transportof moisture and reactant between two neighboring channels with counter flow on the cathode side. Massive computations with 2.7 millioncomputational elements are performed to capture the intricate electrochemical and transport phenomena in PEFC in three-dimensions. Twoc nsport in theg effects int idificationi een twoa ss betweent idificationb©
K
1
attspbiadav
r as
hnol-con-tageem-
Thisex-Thee ar ap-denextout-n-ical
thoutnts
0d
ases are examined and compared. One is under the common assumption that molecular diffusion dominates the species traas diffusion layer (GDL) and thus, the lateral convection effect is neglected. The other case is to include the flow and convection
he GDL using a realistic permeability of the porous GDL. Numerical results elucidate the mechanism and extent of internal humnduced by lateral moisture diffusion. In addition, it is found that given the typical GDL, there exists a large pressure drop betwdjacent channels in counter flow, one flowing in from the inlet and the other flowing out to the outlet, causing severe reactant bypa
he two flow paths of reverse direction. The bypass results in reactant flow “short-circuit” and greatly diminishes the internal humenefit intended by the counter-flow design.2005 Elsevier B.V. All rights reserved.
eywords:Computational fuel cell dynamics; Polymer electrolyte fuel cells; Water management; Gas dynamics; Low humidity
. Introduction
Due to development of perfluorosulfonic-acid membranesnd the dramatic reduction in precious metal catalyst loading,
he polymer electrolyte fuel cell (PEFC) has become a viableechnology[1]. A PEFC consists of gas channels, gas diffu-ion layers (GDLs), and a proton-conductive membrane withlatinum catalyst coated on the two surfaces, called the mem-rane electrode assembly (MEA). Gas channels are grooved
n graphite or metal plates, where injected reactant streamsre distributed for electrochemical reactions. Protons are pro-uced from hydrogen oxidation in the anode catalyst layer,nd pass through the membrane, carrying water moleculesia electro-osmotic drag, to the cathode catalyst layer where
∗ Corresponding author. Tel.: +1 814 863 4762; fax: +1 814 863 4848.E-mail address:[email protected] (C.-Y. Wang).
the oxygen reduction reaction (ORR) occurs, with watethe product.
Water management is a central issue in PEFC tecogy because high water content results in high protonductivity of the membrane, thus decreasing ohmic volloss. Commonly, two methods are used to hydrate the mbrane. One is to externally humidify inlet reactant gases.strategy requires a humidifier, making it complex andpensive to be applied to portable or mobile systems.other way is to make full use of water production insidPEFC and humidify reactant gases internally. In the latteproach, Qi and Kaufman[2] proposed a counter-flow cathoflowfield design where an inlet gas channel is placedto an outlet channel in hopes that the moist air in thelet channel will help humidify the dry air in the inlet chanel. Such a self-humidification process is of technologinterest as it has the potential to feed dry reactants wiexternal humidification. While cell polarization experime
378-7753/$ – see front matter © 2005 Elsevier B.V. All rights reserved.oi:10.1016/j.jpowsour.2005.01.047
Y. Wang, C.-Y. Wang / Journal of Power Sources 147 (2005) 148–161 149
Nomenclature
a effective catalyst area per unit volume (m2/m3)A superficial electrode area (m2)Ck molar concentration of species k (mol/m3)D mass diffusivity of species (m2/s)F Faraday’s constant, 96,487 C/equivalenti0 exchange current density (A/m2)I current density (A/cm2)j transfer current (A/cm3)K permeability (m2)n the direction normal to the surfacend electro-osmotic drag coefficient (H2O/H+)p pressure (Pa)R gas constant (8.134 J/mol K)s stoichiometric coefficient in electrochemical
reactionS source term in transport equationst time (s)T temperature (K)�u velocity vector (m/s)Uo open circuit potential (V)Vcell cell potential (V)X mole fraction
Greekα transfer coefficient or net water transport co-
efficient per protonε porosityφ phase potential (V)η surface overpotential (V)κ ionic conductivity (S/m)λ membrane water contentµ viscosity (kg/m s)σ electronic conductivity (S/cm)ρ density (kg/m3)τ shear stress (N/m2, or tortuosity factor)ξ stoichiometric flow ratio
Superscripts and Subscriptsa anodeavg averagec cathodee electrolyteeff effective valueg gas phasein inletk speciesm membraneo standard condition, 273.15 K and 101.3 kPa
(1 atm)ref references solid phase of electrodesat saturate valuew water
have been reported by Qi and Kaufman[2] for this flowfielddesign, a fundamental understanding of the complex trans-port phenomena uniquely present in this flow configuration isabsent.
Mathematic models, describing detailed physico-chemical processes and coupling transport equations withelectrochemical kinetics, are an important tool to aid infundamental understanding of relevant phenomena inPEFCs. To date, mathematic models have been developedfrom the simple one-dimensional[3–5], two-dimensional[6,7] to the complex three-dimensional models. Springer etal. [4,5] presented a detailed description of water behaviorin the membrane and experimentally measured the water-diffusion coefficient, electro-osmotic drag coefficient andmembrane proton conductivity as functions of membranewater content. Fitted curves were incorporated into their one-dimensional model to capture water transport phenomena inthe membrane via molecular diffusion and electro-osmoticdrag. Fuller and Newman[6] considered two-dimensionalMEA in the through-plane and flow directions operat-ing on reformed methanol. Water management, thermalmanagement and utilization of fuel were examined indetail.
A comprehensive non-isothermal, three-dimensionalmodel was developed by Berning et al.[8]. They simulated ahalf of a single channel to study the temperature distribution.H as-s micalm sameaA af onlya ons,r inac-c oyedo ed.W sedo , andt asedo lystl as theM stri-b , theirm andm
rnalh of a5 ld.T int teP upont ti y-n dingc
owever, their model ignored the membrane-electrodeembly, thus not capturing the transport and electrocheechanisms in these vital components of PEFCs. Thessumption also existed in the model of Dutta et al.[9,10].n important contribution of Dutta’s work is to simulate
uel cell with 20-branch serpentine channels. However,bout 200,000 grid points were employed in the simulatiaising the concern of grid dependence and numericaluracy. In addition, the governing equations were emplnly in the gas channels and GDLs, with the MEA excludater transport in the MEA was analytically modeled ba
n the approximations of constant transport propertieshe diffusion flux through the membrane was calculated bn the difference of water concentrations in the two cata
ayers. In contrast, Wang and co-workers[11–15]presentedingle-domain model, including detailed mechanisms inEA, such as electrolyte potential, current and water di
utions in the membrane as well as catalyst layers. Thusodel is chosen for this study of internal humidificationembrane hydration.The goal of this paper is to investigate the inte
umidification phenomenon through the simulations0 cm2 PEFC with counter flow in the cathode flowfiehe geometry of the fuel cell is similar to the one
he work by Qi and Kaufman[2] except that a compleEFC with 36 channels is considered. We expand
he model of Um et al.[11] and numerically implement into Star-CD®, a commercial computational fluid damics (CFD) software package, based on its user coapability.
150 Y. Wang, C.-Y. Wang / Journal of Power Sources 147 (2005) 148–161
2. Numerical Model
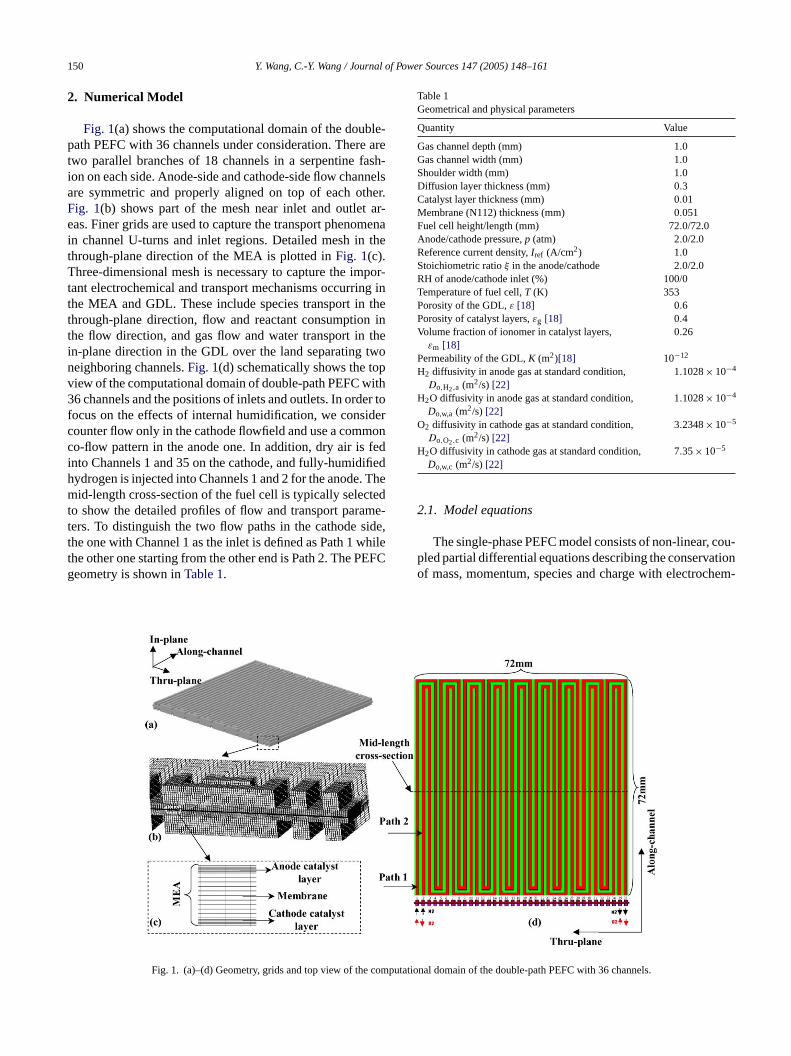
Fig. 1(a) shows the computational domain of the double-path PEFC with 36 channels under consideration. There aretwo parallel branches of 18 channels in a serpentine fash-ion on each side. Anode-side and cathode-side flow channelsare symmetric and properly aligned on top of each other.Fig. 1(b) shows part of the mesh near inlet and outlet ar-eas. Finer grids are used to capture the transport phenomenain channel U-turns and inlet regions. Detailed mesh in thethrough-plane direction of the MEA is plotted inFig. 1(c).Three-dimensional mesh is necessary to capture the impor-tant electrochemical and transport mechanisms occurring inthe MEA and GDL. These include species transport in thethrough-plane direction, flow and reactant consumption inthe flow direction, and gas flow and water transport in thein-plane direction in the GDL over the land separating twoneighboring channels.Fig. 1(d) schematically shows the topview of the computational domain of double-path PEFC with36 channels and the positions of inlets and outlets. In order tofocus on the effects of internal humidification, we considercounter flow only in the cathode flowfield and use a commonco-flow pattern in the anode one. In addition, dry air is fedinto Channels 1 and 35 on the cathode, and fully-humidifiedhydrogen is injected into Channels 1 and 2 for the anode. Themid-length cross-section of the fuel cell is typically selectedt me-t ide,t whilet EFCg
Table 1Geometrical and physical parameters
Quantity Value
Gas channel depth (mm) 1.0Gas channel width (mm) 1.0Shoulder width (mm) 1.0Diffusion layer thickness (mm) 0.3Catalyst layer thickness (mm) 0.01Membrane (N112) thickness (mm) 0.051Fuel cell height/length (mm) 72.0/72.0Anode/cathode pressure,p (atm) 2.0/2.0Reference current density,Iref (A/cm2) 1.0Stoichiometric ratioξ in the anode/cathode 2.0/2.0RH of anode/cathode inlet (%) 100/0Temperature of fuel cell,T (K) 353Porosity of the GDL,ε [18] 0.6Porosity of catalyst layers,εg [18] 0.4Volume fraction of ionomer in catalyst layers,εm [18]
0.26
Permeability of the GDL,K (m2)[18] 10−12
H2 diffusivity in anode gas at standard condition,Do,H2,a (m2/s) [22]
1.1028× 10⁻⁴
H2O diffusivity in anode gas at standard condition,Do,w,a (m2/s) [22]
1.1028× 10⁻⁴
O2 diffusivity in cathode gas at standard condition,Do,O2,c (m2/s) [22]
3.2348× 10⁻⁵
H2O diffusivity in cathode gas at standard condition,Do,w,c (m2/s) [22]
7.35× 10⁻⁵
2.1. Model equations
The single-phase PEFC model consists of non-linear, cou-pled partial differential equations describing the conservationof mass, momentum, species and charge with electrochem-
compu
o show the detailed profiles of flow and transport paraers. To distinguish the two flow paths in the cathode she one with Channel 1 as the inlet is defined as Path 1he other one starting from the other end is Path 2. The Peometry is shown inTable 1.
Fig. 1. (a)–(d) Geometry, grids and top view of the
tational domain of the double-path PEFC with 36 channels.
Y. Wang, C.-Y. Wang / Journal of Power Sources 147 (2005) 148–161 151
ical reactions. The equations can be written, in the vectorform, as[11]:
Continuity conservation : ∇ · (ρ�u) = 0 (1)
Momentum conservation :1
ε2∇ · (ρ�u�u) = −∇p+ ∇ · τ + Su (2)
Species conservation : ∇ · (�uCk) = ∇ · (Deffk ∇Ck) + Sk
(3)
Charge conservation : ∇ · (κeff∇φe) + Se = 0 (4)
whereρ, �u, p, Ck andφe, respectively, denote the density,superficial fluid velocity vector, pressure, mole fraction ofspecies k and electrolyte potential. The species considered arehydrogen, oxygen and water. In Eqs.(1)and(2), use has beenmade of a constant-flow assumption in which the fluid densityis constant and the mass source/sink in the continuity equation
Table 2Source terms for the conservation equations in each region
Su Sk Sφ
Gas channels 0 0 –
Diffusion layers Su = − µK
�u 0 0
Catalyst layers Su = − µK
�u Sk = −∇ ·(nd
Fie
)− skj
nFSφ = j
Membrane Su = − µK
�u 0 0
Note: nd is the electro-osmotic drag coefficient for water. For H2 and O2,nd = 0.
is ignored. This constant-flow approximation has proved tobe valid under common PEFC operations[16]. Source terms,electrochemical properties and physical properties, identifiedfor various regions of a fuel cell, are listed inTables 2–4,respectively.
In the GDL, a small value of permeabilityK will resultin a large source termSu in Eq. (2), turning Eq.(2) into the
Table 3Electrochemical properties
Description Anode Cathode
T i0,a
(CH2
CH2,ref
)1/2 (αa + αc
RT· F · η
)−ai0,c
(CO2
CO2,ref
)e
(− αcFRT
·η)
S s −φe −Uo (with φs = 0) φs −φe −Uo (with φs =Vcell)E 1.23− 0.9× 10⁻³ (T− 298)E .0× 109 10000T a +αc = 2 αc = 1
TP
Q Value
W = CwRT
psat
og10psat=−2.1794 + 0.02953 (T− 273.15)− 9.1837× 10⁻⁵(T− 273.15)2
1.4454× 10⁻⁷(T− 273.15)3
W ={
0.043+ 17.81a− 39.85a2 + 36.0a3 for 0< a ≤ 11
I 0.0051
H mw =
{
E
{
M
HG
D
V
ransfer current density,j (A/m3) a
urface overpotential,η (V) φ
quilibrium potential,Uo (V) 0xchange current density x reaction surface area,ai0 (A/m3) 1ransfer coefficient,α α
able 4hysical and transport properties
uantity
ater activity,a [4] a
l+
ater content in membrane,λ [4] λ
onic conductivity of membrane,κ (S/m)[4] (
2O diffusivity in membrane,Dmw (m2/s) [19] D
lectro-osmotic drag coefficient,nd [20] nd =
embrane density,ρ (kg/m3) [21] ρ = 1.9
1
2/O2 diffusivity in membrane,DmH2/Dm
O2(m2/s) [3] 2.59× 1
as diffusivity in porous media,Deff (m2/s) Deff = ε
iffusivity in gas,D (m2/s) [22] Do
(T
35
iscosity of anode/cathode gas,µ (kg/m s)[23] µ = 9.8
4+ 1.4(a− 1) for 1 ≤ a ≤ 3
39λ− 0.00326) exp[
1268(
1
303− 1
T
)]3.1 × 10⁻³λ(e0.28λ − 1) · e[−2346/T ] for 0< λ ≤ 34.17× 10⁻⁴λ(1 + 161e−λ) · e[−2346/T ] otherwise
1.0 for λ ≤ 141.5
8(λ− 14)+ 1.0 otherwise
8+ 0.0324λ
+ 0.0648λ× 103
0−6/1.22× 10−6
1.5D
3
)3/2 (1
p
)8× 10⁻⁶XH2 + 1.12× 10⁻⁵XH2O + 2.01× 10⁻⁵XN2 + 2.3 × 10⁻⁵XO2
152 Y. Wang, C.-Y. Wang / Journal of Power Sources 147 (2005) 148–161
Darcy’s law for porous media:
∇p = µ
K�u (5)
In addition, notice that the present model is a single-phaseapproach in which the total water amount is tracked withoutdistinguishing liquid water from water vapor. Such a single-phase model is valid generally under the condition that theliquid volume fraction is low or liquid droplets are small toform a mist flow. This approach is particularly well suitedfor the present study since only the low-humidity operationis concerned.
2.2. Boundary conditions
Eqs.(1)–(4) form a complete set of governing equationswith eight unknowns:�u, p, CH2, CO2,CH2O andφe. Theircorresponding boundary conditions are specified as follows.
2.2.1. Flow inlet boundariesThe inlet velocity�uin in a gas channel is expressed by the
respective stoichiometric flow ratio, i.e.ξa or ξc, defined at areference current density,Iref, as:
ξa = CH2ρauin,aAaIrefA2F
and ξc = CO2ρcuin,cAcIrefA4F
(6)
w thea t mo-l andh
2
2ux
c
u
2
soft-w -p rcet userc nsityd tedi canb elec-tg l el-e y to
capture fine details of flow and transport phenomena in thisPEFC configuration. A simulation typically requires about100 iterations and takes nearly 5 h on 9 nodes of 1.4 GHzAMD Athelon Thunderbird CPU and 512MB DDR SDRAM.
3. Results and discussion
Two cases are compared in our study, in Case 1, we assumethere is no velocity in the GDL, thus species transport isdominated by diffusion. The other one, Case 2, is to apply theDarcy’s law in the GDL based on its permeability and explorethe convection effect on internal humidification additionally.
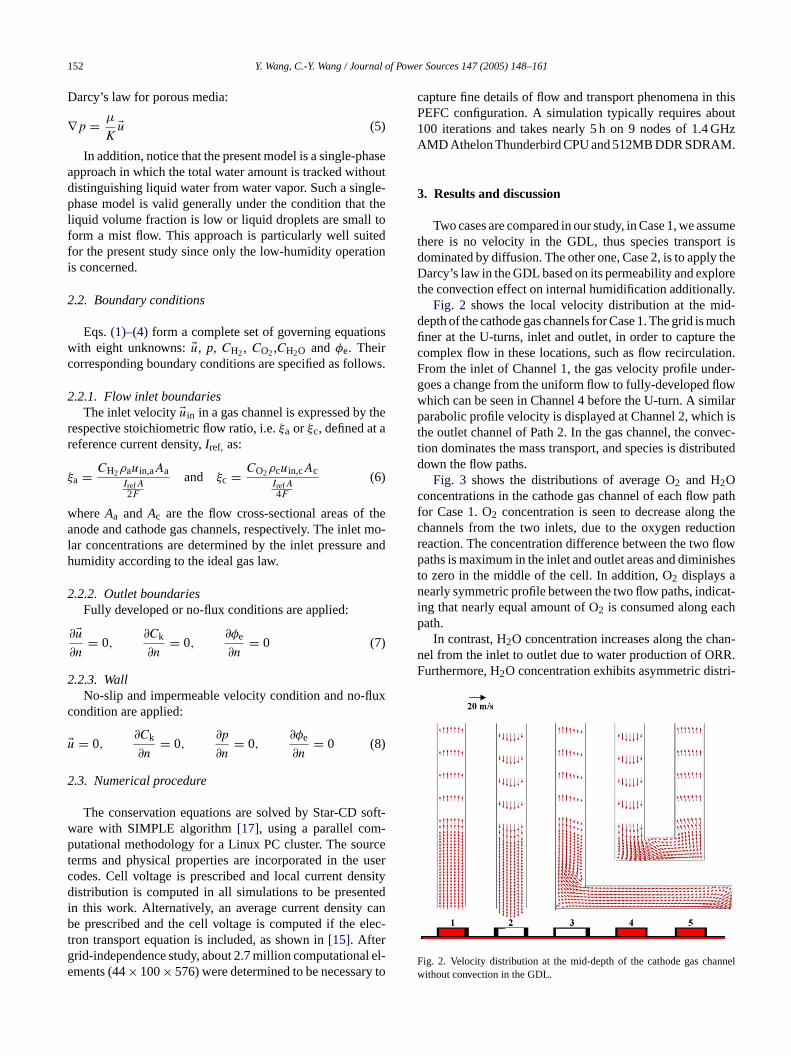
Fig. 2 shows the local velocity distribution at the mid-depth of the cathode gas channels for Case 1. The grid is muchfiner at the U-turns, inlet and outlet, in order to capture thecomplex flow in these locations, such as flow recirculation.From the inlet of Channel 1, the gas velocity profile under-goes a change from the uniform flow to fully-developed flowwhich can be seen in Channel 4 before the U-turn. A similarparabolic profile velocity is displayed at Channel 2, which isthe outlet channel of Path 2. In the gas channel, the convec-tion dominates the mass transport, and species is distributeddown the flow paths.
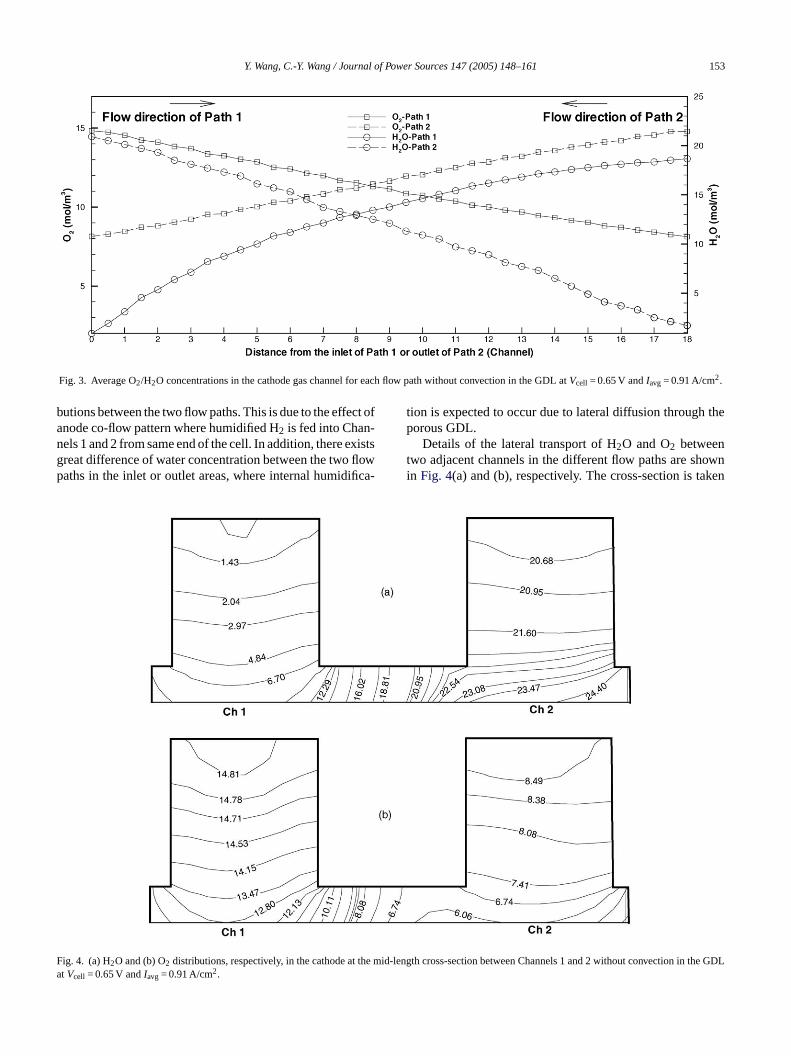
Fig. 3 shows the distributions of average O2 and H2Oconcentrations in the cathode gas channel of each flow pathf thec tionr flowp shestn cat-i chp
an-n R.F tri-
F nnelw
hereAa andAc are the flow cross-sectional areas ofnode and cathode gas channels, respectively. The inle
ar concentrations are determined by the inlet pressureumidity according to the ideal gas law.
.2.2. Outlet boundariesFully developed or no-flux conditions are applied:
∂�u∂n
= 0,∂Ck
∂n= 0,
∂φe
∂n= 0 (7)
.2.3. WallNo-slip and impermeable velocity condition and no-fl
ondition are applied:
� = 0,∂Ck
∂n= 0,
∂p
∂n= 0,
∂φe
∂n= 0 (8)
.3. Numerical procedure
The conservation equations are solved by Star-CDare with SIMPLE algorithm[17], using a parallel comutational methodology for a Linux PC cluster. The sou
erms and physical properties are incorporated in theodes. Cell voltage is prescribed and local current deistribution is computed in all simulations to be presen
n this work. Alternatively, an average current densitye prescribed and the cell voltage is computed if the
ron transport equation is included, as shown in[15]. Afterrid-independence study, about 2.7 million computationaments (44× 100× 576) were determined to be necessar
or Case 1. O2 concentration is seen to decrease alonghannels from the two inlets, due to the oxygen reduceaction. The concentration difference between the twoaths is maximum in the inlet and outlet areas and dimini
o zero in the middle of the cell. In addition, O2 displays aearly symmetric profile between the two flow paths, indi
ng that nearly equal amount of O2 is consumed along eaath.
In contrast, H2O concentration increases along the chel from the inlet to outlet due to water production of ORurthermore, H2O concentration exhibits asymmetric dis
ig. 2. Velocity distribution at the mid-depth of the cathode gas chaithout convection in the GDL.
Y. Wang, C.-Y. Wang / Journal of Power Sources 147 (2005) 148–161 153
Fig. 3. Average O2/H2O concentrations in the cathode gas channel for each flow path without convection in the GDL atVcell = 0.65 V andIavg= 0.91 A/cm2.
butions between the two flow paths. This is due to the effect ofanode co-flow pattern where humidified H2 is fed into Chan-nels 1 and 2 from same end of the cell. In addition, there existsgreat difference of water concentration between the two flowpaths in the inlet or outlet areas, where internal humidifica-
tion is expected to occur due to lateral diffusion through theporous GDL.
Details of the lateral transport of H2O and O2 betweentwo adjacent channels in the different flow paths are shownin Fig. 4(a) and (b), respectively. The cross-section is taken
Fa
ig. 4. (a) H2O and (b) O2 distributions, respectively, in the cathode at the midtVcell = 0.65 V andIavg= 0.91 A/cm2.
-length cross-section between Channels 1 and 2 without convection in the GDL
154 Y. Wang, C.-Y. Wang / Journal of Power Sources 147 (2005) 148–161
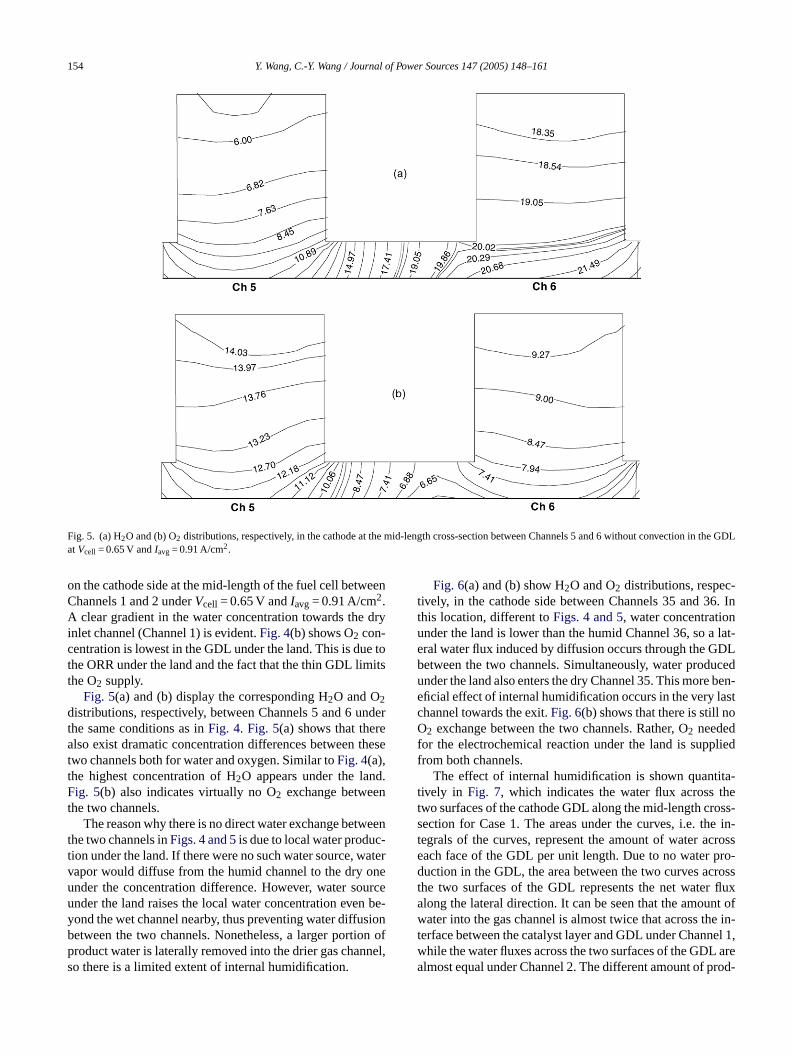
Fig. 5. (a) H2O and (b) O2 distributions, respectively, in the cathode at the mid-length cross-section between Channels 5 and 6 without convection in the GDLatVcell = 0.65 V andIavg= 0.91 A/cm2.
on the cathode side at the mid-length of the fuel cell betweenChannels 1 and 2 underVcell = 0.65 V andIavg= 0.91 A/cm2.A clear gradient in the water concentration towards the dryinlet channel (Channel 1) is evident.Fig. 4(b) shows O2 con-centration is lowest in the GDL under the land. This is due tothe ORR under the land and the fact that the thin GDL limitsthe O2 supply.
Fig. 5(a) and (b) display the corresponding H2O and O2distributions, respectively, between Channels 5 and 6 underthe same conditions as inFig. 4. Fig. 5(a) shows that therealso exist dramatic concentration differences between thesetwo channels both for water and oxygen. Similar toFig. 4(a),the highest concentration of H2O appears under the land.Fig. 5(b) also indicates virtually no O2 exchange betweenthe two channels.
The reason why there is no direct water exchange betweenthe two channels inFigs. 4 and 5is due to local water produc-tion under the land. If there were no such water source, watervapor would diffuse from the humid channel to the dry oneunder the concentration difference. However, water sourceunder the land raises the local water concentration even be-yond the wet channel nearby, thus preventing water diffusionbetween the two channels. Nonetheless, a larger portion ofproduct water is laterally removed into the drier gas channel,so there is a limited extent of internal humidification.
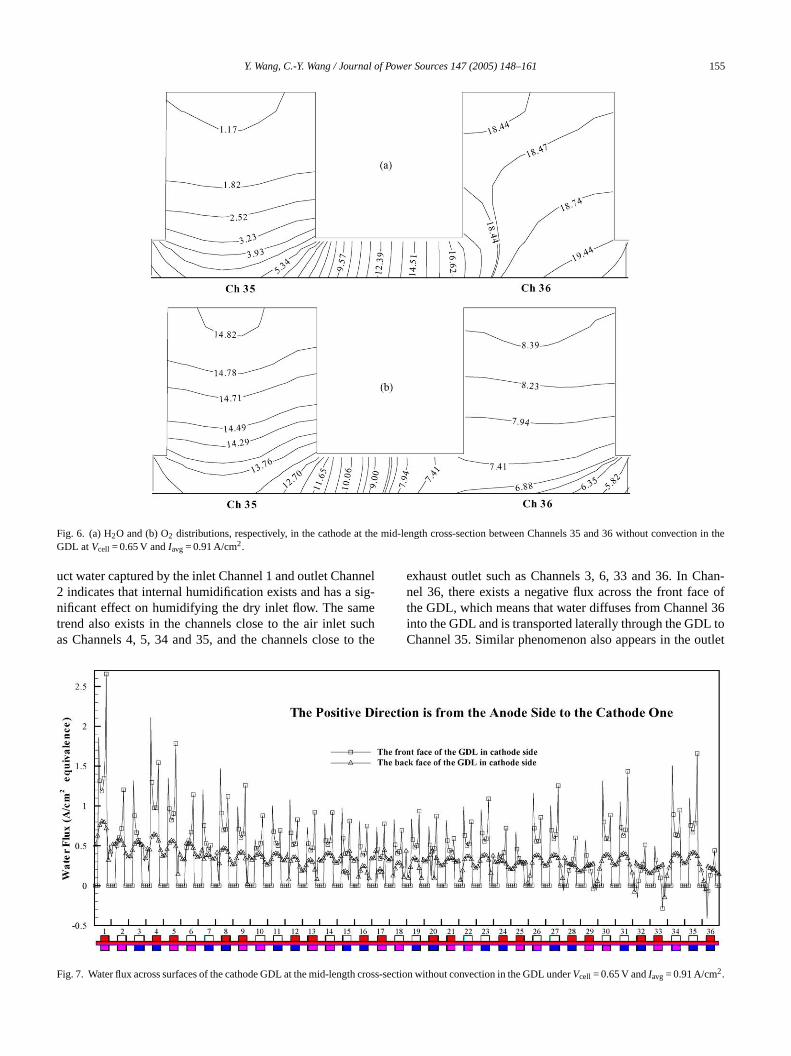
Fig. 6(a) and (b) show H2O and O2 distributions, respec-tively, in the cathode side between Channels 35 and 36. Inthis location, different toFigs. 4 and 5, water concentrationunder the land is lower than the humid Channel 36, so a lat-eral water flux induced by diffusion occurs through the GDLbetween the two channels. Simultaneously, water producedunder the land also enters the dry Channel 35. This more ben-eficial effect of internal humidification occurs in the very lastchannel towards the exit.Fig. 6(b) shows that there is still noO2 exchange between the two channels. Rather, O2 neededfor the electrochemical reaction under the land is suppliedfrom both channels.
The effect of internal humidification is shown quantita-tively in Fig. 7, which indicates the water flux across thetwo surfaces of the cathode GDL along the mid-length cross-section for Case 1. The areas under the curves, i.e. the in-tegrals of the curves, represent the amount of water acrosseach face of the GDL per unit length. Due to no water pro-duction in the GDL, the area between the two curves acrossthe two surfaces of the GDL represents the net water fluxalong the lateral direction. It can be seen that the amount ofwater into the gas channel is almost twice that across the in-terface between the catalyst layer and GDL under Channel 1,while the water fluxes across the two surfaces of the GDL arealmost equal under Channel 2. The different amount of prod-
Y. Wang, C.-Y. Wang / Journal of Power Sources 147 (2005) 148–161 155
Fig. 6. (a) H2O and (b) O2 distributions, respectively, in the cathode at the mid-length cross-section between Channels 35 and 36 without convection in theGDL atVcell = 0.65 V andIavg= 0.91 A/cm2.
uct water captured by the inlet Channel 1 and outlet Channel2 indicates that internal humidification exists and has a sig-nificant effect on humidifying the dry inlet flow. The sametrend also exists in the channels close to the air inlet suchas Channels 4, 5, 34 and 35, and the channels close to the
exhaust outlet such as Channels 3, 6, 33 and 36. In Chan-nel 36, there exists a negative flux across the front face ofthe GDL, which means that water diffuses from Channel 36into the GDL and is transported laterally through the GDL toChannel 35. Similar phenomenon also appears in the outlet
Fig. 7. Water flux across surfaces of the cathode GDL at the mid-length cross-section without convection in the GDL underV = 0.65 V andI = 0.91 A/cm2.
cell avg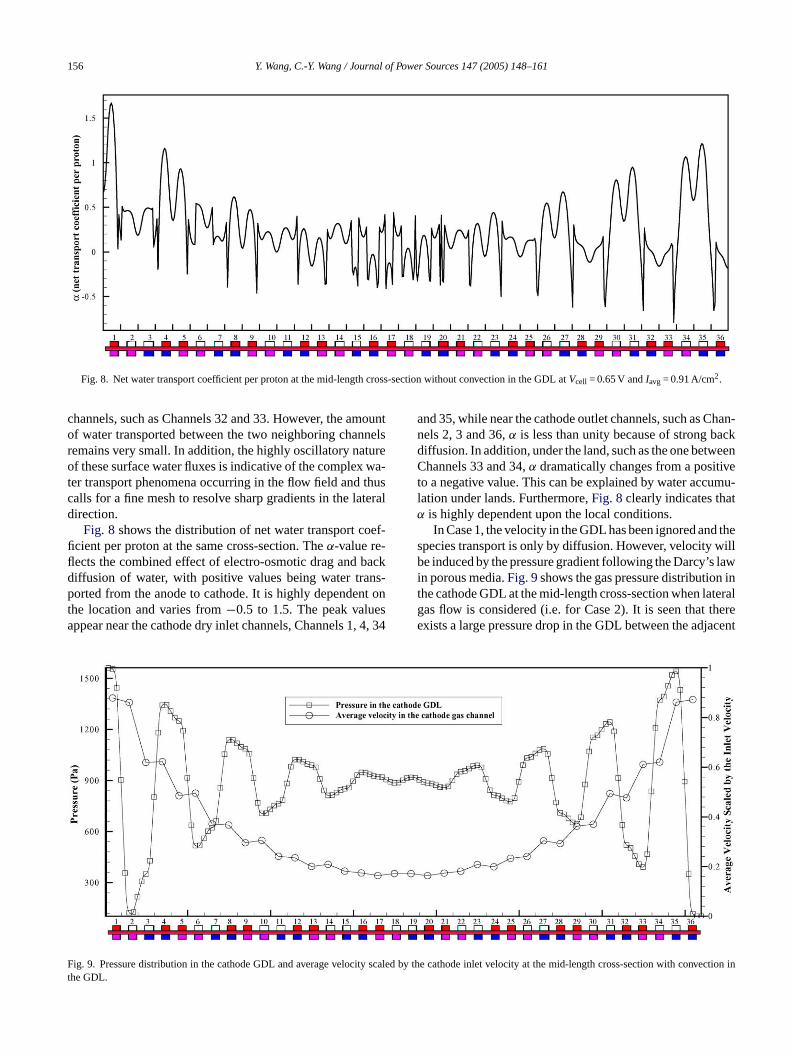
156 Y. Wang, C.-Y. Wang / Journal of Power Sources 147 (2005) 148–161
Fig. 8. Net water transport coefficient per proton at the mid-length cross-section without convection in the GDL atVcell = 0.65 V andIavg= 0.91 A/cm2.
channels, such as Channels 32 and 33. However, the amountof water transported between the two neighboring channelsremains very small. In addition, the highly oscillatory natureof these surface water fluxes is indicative of the complex wa-ter transport phenomena occurring in the flow field and thuscalls for a fine mesh to resolve sharp gradients in the lateraldirection.
Fig. 8 shows the distribution of net water transport coef-ficient per proton at the same cross-section. Theα-value re-flects the combined effect of electro-osmotic drag and backdiffusion of water, with positive values being water trans-ported from the anode to cathode. It is highly dependent onthe location and varies from−0.5 to 1.5. The peak valuesappear near the cathode dry inlet channels, Channels 1, 4, 34
and 35, while near the cathode outlet channels, such as Chan-nels 2, 3 and 36,α is less than unity because of strong backdiffusion. In addition, under the land, such as the one betweenChannels 33 and 34,α dramatically changes from a positiveto a negative value. This can be explained by water accumu-lation under lands. Furthermore,Fig. 8clearly indicates thatα is highly dependent upon the local conditions.
In Case 1, the velocity in the GDL has been ignored and thespecies transport is only by diffusion. However, velocity willbe induced by the pressure gradient following the Darcy’s lawin porous media.Fig. 9shows the gas pressure distribution inthe cathode GDL at the mid-length cross-section when lateralgas flow is considered (i.e. for Case 2). It is seen that thereexists a large pressure drop in the GDL between the adjacent
F y scale onvet
ig. 9. Pressure distribution in the cathode GDL and average velocithe GDL.
d by the cathode inlet velocity at the mid-length cross-section with cction in
Y. Wang, C.-Y. Wang / Journal of Power Sources 147 (2005) 148–161 157
channels in different flow paths at the two ends of the fuel cell.Between Channels 1 and 2, c.a. 1.5 kPa pressure difference ispresent. According to the Darcy’s law, Eq.(5), and using theGDL permeability of 10−12 m2, one obtains a lateral velocityof about 0.15 m/s in the GDL from the dry Channel 1 to wetChannel 2. As a result, there is a certain amount of inletfresh air bypassing through the GDL and directly flowinginto the channel in the other flow path towards the exit. Thisgas bypass, or “short circuit”, greatly reduces the reactantutilization in the cell.
To quantify the bypass, average gas velocity in the cathodegas channels is also presented inFig. 9. It can be seen thatbypass causes severe leakage of injected flow. For Path 1,from the inlet Channel 1 to the middle of the fuel cell, e.g.Channel 17, the mass of flow in the channel decreases byabout 80%. From the middle to the outlet Channel 36, theflow acquires four times mass from the other flow path.
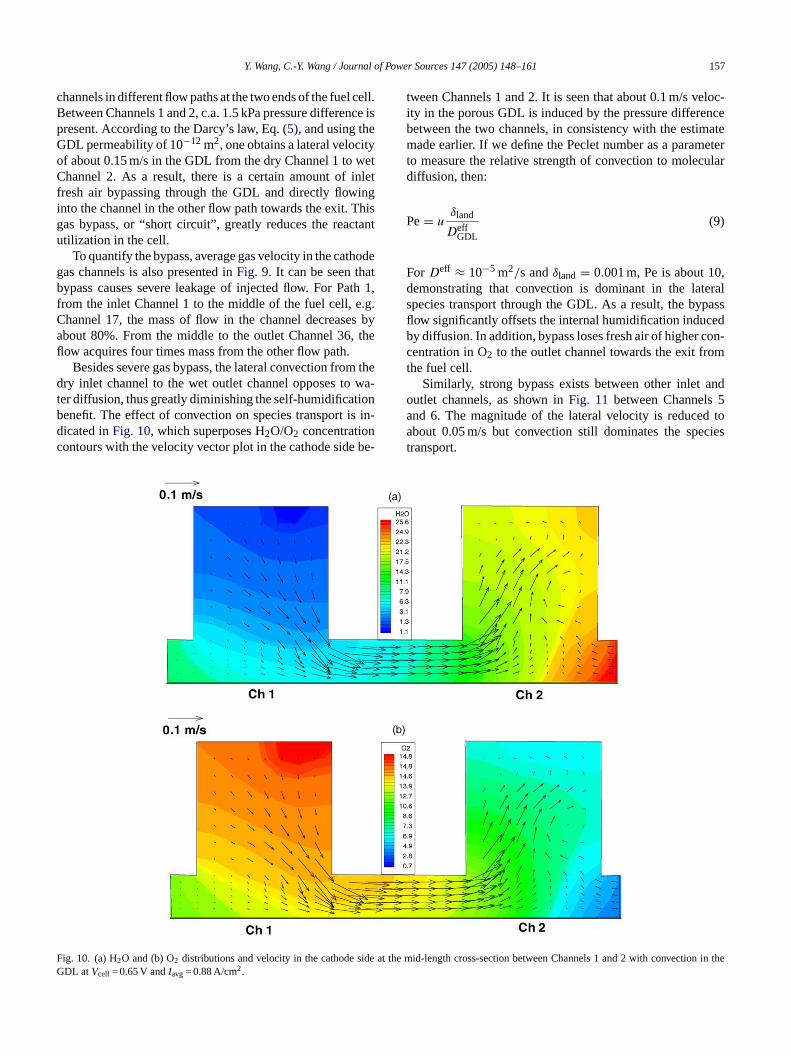
Besides severe gas bypass, the lateral convection from thedry inlet channel to the wet outlet channel opposes to wa-ter diffusion, thus greatly diminishing the self-humidificationbenefit. The effect of convection on species transport is in-dicated inFig. 10, which superposes H2O/O2 concentrationcontours with the velocity vector plot in the cathode side be-
tween Channels 1 and 2. It is seen that about 0.1 m/s veloc-ity in the porous GDL is induced by the pressure differencebetween the two channels, in consistency with the estimatemade earlier. If we define the Peclet number as a parameterto measure the relative strength of convection to moleculardiffusion, then:
Pe= uδland
DeffGDL
(9)
ForDeff ≈ 10−5 m2/s andδland = 0.001 m, Pe is about 10,demonstrating that convection is dominant in the lateralspecies transport through the GDL. As a result, the bypassflow significantly offsets the internal humidification inducedby diffusion. In addition, bypass loses fresh air of higher con-centration in O2 to the outlet channel towards the exit fromthe fuel cell.
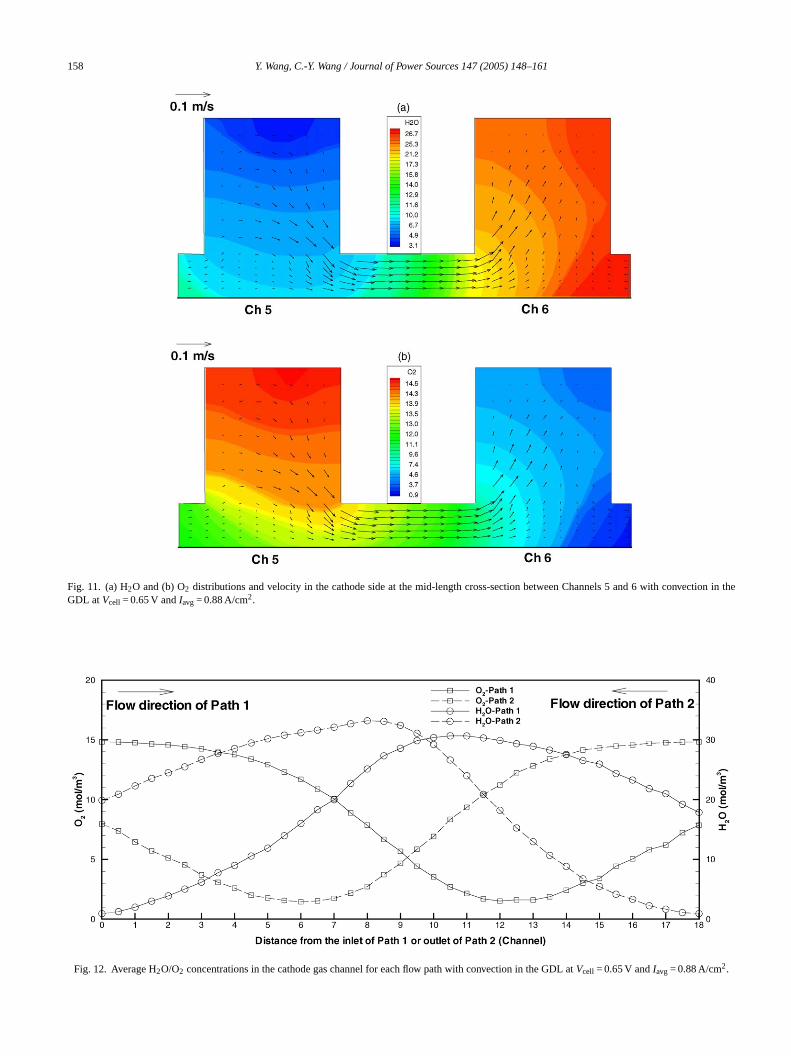
Similarly, strong bypass exists between other inlet andoutlet channels, as shown inFig. 11 between Channels 5and 6. The magnitude of the lateral velocity is reduced toabout 0.05 m/s but convection still dominates the speciestransport.
FG
ig. 10. (a) H2O and (b) O2 distributions and velocity in the cathode side at tDL atVcell = 0.65 V andIavg= 0.88 A/cm2.
he mid-length cross-section between Channels 1 and 2 with convection in the
158 Y. Wang, C.-Y. Wang / Journal of Power Sources 147 (2005) 148–161
Fig. 11. (a) H2O and (b) O2 distributions and velocity in the cathode side at the mid-length cross-section between Channels 5 and 6 with convection in theGDL atVcell = 0.65 V andIavg= 0.88 A/cm2.
Fig. 12. Average H2O/O2 concentrations in the cathode gas channel for each flow path with convection in the GDL atVcell = 0.65 V andIavg= 0.88 A/cm2.
Y. Wang, C.-Y. Wang / Journal of Power Sources 147 (2005) 148–161 159
Fig. 13. Water content profile at the interface of the membrane and cathode catalyst layer at the mid-length cross-section.
An integral effect of gas bypass is shown inFig. 12, whichplots H2O/O2 concentrations in the cathode gas channel foreach flow path. Contrary to Case 1, along each flow path, H2Oconcentration increases first due to ORR water productionbut decreases later due to addition of drier gas from the otherflow path. Furthermore, water concentration reaches as highas 30 mol/m3 in the middle of the fuel cell, due partly to thedeceleration of channel flow as shown inFig. 9.
The trends of O2 concentrations of the two flow paths arealso different fromFig. 3. It is shown that O2 concentrationdecreases first along the flow due to ORR consumption, thenincreases due to bypass of fresher air. In addition, high O2concentration at the outlet indicates that bypass causes a veryserious leakage of O2 and hence, lower cell performance inthis case. Furthermore, because O2 concentration becomes
very low, around 2 mol/m3, in the middle of the flow field,O2 transport limitation occurs and leads to low current densitylocally.
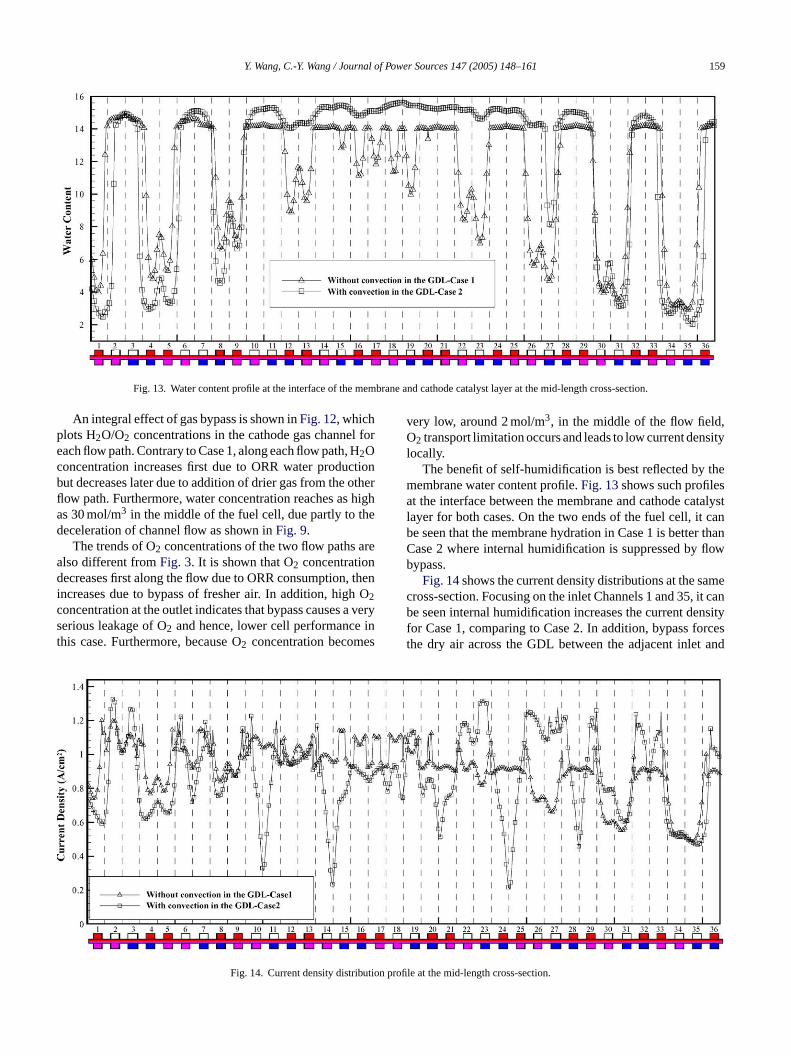
The benefit of self-humidification is best reflected by themembrane water content profile.Fig. 13shows such profilesat the interface between the membrane and cathode catalystlayer for both cases. On the two ends of the fuel cell, it canbe seen that the membrane hydration in Case 1 is better thanCase 2 where internal humidification is suppressed by flowbypass.
Fig. 14shows the current density distributions at the samecross-section. Focusing on the inlet Channels 1 and 35, it canbe seen internal humidification increases the current densityfor Case 1, comparing to Case 2. In addition, bypass forcesthe dry air across the GDL between the adjacent inlet and
tion pr
Fig. 14. Current density distribu ofile at the mid-length cross-section.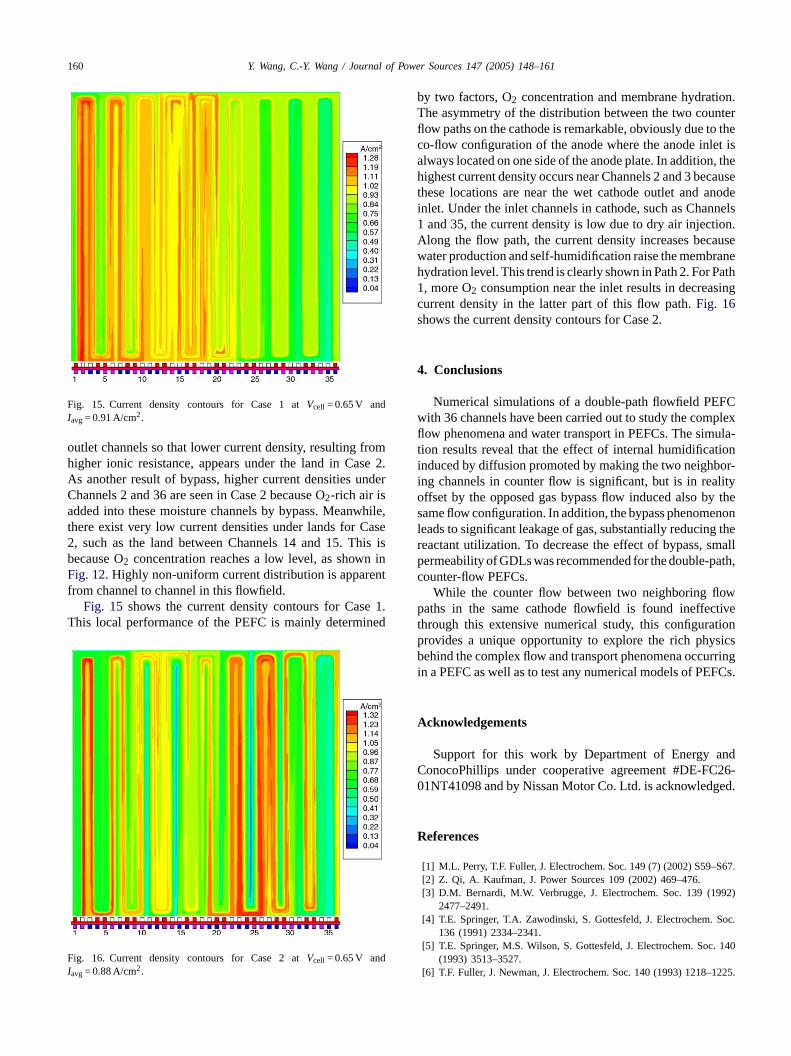
160 Y. Wang, C.-Y. Wang / Journal of Power Sources 147 (2005) 148–161
Fig. 15. Current density contours for Case 1 atVcell = 0.65 V andIavg= 0.91 A/cm2.
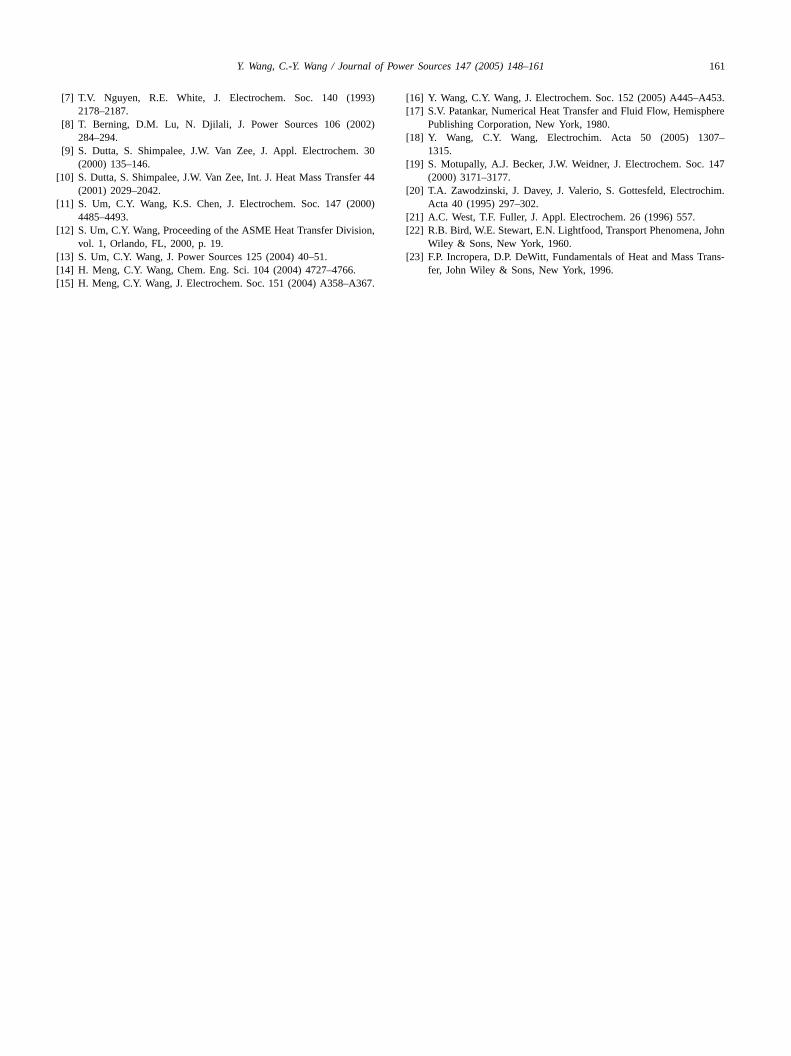
outlet channels so that lower current density, resulting fromhigher ionic resistance, appears under the land in Case 2.As another result of bypass, higher current densities underChannels 2 and 36 are seen in Case 2 because O2-rich air isadded into these moisture channels by bypass. Meanwhile,there exist very low current densities under lands for Case2, such as the land between Channels 14 and 15. This isbecause O2 concentration reaches a low level, as shown inFig. 12. Highly non-uniform current distribution is apparentfrom channel to channel in this flowfield.
Fig. 15 shows the current density contours for Case 1.This local performance of the PEFC is mainly determined
FI
by two factors, O2 concentration and membrane hydration.The asymmetry of the distribution between the two counterflow paths on the cathode is remarkable, obviously due to theco-flow configuration of the anode where the anode inlet isalways located on one side of the anode plate. In addition, thehighest current density occurs near Channels 2 and 3 becausethese locations are near the wet cathode outlet and anodeinlet. Under the inlet channels in cathode, such as Channels1 and 35, the current density is low due to dry air injection.Along the flow path, the current density increases becausewater production and self-humidification raise the membranehydration level. This trend is clearly shown in Path 2. For Path1, more O2 consumption near the inlet results in decreasingcurrent density in the latter part of this flow path.Fig. 16shows the current density contours for Case 2.
4. Conclusions
Numerical simulations of a double-path flowfield PEFCwith 36 channels have been carried out to study the complexflow phenomena and water transport in PEFCs. The simula-tion results reveal that the effect of internal humidificationinduced by diffusion promoted by making the two neighbor-ing channels in counter flow is significant, but is in realityo y thes enonl g ther mallp ath,c
owp tivet tionp sicsb rringi FCs.
A
ndC C26-0 ed.
R
S67.
92)
Soc.
140
1225.
ig. 16. Current density contours for Case 2 atVcell = 0.65 V andavg= 0.88 A/cm2.
ffset by the opposed gas bypass flow induced also bame flow configuration. In addition, the bypass phenom
eads to significant leakage of gas, substantially reducineactant utilization. To decrease the effect of bypass, sermeability of GDLs was recommended for the double-pounter-flow PEFCs.
While the counter flow between two neighboring flaths in the same cathode flowfield is found ineffec
hrough this extensive numerical study, this configurarovides a unique opportunity to explore the rich phyehind the complex flow and transport phenomena occu
n a PEFC as well as to test any numerical models of PE
cknowledgements
Support for this work by Department of Energy aonocoPhillips under cooperative agreement #DE-F1NT41098 and by Nissan Motor Co. Ltd. is acknowledg
eferences
[1] M.L. Perry, T.F. Fuller, J. Electrochem. Soc. 149 (7) (2002) S59–[2] Z. Qi, A. Kaufman, J. Power Sources 109 (2002) 469–476.[3] D.M. Bernardi, M.W. Verbrugge, J. Electrochem. Soc. 139 (19
2477–2491.[4] T.E. Springer, T.A. Zawodinski, S. Gottesfeld, J. Electrochem.
136 (1991) 2334–2341.[5] T.E. Springer, M.S. Wilson, S. Gottesfeld, J. Electrochem. Soc.
(1993) 3513–3527.[6] T.F. Fuller, J. Newman, J. Electrochem. Soc. 140 (1993) 1218–
Y. Wang, C.-Y. Wang / Journal of Power Sources 147 (2005) 148–161 161
[7] T.V. Nguyen, R.E. White, J. Electrochem. Soc. 140 (1993)2178–2187.
[8] T. Berning, D.M. Lu, N. Djilali, J. Power Sources 106 (2002)284–294.
[9] S. Dutta, S. Shimpalee, J.W. Van Zee, J. Appl. Electrochem. 30(2000) 135–146.
[10] S. Dutta, S. Shimpalee, J.W. Van Zee, Int. J. Heat Mass Transfer 44(2001) 2029–2042.
[11] S. Um, C.Y. Wang, K.S. Chen, J. Electrochem. Soc. 147 (2000)4485–4493.
[12] S. Um, C.Y. Wang, Proceeding of the ASME Heat Transfer Division,vol. 1, Orlando, FL, 2000, p. 19.
[13] S. Um, C.Y. Wang, J. Power Sources 125 (2004) 40–51.[14] H. Meng, C.Y. Wang, Chem. Eng. Sci. 104 (2004) 4727–4766.[15] H. Meng, C.Y. Wang, J. Electrochem. Soc. 151 (2004) A358–A367.
[16] Y. Wang, C.Y. Wang, J. Electrochem. Soc. 152 (2005) A445–A453.[17] S.V. Patankar, Numerical Heat Transfer and Fluid Flow, Hemisphere
Publishing Corporation, New York, 1980.[18] Y. Wang, C.Y. Wang, Electrochim. Acta 50 (2005) 1307–
1315.[19] S. Motupally, A.J. Becker, J.W. Weidner, J. Electrochem. Soc. 147
(2000) 3171–3177.[20] T.A. Zawodzinski, J. Davey, J. Valerio, S. Gottesfeld, Electrochim.
Acta 40 (1995) 297–302.[21] A.C. West, T.F. Fuller, J. Appl. Electrochem. 26 (1996) 557.[22] R.B. Bird, W.E. Stewart, E.N. Lightfood, Transport Phenomena, John
Wiley & Sons, New York, 1960.[23] F.P. Incropera, D.P. DeWitt, Fundamentals of Heat and Mass Trans-
fer, John Wiley & Sons, New York, 1996.