Embed Size (px)
Citation preview
Simulation of Solid Flow Behavior in Dense Phase Pneumatic
Conveying with a Bend by a New Model
Shanshan Sun, Zhulin Yuan , Wenqi Zhong
Key Laboratory of Energy Thermal Conversion and Control of Ministry of Education, Southeast University, Nanjing 210096, China
Abstract. Understanding flow behaviors of dense phase gas-solid flow in pneumat ic conveying with a
bend is important for optimal design. A new mathematical model describ ing the motion of dense powder was
proposed. The article described the theoretical basis of the model and the process to construct the model. The
new model was applied to simulate the dense phase gas-solid flow in pneumatic conveying pipes with a bend,
and verified by comparing with experimental results both qualitatively and quantitatively. The dense phase
flow pattern in the horizontal p ipe is disappeared after through the bend into the vertical pipe. Compared with
the outlet of the bend, the fluctuation of solid concentration at the inlet is more violent. The investigation on
the distribution of solid concentration along the bend indicated that the blockage in the bend was more likely
to occur. With the increasing of the superficial gas velocity, the distribution of solid concentration at the
horizontal pipe and the vertical pipe became similar.
Keywords: Pneumatic conveying, dense phase, mathematic model, bend, flow pattern.
1. Introduction
Dense phase pneumatic conveying has become the key technology in gasification. Compared with dilute
transportation, dense phase gas-solid flow through the pipe is more complicated and unsteady, due to its low
velocity and high solid concentration in transportation [1], [2]. In recent years, researchers were focused on
the investigation of pipe pressure loss, flow stability and obtain several rules. Flow pattern variation in dense
phase pneumatic conveying is not fully understood. Flow pattern reflects the form and structure of gas-solid
flow. Understanding flow patterns and their variation are very important in measuring gas-solid parameters
and detecting the flow behavior and operation reliable of pneumatic conveying system.
Bends or elbows play important roles in pneumatic conveying, and have a great effect on the gas-solid
flow structures. Numerous studies have been conducted to characterize the solid flow behaviors in the
bend/elbow [3]-[7]. However, most of those researches are mainly carried out to dilute phase flow. It is
difficult to quantify the dense phase gas-solid flow parameters experimentally. Comparatively, numerical
approaches as effective means can help extend the experimental researches. The dense phase gas-solid flow
is mainly investigated with Euler-based continuum model or Lagrangian-based discrete model. The
continuum model models the particle flow as continuum, and using spatial gradients to describe particle
interactions. However, in complex gas-solid system, each type and size of particles must be solved by
separate continuity and momentum equations and thus make the continuum formulation more complicated.
Discrete model is known as the discrete element method. This model is normally used to model the flow
behavior of particles with a large range of types, sizes, shapes, and velocities [8]. However, because of the
excessive calculation cost, the amount of simulated particles is severely limited and the model is difficult to
be applied to large-scale industrial systems.
Corresponding author. Tel.: + 86-13770504533; fax: +86-25-83689730. E-mail address: [email protected].
International Proceedings of Chemical, Biological and Environmental Engineering, V0l. 90 (2015)
DOI: 10.7763/IPCBEE. 2015. V90. 5
28
In this paper, a new model combining Euler-based with Lagrange-based methods was proposed to
simulate the dense phase gas-solid flow in pneumatic conveying pipes with a bend. Compared with the DEM
method, the compute cost of the present model reduced dramatically. The numerical model will be
introduced firstly. And the results of the calculated flow pattern and the pressure gradient against the
superficial gas velocity in horizontal pipe will be compared with the experiment results for its verification.
Finally, the solid flow behavior and the distribution of solid concentration for different operation parameters
will be conducted to implement the applications of this model.
2. Mathematical Model
2.1. Requirements of the new model
Due to the deficiency of existing model in simulating dense powder flow, a new mathematical model,
which should meet the following requirements, is desired:
1) The model can be used to simulate the particle size at the rank of m.
2) The new model shall have high computing efficiency, and it can conduct numerical calculation of
engineering problems in large-scale powder system.
2.2. Solid phase (The new model)
The calculation of the forces in powder particles include the fluid drag force, field force, collision force
with wall, and interaction force between particles. In order to investigate the interaction force between
particles, the model combines Eulerian method with Lagrangian method, which divides the calculation
region into several grids. The Eulerian method is used to calculate the particle shear force between grids, and
the Lagrangian method is used to calculate movement behavior of particles in a grid.
2.2.1 Interaction force between particles in a grid
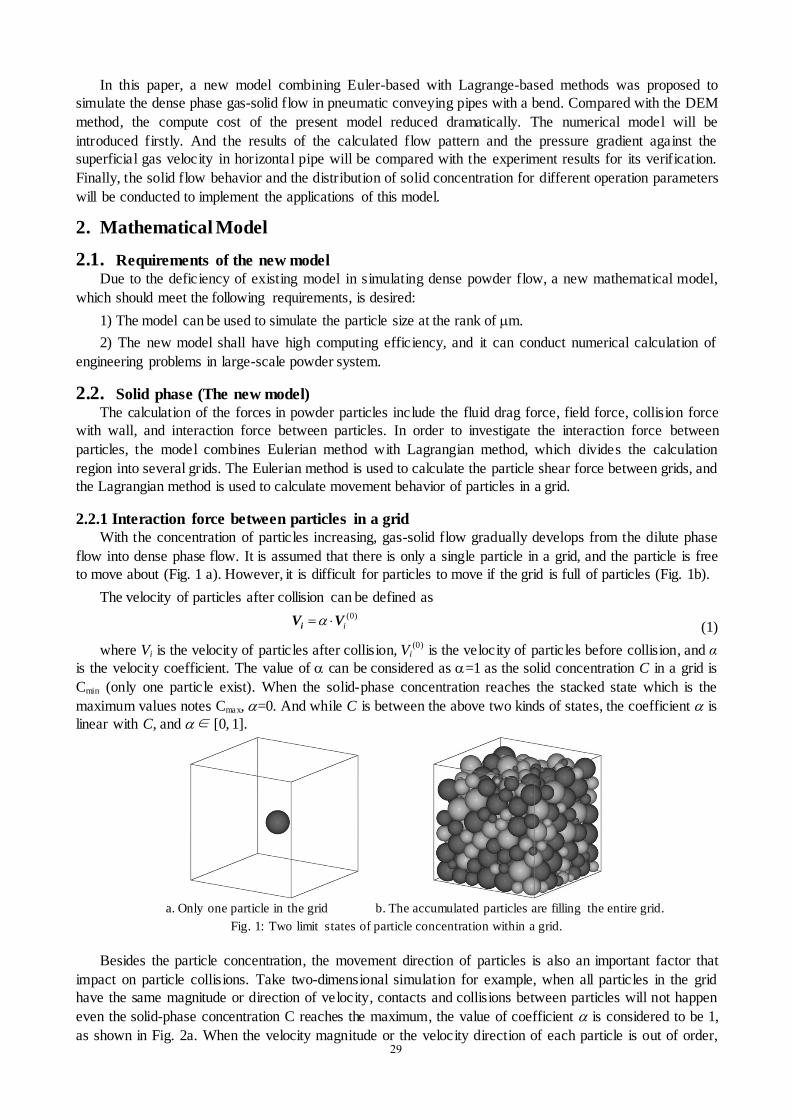
With the concentration of particles increasing, gas-solid flow gradually develops from the dilute phase
flow into dense phase flow. It is assumed that there is only a single particle in a grid, and the particle is free
to move about (Fig. 1 a). However, it is difficult for particles to move if the grid is full of particles (Fig. 1b).
The velocity of particles after collision can be defined as (0)
i iV V (1)
where Vi is the velocity of particles after collision, Vi(0)
is the velocity of particles before collision, and α
is the velocity coefficient. The value of can be considered as =1 as the solid concentration C in a grid is
Cmin (only one particle exist). When the solid-phase concentration reaches the stacked state which is the
maximum values notes Cmax, =0. And while C is between the above two kinds of states, the coefficient is
linear with C, and ∈ [0, 1].
a. Only one particle in the grid b. The accumulated particles are filling the entire grid.
Fig. 1: Two limit states of particle concentration within a grid.
Besides the particle concentration, the movement direction of particles is also an important factor that
impact on particle collisions. Take two-dimensional simulation for example, when all particles in the grid
have the same magnitude or direction of velocity, contacts and collisions between particles will not happen
even the solid-phase concentration C reaches the maximum, the value of coefficient is considered to be 1,
as shown in Fig. 2a. When the velocity magnitude or the velocity direction of each particle is out of order, 29
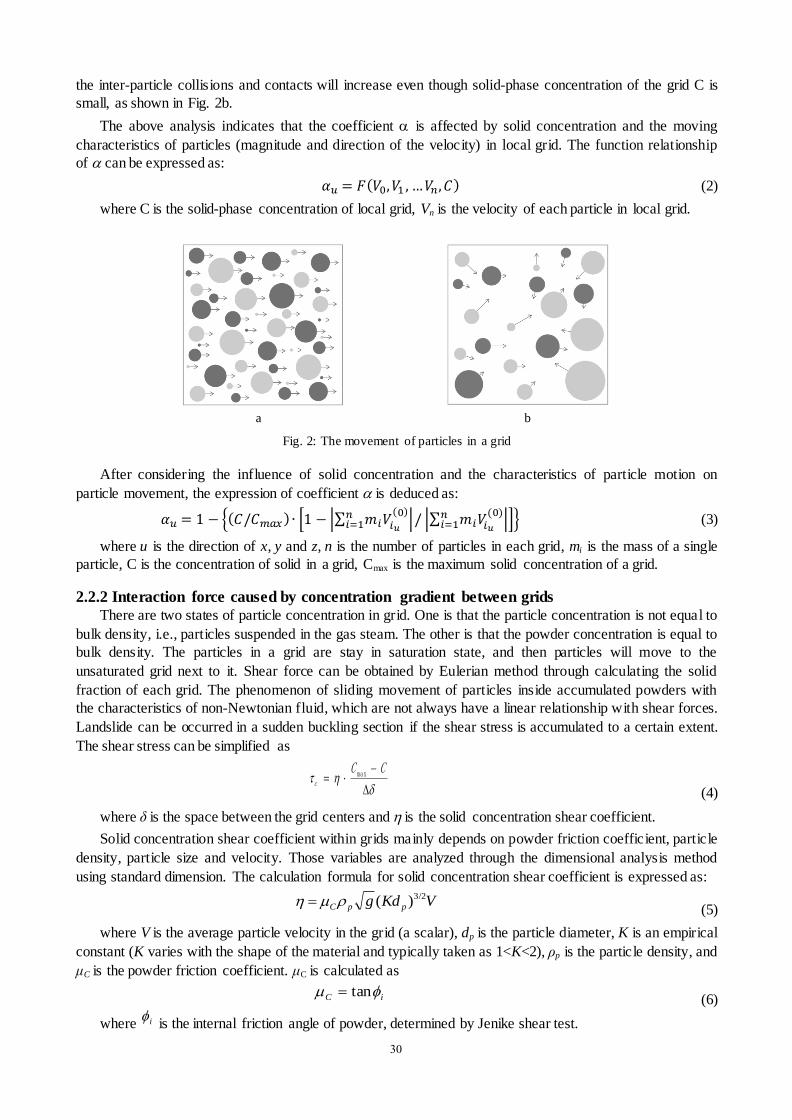
the inter-particle collisions and contacts will increase even though solid-phase concentration of the grid C is
small, as shown in Fig. 2b.
The above analysis indicates that the coefficient is affected by solid concentration and the moving
characteristics of particles (magnitude and direction of the velocity) in local grid. The function relationship
of can be expressed as:
𝛼𝑢 = 𝐹(𝑉0, 𝑉1 , …𝑉𝑛, 𝐶) (2)
where C is the solid-phase concentration of local grid, Vn is the velocity of each particle in local grid.
a b
Fig. 2: The movement of particles in a grid
After considering the influence of solid concentration and the characteristics of particle motion on
particle movement, the expression of coefficient is deduced as:
𝛼𝑢 = 1 − {(𝐶/𝐶𝑚𝑎𝑥) ∙ [1 − |∑ 𝑚𝑖𝑉𝑖𝑢(0)𝑛
𝑖=1 |/ |∑ 𝑚𝑖𝑉𝑖𝑢(0)𝑛
𝑖=1 |]} (3)
where u is the direction of x, y and z, n is the number of particles in each grid, mi is the mass of a single
particle, C is the concentration of solid in a grid, Cmax is the maximum solid concentration of a grid.
2.2.2 Interaction force caused by concentration gradient between grids
There are two states of particle concentration in grid. One is that the particle concentration is not equal to
bulk density, i.e., particles suspended in the gas steam. The other is that the powder concentration is equal to
bulk density. The particles in a grid are stay in saturation state, and then particles will move to the
unsaturated grid next to it. Shear force can be obtained by Eulerian method through calculating the solid
fraction of each grid. The phenomenon of sliding movement of particles inside accumulated powders with
the characteristics of non-Newtonian fluid, which are not always have a linear relationship with shear forces.
Landslide can be occurred in a sudden buckling section if the shear stress is accumulated to a certain extent.
The shear stress can be simplified as
CCc
max
(4)
where δ is the space between the grid centers and is the solid concentration shear coefficient.
Solid concentration shear coefficient within grids mainly depends on powder friction coefficient, particle
density, particle size and velocity. Those variables are analyzed through the dimensional analysis method
using standard dimension. The calculation formula for solid concentration shear coefficient is expressed as:
(5)
where V is the average particle velocity in the grid (a scalar), dp is the particle diameter, K is an empirical
constant (K varies with the shape of the material and typically taken as 1<K<2), ρp is the particle density, and
μC is the powder friction coefficient. μC is calculated as
iC tan (6)
where i is the internal friction angle of powder, determined by Jenike shear test.
VKdg ppC
3/2)(
30
2.3. Gas phase
We use the volume average equations of motion for the incompressible gas.
Continuity equation is given as:
0)(
gg
gu
t
(7)
Momentum equation is given as:
gFpuuut
ggggkdgggggggg
(8)
where εg, ug, ρg, p, (Fd)k and τg indicate the gas volume fraction, the local velocity of gas, the gas density,
the pressure, the drag force and the molecular viscous stress tensor, respectively. Drag force in this paper is
based on the coupling relation between the balance of drag force and two-fluid model [9]. The drag force is
)(1
)(,, kpkg
k
kkp
kd vuV
F
k=1, ···, N (9)
where (Vp)k, vk, εk, βk are the particle volume, the velocity, the local void fraction and the local interphase
momentum transfer coefficient for particle k, respectively. uk is gas virtual velocity in the mass center of
particle k. When εk<0.8, βk is given by Ergun equation [10]. When εk≥0.8, βk is given by Wen and Yu
correlation [11],
8.0,1
4
3
8.0,15.171
150
65.2
0
2
2
kkkkg
kp
kk
kdk
kkk
kp
g
k
kp
g
k
kk
vud
C
vudd
(10)
where (dp)k is the particle diameter, μg is the gas viscosity .The drag coefficient for an isolated particle is,
1000Re44.0
1000Re,Re15.01Re
24 687.0
0
kp
kpkp
kpkdC
(11)
Where the Reynolds of particle k within a group of particles is defined as:
g
kpkkgk
kp
dvu
Re (12)
2.4. Simulation condition
The generally calculation method for gas phase is separation of variables, and coupling pressure with
velocity by SIMPLE method. The inlet boundary is velocity, and outlet boundary is pressure-outlet. Hard
sphere model is used to model collisions between particles and wall. The coefficient of restitution is 0.9.
In this work, the pipe system involves horizontal and vertical pipes connected by 90° bend. The diameter
of pipe D=10mm. The length of horizontal pipe is 1m. And a 1m length of vertical pipe is connected after a
90° bend whose radius of curvature R=2.0 D. Physical and numerical parameters used in this study are listed
in Table 1.
31
In the present work, the grid sizes of 0.4 mm×0.25 mm, 0.8 mm×0.5 mm, 1.6 mm×1.0 mm were
performed in simulations to check the grid independence of the solution. The comparison of the calculated
solid concentration showed an insignificant difference on the simulation results.
Table 1: Numerical parameters
Parameter Unit Value
Transportation pressure Mpa 1
Particle average diameter μm 200
Particle density kg/m3 1350
Superficial gas velocity m/s 8-11
Inlet solid volume fraction - 0.3
Time step s 0.0005
The new model is based on the combination of Eulerian approach and Lagrangian approach, and the
whole process of numerical simulation, which should combine with other forces (such as drag force, field
force, etc.). If the numerical particle is defined as a group of particles with the same properties (size, density,
etc.), the new model can calculate large scale gas-solid flow powder systems, which contains billions of
particles by using millions of numerical particles.
3. Results and Discussions
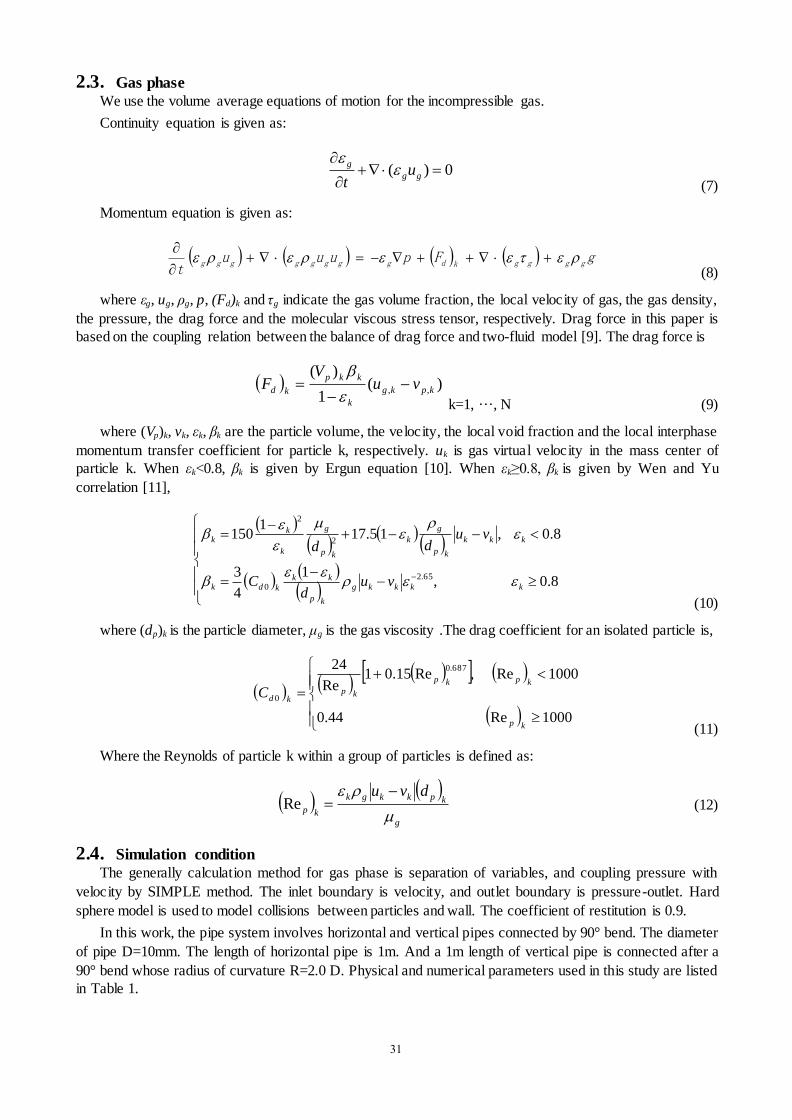
To validate the accuracy of the proposed model, the simulation results are compared to experimental data
of Pu [12]. Fig. 3 presents the characteristics of dune flow in horizontal pipe. The particles move in a
wavelike way, while the sedimentary layer is scooped up and then sliding down to supplement the
sedimentary layer constantly. In addition, a certain amount of suspended particles still exist in the upper part
of the sedimentary layer. The simulation result reproduced the formation and movement process of dune
flow. Fig. 4 depicts the snapshot of the flow pattern obtained by Pu [12]. The solid-phase flow pattern of
dense pneumatic conveying process is similar to the numerical simulation result (Fig. 3), confirming the
accuracy of the model to a certain extent.
Fig. 3: The calculated flow pattern of horizontal dense pneumatic conveying
Fig. 4: The snapshot of flow patterns in the horizontal pipe with high speed camera.
32
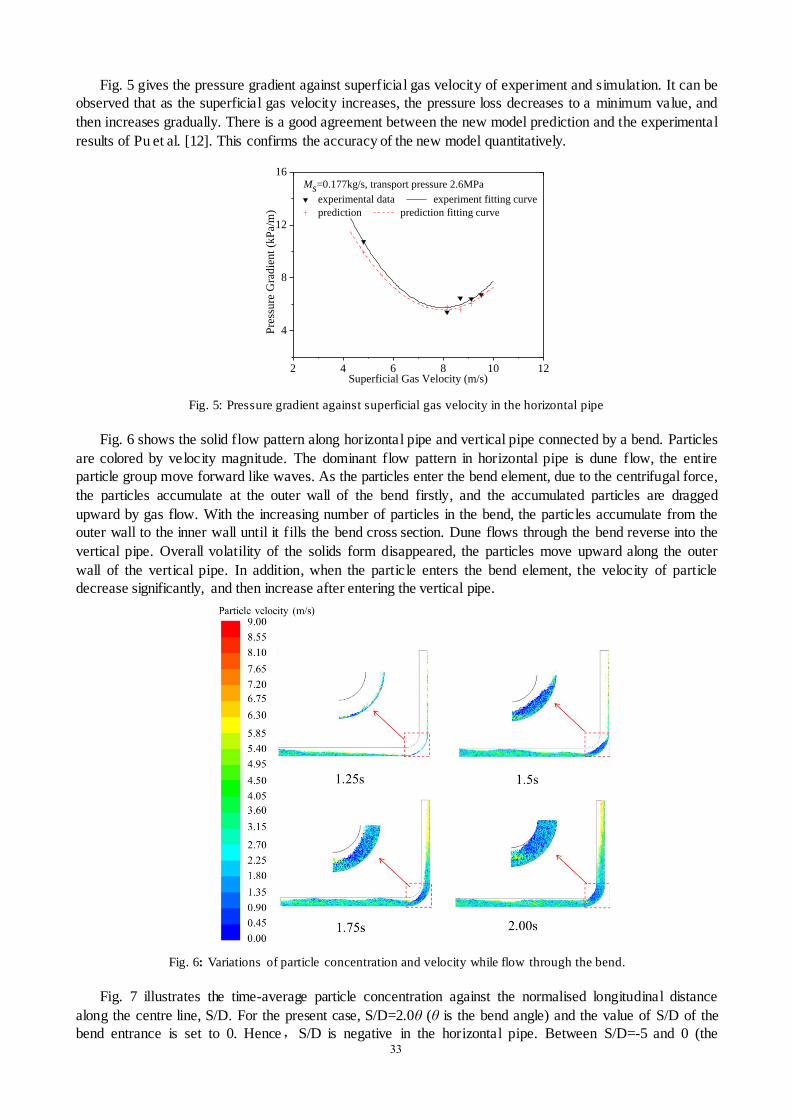
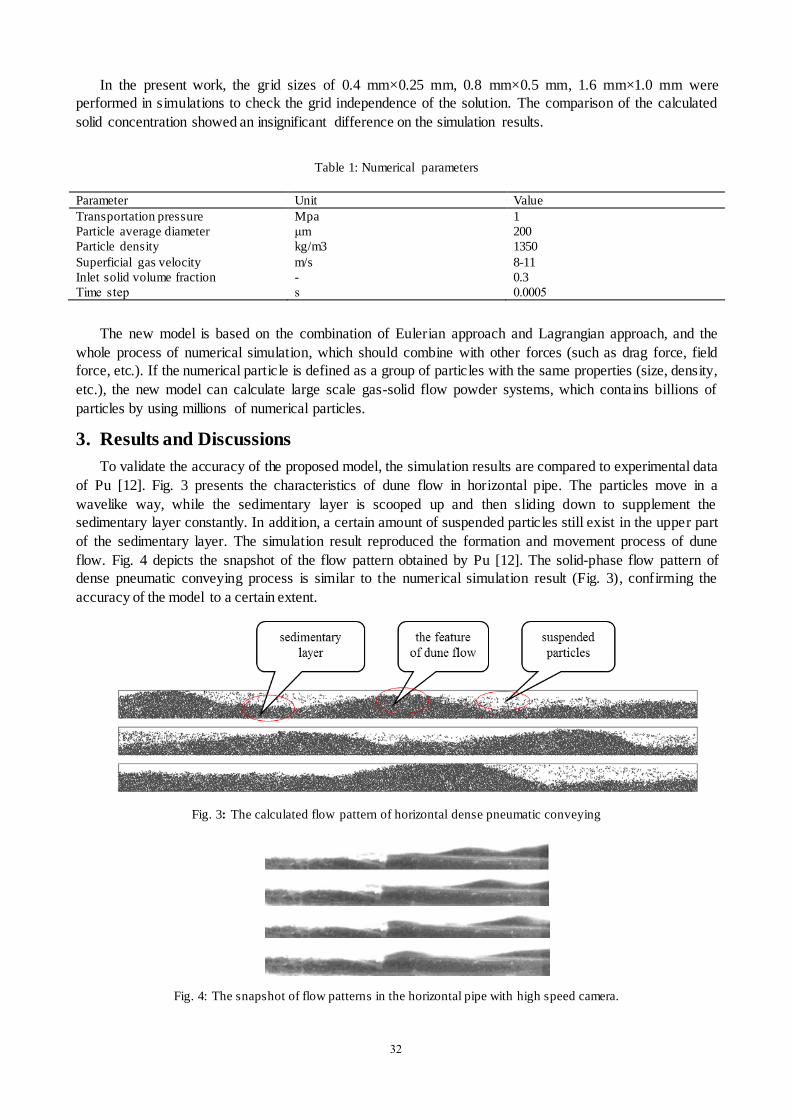
Fig. 5 gives the pressure gradient against superficial gas velocity of experiment and simulation. It can be
observed that as the superficial gas velocity increases, the pressure loss decreases to a minimum value, and
then increases gradually. There is a good agreement between the new model prediction and the experimental
results of Pu et al. [12]. This confirms the accuracy of the new model quantitatively.
Fig. 5: Pressure gradient against superficial gas velocity in the horizontal pipe
Fig. 6 shows the solid flow pattern along horizontal pipe and vertical pipe connected by a bend. Particles
are colored by velocity magnitude. The dominant flow pattern in horizontal pipe is dune flow, the entire
particle group move forward like waves. As the particles enter the bend element, due to the centrifugal force,
the particles accumulate at the outer wall of the bend firstly, and the accumulated particles are dragged
upward by gas flow. With the increasing number of particles in the bend, the particles accumulate from the
outer wall to the inner wall until it fills the bend cross section. Dune flows through the bend reverse into the
vertical pipe. Overall volatility of the solids form disappeared, the particles move upward along the outer
wall of the vertical pipe. In addition, when the particle enters the bend element, the velocity of particle
decrease significantly, and then increase after entering the vertical pipe.
Fig. 6: Variations of particle concentration and velocity while flow through the bend.
Fig. 7 illustrates the time-average particle concentration against the normalised longitudinal distance
along the centre line, S/D. For the present case, S/D=2.0θ (θ is the bend angle) and the value of S/D of the
bend entrance is set to 0. Hence,S/D is negative in the horizontal pipe. Between S/D=-5 and 0 (the
2 4 6 8 10 12
4
8
12
16Ms=0.177kg/s, transport pressure 2.6MPa
experimental data experiment fitting curve
prediction prediction fitting curve
Pre
ssu
re G
rad
ien
t (k
Pa/
m)
Superficial Gas Velocity (m/s)
33
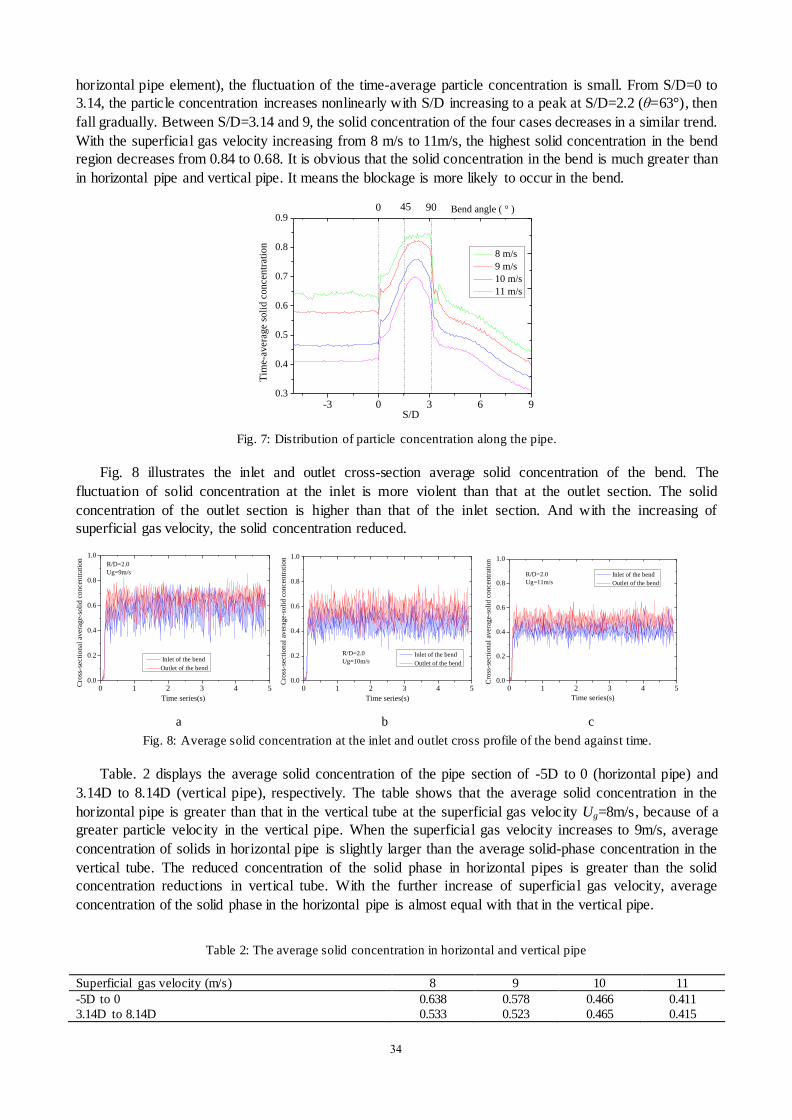
horizontal pipe element), the fluctuation of the time-average particle concentration is small. From S/D=0 to
3.14, the particle concentration increases nonlinearly with S/D increasing to a peak at S/D=2.2 (θ=63°), then
fall gradually. Between S/D=3.14 and 9, the solid concentration of the four cases decreases in a similar trend.
With the superficial gas velocity increasing from 8 m/s to 11m/s, the highest solid concentration in the bend
region decreases from 0.84 to 0.68. It is obvious that the solid concentration in the bend is much greater than
in horizontal pipe and vertical pipe. It means the blockage is more likely to occur in the bend.
Fig. 7: Distribution of particle concentration along the pipe.
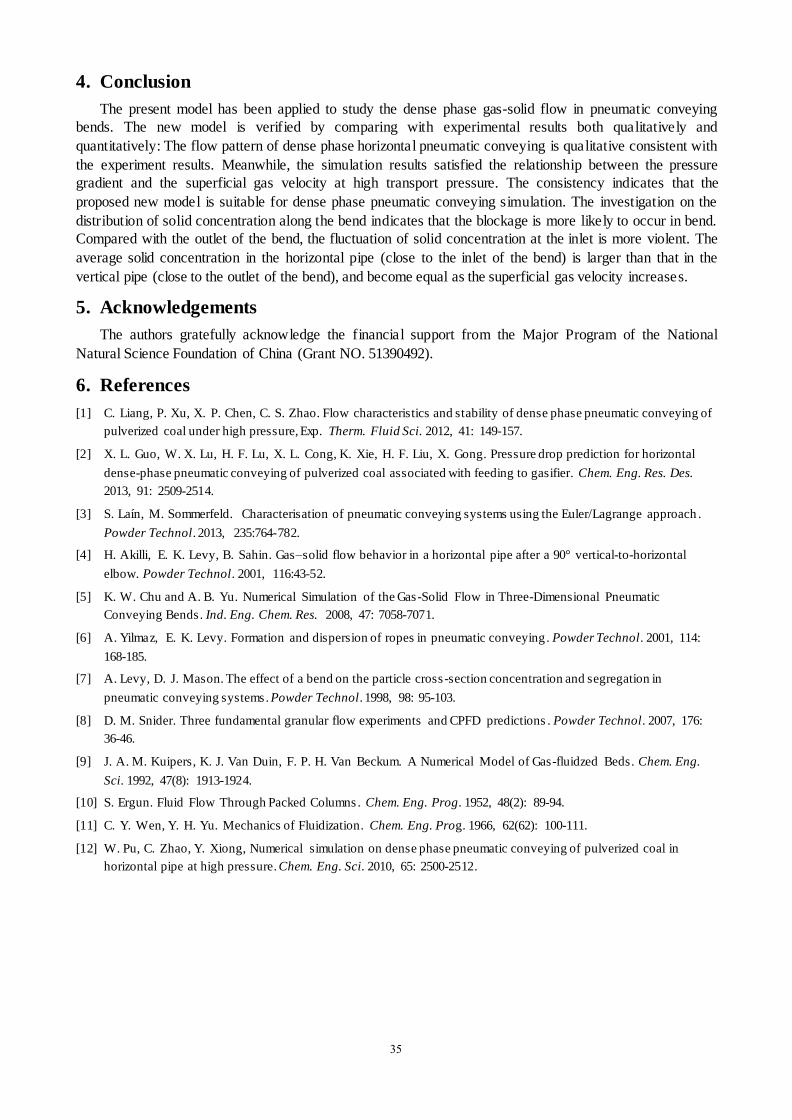
Fig. 8 illustrates the inlet and outlet cross-section average solid concentration of the bend. The
fluctuation of solid concentration at the inlet is more violent than that at the outlet section. The solid
concentration of the outlet section is higher than that of the inlet section. And with the increasing of
superficial gas velocity, the solid concentration reduced.
a b c
Fig. 8: Average solid concentration at the inlet and outlet cross profile of the bend against time.
Table. 2 displays the average solid concentration of the pipe section of -5D to 0 (horizontal pipe) and
3.14D to 8.14D (vertical pipe), respectively. The table shows that the average solid concentration in the
horizontal pipe is greater than that in the vertical tube at the superficial gas velocity Ug=8m/s, because of a
greater particle velocity in the vertical pipe. When the superficial gas velocity increases to 9m/s, average
concentration of solids in horizontal pipe is slightly larger than the average solid-phase concentration in the
vertical tube. The reduced concentration of the solid phase in horizontal pipes is greater than the solid
concentration reductions in vertical tube. With the further increase of superficial gas velocity, average
concentration of the solid phase in the horizontal pipe is almost equal with that in the vertical pipe.
Table 2: The average solid concentration in horizontal and vertical pipe
Superficial gas velocity (m/s) 8 9 10 11
-5D to 0 0.638 0.578 0.466 0.411
3.14D to 8.14D 0.533 0.523 0.465 0.415
-3 0 3 6 90.3
0.4
0.5
0.6
0.7
0.8
0.9
Tim
e-av
erag
e so
lid c
once
ntr
atio
n
S/D
8 m/s
9 m/s
10 m/s
11 m/s
0 45 90 Bend angle ( ° )
0 1 2 3 4 50.0
0.2
0.4
0.6
0.8
1.0
R/D=2.0
Ug=9m/s
Cro
ss-s
ecti
on
al a
ver
age-
soli
d c
on
cen
trat
ion
Time series(s)
Inlet of the bend
Outlet of the bend
0 1 2 3 4 50.0
0.2
0.4
0.6
0.8
1.0
Cro
ss-s
ecti
onal
aver
age-
soli
d c
once
ntr
atio
n
Time series(s)
Inlet of the bend
Outlet of the bend
R/D=2.0
Ug=10m/s
0 1 2 3 4 50.0
0.2
0.4
0.6
0.8
1.0
R/D=2.0
Ug=11m/s
Cro
ss-s
ecti
onal
aver
age-
soli
d c
once
ntr
atio
n
Time series(s)
Inlet of the bend
Outlet of the bend
34
4. Conclusion
The present model has been applied to study the dense phase gas-solid flow in pneumatic conveying
bends. The new model is verified by comparing with experimental results both qualitatively and
quantitatively: The flow pattern of dense phase horizontal pneumatic conveying is qualitative consistent with
the experiment results. Meanwhile, the simulation results satisfied the relationship between the pressure
gradient and the superficial gas velocity at high transport pressure. The consistency indicates that the
proposed new model is suitable for dense phase pneumatic conveying simulation. The investigation on the
distribution of solid concentration along the bend indicates that the blockage is more likely to occur in bend.
Compared with the outlet of the bend, the fluctuation of solid concentration at the inlet is more violent. The
average solid concentration in the horizontal pipe (close to the inlet of the bend) is larger than that in the
vertical pipe (close to the outlet of the bend), and become equal as the superficial gas velocity increases.
5. Acknowledgements
The authors gratefully acknowledge the financial support from the Major Program of the National
Natural Science Foundation of China (Grant NO. 51390492).
6. References
[1] C. Liang, P. Xu, X. P. Chen, C. S. Zhao. Flow characteristics and stability of dense phase pneumatic conveying of
pulverized coal under high pressure, Exp. Therm. Fluid Sci. 2012, 41: 149-157.
[2] X. L. Guo, W. X. Lu, H. F. Lu, X. L. Cong, K. Xie, H. F. Liu, X. Gong. Pressure drop prediction for horizontal
dense-phase pneumatic conveying of pulverized coal associated with feeding to gasifier. Chem. Eng. Res. Des.
2013, 91: 2509-2514.
[3] S. Laín, M. Sommerfeld. Characterisation of pneumatic conveying systems using the Euler/Lagrange approach .
Powder Technol. 2013, 235:764-782.
[4] H. Akilli, E. K. Levy, B. Sahin. Gas–solid flow behavior in a horizontal pipe after a 90° vertical-to-horizontal
elbow. Powder Technol. 2001, 116:43-52.
[5] K. W. Chu and A. B. Yu. Numerical Simulation of the Gas-Solid Flow in Three-Dimensional Pneumatic
Conveying Bends. Ind. Eng. Chem. Res. 2008, 47: 7058-7071.
[6] A. Yilmaz, E. K. Levy. Formation and dispersion of ropes in pneumatic conveying. Powder Technol. 2001, 114:
168-185.
[7] A. Levy, D. J. Mason. The effect of a bend on the particle cross -section concentration and segregation in
pneumatic conveying systems. Powder Technol. 1998, 98: 95-103.
[8] D. M. Snider. Three fundamental granular flow experiments and CPFD predictions . Powder Technol. 2007, 176:
36-46.
[9] J. A. M. Kuipers, K. J. Van Duin, F. P. H. Van Beckum. A Numerical Model of Gas-fluidzed Beds. Chem. Eng.
Sci. 1992, 47(8): 1913-1924.
[10] S. Ergun. Fluid Flow Through Packed Columns . Chem. Eng. Prog. 1952, 48(2): 89-94.
[11] C. Y. Wen, Y. H. Yu. Mechanics of Fluidization. Chem. Eng. Prog. 1966, 62(62): 100-111.
[12] W. Pu, C. Zhao, Y. Xiong, Numerical simulation on dense phase pneumatic conveying of pulverized coal in
horizontal pipe at high pressure. Chem. Eng. Sci. 2010, 65: 2500-2512.
35


![Test Plant Dense Phase Pressure Pneumatic Conveying · 2019-04-02 · 28 2329 Dense Phase Pressure Pneumatic Conveying Test Plant I]Z E6A6B6I>8 EGD8:HH aVWdgVidgn [dg edlYZgh lVh](https://img.pdfslide.net/doc/110x75/5f5efd5733afe60b2209b0bb/test-plant-dense-phase-pressure-pneumatic-conveying-2019-04-02-28-2329-dense-phase.jpg)