Embed Size (px)
Citation preview

Simulation of TCP Simulation of TCP connection over connection over wireless linkswireless links
Project By:Project By:Zavhon Ran , Cohen Eran , Zavhon Ran , Cohen Eran ,
Pilosof SaarPilosof Saar
Instructors:Instructors:Dr. Dany Raz, Mr. Itai Dabran Dr. Dany Raz, Mr. Itai Dabran

IntroductionIntroduction
Cellular companies began offering Cellular companies began offering Tcp/Ip services for their customers. Tcp/Ip services for their customers.
Performance of these services is still Performance of these services is still very dull.very dull.
Efforts are being made to improve Efforts are being made to improve wireless Tcp/Ip services. wireless Tcp/Ip services.

Project MotivationProject Motivation What we know :What we know :
Wireless lines suffer from higher error rate than the Wireless lines suffer from higher error rate than the wired ones. wired ones.
Bandwidth is rather limited. Bandwidth is rather limited. The problem :The problem :
Collected real-life measurements show that the Tcp Collected real-life measurements show that the Tcp throughput over the tested wireless systems is even throughput over the tested wireless systems is even lower than expected.lower than expected.
Possible explanations :Possible explanations : The little “forgiveness” of the Tcp protocol causes The little “forgiveness” of the Tcp protocol causes
frequent time-outs, lowering the efficiency of the line.frequent time-outs, lowering the efficiency of the line. Frequent time-outs are the result of higher loss-rates Frequent time-outs are the result of higher loss-rates
caused by buffer over flooding.caused by buffer over flooding.

The Network StructureThe Network Structure
Given Real-Life Given Real-Life MeasurementsMeasurements
Four representing graphs for the real-Four representing graphs for the real-lifelifemeasurements, were given:measurements, were given:
MIRSMIRS UplinkUplink DownlinkDownlink
GSMGSM UplinkUplink DownlinkDownlink

MIRSMIRS
Uplink

Downlink
MIRSMIRS

GSMGSMUplink
Downlink
GSMGSM

Project GoalsProject Goals Install the NS (Network Simulator) on Install the NS (Network Simulator) on
Windows.Windows. Create a simulation of the network Create a simulation of the network
configuration.configuration. Multiple simulation execution on variants of the Multiple simulation execution on variants of the
original configuration. original configuration. (in order to reproduce results similar to the real-life (in order to reproduce results similar to the real-life
measurements)measurements) Change the NS files, creating necessary outputs.Change the NS files, creating necessary outputs. Create the engine for repetitive simulation runs.Create the engine for repetitive simulation runs. Transform data into graphs, for comparison.Transform data into graphs, for comparison.
Analyze results. Analyze results.

Install the NSInstall the NS

What is NS What is NS Network SimulatorNetwork Simulator
NS is a software package which can simulate most existing network protocols.
How is it used …

NS Advantages :
Has implementation of wide variety of network
protocols.
Powerful analysis tools (one of which is the
NAM).
Open sourced – written in C++ and OTcl.
Maintainability.
Reliability.
What is NS (cont…)What is NS (cont…)

Importing NS into Importing NS into WindowsWindows
NS was developed for the Unix (or Linux) NS was developed for the Unix (or Linux) operating systems. operating systems.
As the NS package is constructed of As the NS package is constructed of several components, each had to be several components, each had to be compiled and installed separately.compiled and installed separately.
The main modifications were made in the The main modifications were made in the makefiles of the components.makefiles of the components.
MS-Visual C++ project MS-Visual C++ project In order to be able to change and debug NS code, we In order to be able to change and debug NS code, we
created acreated aMS-Visual project containing all NS components.MS-Visual project containing all NS components.

Simulation of the Simulation of the network network
configurationconfiguration

Network layout Network layout (reminder)(reminder)

TCL ScriptsTCL Scripts
We used two .tcl files, one included by the other.
net_define.tcl – Includes params.tcl file. Defines the general configuration of the network.
params.tcl –Automatically generated by the Perl script, this file
holdsdefinitions for the following parameters :
Buffer sizeError rateUp link bit rateDown link bit ratePacket size.

Our Network layout, as Our Network layout, as shown in NAMshown in NAM
Rate - 1 MbpsDelay - 1 ms
Rate - 9 KbpsDelay – 0.001 ms
Rate - 1 MbpsDelay - 1 ms
Buffer Size – 10 pkts
Lost packet – buffer overflow

Multiple Multiple executionsexecutions
Changes to NS files.Changes to NS files.
Creation of engine for repetitive Creation of engine for repetitive simulations.simulations.
Execution parameters.Execution parameters.
Transformation of the textual data Transformation of the textual data into graphs.into graphs.

Changes to NS filesChanges to NS files
In order to produce the data we need, at the run of In order to produce the data we need, at the run of a simulation, we have added some printouts. a simulation, we have added some printouts.
The following files were changed:The following files were changed: tcp.cpptcp.cpp
A line print for each message sent, with itsA line print for each message sent, with its timetime, , sequence numbersequence number and the and the window sizewindow size at the time at the time of its sent. of its sent.
errmodel.cpp errmodel.cpp A line print for any packet lost due to A line print for any packet lost due to network network errorserrors, with its , with its sequence numbersequence number and and reasonreason. .
queue.cpp queue.cpp A line print for any packet lost due to A line print for any packet lost due to buffer buffer overflowoverflow, with its , with its sequence numbersequence number and and reasonreason. .

Creation of engine for Creation of engine for repetitive simulationsrepetitive simulations
We have used the Perl scripting We have used the Perl scripting language, to perform the multiple runs. language, to perform the multiple runs.
ns.plns.pl - - Generate parametric network Generate parametric network
configuration files (configuration files (params.tclparams.tcl), for each ), for each desired network configuration.desired network configuration.
Run the NS on each configurations and Run the NS on each configurations and save the output into data files, from which save the output into data files, from which graphs will be created.graphs will be created.

Execution parametersExecution parametersThe following Parameters were modified : Buffer size -
Buffer size was set to each one of the following sizes: 5,7,9,11,13,15 packets.
Packet size –Packet size was set to: 500,1000,1500 bytes
Error-rates for packet-size -
In addition to the base error-rates, different variants were tested:
-100% (no errors at all), -50%, -20%, +20%, +50% and +100% (double errors).

Execution parameters Execution parameters (cont.)(cont.)
Throughputs –Different throughputs (Kilo-Bit per second)
were given tothe simulation links.

Matlab scriptMatlab script
gen_all.m - For all data files created by the Perl script
(one for eachparameter combination), the script
graph_gen.m is used togenerate graphs.
graph_gen.m - From the textual data file, creates a graph by
the sameformat as the real-life measurements graphs
we received . .

Results & Results & ConclusionsConclusions
Window size insight.Window size insight.
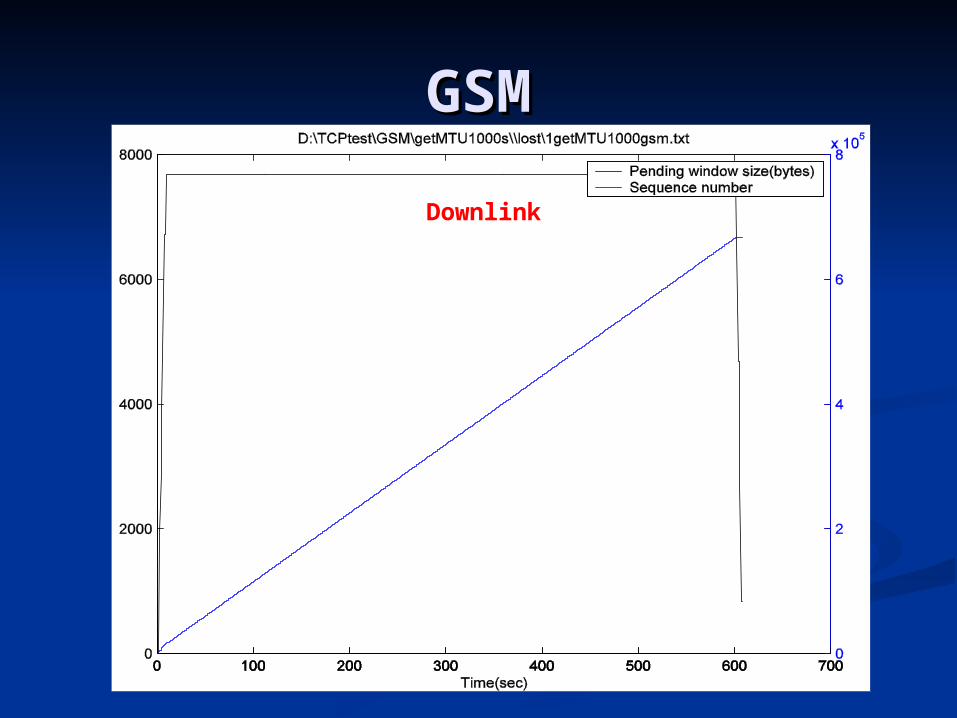
GSM Downlink.GSM Downlink.
MIRS Uplink.MIRS Uplink.

The window size growthThe window size growth
Time-out, window drops to 1.Time-out, window drops to 1.
Slow-Slow-start start Congestion-Congestion-avoidance. avoidance. Three Three
duplicate duplicate ACKs, ACKs, window drops window drops to half the to half the original size.original size.

GSM Downlink GSM Downlink (reminder)(reminder)
Window size rises to a maximum that can fit in 8 packets and remains at that size for the whole duration of the transmittion. No losses occur!

GSM Downlink – GSM Downlink – revelation revelation
Receiver window size is 20 andBuffer size is 19 – losses occur!
Receiver window size is 20 and
Buffer size is 20 (or larger) –
NO losses!
Under zero error-rate, we receive the following results:

GSM Downlink – GSM Downlink – explicationexplication
Second-layer error-correction gives Tcp a Second-layer error-correction gives Tcp a zerozero error rateerror rate.. The only possible reason for losses is a buffer overflow.The only possible reason for losses is a buffer overflow. As long as:As long as:
|sender window | ≤ network capacity|sender window | ≤ network capacity no losses will occur. no losses will occur.
Tcp network capacity is:Tcp network capacity is: net_capacity = Σ|allocated buffer| + |pending data|net_capacity = Σ|allocated buffer| + |pending data|
Under our simulation:Under our simulation:net_capacity = |buffer on the cellular phone|net_capacity = |buffer on the cellular phone|
(No buffering of ACKs, and virtually no pending data, due to near (No buffering of ACKs, and virtually no pending data, due to near zero transmittion delay)zero transmittion delay)
Tcp enforces the following limitation on the sender window Tcp enforces the following limitation on the sender window size : size :
|sender window ||sender window | ≤ |receiver window |≤ |receiver window | So, as long as So, as long as |buffer| ≥ ||buffer| ≥ | receiver window | receiver window | , no losses , no losses
occur and this kind of results are possible. occur and this kind of results are possible.

GSM Downlink – GSM Downlink – suggestionsuggestion
Motivation:Motivation:The size of the buffer allocated by the cellular carrier The size of the buffer allocated by the cellular carrier at its transmittion site (the antenna) is unknown, but at its transmittion site (the antenna) is unknown, but is a key element for Tcp protocol optimization.is a key element for Tcp protocol optimization.
Possible buffer size estimation procedure:Possible buffer size estimation procedure: Start with a small receiver window size, and gradually Start with a small receiver window size, and gradually
raise it.raise it.(by that we gradually change the limit for the sender (by that we gradually change the limit for the sender
window size).window size). When a loss is detected, the last receiver window size When a loss is detected, the last receiver window size
should equal the network capacity.should equal the network capacity. Based on some network information, we can estimate Based on some network information, we can estimate
the relative part of the network capacity occupied by the relative part of the network capacity occupied by the buffer, and its size.the buffer, and its size.

MIRS Downlink, same MIRS Downlink, same receiver window problemreceiver window problem??

MIRS Uplink (reminder)MIRS Uplink (reminder)
These frequent losses, cause idle-times, time-outs and retransmissions.

MIRS Uplink - graph MIRS Uplink - graph correlationcorrelation
A simulation result A simulation result graphgraph
for MIRS, packet-sizefor MIRS, packet-size
1000 Bytes, 1000 Bytes,
error-rate 19% and error-rate 19% and
buffer-size 9 buffer-size 9 (packets).(packets).
We can note the general resemblance to the We can note the general resemblance to the real-life MIRSreal-life MIRS
graph, on the graph, on the idle timesidle times, the , the time-outstime-outs and the and the regularregular
losses (due to 3 duplicate ACKs).losses (due to 3 duplicate ACKs).

MIRS Uplink – idle-timesMIRS Uplink – idle-times
Some diagnostics regarding the idle-times can now be Some diagnostics regarding the idle-times can now be made:made:
The window size drops to one. The window size drops to one. One packet is being repeatedly lost and retransmitted One packet is being repeatedly lost and retransmitted
during this time (same sequence number). during this time (same sequence number). So the sender is not really idling !!!So the sender is not really idling !!!
Duration between Time-outs Duration between Time-outs grows exponentially –grows exponentially –
The distance between the red dots (losses) grows The distance between the red dots (losses) grows exponentially. exponentially.
It can be explained by the fact that the TCP sender It can be explained by the fact that the TCP sender doublesdoubles
it’s RTO whenever a loss by time-out occurs.it’s RTO whenever a loss by time-out occurs.

MIRS Uplink – another MIRS Uplink – another look at the Idle-timeslook at the Idle-times
In order to better understand what happens during In order to better understand what happens during the so called idle times, we made some further the so called idle times, we made some further investigation of the loss types. investigation of the loss types.
We have differentiated :We have differentiated : Two types of losses:Two types of losses:
Places where the sender detects a “three-duplicate-ACKs" situation.
Places where the sender detects a time-out. Two reasons for losses:Two reasons for losses:
Losses due to buffer overflow. Losses due to error on the lines.

Xs – "three-duplicate-ACKs“.
Os – time-outs.
Re-Sent - The packet that is sent in the time-out, is lost again, causing another timeout few seconds later.

SubmissionSubmission Project paper.Project paper.
The disk.The disk.
The web page